XVI CONGRESSO NACIONAL DE TRANSPORTES MARÍTIMOS E...
8
26º Congresso Nacional de Transporte Aquaviário, Construção Naval e Offshore - SOBENA 2016 Rio de Janeiro, 6 a 8 de Novembro de 2016 Including Hydrodynamics Model and Tidal Windows into a Stochastic Traffic Simulation Laíssa Régia Sarmento Baltazar Universidade Federal do Rio de Janeiro – COPPE/UFRJ João Vitor Marques de Oliveira Moita Universidade Federal do Rio de Janeiro – COPPE/UFRJ Marcos Nicolás Gallo Universidade Federal do Rio de Janeiro – COPPE/UFRJ Susana Beatriz Vinzon Universidade Federal do Rio de Janeiro – COPPE/UFRJ Jean-David Caprace Universidade Federal do Rio de Janeiro – COPPE/UFRJ [email protected] Abstract: The North channel of the Amazon River is a dynamic coastal environment with a navigation channel particularly sensible due to the limitation of ships draft and the risk of running aground on sandbanks. The hydrodynamic of this area provides the deposition contributing to the formation/evolution of banks at the estuary mouth. The converging effect on the incident macro-tide induce an increase of its amplitude, with height above 3 m, beyond that, flood/ebb asymmetries and seasonally modulation are observed throughout the navigation channel. However, measurements of the levels take place in the coastal station in Ponta do Céu with a low predictability of levels over the 100 km of the ap- proach channel. Thus, in order to contribute to the safety and efficiency of navigation, this work presents different improvements to forecast the water levels and navigable depths, through the op- eration of hydrodynamic modeling and discrete-event simulations of the traffic. With the simulation of water levels/currents results was possible to identify the tidal windows taking into account the tidal variations during differents spring tides scenarios and seasonality of the river. This research conclude that the inclusion of tidal windows in traffic simulations result positively in decision making for safer and efficient navigation in areas of macro tide. 1 – Introduction The North approach channel of the Amazon River is one of the most dynamic and complex coastal environment in the world of a great so- cio-economic and environmental importance. In addition to the existing cities on its margins, this is the only access to the waterways and inland ports such as Madeira river (DNIT, 2016). How- ever, the navigation channel is a particularly sensible area because there is a limitation to the ships draft and a risk of running aground on sandbanks (Arentz, 2009) The loss of sediment-carrying capacity of the river provides the deposition contributing to the reduction of depth due to the formation mud banks off and sand banks near the mouth of the estuary (Figure 1). In addition, strong tidal cur- rents, winds (Alísios) and river discharge (~1.9 x 10⁵ m³/s) have an influence on the position of these banks that force the authorities to change constantly the position of the navigation channel (Fernandes, 2010; Watanabe, 2012; Arentz, 2009). Moreover, the region has converging ef- fect on the incident macro-tide causing an in- crease of its amplitude. Spring tides with height above 3 meters, flood/ebb asymmetries and seasonally modulation are observed throughout 1
Transcript of XVI CONGRESSO NACIONAL DE TRANSPORTES MARÍTIMOS E...

26º Congresso Nacional de Transporte Aquaviário, Construção Naval e Offshore - SOBENA 2016
Rio de Janeiro, 6 a 8 de Novembro de 2016
Including Hydrodynamics Model and Tidal Windows into a Stochastic Traffic
Simulation
Laíssa Régia Sarmento Baltazar Universidade Federal do Rio de Janeiro – COPPE/UFRJ
João Vitor Marques de Oliveira Moita
Universidade Federal do Rio de Janeiro – COPPE/UFRJ
Marcos Nicolás Gallo Universidade Federal do Rio de Janeiro – COPPE/UFRJ
Susana Beatriz Vinzon
Universidade Federal do Rio de Janeiro – COPPE/UFRJ
Jean-David Caprace Universidade Federal do Rio de Janeiro – COPPE/UFRJ
Abstract: The North channel of the Amazon River is a dynamic coastal environment with a navigation channel particularly sensible due to the limitation of ships draft and the risk of running aground on sandbanks. The hydrodynamic of this area provides the deposition contributing to the formation/evolution of banks at the estuary mouth. The converging effect on the incident macro-tide induce an increase of its amplitude, with height above 3 m, beyond that, flood/ebb asymmetries and seasonally modulation are observed throughout the navigation channel. However, measurements of the levels take place in the coastal station in Ponta do Céu with a low predictability of levels over the 100 km of the ap-proach channel. Thus, in order to contribute to the safety and efficiency of navigation, this work presents different improvements to forecast the water levels and navigable depths, through the op-eration of hydrodynamic modeling and discrete-event simulations of the traffic. With the simulation of water levels/currents results was possible to identify the tidal windows taking into account the tidal variations during differents spring tides scenarios and seasonality of the river. This research conclude that the inclusion of tidal windows in traffic simulations result positively in decision making for safer and efficient navigation in areas of macro tide.
1 – Introduction The North approach channel of the Amazon
River is one of the most dynamic and complex coastal environment in the world of a great so-cio-economic and environmental importance. In addition to the existing cities on its margins, this is the only access to the waterways and inland ports such as Madeira river (DNIT, 2016). How-ever, the navigation channel is a particularly sensible area because there is a limitation to the ships draft and a risk of running aground on sandbanks (Arentz, 2009)
The loss of sediment-carrying capacity of the river provides the deposition contributing to the reduction of depth due to the formation mud banks off and sand banks near the mouth of the estuary (Figure 1). In addition, strong tidal cur-rents, winds (Alísios) and river discharge (~1.9 x 10⁵ m³/s) have an influence on the position of these banks that force the authorities to change constantly the position of the navigation channel (Fernandes, 2010; Watanabe, 2012; Arentz, 2009). Moreover, the region has converging ef-fect on the incident macro-tide causing an in-crease of its amplitude. Spring tides with height above 3 meters, flood/ebb asymmetries and seasonally modulation are observed throughout
1

the navigation channel. Despite of that, meas-urements of the levels generally take place in the coastal station in Ponta do Céu (Figure 1) with a low predictability of levels over the 100 km of the approach channel (Gallo, 2004; Fernandes, 2006; Arentz, 2009).
Fernandes (2006) and Arentz (2009), using the model developed by Gallo and Vinzon (2005), has addressed the problematic of water level forecast along the North Channel. The 2DH model calibration was refined by Rezende
and Vinzon (2009) in order to improve the re-sults reliability for navigation channel. The level time series simulated in this model was ana-lyzed by harmonic method, resulting in maps of variation of reduction level (RL) and LAT (Low-est Astronomical Tide) to the region. This simu-lation allowed to verify potential errors in reduc-tion of surveys when it is used the discrete zon-ing method (used by Brazil Navy) to forecast of level water. Fernandes (2006) observed metric differences between the reductions of survey using the discrete method and that one with the
Figure 1: Study area with highlight to the banks off and near the estuary mouth continue surface, obtained by the modelling.
Pinheiro and Vinzon (2013) have demon-strated the viability to incorporate the model re-sults – through tidal level forecasting and up-dating the instantaneous depth – to the 3D vis-ualizations technics, aiding navigation safety to facilitate understanding of the scenario and ren-dering the decision-making faster and intuitive.
Another reason for a reliable water level forecast in navigation channels is the possibility to improve the navigation safety introducing the window tidal in traffic simulations. Access chan-nels to harbors are often subject to tide, so that arrival and departure of ships may be limited to a certain window. This window is mainly deter-mined by the variations of the water level and is therefore of particular importance for deep-draft vessels, but also other parameters such as lat-eral and longitudinal current components, or penetration of the keel into soft mud layers may
be limiting factors (Eloot et al, 2009). In Amazon particular case, tidal window has to be consid-ered for deep-drafted ships to arrive and depart from the ports due the limited depth at mud bank, which its interface with water is consid-ered the bottom.
In maritime field, simulations models have been used for port operations and ship traffic flow. Most of the existing traffic simulations place emphasis on the study of traffic rules and entrance regime on port capacity with very little attention on safety aspect of a particular transit (Pianc, 1997 apud Quy et al, 2007).
Thus, in order to contribute to the safety and efficiency of navigation at Amazon River mouth, this work presents different improvements to forecast the water levels and navigable depths, through the operation of hydrodynamic model-ing and discrete-event simulations of the traffic.
2

2 – Methodology
2.1 – Hydrodynamic Model The Delft3D – FLOW, a finite differences
model, has been used to simulate the hydrody-namic conditions in region of the study. The computational grid extend from the Cape Or-ange to western coast of Maranhão states, in along-shore direction; and from the Amazon River, just downstream Santarém City, to the deep ocean basin, about 280 km beyond the shelf break, in cross-shore direction (Molinas et al., 2014). This model was calibrated by the mean of measured data, mainly along the nav-igation channel, in the inner portion of the estu-ary and continental adjacent shelf.
The bathymetric data used for this model were from about 30 nautical charts published by Brazilian Navy. The boundary conditions considered were tide (FES2004), a monthly cli-matology discharge of rivers that most contrib-utes to this estuarine complex (elaborated from ANA database) and, the wind velocity and sea level pressure (European Centre for Medium-Range Weather Forecast – ECMWF, and ERA-Interim product). More information about the model configuration and its calibrations is avail-able in Molinas et. al. (2014).
The water level and current results from model simulation were analyzed in 10 stations distributed along approximately 350 km in the navigation channel, from nearby Santana Port (P1) to offshore at the inner shelf (PC). The maximum distance between two stations is ≈40.3 km (P8 – P9) and the minimum is ≈32.8km (P9 – PC), with an average distance of ≈39 km between the stations. The bathyme-try of the corresponding stations is presented in Table 1 where the minimum of 11.1 meters is observed for P8 due to the presence of a fluid mud suspension. Compared with water, such a ‘black water’ layer is characterized by a density that is somewhat higher (1050-1300 kg/m 3), but has comparable rheological properties. Therefore, contact between the ship’s keel and the upper part of the fluid mud layer will most likely not damage the ship. In this paper, the water-mud interface is considered as the bot-tom level. Therefore, the minimum under keel clearance has been set to zero. In that way, the keel of the ship will just touch the surface of the mud layer without entering inside.
Table 1: Bathymetry of the regions at the
references stations point. P1 17.5 m P6 16.1 m P2 42.0 m P7 15.3 m P3 23.6 m P8 11.1 m
P4 25.1 m P9 13.6 m P5 26.1 m PC 22.1 m With the results of a year simulation, the wa-
ter levels and currents were extracted and its harmonic analysis realized. The currents was extracted as U and V components, and then, was built with the resultant a series of harmonic data considering SW-NE the predominant direc-tion of the channel. The ebb flow (NE) was de-termined as positive (inner the intervals 0°-150° and 330°-360º) and the flood flow (SW) as neg-ative (inner the interval 150º-330°), with the 0º pointing to the East.
The harmonic analysis is essentially a math-ematical method for processing sampled data of tide for determining the harmonic constants of the various components. It use the Fourier anal-ysis as a filter to separate the components and it considered that a sign is represented by a fi-nite sum of terms in sines and cosines, following equations Eq. 1 describing water level and Eq. 2 describing currents (FRANCO, 1997; Ribeiro, 2013).
𝜼𝜼(𝒕𝒕) = 𝒂𝒂𝟎𝟎 + �𝒂𝒂𝒂𝒂 × 𝐜𝐜𝐜𝐜𝐜𝐜𝝎𝝎𝒂𝒂𝒕𝒕 + 𝜶𝜶𝒂𝒂
𝒌𝒌
𝒂𝒂=𝟏𝟏
Eq. 1
𝑽𝑽(𝒕𝒕) = 𝒗𝒗𝟎𝟎 + �𝒗𝒗𝒂𝒂 × 𝐜𝐜𝐜𝐜𝐜𝐜(𝝎𝝎𝒂𝒂𝒕𝒕 + 𝜶𝜶𝒂𝒂)𝒌𝒌
𝒂𝒂=𝟏𝟏
Eq. 2
where η(t)/ V(t) is signal; 𝑎𝑎𝑎𝑎/𝑣𝑣𝑎𝑎 is amplitude of water level/currents; 𝑎𝑎0/𝑣𝑣0 is the mean level of reference established/river velocity; k is har-monic components considered; αn is the phase and; ωn is the angular frequencies correspond-ents.
The tide forecast for the same year of data was used to assess the representativeness of the harmonic components resulting from analy-sis. The tools “t_tide” and “t_predic”, of MatLab program (Pawlowicz, 2002) were used to pro-ceed the harmonic analysis and tide forecast, respectively. The Figure 2 show an example of the comparison between the series resultant of model simulation and the forecast made with the components resultant of harmonic analysis at PC station.
Water level and currents had the representa-tion of amplitude/phases varying in the stations, with a maximum - minimum mean error of 6.10 x 10⁻⁴ (P9) and -5.92 x 10⁻⁶ (P7) for water level, and of 9.13 x 10⁻⁴ (P9) and -9.61 x 10⁻⁴ (P6) for currents.
3

Figure 2: Graphics with the model data and forecast for PC station. Time indicated in Julian days
Figure 3: The hydrodynamic data results of P1 station. The highlighted parts indicates the se-lected periods of river’s high discharge (blue) while the rectangle represents the spring tide
2.2 – Stochastic Traffic Simulation The traffic simulations were realized to esti-
mate the grounding risk in some specific situa-tions at Amazon’s mouth. All the components resultants of harmonic analysis was imple-mented in the simulation to reproduce the water level and currents of astronomical tide. The spring tide occurring in May was chosen to be the stage of the tide that induces greater ampli-tude variation.
The ship draft considered here corresponds to 11.5 meters, the limit imposed by the Barra Norte – Amazonas entrance (CDP, 2000) at 12 knots over water. The simulation model has
been sliced in nine sections where the bathym-etry was considered constant, see Figure 1.
Six scenarios were defined to perform the traffic simulations. In each case, a departure of the ship is considered each hour during 48 hours. The simulation experiment matrix is pre-sented in Table 2. Experiments 1 and 2 corre-spond respectively to the simulation of the voy-age of a ship from shelf to Santana port (PC to P1) and exit from port to shelf (P1 to PC) con-sidering only the currents and water levels due to the tide. Next experiments 3 and 4 consider the river discharge effect in addition to the tide. Finally, experiments 5 and 6 corresponds to the
4
study of the effect of the uncertainty on the ba-thymetry measurement while the river dis-charge is disregarded.
Table 2: Simulation experiment matrix Exp Voy. Tide River
disch. Bath. var.
1 PC to P1 Yes No No 2 P1 to PC Yes No No 3 PC to P1 Yes Yes No 4 P1 to PC Yes Yes No 5 PC to P1 Yes No Yes 6 P1 to PC Yes No Yes
The current due to river discharge has been
considered at all stations while water level due to river discharge has been considered only at stations P1 to P6. Table 3 presents the con-stants that has been considered for each sta-tion for the period of the highest river discharge of the year corresponding to May. The authors understand that in the outer stations there is no significant influence of the river discharge on the water levels.
Table 3: Constants due to highest river dis-charge (May)
Current Level Current Level [m/s] [m] [m/s] [m]
P1 0.67 1.22 P6 0.38 0.00 P2 0.55 1.10 P7 0.20 0.00 P3 0.43 0.98 P8 0.21 0.00 P4 0.58 0.75 P9 0.21 0.00 P5 0.52 0.58 PC 0.28 0.00
The incertitude on the bathymetry is consid-
ered to model the effect of the bathymetry un-certainties, presence of small dunes and mud layers. In order to take into account of this ef-fect, a stochastic variable following a triangular probability density function presented in Eq. 3 has been added to the bathymetry depth pre-sented in Table 1. Value of 𝑎𝑎, 𝑏𝑏 and 𝑐𝑐 were re-spectively taken to -0.5, 0.5 and 0.
⎩⎪⎪⎨
⎪⎪⎧
0 for 𝑥𝑥 < 𝑎𝑎,2(𝑥𝑥−𝑎𝑎)
(𝑏𝑏−𝑎𝑎)(𝑐𝑐−𝑎𝑎)for 𝑎𝑎 ≤ 𝑥𝑥 < 𝑐𝑐,
2𝑏𝑏−𝑎𝑎
for 𝑥𝑥 = 𝑐𝑐,2(𝑏𝑏−𝑥𝑥)
(𝑏𝑏−𝑎𝑎)(𝑏𝑏−𝑐𝑐) for 𝑐𝑐 < 𝑥𝑥 ≤ 𝑏𝑏,
0 for 𝑏𝑏 < 𝑥𝑥.
Eq. 3
At each section is corresponding a refer-
ence point (P1-9 and PC) to assess the water level as well as the currents. Both under keel clearance and ship speed over ground has
been re-calculated 10 minutes of the simulation. However, these values are considered constant during this interval. If the under keel clearance has been inferior to zero at least once in the sim-ulation, a trigger is set to true in order to identify that the ship has been in front of a grounding issue. Squat effect, heel due to wind and ship motions due to waves has been disregarded in this study.
3 – Results
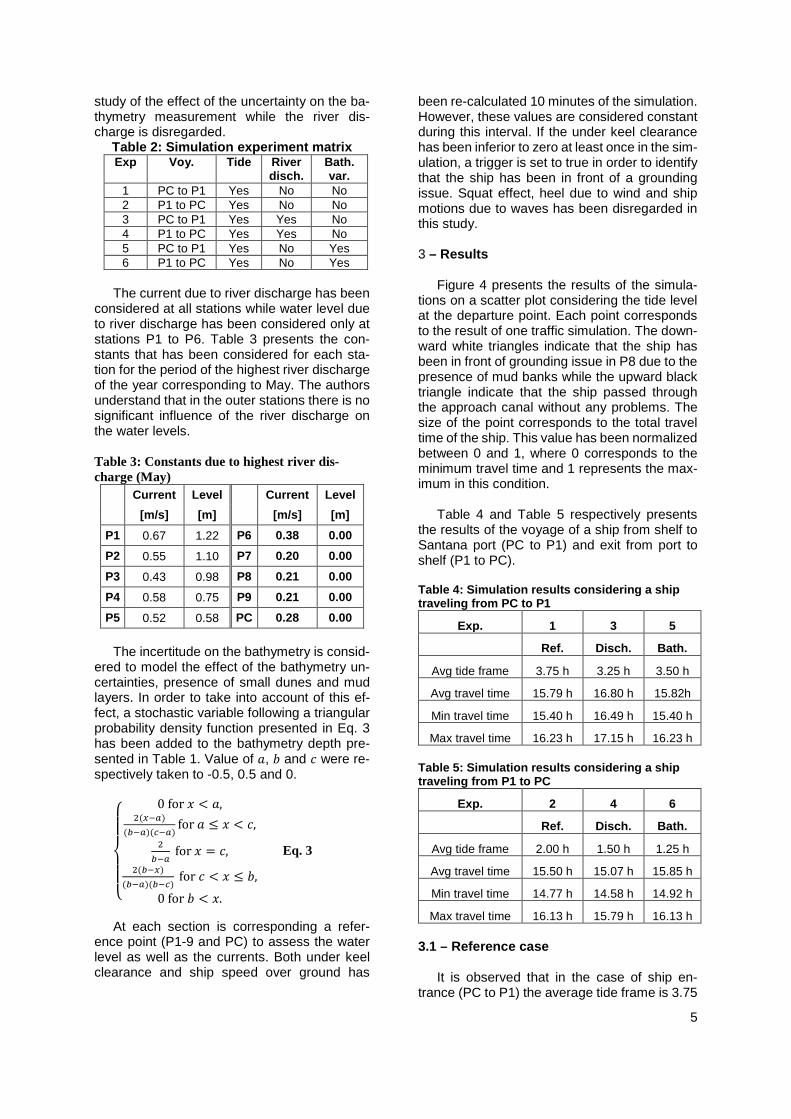
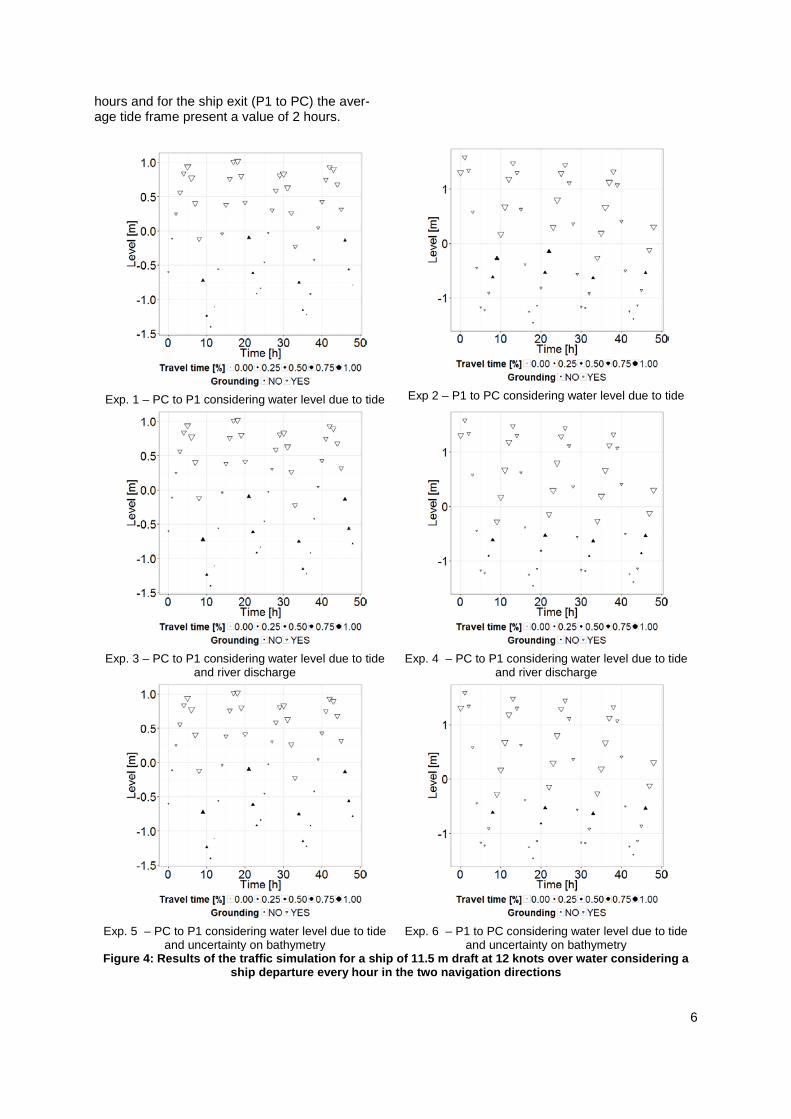
Figure 4 presents the results of the simula-
tions on a scatter plot considering the tide level at the departure point. Each point corresponds to the result of one traffic simulation. The down-ward white triangles indicate that the ship has been in front of grounding issue in P8 due to the presence of mud banks while the upward black triangle indicate that the ship passed through the approach canal without any problems. The size of the point corresponds to the total travel time of the ship. This value has been normalized between 0 and 1, where 0 corresponds to the minimum travel time and 1 represents the max-imum in this condition.
Table 4 and Table 5 respectively presents
the results of the voyage of a ship from shelf to Santana port (PC to P1) and exit from port to shelf (P1 to PC).
Table 4: Simulation results considering a ship traveling from PC to P1
Exp. 1 3 5
Ref. Disch. Bath.
Avg tide frame 3.75 h 3.25 h 3.50 h
Avg travel time 15.79 h 16.80 h 15.82h
Min travel time 15.40 h 16.49 h 15.40 h
Max travel time 16.23 h 17.15 h 16.23 h
Table 5: Simulation results considering a ship traveling from P1 to PC
Exp. 2 4 6
Ref. Disch. Bath.
Avg tide frame 2.00 h 1.50 h 1.25 h
Avg travel time 15.50 h 15.07 h 15.85 h
Min travel time 14.77 h 14.58 h 14.92 h
Max travel time 16.13 h 15.79 h 16.13 h
3.1 – Reference case
It is observed that in the case of ship en-trance (PC to P1) the average tide frame is 3.75
5
hours and for the ship exit (P1 to PC) the aver-age tide frame present a value of 2 hours.
Exp. 1 – PC to P1 considering water level due to tide
Exp 2 – P1 to PC considering water level due to tide
Exp. 3 – PC to P1 considering water level due to tide
and river discharge
Exp. 4 – PC to P1 considering water level due to tide
and river discharge
Exp. 5 – PC to P1 considering water level due to tide
and uncertainty on bathymetry
Exp. 6 – P1 to PC considering water level due to tide
and uncertainty on bathymetry Figure 4: Results of the traffic simulation for a ship of 11.5 m draft at 12 knots over water considering a
ship departure every hour in the two navigation directions
6

The total travel time is minimized if the ship starts as late as possible at the falling tide trav-elling from PC to P1 however when he ship is traveling from port to sea (P1 to PC), the total travel time is reduced if the ship start at the be-ginning of the rising tide.
3.2 – Effect of river discharge
Considering a voyage of a ship from shelf to port, it can be observed that the river discharge has a considerable impact on the simulation re-sults by increasing the average travel time by one hour and reducing the average tide frame by half an hour. The opposite case that involve the voyage of a ship from the port to the shelf presents the reverse situation. The discharge of the river induce a reduction of the average travel time by 0.43 hour while the average time frame is reduced by half an hour. 3.3 – Effect of bathymetry uncertainty
As previously mentioned, the sensitivity to
the bathymetry error measurement has been modelled using a stochastic variable. It means that successive simulations may give different results. It can be observed that the case of a voyage of a ship from shelf to port is almost not affected in comparison the reference case. However, for the opposite case regarding the ship travelling from port to shore, the uncer-tainty on bathymetry measurement increase the average travel time by 0.35 hour and re-duce the average tide frame by 0.75 hour.
4 – Conclusions
This study suggests that the proposed
model can improve the decision making regard-ing acceptable tidal windows. It has been shown that the combination of hydrodynamic model and traffic simulations can be used to im-prove trade performance of approach channels, mainly where low predictability of levels exists.
Simulations for the case of the Amazon North channel showed that there is a significant influence of the river discharge on the tidal modulation and consequently on the travel time.
The unique probabilistic aspects that has been considered in this study correspond to the uncertainty on bathymetry measurement. Fu-ture enhancements may include additional un-certainties such as ship draft, tidal prediction er-rors and wave forecast.
This analysis will lead to a better safety and better efficiency of ports and channel opera-tions. Indeed, the methodology allow the calcu-lation of a timetable on a year period showing the tide window for a specific draft and a specific ship speed over water. High-tide windows can be used to allow deep-draft vessels to sail in the channel with the tide. Although, there is a need to include other effects and parameters into traf-fic simulation in order to improve the channel navigation, such as the seasonality of river dis-charge.
Other considerations such the squat effect, the heel due to wind or the ship motions due to waves might be included in the model in a future work. However, in the present case study, these effects are considered secondary as the limited depth of the approach channel present a small extension and the sea bottom presents a soft mud in suspension.
5 – Acknowledgments
This research was partially supported by Grant 456288/2013-9 of Brazilian National Re-search Council (CNPq). We thank the anonymous reviewers for their feedback.
6 – Referências Bibliográficas
ARENTZ, M. F. R. A modelagem hidrodinâmica como auxílio à navegação no canal norte do es-tuário do Amazonas. M. Sc., Federal University of Rio de Janeiro, RJ, Brasil. 2009.
COMPANHIA DOCAS DO PARÁ – CDP. Reso-lução Nº 66, de 26 de junho de 2000. Diário Ofi-cial da União, p. 5/6. 21/08/2000.
DEPARTAMENTO NACIONAL DE INFRAESTRUTURA DE TRANSPORTE. “Hi-drovia Do Solimões/Amazonas”. Available in: http://www.dnit.gov.br/hidrovias/hidrovias-interi-ores/hidrovia-do-solimoes-amazonas. Acess in: October 08, 2016.
ELOOT, K. Development of decision supporting tools for determining tidal windows for deep-drafted vessels. TransNav, the International Journal on Marine Navigation and Safety of Sea Transportation, Vol. 4, No. 3, pp. 323-330, 2010.
FERNANDES, R. D. Teste metodológico para a redução de sondagens na foz do rio Amazonas. M. Sc., Federal University of Rio de Janeiro, RJ, Brasil. 2006.
FERNANDES R.D. Formação e Evolução dos Bancos de Areia da Foz do Rio Amazonas. Tese de Doutorado em PEnO, COPPE/UFRJ, Rio de Janeiro, RJ, Brasil, 2010.
7

FRANCO, A. S. Marés, Fundamentos, Análise e Previsão. 1º.ed, Niterói, RJ, Diretoria de Hi-drografia e Navegação, 1997. 265 p.
GALLO, M. N. A Influência da Vazão Fluvial so-bre a Propagação da Maré no Estuário do Rio Amazonas M. Sc., Federal University of Rio de Janeiro, RJ, Brasil. 2004.
MOLINAS, E.; VINZON, S. B.; VILELA, C. P. X; GALLO, M. N. 2014. Structure and position of the bottom salinity front in the Amazon Estuary. Ocean Dynamics (2014) 64:1583 – 1599.
PAWLOWICZ R., BEARDSLEY B., and LENTZ S. , Classical tidal harmonic analysis including error estimates in MATLAB using T_TIDE, Computers and Geosciences, 2002, 28:929 – 937
PIANC. Approach channels – A guide for de-sign. In Supplement to Bulletin no 95 (Interna-tional Association of Ports and Harbors), 1997.
PIANC 2014. Harbour Approach Channels De-sign Guidelines. Report 121. The world Associ-ation for Waterborne Transport Infrastructure.
PINHEIRO, F. M.; VINZON, S. B. Seabed fea-tures characterization of Barra Norte by multibeam survey: Furrows evidence at the outermost river branch of the Amazon River. In: Acoustics in Underwater Geosciences Sympo-sium (RIO Acoustics), 2013 IEEE/OES.
QUY, N.M. et al. Modeling Risk and Simulation-Based Optimization of Channel Depths at Cam Pha Coal Port. In: Proceedings of the IASTED Asian Conference – Modelling and Simulation, 2007, Beijing, China.
REZENDE M.F., VINZON S.B. The Use Of Hy-drodynamic Modeling In Navigation Aids Along The Northern Channel Of The Amazon Estuary. Hydro9, Enhancing Global Capacity, 2009, Ci-dade Do Cabo.
RIBEIRO, J. L. Aplicação da técnica de wave-lets para análise e previsão de marés no estuá-rio do Amazonas. M. Sc. M. Sc., Federal Univer-sity of Rio de Janeiro, RJ, Brasil. 2013.
8