


Línguas
Páginas
Legal


Electric sensor to investigate ablation and associated
processes in thermal protection systems
Tiago Manuel de Oliveira Marques
Dissertação para obtenção do Grau de Mestre em
Astrofísica e Instrumentação para o Espaço
Júri
Presidente: Professor João Manuel de Morais Barros Fernandes
Vogal: Professora Maria Alexandra Albuquerque Faria Pais
Orientadores: Professor José Lopes Pinto da Cunha
Engenheiro Abel Borges Ferreira Mendes
Outubro de 2013

ii

iii
Abstract
In this thesis is presented a non-invasive sensor to measure in real time the ablation of
thermal protection systems during atmospheric entry and re-entry.
Thermal protection systems are critical to ensure that future spacecraft have the
capabilities needed to descend through another planet atmosphere. One of the next
challenges in space achievements is to send humans to Mars. For this type of mission it
is useful to have a sensor measuring the recession rate of the thermal protection system
and sending the data back to Earth.
The return from space incurs the risk of human casualties and property damages. The
models used to assess this risk contain a large degree of uncertainty and lack
experimental data for calibration. The data recorded is expected to provide invaluable
insight leading to thermal protection systems optimization. Such sensor could reduce
developmental costs and risks to space flight.
This electrical sensor is inspired in mutual impedance technique, suitable to measure the
shield thickness during ablation.
Keywords: Thermal Protection Systems, Space Instrumentation, Atmospheric Entry,
Mutual Impedance, Ablation, Electric sensors.
iv
Resumo
Nesta tese, é apresentado um sensor não-intrusivo para medir, em tempo real, a ablação
de um sistema de proteção térmica, durante uma entrada atmosférica.
Os sistemas de proteção térmica são indispensáveis para garantir que veículos espaciais
possam aterrar noutros planetas. O próximo grande passo da humanidade ao nível
espacial é enviar humanos para Marte. Para uma missão desse género, será fundamental
ter um sensor que consiga medir a perda de massa em tempo real e que esses dados
sejam enviados para a Terra.
O regresso do espaço é um risco para todos os tipos de missões, quer sejam tripuladas
ou não tripuladas. Os modelos utlizados para estudar o risco necessitam de um grande
volume de dados experimentais para refinar as calibrações e serem mais precisos.
Espera-se que os dados recolhidos pelo sensor sejam de grande valor para a otimização
dos sistemas de proteção térmica. Este sensor pode reduzir os custos e os riscos destas
missões.
Este sensor usa a técnica da impedância mútua para medir a espessura da proteção
térmica durante o processo ablativo.
Palavras Chave: Sistemas de proteção térmica, instrumentação para o espaço, entrada
atmosférica, impedância mútua, ablação, sensores elétricos.

v

vi
Contents
Abstract ............................................................................................................................ iii
Resumo ............................................................................................................................ iv
Acknowledgements ....................................................................................................... viii
List of Tables .................................................................................................................... x
List of Figures .................................................................................................................. xi
List of Acronyms ........................................................................................................... xiii
List of Symbols .............................................................................................................. xiv
1. Introduction ............................................................................................................... 1
1.1. Motivation ................................................................................................................. 1
1.2. Scope of the work .............................................................................................. 2
2. Theoretical Background ............................................................................................ 3
2.1. Atmospheres ...................................................................................................... 3
2.2. Thermal Protection Systems .............................................................................. 4
2.3. Ablative Materials .............................................................................................. 6
2.4. Ablation ............................................................................................................. 6
2.5. CFD methods for ablating systems .................................................................... 8
3. State of the Art ........................................................................................................ 10
Recession Measurement ............................................................................................. 10
3.1. ARAD .............................................................................................................. 11
3.2. HEAT ............................................................................................................... 12
4. The TPIP Project ..................................................................................................... 14
4.1. Thermal Protection system sensor based on Impedance Probe (TPIP) ........... 14
4.2. System Architecture ......................................................................................... 14
4.3. Mutual Impedance Probe ................................................................................. 16
4.4. Electrodes Integration ...................................................................................... 19

vii
5. Test Results ............................................................................................................. 22
5.1. Electrodes Configuration Selection ................................................................. 22
5.2. Tested features ................................................................................................. 26
6. Conclusions ............................................................................................................. 51
6.1. Thesis Contribution .......................................................................................... 51
6.2. Looking Forward ............................................................................................. 52
6.3. Future Work ..................................................................................................... 52
6.4. Final Thoughts ................................................................................................. 52
Annexes .......................................................................................................................... 54
A1. P50 data sheet ...................................................................................................... 54
A2. Calcarb data sheet ................................................................................................ 55
A3. System Requirements .......................................................................................... 56
References ...................................................................................................................... 58

viii
Acknowledgements
The author wishes to acknowledge to all who have directly or indirectly assisted in the
creation of this work:
First of all, thanks to my family, for the unconditional support. My heartfelt thanks to
my mother, for the encouragement and permanent belief in me.
To Ricardo Patrício and Abel Mendes at Active Space Technologies, for accepting me
to do my master dissertation while doing an internship at the company. I learned a lot
with all AST team. Special thanks to Fernando Simões, for his invaluable insights and
transmitted passion about science.
Prof. José Pinto da Cunha and Prof. João Fernandes at University of Coimbra, for
advising me to make my thesis in a company.
And last, but not least, my good friends for keeping me sane and enjoying life.

ix

x
List of Tables
Table 1: Orders of magnitude of anticipated recession for each type of mission. ........... 5
Table 2: Different electrode configurations [29]. ........................................................... 25
Table 3: Dielectric properties of tested materials. .......................................................... 27
Table 4: Calibration of TPIP sensor. Data acquired at the frequency of 1 kHz and using
cables of 38 cm of length. ............................................................................................... 28
Table 5: Number of time a configuration appears among the best configurations for each
frequency. ....................................................................................................................... 35
Table 6: Average and standard deviation of TPIP measurements for configuration 4:
PCB vs. SP electrodes. ................................................................................................... 50
Table 7: Functional Requirements. ................................................................................. 56
Table 8: Performance Requirements. ............................................................................. 56
Table 9: Environmental and Operational Requirements. ............................................... 56
Table 10: Physical Requirements. .................................................................................. 56
Table 11: Design Requirements and Implementation Constraints. ................................ 56
xi
List of Figures
Figure 1: Artist impression of a spacecraft atmospheric reentry [32]. ............................. 3
Figure 2: ARD Front-shield TPS a) before and b) after recovery [4]. ............................. 6
Figure 3: Ablation Process [24]. ....................................................................................... 7
Figure 4: Surface Mass Balance (SMB). .......................................................................... 9
Figure 5: Surface Energy Balance (SEB). ........................................................................ 9
Figure 6: Schematics of Arad sensor. Each ARAD device consists of a narrow rod made
of the ablator material itself (carbon fiber phenolic) wrapped with alternating layers of
insulating tape (Kapton), Platinum-Tungsten wire, another Kapton layer, and Nickel
ribbon [25]. ..................................................................................................................... 11
Figure 7: Heat Sensor. a) materials [26], b) schematics [27]. ....................................... 13
Figure 8: TPIP system architecture. ............................................................................... 15
Figure 9: Electrodes assembly [1] a) Electrodes view b) Shielding view. ..................... 16
Figure 10: Principle of Mutual Impedance measurement [29]. ...................................... 17
Figure 11: P50 sheets from Amorim Cork Composites. ................................................ 18
Figure 12: 1 - Ablative TPS layer; 2 - Internal layer. Adapted from [23] ...................... 19
Figure 13: Integration of the electrodes in the internal surface of TPS. In black is shown
the wire used for the signals transmission between the electrodes and the data
acquisition unit. .............................................................................................................. 20
Figure 14: Characterization of all 10 different electrode configurations measuring P50
samples. FR4 is an epoxy based composite present on printed circuit boards (PCB) and
is where the electrodes are integrated. ............................................................................ 29
Figure 15: Mean and standard deviation of the amplitude and phase as a function of
thickness at 10 Hz [29]. .................................................................................................. 30
Figure 16: Mean and standard deviation of the amplitude and phase as a function of
thickness at 200 Hz [29]. ................................................................................................ 31
Figure 17: Mean and standard deviation of the amplitude and phase as a function of
thickness at 1kHz [29]. ................................................................................................... 32
Figure 18: Mean and standard deviation of the amplitude and phase as a function of
thickness at 10 kHz [29]. ................................................................................................ 33

xii
Figure 19: Mean and standard deviation of the amplitude and phase as a function of
thickness at 100 kHz [29]. .............................................................................................. 34
Figure 20: Electric field representation. ......................................................................... 36
Figure 21: influence of DC electric field on TPIP measurements. The vertical dashed
line identifies when the electric field is turned on [29]. ................................................. 37
Figure 22: Magnetic field test assembly. ........................................................................ 38
Figure 23: Influence of a DC magnetic field on TPIP measurements [29]. ................... 38
Figure 24: Equipotential test setup. ................................................................................ 39
Figure 25: Electric field distribution with (bottom) and without (top) an equipotential
surface [28]. .................................................................................................................... 40
Figure 26: Amplitude and phase as function of thickness with and without equipotential
surface [29]. .................................................................................................................... 41
Figure 27: Thermal chamber test [29]. ........................................................................... 42
Figure 28: Influence of temperature on amplitude and phase measurements. Results for
a P50 sheet of 5 mm thick [29]. ...................................................................................... 42
Figure 29: P50 burning [1]. ............................................................................................ 43
Figure 30: Influence of heat and pyrolization on TPIP measurements. P50 with
thickness of 10 mm [29]. ................................................................................................ 44
Figure 31: Testing TPIP response to thickness increase with Calcarb® layers. Note that
the sensor is attached to a P50 plate with 5 mm thick [1]. ............................................. 45
Figure 32: Amplitude and phase as a function of thickness at frequency of 1 kHz [29].
........................................................................................................................................ 46
Figure 33: Calcarb burning [1]. ...................................................................................... 46
Figure 34: Influence of heat and pyrolization on TPIP measurements - Calcarb® with
thickness of 18 mm [29]. ................................................................................................ 47
Figure 35: Influence of heat and pyrolization on TPIP measurements. P50 - 5 mm and
Calcarb® - 18 mm [29]. ................................................................................................. 48
Figure 36: Silver Paint electrodes painted on a P50 plate. Same geometry as
configuration four (C4). .................................................................................................. 49
Figure 37: Amplitude and phase as a function of thickness vs. silver paint electrode
[29]. ................................................................................................................................ 50
Figure 38: MI signal at 1 kHz as function of P50 thickness........................................... 53

xiii
List of Acronyms
ARAD Analog Resistance Ablation Detector
ARD Atmospheric Reentry Demonstrator
AST Active Space Technologies
CFD Computational Fluid Dynamics
ELF Extreme Low Frequency
ESA European Space Agency
FFT Fast Fourier Transform
HEAT Hollow aErothermal Ablation Temperature
IS Impedance Spectroscopy
IXV Intermediate eXperimental Vehicle
MEDLI Mars Science Laboratory Entry, Descent, and Landing Instrument
MI Mutual Impedance
MIP Mutual Impedance Probe
MSL Mars Science Laboratory
NASA National Aeronautics and Space Agency
PCB Printed Circuit Board
PVD Physical Vapor Deposition
TPIP Thermal Protection System sensor based on Impedance Probe
TPS Thermal Protection System
VLF Very Low Frequency

xiv
List of Symbols
A Amplitude
E Electric field
f Frequency
I Current
R Resistance
Z Impedance
Permittivity
Conductivity
Phase
Angular frequency


1
1. Introduction
1.1. Motivation
Space vehicles that enter a planetary atmosphere require use of a thermal protection
system (TPS) to shield them from aerodynamic heat. The TPS consists of various
materials applied on the spacecraft to give protection against aerodynamic heating. This,
combined with vehicle’s configuration and entry trajectory, define the temperature
distribution on the vehicle. The problem of re-entry on the Earth’s atmosphere was a
significant challenge for the early spaceflight researchers, as they considered how best
to overcome the heat resulting from friction and compression of the atmospheric gas.
Nowadays, the research challenge is more focused on TPS optimization, to improve
material performance and risk assessment.
Investigation of ablation processes on the surface of TPS during entry or re-entry in the
atmosphere is fundamental for humans to go further in space exploration. The term
ablation is usually referred to the removal of material from the heat shield due to
material heating and pyrolysis, which is caused by atmospheric gas drag. For any
planetary entry probe, the heat shield is a key component that can constitute a
significant fraction of the available spacecraft mass and respective mass budget. The
lack of in-flight data from previous missions does not allow the reduction of
uncertainties about mass constraints, and it is essential to develop lightweight
techniques and in-situ sensors to assess the interaction between the aerothermodynamic
flow and the TPS response. The performance of TPS ablation is closely related to the
mass and heat transfer as well as to chemical reactions that occur within the gas
boundary layer. Usually, heat shield mass is overestimated to increase re-entry safety
margins.
Ch
apte
r
1

2
1.2. Scope of the work
The project presented and discussed in this thesis aims to develop an innovative non-
intrusive electrical sensor to provide real time measurements of the TPS surface
recession of entry and re-entry space vehicles. This research was conducted during an 8
months internship at the Active Space Technologies, in Coimbra. The first phase of the
project has been completed and delivered to the client (ESA). The executive summary is
already available [1] and this work resulted in a patent [2] with the author as a co-
inventor.
For terrestrial missions, the amount of mass lost can sometimes be analyzed after
landing, the same is not possible for planetary missions. Nevertheless, it is very
important to study the ablation during re-entry, when ablation processes are most
critical.
TPIP sensor is based on Mutual Impedance technique and will allow an accurate
measurement of shield thickness during re-entry, by means of a non-intrusive electrical
method. It is based on a mutual impedance probe used to measure the dielectric
properties of the medium, and infer real time estimation of the TPS ablation during re-
entry. The dielectric properties of most materials vary with frequency, composition, and
temperature because polarization is also a function of those parameters.

3
2. Theoretical Background
2.1. Atmospheres
The atmosphere has an important role in the design of entry vehicles. It is
responsible for reducing the entry velocity to an acceptable landing speed by
converting kinetic energy to heat by friction and air compression. During the
hypersonic flight within the atmosphere, depending on velocity and trajectory, the
temperature around the spacecraft shield may surpass 2000 ºC [30] (See Figure 1).
An atmosphere is a layer is gases that may surround a material body of sufficient
mass, like a planet or moon. In our Solar System there are several planets and
moons that have a substantial atmosphere.
Figure 1: Artist impression of a spacecraft atmospheric reentry [32].
Ch
apte
r
2

4
2.2. Thermal Protection Systems
To protect the spacecraft structure from the high temperatures that are present during
atmospheric entry or re-entry is mandatory to use a heat shield. The TPS is usually
made of layers of various materials applied outside of the structure of the space vehicle
to maintain the skin within a range of acceptable temperatures. The TPS mass depends
primarily on spacecraft size, shape and the entry profile. The TPS can be divided in two
broad classes: i) one uses a covering material that will absorb the heat and radiate it
back into space, away from the spacecraft. In fact, all materials radiate heat depending
of the temperature. However, only certain materials can radiate heat so efficiently that
the temperature does not build up within the material and in the spacecraft, possibly
melting its structure. ii) another class of TPS is intended to burn and fall away from the
spacecraft. These materials need not absorb or radiate efficiently, so when the surface
becomes very hot, the material starts to burn steadily and erodes. The term that
describes this process of material being eroded by heat is ablation. This work mainly
focus on ablative TPS, described more in detail in next section. Table 1 shows some
predicted recession thickness taken from various missions [3]. All considered vehicles
are capsules, except Intermediate eXperimental Vehicle (IXV).

5
Mission Area Material Thickness Recession
Advanced Re-entry
Vehicle - 1998 [4]
Front
Shield
Low Density
Carbon-Phenolic
60 to 80 mm 10-20 mm
Back
Cover
Norcoat-Liège 10 to 15 mm ~ 2 mm
IXV - 2009 [5] Windward Low Density
Carbon-Phenolic
80 to 100 mm 15-20 mm
Leeward Norcoat-Liège 12 to 19 mm ~ 0
Jupiter (Galileo) –
1989 [6]
Front
Shield
High Density
Carbon-Phenolic
140 (nose) to
55 mm
(shoulder)
~ 45 mm
Titan (Huygens) –
1997 [7]
Front
Shield
AQ60 (LD Silica
Phenolic)
17 to 19 mm < 2 mm
Back
Cover
Prosial 1 to 3 mm 0
Mars Express (Mars) –
2003 [8]
Front
Shield
Norcoat-Liège 8 to 12 mm 1 – 2 mm
Back
Cover
Norcoat-Liège 1,5 to 8 mm 0
Table 1: Orders of magnitude of anticipated recession for each type of mission.

6
2.3. Ablative Materials
Different thermal protection systems (ablation, heat sink, transpiration cooling) have
been proposed and studied quite extensively, especially from the experimental point of
view. Among them, is ablative TPS, which is characterized by a sacrificial removal of
the surface material to protect the underlying structure, are normally applied on
spacecraft or solid rocket nozzles. When surface is hot enough the material starts
burning and ablating, thus protecting the spacecraft. The process is explained in section
2.4. Ablative TPS must be designed to protect the vehicle with a minimum weight
penalty. Typically, we categorize ablative TPS by density, i.e., low density, mid density
and high density. Material strength increases with density, but so does the thermal
conductivity. Depending on mission entry environment the selected material requires a
balance between ablative and insulation efficiency. In Figure 2 is shown the result of
ablation on Advanced Re-entry Vehicle (ARD).
Figure 2: ARD Front-shield TPS a) before and b) after recovery [4].
2.4. Ablation
A complete understanding of the ablation process however, requires a study of the heat
loads experienced during the entry process. This is the most significant heat load.
Radiative heat flux from the preceding bow shock also provide a significant heat load
that contribute to the total and dictate which materials can be exposed to these loads.

7
Consequently, a combination of design strategy and understanding of the re-entry
environment can be used to control ablation. Section 2.5 shows however, that current
models used to simulate such an environment contain critical uncertainty.
During entry, ablative materials undergo three stages, as can be seen in Figure 3: i)
virgin material, ii) pyrolysis1 and iii) char. The material is considered virgin until it has
been affected by heat or radiation as heating increases and pyrolysis begins. As it is
heated, the original virgin material pyrolysis and yields a pyrolysis gas, which
percolates away from the pyrolysis zone leaving a porous residue which for most
materials it is a carbonaceous char. This char is low density substrate that adheres to the
remaining material after the pyrolysis phase ends. The phenomena can be described as
the process whereby mass is removed from an object by vaporization or other similar
erosive processes. But the ablation also occurs in different branches of physics, for
example, in the melting or sublimation of a solid or in laser drilling in metals and the
cornea surgery [9].
Figure 3: Ablation Process [24].
The ablation process is schematically represented in Figure 3, showing that when
heated, the composite resin (epoxy) experiences a series of chemical reactions that
release gaseous by products (pyrolysis) leaving a layer of char.
1 Decomposition of organic material at high temperatures.

8
The study of ablative processes can be grouped in three main categories: i) engineering
models, ii) numerical models and iii) experimental methods. Engineering models are
recommended in the initial stages of space vehicles development; numerical models
apply the theory and can predict the occurring processes; and experimental methods can
give inputs to the other methods and validate some concepts.
2.5. CFD methods for ablating systems
Having an accurate prediction of the thermal response of TPS materials is essential to
successfully carry out the design of an optimum TPS. Simulation tools should be able to
compute the surface recession and temperature histories under general heating
conditions. Most commercial Computational Fluid Dynamics (CFD) codes use ordinary
surface boundary conditions and cannot be realistically used to predict the aerothermal
heating profile of TPS [10]. Normally, CFD codes treat fluid/solid boundary conditions
in a simplified approach and mass transfer is often not even considered. Current
methods focus on some aspects of the problem at expense of others and simplifying the
studies by making assumptions. Thus, aerodynamic methods concentrate on the
flowfield, and rely on other methods to provide material-response characteristics; on the
other hand, material-response methods concentrate on surface ablation and heat
conduction in the material, using simplified models to provide the aerothermodynamic
heating. However, to improve estimation of the heat flux over an ablating surface, a
flow solver coupled with ablating surface conditions becomes a requirement.
Aerothermodynamics phenomena on the receding surface ablate the material and induce
electric currents in the shield. For aerothermal heating predictions over ablating TPS, is
necessary to develop surface thermochemistry procedures that integrate with a Navier-
Stokes flow solver. The general boundary conditions should include appropriate energy
and multispecies mass balances with surface ablation models (See Figure 4 and Figure
5, source [11]).

9
Figure 4: Surface Mass Balance (SMB).
Figure 5: Surface Energy Balance (SEB).
Chemical reactions involving different enthalpy and phase changes take place at TPS
wall, heating and removing material from the shield and modifying in-depth fluxes.
Graphite is the simplest and the most popular material used to study ablation processes.
Oxidation, nitrification, and sublimation are among the common processes that occur on
the front shield.
The model presented above was used by D. Bianchi [12] to describe the ablation
problem. Again, considering some assumptions:
Steady-state flow;
Negligible radiation heat transfer from the hot gas;
Pyrolysis gas in chemical equilibrium at the wall temperature and pressure.
To formulate mathematically this problem it is necessary:
Compressible Navier-Stokes equations;
General heat-transfer equation;
Mass transport equation;
Equation of State;

10
3. State of the Art
TPS Recession is currently measured on probes using namely one of two sensor types:
the Analog Resistance Ablation Detector (ARAD) [13], and the Hollow aErothermal
Ablation Temperature detector (HEAT). These are the two most common types of
sensors that have been used to measure recession.
Recession Measurement
Recession is the term used to define the amount of TPS material ablated during entry
and recession measurements shows how the TPS shield mass change in the process of
entry. In situ TPS sensors are required to provide optimization: sizing tools, design, and
material performance, leading to risk reduction and decrease of mass requirements.
Information about the total recession is quite limited on Earth and practically non-
existent in other planetary missions though, the Galileo mission showed that
temperature and recession measurements contributed to a better understanding of the
Jupiter entry environment and will contribute to improve TPS architectures in future
missions [14]. Recession is generally quite low for most planetary entries, with the
exception of Galileo probe entry in Jupiter atmosphere (See Table 1). Manned vehicles
require more stringent safety conditions, consequently, the TPS thickness and estimated
ablation of such spacecraft ought to be higher.
A four-electrode array employing the mutual impedance technique was used on board
the Huygens Probe to measure the dielectric properties of Titan surface and the
conductivity of the atmosphere.
Ch
apte
r
3
11
3.1. ARAD
One of the more successful efforts in the development of a surface recession sensor is
the quartz-based Analog Resistance Ablation Detector (ARAD), originally developed
by General Electric [15]. The NASA probe heat shield was instrumented with ARADs
to monitor the probe’s heat shield deformation and mass loss during its entry into
Jupiter’s atmosphere (Galileo mission) [13]. The operating principle was similar as the
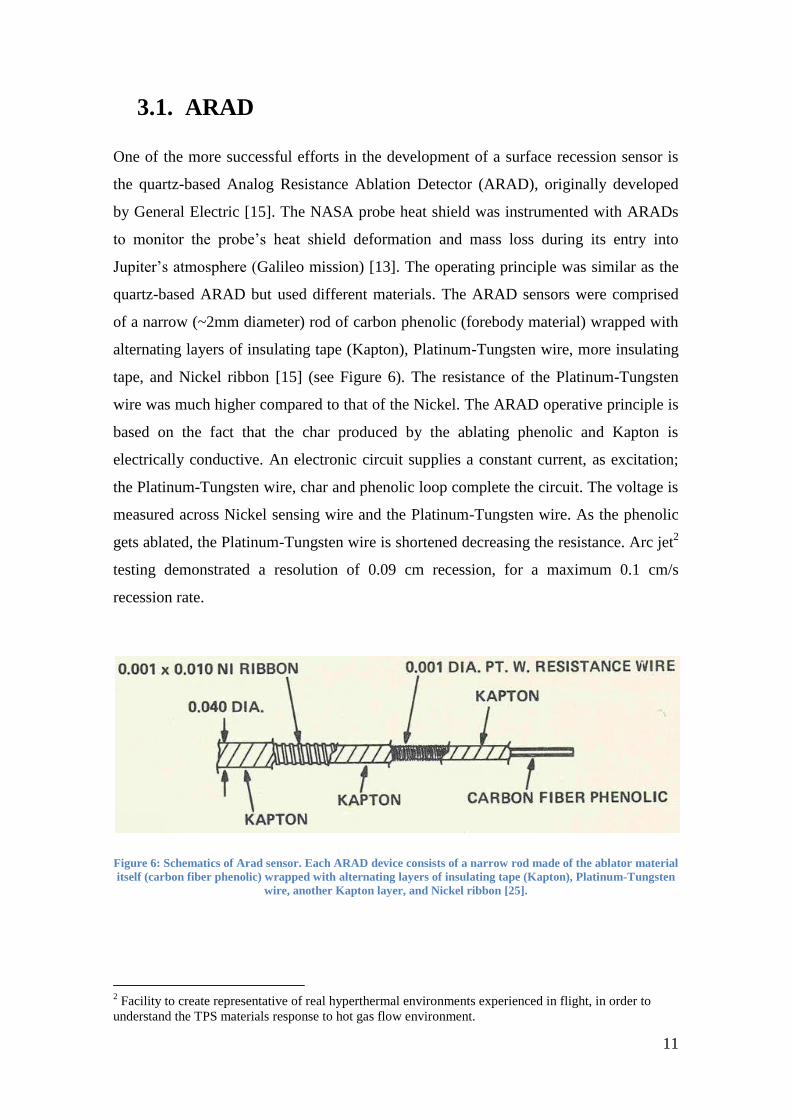
quartz-based ARAD but used different materials. The ARAD sensors were comprised
of a narrow (~2mm diameter) rod of carbon phenolic (forebody material) wrapped with
alternating layers of insulating tape (Kapton), Platinum-Tungsten wire, more insulating
tape, and Nickel ribbon [15] (see Figure 6). The resistance of the Platinum-Tungsten
wire was much higher compared to that of the Nickel. The ARAD operative principle is
based on the fact that the char produced by the ablating phenolic and Kapton is
electrically conductive. An electronic circuit supplies a constant current, as excitation;
the Platinum-Tungsten wire, char and phenolic loop complete the circuit. The voltage is
measured across Nickel sensing wire and the Platinum-Tungsten wire. As the phenolic
gets ablated, the Platinum-Tungsten wire is shortened decreasing the resistance. Arc jet2
testing demonstrated a resolution of 0.09 cm recession, for a maximum 0.1 cm/s
recession rate.
Figure 6: Schematics of Arad sensor. Each ARAD device consists of a narrow rod made of the ablator material
itself (carbon fiber phenolic) wrapped with alternating layers of insulating tape (Kapton), Platinum-Tungsten
wire, another Kapton layer, and Nickel ribbon [25].
2 Facility to create representative of real hyperthermal environments experienced in flight, in order to
understand the TPS materials response to hot gas flow environment.

12
The ARAD sensors had multiple failures on the Galileo mission due to unknown
reasons [3], but it is suspected that there was a low signal to noise ratio contributing to
those failures. Another possible explanation for those failures is electrostatic
discharging interference with the measurement.
3.2. HEAT
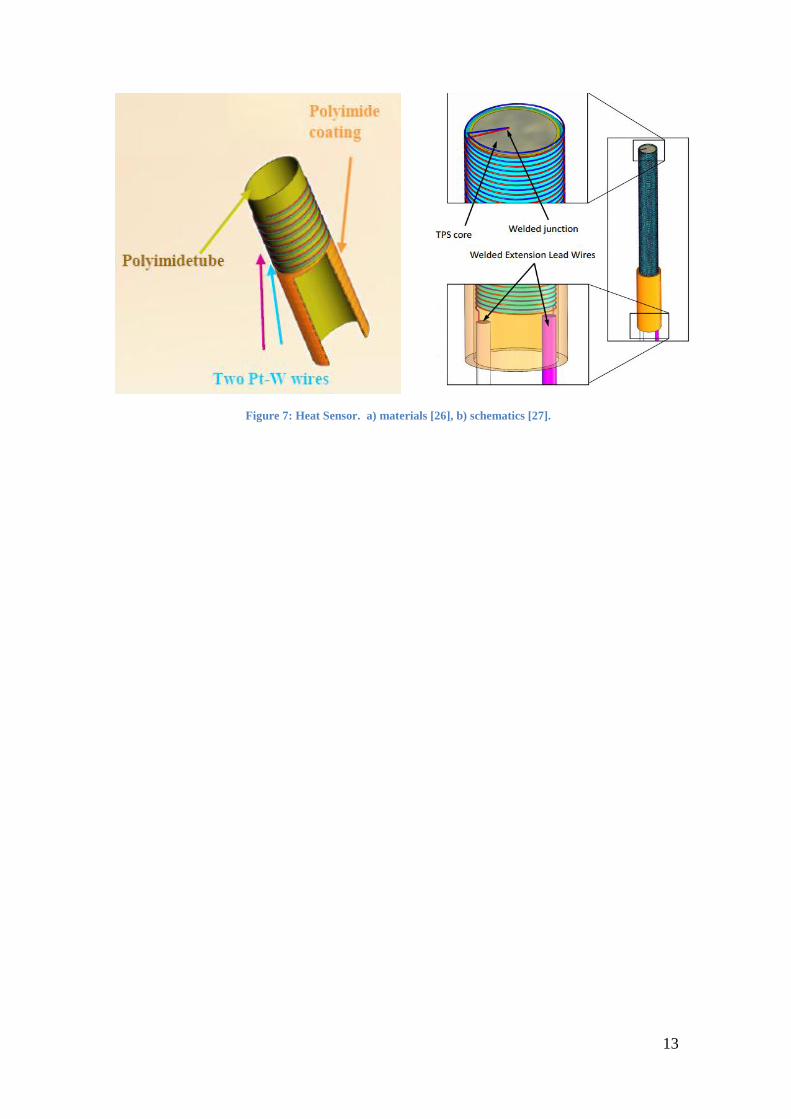
The Hollow aErothermal Ablation Temperature3 detector (HEAT sensor) measures
recession through the corresponding change in resistance and requires an external
constant current source excitation. Like ARAD, is an intrusive sensor because is
necessary to drill holes in TPS to accommodate it. The HEAT sensor operating
principle consists in using a hollow thin-film tube that chars at approximately 700 ºC
and because the char layer is electrically conductive it completes the electrical circuit
between the two coils of wound wire, returning an electrical signal to indicate its length.
The wire is made by platinum and is wrapped around a polyimide tube (See Figure 7).
A core of the acreage TPS is inserted into the HEAT to reduce the sensor’s disturbance
to the local material.
The HEAT sensor was developed to overcome the shortcomings of the ARAD sensor
package and was applied on MSL Entry, Descent and Landing Instrumentation
(MEDLI) that flew on Mars Science Laboratory (MSL), landed on Mars on August
2012.
3 In some literature the acronym HEAT stands for Hollow aErothermal Ablation Tracking.
13
Figure 7: Heat Sensor. a) materials [26], b) schematics [27].

14
4. The TPIP Project
4.1. Thermal Protection system sensor based on
Impedance Probe (TPIP)
This project relates to an ablation sensor for spacecraft’s thermal protection systems
encountering very high temperatures during atmospheric re-entry. The major difference
between available sensors and TPIP is that the others are intrusive. This project aims to
create a non-intrusive electrical sensor to provide real time measurements of TPS
surface recession of entry and re-entry spacecraft. It is based on Mutual Impedance
Probe (MIP) used to measure the dielectric properties of the medium, and to infer TPS
ablation in real time, with a minimum resolution of 0.5 mm for a shield thickness of 20
mm.
4.2. System Architecture
The architecture of the TPIP sensor comprises analogue, digital, and software modules
(See Figure 8). The selected working frequencies for the analogue module are in ELF-
VLF range. The waveform and associated modified signals are injected in the medium
through a pair of transmitters, forming an electric dipole. The digital module includes
the data acquisition system. The software module is responsible for signal processing,
and data analysis and transmission, although it can also be done externally. The basic
numerical algorithm used to assist with data analysis was the traditional Fast Fourier
Transform (FFT), along with averaging techniques. Unlike FFT, sine-fitting algorithms
Ch
apte
r
4

15
are immune to spectral leakage and noise since they act as very narrow band pass filters,
tuning only the sine frequency and disregarding any other disturbances, this can be an
future improvement in data analysis. For the Mutual Impedance technique, where both
transmitting and receiving signals can be measured, one can use a seven-parameter sine-
fitting algorithm, which computes the amplitude, phase, and DC component of the two
signals as well as the common frequency. The differential signal is measured in the two
receivers (Rx1 and Rx2) and a high-pass filter is included to remove the DC and quasi-
static components and, consequently, improve sensor performance.
Noise induced by power lines is mitigated by decoupling capacitors placed as close as
possible to the integrated circuits to minimize interference and crosstalk. The system
uses coaxial and triaxial cabling to carry signals from the receivers and to the
transmitters, respectively.
Analogue module
Power
Signal GeneratorSignal
Conditioning
DACQ
GUI
(LabVIEW)
TPIP
Electrodes
Rx
Tx
Digital Module
Software Module
Figure 8: TPIP system architecture.

16
4.3. Mutual Impedance Probe
Impedance is an important parameter used to characterize electronic circuits,
components, and materials used to make components. To determine the impedance, we
need to measure at least two values since impedance is a complex quantity [16].
Z = I
V (1)
There are different methods for measuring impedances. The method of choice depends
on the frequency range, the magnitude of the applied signal, the desired accuracy and
also the simplicity of implementation [17]. The most standard approach to measure
impedance consists in applying a single-frequency voltage or current to the interface
(electrodes) and measuring the phase shift and amplitude of the resulting current at that
frequency, using either an analog circuit or a FFT analysis of the response. This
approach is known as Impedance Spectroscopy (IS), can usually measure impedances as
a function of frequency in the ranges from about 1 mHz to 1 MHz [18].
The Mutual Impedance (MI) is a technique that belongs to the broad domain of IS but
uses a swept-frequency technique to measures the complex permittivity of a medium,
which is related to the dissipation of energy within the medium. A periodic current of
known shape, amplitude and appropriate frequency, e.g. a sinusoidal or square signal, is
injected between two transmitting electrodes, known as Tx1 and Tx2, and induces a
voltage difference between two receiving electrodes, Rx1 and Rx2, shown in Figure 9.
The impedance of the medium is supposed to be independent of the amplitude of the
applied signal [18]. The sensor sensitivity is expected to be optimal when the material
thickness is commensurate with spacing between transmitters and receivers [21].
Figure 9: Electrodes assembly [1] a) Electrodes view b) Shielding view.

17
Figure 10: Principle of Mutual Impedance measurement [29].
The Mutual Impedance Probe (MIP) is an instrument that implements the MI technique
and requires 4 electrodes (See Figure 10). A sinusoidal current of constant amplitude
with a known frequency is injected between two transmitting electrodes (Tx1 and Tx2)
inducing a voltage, V, between two receivers (Rx1 and Rx2) [19]. The ratio V/I,
equation (1), is the mutual impedance of the probe. This requires a periodic signal that
is used to drive the two transmitting electrodes. If the amplitude and phase of the signal
are (A 0 ,φ 0 ) in a vacuum or other reference medium, and (A,φ) in given environment,
the conductivity, σ, and relative permittivity, ε, of the medium are [20]:
(2)
(3)
where is the angular frequency of the stimuli and the permittivity of the medium.
Equations (2) and (3) are used to derive the dielectric properties of the medium and,
indirectly, the TPS front surface recession. Since no galvanic contact is necessary
between the sensor and the inspecting medium, the electrodes do not have to be
embedded in the TPS. If we guarantee no air between the electrodes and TPS rear
surface, sensor sensitivity is maximized. This topic will be discussed more in detail in
next sections.

18
The relative sensor dielectric constant is given by:
(4)
where and correspond to real and imaginary parts of the dielectric constant. The
optimal response of the MIP is obtained when the imaginary part equals the real part,
yielding to:
(5)
In order to estimate the optimal stimuli frequency we need to assume ~ 3 and
for a P50 medium (Figure 11), obtaining:
The range of optimal frequencies is therefore,
(6)
Figure 11: P50 sheets from Amorim Cork Composites.
Preliminary dielectric characterization of the mentioned P50 (See Annex 1) was
conducted by Professors Carmo Lança and Eugen Neagu, at Universidade Nova de
Lisboa. The electrical conductivity measurements were performed with a relative
humidity of 37% at 298 K, and the obtained results vary between 1E-9 and 1E-7 S/m
[31].

19
P50 cork composite particles are the same particles used by EADS - Astrium for
manufacturing the Norcoat-Liège composite used in thermal protection, and TPS for
NASA launchers. The other material used to validate the system is Calcarb® from
Mersen (See Annex 2) which has similar properties of new carbon based TPS.
4.4. Electrodes Integration
The electrodes mentioned above can be integrated on the internal surface of the TPS and
measure the ablation occurring on the external surface of the shield, as shown in Figure
12.
Figure 12: 1 - Ablative TPS layer; 2 - Internal layer. Adapted from [23]
To assess the most suitable integration solutions, we considered various alternative
solutions, in particular:
1. Machining the TPS
In this solution it is necessary to machinate the TPS surface to assemble the electrode
inside a hole, keeping the surface flat, as shown in Figure 13.

20
Figure 13: Integration of the electrodes in the internal surface of TPS. In black is shown the wire used for the
signals transmission between the electrodes and the data acquisition unit.
A small hole is needed to ensure the connection between the electrodes and the coaxial
cable. One big problem of this solution is the fact that the volume of the layer is
changed by the drilled hole and this has implications in the TPS properties. The solution
for the problem mentioned above is to integrate the sensor without machining the TPS
but the thickness of the electrodes can be an issue.
2. Flexible or rigid PCB glued to the TPS
This solution consists in gluing the electrodes directly on the ablative interior surface of
the TPS. Using glue the air between the electrode and the surface is eliminated, the glue
must be a special one that resists high temperatures and with a low electrical
conductivity because otherwise a “short-circuit” can occur. The PCB can be rigid or
flexible, depending on the integration zone, to ensure a perfect contact between the
electrodes and the TPS structure.
3. Soldering
The soldering technique more adequate for this situation is the metal-ceramic brazing
[22]. That is a process which parts are joined by a metal alloy of low melting pointing,
without melting the base material.

21
4. Deposition
Physical vapor deposition is a set of processes used to deposit thin layers of material,
typically in range of few nanometers to several micrometers in thickness. This process
has three different phases: vaporization of the material; transportation of the vapor in
vacuum to the substrate surface; and, condensation onto the surface thus generating a
thin film. The Physical Vapor Deposition (PVD) can be done directly on the ablative
TPS internal surface.
5. Using adhesive flexible copper foil electrodes
An uncomplicated alternative to make the electrode is to use adhesive cooper foil. It is
very easy to find in the market and is available with different tape thicknesses.
6. Using conductive paint to produce the electrodes directly on the TPS
The electrodes are obtained with conductive liquid paint, applied directly on the interior
surface of the ablative TPS. To help to guarantee the required shape of the electrodes a
mask is required, and the ink can be applied either with a jet or using a brush. This paint
should be silver based because it is a good electrical conductor and is thermally stable.
The above solutions have been evaluated in detail, considering some aspects such as
contact quality, sensor manufacturing, integration, robustness, weight, and cost.
Regarding all the requirements (low mass, low power and non-intrusiveness) and issues
we found that the silver paint electrodes are a very interesting solution. However,
further tests need to be performed and for the TPIP prototype the electrodes are
integrated in a PCB, as shown in Figure 9. The sensor sensitivity is higher using the
PCB because silver paint electrodes are very noise susceptible.

22
5. Test Results
A series of bench tests have been performed to validate the proposed solution and
access if the proof of concept satisfies the goals and the project requirements, namely, in
terms of suitability to perform non-invasive, real-time measurements of TPS thickness,
and accuracy of such measurements. The results of the measurements were presented to
the tester numerically and graphically by data processing module, using Labview®.
5.1. Electrodes Configuration Selection
Selection of the architecture of the electrodes must take into account several
requirements. The size of the electrodes should depend of the sensor sensitivity and the
sensor depth range, and should be similar to the separation between electrodes. Based in
a theoretical assessment of the MIP concept, as well as on its optimization for
measuring the TPS recession level, several electrode shapes and sizes were considered
and tested (see Table 2). The tests are intended to validate the numerical model. To
evaluate theoretically each configuration it was employed model with a finite element
method to solve the generalized Poisson equation, from which one gets the potential
distribution as function of medium properties. Each configuration has four electrodes,
two are transmitters and two are receivers.
Ch
apte
r
5

23
Configuration Shape Specifications
C1
Electrodes
width: 5 mm
Electrodes
length: 20 mm
Gap between
electrodes: 5
mm
C2
Electrodes
width: 10 mm
Electrodes
length: 20 mm
Gap between
electrodes: 10
mm
C3
Electrodes
width: 15 mm
Electrodes
length: 20 mm
Gap between
electrodes: 15
mm
C4
Electrodes
width: 10 mm
Electrodes
length: 50 mm
Gap between
electrodes: 10
mm
(Continues)

24
C5
Most inner
electrode
radius: 5 mm
Electrodes area:
200 mm2
Gap between
electrodes: 6
mm
C6
Inner electrode
radius: 5 mm
Electrodes area:
200 mm2
Gap between
electrodes: 3
mm
C7
Inner electrode
radius: 5 mm
Gap between
electrodes: 2
mm
Electrodes
width: 2 mm
(Continues)

25
C8
Inner electrode
radius: 5 mm
Gap between
electrodes: 4
mm
Electrodes
width: 4 mm
C9
Dipole external
diameter: 9 mm
Dipole strip cut-
out: 3 mm
Gap between
electrodes: 4
mm
Electrodes
width: 4 mm
C10
Dipole external
diameter: 18
mm
Dipole strip cut-
out: 6 mm
Gap between
electrodes: 6
mm
Electrodes
width: 6 mm
Table 2: Different electrode configurations [29].
26
5.2. Tested features
Tests have been performed some to validate the proposed concept, in particular the
following aspects:
Noise characterization at electronics level;
Phase shift characterization at electronics level;
Reference measurement of conductivity and permittivity;
Characterization of all electrode configurations;
Full characterization of the best electrode configurations;
Environmental testing;
Sensor behavior to the P50 pyrolization;
Calcarb® testing;
Characterization of silver painted electrodes using configuration 4;
The author was responsible for the preparation of test procedures and for testing the
sensor, performing test 1 to 6 and test 12. The data from the other tests were provided
by other members of the team and can be found in project final report [29]. The
information about the other tests are present in this work because are important to
understand some theoretical approaches. Particularly, pyrolysis test.
Some different tests have been performed to validate the proof of concept:
5.2.1. Test 1: Electronic noise characterization
This test intended to characterize the noise resultant from the signal conditioning board
and the acquisition unit. The electrodes were replaced by well-known voltage dividers
in order to minimize the effect of the electromagnetic field. With this test is possible to
access the fluctuations of the system, namely if the amplitude and phase of the
electrodes. The pass criterion was to achieve an error less than 0.1% at every applied

27
frequency. The system passed this test in most of all the frequencies, and was concluded
that the electronics have a stable and accurate amplitude response (~0.07%).
5.2.2. Test 2: Phase shift characterization at electronics level
This test intended to characterize the phase shift introduced by the acquisition unit and
the signal conditioning board. This kind of test is very important to ensure the accuracy
of the measurements across the different materials. This was done by measuring its
accuracy for various capacitances and the conclusion was that the precision of the
sensor is the same for different materials. In terms of magnitude, the requirements have
been met for every considered frequency. It was seen that as the frequency rises, the
phase shift error decreases and it shows that phase measurements are less accurate than
amplitude measurements.
5.2.3. Test 3: Measurements in Reference Materials
These measurements constitute a preliminary calibration of the TPIP system, using
various materials with known dielectric properties (See Table 3). From this test on, the
electrodes were connected to the respective Rx inputs and Tx outputs. To access the
impact of the cables on the measurements, the test was made using two different cable
lengths. When the size is bigger the attenuation rises, reducing the system sensitivity,
because of cable capacitance.
Material Permittivity [1] Conductivity [S m1
]
PTFE 2.1 5 x 10¹³
Polyamide/nylon 3.5 1012
ISOVAL 5.5 1012
– 1010
Table 3: Dielectric properties of tested materials.
It can be concluded that the main goal of the test, which is measuring the amplitude and
phase shift errors, was successfully archived because the results were similar for each
tested material (polyamide, PTFE and ISOVAL®). The results are shown in Table 4. It
was also acquired data measuring data of air to calibrate the sensor.

28
Material Amplitude [dB] Phase [º]
PTFE Average -23.2186 352.7957
Standard
deviation
0.0064 0.0180
Polyamide/nylon Average -13.9802 352.7738
Standard
deviation
0.0040 0.0173
ISOVAL Average -20.0252 355.3460
Standard
deviation
0.0035 0.0294
Air Average -24.6071 350.3421
Standard
deviation
0.0032 0.0279
Table 4: Calibration of TPIP sensor. Data acquired at the frequency of 1 kHz and using cables of 38 cm of
length.
5.2.4. Test 4: Characterization of All Electrode Configurations
This test case was intended to select the most suitable configuration for thickness
measurements, regarding in particular the shape and size of all 10 electrode
configurations (linear and circular architectures), previously selected (See Table 2).
Additionally these measurements can be used to validate the finite element results. For
this test we made various measurements of the amplitude and phase for P50 thickness in
the range from 5 to 20 mm, calculating the mean value and standard deviation of the
measured signal. The test assembly is shown in Figure 14. From this test on, the
electrodes are attached to the P50 samples by means of epoxy glue that possesses good
dielectric properties.

29
Air or Ground
FR4 1 2 3 4
Electrode
Shield pad
P50
20 m
m
P50
P50
5 m
m
P50
Figure 14: Characterization of all 10 different electrode configurations measuring P50 samples. FR4 is an
epoxy based composite present on printed circuit boards (PCB) and is where the electrodes are integrated.
Larger variation in amplitude or phase with thickness means higher sensitivity.
However it is necessary to verify if the error bar is acceptable. This means a choice is
made based upon the slope of the curve and associated errors. Monotony is just
considered as tiebreaker. Plots in Figure 15, Figure 19, Figure 17, Figure 18 and Figure
19 show the three best results of the amplitude and phase for each frequency among the
10 configurations. From top to bottom, the considered frequencies are: 10 and 200 Hz
as well as 1, 10, and 100 kHz. For the sake of visualization, all the data is normalized
against the values for a thickness of 5 mm.

30
Figure 15: Mean and standard deviation of the amplitude and phase as a function of thickness at 10 Hz [29].

31
Figure 16: Mean and standard deviation of the amplitude and phase as a function of thickness at 200 Hz [29].

32
Figure 17: Mean and standard deviation of the amplitude and phase as a function of thickness at 1kHz [29].

33
Figure 18: Mean and standard deviation of the amplitude and phase as a function of thickness at 10 kHz [29].

34
Figure 19: Mean and standard deviation of the amplitude and phase as a function of thickness at 100 kHz [29].

35
Table 5 shows how often each configuration appears among the best three
configurations for each different injected frequency. The configurations that not appear
among the best three are not present in the table.
Configuration xi
C1 6
C2 1
C3 4
C4 10
C8 1
C10 8 Table 5: Number of time a configuration appears among the best configurations for each frequency.
In order to support the decision of what configurations are best, a trade-off was made.
The most relevant results include:
The best square configuration is C4 because it is the one that has the highest
variation over the P50 thickness range;
The best circular configuration is C10, for the same reason mentioned above;
Configuration C1 has been selected because it could be interesting to measure
thin layers since is a small size electrode configuration, with a short spacing
among them.
5.2.5. Test 5: Full Characterization of the Best Electrode Configurations
This test is a repetition of test case 4 but just for the best configurations, made with
smaller thickness steps in order to calculate the expected accuracy of the measurements,
namely the mean and standard deviation. The results from this are also useful to validate
the numerical model used in the simulations.
It was possible to conclude that the most suitable configurations are configuration 1
(small electrodes) for thin layers, and configuration 4 (large electrodes) is more accurate
for layers of at least 20 mm. By the increment of smaller thickness steps it was possible
to access that the homogeneity of the medium has a reasonable influence on the
measurements of the sensor, in other words, it is different to measure five sheets of cork
of 1 mm thick or measure a layer composed by just one sheet of 5 mm.

36
5.2.6. Test 6: Environmental Tests – DC electric field
The goal of this test case was to access the influence of an external DC electric field on
the TPIP measurements. A known electric field is applied when the thickness
measurements are performed. These results are then compared with similar
measurements without DC field. For this purpose, two aluminium sheets separated by
100 mm were mounted in the proximity of the TPIP sensor. The bottom layer was
grounded, and that on top was biased to 50 V, creating an electric field of 500 V m 1 ,
as represented in Figure 20.
P50
100 m
m
GND
50 V
ElectrodeE = 500 V/m
Figure 20: Electric field representation.
To verify the influence of an electric field on the TPIP measurements, a test with the
duration of approximately 270 seconds is performed, divided in two stages (without and
with an electric field, respectively). The results for 1, 5 and 10 kHz are plotted in Figure
21.

37
Figure 21: influence of DC electric field on TPIP measurements. The vertical dashed line identifies when the
electric field is turned on [29].
As the variations with a 500 V m 1 field are minor, the direct effect of electric fields can
be disregarded for most space applications.
5.2.7. Test 7: Environmental Tests – DC magnetic field
The goal of this test case was to assess the influence of an external static magnetic field
on the TPIP measurements. For this test we performed some measurements of the
amplitude and phase with and without a known magnetic field produced by permanent
magnets, and compare the results.

38
P50
FR4 1 2 3 4
Shield pad5 m
m
50
mm
Permanent magnets
Figure 22: Magnetic field test assembly.
For the assembly shown on Figure 22, the magnetic field in vicinity of the electrodes is
of the order of 10 mT. In order to verify the influence of a DC magnetic field on the
TPIP measurements, a test with the duration of approximately 320 seconds was
performed, divided in two stages (with and without a magnetic field). This test was
similar to that for DC electric field. The results for frequencies of 1, 5 and 10 kHz and a
distance from the magnets to TPIP of 5 cm are plotted in Figure 23.
Figure 23: Influence of a DC magnetic field on TPIP measurements [29].

39
The influence of a DC magnetic field is not negligible for amplitude and phase
measurements, as one can see an offset when the field is imposed. Moreover, the
amplitude is more susceptible to the field than the phase, since a variation can be
perceived farther from the electrodes. It was possible to observe that when the distance
is reduced, the medium is more affected by the field, but at 5 cm distance we can only
see the offset in the amplitude measurements.
The magnetic field has limited impact on this type of sensor. In fact, the value of the
magnetic field on the Earth surface is about 50 μT while the applied field is
approximately 10 mT. The field applied to the sensor is much stronger than what is
expected to be found in space applications.
5.2.8. Test 8: Environmental Tests – equipotential surface
The goal of this test was to assess the influence of the plasma on the TPIP
measurements. Plasma electrical properties are approximated by an equipotential
surface made up of an aluminium sheet on the P50 layer. Again, the results obtained
were compared with and without AC sheet. The test assembly is shown in Figure 24.
P50
FR4 1 2 3 4
Electrode
Shield pad
5 m
m
Aluminium
Figure 24: Equipotential test setup.
In theory, when an equipotential surface is placed over a layer of P50, the field lines are
forced to redistribute themselves, so that the field satisfies the boundary conditions

40
given by the equipotential surface and the transmitting electrodes, affecting the way the
field lines cross the receivers, leading to a reduction in the sensitivity of the sensor (see
Figure 25).
Figure 25: Electric field distribution with (bottom) and without (top) an equipotential surface [28].
As the equipotential surface moves away from the electrodes, it is expected that the
electric field effect weakens. Figure 26 plots the amplitude and phase as a function of
thickness for a normal layer of P50 compared to a layer of P50 with an equipotential
surface above it.

41
Figure 26: Amplitude and phase as function of thickness with and without equipotential surface [29].
The results confirm the behavior that was theoretically expected. It is possible to note
the jumps resulting from the non-homogeneity of the medium (P50 cork). From
observation of the plots of Figure 26, one can also see that the variation in amplitude
and phase is not negligible when the layer is subjected to an equipotential surface.
Therefore, the effect of creating plasma on the thermal protection system must be taken
into account in the development and utilization of the sensor.
5.2.9. Test 9: Environmental Tests – thermal testing
The goal of this test case was to assess the influence of environment temperature on
TPIP measurements. This test consists in performing some thickness measurements
inside a thermal chamber, at different temperatures, and comparing the results with a
similar test under normal conditions. Figure 27 shows the thermal chamber used in this
test.

42
Figure 27: Thermal chamber test [29].
The cables held up a maximum temperature of 125ºC, at which point the test was
stopped. Figure 28 plots the amplitude and phase for all intervals from 50ºC to 125ºC.
Figure 28: Influence of temperature on amplitude and phase measurements. Results for a P50 sheet of 5 mm
thick [29].
As expected, the measurements vary with temperature. This variation can be related to
polarization, i.e., the dielectric properties of the medium, the electrodes and cabling.
A comparison between measurements made with these materials provides useful
insights to understand the significance of the thermal and electrical conductivities.

43
Corroborating our predictions from theoretical models, a large increase in electrical
conductivity reduces sensor sensitivity. Therefore, the Rx gain must be increased to
allow for sensitivity maximization to the expense of sensor noise increase. Evaluation of
the impact of temperature in the Rx signal is thus necessary to obtain a reliable
calibration of the sensor. In addition, these results are also important to rank effects of
temperature in the electronics, cabling, and in the medium. To decouple the effects of
temperature in the medium and the sensor, the electrodes and the thermal protection
system must be separated by a material that possesses low thermal conductivity, low
permittivity, and low electrical conductivity. If the TPS temperature indeed introduces a
major perturbation in measurements, then careful data analysis is require to assess
impact of heat in sensor performance.
5.2.10. Test 10: Test of sensor behavior of P50 pyrolization
This test case intended to evaluate how TPIP performs whenever the TPS is composed
by intact and charred materials. In this test the pyrolization was achieved by means of a
blowtorch. Figure 29 shows the pyrolization test assembly.
Figure 29: P50 burning [1].
In Figure 30 it is possible to identify 4 stages occurring in this test:
1. The acquisition has started but the torch is still not ignited and the amplitude remains
constant;

44
2. The torch started to burn the P50 plate and the amplitude starts decreasing. This is the
effect of both the equipotential surface in the plate and overall, the amplitude decreases
almost 15 dB. The effect of the thickness decrease can be also responsible for the
amplitude variation;
3. The torch continues to burn the P50 plate and the amplitude increases. This phase
comprises the effect of the temperature increase (a variation of 40 dB is noticed);
4. The torch continues to burn the P50 plate and the amplitude saturates. At which point
the test is stopped.
It is important to keep in mind that phase behaviour is quite different for different
electrode configurations, in this case it was used the configuration 1.
Figure 30: Influence of heat and pyrolization on TPIP measurements. P50 with thickness of 10 mm [29].
We conclude that the sensitivity of the TPIP is good enough to clearly identify the
different stages that occur during the burning, as intended.

45
5.2.11. Test 11: Calcarb® Testing
This test case intended to characterize the TPIP measurement response of a material that
allegedly is included in TPS composites.
Figure 31: Testing TPIP response to thickness increase with Calcarb® layers. Note that the sensor is attached
to a P50 plate with 5 mm thick [1].
Two types of tests were considered: The first was a test to evaluate the sensor response
to thickness variations, as discussed in 5.2.5 (test 5) using P50 layers, see test assembly
on Figure 31; the second experiment describes Calcarb® pyrolization, similar to 5.2.10
(test 10).
From the left hand side of Figure 32, we can see that the amplitude measurements
provide a resolution better than 0.7 mm for a 45 mm thick Calcarb® plate which is a
very promising result for a material with such high electrical conductivity. Because of
the high conductivity of the medium, phase measurements are much less relevant.

46
Figure 32: Amplitude and phase as a function of thickness at frequency of 1 kHz [29].
Figure 33: Calcarb burning [1].
As for the P50 pyrolization test, it is important to analyze the main variables driving the
variation of the amplitude and phase shift: plate thickness, temperature and plasma. We
can see in Figure 34 the progress of the amplitude and phase during this experiment.

47
Figure 34: Influence of heat and pyrolization on TPIP measurements - Calcarb® with thickness of 18 mm [29].
It is possible to identify 7 main stages in this test (the first 4 are similar to those in P50
pyrolysis test that have been performed previously):
1. The acquisition has started but the torch is not ignited, thus the amplitude is constant
(It starts at approximately -40 dB instead of -15 dB because the environment is now
different);
2. The torch started to burn the P50 plate and the amplitude decreases. This phase
primarily comprises the effect of the equipotential surface in the plate since the
amplitude decreases almost 15 dB. The effect of thickness decrease can be also
responsible for the amplitude decrease;
3. The torch continues to burn the P50 plate and the amplitude increases sharply. This
phase comprises the effect of the temperature increase since a variation of 50 dB is
noticed; this increase is sharp because the thermal conductivity of the plates is orders of
magnitude higher than that of P50;
4. The torch continues to burn the P50 plate and the amplitude saturates. At this point
the torch is stopped;
5. The temperature of the layer decreases and the amplitude also decreases;

48
6. A peak in the amplitude and phase signals is perceived. This peak is apparently not
related to the processes discussed previously and we do not understand its origin;
7. The signals stabilize on the initial values when the initial temperature is reached.
The electrical and thermal conductivity of Calcarb® is very high when comparing to
cork, a P50 of 5 mm thick plate was introduced. The sensor was attached to one side of
P50 layer and pyrolization occurred above the Calcarb® plate. Figure 35 plots the
response for this test.
Figure 35: Influence of heat and pyrolization on TPIP measurements. P50 - 5 mm and Calcarb® - 18 mm [29].
Since cork is a worse thermal conductor than Calcarb®, it is possible to see a similar
response to the previous test, with the effect of temperature on the electrodes spreading
over a wider period. However, the test is stopped in stage 4, when the amplitude
saturates.
49
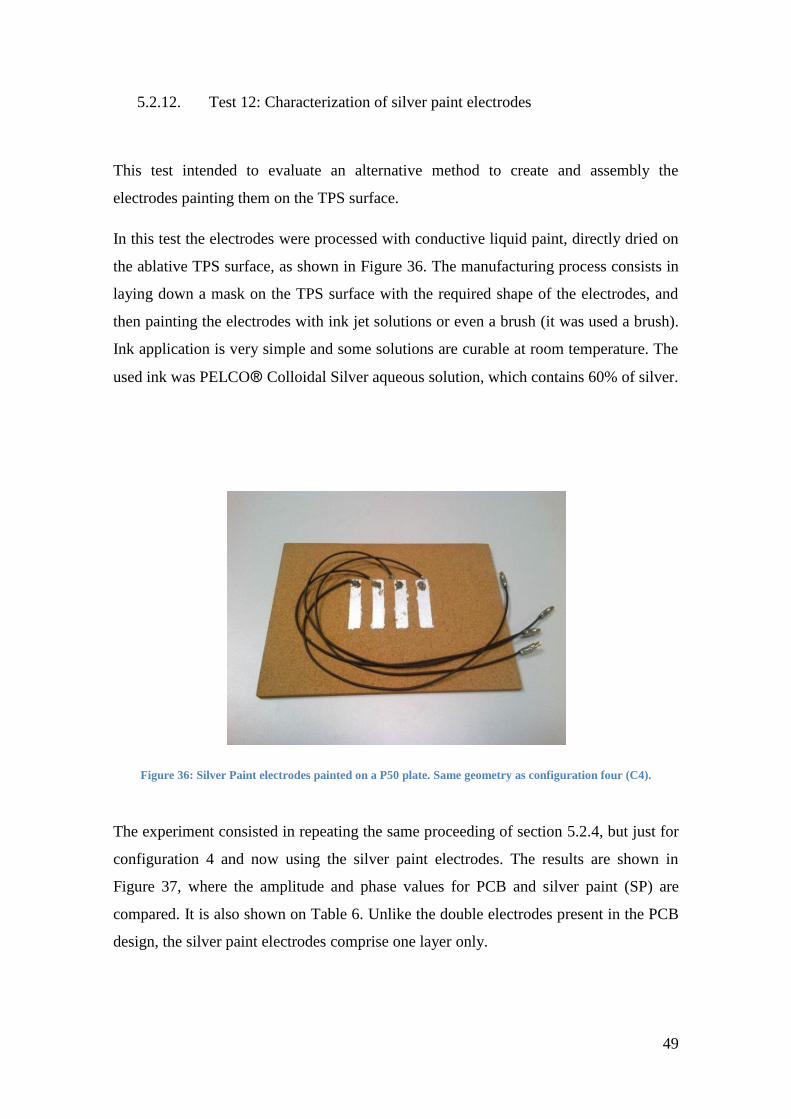
5.2.12. Test 12: Characterization of silver paint electrodes
This test intended to evaluate an alternative method to create and assembly the
electrodes painting them on the TPS surface.
In this test the electrodes were processed with conductive liquid paint, directly dried on
the ablative TPS surface, as shown in Figure 36. The manufacturing process consists in
laying down a mask on the TPS surface with the required shape of the electrodes, and
then painting the electrodes with ink jet solutions or even a brush (it was used a brush).
Ink application is very simple and some solutions are curable at room temperature. The
used ink was PELCO® Colloidal Silver aqueous solution, which contains 60% of silver.
Figure 36: Silver Paint electrodes painted on a P50 plate. Same geometry as configuration four (C4).
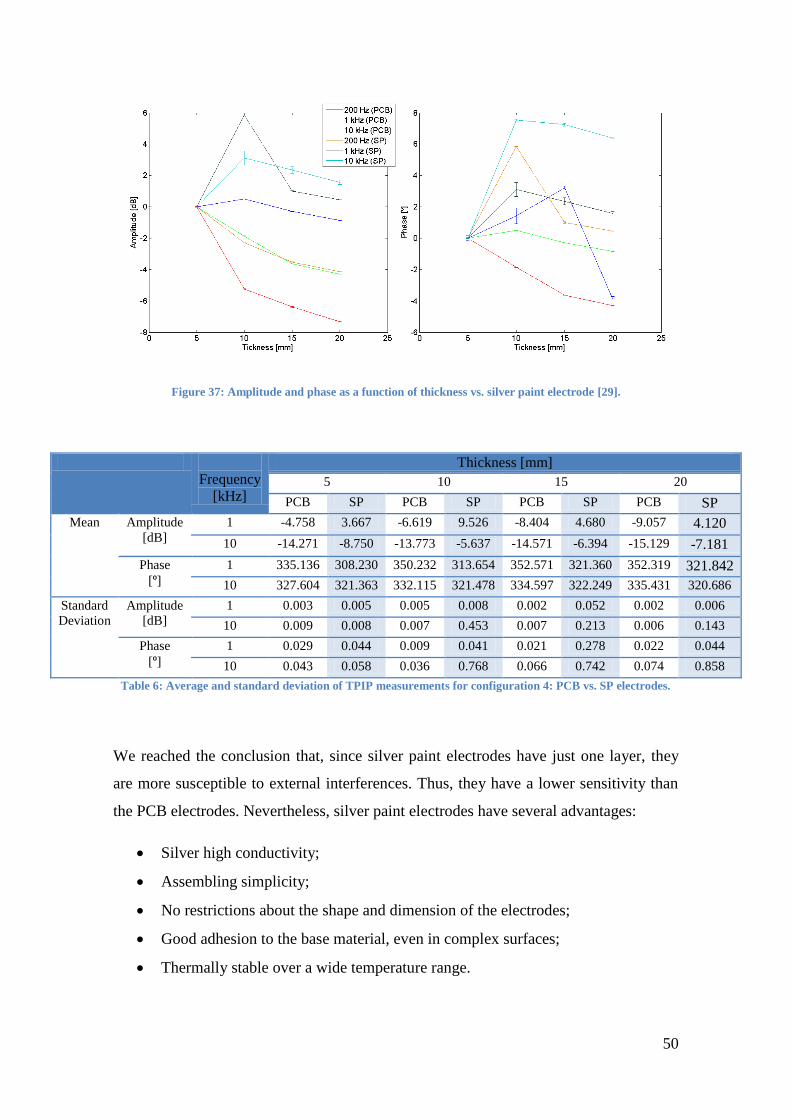
The experiment consisted in repeating the same proceeding of section 5.2.4, but just for
configuration 4 and now using the silver paint electrodes. The results are shown in
Figure 37, where the amplitude and phase values for PCB and silver paint (SP) are
compared. It is also shown on Table 6. Unlike the double electrodes present in the PCB
design, the silver paint electrodes comprise one layer only.
50
Figure 37: Amplitude and phase as a function of thickness vs. silver paint electrode [29].
Frequency
[kHz]
Thickness [mm]
5 10 15 20
PCB SP PCB SP PCB SP PCB SP
Mean Amplitude
[dB]
1 -4.758 3.667 -6.619 9.526 -8.404 4.680 -9.057 4.120
10 -14.271 -8.750 -13.773 -5.637 -14.571 -6.394 -15.129 -7.181
Phase
[º] 1 335.136 308.230 350.232 313.654 352.571 321.360 352.319 321.842
10 327.604 321.363 332.115 321.478 334.597 322.249 335.431 320.686
Standard
Deviation
Amplitude
[dB]
1 0.003 0.005 0.005 0.008 0.002 0.052 0.002 0.006
10 0.009 0.008 0.007 0.453 0.007 0.213 0.006 0.143
Phase
[º] 1 0.029 0.044 0.009 0.041 0.021 0.278 0.022 0.044
10 0.043 0.058 0.036 0.768 0.066 0.742 0.074 0.858
Table 6: Average and standard deviation of TPIP measurements for configuration 4: PCB vs. SP electrodes.
We reached the conclusion that, since silver paint electrodes have just one layer, they
are more susceptible to external interferences. Thus, they have a lower sensitivity than
the PCB electrodes. Nevertheless, silver paint electrodes have several advantages:
Silver high conductivity;
Assembling simplicity;
No restrictions about the shape and dimension of the electrodes;
Good adhesion to the base material, even in complex surfaces;
Thermally stable over a wide temperature range.

51
6. Conclusions
This thesis examined the concept of using a non-intrusive sensor to measure ablation
during atmospheric entry or re-entry using a mutual impedance technique. Such kind of
sensor could have numerous applications, not only in the space domain. The work was
performed on Active Space Technologies, Coimbra and the client was ESA.
6.1. Thesis Contribution
This innovative electric sensor can offer real time measurements of TPS thickness
during ablation using a low-cost and non-intrusive technique. The data acquired with
the sensor can provide inputs for TPS design optimization and mass reduction.
Therefore, the sensor can reduce the cost and risk to spaceflight. It is crucial to study
and develop a sensor to measure ablative processes in real-time during atmospheric
entry and re-entry in view of developing new materials and optimize cost effective
techniques.
The prototype fulfilled the initial requirements: low mass, low power, non-
intrusiveness, good integration, and good thickness accuracy as described more in detail
in Annex 3.
Ch
apte
r
6

52
6.2. Looking Forward
This electric sensor can provide relevant technological advancements in TPS
optimization both for Mars Sample Return missions and for Asteroid Sample Return
missions. Furthermore this technology fits the strategic harmonization roadmaps of ESA
and NASA.
A mutual impedance probe operated on a vehicle can be used to create maps of surface
ice abundance which would be a valuable tool for the selection of sampling locations for
the search of evidence of life in planetary missions.
6.3. Future Work
From an application point of view, the TPIP sensor can be used in entry and re-entry
vehicles, in launchers, and eventually in plasma physics in the future. We can see
relevant capabilities to study aerothermodynamics and magnetohydrodynamics, but still
require significant modeling effort. To study the influence of the plasma on the
measurements the sensor must be tested on a reliable testing environment, e.g. Arc jet
facility.
Monitoring of heat shield performance is important to investigate aerothermodynamic
processes and the interaction between the ablating material and the surrounding plasma.
A computational simulation of an atmospheric re-entry would be very interesting to
compare with sensor recession thickness measurements.
6.4. Final Thoughts
Silver paint electrodes offer a very simple integration solution. The application is very
simple and ensures several advantages, but this solution is more susceptible to noise,
leading to a decrease of resolution and sensor efficiency. Future investigation should be
conducted to solve this weakness.
From tests in an oven up to 125ºC as well as burning and pyrolysis of different media
with a blowtorch, it is clear that temperature affects the performance of the electric

53
sensor. However, it is not obvious which mechanism prevails. Three main sources have
been identified: i) modification of medium polarization due to temperature; ii) heating
of the electrodes and cables by conduction and convention due to the blowtorch; iii)
impact of environmental conditions in the analogue electronics. It was detected a small
trend when P50 measurements as a function of thickness have been taken at standard
conditions of pressure, temperature, and humidity. These tiny observed variations are
due to fluctuations in room temperature (impact on stability of the analogue module) or
humidity (effect in the conductivity of the P50 layers). Although producing a small
impact in sensor sensitivity, it is likely that resolution can be increased when the source
of this variation is identified and corrected.
The presence of plasma on the surface of the medium changes the amplitude and phase
measured by the sensor. Even under extreme conditions of induced DC electric and
magnetic fields (E~500 V m 1 and B~10 mT), small variations could be seen in the
amplitude and phase of the signal of the sensor. However, in real space applications it is
not expected to find conditions as severe as those tested (e.g. On Earth surface we found
E~100 V m 1 and B~50 μT and in the ionosphere and magnetosphere is several orders
of magnitude lower). Nonetheless, the situation may be different with AC fields and
complementary studies are necessary. In general, amplitude measurements are more
accurate than phase measurements. Sensor sensitivity is affected by the length of the
cables and is driven by the size of the electrodes. The measurement accuracy archived is
better than 0.5 mm for a P50 shield thickness up to 50 mm, as shown in Figure 38.
Figure 38: MI signal at 1 kHz as function of P50 thickness [2].

54
Annexes
A1. P50 data sheet
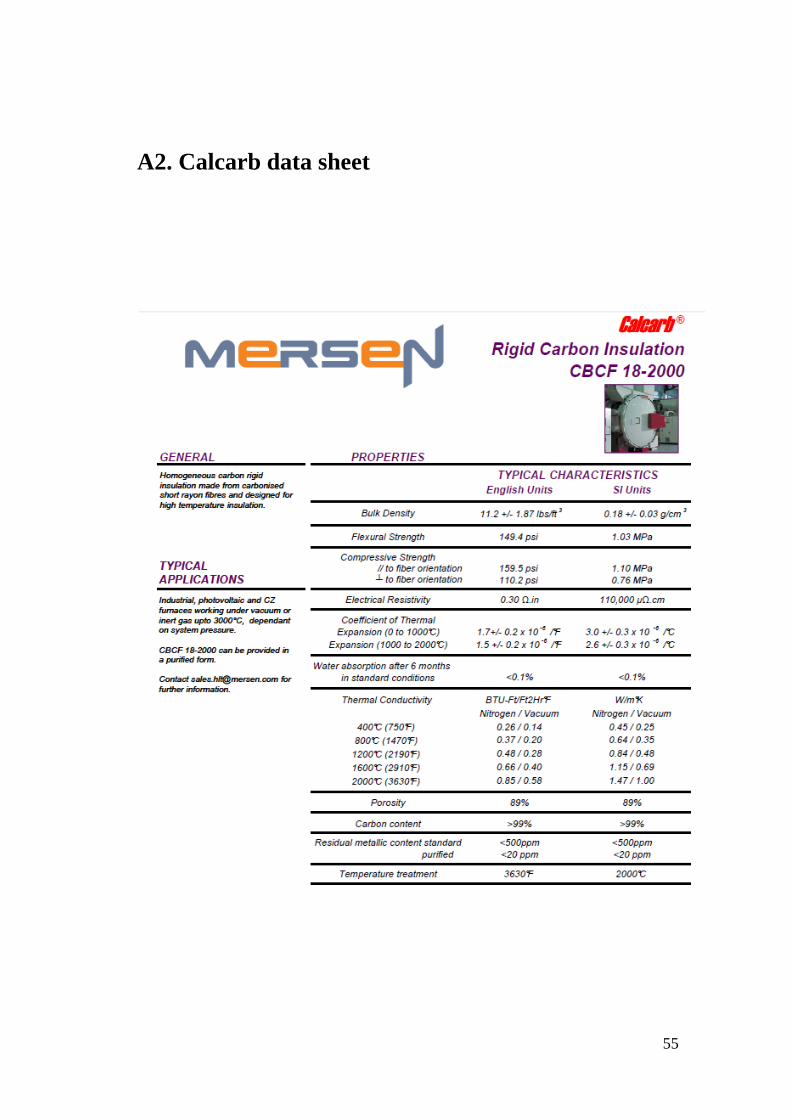
55
A2. Calcarb data sheet

56
A3. System Requirements
# Description
1 The system shall measure the surface recession of the TPS unit employing the
MI technique.
2 The proof of concept and preliminary prototype shall test various stimuli profiles
in the relevant media.
3 TPIP shall reach TRL 4 “Concept and/or breadboard validation in laboratory
environment” Table 7: Functional Requirements.
# Description
1 To improve sensor accuracy of various TPS thicknesses and surface profiles,
sensor shape optimization analyses shall be carried out, supported by an iterative
methodology based in numerical modeling, followed by sensor prototyping and
testing
2 The accuracy of the TPS thickness measurement shall not exceed 0.5 mm.
3 The range of measurements can be optimized in accordance with costumer needs,
by means of controlling the distance between the electrodes.
4 The TPIP sensitivity is mostly constrained by the excitation frequency. For
reliable and accurate measurements, the ADC sampling rate of the Rx electrodes
should be about 100 times higher than the working frequency. Table 8: Performance Requirements.
# Description
1 Concept validation shall test the TPS unit emulating ablation conditions, namely
i) high temperatures, ii) electrical fields, iii) magnetic fields, and iv) electrical
conducting surface.
2 The sensor shall be able to operate in the range from -50 to + 50 ºC.
3 The sensor shall be compatible with the range from -100 to +200 ºC.
4 The total required power shall not exceed 0.5 W. Table 9: Environmental and Operational Requirements.
# Description
1 The total mass of the electrodes, cables, and analogue unit shall not exceed 0.1
kg.
2 The area occupied by the electrodes depends on the selected arrangement, but
shall not exceed 10 cm2
, with a thickness lower than 3 mm. Table 10: Physical Requirements.
# Description
1 The TPIP architecture shall be flexible enough to allow multiplexing capabilities
if necessary, e.g., multiple sensors sharing signal conditioning and processing.
2 The electrodes shall be attached to the TPS rear end using non-intrusive
solutions. Table 11: Design Requirements and Implementation Constraints.

57

58
References
[1] TPIP Summary Report, SER-TPP-ES-001, Active Space Technologies, 2013.
[2] F. Simões, A. Mendes, I. Ribeiro, T. Marques, J. Varandas. Method and system for
monitoring ablation processes in thermal protection systems. PT 107152N (pending),
2013.
[3] B. Laub, E. Venkatapatly. Thermal Protection System Technology and facility needs
for demanding future Planetary Missions. IPPW1 – Lisbon, 2003.
[4] J.C. Paulat and P. Boukhobza. Re-entry Flight Experiments Lessons Learned - The
Atmospheric Reentry Demonstrator ARD. RTO-EN-AVT-130, EADS – SPACE
Transportation, 2007.
[5] M. Giardino, E. Campagnoli, L. Andrioli, M. Bertone and G. Pippia. Analysis
Advances in AblaTan Ablative Tool development with application to system model
analysis. 26th European Space Thermal Analysis Workshop - ESTEC, Appendix D,
2012.
[6] F. S. Milos., R. A. Brewer, R. A., Y.-K. Chen, T. H. Squire. Analysis of Galileo
Probe Heatshield Ablation and Temperature Data. Journal of Spacecraft and Rockets,
vol. 36, issue 3, pp. 298-306, 1999.
[7] J.-M. Bouilly. Thermal Protection System of the HUYGENS Probe for Titan Entry:
Qualification, Flight Preparation, and Lessons Learnt. Proceedings form International
Planetary Probe Workshop, Greece, July 2005.
[8] H. Ritter, O. Bayle, Y. Mignot, E. Boulier, P. Portela, J-M. Bouilly, R. Sharda.
Ongoing European Developments on Entry Heatshields and TPS Materials. 8th
International Planetary Probe Workshop, June 2011.
[9] Lin, W.-S., Steady Ablation on the Surface of a Two-Layer Composite.
International Journal of Heat and Mass Transfer, Vol. 48, Nos. 25-26, 2005.
[10] F. S. Milos and D. J. Rasky. Review of numerical procedures for computational
surface thermochemistry. Journal of Thermophysics and Heat Transfer, 1994.
[11] D. Bianchi, F. Nasuti, R. Paciorri, M. Onofri. Computational Analysis of
Hypersonic Flows Including Finite Rate Ablation Thermochemistry. 7th European
Workshop on Thermal Protection Systems and Hot Structures, ESA-ESTEC,
Noordwijk, The Netherlands, 2012.

59
[12] D. Bianchi. Modeling of ablation phenomena in space applications. 2007. PhD
Thesis, Dept. of Mechanics and Aeronautics, Univ. of Rome “La Sapienza”, Rome,
Italy.
[13] B. Laub, E. Venkatapatly. Current Developments in Future Planetary Probe
Sensors for TPS. IPPW1 – Lisbon, 2003.
[14] F. S. Milos., R. A. Brewer, R. A., Y.-K. Chen, T. H. Squire. Analysis of Galileo
Probe Heatshield Ablation and Temperature Data. Journal of Spacecraft and Rockets,
vol. 36, issue 3, pp. 298-306, 1999.
[15] Cassanto, J.M., et. Al. A Simple Recession Gage for In Flight Measurement of the
Char Degradation Zone for Re-entry Vehicle Heatshields. ISA Sympo-sium, 1980.
[16] Impedance Measurement Handbook (2nd Edition), Agilent Technologies Co. Ltd.,
2003.
[17] Impedance Measurement Handbook: A guide to measurement technology and
techniques, Agilent Technologies, ref. 5950-3000, July 2006.
[18] E. Barsoukov, J. Macdonald. Impedance Spectroscopy: Theory, Experiment, and
Applications. John Wiley & Sons, 2005.
[19] F. Simões., Résonances des cavités ionosphériques des planètes et de leurs
satellites: progrès et perspectives instrumentales. 2007. PhD Thesis, Univ. Pierre et
Marie Curie, France.
[20] M. Hamelin et al. Conductivity and Electron Density Profiles of the Atmosphere of
Titan from the Huygens PWA-HASI Instrument: Mutual Impedance Probe
Measurements. Planetary and Space Science, 55, 1964-1977, 2007.
[21] R. Grard et al., Electric Properties and Related Physical Characteristics of the
Atmosphere and Surface of Titan. Planetary and Space Science, 54/12, 1124-1136,
2006 .
[22] C. A. WALKER AND V. C. HODGES. Comparing Metal-Ceramic Brazing
Methods. American welding society, 2008.
[23] G. Pinaud, A.J. van Eekelen, and J.-M. Bouilly. Aerofast: Development of Cork
TPS Material and a 3D Comparative Thermal/Ablation Analysis of an Apollo & a
Biconic Sled Shape for an Aerocapture Mission. IPPWC8, June 2011.
[24] A. Amar, N. Calvert, B. Kirk. Development and Verification of the Charring
Ablating Thermal Protection Implicit System Solver. AIAA paper 2011-144, 2011.

60
[25] J. M. Cassanto, C. R. Droms and J. Metzger. A Simple Recession Gage for In-
flight Measurement of the Char Degradation Zone for Re-Entry Vehicle Heat Shields.
26th International Instrumentation Symposium, Seattle, WA, USA, 1980.
[26] T. White, I. Cozmuta, J. Santos, B. Laub. MEDLI Aerothermal Environment
Reconstruction Efforts. 8th
International Planetary Probes Workshop, Portsmouth, VA,
USA, 2011.
[27] D. Empey, E. Martinez. NASA Applications of TPS Instrumentation in Ground
and Flight. IPPW9, 2012.
[28] Fernando Simões, Private Comunication, Active Space Technologies, 2013.
[29] TPIP Final Report, SER-TPP-RP-002, Active Space Technologies, 2013.
[30] A. Ball, J. Garry, R. Lorenz and V. Kerzhanovich. Planetary Landers and Entry
Probes, Cambridge University Press, 2007.
[31] M. C. Lança et al. Electrical properties of cork and derivates. Universidade Nova
de Lisboa, 2011.
[32] Atmospheric Reentry Demonstrator. European Space Agency, BR-128, 1998.
Top Related