


Línguas
Páginas
Legal

UNIVERSIDADE ESTADUAL DE CAMPINAS
Faculdade de Engenharia Civil, Arquitetura e Urbanismo
RODRIGO BARROS CASTRO
CITY LOGISTICS E BOAS PRÁTICAS EM LOGÍSTICA URBANA: O CASO DE SÃO PAULO
CITY LOGISTICS AND URBAN LOGISTICS BEST PRACTICES: CASE OF SÃO PAULO
CAMPINAS
2016

UNIVERSIDADE ESTADUAL DE CAMPINAS
FACULDADE DE ENGENHARIA CIVIL, ARQUITETURA E
URBANISMO
CITY LOGISTICS E BOAS PRÁTICAS EM LOGÍSTICA
URBANA: O CASO DE SÃO PAULO
CITY LOGISTICS AND URBAN LOGISTICS BEST
PRACTICES: CASE OF SÃO PAULO
Rodrigo Barros Castro
Dissertação de Mestrado aprovada pela Banca Examinadora, constituída por:
Prof. Dr. Orlando Fontes Lima Júnior
Presidente e Orientador/Universidade Estadual de Campinas
Prof. Dr. Matthias Winkenbach
Massachusetts Institute of Technology
Prof. Dr. Antônio Galvão Naclério Novaes
Universidade Federal de Santa Catarina
A Ata da defesa com as respectivas assinaturas dos membros encontra-se
no processo de vida acadêmica do aluno.
Campinas, 14 de Dezembro de 2016

RESUMO
A urbanização ocasiona em uma maior demanda por mercadorias, serviços e atividades
logísticas de apoio, atividades que geram impactos significativos nas cidades. O conceito de
city logistics se apresenta como oportunidade para o transporte urbano de cargas. Diversas
boas práticas de logística urbana foram desenvolvidas para mitigar seus impactos associados.
Porém, cidades têm características diferentes, e políticas públicas ou soluções aplicadas em
áreas urbanas distintas só podem resultar em diferentes impactos. Além disso, a melhor escala
para se estudar a logística urbana de cargas é no nível distrital, uma vez que permite o
desenvolvimento de introspecções relativas à características locais das operações, suas
restrições e necessidades.
Neste contexto, esta pesquisa tem como objetivo a melhora na sustentabilidade do transporte
urbano de carga em uma área crítica da cidade de São Paulo, Brasil. A primeira etapa deste
projeto consiste na identificação de clusters urbanos na cidade de acordo com variáveis
relevantes para a logística urbana – concentração de estabelecimentos, população,
regulamentações e densidade e capacidade de vias. Este procedimento permitiu o
conhecimento do contexto de São Paulo com relação ao transporte urbano de cargas, e ainda a
sugestão de políticas públicas gerais que contribuem para a mobilidade na cidade. A segunda
etapa fundamenta-se no estudo aprofundado de uma área de um quilômetro quadrado com o
envolvimento dos atores impactados pelo transporte urbano de carga. A aplicação de um
método multicritério para tomada de decisão permitiu a análise e proposta de uma boa prática
apropriada para o contexto do local.

ABSTRACT
Urbanization is responsible for an increase in demand for goods, services and logistics
support activities. The concept of city logistics presents itself as an opportunity for urban
freight transport. Several urban logistics best practices were developed to mitigate their
associated impacts. However, cities have different characteristics, and public policies applied
in different urban areas can only result in different impacts. Besides, the best scale for
studying urban logistics freight activities is at the district/neighborhood level, since it allows
the development of insights into the specific nuances of daily operations, existing constraints
and needs driving a specific area.
In this context, this research aims to improve the sustainability of the urban freight transport
in a critical area of São Paulo, Brazil. The first step of this project consists on the
identification of clusters in the city according to relevant variables for urban logistics –
establishments’ concentration, population, regulations, road capacity and density. This
procedure allowed obtaining knowledge of São Paulo’s context regarding urban freight
transport, with suggestion of general public policies or best practices that contribute to
mobility in the city, besides the identification of critical areas for urban logistics. The second
step is based on an in-depth study of a critical area of one square kilometer, with the
involvement of the stakeholders affected by the urban freight transport. The application of a
multi criteria decision tool allowed the analysis and proposal of an appropriate best practice.
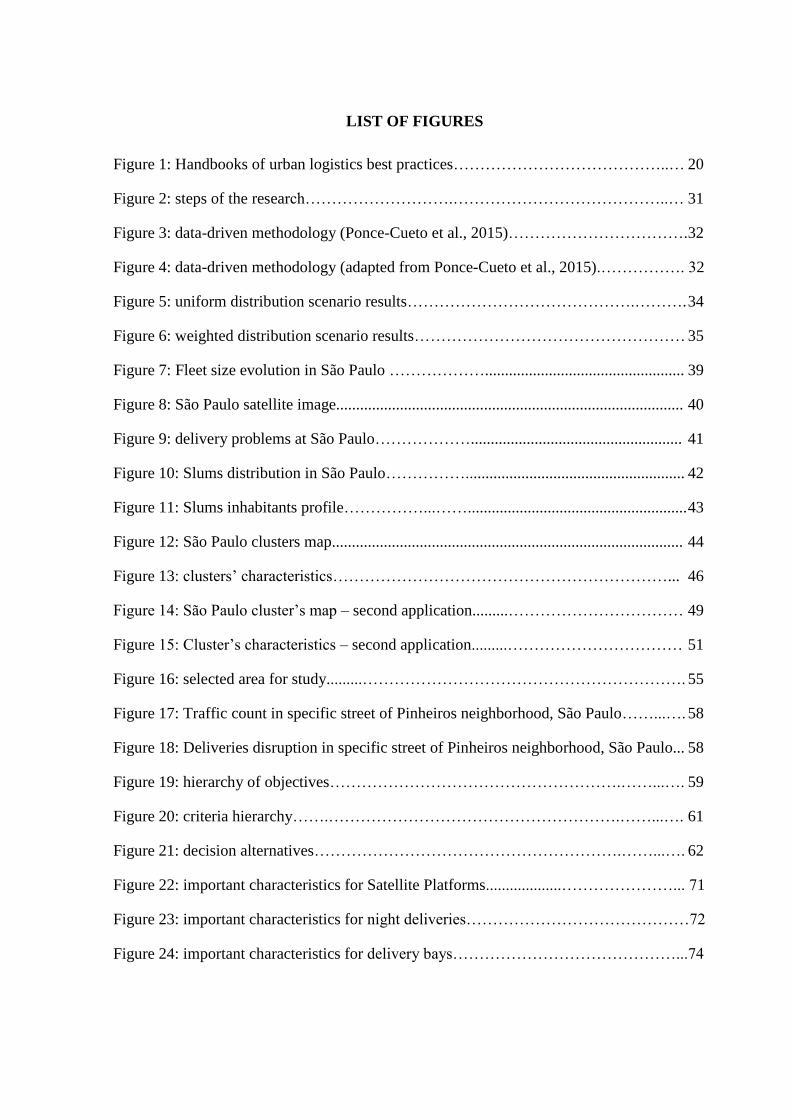
LIST OF FIGURES
Figure 1: Handbooks of urban logistics best practices…………………………………..… 20
Figure 2: steps of the research……………………….…………………………………..… 31
Figure 3: data-driven methodology (Ponce-Cueto et al., 2015)……………………………. 32
Figure 4: data-driven methodology (adapted from Ponce-Cueto et al., 2015).……………. 32
Figure 5: uniform distribution scenario results…………………………………….………. 34
Figure 6: weighted distribution scenario results…………………………………………… 35
Figure 7: Fleet size evolution in São Paulo ……………….................................................. 39
Figure 8: São Paulo satellite image....................................................................................... 40
Figure 9: delivery problems at São Paulo………………..................................................... 41
Figure 10: Slums distribution in São Paulo……………....................................................... 42
Figure 11: Slums inhabitants profile……………...……....................................................... 43
Figure 12: São Paulo clusters map........................................................................................ 44
Figure 13: clusters’ characteristics………………………………………………………... 46
Figure 14: São Paulo cluster’s map – second application.........…………………………… 49
Figure 15: Cluster’s characteristics – second application.........…………………………… 51
Figure 16: selected area for study.........……………………………………………………. 55
Figure 17: Traffic count in specific street of Pinheiros neighborhood, São Paulo……...…. 58
Figure 18: Deliveries disruption in specific street of Pinheiros neighborhood, São Paulo... 58
Figure 19: hierarchy of objectives……………………………………………….……...…. 59
Figure 20: criteria hierarchy…….……………………………………………….……...…. 61
Figure 21: decision alternatives………………………………………………….……...…. 62
Figure 22: important characteristics for Satellite Platforms...................…………………... 71
Figure 23: important characteristics for night deliveries……………………………………72
Figure 24: important characteristics for delivery bays……………………………………...74
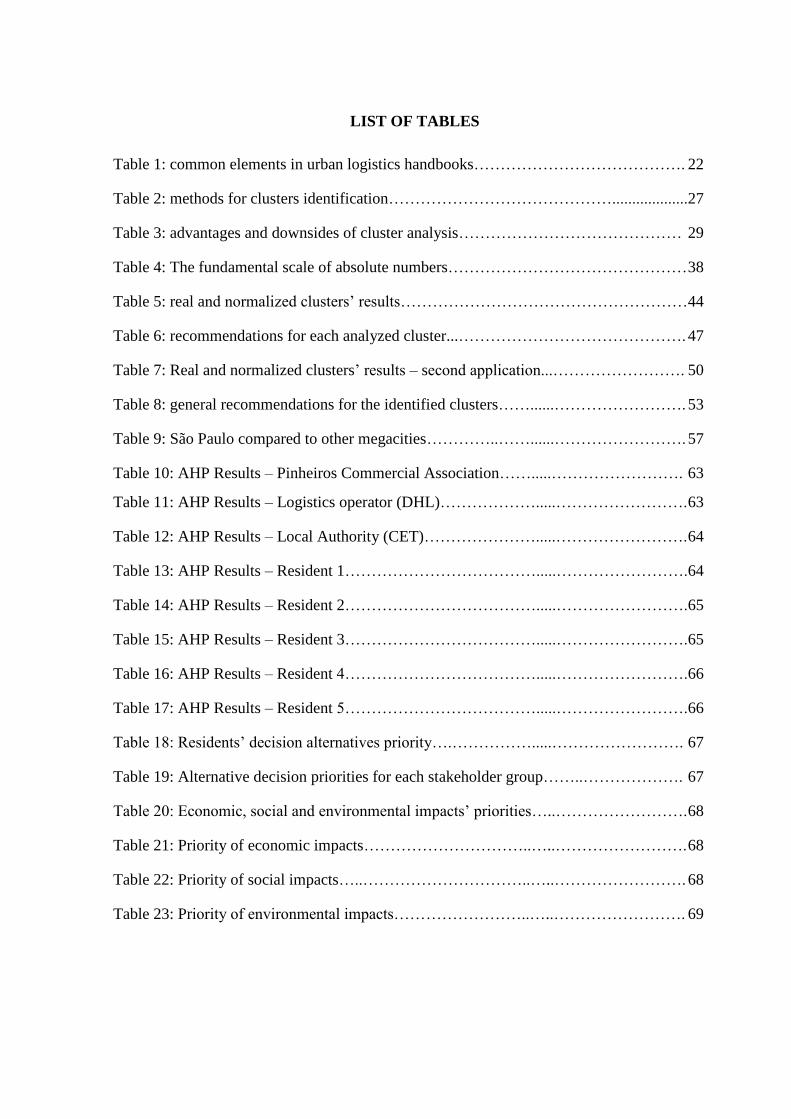
LIST OF TABLES
Table 1: common elements in urban logistics handbooks…………………………………. 22
Table 2: methods for clusters identification……………………………………...................27
Table 3: advantages and downsides of cluster analysis…………………………………… 29
Table 4: The fundamental scale of absolute numbers……………………………………… 38
Table 5: real and normalized clusters’ results………………………………………………44
Table 6: recommendations for each analyzed cluster...……………………………………. 47
Table 7: Real and normalized clusters’ results – second application...……………………. 50
Table 8: general recommendations for the identified clusters……......……………………. 53
Table 9: São Paulo compared to other megacities…………..……......……………………. 57
Table 10: AHP Results – Pinheiros Commercial Association…….....……………………. 63
Table 11: AHP Results – Logistics operator (DHL)……………….....……………………. 63
Table 12: AHP Results – Local Authority (CET)………………….....……………………. 64
Table 13: AHP Results – Resident 1……………………………….....…………………….64
Table 14: AHP Results – Resident 2……………………………….....…………………….65
Table 15: AHP Results – Resident 3……………………………….....…………………….65
Table 16: AHP Results – Resident 4……………………………….....…………………….66
Table 17: AHP Results – Resident 5……………………………….....…………………….66
Table 18: Residents’ decision alternatives priority….…………….....……………………. 67
Table 19: Alternative decision priorities for each stakeholder group……..………………. 67
Table 20: Economic, social and environmental impacts’ priorities…..……………………. 68
Table 21: Priority of economic impacts…………………………..…..……………………. 68
Table 22: Priority of social impacts…..…………………………..…..……………………. 68
Table 23: Priority of environmental impacts……………………..…..……………………. 69

LIST OF ACRONYMS
GDP: Gross Domestic Product
B2B: Business-to-Business
B2C: Business-to-Consumer
ICT: Information and Communication Technologies
ITS: Intelligent Transportation Systems
AHP: Analytic Hierarchy Process
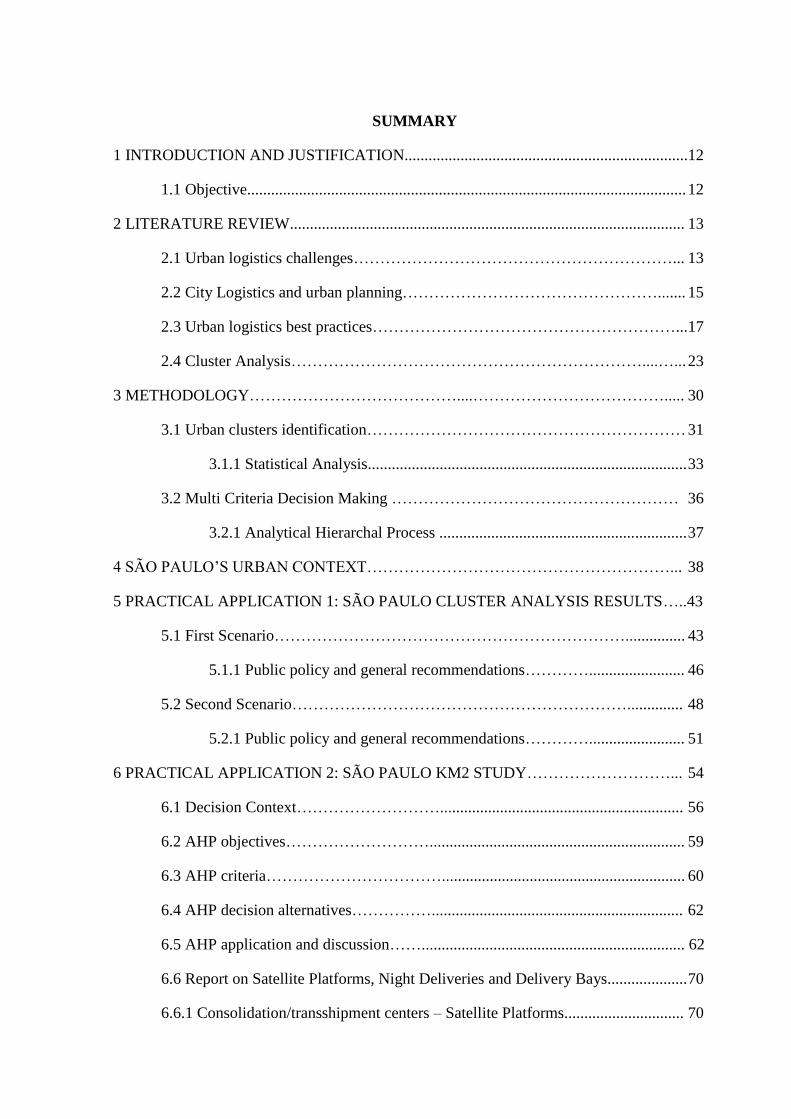
SUMMARY
1 INTRODUCTION AND JUSTIFICATION.......................................................................12
1.1 Objective.............................................................................................................. 12
2 LITERATURE REVIEW................................................................................................... 13
2.1 Urban logistics challenges……………………………………………………... 13
2.2 City Logistics and urban planning…………………………………………....... 15
2.3 Urban logistics best practices…………………………………………………... 17
2.4 Cluster Analysis…………………………………………………………....…... 23
3 METHODOLOGY…………………………………....………………………………..... 30
3.1 Urban clusters identification…………………………………………………… 31
3.1.1 Statistical Analysis................................................................................ 33
3.2 Multi Criteria Decision Making ……………………………………………… 36
3.2.1 Analytical Hierarchal Process .............................................................. 37
4 SÃO PAULO’S URBAN CONTEXT…………………………………………………... 38
5 PRACTICAL APPLICATION 1: SÃO PAULO CLUSTER ANALYSIS RESULTS…..43
5.1 First Scenario…………………………………………………………............... 43
5.1.1 Public policy and general recommendations…………........................ 46
5.2 Second Scenario……………………………………………………….............. 48
5.2.1 Public policy and general recommendations…………........................ 51
6 PRACTICAL APPLICATION 2: SÃO PAULO KM2 STUDY………………………... 54
6.1 Decision Context………………………............................................................. 56
6.2 AHP objectives………………………................................................................ 59
6.3 AHP criteria……………………………............................................................. 60
6.4 AHP decision alternatives……………............................................................... 62
6.5 AHP application and discussion…….................................................................. 62
6.6 Report on Satellite Platforms, Night Deliveries and Delivery Bays.................... 70
6.6.1 Consolidation/transshipment centers – Satellite Platforms.............................. 70

6.6.2 Night Deliveries................................................................................................ 72
6.6.3 Delivery Bays................................................................................................... 73
7 CONCLUSIONS AND FUTURE WORK......................................................................... 74
Bibliographic references…………………………………………………………………… 76

12
1 INTRODUCTION AND JUSTIFICATION
The world is experiencing a transition in its population, migrating from rural areas to cities.
The overall growth of the urban population is 65 million people per year, and half of the
world population already lives in cities, generating over 80% of the world’s GDP (Dobbs et
al., 2011). This urbanization is more pronounced in developing countries where, in 2012, the
urban population accounted for 79% of its inhabitants (Merchán et al., 2015).
Urbanization in developing countries is confirmed by Ibeas et al. (2012), who argues that
urban freight transport has an essential role in the development of cities, especially in
emerging countries. For the population, it ensures the adequate supply of stores, as well as
B2C (Business to Consumer) deliveries. For companies, it is the essential link between
suppliers and clients. Besides, the urban freight transport is a major employer (Crainic, 2004).
When compared to the transport of people in cities, urban freight transport generates
significant social, environmental and economic negative impacts. Congestion affects the
economy of the cities due to the waste of resources and inefficiency they generate. The
emission of pollutants, the use of non-renewable fuel and waste products such as tires and oil
are relevant environmental impacts. As social impacts, the physical consequence of pollutants
emission (diseases), the accidents resulting from traffic, the high noise levels, among others
can be cited (Anderson et al., 2005; Behrends et al., 2008; Mckinnon, 2010). According to
Oliveira et al. (2015), 79% of urban freight transport challenges involve congestion
intensification, 76% of its challenges involve space-time restrictions of cargo vehicles, and
52% involve the lack of interaction between the stakeholders.
In this context, the identification and implementation of best practices that contribute to urban
freight mobility presents as a great opportunity, especially for developing countries such as
Brazil.
1.1 Objective
The objective of this research is to propose a city logistics best practice to a critical area of
São Paulo/SP, in order to improve the sustainability of the urban freight transport. The
research is based in two main applications: cluster analysis of the city, and KM² analysis of a
critical area.
13
Initially, São Paulo was divided into clusters according to urban logistics relevant variables –
population and establishments’ concentration, regulations and road density and capacity. This
procedure had the purpose of analyzing São Paulo’s urban context regarding urban freight
transport, providing insights and suggestions of city logistics best practices and public
policies according to each cluster.
The second step of this research stands for an in-depth study of a one square kilometer area of
a critical cluster, in order to better analyze and develop specific urban logistics solutions for
the zone.
2 LITERATURE REVIEW
2.1 Urban logistics challenges
Urbanization induces a higher demand for goods, services and logistical support activities. A
large number of different types of goods flows through the urban environment, occupying
about a quarter of a typical city traffic. Freight needs loading and unloading zones,
warehouses, wrapping and packaging services, among others activities and logistics spaces,
requiring greater use of urban space. This change of scenario provides opportunities, such as
the increase in productivity through economies of scale (Blanco, 2014; Allen et al., 2008;
Dablanc, 2007).
The significant freight volume that is transported in cities tends to increase. Factors
contributing to this phenomenon include production and distribution practices based in low
inventories and reduced delivery windows, such as Just in Time concept, as well as the
change in the urban metabolism, with the growth of e-commerce and its increased associated
deliveries (Crainic, 2004).
Logistics operators, however, have to work often with inadequate infrastructure, with
congestion and lack of areas for loading and unloading freight - and economies of scale
depend on transportation costs. Besides, vehicles used for freight transport are responsible for
major negative impacts in cities - economic, social and environmental (Blanco, 2014;
Dablanc, 2007).

14
Despite the negative impacts, cities depend on cargo transportation. Urban logistics plays an
essential role in maintaining and retaining industrial and commercial activities, which are
essential for major wealth generating activities, and is a major employer. Efficient urban
freight transport increases the competitiveness of industry, and is critical to sustain the current
life style in cities. Thus, urban logistics creates a conflict between commercial interests and
the urban environment (Crainic, 2004; Dablanc, 2009).
Public authorities are aware of the importance of controlling and organizing urban freight
transport, but most do not know how. In general, public policies regarding freight are scarce
and outdated. The truck traffic is seen as something that should be strictly regulated, whereas
the best solution would be to organize it more efficiently (Crainic, 2004; Dablanc, 2007;
Sanches, 2008).
Part of the complexity of the urban freight transport occurs due to the presence of different
stakeholders with different goals, often conflicting among each other. Taniguchi and
Tamagawa (2005) listed and described the main stakeholders in urban logistics:
Shippers;
Freight Carriers;
Administrator;
Residents;
Urban expressway operators.
Shippers have as main interest the delivery and withdrawal of goods with low cost, meeting
the needs of its customers. Carriers seek to minimize transportation costs and to ensure an
adequate traffic flow. Administrators seek to regulate and minimize the impact of the
relationship between the cargo and the city. Residents desire the availability of a wide variety
of products and still ensure good life quality in the urban environment. Urban expressway
operators present as main objective maintaining profitability, but also need to provide a good
traffic environment (Taniguchi e Tamagawa, 2005).
The productivity of urban freight transport system depends on joint efforts between the
stakeholders involved. The public sector is responsible for the infrastructure, regulation and
15
management, whereas the private sector operates cargo terminals and carries out transport
operations (Lima, 2011). However, both stakeholders await initiatives from each other. Public
authorities expect companies to create new specific logistics services for the emerging needs
of customers and retailers, while the private sector is awaiting initiatives and subsidies from
the public sector (Dablanc, 2007). Still, according to Crainic (2009), it is essential to replace
initiatives that consider deliveries, companies, vehicles and the urban environment separately
by integrated logistics systems.
There is a growing concern regarding urban freight transport, leveraged by its challenging
issues. In this context, City Logistics concept was developed with the purpose of reducing
congestion and increasing mobility; reducing greenhouse gas emissions and noise, improving
the quality of life; and supporting the social and economic development of the city (Crainic,
2004).
2.2 City Logistics and urban planning
City logistics plays an important role in the development of sustainable, efficient, and safe
systems for urban freight transport. The most accepted definition for sustainable development
states it is a development that meets the needs of the present without compromising the needs
of future generations (Anderson et al., 2005).
Taniguchi et al. (2001) defines city logistics as “the process of totally optimizing urban
logistics activities by considering the social, environmental, economic, financial, and energy
impacts of urban freight movement.”
Public managers can assist the process of logistics activities optimization in the cities.
Solutions such as the implementation of freight consolidation centers, accessibility
regulations, and areas of low emissions of polluting gases have been tested and implemented
in cities around the world to achieve the objectives of city logistics: mobility, sustainability
and life quality (Taniguchi et al., 2014).
Three elements are essential to promote city logistics: (1) Application of innovative
technologies - Information and Communication Technologies (ICT) and Intelligent
Transportation Systems (ITS); (2) Change in the mentality of logistics managers; (3) Public-
Private Partnerships (Taniguchi, 2014).
16
The application of technologies such as ICT and ITS in urban freight transport allows the
precise collection of data with low costs. Digital data can be used to optimize the routing and
planning of vehicles dynamically and stochastically. This optimization allows the reduction of
logistics costs, the reduction of greenhouse gas emissions and the reduction of the congestion
caused by freight vehicles. Both private business and society can benefit from the application
of ICT and ITS in terms of efficiency and reduction of negative impacts (Taniguchi and
Shimamoto, 2004).
The mentality change of logistics managers is critical for urban logistics, since these
managers are important actors in the urban cargo transport operations. Taniguchi (2014)
highlights the importance of certifications for the development of sustainable logistics
systems, such as ISO9001 (quality management) and ISO14001 (environmental
management).
Public-private partnerships are essential to urban freight mobility. They allow all actors
involved in the urban freight transport to participate in the development of public policies and
solutions. Information sharing between private companies and the public sector also allows a
better understanding of the distribution of cargo throughout the city and its associated
problems (Browne et al., 2004).
Duin and Quak (2007) classified the three main areas of the city logistics concept as:
Flow improvements, such as consolidation centers, transport reorganization, routing
optimization;
Infrastructure, such as loading and unloading zones;
Public policies.
Several projects were developed to propose best practices in urban logistics and to mitigate
their associated impacts. However, cities have different characteristics, and policy measures
applied in different urban areas can only result in different impacts. Thus, it is essential to
include urban form characteristics and all stakeholders’ opinions to enhance city logistics
planning, and the transferability and sustainability of urban logistics solutions (Alho and
Silva, 2015; Dablanc, 2009; Anderson et al., 2005).

17
There are no global solutions or success formulas for the various problems arising from the
cargo transportation in the urban environment. Any strategy chosen to mitigate these
problems should be developed according to the characteristics of each region. An agreement
should be established between the conflicting objectives of the various actors in the urban
environment that participate in the load distribution process, such as retailers, government,
carriers, among others (Correia et al., 2010;. Crainic et al ., 2009).
In this context, this research presents a literature review on urban logistics best practices.
Then, an overview of Cluster Analysis is presented, research method used for the
segmentation of São Paulo, Brazil, into urban clusters. This procedure allowed analyzing
specific characteristics of the city, basis suggested for the development and implementation of
best practices.
2.3 Urban logistics best practices
Urban logistics best practices are a set of actions with the purpose of minimizing the negative
impacts and maximize the efficiency and effectiveness of logistics operations that take place
in cities. According to Oliveira et al. (2015), 38% of the urban freight transport best practices
involve the implementation of urban consolidation centers, 31% use different vehicles for
cargo deliveries, and 28% adopt ITS and ICT systems for fleet tracking and monitoring.
The main best practices for urban freight transport can be described as (Merchan and Blanco,
2015):
Freight consolidation centers;
Cargo consolidation centers allow companies have economies of scale out of cities, with
transshipment and/or consolidation of freight for urban transport. These spaces also assist
compliance with regulations implemented to reduce the impacts of logistics operations (Allen,
Browne, & Leonardi, 2012).
Loading and unloading zones;
The use of delivery bays for loading/unloading operations are the most cost-effective parking
solutions for freight vehicles in congested areas. They are designed and implemented by
18
public authorities, but similar solutions can be developed by private carriers, such as the use
of shopping centers parking spaces.
Automatic Parcel Terminals;
Automatic Parcel Terminals are urban lockers conveniently located to collect orders, and
stands out as alternative for home delivery. This solution contributes to the assertiveness of
Business to Consumer (B2C) deliveries, eliminating the need for any additional attempts to
complete the delivery. Thus, urban lockers appear as good choice for the e-commerce freight
transport.
Alternative vehicles;
With the growth of public policies that restrict the access of heavy vehicles in the center of
cities, models that optimize the freight distribution may involve the transfer of cargo for small
vehicles such as tricycles and motorcycles. Such vehicles are good alternatives to the Last
Mile Distribution. The use of electric vehicles should also be considered, since they provide
environmental benefits.
Mobile Warehouses;
The use of trucks, serving as mobile warehouses for smaller vehicles, is also a solution to the
Last Mile Distribution, where vehicles can become micro platforms for freight
deconsolidation.
Off-hour Deliveries;
Night delivery is considered an alternative to reduce the flow of heavy vehicles during peak
hours of traffic in cities. For the implementation of this practice, vehicles must be especially
equipped to control noise levels, and retailers must be organized in order to receive the
deliveries during this period. For carriers, the benefits of night delivery are the use of larger
vehicles and less travel times. For the society, there is a reduction of congestion during the
day due to the decrease in the number of vehicles operating in the delivery of freight in the
city center. Commercial establishments guarantee a more organized operation and minor
annoyance to their customers. Moreover, the reduction in travel time contributes in reducing
emissions and energy consumption.
19
GPS Sensors and Data for logistics.
Global Positioning Systems (GPS) support ITS. The demand for these systems is increasing,
and they can be used both to enhance the process of routing vehicles as well as services
provided to customers (estimated time of trucks arrival, for example).
The use of best practices is one of the most common procedures to implement a solution in
urban logistics. However, due to the differences of the cities, there is no standard procedure
for implementing urban freight transport solutions. An important step in this process is to
select solutions that can be implemented, taking into account needs, goals, available resources
and local infrastructure (Iwan e Kijewska, 2014).
Solutions can be implemented according to three main approaches: development of new and
innovative solutions in a co creation procedure - creation; direct copying of an implemented
solution - transfer; and transferring proven solutions while making changes that mainly
depend on the implementation environment – adaptation. The adaptation of best practices
makes it possible to avoid mistakes and to indicate to stakeholders the potential benefits
experienced by the cities that have already adopted the solution. Best practices adapted to the
specific needs of a city are often combinations of various solutions or complementary
solutions (Iwan, 2014; Iwan e Kijewska, 2014).
In this context, best practices handbooks are useful tools in choosing solutions, and several
projects have been developed with this purpose. To select and implement an appropriate
solution, according to Iwan (2014) a key success factor is the transferability of the best
practice, defined as the degree of possibility to transfer a given solution to another place,
adapting it according to different needs and requirements of different urban environments and
operations.
Several projects can be cited as examples of handbooks in urban logistics best practices, such
as: Inter- and Intra- City Freight Distribution Networks (City Freight, 2005); Good Practice
Guide on Urban Freight Transport (Allen et al., 2007); Freight Transport for Development
Toolkit: Urban Freight (Dablanc, 2009); Debates on Brazilian urban logistics - best practices
(CLUB, 2013); City Logistics Best Practices: a Handbook for Authorities (Dablanc et al.,
2014); Making Urban Freight Logistics more Sustainable (CIVITAS, 2015). These handbooks
present an overview of best practices in urban freight transport, with analysis that aid on
determining important aspects for its transferability. These projects (Figure 1) were studied
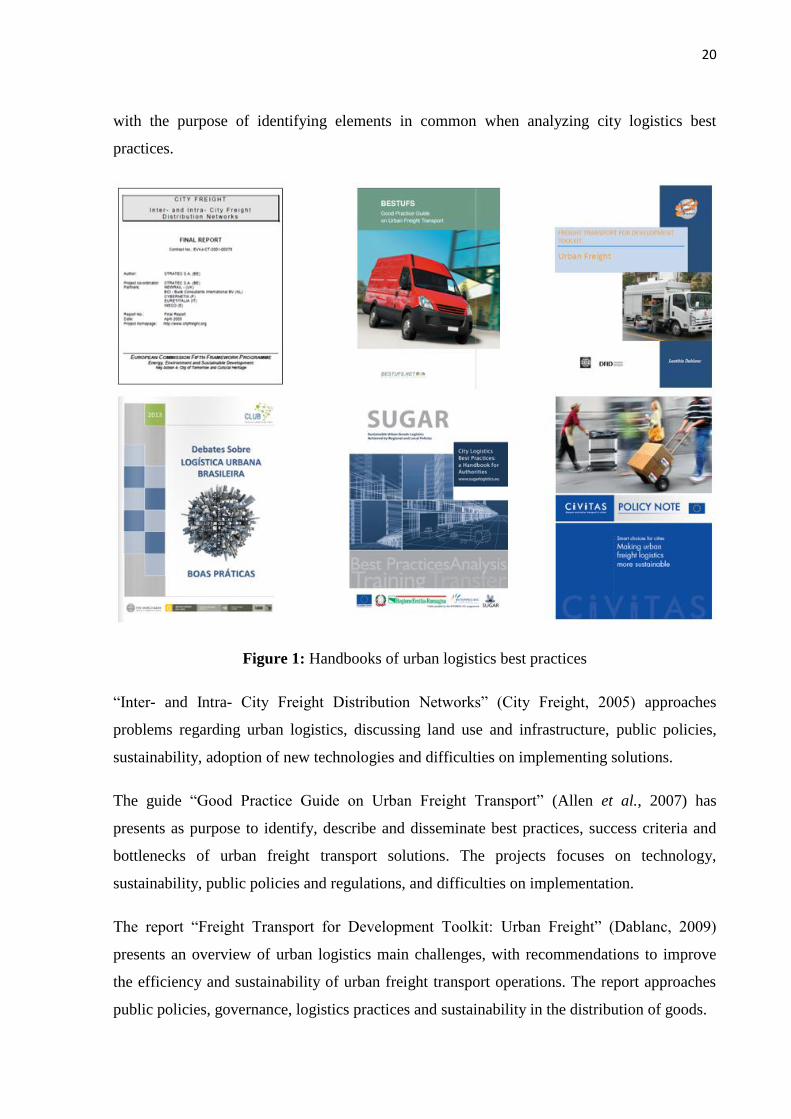
20
with the purpose of identifying elements in common when analyzing city logistics best
practices.
Figure 1: Handbooks of urban logistics best practices
“Inter- and Intra- City Freight Distribution Networks” (City Freight, 2005) approaches
problems regarding urban logistics, discussing land use and infrastructure, public policies,
sustainability, adoption of new technologies and difficulties on implementing solutions.
The guide “Good Practice Guide on Urban Freight Transport” (Allen et al., 2007) has
presents as purpose to identify, describe and disseminate best practices, success criteria and
bottlenecks of urban freight transport solutions. The projects focuses on technology,
sustainability, public policies and regulations, and difficulties on implementation.
The report “Freight Transport for Development Toolkit: Urban Freight” (Dablanc, 2009)
presents an overview of urban logistics main challenges, with recommendations to improve
the efficiency and sustainability of urban freight transport operations. The report approaches
public policies, governance, logistics practices and sustainability in the distribution of goods.

21
Brazilian Urban Logistics Center developed the report “Debates on Brazilian urban logistics -
best practices” (CLUB, 2013). City logistics best practices adopted by European, American
and Asian cities are explored, studying projects from the public and private sector. Most
projects were analyzed under the sections logistics practices, technology, sustainability, public
policies and regulations, and business model.
“City Logistics Best Practices: a Handbook for Authorities” (Dablanc et al., 2014) covers
political issues and defines performance indicators for the characterization of best practices.
The purpose of the handbook is to analyse urban logistics best practices in a project composed
of seventeen partners from ten countries. It approaches logistics practices according to public
policies, regulations, governance, primary obstacles to implementation and business model.
The handbook still details useful aspects for evaluating the economic viability of the studied
solution.
The report “Making urban freight logistics more sustainable” (CIVITAS, 2015) presents
different approaches that may be adopted for enhancing urban freight transport: stakeholders
involvement (governance), public policies, market-based measures, land use and
infrastructure planning, new technologies, sustainable systems, investments and
implementation time.
According to Iwan (2014), an essential condition for the effective adaptation of a best practice
is to perform a preliminary analysis of the solution prior to its implementation. Patier and
Browne (2010) also emphasize the importance of prior analysis for innovation in urban
logistics.
The study of these projects allowed the identification of common elements, listed in Table 1.
The importance of this table, with the use of non-academic projects, is the learning the
experiences in developing and implementing solutions can provide. Thus, common elements
that should be studied and analyzed when planning or developing a new solution for urban
freight transport were selected, in order to ensure the transferability of solutions.
22
Table 1: common elements in urban logistics handbooks.
City
Freight
(2005)
Allen et
al., (2007)
Dablanc
(2009)
CLUB
(2013)
Dablanc
et al.
(2014)
CIVITAS
(2015)
Logistics practices X X X X X
Adoption of new
technologies
X X X X
Sustainability X X X X X
Public policies and
governance
X X X X X X
Implementation
difficulties
X X X
Business model and
economic viability
X X X
The elements of Table 1 were selected because and can be described as:
Logistics practices: reports that describe logistics practices adopted in urban freight
transport solutions, such as: freight consolidation, freight transhipment, sustainable
vehicles, freight routing and management, unattended cargo reception (i.e. urban
lockers), off-hour deliveries, among others (Leonardi et al., 2014; Allen et al., 2007).
Adoption of new technologies: projects that analyse the adoption of new technologies
in the studied solutions. The main applications of ICT consisted of systems with the
purpose of collecting, processing and distributing information to its use in the
planning, operation and management of cargo transportation. The recent focus has
become the creation of Internet integrated applications that enable sharing data with
many users, the context in which ICTs have caused a variety of effects on logistics
systems. The e-commerce increases the Business-to-Business (B2B) and Business-to-
Consumer (B2C) transactions, which leads to an increased demand for transport. The
ITS have promoted the optimization of fleet management based on traffic or real-time
information, which increases the efficiency of transport (Yoshimoto and Nemoto,
2005).
Sustainability: reports that study the sustainability of the best practices. Urban freight
transport is responsible for social, environmental and economic impacts, such as
congestion, atmospheric pollution, high noise levels, security costs, among others
(Behrends et al., 2008; Mckinnon, 2010). In this context, studying the sustainability of
developed solutions is essential.

23
Public policies and governance: reports that evaluate the adoption of public policies or
the relationship between the stakeholders. The collaboration between the different
actors involved in logistics processes is essential to improving life quality in cities
(Crainic et. al, 2009; Dablanc 2007). The use of governance in solving urban logistics
problems is challenging, mainly due to the collaborative work necessary between the
stakeholders involved in the problems. Each stakeholder has different interests, often
conflicting with each other, and so the individual can overlap the collective goal.
Muñuzuri et al. (2005) states that for local authorities solutions for city logistics may
be related to public infrastructure; land use management (i.e. areas reserved for
loading/unloading zones); access conditions (spatial and temporal constraints); and
traffic management (ITS applications).
Implementation difficulties: projects that indicate the main difficulties in
implementing the studied best practice. Urban logistics is a complex phenomenon due
to the presence of multiple stakeholders, such as customers, shippers and receivers
with specific transport needs regarding the origin and destination of the cargo. City
logistics activities are also related to the local economy, transport infrastructures,
environmental and legal conditions (DASBURG e SCHOEMAKER, 2006).
Therefore, we see the importance of a prior analysis of the main difficulties in
implementing urban freight transport best practices.
Business model and economic viability: business model adopted in the solution and/or
its economic viability. Patier and Browne (2010) highlight the importance of
performing an economic analysis to evaluate innovations in urban logistics, proposing
economic and commercial indicators.
Paper I, attached in this research, and the paper written by Dias e Garcia (2015) were pilot
studies in using these elements when studying urban logistics best practices. After the analysis
of the use of satellite platforms for the transhipment of cargo to smaller vehicles for last mile
delivery at Campinas/SP downtown (Dias and Garcia, 2015), it was possible to develop a
simulating model in order to quantify the resources required for the operation before its
implementation (Paper II, attached in this research).
2.4 Cluster Analysis
Several logistics practices have been introduced to address the challenges of city logistics.
However, cities have different characteristics, and policy measures applied in different urban

24
areas can only result in different associated impacts. Thus, it is essential to consider urban-
specific characteristics to enhance the transferability and sustainability of urban logistics
solutions (Alho and Silva, 2015).
A definition of clusters states it as a grouping of similar things, such as geographical factors,
type of business, or business relationships along the supply chain (United Nations, 2007). The
cluster boundary delineation if often imprecise, and, according to Porter (1998), “a cluster is a
geographically proximate group of interconnected companies and associated institutions in a
particular field, linked by commonalities and complementarities.” Cluster analysis facilitates
the exploration of natural or hidden data structure and groups commonalities in a set of data
objects, aiding on the development of insights regarding the studied area.
In this context, we analyzed and compared different clusters identification methods from the
works: Ponce-Cueto et al., 2015; Alho and Silva, 2015; Chhetri et al., 2013, and; Allen et al.,
2012. These papers were selected due to their focus on city logistics activities, the relevance
of the projects and for being relatively recent studies.
In the work “Segmentation of urban areas from a logistics perspective: comparative case
studies in Lisbon, Madrid, Mexico City, Quito, Rio de Janeiro, and Singapore”, the purpose is
to identify clusters that impact urban logistics activities, to assist urban planning with general
recommendations for public policies. The research study is based in four steps: collection and
processing information, in which demographic, socioeconomic, regulation and infrastructure
data were collected; Statistical analysis, with the development of the principal component
analysis and k-means clustering analysis; Logistic cluster identification – a categorization of
different areas of the city according to urban logistics characteristics, and; finally, general
recommendations for public policy aiming contributions for urban freight mobility (Ponce-
Cueto et al., 2015).
The paper “Utilizing urban form characteristics in urban logistics analysis: a case study in
Lisbon, Portugal”, the author presents the concept of Logistics Profile, which “… suggests
homogeneous groups of urban zones with respect to three dimensions, which could be used to
analyze freight movement policy: (1) the social and built environment; (2) characteristics of
the goods/products being moved; (3) characteristics of the deliveries at the receiver
establishment.” The study was conducted with two statistical steps: Multiple Classification
Analysis (MCA) model and Two-step cluster analysis. The author states the Logistical Profile
25
has the potential to be used as a starting point for urban planning commodities and policy
analysis on the subject. In the paper, Lisbon was segmented into four logistic profiles,
allowing the city planners to focus on just four separate sets of rules and political action.
The work “Characterizing spatial logistics employment clusters” studied cluster theory with a
different approach: an analysis involving logistics employment clusters. The paper identified
industries related to logistics in order to quantify its employments, and conducted a statistical
analysis (principal component analysis and autocorrelation techniques) to empirically identify
and spatially contextualize logistics hubs. The research offers policymakers and practitioners
a foundation on which decisions about future infrastructure investment can be evaluated to
support cluster development and achieve economies of agglomeration (Chhetri et al., 2013).
The last paper, “Investigating relationships between road freight transport, facility location,
logistics management and urban form”, investigates relationships between road freight
transport, urban form, land use, facility location and logistics management. The main idea is
the collection of demographic data, socioeconomic data (area occupied by
industries/commerce, area occupied by industries/commerce per capta and per km2) and also
Origin/Destination information (trips within the area, from the area and to the area). The work
studied specific factors (loaded vehicle kilometers, empty vehicle kilometers, tonnes lifted,
tonne-kilometers, and vehicle loading factors) – and provided an analysis to the extent to
which the commercial and industrial land use patterns influence the amount, pattern and
intensity of road freight transport activity, and whether the suburbanization of warehousing
has been occurring (Allen et al., 2012).
We built an abstract of the mentioned methods in Table 2, showing common elements and
differences between the different alternatives. The parameters adopted (objective, data
collection, statistical analysis, result and conclusion) were chosen due to the following
reasons: the objective of each project adopting cluster analysis has a direct impact on the
required data for collection; cluster analysis usually requires statistical analysis, and; results
and conclusion help quantifying potential and applicability of the method.
We can see that, out of the four methods studied, three work with similar statistical analysis:
Principal Component Analysis e Multiple Classification Analysis (Alho and Silva, 2015;
Chhetri et al., 2013; Ponce-Cueto et al., 2015). Both statistical tools work with independent
variables and look for similarities between them. However, the work of Allen et al. (2012)

26
makes use of Origin / Destination matrix, and lists the array information with data common to
other methods such as demographic and socioeconomic data. Although the methods present
some differences, mainly because of distinct purposes, their results have commonalities, with
the grouping of regions to contribute to the local assessment.
All methods present contributions in addressing city logistics issues: the papers from Ponce-
Cueto et al. (2015) and Alho and Silva (2015) aid on dividing the city so that critical areas
can be identified and proper solutions suggested; Chhetri et al. (2013) offers a founded basis
that helps identifying lack of infrastructure for logistics activities, and; Allen et al. (2012)
analyzes road freight transport and its relation to urban form to assist planners when making
transport and land use decisions.
A criticism regarding the cluster theory approach is the lack of uniformity on its existing
methodologies, which leads to difficulty when comparing different reports on cluster
developments or for policy makers to form an objective judgment (United Nations, 2007;
Punj and Stewart 1983). This guides the study to unclear policy implications, as most of the
developed solutions turns out to be traditional economic development policies or practices,
with its particularity being the application on the cluster area. The lack of assessment of
cluster theory approach solutions is a limitation of this quantitative procedure (Wolman and
Hincapie, 2015). The necessity of background data for the development of the statistical
analysis should also be cited. Furthermore, the studied cluster analysis methods does not
provide descriptive report about the segmented areas, requiring additional effort to draw
inferences regarding their statistical significance (Punj and Stewart, 1983).
Despite its constraints, there are some contributions from the cluster method that should be
highlighted. Clustering procedures are a helpful tool in data analysis when one desires to
group objects (or variables) according to their relative similarity. The provision of a
conceptual framework allows a better view of the economy, aiding to the direction of the
regional economic policies development (Wolman and Hincapie, 2015). The cluster analysis
approach then helps on the understanding of the regional economy, and, depending on the
variables included on the analysis, its crossing with urban form and infrastructure or
demographic data, essential aspects to urban logistics. Castro et al. (2016) confirms the
advantages of applying cluster analysis in city logistics researches. Table 3 summarizes the
main advantages and downsides of cluster analysis as tool for city logistics planning.

27
Table 2: methods for clusters identification.
Steps Ponce-Cueto et al. (2015) Alho e Silva (2015) Chhetri et al. (2013) Allen et al. (2012)
OB
JEC
TIV
E
Identification of clusters that have impact on urban
logistics
Proposal of a quantitative methodology to define logistics profiles, considered as groups of urban
areas with homogeneous characteristics in relation to land use and movement of goods.
Identification of employment logistics
clusters
This paper investigates relationships between road freight transport activity,
urban form, land use, facility location and logistics management
DA
TA C
OLL
ECTI
ON
Demographic data (area, population and
demographic density)
City area features (Commercial density, homogeneity, logistics accessibility)
Industries "explicitly" related to logistics were
identified
Demographic data (area, population and demographic density)
Socioeconomic data (quantity of establishments
per industry)
Product Characteristics (Easiness of handling, special conditions)
Socioeconomic data (area occupied by industries/commerce, area occupied by industries/commerce per capta and per
km2)
Infrastructure data (road capacity and road density)
Agents/deliveries profile (Urgency of deliveries, frequency of deliveries, amount of freight to be
delivered)
Information about employment in those
industries were collected
Road freight activity data (3 types of trips: trips within the studied area, trips to the studied area and trips from the
studied area) Regulation data
STA
TIST
ICA
L A
NA
LYSI
S
Principal component Analysis
Multiple Classification Analysis (MCA) model Principal component
analysis No statistical analysis performed. Paper makes analysis such as loaded vehicle kilometers, empty vehicle kilometers, tonnes lifted, tonne-kilometers, and
vehicle loading factors K-means Clustering Two-step cluster analysis
Autocorrelation techniques to measure "spill over" impacts of clustering in
neighboring areas

28
RES
ULT
S
Segmentation of the city into urban clusters aiding
the identification of critical areas and development of
insights
Identification of four logistic profiles validated for the study case in Lisbon. The approaches to the logistics management in this city can focus on just four separate sets of rules and political
action.
Delineate logistics employment clusters to
represent the underlying regional geography of the
logistics landscape
Commercial and industrial floor-space composition
Warehousing floor-space and changes over the decade
Road freight transport activity patterns including its efficiency and intensity
CO
NC
LUSI
ON
General recommendations for public policies
The Logistical Profile (LP) has the potential to be used as a starting point for urban planning
commodities and policy analysis on the subject.
The key value of this research is the
quantification of spatial logistics employment clusters using spatial
autocorrelation measures to empirically identify and
spatially contextualize logistics hubs.
The extent to which the commercial and industrial land use patterns influence the amount, pattern and intensity of road freight transport activity, and
whether the suburbanization of warehousing has been occurring.
CO
NTR
IBU
TIO
N T
O C
ITY
LOG
ISTI
CS
Segmentation of the city into homogeneous areas
identifying critical clusters to urban logistics and
allowing similar policies/solutions for the
same cluster
Segmentation of the city into Logistic Profiles identifying critical areas and allowing similar
policies/solutions for the same zone
The research offers an empirically founded basis on which decisions about
future infrastructure investment can be
evaluated to support cluster development
It is expected that improved understanding of the relationship
analyzed (road freight transport, facility location, logistics management and
urban form) will assist planners when making transport and land use decisions

29
Table 3: advantages and downsides of cluster analysis.
Cluster Analysis
Advantages
Provision of demographic and economic conceptual
framework;
Possibility of correlating important variables to urban logistics
(e.g. infrastructure, demographic or regulation data) with the
cities' economic activities;
Insights provision that groups commonalities by use of
statistical analysis tools.
Disadvantages
Lack of uniformity;
Necessity of background data for statistical analysis;
Lack of assessment of cluster theory approach solutions;
Necessity of further effort to draw inferences regarding their
statistical significance.
30
3 METHODOLOGY
A preliminary literature review was conducted in order to understand the urbanization and the
urban logistics challenges, allowing the definition of the research problem and objective.
The literature review included the study of important urban planning tools, such as the city
logistics concept. Projects approaching the dissemination of urban logistics best practices
were analyzed, with the purpose of identifying common elements and thus contributing to the
transferability on the development of new solutions for freight mobility. This work presents
cluster analysis as tool for identification of urban clusters, contributing in the development of
public policies and solutions that optimize urban freight transport. The advantages and
disadvantages of the approach were listed, as well as four different methods adopted for city
logistics planning were described.
The methodology of the research is a stepwise approach: initially, we identified urban clusters
from São Paulo, Brazil, adopting one of the studied methods, which is further detailed in the
next section. This procedure allowed the segmentation of the city into different clusters, with
the development of specific insights according to each zone characteristics and the proposal of
general recommendations aiding urban freight transport. This first application consists of two
scenarios, where two additional variables where included in the second scenario in order to
compare the results and select the most representative map of the city. The second main
application of the research is the use of a Multi Criteria Decision tool, the Analytic Hierarchy
Process, in a critical area of the city identified by the cluster analysis. With the involvement of
the stakeholders, we prioritized and proposed an adequate urban logistics best practice
ensuring its transferability and efficiency.
Figure 2 illustrates the steps of this research.
31
Figure 2: steps of the research.
3.1 Urban clusters identification
The research study follows the methodology described in Ponce-Cueto et al. (2015): (1)
Collection and processing information, in which we collected demographic, socioeconomic,
regulation and infrastructure data from secondary database and using Geographic Information
Systems. (2) Statistical analysis, mainly principal component analysis (PCA) and k-means
clustering analysis. (3) Logistics clusters identification – a categorization of different areas of
the city according to urban logistics characteristics. (4) And; finally, general
recommendations for public policy aiming contributions for urban freight mobility (Ponce-
Cueto et al., 2015). Figure 3 represents the data-driven methodology.
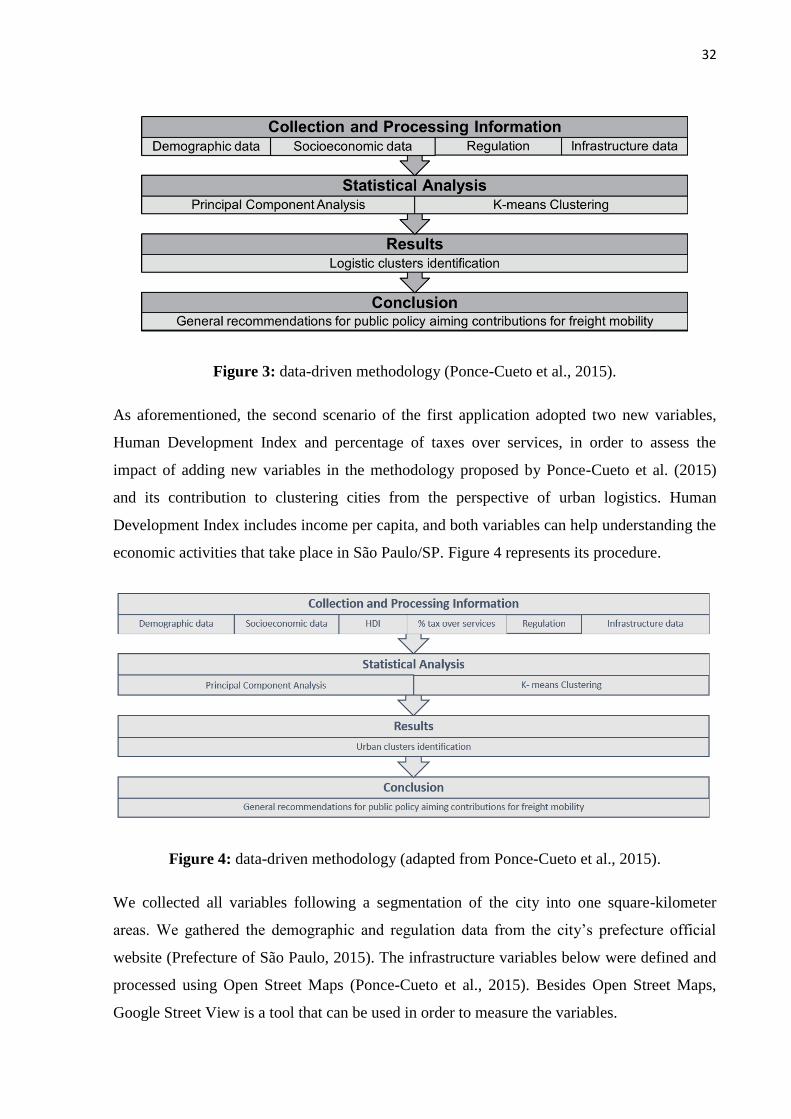
32
Figure 3: data-driven methodology (Ponce-Cueto et al., 2015).
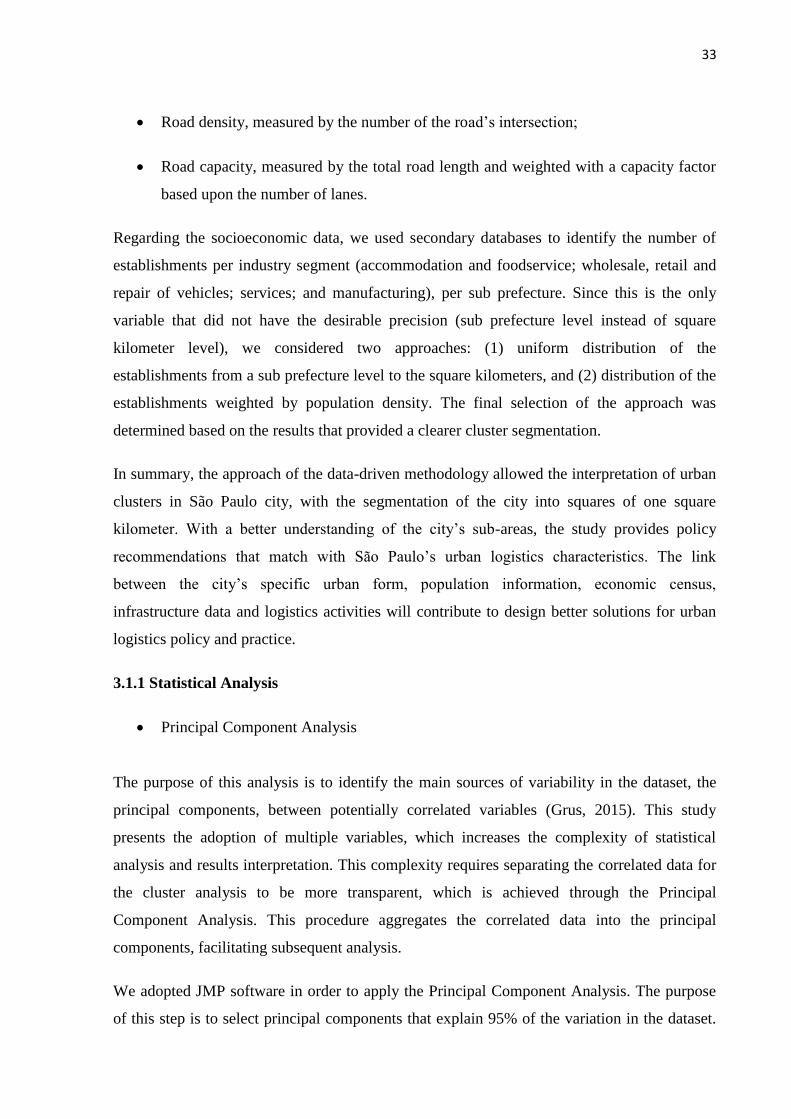
As aforementioned, the second scenario of the first application adopted two new variables,
Human Development Index and percentage of taxes over services, in order to assess the
impact of adding new variables in the methodology proposed by Ponce-Cueto et al. (2015)
and its contribution to clustering cities from the perspective of urban logistics. Human
Development Index includes income per capita, and both variables can help understanding the
economic activities that take place in São Paulo/SP. Figure 4 represents its procedure.
Figure 4: data-driven methodology (adapted from Ponce-Cueto et al., 2015).
We collected all variables following a segmentation of the city into one square-kilometer
areas. We gathered the demographic and regulation data from the city’s prefecture official
website (Prefecture of São Paulo, 2015). The infrastructure variables below were defined and
processed using Open Street Maps (Ponce-Cueto et al., 2015). Besides Open Street Maps,
Google Street View is a tool that can be used in order to measure the variables.
33
Road density, measured by the number of the road’s intersection;
Road capacity, measured by the total road length and weighted with a capacity factor
based upon the number of lanes.
Regarding the socioeconomic data, we used secondary databases to identify the number of
establishments per industry segment (accommodation and foodservice; wholesale, retail and
repair of vehicles; services; and manufacturing), per sub prefecture. Since this is the only
variable that did not have the desirable precision (sub prefecture level instead of square
kilometer level), we considered two approaches: (1) uniform distribution of the
establishments from a sub prefecture level to the square kilometers, and (2) distribution of the
establishments weighted by population density. The final selection of the approach was
determined based on the results that provided a clearer cluster segmentation.
In summary, the approach of the data-driven methodology allowed the interpretation of urban
clusters in São Paulo city, with the segmentation of the city into squares of one square
kilometer. With a better understanding of the city’s sub-areas, the study provides policy
recommendations that match with São Paulo’s urban logistics characteristics. The link
between the city’s specific urban form, population information, economic census,
infrastructure data and logistics activities will contribute to design better solutions for urban
logistics policy and practice.
3.1.1 Statistical Analysis
Principal Component Analysis
The purpose of this analysis is to identify the main sources of variability in the dataset, the
principal components, between potentially correlated variables (Grus, 2015). This study
presents the adoption of multiple variables, which increases the complexity of statistical
analysis and results interpretation. This complexity requires separating the correlated data for
the cluster analysis to be more transparent, which is achieved through the Principal
Component Analysis. This procedure aggregates the correlated data into the principal
components, facilitating subsequent analysis.
We adopted JMP software in order to apply the Principal Component Analysis. The purpose
of this step is to select principal components that explain 95% of the variation in the dataset.

34
The first principal component corresponds to the linear combination of the standardized
original variables that has the greatest possible variance. Each subsequent principal
component corresponds to the linear combination of the variables that has the greatest
possible variance and is uncorrelated with all previously defined components.
The input variables of the first approach (uniform distribution) were population, road density,
road capacity and establishments’ concentration. The establishments’ concentration were
divided into four segments: Accommodation & foodservice; Wholesale, retail and repair of
vehicles; All services, and; Manufacturing. Figure 5 illustrates the report of the statistical
analysis, with the selection of three principal components.
Figure 5: uniform distribution scenario results.
The input variables of the second approach (weighted distribution) were the same from the
first approach, with different values for the establishments’ concentration. Instead of applying
uniform distribution for the division of the establishments from a sub prefecture level to the
one square kilometer level, weighted distribution was applied following the correlation
between establishments’ concentration and population and road capacity. Figure 6 shows the
report of the Principal Component Analysis for this scenario, with the selection of three
principal components

35
Figure 6: weighted distribution scenario results.
The reports give important information. The eigenvalue in the Summary plots indicate the
total number of components extracted based on the amount of variance contributed by each
component. The bar chart illustrates the percentage of the variation accounted for by each
principal component, information used to select the number of principal components for each
scenario. As aforementioned, we required 95% of variation in the dataset, represented by the
principal components.
The Score Plot, reports’ central graphic, illustrates each component calculated values’ in
relation to the other, adjusting each value for the mean and standard deviation. The Loadings
Plot, graphic located in the right side of the reports, represents the effect of each component
on the adopted variables. The closer the value is to one the greater the effect is.
The reports show the establishments’ concentration from all four segments are the variables
with greater effect on principal component number one. However, they present a low effect
on principal component number two. Road density, road capacity and population, in general,
are responsible for the greatest effect on principal component number two.
K-means Clustering
According to Pham et al. (2005), k-means algorithm is a popular data-clustering tool, and
gives as output the K optimal number of clusters and its division. We adopted the F-Statistic
36
for selecting the optimal number of clusters. Since the optimal statistical number (K optimal)
is not necessarily the best representation of the city, and the code used allows increasing K
optimal giving new clustering distributions as output, we tried the following values for k for
each scenario: K optimal, K optimal + 1, K optimal + 2, and K optimal +3. After analyzing
the cluster map output for each K value, we selected the most representative for each scenario.
The most representative cluster maps chosen for approaches (1) and (2) are almost equal, and
have five clusters. Since both maps from the first and second scenarios are similar, and we
adopted correlation between variables for the weighted distribution approach, we chose the
first approach (uniform distribution) to illustrate the city, as correlations do not necessarily
imply a causal relationship.
3.2 Multi Criteria Decision Making
Decision making is a complex activity, since it is necessary to evaluate alternative actions
from the perspective of conflicting viewpoints (Freitas, 1999). Multi Criteria Decision
Making is "a tool for decision making developed to complex problems" (CIFOR, 2015), such
as the context experienced by urban logistics (Anderson et al., 2005; Behrends et al., 2008;
Mckinnon, 2010; Oliveira et al., 2015).
Multi Criteria Decision Making assists in the structuring and solving of decision problems
and planning involving multiple criteria (Majumder, 2015). In addition, Multi Criteria
Decision Making techniques can be used to identify the best solution in a specific context, to
sort options, or simply to distinguish between acceptable and unacceptable alternatives
(Communities and Local Government, 2009).
Multi Criteria Decision Making methods are classified in two groups: Compensatory Methods
and Outranking Methods. Among the Compensatory Methods, the Analytic Hierarchy Process
(AHP) was already successfully adopted for prioritizing an urban logistics solution in an
important Latin America megacity, (Córdova et al., 2014), and is the approach selected for
this research. Awasthi et al. (2012) also used AHP to involve stakholders in the study of a city
logistics context and best practice prioritization. In addition, the methodology has also been
adopted for transport researches, such as the definition of the best alternatives for urban public
transport with the participation of the stakeholders (Silva, 2014). Kunadhamraks and Hanaoka
37
(2005) use fuzzy AHP for evaluation of logistics performance for freight mode choice at an
intermodal terminal.
In addition, the AHP has already been successfully applied in various settings to make
decisions. In public administration, the state of North Carolina used it to develop evaluation
criteria and assign ratings to vendors, leading to the selection of a best-value vendor
acceptable to the decision makers. The Department of Defence in the US uses it frequently
and extensively to allocate their resources to their diverse activities. British Airways used it in
1998 to choose the entertainment system vendor for its entire fleet of airplanes. Xerox
Corporation has used the AHP to allocate close to a billion dollars to its research projects. In
1999, the Ford Motor Company used the AHP to establish priorities for criteria that improve
customer satisfaction. Ford gave Expert Choice Inc, an Award for Excellence for helping
them achieve greater success with its clients (Saaty, 2008).
AHP includes and measures all important factors, whether tangible or intangible, approaching
to a realistic model. According to Saaty (1994), a benefit of the method is that it can handle
quantitative and qualitative aspects of a decision problem. AHP helps the decision makers to
find a solution that best suits the goals, avoiding conflicts of interest by involving the
stakeholders, and helps the understanding of the problem and its context by building a
decision hierarchy (Majumder, 2015).
3.2.1 Analytic Hierarchy Process
The basis of the Analytic Hierarchy Process (AHP) is the decomposition and synthesis of the
relationship between the chosen criteria so that the indicators are prioritized, and thus
establish a performance measure (Saaty, 1991).
Decision Support Systems Glossary (DSS, 2006) defines the AHP as "a decision making
approach that involves structuring multi criteria indicators in a hierarchy. The method
assesses the relative importance of these criteria, comparing alternatives for each criteria, and
determines an overall ranking of the alternatives."
The method has three main steps:

38
(i) Hierarchy: this step consists in the identification of the problem and its objectives. The
problem is decomposed into a hierarchy of goal, criteria, sub-criteria and alternatives. This is
the most creative and important part of decision-making (Saaty, 1994). Despite the need to
compute the weights of each criteria, the hierarchy facilitates analyzing the studied problem
(Bornia e Wernke, 2001).
(ii) Judgment: paired comparisons for each level of the hierarchy based on the AHP scale
of priorities to develop relative weights, called priorities, which differentiate the importance
of the criteria (Grandzol, 2005). Saaty (1991) recommends the use of the scale shown in Table
4.
(iii) Consistency of Judgements: Saaty (2000) proposes to verify the consistency of
judgments by calculating the Consistency Index and Consistency Ratio. The Consistency
Ratio should be less than 0.10.
Table 4: The fundamental scale of absolute numbers (Saaty, 1991)
Intensity of Importance
Definition Explanation
1 Equal Importance Two activities contribute equally to the objective
3 Moderate importance Experience and judgement slightly favour
one activity over another
5 Strong importance Experience and judgement strongly favour
one activity over another
7 Very strong or demonstrated
importance
An activity is favoured very strongly over another; its dominance demonstrated in practice
9 Extreme importance The evidence favouring one activity over another
is of the highest possible order of affirmation
2, 4, 6, 8 Intermediate values Condition between two settings (1, 3, 5, 7, 9)
4 SÃO PAULO’S URBAN CONTEXT
São Paulo is America’s most populated city, with more than eleven million inhabitants
according to IBGE (2016) - Brazilian Institute of Geography and Statistics. Increased
urbanization directly translates into increased demand for goods and services and their
supporting logistics activities (Blanco, 2014), and São Paulo presents a heterogeneous land
39
use, with high concentration of commercial establishments, warehouses and industries
(Prefecture of São Paulo, 2015). This context indicates a large demand for cargo
transportation and an intense flow of cargo vehicles throughout the city.
According to CET (2016), the city of São Paulo has an almost permanent saturation of its
road system. In order to mitigate this serious problem, the City adopted in 1997 a rotation
system of private vehicles, which restricts their movement according to its plate final number
and the days and times of the week.
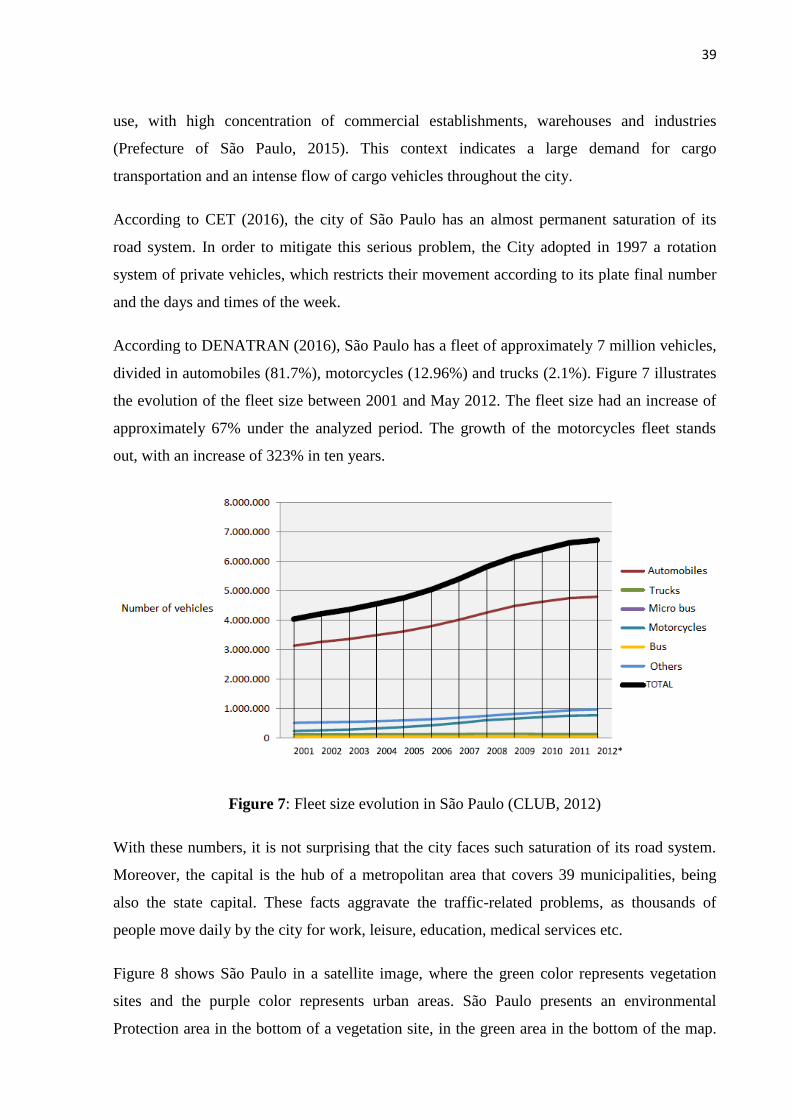
According to DENATRAN (2016), São Paulo has a fleet of approximately 7 million vehicles,
divided in automobiles (81.7%), motorcycles (12.96%) and trucks (2.1%). Figure 7 illustrates
the evolution of the fleet size between 2001 and May 2012. The fleet size had an increase of
approximately 67% under the analyzed period. The growth of the motorcycles fleet stands
out, with an increase of 323% in ten years.
Figure 7: Fleet size evolution in São Paulo (CLUB, 2012)
With these numbers, it is not surprising that the city faces such saturation of its road system.
Moreover, the capital is the hub of a metropolitan area that covers 39 municipalities, being
also the state capital. These facts aggravate the traffic-related problems, as thousands of
people move daily by the city for work, leisure, education, medical services etc.
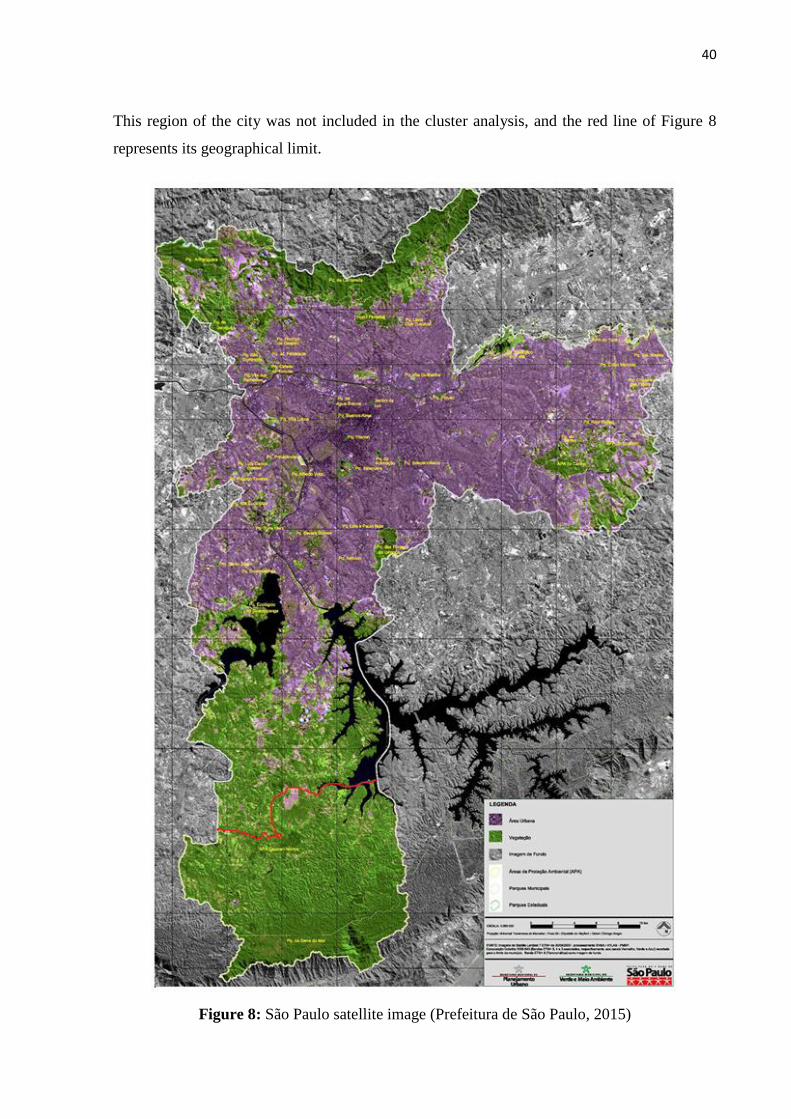
Figure 8 shows São Paulo in a satellite image, where the green color represents vegetation
sites and the purple color represents urban areas. São Paulo presents an environmental
Protection area in the bottom of a vegetation site, in the green area in the bottom of the map.
40
This region of the city was not included in the cluster analysis, and the red line of Figure 8
represents its geographical limit.
Figure 8: São Paulo satellite image (Prefeitura de São Paulo, 2015)

41
Brazilian Urban Logistics Center (CLUB) developed several studies regarding urban freight
transport in important Brazilian cities. CLUB analyzed São Paulo, and Figure 9 presents its
main challenges regarding urban logistics activities. The most important identified problems
are related to public policies and congestion, whereas relevant issues such as delivery bays
and security were also cited.
Figure 9: delivery problems at São Paulo (CLUB, 2016)
São Paulo still faces the challenge of urban freight transport in slums. Worldwide, in 2012,
33% of the population live in slums (Lima, 2015). Figure 10 illustrates its distribution in São
Paulo, more concentrated in peripherical zones. In addition, as shown in Figure 11, there is a
growth in the acquisition patterns in those areas, with an increasing number of middle class
families in slums. The higher acquisition power in slums makes urban logistics more critical
in those areas, due to infrastructure restrictions combined with a growth in demand for freight.

42
Figure 10: Slums distribution in São Paulo.

43
Figure 11: Slums inhabitants profile (Lima, 2015).
This research presents a stepwise strategy in the cluster analysis, with two scenarios, in order
to assess the impact of including new variables in the study and with the purpose of selecting
the most representative cluster map of the city. In the first scenario, presented in Section 5.1,
we adopted the following variables: establishments’ concentration (Accommodation &
foodservice; Wholesale, retail and repair of vehicles; All services, and; Manufacturing), road
density, road capacity, population concentration and regulation data. In the second scenario,
shown in Section 5.2, we included Human Development Index and percentage of taxes over
services.
5 PRACTICAL APPLICATION 1: SÃO PAULO CLUSTER ANALYSIS RESULTS
5.1 First Scenario
We normalized the data from each cluster, in order to analyze its logistics profile. Table 5
presents the data on the real and normalized scale and Figure 12 illustrates the clusters map.

44
Table 5: real and normalized clusters’ results.
Cluster Population
Road
capacity
Road
density
Wholesale,
retail and
repair of
vehicles
Accommodation
& food service
All
services Manufacturing
average 0 29117.88 29.48 99.01 69.85 67.05 289.46 14.09
average 1 15549.04 33.00 101.84 216.48 218.88 995.83 41.16
average 2 3428.88 10.13 28.52 12.28 10.55 42.66 2.33
average 3 10626.66 29.71 120.83 27.75 22.86 93.95 5.53
average 4 23074.57 40.47 112.43 571.00 519.00 2524.00 102.00
total 81797.03 142.78 462.63 897.37 838.35 3945.90 165.11
normalized 0 0.36 0.21 0.21 0.08 0.08 0.07 0.09
normalized 1 0.19 0.23 0.22 0.24 0.26 0.25 0.25
normalized 2 0.04 0.07 0.06 0.01 0.01 0.01 0.01
normalized 3 0.13 0.21 0.26 0.03 0.03 0.02 0.03
normalized 4 0.28 0.28 0.24 0.64 0.62 0.64 0.62
Figure 12: São Paulo clusters map.
45
High-density Residential zone
Cluster number 0 presents the highest population normalized value, with a demographic
density of almost 30,000 people per square kilometer. This cluster has low establishments’
concentration (between 0.07 and 0.09 on normalized data) and average infrastructure values
for both road density and road capacity. Thus, it is a residential zone.
Critical zone for urban logistics
Cluster number 1 presents an average value for population, with 0.19 as normalized value. It
has the second higher establishments’ concentration, with normalized values between 0.24
and 0.26. Although presenting similar normalized values, the services segments represent
more than half of the establishments. The cluster has average infrastructure data, with
normalized values lower than the establishments’ concentration, and is inside the restriction
zone (urban trucks allowed). Thus, this cluster is a critical zone for urban logistics activities.
Peripheral zone
Cluster number 2 has the lowest normalized values for population, establishments’
concentration, road density and road capacity. However, it has the second bigger area, when
compared to the other clusters. It is a peripheral zone, with low economic activities.
Low-density residential zone
Cluster number 3 has a low normalized value for population density (0.13) and for
establishments’ concentration (between 0.2 and 0.3 on normalized data). However, this cluster
presents high road density and average road capacity normalized values. In addition to the
infrastructure data, it is practically outside the restriction zone, and therefore, represents a
zone with high growth potential.
Central area
Cluster number 4 presents a high population density: 23074.57 inhabitants per square
kilometer, with a normalized value of 0.28. This cluster contains the higher commercial
activity, with a normalized value higher than 0.6 for every studied segment. Despite having its
infrastructure values above average, they do not stand out as much as population or

46
establishments’ concentration. This cluster is inside the restriction zone (urban trucks
allowed).
This cluster represents “Sé” sub prefecture. It corresponds to the oldest occupied area of São
Paulo city, initiated on the XVI century, and is known as the “old downtown”. The
inhabitants’ are leaving this region over time, but as the logistics profile shows, it is still a
high-populated zone. The cluster concentrates low-income population
Figure 13 illustrates the clusters’ characteristics, according to the studied variables.
Figure 13: clusters’ characteristics.
5.1.1 Public policy and general recommendations
São Paulo’s segmentation into five different clusters presents a contribution to city logistics
planning, and Table 6 discusses some insights with the presented results, aiding outcomes
especially to the last mile delivery.

47
Table 6: recommendations for each analyzed cluster.
Cluster (0)
High-density
Residential
Zone
In residential areas, policies providing vehicles speed and noise
control are important to ensure adequate levels of life quality and
safety. Public policies adequate to this region could also improve
last mile delivery assertiveness, specifically B2C deliveries.
Further, cluster-specific analyses are suggested for the proposal of
specific solutions.
Cluster (1)
Critical zone
for urban
logistics
There is a lack of accessibility due to low road density in
comparison with establishments and population concentration, and
for being inside the restriction zone. Investments in infrastructure
are essential, and urban distribution centers can aid on freight
consolidation. Considering the high adoption of motorcycles for
transport, transshipment solutions to smaller vehicles should be
studied.
Cluster (2) Peripheral
zone
We recommend public policies aiming the economic and
infrastructure development of the region, with focus on ensuring
accessibility from logistics centers/industrial zones to
residential/commercial areas. Slums concentration – solutions
such as Mobile Warehouses and Truck Shops for improving goods
accessibility should be further studied. Sustainability must be
considered due to high vegetation concentration.
Cluster (3) Low-density
zone
No infrastructure constraints, since establishments and population
concentration are low when compared to road density and
capacity. The zone has a high potential for economic growth.
Cluster (4) Central zone
Very high concentration of commercial establishments and
population. The cluster is known as “old downtown” and is inside
the restriction area. Considering the high adoption of motorcycles
for transport, transshipment solutions to smaller vehicles should
be studied. A satellite platform can be a great solution for freight
forwarding in central areas, as well as the provision of
48
infrastructure such as delivery bays for parking VUC’s is critical.
The use of delivery windows for freight forwarding in this area
may also be explored. For companies, night deliveries can be an
option to improve operational efficiency levels due to low traffic
levels at night. Further studies are needed to development of
solutions.
5.2 Second Scenario
The most representative cluster map after completing the statistical procedures is illustrated in
Figure 14, while the data regarding each cluster is presented in Table 7. Figure 15 shows the
main characteristics of each cluster according to the adopted variables.

49
Figure 14: São Paulo cluster’s map – second application
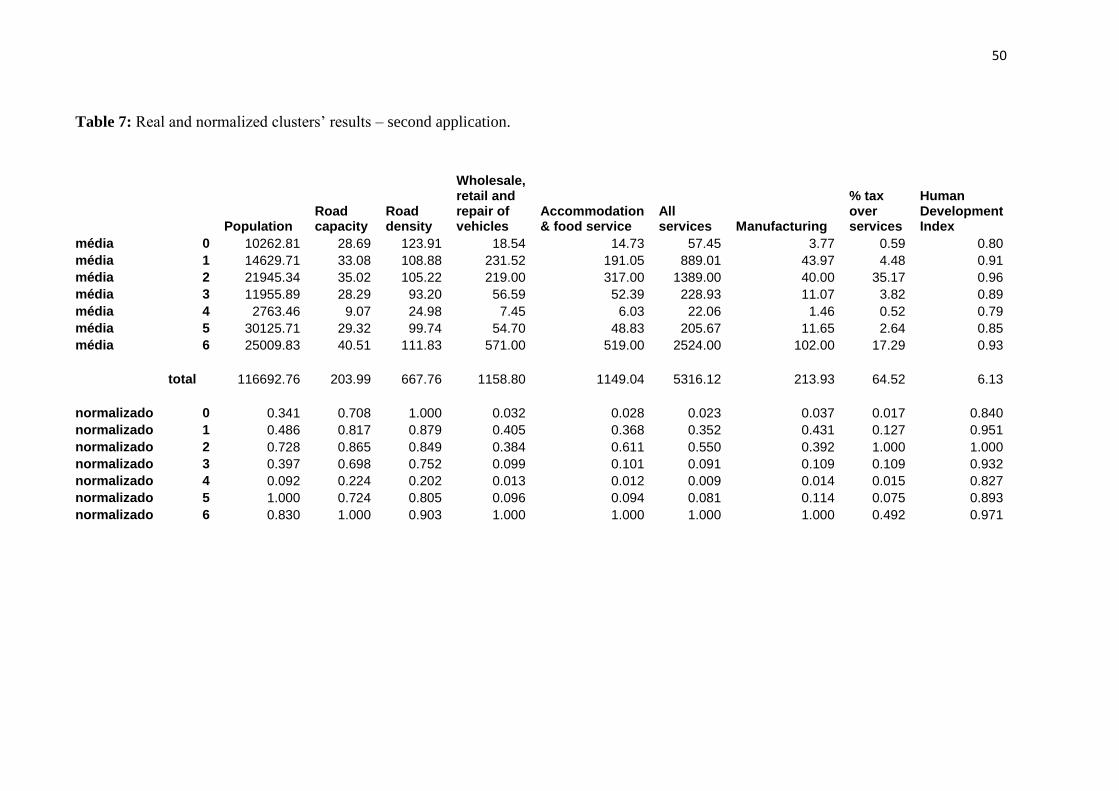
50
Table 7: Real and normalized clusters’ results – second application.
Population Road capacity
Road density
Wholesale, retail and repair of vehicles
Accommodation & food service
All services Manufacturing
% tax over services
Human Development Index
média 0 10262.81 28.69 123.91 18.54 14.73 57.45 3.77 0.59 0.80
média 1 14629.71 33.08 108.88 231.52 191.05 889.01 43.97 4.48 0.91
média 2 21945.34 35.02 105.22 219.00 317.00 1389.00 40.00 35.17 0.96
média 3 11955.89 28.29 93.20 56.59 52.39 228.93 11.07 3.82 0.89
média 4 2763.46 9.07 24.98 7.45 6.03 22.06 1.46 0.52 0.79
média 5 30125.71 29.32 99.74 54.70 48.83 205.67 11.65 2.64 0.85
média 6 25009.83 40.51 111.83 571.00 519.00 2524.00 102.00 17.29 0.93
total 116692.76 203.99 667.76 1158.80 1149.04 5316.12 213.93 64.52 6.13
normalizado 0 0.341 0.708 1.000 0.032 0.028 0.023 0.037 0.017 0.840
normalizado 1 0.486 0.817 0.879 0.405 0.368 0.352 0.431 0.127 0.951
normalizado 2 0.728 0.865 0.849 0.384 0.611 0.550 0.392 1.000 1.000
normalizado 3 0.397 0.698 0.752 0.099 0.101 0.091 0.109 0.109 0.932
normalizado 4 0.092 0.224 0.202 0.013 0.012 0.009 0.014 0.015 0.827
normalizado 5 1.000 0.724 0.805 0.096 0.094 0.081 0.114 0.075 0.893
normalizado 6 0.830 1.000 0.903 1.000 1.000 1.000 1.000 0.492 0.971
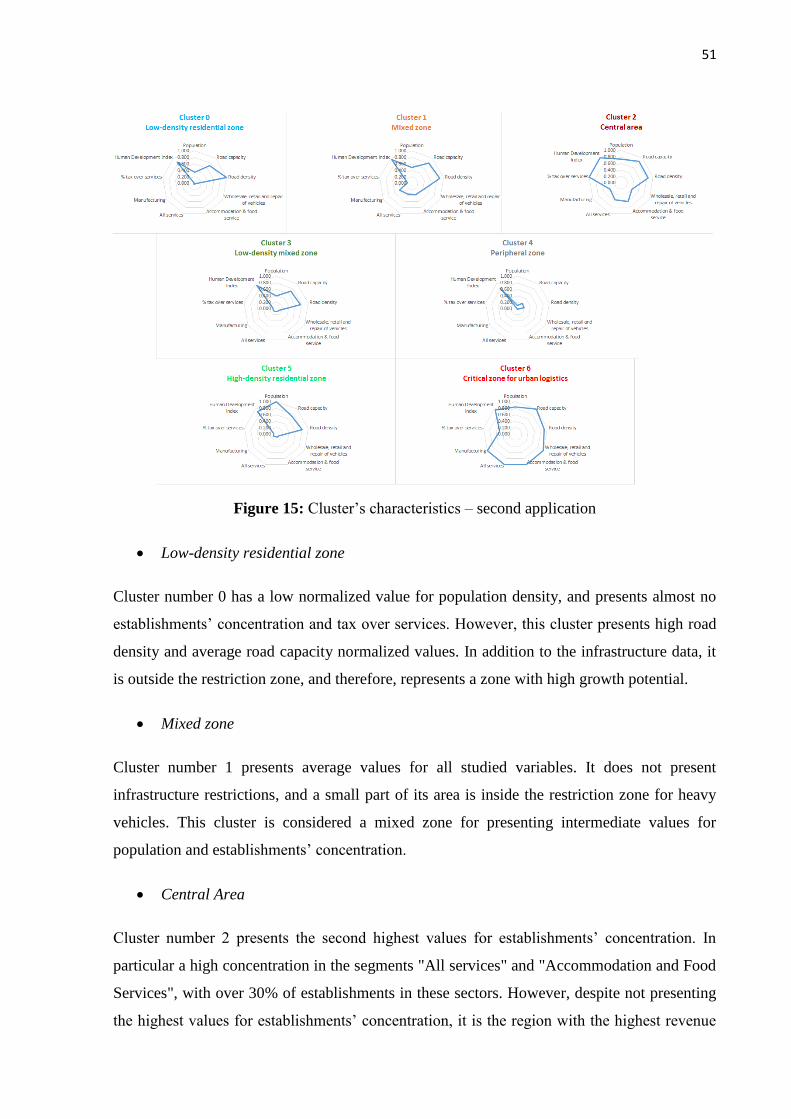
51
Figure 15: Cluster’s characteristics – second application
Low-density residential zone
Cluster number 0 has a low normalized value for population density, and presents almost no
establishments’ concentration and tax over services. However, this cluster presents high road
density and average road capacity normalized values. In addition to the infrastructure data, it
is outside the restriction zone, and therefore, represents a zone with high growth potential.
Mixed zone
Cluster number 1 presents average values for all studied variables. It does not present
infrastructure restrictions, and a small part of its area is inside the restriction zone for heavy
vehicles. This cluster is considered a mixed zone for presenting intermediate values for
population and establishments’ concentration.
Central Area
Cluster number 2 presents the second highest values for establishments’ concentration. In
particular a high concentration in the segments "All services" and "Accommodation and Food
Services", with over 30% of establishments in these sectors. However, despite not presenting
the highest values for establishments’ concentration, it is the region with the highest revenue

52
in taxes over services, which can be explained by a greater value in the price of activities in
this region, or a higher corresponding aliquot. Thus, this cluster has a high commercial
activity, but with lower infrastructure restrictions in comparison with cluster number 6.
Nevertheless, it is within the restriction zone for heavy vehicles.
Low-density mixed zone
Cluster number 3 has a low normalized value for population density, establishments’
concentration and tax over services. However, this cluster presents average road density and
road.
Peripheral zone
Low population and establishments’ concentration. Its Human Development Index is the
lowest; however, no cluster has a HDI that stands out (average of 0.15 for all clusters).
High-density Residential zone
Cluster number 5 presents the highest population normalized value, with a demographic
density of almost 30,000 people per square kilometer. This cluster has low establishments’
concentration and tax over services, and also average infrastructure values for both road
density and road capacity. Thus, it is a residential zone.
Critical zone for urban logistics
This cluster presents the highest normalized values for establishments’ concentration, with
more than 50% of the establishments of all segments studied. However, the cluster’s tax
collection over services does not have a meaningful value as the establishments’
concentration, which may suggest a high volume of commercial activities, but low prices or
related aliquot. This zone has average values for infrastructure (road density and road
capacity), and is inside the restriction zone for heavy vehicles. Therefore, it is considered a
critical zone for urban logistics.
5.2.1 Public policy and general recommendations
The adoption of two additional variables allowed the segmentation of the city into seven
clusters – with two new homogeneous areas that were not identified in the research performed
53
by Castro et al. (2016). The clusters High-density Residential zone, Critical zone for urban
logistics, Peripheral zone, Low-density residential zone, and Central Area were identified in
both approaches, while the second application led to the new clusters: Mixed zone and Low-
density mixed zone. Table 8 presents general recommendations for the identified clusters.
Table 8: general recommendations for the identified clusters
Cluster
(0)
Low-
density
residential
zone
No infrastructure constraints, since establishments and population
concentration are low when compared to road density and capacity. The
zone has a high potential for economic growth.
Cluster
(1)
Mixed
zone
This zone presents infrastructure constraints, since its population and
establishments’ concentration is high when compared to its
infrastructure. Since this clusters presents population concentration,
policies such as night deliveries would not be appropriate. Solutions that
involve B2C and B2B are required for this area. Investments in
infrastructure, such as delivery bays, can be explored.
Cluster
(2)
Central
zone
Very high concentration of commercial establishments and population.
The cluster is known as “old downtown” and is inside the restriction
area. Considering the high adoption of motorcycles for transport,
transshipment solutions to smaller vehicles should be studied. A satellite
platform can be a great solution for freight forwarding in central areas,
as well as the provision of infrastructure such as delivery bays for
parking VUC’s is critical. The use of delivery windows for freight
forwarding in this area may also be explored. For companies, night
deliveries can be an option to improve operational efficiency levels due
to low traffic levels at night. Further studies are needed to development
of solutions.
Cluster
(3)
Low-
density
mixed
zone
This cluster presents no infrastructure constraints, in comparison with its
population and commercial establishments’ concentration. The zone has
a high potential for economic growth.
Cluster
(4)
Peripheral
zone
We recommend public policies aiming the economic development of the
region. Infrastructure development is also required, with focus on
ensuring accessibility from logistics centers/industrial zones to
residential/commercial areas. Slums concentration – solutions such as
Mobile Warehouses and Truck Shops for improving goods accessibility
should be further studied. Sustainability must be considered due to high
vegetation concentration.
Cluster
(5)
High-
density
Residential
Zone
In residential areas, policies providing vehicles speed and noise control
are important to ensure adequate levels of life quality and safety. Public
policies adequate to this region could also improve last mile delivery
assertiveness, specifically B2C deliveries. Further, cluster-specific
analyses are suggested for the proposal of specific solutions.

54
Cluster
(6)
Critical
zone for
urban
logistics
There is a lack of accessibility due to low road density in comparison
with establishments and population concentration, and for being inside
the restriction zone. Investments in infrastructure are essential, and urban
distribution centers can aid on freight consolidation. Considering the
high adoption of motorcycles for transport, transshipment solutions to
smaller vehicles should be studied.
The results allow concluding that the additional variables, Human Development Index and
percentage of taxes over services, made possible the development of a map that represents the
city better. Despite the scholarship and the life expectancy indexes included in the Human
Development Index not directly affecting urban freight transport, the share of gross national
income per capita allows an analysis of the socioeconomic distribution of the city. The
percentage of taxes over services helps understanding the economic activities developed in
São Paulo.
Including new variables does not represent a limitation in the research, since the statistical
procedures do not change. It should be noted that the main obstacle to the addition of new
variables is the data collection procedure that can be exhausting, as it requires a detailed
database.
Thus, both identified additional clusters have a feature not found in the study of Castro et al.
(2016): mixed zones, considering city areas where commercial activities are mixed with
residential areas. Alho and Silva (2015) argues about the necessity of considering specific
urban characteristics to enhance the transferability and sustainability of urban logistics
solutions, showing the importance of identifying new areas. Hence, the collection of
additional data is an opportunity for better understanding cities, providing more insights about
possible solutions for urban logistics. Additional variables can also be set according to the
purpose of the study, which allows different segmentation analysis to the city.
6 PRACTICAL APPLICATION 2: SÃO PAULO KM2 STUDY
Urban freight deliveries usually operate on a weekly schedule, serving different zones of the
city each day of the week. Therefore, according to Merchan et al. (2015), the best scale for
understanding urban freight transport is the neighborhood and/or district level. Instead of
analyzing logistics at a wider city level, smaller areas should be selected for studying and
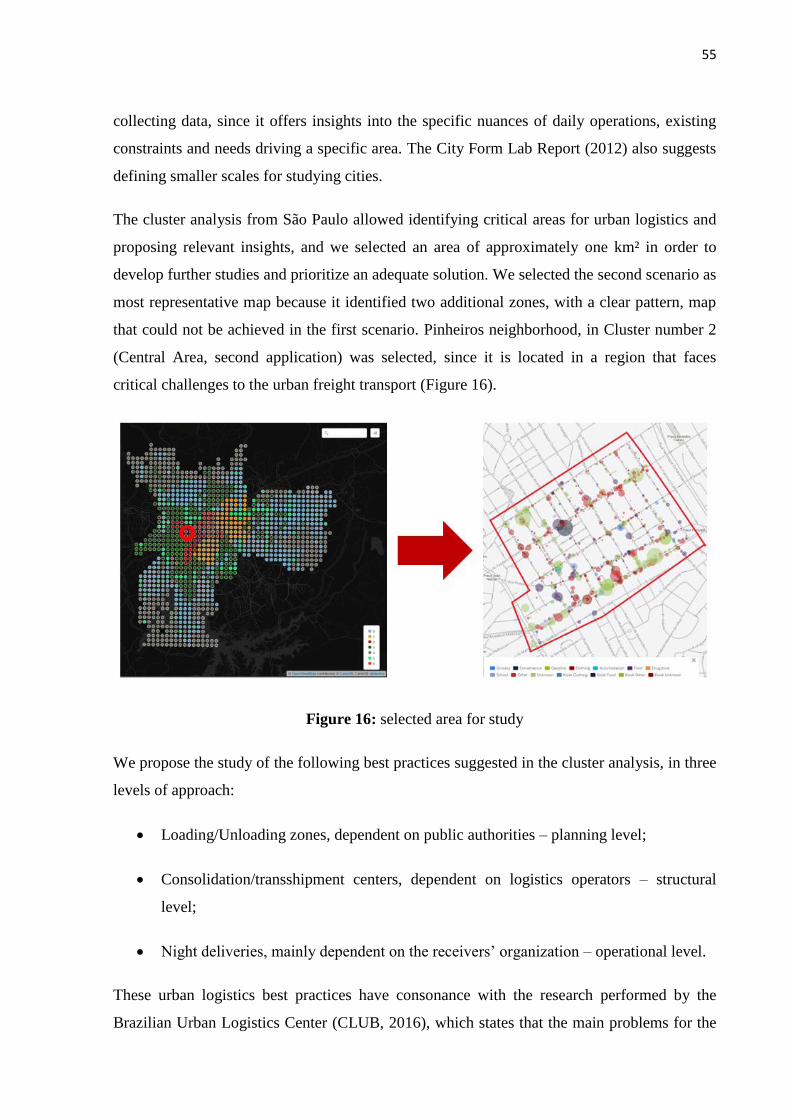
55
collecting data, since it offers insights into the specific nuances of daily operations, existing
constraints and needs driving a specific area. The City Form Lab Report (2012) also suggests
defining smaller scales for studying cities.
The cluster analysis from São Paulo allowed identifying critical areas for urban logistics and
proposing relevant insights, and we selected an area of approximately one km² in order to
develop further studies and prioritize an adequate solution. We selected the second scenario as
most representative map because it identified two additional zones, with a clear pattern, map
that could not be achieved in the first scenario. Pinheiros neighborhood, in Cluster number 2
(Central Area, second application) was selected, since it is located in a region that faces
critical challenges to the urban freight transport (Figure 16).
Figure 16: selected area for study
We propose the study of the following best practices suggested in the cluster analysis, in three
levels of approach:
Loading/Unloading zones, dependent on public authorities – planning level;
Consolidation/transshipment centers, dependent on logistics operators – structural
level;
Night deliveries, mainly dependent on the receivers’ organization – operational level.
These urban logistics best practices have consonance with the research performed by the
Brazilian Urban Logistics Center (CLUB, 2016), which states that the main problems for the
56
urban freight transport in São Paulo are related to public policies (Figure 9). Night delivery,
consolidation and transhipment centers are closely linked to public policies, while investment
in infrastructure and consolidation/transshipment centers also act on the availability of places
for loading/unloading freight. All alternatives also aim to mitigate congestion in urban freight
transport. We selected a Multi Criteria Decision Making approach for studying and
prioritizing one out of the three suggested solutions.
Since we adopted the neighborhood level for this project, it is important to highlight that the
results presented are local. In addition, the context of the analyzed district may change over
the years, and therefore we present short-term solutions for the city.
6.1 Decision Context
This study aims to apply a Multi Criteria Decision Making method, AHP, for prioritizing the
best opportunity for improving the sustainability of urban logistics activities in an area of
approximately one km², located in Pinheiros neighborhood, São Paulo. This Section helps
understanding Pinheiros urban context, and is essential to validate it as a critical zone for
urban logistics for further analysis. If the analysis did not point the site as challenging for the
urban freight transport, another area would be selected.
Pinheiros neighborhood originated as a wholesale center. It is one of the most sophisticated
regions of Sao Paulo, with large and diverse commercial network (clothes, shoes, furniture,
food and drink, banks, among others) and an intense cultural life (libraries, bookstores,
nightclubs and bars, arts fair and antiques, dance academies, among others). Pinheiros had a
fast development after the Independence of Brazil, and factors to this development are the
construction of a tramway car reaching the district center and the inauguration of the
Municipal Market of Pinheiros (Prefecture of São Paulo, 2015). Nearby neighborhoods
include “Jardins” and “Vila Madalena”. Jardins and Vila Madalena are noble areas of São
Paulo. Jardins stands out for the quantity and quality of the services and commerce present,
while Vila Madalena has plenty of establishments for leisure and entertainment.
The atlas proposed by Merchan et al. (2015) contains information on the distribution of
commercial establishments in the region, as well as information on deliveries and location of
delivery bays (http://lastmile.mit.edu/km2). The two sectors with the highest commercial

57
establishments’ concentration are Food (13.98%) and Clothing (10.07%). Pinheiros
neighborhood has some establishments with large areas such as gas stations, supermarket and
gallery. It has 13.11 kilometers of parking lanes extension, with only seven specific areas for
loading and unloading freight (total length of 301.85 meters).
When analyzed to other neighborhoods, from other megacities, the solutions proposed by the
cluster analysis show synergy with the Atlas proposed by Merchan et al. (2015) (Table 9).
The studied area in Madrid, for example, has a similar concentration of stores per km², but
approximately three times more space for dedicated loading/unloading zones. The adoption of
a satellite platform would also benefit São Paulo’s studied area, since the space for parking
smaller vehicles is much larger (11.13 km of regular parking lanes). Figure 17 shows a traffic
count in a specific street from Pinheiros neighborhood, confirming the smaller traffic of
vehicles during the evening, which confirms the opportunity of adopting night deliveries for
increasing the operation efficiency of the last mile delivery. Figure 18 also confirms the
smaller disruption of traffic in operations that avoid peak hours of traffic.
Pinheiros neighborhood also presents a high concentration of nanostores. Blanco and Fransoo
(2013) studied the features of this retail activity, and classified nanostores as having less than
15 square meters of store, among other characteristics. According to a survey conducted at
Pinheiros, approximately 25% of the commercial establishments of the studied area have less
than 4 meters of front length, which indicates to the presence of nanostores. Blanco and
Fransoo (2013) state that the physical distribution of goods to this type of stores is much more
complex. The number of delivery points is larger, with smaller drop sizes, since nanostores do
not have space to stock large quantities of freight, which leads to more frequent deliveries.
Table 9: São Paulo compared to other megacities (Merchan et al., 2015)
Loading/Unloading areas
Density
(pop/km²) Stores/km² Public (mts)
Dedicated (mts)
São Paulo 7.7k 1.38k 11.13k 301.85
Santiago 9.5k 1.8k 415 360
Rio de Janeiro 5.3k 2.62k 1.86k 260
Mexico City 5.9k 2.58k 584 0
Madrid 5.4k 1.42k 10.74k 1.17k
Kuala Lumpur 6.4k 585 1.87k 47.68
Bogotá 1.6k 733 5.8k 5.8k
Beijing 11.5k 836 12.23k 0

58
Figure 17: Traffic count in specific street of Pinheiros neighborhood, São Paulo. Source:
http://lastmile.mit.edu/km2/show/brazil/sao-paulo/sao-paulo
Figure 18: Deliveries disruption in specific street of Pinheiros neighborhood, São Paulo.
Source: http://lastmile.mit.edu/km2/show/brazil/sao-paulo/sao-paulo
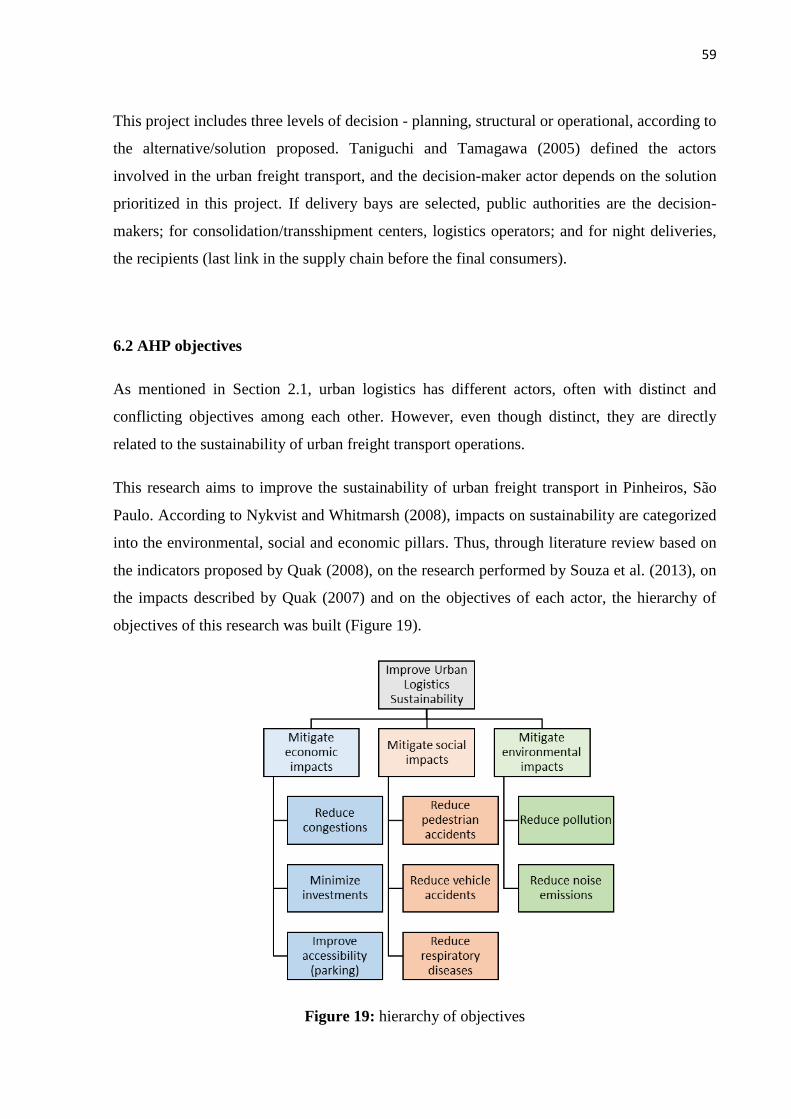
59
This project includes three levels of decision - planning, structural or operational, according to
the alternative/solution proposed. Taniguchi and Tamagawa (2005) defined the actors
involved in the urban freight transport, and the decision-maker actor depends on the solution
prioritized in this project. If delivery bays are selected, public authorities are the decision-
makers; for consolidation/transshipment centers, logistics operators; and for night deliveries,
the recipients (last link in the supply chain before the final consumers).
6.2 AHP objectives
As mentioned in Section 2.1, urban logistics has different actors, often with distinct and
conflicting objectives among each other. However, even though distinct, they are directly
related to the sustainability of urban freight transport operations.
This research aims to improve the sustainability of urban freight transport in Pinheiros, São
Paulo. According to Nykvist and Whitmarsh (2008), impacts on sustainability are categorized
into the environmental, social and economic pillars. Thus, through literature review based on
the indicators proposed by Quak (2008), on the research performed by Souza et al. (2013), on
the impacts described by Quak (2007) and on the objectives of each actor, the hierarchy of
objectives of this research was built (Figure 19).
Figure 19: hierarchy of objectives
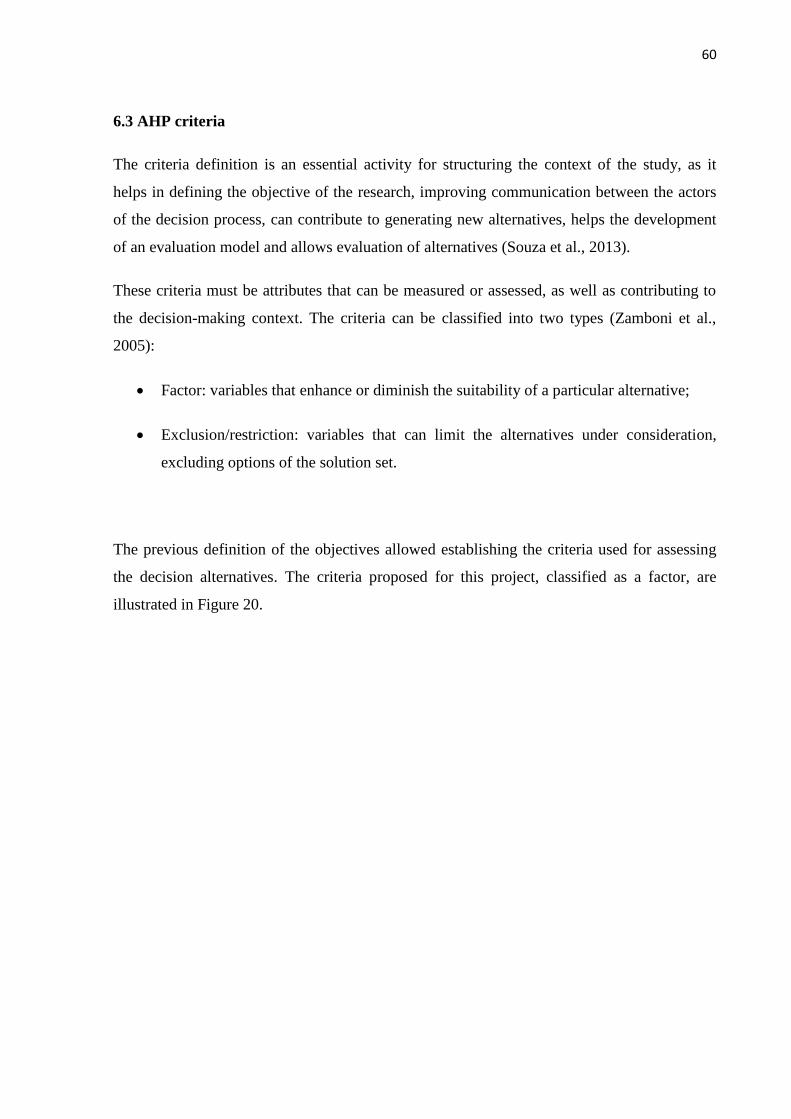
60
6.3 AHP criteria
The criteria definition is an essential activity for structuring the context of the study, as it
helps in defining the objective of the research, improving communication between the actors
of the decision process, can contribute to generating new alternatives, helps the development
of an evaluation model and allows evaluation of alternatives (Souza et al., 2013).
These criteria must be attributes that can be measured or assessed, as well as contributing to
the decision-making context. The criteria can be classified into two types (Zamboni et al.,
2005):
Factor: variables that enhance or diminish the suitability of a particular alternative;
Exclusion/restriction: variables that can limit the alternatives under consideration,
excluding options of the solution set.
The previous definition of the objectives allowed establishing the criteria used for assessing
the decision alternatives. The criteria proposed for this project, classified as a factor, are
illustrated in Figure 20.
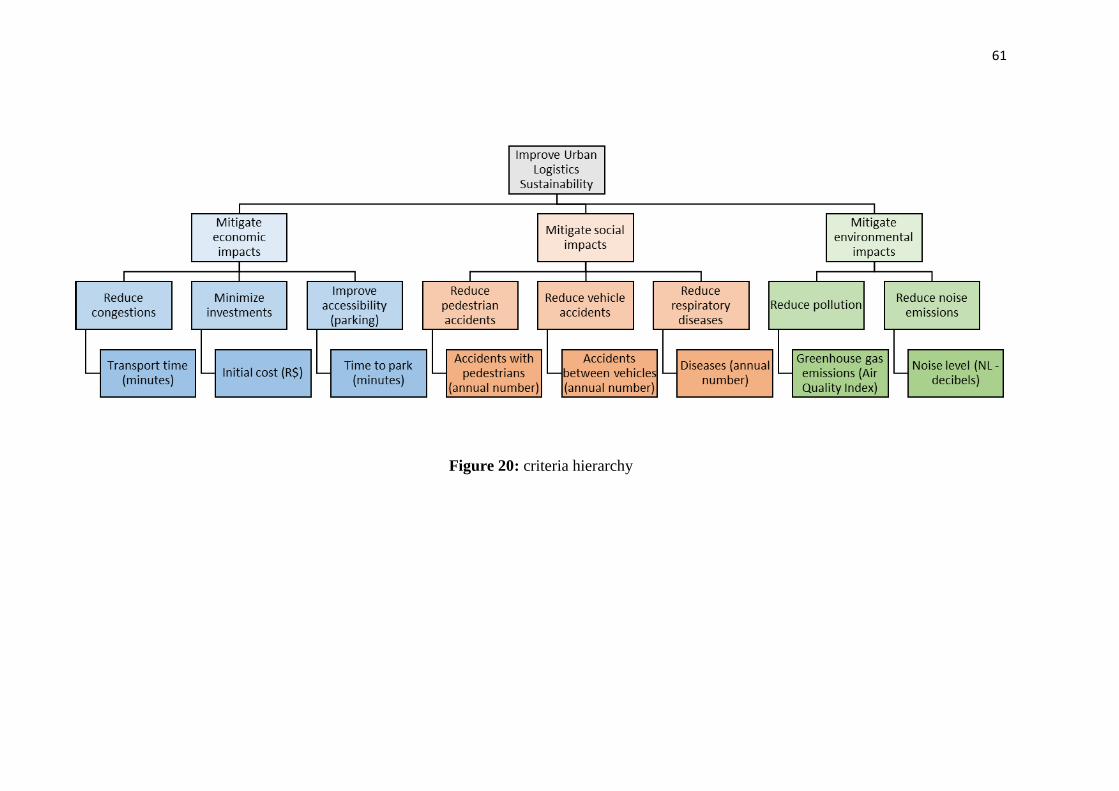
61
Figure 20: criteria hierarchy
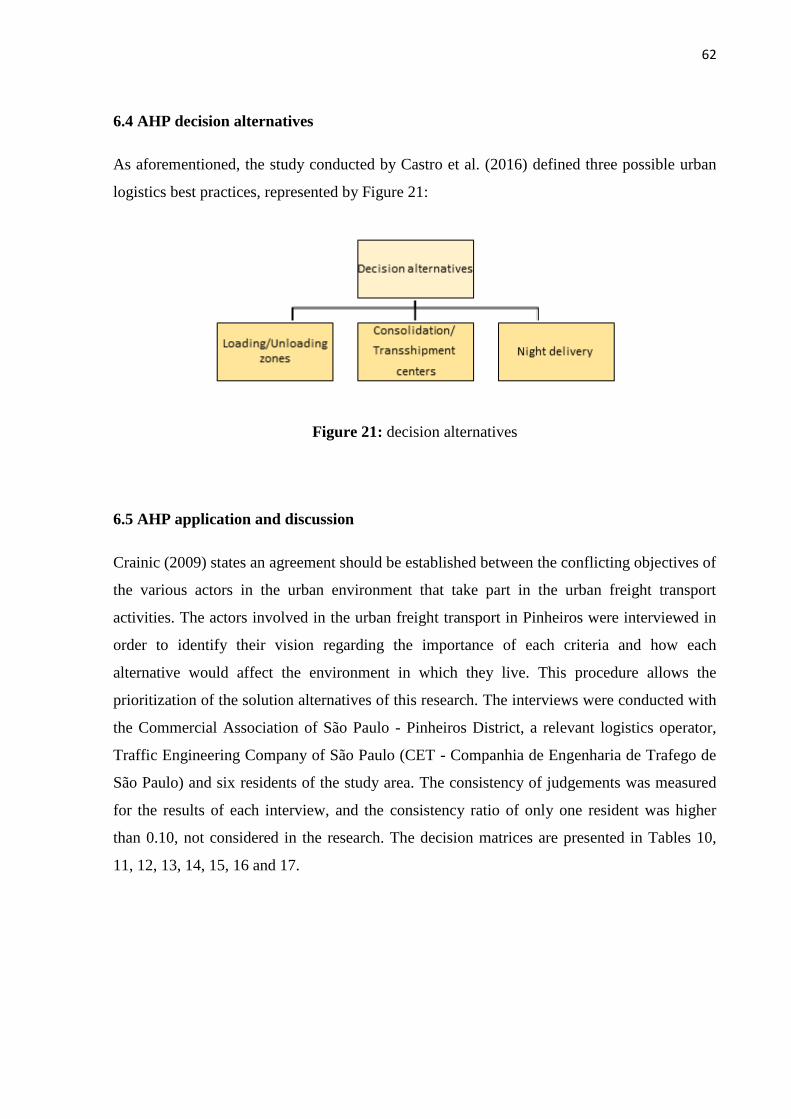
62
6.4 AHP decision alternatives
As aforementioned, the study conducted by Castro et al. (2016) defined three possible urban
logistics best practices, represented by Figure 21:
Figure 21: decision alternatives
6.5 AHP application and discussion
Crainic (2009) states an agreement should be established between the conflicting objectives of
the various actors in the urban environment that take part in the urban freight transport
activities. The actors involved in the urban freight transport in Pinheiros were interviewed in
order to identify their vision regarding the importance of each criteria and how each
alternative would affect the environment in which they live. This procedure allows the
prioritization of the solution alternatives of this research. The interviews were conducted with
the Commercial Association of São Paulo - Pinheiros District, a relevant logistics operator,
Traffic Engineering Company of São Paulo (CET - Companhia de Engenharia de Trafego de
São Paulo) and six residents of the study area. The consistency of judgements was measured
for the results of each interview, and the consistency ratio of only one resident was higher
than 0.10, not considered in the research. The decision matrices are presented in Tables 10,
11, 12, 13, 14, 15, 16 and 17.

63
Table 10: AHP Results – Pinheiros Commercial Association
Congest. Investment Accessibility Pedestrian acc. Vehicles acc. Diseases Pollutants Noise
0.234 0.065 0.701 0.485 0.323 0.192 0.500 0.500
A1: LOADING/UNLOADING ZONES 0.083 0.633 0.106 0.333 0.333 0.143 0.143 0.429 0.239
A2: TRANSSHIPMENT CENTER 0.193 0.106 0.260 0.333 0.333 0.714 0.714 0.429 0.404
A3: NIGHT DELIVERY 0.724 0.260 0.633 0.333 0.333 0.143 0.143 0.143 0.357
Criteria/Alternatives
Economic Impacts Social Impacts Environmental Impacts
Priority0.333 0.333 0.333
Table 11: AHP Results – Logistics operator (DHL)
Congest. Investment Accessibility Pedestrian acc. Vehicles acc. Diseases Pollutants Noise
0.333 0.333 0.333 0.333 0.333 0.333 0.500 0.500
A1: LOADING/UNLOADING ZONES 0.078 0.619 0.083 0.333 0.333 0.083 0.083 0.455 0.260
A2: TRANSSHIPMENT CENTER 0.234 0.096 0.193 0.333 0.333 0.724 0.724 0.455 0.409
A3: NIGHT DELIVERY 0.688 0.284 0.724 0.333 0.333 0.193 0.193 0.091 0.331
Criteria/Alternatives
Economic Impacts Social Impacts Environmental Impacts
Priority0.333 0.333 0.333
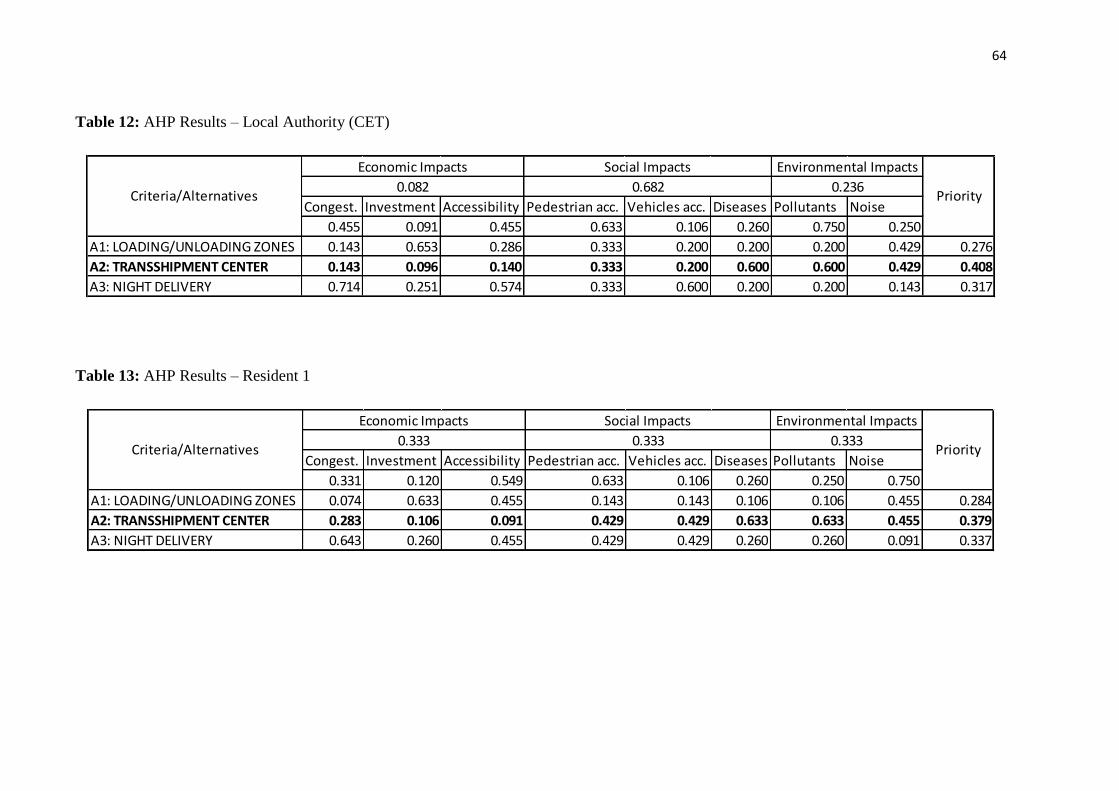
64
Table 12: AHP Results – Local Authority (CET)
Congest. Investment Accessibility Pedestrian acc. Vehicles acc. Diseases Pollutants Noise
0.455 0.091 0.455 0.633 0.106 0.260 0.750 0.250
A1: LOADING/UNLOADING ZONES 0.143 0.653 0.286 0.333 0.200 0.200 0.200 0.429 0.276
A2: TRANSSHIPMENT CENTER 0.143 0.096 0.140 0.333 0.200 0.600 0.600 0.429 0.408
A3: NIGHT DELIVERY 0.714 0.251 0.574 0.333 0.600 0.200 0.200 0.143 0.317
Priority0.082 0.682 0.236
Criteria/Alternatives
Economic Impacts Social Impacts Environmental Impacts
Table 13: AHP Results – Resident 1
Congest. Investment Accessibility Pedestrian acc. Vehicles acc. Diseases Pollutants Noise
0.331 0.120 0.549 0.633 0.106 0.260 0.250 0.750
A1: LOADING/UNLOADING ZONES 0.074 0.633 0.455 0.143 0.143 0.106 0.106 0.455 0.284
A2: TRANSSHIPMENT CENTER 0.283 0.106 0.091 0.429 0.429 0.633 0.633 0.455 0.379
A3: NIGHT DELIVERY 0.643 0.260 0.455 0.429 0.429 0.260 0.260 0.091 0.337
Criteria/Alternatives
Economic Impacts Social Impacts Environmental Impacts
Priority0.333 0.333 0.333
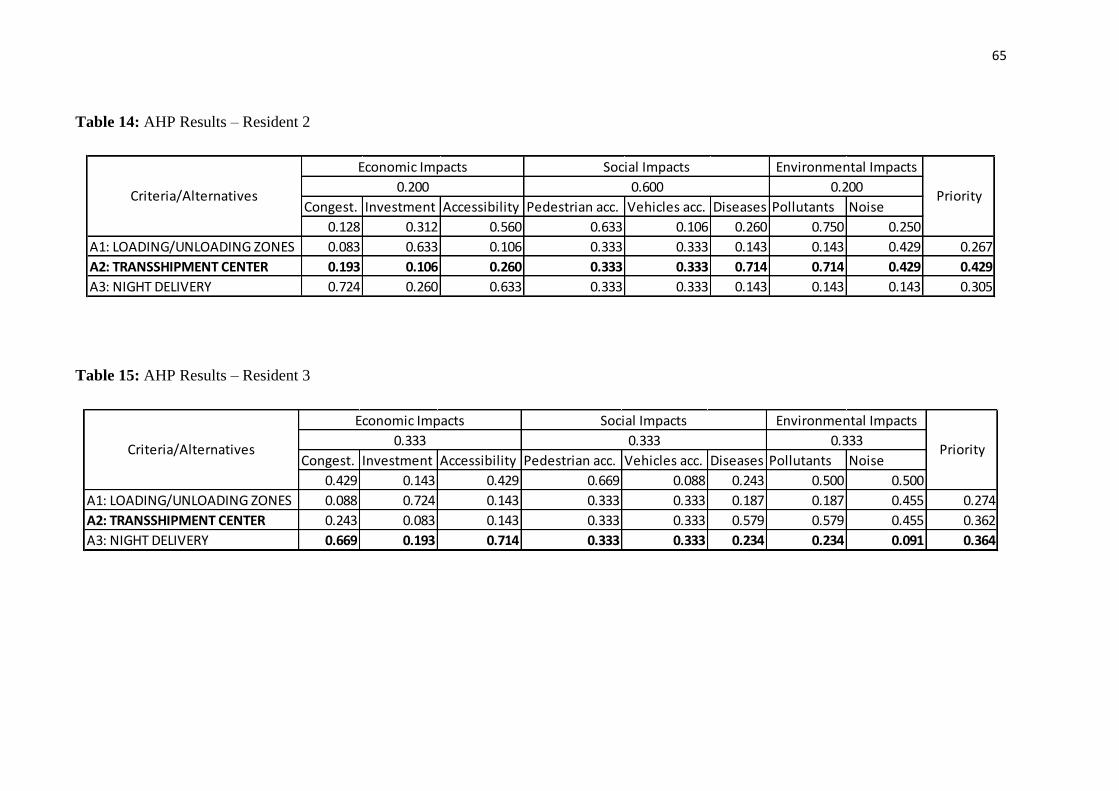
65
Table 14: AHP Results – Resident 2
Congest. Investment Accessibility Pedestrian acc. Vehicles acc. Diseases Pollutants Noise
0.128 0.312 0.560 0.633 0.106 0.260 0.750 0.250
A1: LOADING/UNLOADING ZONES 0.083 0.633 0.106 0.333 0.333 0.143 0.143 0.429 0.267
A2: TRANSSHIPMENT CENTER 0.193 0.106 0.260 0.333 0.333 0.714 0.714 0.429 0.429
A3: NIGHT DELIVERY 0.724 0.260 0.633 0.333 0.333 0.143 0.143 0.143 0.305
Criteria/Alternatives
Economic Impacts Social Impacts Environmental Impacts
Priority0.200 0.600 0.200
Table 15: AHP Results – Resident 3
Congest. Investment Accessibility Pedestrian acc. Vehicles acc. Diseases Pollutants Noise
0.429 0.143 0.429 0.669 0.088 0.243 0.500 0.500
A1: LOADING/UNLOADING ZONES 0.088 0.724 0.143 0.333 0.333 0.187 0.187 0.455 0.274
A2: TRANSSHIPMENT CENTER 0.243 0.083 0.143 0.333 0.333 0.579 0.579 0.455 0.362
A3: NIGHT DELIVERY 0.669 0.193 0.714 0.333 0.333 0.234 0.234 0.091 0.364
Criteria/Alternatives
Economic Impacts Social Impacts Environmental Impacts
Priority0.333 0.333 0.333
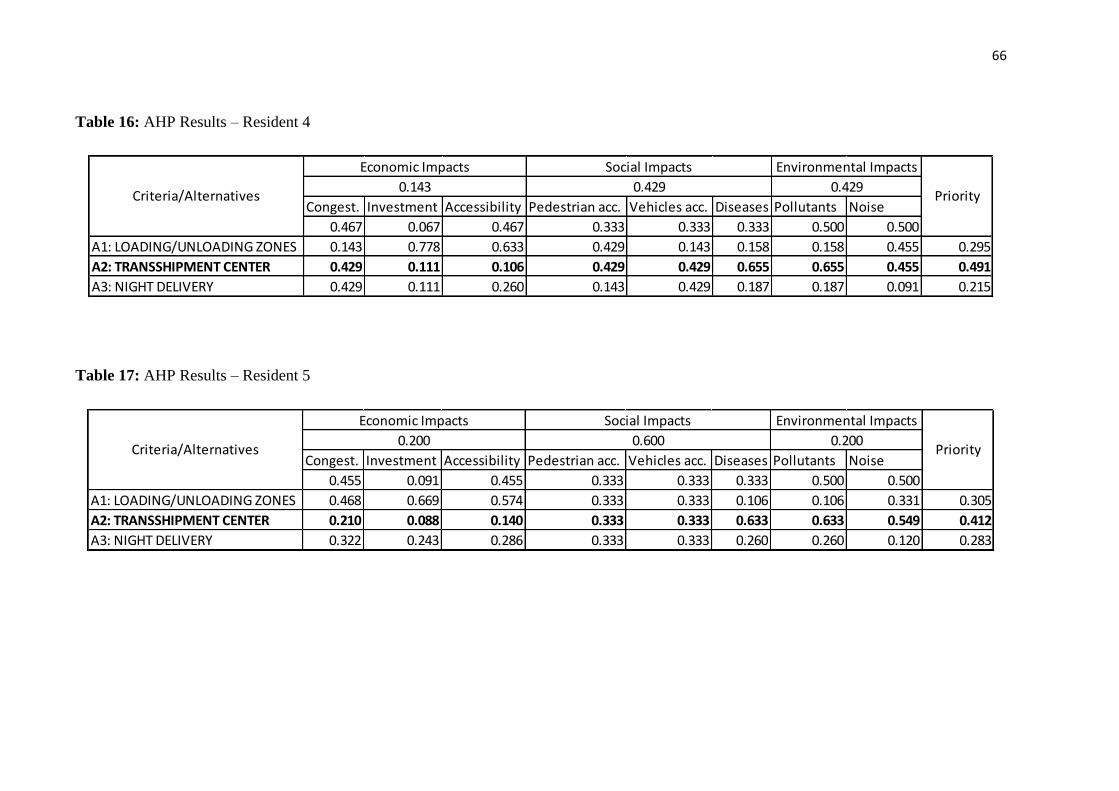
66
Table 16: AHP Results – Resident 4
Congest. Investment Accessibility Pedestrian acc. Vehicles acc. Diseases Pollutants Noise
0.467 0.067 0.467 0.333 0.333 0.333 0.500 0.500
A1: LOADING/UNLOADING ZONES 0.143 0.778 0.633 0.429 0.143 0.158 0.158 0.455 0.295
A2: TRANSSHIPMENT CENTER 0.429 0.111 0.106 0.429 0.429 0.655 0.655 0.455 0.491
A3: NIGHT DELIVERY 0.429 0.111 0.260 0.143 0.429 0.187 0.187 0.091 0.215
Criteria/Alternatives
Economic Impacts Social Impacts Environmental Impacts
Priority0.143 0.429 0.429
Table 17: AHP Results – Resident 5
Congest. Investment Accessibility Pedestrian acc. Vehicles acc. Diseases Pollutants Noise
0.455 0.091 0.455 0.333 0.333 0.333 0.500 0.500
A1: LOADING/UNLOADING ZONES 0.468 0.669 0.574 0.333 0.333 0.106 0.106 0.331 0.305
A2: TRANSSHIPMENT CENTER 0.210 0.088 0.140 0.333 0.333 0.633 0.633 0.549 0.412
A3: NIGHT DELIVERY 0.322 0.243 0.286 0.333 0.333 0.260 0.260 0.120 0.283
Criteria/Alternatives
Economic Impacts Social Impacts Environmental Impacts
Priority0.200 0.600 0.200

67
The data presents a large consonance and suggests that the implementation of
consolidation/transshipment centers, in the view of most respondents, would improve more
effectively the sustainability of the urban freight transport at Pinheiros, São Paulo. The result
of only one resident points to another solution, night delivery. However, the priority of this
resident for night deliveries is very close to consolidation/transshipment centers, with values
of 36.4% and 36.2% respectively.
We compiled the residents’ results according to the guidelines suggested by Saaty (2008) in
order to elaborate only one decision matrix for each stakeholder group involved in the
research. According to the author, the use of the geometric mean is the most appropriate
procedure. We consolidated the priorities perceived by residents regarding the decision
alternatives in Table 18. Delivery bays and night delivery present similar values, whereas
consolidation/transshipment centers have a larger priority, 41.2%.
Table 18: Residents’ decision alternatives priority.
RESIDENTS – DECISION ALTERNATIVES PRIORITIES
A1: LOADING/UNLOADING ZONES 0.284
A2: TRANSSHIPMENT CENTER 0.412
A3: NIGHT DELIVERY 0.296
According to Saaty (2008), there are two options for group decision making: to aggregate
individual judgments and generate only one result for the group, or to build the decision from
the individual results. This second option can be held with experts, such as the case of this
research in which the stakeholders are directly inserted into the study environment and
impacted by the urban freight transport. The priorities of the decision alternatives to improve
sustainability in urban logistics are presented in Table 19. Table 20 also shows the relative
importance of each impact - economic, social and environmental - for each stakeholder
group.
Table 19: Alternative decision priorities for each stakeholder group.
DECISION ALTERNATIVES COMMERCIAL ASSOCIATION
LOGISTICS OPERATOR
CET RESIDENTS GEOMETRIC
MEAN
A1: LOADING/UNLOADING ZONES 0.239 0.260 0.276 0.284 0.264
A2: TRANSSHIPMENT CENTER 0.404 0.409 0.408 0.412 0.408
A3: NIGHT DELIVERY 0.357 0.331 0.317 0.296 0.324

68
Table 20: Economic, social and environmental impacts’ priorities.
SUSTAINABILITY COMMERCIAL ASSOCIATION
LOGISTICS OPERATOR
CET RESIDENTS
ECONOMIC IMPACTS 0.333 0.333 0.082 0.229
SOCIAL IMPACTS 0.333 0.333 0.682 0.443
ENVIRONMENTAL IMPACTS 0.333 0.333 0.236 0.286
Table 19 confirms the consonance in the results, in which the implementation of
consolidation/transshipment centers is the best alternative to increase the sustainability of
urban logistics, according to the answers of the stakeholders directly involved and impacted
by the urban freight transport. It may be noted that for residents and public authorities,
represented by the CET, the social impacts are the most significant to be mitigated. The
logistics operator and Pinheiros District Commercial Association, on the other hand,
classified the economic, social and environmental impacts with the same importance. This
can be explained by the fact that they are private institutions, with profit operations being
essential. The priorities of the criteria for economic, social and environmental impacts are
presented in Tables 21, 22 and 23.
Table 21: Priority of economic impacts.
ECONOMIC IMPACTS COMMERCIAL ASSOCIATION
LOGISTICS OPERATOR
CET RESIDENTS
Congestion 0.234 0.333 0.455 0.329
Investment 0.065 0.333 0.091 0.126
Accessibility 0.701 0.333 0.455 0.489
Table 22: Priority of social impacts.
SOCIAL IMPACTS COMMERCIAL ASSOCIATION
LOGISTICS OPERATOR
CET RESIDENTS
Pedestrian accidents 0.485 0.333 0.633 0.495
Vehicle accidents 0.323 0.333 0.106 0.162
Respiratory diseases 0.192 0.333 0.260 0.284

69
Table 23: Priority of environmental impacts.
ENVIRONMENTAL IMPACTS COMMERCIAL ASSOCIATION
LOGISTICS OPERATOR
CET RESIDENTS
Pollutants 0.5 0.5 0.75 0.472
Noise 0.5 0.5 0.25 0.472
There is an agreement in terms of the necessity of improving the accessibility at Pinheiros,
São Paulo. The criteria with less importance, except to the logistics operator, is the
investment to implement the solution. This difference in values can be explained by the fact
that the logistics operator is the most affected stakeholder with regard to investments in the
case of the studied solutions. Night deliveries require investments in equipment to reduce
noise and satellite platforms require investments in new vehicles (motorcycles or vans).
In the matter of social impacts, pedestrian accidents is more important, whereas vehicle
accidents and respiratory diseases present balanced values. Pollutant and noise emissions
have the same importance for the stakeholders, except to the public authorities (CET), who
argues that mitigation in greenhouse gas emissions must be a priority.
The social impacts, as aforementioned, present in average a higher importance to the
stakeholders group. However, there is a balance in the performance of the solutions in
accidents with pedestrians and vehicles without an alternative especially for the mitigation of
these impacts. Moreover, there is a perception among stakeholders that the
consolidation/transshipment centers have a competitive advantage in the social impacts
(respiratory diseases) and thus in the overall context analyzed, since they withdraw heavy
vehicles from urban centers, major emitters of NOx and particulate matter. This alternative
also presents relatively high values for mitigating the environmental impacts, noise and
pollutants emissions. Night delivery presents on average greater relative values for the
economic impacts (congestion and accessibility), as well as delivery bays, with smaller
investments for implementation.
We conclude that, despite night delivery presents possibilities of efficient operations, being
economically advantageous and widely exploited in the international literature as effective
urban logistics solution, satellite platforms are more consistent with the Brazilian context at
Pinheiros, São Paulo. The social and environmental improvement that this solution can
provide for the urban freight transport is decisive to its prioritization. In addition, security is a
70
major barrier for night deliveries, especially for developing countries, the case of Brazil.
Besides, the cost per square kilometer in urban centers of developed countries is higher than
the cost of emerging countries, barrier to the implementation of satellite platforms.
6.6 Report on Satellite Platforms, Night Deliveries and Delivery Bays
The Sections below present a report on each best practice studied for the analysed context,
Pinheiros neighbourhood – São Paulo. It is important to state that the best practices studied
consist of short-term solutions, without considering external factors, such as Rodoanel
(roadway that encircles São Paulo) and São Paulo’s O/D matrix.
6.6.1 Consolidation/transshipment centers – Satellite Platforms
Crainic (2004) states that significant gains in urban freight transport can only be achieved
through a rationalization of distribution activities involving freight consolidation from
different shippers and carriers as well as through the co-ordination of operations at the city
level. According to the author, such approaches are essential in central areas.
Satellite Platforms are locations where freight is transshipped from normal trucks to smaller
vehicles for the last mile delivery. Satellites offer no storage facilities, with trans-dock
transshipment being the operational model. The operation requires real-time co-ordination,
control, and dispatch of trucks and city-freighters (Boudoin et al., 2013; Crainic, 2004).
The use of Satellite Platforms for the distribution of goods in urban centers can help reducing
congestions. According to Castro et al. (2015), the implementation of Satellite Platforms in
central zones allow reducing the number of trucks that travel in this area and thus possible
congestions. Delivery with smaller vehicles, especially motorcycles, minimize the difficulty
of finding loading and unloading spaces, one of the biggest challenges urban freight transport
faces. Dense urban areas need smaller vehicles to transport freight, which can also contribute
to lower pollutants and noise emissions. (Crainic et al., 2004). The emission of NOx and
particulate matter, the main cause of negative impacts on the health of the population, is
predominant in heavy vehicles (CETESB, 2011). The presence of nanostores in Pinheiros
neighbourhood, mentioned above, is an opportunity to the use of smaller vehicles for the last
mile delivery, since they have smaller orders that could be transported on motorcycles.

71
The implementation of Satellite Platforms depends not only on the support of public
authorities, but relies also on efficient planning for agile transhipment operations and hence
the optimization of the Satellite Platform. Investments on adequate last mile delivery vehicles
are also required. This solution can be further enhanced with cooperation between shippers,
according to the type and quantity of goods, which can further optimize the occupation of the
vehicle and reduce their numbers (Loureiro et al., 2015; Muñuzuri et al., 2005).
Dias and Garcia (2015) studied important characteristics for the implementation of Satellite
Platforms in central areas, shown in Figure 22.
Logistics practice Adoption of new Technologies
Consolidation points with transshipment. Routing software.
Order and truck loading programming.
Tracked vehicles via GPRS.
Freight chests for custom motorcycles.
Sustainability Public Policies and Governance
Fewer heavy vehicles on the streets, with a
reduction in emissions (especially NOx and
particulate matter) and in traffic.
Definition of the Satellite Platforms locations
(land use).
Definition of access routes to the Satellite
Platforms.
Coordination of the use of the Satellite
Platforms.
Incentive for the use of clean vehicles.
Implementation Difficulties Business Model and Economic Viability
Government, local residents and retailers
support.
Investment in appropriate technologies.
Private sector: fixed and variable operation cost
reductions and possible gains from improving
the service level versus investment in
technology, with additional transshipment costs.
Public sector: reduction in roads saturation and
in pollution, supplying the city center.
Figure 22: important characteristics for Satellite Platforms. Source: Dias and Garcia (2015).
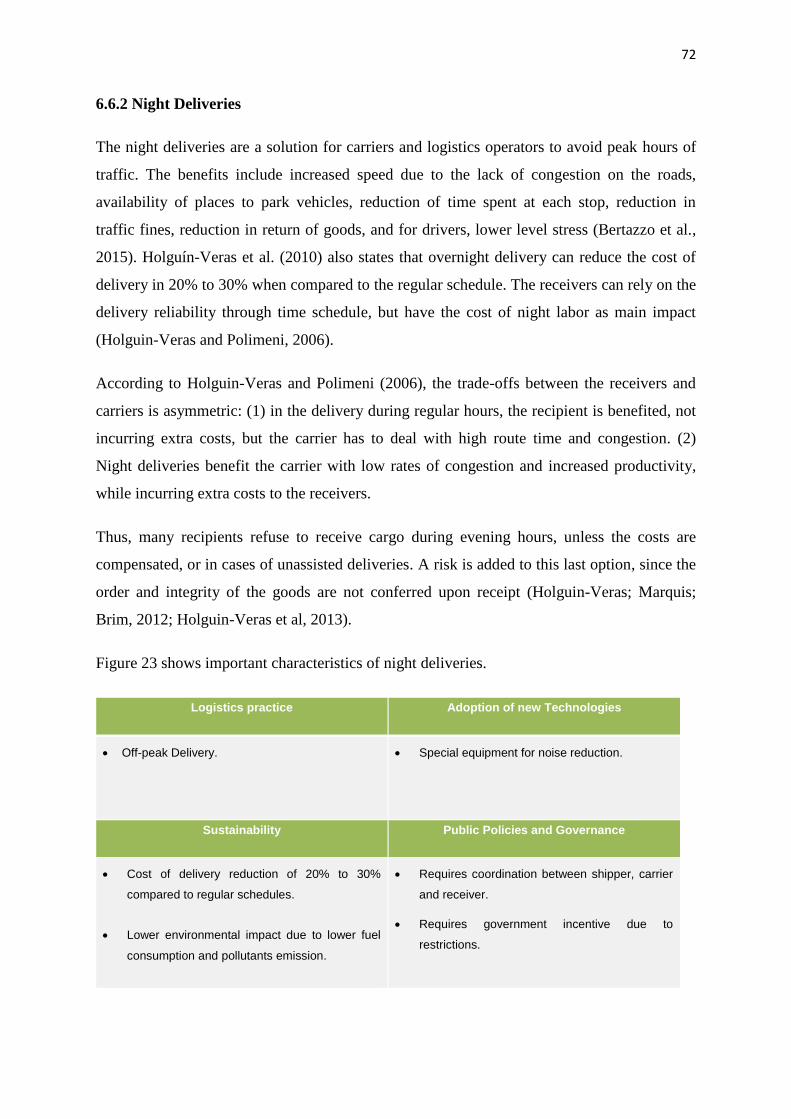
72
6.6.2 Night Deliveries
The night deliveries are a solution for carriers and logistics operators to avoid peak hours of
traffic. The benefits include increased speed due to the lack of congestion on the roads,
availability of places to park vehicles, reduction of time spent at each stop, reduction in
traffic fines, reduction in return of goods, and for drivers, lower level stress (Bertazzo et al.,
2015). Holguín-Veras et al. (2010) also states that overnight delivery can reduce the cost of
delivery in 20% to 30% when compared to the regular schedule. The receivers can rely on the
delivery reliability through time schedule, but have the cost of night labor as main impact
(Holguin-Veras and Polimeni, 2006).
According to Holguin-Veras and Polimeni (2006), the trade-offs between the receivers and
carriers is asymmetric: (1) in the delivery during regular hours, the recipient is benefited, not
incurring extra costs, but the carrier has to deal with high route time and congestion. (2)
Night deliveries benefit the carrier with low rates of congestion and increased productivity,
while incurring extra costs to the receivers.
Thus, many recipients refuse to receive cargo during evening hours, unless the costs are
compensated, or in cases of unassisted deliveries. A risk is added to this last option, since the
order and integrity of the goods are not conferred upon receipt (Holguin-Veras; Marquis;
Brim, 2012; Holguin-Veras et al, 2013).
Figure 23 shows important characteristics of night deliveries.
Logistics practice Adoption of new Technologies
Off-peak Delivery. Special equipment for noise reduction.
Sustainability Public Policies and Governance
Cost of delivery reduction of 20% to 30%
compared to regular schedules.
Lower environmental impact due to lower fuel
consumption and pollutants emission.
Requires coordination between shipper, carrier
and receiver.
Requires government incentive due to
restrictions.

73
Implementation Difficulties Business Model and Economic Viability
Establishments open at night.
Investment in equipment for noise reduction.
Increased security costs.
Private sector: operation cost reductions versus
initial investments to adapt vehicles and
additional security costs.
Public Sector: congestion reduction and
increased accessibility at peak times, as well as
lower greenhouse gas emissions due to greater
operation efficiency.
Figure 23: important characteristics for night deliveries.
6.6.3 Delivery Bays
The implementation and management of loading/unloading spaces for delivery vehicles is an
essential issue in busy urban areas. When its provision is not adequate, delivery vehicles
often park in active traffic lanes, negatively impacting road capacity and safety. Passenger
cars occupying delivery bays is also an important issue to consider when studying urban
logistics. In addition, the lack of delivery bays impact cost and service of freight carriers
operations in cities. Drivers are forced to search for vacant spaces if no vacant spaces exist at
the desired location (Aiura and Taniguchi, 2005).
According to Allen et al. (2000), a study conducted in London and Norwick showed drivers
spend 87% of the total travel time searching for a loading/unloading zone, parking the vehicle
and finally delivering the freight. Oliveira et al. (2011) still states, in a research conducted in
Belo Horizonte/MG, that 45% of the loading/unloading zones are occupied by passenger
vehicles, which makes them inoperative for urban freight distribution.
A survey conducted at Kyoto city showed that more than 85% of drivers surveyed performed
on-street loading-unloading routinely, whereas more than 50% of the loading-unloading
operations were done in a one-way street or a road with one lane in each direction that tends
to cause a traffic jam due to blocking of a car lane. . In addition, parking spaces used by
passenger cars represents approximately 54%, while parking spaces used by pickup-delivery
vehicles represents approximately 22%. The author of this survey developed a model in order
to determine the optimal location of loading-unloading spaces by minimizing the total cost
that is comprised of delay penalty, fixed cost, operation cost, parking fee and waiting cost of

74
both pickup-delivery vehicles as well passenger cars. Using a test road network the model
developed by the authors was able to determine a configuration of parking spaces that
achieved a cost reduction of approximately 16%. (Aiura and Taniguchi, 2005).
Logistics practice Adoption of new Technologies
Loading/Unloading. Model for optimizing location of delivery bays.
Sustainability Public Policies and Governance
Possibility of achieviing cost reduction (16% for
Aiura and Taniguchi (2005) research).
Less polutants emission due to lower time
searching for delivery bay.
Less congestion avoiding on-street deliveries.
Location definition and implementation of
delivery bay sites by public authorities.
Implementation Difficulties Business Model and Economic Viability
Use of loading/unloading zones by passenger
cars (45% for Oliveira et al. (2011) and 54% for
Aiura and Taniguchi (2005)).
Private sector: reduction in operational costs
and increase in service level.
Public sector: reduction in congestions due to
lower on-street deliveries and lower time
searching for a delivery bay, besides lesser
pollutants emission because of increased
efficiency of the operation.
Figure 24: important characteristics for delivery bays.
7 CONCLUSIONS AND FUTURE WORK
This research presents a cluster-based data-driven methodology applied in São Paulo city, in
order to identify urban clusters related to city logistics and select a critical area to be studied.
Based on the results, we can conclude the quantitative methodology is efficient to analyze
urban centers, since the provided clusters are a good representation of the city with important

75
insights for studying freight mobility. Further studies were conducted focusing on evaluating
the feasibility of the proposed solutions to the selected critical area, by involving the
stakeholders and applying a multi criteria decision tool, the AHP. The scale adopted in this
second practical application of the project, at the neighborhood level (Pinheiros, São Paulo),
allowed the development of insights into the specific nuances of daily operations, existing
constraints and needs driving a specific area. This results confirm the statement of Merchan
et al. (2015) adopted in this research, who argue the neighborhood or district level are the
most appropriate for studying the last mile delivery. The involvement of the stakeholders in
the project still provided the opportunity of better understanding the Brazilian and
Pinheiros/São Paulo context regarding urban freight transport, essential to ensure the
transferability of the urban and city logistics best practices developed in the international
literature and to avoid conflict of interests between the actors when implementing a solution.
Furthermore, the integration of quantitative and qualitative methods presents as a great
opportunity of research. We integrated a data driven methodology, the cluster analysis, with a
qualitative tool, interviews, in order to select a critical area of the city and understand the
specificities of the site to propose an adequate urban logistics best practice. Bryman (2006)
states that there are relatively few guidelines about how, when, and why the integration of
method should occur. Greene (2008) also argues that integrated mixed methods analysis has
not yet cohered into a widely accepted framework. Besides, Maxwell and Loomis (2003)
confirm the complexity of actually integrating qualitative and quantitative approaches in any
particular field of study. This leads to the opportunity of further studies into the development
of a framework on how to integrate these methods when addressing urban logistics issues.
The integration of other qualitative or quantitative methods, such as survey or focus groups,
should also be further explored.
The results of this research will be compiled and delivered to the involved stakeholders in a
report. The report includes information regarding the characteristics of the selected cluster,
that includes Pinheiros neighborhood, a summary of the results of the AHP application, with
the most important impacts to be mitigated and the most appropriate solution to be
implemented according to the stakeholders, as well as a short report concerning the three
studied urban logistics best practices.

76
Bibliographic references
Aiura, N., Taniguchi, E. PLANNING ON-STREET LOADING-UNLOADING SPACES
CONSIDERING THE BEHAVIOUR OF PICKUP-DELIVERY VEHICLES. Journal of the
Eastern Asia Society for Transportation Studies, Vol. 6, pp. 2963 - 2974, 2005.
Alho, A. R., & Silva, J. A. Utilizing urban form characteristics in urban logistics analysis: a
case study in Lisbon, Portugal. Journal of Transport Geography 42, 57 – 71, 2015.
Allen, J. Anderson, S.; Browne, M.; Jones, P. (2000) A framework for considering policies to
encourage sustainable urban freight traffic and goods/services flows. Report 2: Current goods
and service operations in urban areas. University of Westminster, Transport Studies Group,
London, England.
Allen, J., Thorne, G., Browne, M. (2007). Good Practice Guide on Urban Freight Transport -
BESTUFS
Allen, J., Browne, M. (2008). Review of Survey Techniques Used in Urban Freight Studies.
Report produced as part of the Green Logistics Project: Work Module 9 (Urban Freight
Transport), London, U.K., http://www.greenlogistics.org.
Allen, J., Browne, M., Cherrett, T. Investigating relationships between road freight transport,
facility location, logistics management and urban form. Journal of Transport Geography 24,
45–57, 2012.
Allen, J., Browne, M. W., & Leonardi, J. (2012). The Role of Urban Consolidation Centers in
Sustainable Freight Transport. Transport Reviews, 32(4), 473-490.
Anderson, S., Allen, J., Browne, M., 2005. Urban logistics – how can it meet policy makers
sustainability objectives? J. Transport Geogr. 13 (1), 71–81.
Awasthi, A. Chauhan, S. A hybrid approach integrating Affinity Diagram, AHP and fuzzy
TOPSIS for sustainable city logistics planning. Applied Mathematical Modelling, 2012.
Behrends, S., Lindholm, M. and Woxenius, J. (2008). The impact of urban freight transport: a
definition of sustainability from an actor’s perspective. Transportation Planning and
Technology, 31 (6), Routledge, Taylor & Francis Group.

77
Bertazzo, T. R., Hino, C., Tacla, D., Yoshizaki, H. T. Y. Estudo de caso: entregas noturnas na
cidade de São Paulo. XXIX Congresso nacional de pesquisa em transporte da ANPET Ouro
Preto, 2015.
Blanco, E., Fransoo, J. C. Reaching 50 million nanostores: retail distribution in emerging
megacities. Research School for Operations Management and Logistics, 2013.
Blanco, E. (2014). Urban Logistics: a Latin American Perspective. Corporación Andina de
Fomento.
BORNIA, A. C.; WERNKE, R. A contabilidade gerencial e os métodos multicriteriais.
Revista Contabilidade & Finanças. FIPECAPI – FEA – USP. v.14, n. 25, p. 60- 71, jan./abr.
2001.
BOUDOIN, D.; MOREL, C.; GARDAT, M. (2013) Supply Chains and Urban Logistics
Platforms. In: Sustainable Urban Logistics : Concepts, Methods and Information Systems.
Gonzalez-Feliu, J.;Semet, F., et al. Dordrecht: Springer Berlin Heidelberg: 1-20 p.
Browne, M., Nemoto, T., Visser, J. and Whiteing, T. (2004). Urban freight movements and
public-private partnerships, In Logistics Systems for Sustainable Cities, E. Taniguchi and
R.G. Thompson, (Eds.), Elsevier, Oxford, 17-35.
Bryman A. (2006). Integrating quantitative and qualitative research: How is it done?
Qualitative Research, 6, 97–113.
Castro, R. B., Lima Jr, O. F., Dias, M. L. F. C., Loureiro, S. A., Noletto, A. P. R. (2015).
Ponto de apoio como solução para distribuição de cargas em centros urbanos (Satellite
platform as solution for urban logistics). XXIX ANPET, Ouro Preto.
Castro, R. B., Merchan, D., Lima Jr, O. F. (2016). Identifying clusters to implement urban
logistics best practices: the case of São Paulo. 2016 MIT SCALE Latin America Conference.
Castro, R. B., Merchán, D., Lima Jr, O. F. City logistics and clustering – impacts of using
HDI and taxes. Working paper, 2016.
Center for International Forestry Research (CIFOR).
http://www.cifor.org/acm/methods/mca.html, Accessed on January 2015.

78
CET, COMPANHIA DE ENGENHARIA DE TRÁFEGO. Disponível em:
<http://www.cetsp.com.br/consultas/caminhoes.aspx>. Acesso em Agosto de 2016.
CETESB (Cia Ambiental do Estado de São Paulo). (2011) Emissões veiculares no estado de
São Paulo. Série Relatórios. Disponível em < http://www.cetesb.sp.gov.br/>.
Chhetri, P., Butcher, T., Corbitt, B. Characterising spatial logistics employment clusters.
International Journal of Physical Distribution & Logistics Management, Vol. 44 No. 3, 2014
City Form Lab. (2012). Measuring growth and change in East-Asian Cities: Progress Report
on urban form and land use measures. Singapore: The World Bank & MIT City Form Lab.
City Freight. (2005). Inter- and Intra- City Freight Distribution Networks. Final Report,
available at: <http://www.cityfreight.org>
CIVITAS – Cleaner and better transport in cities. (2015). Making urban freight logistics more
sustainable.
CLUB - Centro de Logística Urbana do Brasil, 2012. Debates sobre logística urbana
brasileira – grupos focais. Available in:
<http://www.clubbrasil.org/observatorio/relatorios.html> Accessed in Nov 2015
CLUB - Centro de Logística Urbana do Brasil, 2013. Debates sobre logística urbana
brasileira – melhores práticas. Disponível em
<http://www.clubbrasil.org/observatorio/relatorios.html>
CLUB - Centro de Logística Urbana do Brasil, 2016. Disponível em
<http://www.clubbrasil.org/observatorio/estatisticas/dificuldades_de_entrega_por_cidade.htm
l>
Communities and Local Government, 2009. Multi-criteria analysis: a manual. Department for
Communities and Local Government: London.
Córdova, J., Merchán, D., Torres, S. (2014) Redesigning a Retail Distribution Network in
Restricted Urban Areas: A Case Study on Beverage Distribution in the Historic Center of
Quito. Journal of Applied Research and Technology.

79
CORREIA, V. A., OLIVEIRA, L. K., MATEUS, G. R. (2010) Perspectivas para a melhoria
da distribuição urbana de mercadorias. XXIV Congresso de Pesquisa e Ensino em
Transportes.
Crainic, T. G., Ricciardi, N., & Storchi, G. (2004). Advanced freight transportation systems
for congested urban areas. Transportation Research: Part C, 12 (2), 119-‐137.
CRAINIC, T.G., RICCIARDI N., STORCHI G. (2009) Models for evaluating and planning
city logistics systems. Transp Sci 43(4):432–454
Dablanc, L. (2007). Goods transport in large European cities: Difficult to organize, difficult
to modernize. Transportation Research Part A, 280-285.
Dablanc, L. (2009) Freight transport for development toolkit: Urban Freight. Transport
Research Support.
Dablanc, L., Patier, D., Gonzalez-Feliu, J., Augereau, V., Leonardi, J., et al. (2014). SUGAR.
Sustainable Urban Goods Logistics Achieved by Regional and Local Policies. City Logistics
Best Practices: a Handbook for Authorities. Regione Emilia Romagna, Bologna, Italy.,
pp.276, 2011.
DASBURG, N., SCHOEMAKER, J. Quantification of Urban Freight Transport Effects II.
BESTUFS II: Best Urban Freight Solutions II. 2006. Disponível em:
<http://www.bestufs.net/bestufs2_results.html>
DDS – Decision Support Systems Glossary, 2006.
DENATRAN, DEPARTAMENTO NACIONAL DE TRÂNSITO. Estatísticas da frota de
veículo nacional. Disponível em: <http://www.denatran.gov.br/frota.htm>. Acesso em 2016.
DIAS, M. L. F. C., GARCIA, S. E. M. (2015). Pontos de Apoio na Distribuição Urbana de
Bebidas. Mundo Logística. Campinas: MAG, n. 48.
Dobbs, R., Smit, S., Remes, J., Manyika, J., Roxburgh, C., & Restrepo, A. (2011). Urban
World: Mapping the Economic Power of Cities. McKinsey Global Institute.
80
Duin, J. H. R., Quak, H. J. (2007). City logistics: a chaos between research and policy
making? A review. Urban Transport XIII: Urban Transport and the Environment in the 21st
Century.
FREITAS, I. M. D. P. (1999) Metodologia de Avaliação Multicriterial Para Seleção de
Alternativas Tecnológicas e de Tratamento Preferencial na Circulação do Tráfego Para o
Transporte de Média Capacidade. 1999. Tese (Dr. Sc. Engenharia de Transportes) –
Universidade Federal do Rio de Janeiro, COPPE.
GRANDZOL, J.R. Improving the Faculty Selection Process in Higher Education: A Case for
the Analytic Hierarchy Process. Bloomsburg University of Pennsylvania. IR Applications
Volume 6, August 24, 2005.
Greene, J.C., 2008. Is Mixed Methods Social Inquiry a Distinctive Methodology? J. Mix.
Methods Res. 2, 7–22. doi:10.1177/1558689807309969
Grus, J. (2015). Data Science From Scratch. Sebastopol, CA: O'Reilly.
Holguin-Veras, J., Polimeni, J. Potential for off-peak freight deliveries to congested urban
areas. Rensselaer Polytechnic Institute, 2006.
Holguin-Veras, J., Ozbay, K., Kornhauser, A., Shorris, A., Ukkusuri, A. Integrative freight
demand management in the New York metropolitan area. United Stated Department of
Transportation, 2010.
Holguin-Veras, J., Marquis, R., Brom, M. Economic Impacts of Staffed and Unassisted off-
Hour Deliveries in New York City. Procedia – Social and Behavioral Sciences, v.39, p. 34-
46, Jan. 2012.
Holguin-Veras, J. et al. Fostering the Use of Unassisted Off-Hour Deliveries: Operational and
Low-Noise Truck Technologies. Transportation Research Board, n.2379, p. 57-63, 2013.
Ibeas, A., Moura, J. L., Nuzzolo, A., Comi, A. (2012). Urban freight transport demand:
transferability of survey results analysis and models. Procedia – Social and Behavioral
Sciences, v. 54, p. 1068 – 1079.
IBGE (2016) - Brazilian Institute of Geography and Statistics. Available in
<http://www.ibge.gov.br/home/>
81
Iwan, S. Adaptative approach to implementing good practices to support environmentally
friendly urban freight transport management. 1st International Conference Green Cities 2014
– Green Logistics for Greener Cities. Procedia - Social and Behavioral Sciences 151 (2014)
70 – 86.
Iwan, S., Kijewska, K. The Integrated Approach to Adaptation of Good Practices in Urban
Logistics Based on the Szczecin Example. 8th International Conference on City Logistics.
Procedia - Social and Behavioral Sciences 125 (2014) 212 – 225.
Jiang, C., Chen, D. (2009). Research on Urban Logistics Infrastructure: An Empirical Study
of China. J. Service Science & Management, 2: 80-91.
Kunadhamraks, P., Hanaoka, S. Evaluation of logistics performance for freight mode choice
at an intermodal terminal, in: E. Taniguchi, R.G. Thompson (Eds.), Recent Advances in City
Logistics, 2005, pp. 191–205.
Leonardi, J., Browne, M., Allen, J., Bohne, S., Ruesch, M. (2014). Best Practice Factory for
Freight Transport in Europe: Demonstrating How ‘Good’ Urban Freight Cases are Improving
Business Profit and Public Sectors Benefits. 8th International Conference on City Logistics.
Procedia - Social and Behavioral Sciences 125, 84 – 98
LIMA, O. F. JR. (2011) Inovação frugal: a nova rota da logística urbana. Mundo Logística,
23:24-40.
Lima, O. F. JR. (2015). Inovação e Difusão de Boas Práticas em Logística Urbana. Mundo
Logística, 2015 – Maio/Junho.
Loureiro, S. A.; Castro R.; Dias, M. L. F. C; Noleto A. P.; Lima Jr. O. F. Estudo da
Distribuição de Bebidas na Região Central de Campinas através de Modelo de Simulação
Multiagentes. Em: Embalagem na Logística Urbana: conceitos, métodos e práticas.
LALT/Unicamp, 2015.
Majumder, M. Impact of Urbanization on Water Shortage in Face of Climatic Aberrations,
SpringerBriefs in Water Science and Technology, DOI 10.1007/978-981-4560-73-3_2 (2015)

82
Maxwell, J. A., Loomis, D. M. (2003) Mixed Methods Design: An Alternative Approach. In
A. Tashakkori and C. Teddlie (eds) Handbook of Mixed Methods in Social and Behavioral
Research, pp. 209-40. Thousand Oaks, CA: Sage.
McKinnon, A., Cullinane, S., Browne, M., Whiteing, A. (2010). Green logistics: improving
the environmental sustainability of logistics. Londres, Philadelfia, Nova Delhi. Kogan Page,
V. 1.
Merchán, D., Blanco, E., & Bateman, A. (2015). Urban Metrics for Urban Logistics: Building
an Atlas for Urban Freight Policy Makers. 14th International Conference on Computers in
Urban Planning and Urban Management. Cambridge.
Merchan, D., Blanco, E. (2015). The Future of Megacity Logistics. MIT Center for
Transportation and Logistics, September 2015. Overview of Best-Practices, Innovative
Strategies and Technology Trends for Last-Mile Delivery.
MUÑUZURI, J., LARRAÑETA, J., ONIEVA, L., CORTÉS, P. (2005). Solutions applicable
by local administrations for urban logistics improvement. Cities, v. 22, n° 1, p. 15-28.
NYKVIST, B.; WHITMARSH, L. A multi-level analysis of sustainable mobility transitions:
Niche development in the UK and Sweden. Technological Forecasting and Social Change, v.
75, n. 9, p. 1373 – 1387, 2008.
Oliveira, L. K.; Dias,E. G.; Hoffmand, D. (2011) Diagnóstico do uso de vagas de carga e
descarga e identificação dos principais fluxos logísticos na região central de Belo Horizonte.
Relatório Final, UFMG, DETG, Belo Horizonte.
Oliveira, C. M., D’Agosto, M. A., Mello, A. L. D., Gonçalves, F. S., Gonçalves, D. N. S.,
Assumpção, F. C. (2015). Identificando os desafios e as boas práticas para o transporte
urbano de cargas, por meio de uma revisão bibliográfica sistemática. XXIX Congresso
Nacional de Pesquisa em Transporte – ANPET.
Patier, D., Browne, M. (2010) A methodology for the evaluation of urban logistics
innovations. The Sixth International Conference on City Logistics. Procedia Social and
Behavioral Sciences 2, 6229–6241

83
Pham, Duc Truong, Stefan S. Dimov, and C. D. Nguyen. "Selection of K in K-means
clustering." Proceedings of the Institution of Mechanical Engineers, Part C: Journal of
Mechanical Engineering Science 219.1 (2005): 103-119
Ponce-Cueto, E., Winkenbach, M., Merchán, D., Blanco, E. E., Lee, Y. J., Alho, A., Marujo,
L. G. Segmentation of urban areas from a logistics perspective: comparative case studies in
Lisbon, Madrid, Mexico City, Quito, Rio de Janeiro, and Singapore, 2015. Proceedings for
Metrans 2015, available at: <http://www.metrans.org/2015-i-nuf-conference-committee>
Porter, M. E. (1998). Clusters and the new economics of competition. Harvard Business
Review, November/December, 1998.
Prefeitura de São Paulo, 2015. Disponível em: http://www.prefeitura.sp.gov.br/
Quak, H. Sustainability of urban freight transport – Retail Distribution and Local Regulations
in Cities. Rotterdam: Erasmus University, 2007.
Quak, H. (2008) Sustainability of Urban Freight Transport. Retail Distribution and Local
Regulations in Cities. ERIM Ph.D. Series Research in Management.
SAATY, T.L. The Analytic Hierarqchy Process. tradução e revisão por Wainer da Silveira e
Silva, McGraw-Hill, Makron, São Paulo, SP, Brasil, pp. 278, 1991.
SAATY, T.L. How to Make a Decision: The Analytic Hierarchy Process. The Institute for
Operations Research and the Management Sciences, Interfaces 24(6), pg. 19-43, USA, 1994.
Saaty, T.L. Fundamentals of Decision Making and Priority Theory with the Analytic
Hierarchy, 2000. Process Vol. VI, AHP Series, RWS Publications (Fax: 412-681-4510),
Pittsburgh, PA.
Saaty, T. L. Decision making with the analytic hierarchy process. Int. J. Services Sciences,
Vol. 1, No. 1, 2008.
SANCHES, P. F. JR. (2008) Logística de carga urbana: uma análise da realidade brasileira.
Tese de doutorado, Universidade Estadual de Campinas.
Silva, A. L. B. Análise Multicritério para avaliação de rotas cicláveis integradas ao transporte
público. Dissertação de mestrado, Universidade Federal da Bahia, 2014.

84
Souza, J. M. S., Galves, M. L., Neto, A. G. L. P., Braga, M. L. Modelo de estruturação de
problemas aplicado à distribuição urbana na região central de campinas. ANPET, 2013.
Taniguchi, E. (2014). Concepts of city logistics for sustainable and liveable cities. 1st
International Conference Green Cities. Procedia - Social and Behavioral Sciences 151, 310 –
317.
Taniguchi, E., Thompson, R. G., Yamada, T. and van Duin, R. (2001). City logistics:
Network modelling and intelligent transport systems. Pergamon, Oxford
Taniguchi, E. and Shimamoto, H. (2004). Intelligent transportation system based dynamic
vehicle routing and scheduling with variable travel times, Transportation Research Part C,
12C(3-4), 235-250.
Taniguchi, E., Tamagawa, D. (2005). Evaluating city logistics measures considering the
behaviour of several stakeholders. Journal of the Eastern Asia Society for Transportation
Studies, Vol. 6, pp. 3062 – 3076.
Taniguchi, E., Thompson, R. G., Yamada, T. (2014). Recent Trends and Innovations in
Modelling City Logistics. 8th International Conference on City Logistics. Procedia - Social
and Behavioral Sciences 125, 4 – 14
United Nations. Logistics Sector Developments: Planning Models for Enterprises and
Logistics Clusters, 2007.
Wolman, H., Hincapie, D. Clusters and Cluster-Based Development Policy. Economic
Development Quarterly 2015, Vol. 29(2) 135–149
YOSHIMOTO, R., NEMOTO, T. (2005) The impact of information and communication
technology on road freight transportation. International Association of Traffic and Safety
Sciences (IATSS) Research Vol. 29, Nº 1.
ZAMBONI, K.L., FRANÇA, M. CARNEIRO, RODRIGUES, Silva da, A.N., NEGRI, J. C. –
Análise de decisão multicritério na localização de usinas termoelétricas utilizando SIG. 2005,
disponível em http://www.scielo.br/scielo.php?script=sci_arttext&pid=S0101-
74382005000200002.

85
ATTACHMENTS
Paper I
Castro, R. B., Santos, L. S. (2016). Estudo do impacto do e-commerce e de Sistemas
Inteligentes de Transporte na logística urbana (Study of the impact of e-commerce
and Intelligent Transportation Systems in urban logistics). Mundo Logística, n. 50.
Paper II
Castro, R. B., Lima Jr, O. F., Dias, M. L. F. C., Loureiro, S. A., Noletto, A. P. R.
(2015). Ponto de apoio como solução para distribuição de cargas em centros urbanos
(Satellite platform as solution for urban logistics). XXIX ANPET, Ouro Preto.
Paper III
Castro, R. B., Merchan, D., Lima Jr, O. F. (2016). Identifying clusters to implement
urban logistics best practices: the case of São Paulo. 2016 MIT SCALE Latin
America Conference.
Paper IV
Castro, R. B. Loureiro, S. A., Lima Jr, O. F., Noletto, A. P. R. Cluster analysis and
Focus group: integrating Qualitative and Quantitative approaches on addressing city
logistics challenges. Working paper.
86
Study of the impact of e-commerce and Intelligent Transportation
Systems in urban logistics - Estudo do impacto do e-commerce e de
Sistemas Inteligentes de Transporte na logística urbana
Case “Entrega Delivery” e “Já Tá Chegando”
Rodrigo Barros Castro é Engenheiro Civil pela UNICAMP, e realiza
mestrado sobre Logística Urbana na universidade. Atualmente cursa
especialização sobre Logística e Gestão da Cadeia de Suprimentos no MIT, e é
pesquisador no LALT/UNICAMP.
Lilian da Silva Santos é doutora e mestre em Transportes pelo Programa de
Pós-graduação em Transportes da Universidade de Brasília (PPGT/ UnB), e
Bacharelado em Turismo pela Universidade Federal de Ouro Preto (UFOP).
Atualmente é pesquisadora do LALT/UNICAMP, vinculada ao PPPD -
Programa de Pesquisador de Pós-doutorado, junto ao Departamento de
Geotecnia e Transportes (DGT).
Abstract
The diversity of information shared with consumers raises their requirements regarding
service level. In addition, the e-commerce growth caused impacts on urban logistics, such as
the increase in B2C transactions leading to increased demand for transport. The use of
technologies such as Intelligent Transport Systems also influence freight delivery operations,
contributing to increase competitiveness. In this context, due to the high competitiveness
required, collaborative alliances between companies started to be developed, such as
between the companies "Entrega Delivery" and "JáTá Chegando". The purpose of this
article is to analyze the impact of e-commerce and Intelligent Transportation Systems in
urban logistics, from the study of these two companies. In-depth interviews were performed
in order to collect data.
1. Introdução
As principais aplicações de Tecnologias de Informação e Comunicação (TIC) nos anos 90 consistiam em
sistemas com finalidade de obtenção, processamento e distribuição de informações para o melhor uso no
planejamento, operação e gestão do transporte de cargas. Com a chegada do século XXI, o foco tornou-se a
criação de aplicações integradas à internet que possibilitam o compartilhamento de dados com muitos usuários,
contexto no qual as TICs têm causado uma variedade de efeitos nos sistemas logísticos. A popularização da
Internet aumenta as transações Business to Business (B2B) e Business to Consumer (B2C), o que leva a uma
demanda maior por transporte em função do e-commerce. Além disso, os Sistemas Inteligentes de Transporte
(SITs) têm promovido a otimização da gestão de frotas baseado no tráfego ou em informações em tempo real, o
que aumenta a eficiência do transporte (Yoshimoto e Nemoto, 2005). Com isso, essas tecnologias
Foto do autor
Deve ser enviada
também,
separadamente em
arquivo gif ou jpg de
boa qualidade.
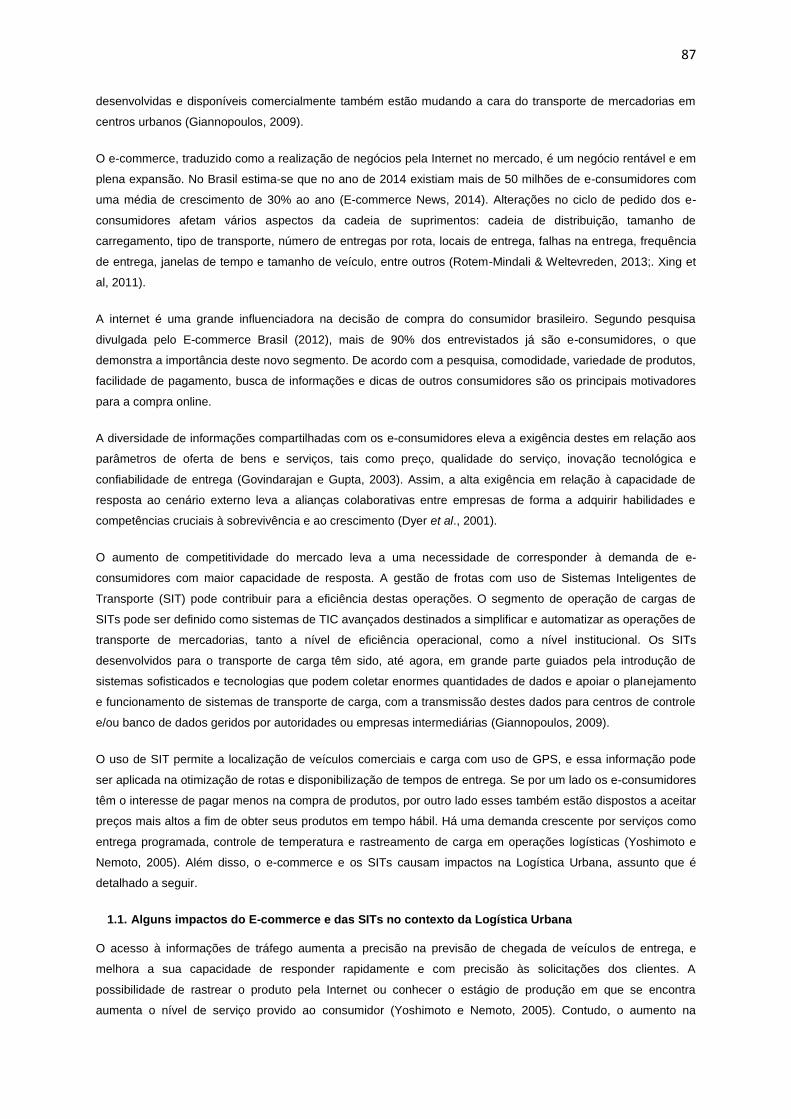
87
desenvolvidas e disponíveis comercialmente também estão mudando a cara do transporte de mercadorias em
centros urbanos (Giannopoulos, 2009).
O e-commerce, traduzido como a realização de negócios pela Internet no mercado, é um negócio rentável e em
plena expansão. No Brasil estima-se que no ano de 2014 existiam mais de 50 milhões de e-consumidores com
uma média de crescimento de 30% ao ano (E-commerce News, 2014). Alterações no ciclo de pedido dos e-
consumidores afetam vários aspectos da cadeia de suprimentos: cadeia de distribuição, tamanho de
carregamento, tipo de transporte, número de entregas por rota, locais de entrega, falhas na entrega, frequência
de entrega, janelas de tempo e tamanho de veículo, entre outros (Rotem-Mindali & Weltevreden, 2013;. Xing et
al, 2011).
A internet é uma grande influenciadora na decisão de compra do consumidor brasileiro. Segundo pesquisa
divulgada pelo E-commerce Brasil (2012), mais de 90% dos entrevistados já são e-consumidores, o que
demonstra a importância deste novo segmento. De acordo com a pesquisa, comodidade, variedade de produtos,
facilidade de pagamento, busca de informações e dicas de outros consumidores são os principais motivadores
para a compra online.
A diversidade de informações compartilhadas com os e-consumidores eleva a exigência destes em relação aos
parâmetros de oferta de bens e serviços, tais como preço, qualidade do serviço, inovação tecnológica e
confiabilidade de entrega (Govindarajan e Gupta, 2003). Assim, a alta exigência em relação à capacidade de
resposta ao cenário externo leva a alianças colaborativas entre empresas de forma a adquirir habilidades e
competências cruciais à sobrevivência e ao crescimento (Dyer et al., 2001).
O aumento de competitividade do mercado leva a uma necessidade de corresponder à demanda de e-
consumidores com maior capacidade de resposta. A gestão de frotas com uso de Sistemas Inteligentes de
Transporte (SIT) pode contribuir para a eficiência destas operações. O segmento de operação de cargas de
SITs pode ser definido como sistemas de TIC avançados destinados a simplificar e automatizar as operações de
transporte de mercadorias, tanto a nível de eficiência operacional, como a nível institucional. Os SITs
desenvolvidos para o transporte de carga têm sido, até agora, em grande parte guiados pela introdução de
sistemas sofisticados e tecnologias que podem coletar enormes quantidades de dados e apoiar o planejamento
e funcionamento de sistemas de transporte de carga, com a transmissão destes dados para centros de controle
e/ou banco de dados geridos por autoridades ou empresas intermediárias (Giannopoulos, 2009).
O uso de SIT permite a localização de veículos comerciais e carga com uso de GPS, e essa informação pode
ser aplicada na otimização de rotas e disponibilização de tempos de entrega. Se por um lado os e-consumidores
têm o interesse de pagar menos na compra de produtos, por outro lado esses também estão dispostos a aceitar
preços mais altos a fim de obter seus produtos em tempo hábil. Há uma demanda crescente por serviços como
entrega programada, controle de temperatura e rastreamento de carga em operações logísticas (Yoshimoto e
Nemoto, 2005). Além disso, o e-commerce e os SITs causam impactos na Logística Urbana, assunto que é
detalhado a seguir.
1.1. Alguns impactos do E-commerce e das SITs no contexto da Logística Urbana
O acesso à informações de tráfego aumenta a precisão na previsão de chegada de veículos de entrega, e
melhora a sua capacidade de responder rapidamente e com precisão às solicitações dos clientes. A
possibilidade de rastrear o produto pela Internet ou conhecer o estágio de produção em que se encontra
aumenta o nível de serviço provido ao consumidor (Yoshimoto e Nemoto, 2005). Contudo, o aumento na
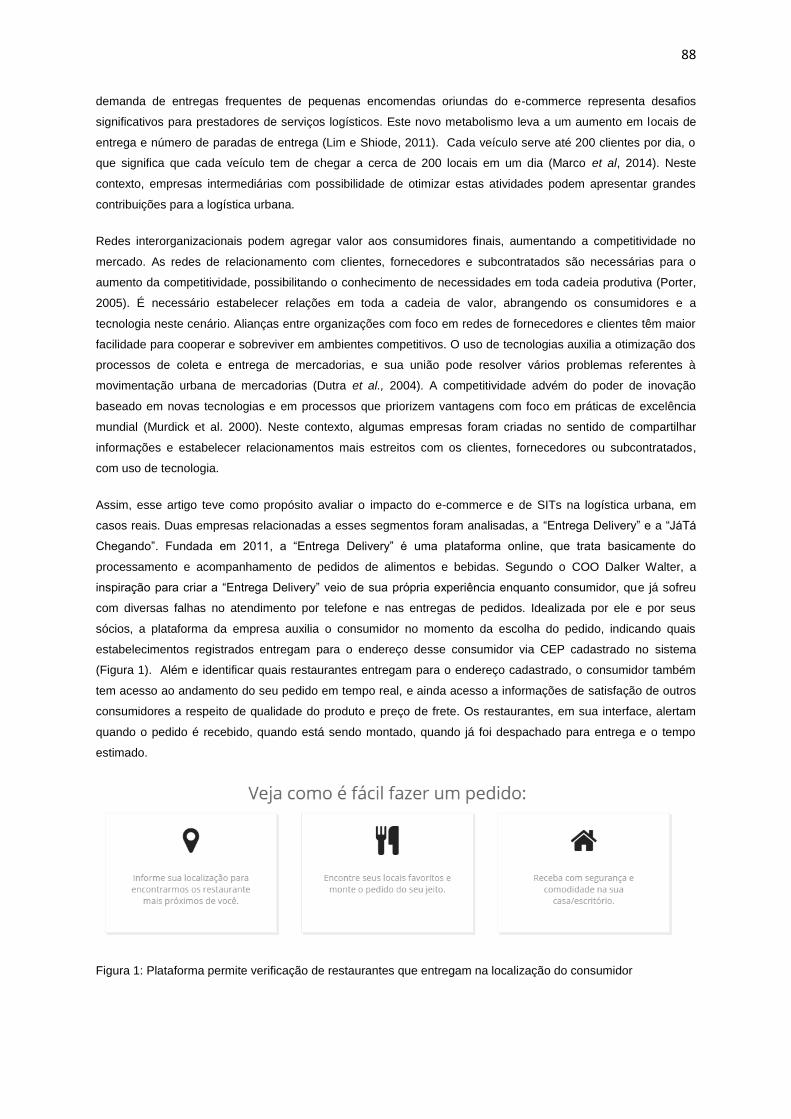
88
demanda de entregas frequentes de pequenas encomendas oriundas do e-commerce representa desafios
significativos para prestadores de serviços logísticos. Este novo metabolismo leva a um aumento em locais de
entrega e número de paradas de entrega (Lim e Shiode, 2011). Cada veículo serve até 200 clientes por dia, o
que significa que cada veículo tem de chegar a cerca de 200 locais em um dia (Marco et al, 2014). Neste
contexto, empresas intermediárias com possibilidade de otimizar estas atividades podem apresentar grandes
contribuições para a logística urbana.
Redes interorganizacionais podem agregar valor aos consumidores finais, aumentando a competitividade no
mercado. As redes de relacionamento com clientes, fornecedores e subcontratados são necessárias para o
aumento da competitividade, possibilitando o conhecimento de necessidades em toda cadeia produtiva (Porter,
2005). É necessário estabelecer relações em toda a cadeia de valor, abrangendo os consumidores e a
tecnologia neste cenário. Alianças entre organizações com foco em redes de fornecedores e clientes têm maior
facilidade para cooperar e sobreviver em ambientes competitivos. O uso de tecnologias auxilia a otimização dos
processos de coleta e entrega de mercadorias, e sua união pode resolver vários problemas referentes à
movimentação urbana de mercadorias (Dutra et al., 2004). A competitividade advém do poder de inovação
baseado em novas tecnologias e em processos que priorizem vantagens com foco em práticas de excelência
mundial (Murdick et al. 2000). Neste contexto, algumas empresas foram criadas no sentido de compartilhar
informações e estabelecer relacionamentos mais estreitos com os clientes, fornecedores ou subcontratados,
com uso de tecnologia.
Assim, esse artigo teve como propósito avaliar o impacto do e-commerce e de SITs na logística urbana, em
casos reais. Duas empresas relacionadas a esses segmentos foram analisadas, a “Entrega Delivery” e a “JáTá
Chegando”. Fundada em 2011, a “Entrega Delivery” é uma plataforma online, que trata basicamente do
processamento e acompanhamento de pedidos de alimentos e bebidas. Segundo o COO Dalker Walter, a
inspiração para criar a “Entrega Delivery” veio de sua própria experiência enquanto consumidor, que já sofreu
com diversas falhas no atendimento por telefone e nas entregas de pedidos. Idealizada por ele e por seus
sócios, a plataforma da empresa auxilia o consumidor no momento da escolha do pedido, indicando quais
estabelecimentos registrados entregam para o endereço desse consumidor via CEP cadastrado no sistema
(Figura 1). Além e identificar quais restaurantes entregam para o endereço cadastrado, o consumidor também
tem acesso ao andamento do seu pedido em tempo real, e ainda acesso a informações de satisfação de outros
consumidores a respeito de qualidade do produto e preço de frete. Os restaurantes, em sua interface, alertam
quando o pedido é recebido, quando está sendo montado, quando já foi despachado para entrega e o tempo
estimado.
Figura 1: Plataforma permite verificação de restaurantes que entregam na localização do consumidor
89
Mais nova no mercado, a “JáTá Chegando” foi fundada em 2014, e possui mais de 6 mil clientes finais
cadastrados em seu banco de dados. Segundo o co-founder Ivan Bonomi, a plataforma fornece para empresas
que realizam entrega de pedidos funcionalidades como otimização de rotas, gestão de frota, através do
monitoramento de localização e velocidade de circulação, envio de SMS para clientes no momento em que a
entrega é iniciada e quando está próxima ao local final, além da prova de entrega, com possibilidade de
entregadores tirarem foto do local. Consumidores podem monitorar a localização de seu pedido e donos de
estabelecimentos comerciais ainda podem monitorar a dirigibilidade dos entregadores, evitando curvas rápidas
no caso de transporte de comida, por exemplo. Assim, contribuem para o desafio do Last Mile Delivery,
aumentando a assertividade da entrega e a redução de seus custos. Os benefícios da plataforma estão
ilustrados na Figura 2.
Figura 2: benefícios da plataforma “JáTá Chegando”
As informações apresentadas foram coletadas mediante a entrevistas realizadas diretamente com os
responsáveis por cada empresa, durante o mês de setembro de 2015.
2. Case: “Entrega Delivery” e “JáTá Chegando”
A análise das informações coletadas por meio das entrevistas feitas com os responsáveis pela “Entrega
Delivery” e “Já Tá Chegando” foi feita mediante a verificação de seis aspectos: Prática Logística; Tecnologia;
Sustentabilidade; Políticas Públicas e Governança; Modelo de Negócio e Viabilidade Econômica; e, Dificuldades
na implementação. Estas variáveis foram selecionadas após análise de três projetos de relevância que abordam
boas práticas em logística urbana de forma que um padrão no estudo destas práticas seja alcançado, e
permitem que os aspectos mais importantes das operações sejam considerados. Essas práticas logísticas estão
detalhadas nos itens seguintes.
2.1. Prática logística

90
As melhores práticas logísticas podem ser encontradas em empresas de diversos setores, em qualquer posição
da cadeia de suprimentos, como fabricantes, varejistas e atacadistas (Bowersox et al., 1989). Além disso, de
acordo com Dantas (2000), práticas logísticas e desempenho estão estritamente ligados.
A “Entrega Delivery” atua como intermediária entre estabelecimentos comerciais – restaurantes – e
consumidores finais, influenciando as práticas logísticas envolvidas no processo de delivery. As práticas
logísticas envolvidas pelas atividades da empresa têm sinergia com as atividades descritas por Ballou (2006)
como manutenção de informações e processamento de pedidos. Com relação à primeira atividade, a plataforma
da “Entrega Delivery” permite a manutenção de um extenso banco de dados, com informações importantes para
o planejamento de operações da cadeia de suprimentos. O banco de dados contém a localização e contato dos
clientes, quantidade de pedidos, além de informações relativas aos restaurantes, como tempo de entregas e
qualidade.
Ressalta-se que a atividade de processamento de pedidos é essencial em um processo logístico, pois um bom
gerenciamento desta operação auxilia a empresa a atingir um nível de serviço eficaz oferecido aos clientes.
Problemas relativos ao processamento de pedidos podem ser minimizados com sistemas de informação (Ballou,
2006; e Fleury, 2006). Neste sentido, a plataforma da “Entrega Delivery” oferece a possibilidade de
consumidores realizarem seu pedido, acompanharem o status do mesmo, além de receberem uma estimativa do
tempo de entrega. Ainda, a plataforma separa automaticamente os restaurantes que atendem na área do
consumidor, de acordo com seu CEP. Há duas possibilidades para realizar pedidos utilizando a plataforma: o
uso de sites personalizados, atrelados à página do restaurante, que são transmitidos para a página da “Entrega
Delivery” apenas na etapa de finalização do pedido, ou realizar os pedidos diretamente com o site da plataforma.
O uso desta tecnologia para processamento de pedidos diminui a demanda de pedidos via telefone, contribui
para a diminuição de erros no mesmo, além do ganho de tempo por parte dos operadores do restaurante.
Por sua vez, a empresa “JáTá Chegando” também atua como intermediária entre os estabelecimentos
comerciais e consumidores finais, provendo serviços que agregam valor às práticas logísticas desempenhadas
na distribuição de mercadorias em centros urbanos. A plataforma permite a otimização das rotas realizadas pelo
entregador, contribuindo para as atividades de transporte da cadeia de suprimentos. O algoritmo estabelece a
melhor ordem de entrega para que a menor rota seja realizada.
Os serviços desempenhados pela “JáTá Chegando” também possibilitam a manutenção de informações ao
longo da cadeia de suprimentos, atividade essencial para o correto planejamento e controle logístico. Uma base
de dados com localização de clientes, rotas, padrões de entrega e velocidade dos entregadores, por exemplo,
possibilita uma administração eficiente das atividades desempenhadas para distribuição de mercadorias em
centros urbanos.
2.2. Tecnologia
Tecnologias podem contribuir na competitividade de empresas, além de auxiliar na mitigação de problemas
oriundos da logística de cargas (Barbosa et al., 2007).
Nesse contexto, cabe destacar que a plataforma desenvolvida pela empresa “Entrega Delivery” apresenta
grande sinergia com o uso de tecnologia no aumento da competitividade de empresas e com o aumento na
demanda de transações B2C gerada pelo e-commerce (Barbosa et al., 2007; Yoshimoto e Nemoto, 2005). A
sua plataforma permite a verificação do desempenho de entregas, uma vez que fornece informação de tempo e
91
custo de entrega para os consumidores. Além disso, os consumidores recebem uma notificação, por uma tela de
acompanhamento, informando que o entregador chegará ao local dentro instantes, e já podem se preparar para
receber o pedido contribuindo para a eficiência no tempo de entrega. Ainda, na avaliação de entrega realizada
pelo consumidor após utilizar a plataforma, um dos pontos considerados é o desempenho da entrega. O outro
ponto considerado é a qualidade do produto.
Quando se discute tecnologia relacionada à logística urbana, deve-se também analisar aspectos relativos à
informação e comunicação, influenciados por sistemas de telecomunicações e de gerenciamento de
informações (Barbosa et al., 2007).
Pode-se destacar o sistema de telecomunicações da “Entrega Delivery”, uma vez que os clientes são avisados
quando o pedido é processado, quando está sendo produzido, quando é despachado e está a caminho. O
responsável pelos pedidos do restaurante ainda recebe uma mensagem automatizada de SMS caso o primeiro
status do pedido não seja alterado após determinado período, indicando que seu preparo foi iniciado. Isto
diminuiu em 70% a ocorrência de interação humana de suporte para resolver problemas operacionais.
O sistema de gerenciamento de informações da “Entrega Delivery” age de forma positiva na eficiência das
operações de delivery, pois tanto usuários quanto restaurantes são avaliados pelo sistema. Esse permite a
tomada de decisão quando há avaliações negativas ou críticas em relação ao restaurante, problemas na
atualização de status de pedidos ou problemas no pagamento por parte de consumidores, por exemplo.
Restaurantes mal avaliados podem ser inativados de acordo com os feedbacks recebidos. O gerenciamento de
informações também trabalha no sentido de auxiliar as vendas dos restaurantes, pois podem informar os hábitos
de procura dos consumidores de cada bairro.
Por sua vez, a plataforma desenvolvida pela empresa “JáTá Chegando” também permite a análise do
desempenho de entregas, devido à possibilidade de monitorar o entregador e verificar a velocidade de
circulação do mesmo, além do tempo de entrega. Outro serviço que contribui com o desempenho de entregas é
o otimizador de rotas, que fornece ao entregador o melhor traçado entre os pontos de entrega. A funcionalidade
de envio de SMS para os clientes quando a entrega é iniciada e quando o entregador está próximo ao local
também aumenta a assertividade dos deliveries, contribuindo para a eficiência do Last Mile Delivery. O sistema
de monitoramento e envio de mensagens SMS também deve ser ressaltado como um sistema de
telecomunicações que apoia as atividades logísticas, permitindo a comunicação de dados relevantes entre
clientes e estabelecimentos comerciais.
Apesar de já realizar algumas atividades de gerenciamento de informações, esta operação se apresenta como
uma oportunidade para a “JáTá Chegando”, devido à grande quantidade de dados obtidos. Além das
transportadoras, um dos maiores nichos atendidos por essa empresa é o sistema de bike courier. Empresas que
utilizam este tipo de entrega computam a quantidade de quilômetros pedalados por mês de forma a ressaltar a
redução na emissão de CO2. O gerenciamento de informações também apoia a contabilidade de pedidos
monitorados com a plataforma. Uma nova funcionalidade, solicitada por transportadoras, permite que a prova da
entrega seja realizada, possibilitando o gerenciamento de pedidos não completos.
2.3. Sustentabilidade
Estratégias sustentáveis podem não só atuar na redução de custo, mas também se apresentar como vantagem
competitiva por aspectos de marketing (Boudoin et al., 2013). Ao se estudar sustentabilidade no transporte de
92
cargas, três variáveis são essenciais: impacto ambiental, impacto social e impacto econômico (BESTUFS,
2007).
A “Entrega Delivery” fomenta modelos sustentáveis de entrega com modelos híbridos, devido à ganhos no
impacto ambiental e mobilidade, de acordo com a região. Entregas próximas podem ser realizadas via bicicleta,
e entregas com distâncias maiores com veículos motorizados. Com esta prática, pode-se reduzir a emissão de
CO2, NOx e material particulado, que são os principais responsáveis por problemas causados na saúde de
indivíduos e preponderantes de veículos de carga, impacto social importante (CETESB, 2011). A “JáTá
Chegando” também gera valor em atividades de bike courier, serviço de transporte que também contribui para o
meio ambiente com a redução na emissão de gases, em função da menor quantidade de veículos pesados
circulando nas cidades.
Como impacto econômico deve-se observar a sinergia das plataformas com o e-commerce, e sua relação com o
aumento na demanda de entrega de mercadorias em centros urbanos. Segundo Yoshimoto e Nemoto (2005), a
internet ocasiona em um aumento nas transações B2C, o que leva à uma demanda por transporte.
O novo metabolismo urbano, abordado por Lima (2011), também é importante para as operações da “JáTá
Chegando” e “Entrega Delivery”. Há um aumento na quantidade de entregas fracionadas, compras em menor
escala, e que consequentemente exige um melhor planejamento de transporte.
2.4. Políticas Públicas e Governança
A colaboração entre os diferentes atores envolvidos na logística de cargas contribui para a melhora na qualidade
de vida em centros urbanos (Crainic et. al, 2009; Dablanc 2007).
A empresa “Entrega Delivery” estabelece um relacionamento entre consumidores e restaurantes. É um sistema
colaborativo, pois os restaurantes ajudam a validar os dados dos clientes, evitando assim trotes, por exemplo.
Consumidores são beneficiados com as avaliações de outros consumidores pois podem consultar o
desempenho dos restaurantes. Através de seu gerenciamento de informações, a empresa ainda pode contribuir
com as campanhas de promoções fornecidas pelos restaurantes, de acordo com a demanda observada na
região.
A empresa “JáTá Chegando” apresenta um relacionamento colaborativo com empresas para desenvolvimento
da plataforma com solicitação de funcionalidades. O relacionamento com consumidores só ocorre no
monitoramento das entregas, com possibilidade de rastreio de entrega e envio de SMS.
Com relação às políticas públicas, há uma lei que regulariza o tipo de moto que deve ser utilizada, além de um
curso obrigatório para motoboys, porém a verificação na região não é eficaz. Contudo, a responsabilidade pelo
cumprimento desta regulamentação é de quem realiza o transporte, ou seja, não cabe às empresas analisadas.
2.5. Modelo de Negócio e Viabilidade Econômica
Um modelo de negócios tem como finalidade identificar como o negócio pode obter lucro (Betz, 2002). Ainda,
Patier (2010) ressalta a importância de se considerar variáveis econômicas na análise de inovações.
Para a “Entrega Delivery”, o custo mais significativo é o custo de suporte aos restaurantes. O modelo de negócio
da empresa visa a alta retenção de consumidores que utilizam a plataforma, uma vez que o lucro se dá através
93
de um percentual em relação ao preço da compra na plataforma, e o rápido suporte aos restaurantes é uma
importante diferenciação do produto. O modelo é escalável, e não há um limitador significante para adicionar
novos restaurantes no sistema.
A “Entrega Delivery” atua em Campinas, Americana, Indaiatuba, Belo Horizonte, Natal, João Pessoa, Manaus e
Maringá. As cidades são escolhidas de acordo com os seguintes critérios: população superior à 1 milhão de
pessoas; ao menos 20% da população da cidade deve ter pelo menos uma renda-alvo específica, de forma a
garantir uma quantidade expressiva da população com acesso à internet; e cidades com uma quantidade de
estabelecimentos alimentícios significativa. Apenas a cidade de Maringá foge deste modelo, em função de
facilidade comercial, e João Pessoa e Manaus foram adicionadas devido a um requerimento individual de
restaurantes da região. O modelo foi validado em Campinas, e expandido para as outras cidades. A maior parte
destas informações foram coletadas no banco de dados do IBGE.
Os principais clientes da “JáTá Chegando” são o segmento de Bike Courier, transportadoras, entregas de
farmácias de manipulação, padarias e clubes de assinaturas para entregas de produtos orgânicos, e não há
limite de capacidade do sistema para o cadastro de empresas clientes e usuários. Novos segmentos visados
são transporte escolar com rastreamento de vans; e empresas com serviços para pessoas com dificuldade de
locomoção, de forma que a localização da van que realizará o atendimento seja conhecida.
Há a possibilidade de empresas realizarem cadastro no site do “JáTá Chegando”, e a partir disso o contato
inicial é realizado de forma a analisar a possibilidade de uso da plataforma. A presença geográfica é
significativa, com monitoramento de entregas em Manaus, São Paulo, Recife, Fortaleza e Rio de Janeiro.
Custos de operação e implementação não foram significativos para a empresa “JáTá Chegando”, uma vez que
os sócios já possuíam os equipamentos de TI necessários para operação. A empresa adquire lucro através da
quantidade de pedidos rastreados pela plataforma. A avaliação de satisfação de clientes ainda não é realizada,
porém é um objetivo da empresa.
2.6. Dificuldades na implementação
Inicialmente, imaginava-se que uma plataforma eficiente deveria ser o aspecto mais importante, então seria
necessário um determinado expertise para seu desenvolvimento.
Atualmente a plataforma da “Entrega Delivery” é resultado de uma metodologia bem elaborada. O
desenvolvimento da plataforma, caso o modelo da mesma já estivesse estruturado, poderia ter sido terceirizado.
Assim, o relacionamento com os restaurantes e consumidores foi essencial, para que a estrutura da plataforma
atendesse à demanda e necessidade dos potenciais clientes e consumidores e fosse aceita pelo mercado.
Uma das dificuldades encontradas é a falta de valor dado por empresas na importância da melhoria do
desempenho de entregas, além da visão do benefício que este sistema pode trazer em relação ao custo de uso
da inovação. Além disso, a aceitação de inovação e novas tecnologias se apresentam como obstáculos para
“JáTá Chegando”. A falta de infraestrutura de tecnologia no Brasil também foi citada, devido às dificuldades
técnicas como perda de sinal 3G ou GPS, que atrapalham o monitoramento em tempo real da localização do
entregador. Esta localização não é perdida, e o traçado é realizado pela plataforma após recuperação de sinal.
Considerações Finais
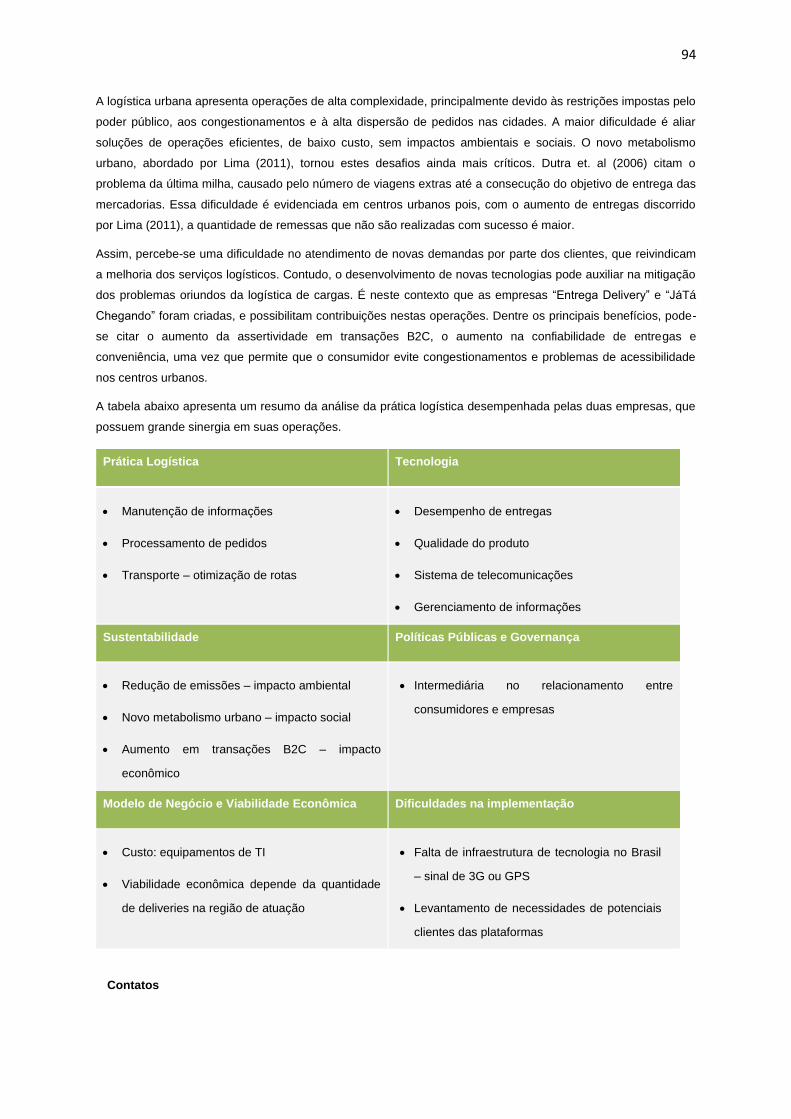
94
A logística urbana apresenta operações de alta complexidade, principalmente devido às restrições impostas pelo
poder público, aos congestionamentos e à alta dispersão de pedidos nas cidades. A maior dificuldade é aliar
soluções de operações eficientes, de baixo custo, sem impactos ambientais e sociais. O novo metabolismo
urbano, abordado por Lima (2011), tornou estes desafios ainda mais críticos. Dutra et. al (2006) citam o
problema da última milha, causado pelo número de viagens extras até a consecução do objetivo de entrega das
mercadorias. Essa dificuldade é evidenciada em centros urbanos pois, com o aumento de entregas discorrido
por Lima (2011), a quantidade de remessas que não são realizadas com sucesso é maior.
Assim, percebe-se uma dificuldade no atendimento de novas demandas por parte dos clientes, que reivindicam
a melhoria dos serviços logísticos. Contudo, o desenvolvimento de novas tecnologias pode auxiliar na mitigação
dos problemas oriundos da logística de cargas. É neste contexto que as empresas “Entrega Delivery” e “JáTá
Chegando” foram criadas, e possibilitam contribuições nestas operações. Dentre os principais benefícios, pode-
se citar o aumento da assertividade em transações B2C, o aumento na confiabilidade de entregas e
conveniência, uma vez que permite que o consumidor evite congestionamentos e problemas de acessibilidade
nos centros urbanos.
A tabela abaixo apresenta um resumo da análise da prática logística desempenhada pelas duas empresas, que
possuem grande sinergia em suas operações.
Prática Logística Tecnologia
Manutenção de informações
Processamento de pedidos
Transporte – otimização de rotas
Desempenho de entregas
Qualidade do produto
Sistema de telecomunicações
Gerenciamento de informações
Sustentabilidade Políticas Públicas e Governança
Redução de emissões – impacto ambiental
Novo metabolismo urbano – impacto social
Aumento em transações B2C – impacto
econômico
Intermediária no relacionamento entre
consumidores e empresas
Modelo de Negócio e Viabilidade Econômica Dificuldades na implementação
Custo: equipamentos de TI
Viabilidade econômica depende da quantidade
de deliveries na região de atuação
Falta de infraestrutura de tecnologia no Brasil
– sinal de 3G ou GPS
Levantamento de necessidades de potenciais
clientes das plataformas
Contatos
95
Dalker Walter - COO – Entrega Delivery
(19) 3307 – 4648
http://comida.entregadelivery.com.br/
Ivan Bonomi - co-founder - JáTá Chegando
(19) 3244-6403
www.jatachegando.com
Referências
BALLOU, R. H. Gerenciamento da cadeia de Suprimentos: Planejamento, Organização e Logística Empresarial.
São Paulo: Bookman, 2006.
BARBOSA, F. A., SACOMANO, J. B., PORTO, A. J. V. Metodologia de análise para redes interorganizacionais:
competitividade e tecnologia. Gest. Prod., São Carlos, v. 14, n. 2, p. 411-423, maio-ago. 2007.
BESTUFS (2007). Good Practice Guide on Urban Freight, www.bestufs.net.
BETZ, F. Strategic business models. Engineering Management Journal, v.14, n.1, p21-7, 2002
BOUDOIN, D.; MOREL, C.; GARDAT, M. Supply Chains and Urban Logistics Platforms. In: Sustainable Urban
Logistics : Concepts, Methods and Information Systems. Gonzalez-Feliu, J.;Semet, F., et al. Dordrecht: Springer
Berlin Heidelberg: 1-20 p. 2013.
BOWERSOX, D. J., DAUGHERTY, P. J., DRÖGE, C. L., ROGERS, D. S., WARDLOW, D. L. Leading edge
logistics: competitive position for the 1990’s. Oak Brook: Council of Logistics Management, 1989.
CETESB (Cia Ambiental do Estado de São Paulo). Emissões veiculares no estado de São Paulo. Série
Relatórios, 2011. Disponível em < http://www.cetesb.sp.gov.br/>.
CRAINIC, T.G., RICCIARDI N., STORCHI G. (2009) Models for evaluating and planning city logistics systems.
Transp Sci 43(4):432–454
DABLANC, L. Goods Transport in Large European Cities: Difficult to Organize, Difficult to Modernize (2007). 41
Transportation Research Part A 280, 285.
DANTAS, E. M. A. Estágio da organização logística de três empresas do setor de bebidas: um estudo de caso.
Dissertação de mestrado, Universidade Federal do Rio de Janeiro, 2000.

96
DUTRA, N. O Enfoque de City Logistics na Distribuição Urbana de Encomendas. Tese (doutorado em
Engenharia de Produção) – Universidade Federal de Santa Catarina. Orientador: Antônio Galvão Naclério
Novaes (2004).
DUTRA, N. G. S., NOVAES, A. G. N., MOREIRA, M. E. P. (2006) Novos conceitos e tecnologias na distribuição
urbana de mercadorias. XXVI ENEGEP.
DYER, J. H.; KALE, P.; SINGH, H. How to make strategic alliances work. Sloan Management Review, v. 42, n. 8,
p. 370-382, 2001.
E-COMMERCE BRASIL. Pesquisa traça perfil do e-consumidor brasileiro, 2012. Disponível em:
<https://www.ecommercebrasil.com.br/noticias/pesquisa-traca-perfil-do-e-consumidor-brasileiro/>
E-COMMERCE NEWS. Brasil já tem 51,3 milhões de e-consumidores, aponta e-bit, 2014. Disponível em: <
http://ecommercenews.com.br/noticias/pesquisas-noticias/brasil-ja-tem-513-milhoes-de-e-consumidores-aponta-
e-bit>
FLEURY, P. F. O Sistema de Processamento de Pedidos e a Gestão do Ciclo do Pedido. Disponível em:
http://www.cel.coppead.ufrj.br/fs-busca.htm?fr-art-sist_process_ pedidos.htm. Acesso em: MAR/2006
GIANNOPOULOS, G. A. Towards a European ITS for freight transport and logistics: results of current EU funded
research and prospects for the future. Eur. Transp. Res. Rev. (2009) 1:147–161
GOVINDARAJAN, V.; GUPTA, A. K. Global strategy and the organization. New York: IE-Wiley, 2003.
LIM, H., & SHIODE, N., 2011. The impact of online shopping demand on physical distribution networks: a
simulation approach. International Journal of Physical Distribution & Logistics Management, 41(8), 732-749.
LIMA, O. F. Jr. (2011) Inovação frugal: a nova rota da logística urbana. Mundo Logística, v. 23, p. 24-40.
MARCO, A. D., CAGLIANO, A. C., MANGANO, G., PERFETTI, F. Factor influencing Logistics Service Providers
Efficiency’ in Urban Distribution Systems. Transportation Research Procedia 3 ( 2014 ) 499 – 507.
MURDICK, R. G. et al. Business policy and strategy: an action guide. 6. ed. London: IE-CRC Press, 2000.
PATIER, D., BROWNE, M. A methodology for the evaluation of urban logistics innovations. The Sixth
International Conference on City Logistics, 2010.
PORTER, M. Estratégia competitiva. 4. ed. Rio de Janeiro: Campus, 2005.
ROTEM-MINDALI, O., & WELTEVREDEN, J. W., 2013. Transport effects of e-commerce: what can be learned
after years of research? Transportation, 40(5), 867-885.
XING, Y., GRANT, D. B., MCKINNON, A. C., & FERNIE, J. (2011). The interface between retailers and logistics
service providers in the online market. European Journal of Marketing, 45(3), 334-357.
YOSHIMOTO, R., NEMOTO, T. (2005) The impact of information and communication technology on road freight
transportation. International Association of Traffic and Safety Sciences (IATSS) Research Vol. 29, Nº 1, 2005.
97
SATELLITE PLATFORM AS SOLUTION FOR URBAN LOGISTICS - PONTO DE
APOIO COMO SOLUÇÃO PARA DISTRIBUIÇÃO DE CARGAS EM CENTROS
URBANOS
Rodrigo Barros Castro
Orlando Fontes Lima Jr
Maria de Lourdes Ferreira Cassiano Dias
Sérgio Adriano Loureiro
Ana Paula Reis Noletto LALT Laboratório de Aprendizagem em Logística e Transportes
Universidade Estadual de Campinas
RESUMO
Este trabalho avaliou o impacto da implantação de um ponto de apoio no dimensionamento da frota necessária
para a distribuição de bebidas no centro de Campinas/SP. Os resultados demonstram que o uso de duas motos e
duas vans para a distribuição dos pedidos de menor volume a partir do ponto de apoio é suficiente. Esta medida
reduz em aproximadamente um terço a quantidade de VUCs que circulam no centro da cidade para esta
operação, além de atenderem 77,86% dos pedidos diários da região. A grande contribuição desta proposta, com
a redução do número de veículos pesados que circulam no centro, é diminuir os congestionamentos causados
pelos caminhões, além da emissão de gases poluentes.
ABSTRACT
The purpose of this paper is the sizing of the vehicle fleet required for the distribution of beverages in
Campinas/SP downtown from the implementation of a support point. The results show that two motorcycles and
two vans are required for the distribution of the smaller orders of beverage. This measure can reduce
approximately one third of the trucks required for the operation, and attend 77,86% of the diary orders. The
contribution of this proposal, with the reduction of heavy vehicles in Campinas/SP downtown, is to diminish
congestion and the emission of pollutants, caused by trucks.
1. INTRODUÇÃO
O transporte de mercadorias em centros urbanos enfrenta grandes desafios. Dois aspectos
fundamentais enfrentados nas operações de transporte de carga são os congestionamentos e as
deficiências de infraestrutura nos pontos de carga e descarga. A eficiência das operações é
prejudicada por congestionamentos, pois muitas cidades possuem sistema viário inadequado.
O tráfego de caminhões é visto como algo que deve ser estritamente regulado, sendo que a
melhor solução seria organizá-lo de forma mais eficiente (Correia et al., 2010; Sanches,
2008)
A maior dificuldade é aliar soluções de operações eficientes, de baixo custo, sem impactos
ambientais e sociais. O novo metabolismo urbano, abordado por Lima Jr (2011), tornou estes
desafios ainda mais críticos. Nota-se um maior número de compras em menor escala, o que
aumenta o número de entregas a serem realizadas e exige um melhor planejamento de
transporte. O novo metabolismo não se restringe às compras, mas também aborda o crescente
uso do conceito Just in Time, que reduz o armazenamento de produtos e obriga uma maior
eficiência na entrega (Dablanc, 2009).
O aumento de entregas em centros urbanos discorrido por Lima Jr (2011) agrava o problema
da última milha, pois a quantidade de remessas que não são realizadas com sucesso aumenta.
Assim, o número de viagens extras até a consecução do objetivo de entrega de mercadorias é
maior. O melhor planejamento de entregas na área estudada é essencial, a fim de evitar
tráfegos mais intensos (Dutra et al., 2006).
98
Dificuldades de acesso também degradam a produtividade, já que os transportadores não
conseguem cumprir prazos em função da inexistência de locais adequados para realizar as
operações de carga e descarga. Dezi et al. (2010) retratam a importância da infraestrutura ao
propor métodos para o adequado dimensionamento das zonas de carga e descarga, além de
ressaltarem a importância de uma distribuição apropriada de vagas pela cidade.
A produtividade do sistema de transporte de cargas em centros urbanos depende de esforços
conjuntos. O setor público é responsável pela infraestrutura, regulamentação e
gerenciamento, enquanto que o setor privado desenvolve veículos adequados, realiza o
transporte dos produtos e a implantação de terminais de carga. O desafio é aliar o interesse de
ambas as partes, criando as condições necessárias para uma operação eficiente (PIARC,
2012; Patier et al., 2010; Dablanc, 2007; Muñuzuri et al., 2005).
Não existem soluções prontas ou fórmulas de sucesso para os diversos problemas oriundos do
transporte de cargas no ambiente urbano. Qualquer estratégia escolhida para a mitigação
destes problemas deve ser desenvolvida de acordo com as características de cada região.
Deve-se estabelecer uma consonância entre os objetivos conflitantes dos diversos atores que
compõem o ambiente urbano e participam do processo de distribuição de carga, como os
varejistas, o poder público, transportadores, entre outros (Correia et al., 2010; Crainic et al.,
2009).
Tendo em vista estes conflitos, a participação de todos os stakeholders nos grupos focais que
resultaram no uso do ponto de apoio como solução para a distribuição de bebidas foi
essencial. A metodologia de Living Lab proposta por Dias e Lima Jr (2014) tem se mostrado
adequada para lidar com este tipo de conflito.
Pontos de apoio são Espaços Logísticos Urbanos Especialistas, uma vez que têm como
finalidade atender regiões específicas e somente a atividade de transbordo é realizada. Esta
operação não ocorre dentro de uma área de restrição para veículos de grande porte, e o
transbordo é feito a partir de caminhões de maior capacidade. A partir do ponto de apoio
veículos menores realizam a distribuição de mercadorias (Boudoin et al., 2013).
O uso de pontos de suporte para distribuição de mercadorias em centros urbanos pode
auxiliar na redução dos congestionamentos. Zonas urbanas densas necessitam de veículos
menores para o transporte de cargas, que ainda podem contribuir com uma menor emissão de
poluentes e ruído (Crainic et al., 2004). A emissão de NOx e material particulado, principais
causadores de impactos negativos na saúde dos indivíduos, é preponderante dos veículos
pesados (CETESB, 2011).
Dentro deste contexto, o objetivo deste trabalho é o dimensionamento da frota necessária para
a distribuição de bebidas no centro de Campinas/SP a partir da implantação de um ponto de
apoio inserido no centro urbano. Esta operação foi simulada com auxílio do software
Promodel, com uso da metodologia de modelagem e simulação de eventos discretos
apresentada a seguir.
2. MODELAGEM E SIMULAÇÃO DE EVENTOS DISCRETOS Simulação de eventos discretos é uma metodologia de simulação dinâmica, em que as
variáveis do sistema se alteram em momentos distintos no tempo em função de um evento
específico. Seus elementos podem ser descritos como: entidades, atividades, recursos e
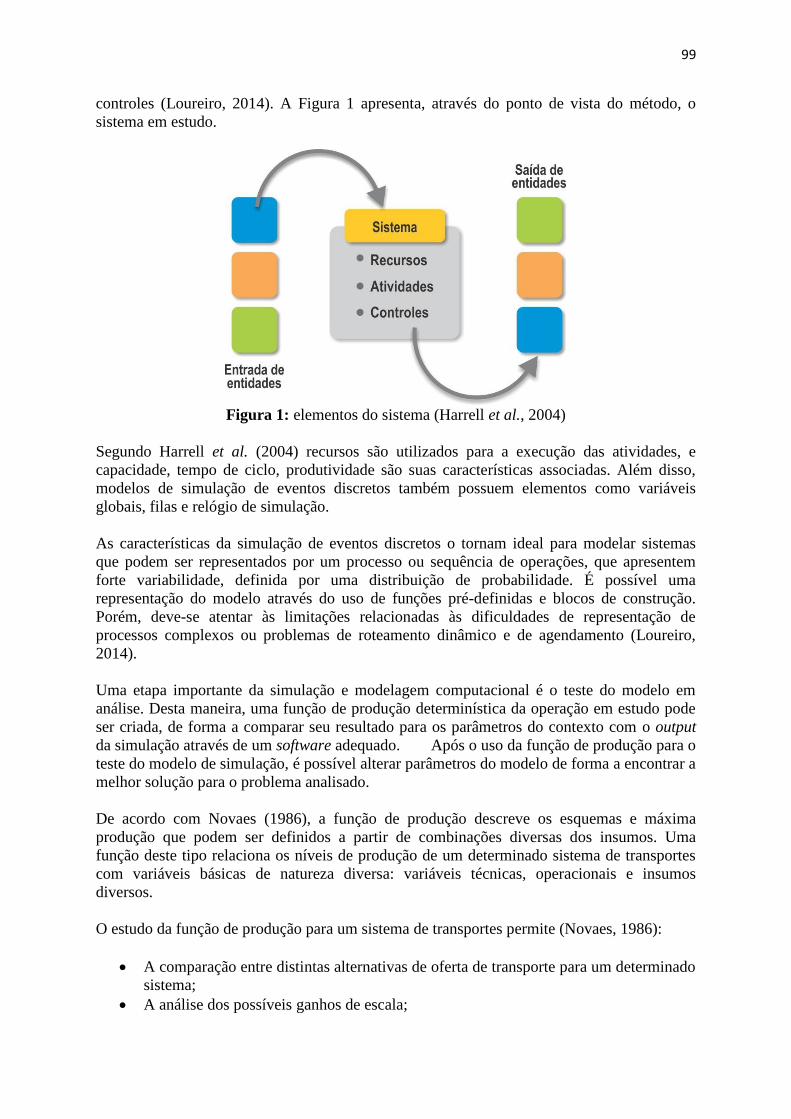
99
controles (Loureiro, 2014). A Figura 1 apresenta, através do ponto de vista do método, o
sistema em estudo.
Figura 1: elementos do sistema (Harrell et al., 2004)
Segundo Harrell et al. (2004) recursos são utilizados para a execução das atividades, e
capacidade, tempo de ciclo, produtividade são suas características associadas. Além disso,
modelos de simulação de eventos discretos também possuem elementos como variáveis
globais, filas e relógio de simulação.
As características da simulação de eventos discretos o tornam ideal para modelar sistemas
que podem ser representados por um processo ou sequência de operações, que apresentem
forte variabilidade, definida por uma distribuição de probabilidade. É possível uma
representação do modelo através do uso de funções pré-definidas e blocos de construção.
Porém, deve-se atentar às limitações relacionadas às dificuldades de representação de
processos complexos ou problemas de roteamento dinâmico e de agendamento (Loureiro,
2014).
Uma etapa importante da simulação e modelagem computacional é o teste do modelo em
análise. Desta maneira, uma função de produção determinística da operação em estudo pode
ser criada, de forma a comparar seu resultado para os parâmetros do contexto com o output
da simulação através de um software adequado. Após o uso da função de produção para o
teste do modelo de simulação, é possível alterar parâmetros do modelo de forma a encontrar a
melhor solução para o problema analisado.
De acordo com Novaes (1986), a função de produção descreve os esquemas e máxima
produção que podem ser definidos a partir de combinações diversas dos insumos. Uma
função deste tipo relaciona os níveis de produção de um determinado sistema de transportes
com variáveis básicas de natureza diversa: variáveis técnicas, operacionais e insumos
diversos.
O estudo da função de produção para um sistema de transportes permite (Novaes, 1986):
A comparação entre distintas alternativas de oferta de transporte para um determinado
sistema;
A análise dos possíveis ganhos de escala;

100
A quantificação dos fatores físicos (insumos e produtos) para uma análise econômica
(custos, receitas e valores).
3. METODOLOGIA
Para o dimensionamento de frota na implantação de um ponto de apoio que suporte a
distribuição de bebidas no centro de Campinas/SP, optou-se pela metodologia de pesquisa de
modelagem e simulação computacional de eventos discretos. A Figura 2 ilustra o fluxograma
do procedimento adotado.
Figura 2: etapas do desenvolvimento da pesquisa
A revisão bibliográfica teve como finalidade identificar trabalhos que abordam o tema de
logística urbana e que contribuam para o referencial teórico e motivação da pesquisa, além de
definir conceitos básicos de modelagem e simulação de eventos discretos. Após esta etapa, o
contexto do desenvolvimento da pesquisa foi descrito. Esta etapa possibilitou o correto
delineamento do problema, além dos objetivos a serem atingidos.
A terceira etapa do trabalho é o desenvolvimento do modelo computacional, em que o
método de modelagem escolhido foi a simulação de eventos discretos. O processo de
desenvolvimento consiste na codificação do modelo conceitual desenvolvido na etapa
anterior em uma linguagem computacional. Assim, são realizados experimentos, onde os
parâmetros são alterados, o que possibilita que diferentes cenários sejam criados. Isso permite
uma maior compreensão do sistema modelado, uma vez que pode-se observar os processos
mais críticos do problema em estudo. O modelo foi testado com uma função de produção,
para garantir sua aproximação com a realidade analisada.
3.1 Aplicação da metodologia
O setor de bebidas foi escolhido por representar um segmento crítico, com transporte de
grandes volumes em uma operação complexa. Nesta operação as cargas se deslocam do
centro de distribuição com caminhões toco até o ponto de apoio, a partir de onde são
distribuídas por motos e vans, de acordo com o tamanho do pedido feito pelo estabelecimento
comercial. Os maiores pedidos ainda são transportados com VUCs, a partir do centro de
distribuição. Este sistema foi modelado com auxílio do software Promodel.
Para analisar a logística da entrega de bebidas no centro de Campinas/SP, os
estabelecimentos comerciais que trabalham com bebidas foram localizados. Uma pesquisa de
campo foi realizada, com a finalidade de avaliar as necessidades de melhoria da operação. A
Figura 3 ilustra a área de estudo demarcada. Nesta etapa, um questionário foi aplicado de
forma a caracterizar os estabelecimentos e suas operações de recebimento de bebidas.
Entender a estrutura operacional do processo de carga e descarga foi de suma importância.
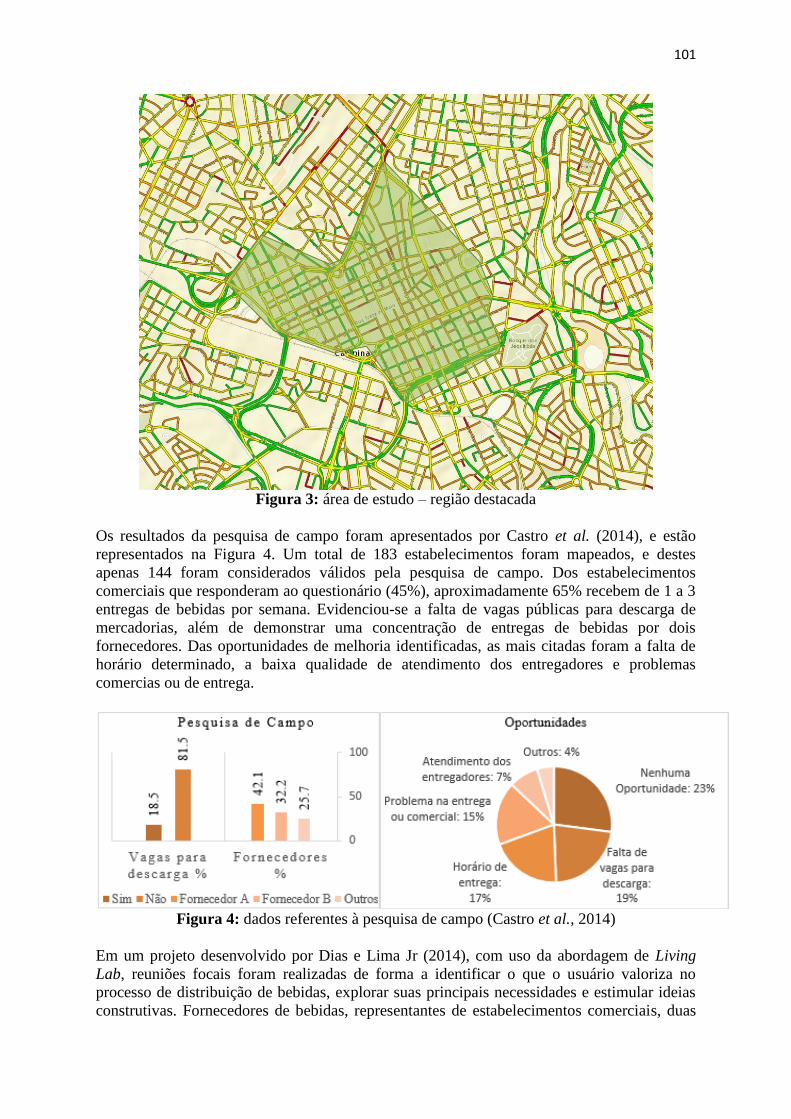
101
Figura 3: área de estudo – região destacada
Os resultados da pesquisa de campo foram apresentados por Castro et al. (2014), e estão
representados na Figura 4. Um total de 183 estabelecimentos foram mapeados, e destes
apenas 144 foram considerados válidos pela pesquisa de campo. Dos estabelecimentos
comerciais que responderam ao questionário (45%), aproximadamente 65% recebem de 1 a 3
entregas de bebidas por semana. Evidenciou-se a falta de vagas públicas para descarga de
mercadorias, além de demonstrar uma concentração de entregas de bebidas por dois
fornecedores. Das oportunidades de melhoria identificadas, as mais citadas foram a falta de
horário determinado, a baixa qualidade de atendimento dos entregadores e problemas
comercias ou de entrega.
Figura 4: dados referentes à pesquisa de campo (Castro et al., 2014)
Em um projeto desenvolvido por Dias e Lima Jr (2014), com uso da abordagem de Living
Lab, reuniões focais foram realizadas de forma a identificar o que o usuário valoriza no
processo de distribuição de bebidas, explorar suas principais necessidades e estimular ideias
construtivas. Fornecedores de bebidas, representantes de estabelecimentos comerciais, duas
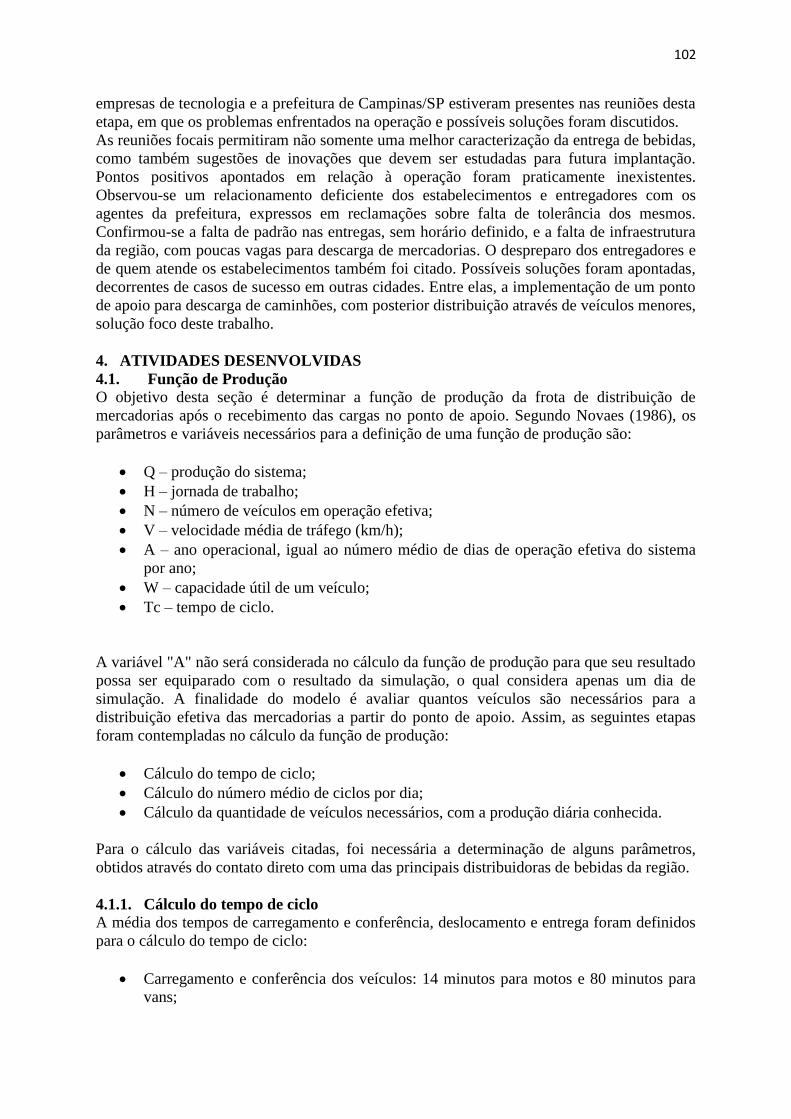
102
empresas de tecnologia e a prefeitura de Campinas/SP estiveram presentes nas reuniões desta
etapa, em que os problemas enfrentados na operação e possíveis soluções foram discutidos.
As reuniões focais permitiram não somente uma melhor caracterização da entrega de bebidas,
como também sugestões de inovações que devem ser estudadas para futura implantação.
Pontos positivos apontados em relação à operação foram praticamente inexistentes.
Observou-se um relacionamento deficiente dos estabelecimentos e entregadores com os
agentes da prefeitura, expressos em reclamações sobre falta de tolerância dos mesmos.
Confirmou-se a falta de padrão nas entregas, sem horário definido, e a falta de infraestrutura
da região, com poucas vagas para descarga de mercadorias. O despreparo dos entregadores e
de quem atende os estabelecimentos também foi citado. Possíveis soluções foram apontadas,
decorrentes de casos de sucesso em outras cidades. Entre elas, a implementação de um ponto
de apoio para descarga de caminhões, com posterior distribuição através de veículos menores,
solução foco deste trabalho.
4. ATIVIDADES DESENVOLVIDAS
4.1. Função de Produção
O objetivo desta seção é determinar a função de produção da frota de distribuição de
mercadorias após o recebimento das cargas no ponto de apoio. Segundo Novaes (1986), os
parâmetros e variáveis necessários para a definição de uma função de produção são:
Q – produção do sistema;
H – jornada de trabalho;
N – número de veículos em operação efetiva;
V – velocidade média de tráfego (km/h);
A – ano operacional, igual ao número médio de dias de operação efetiva do sistema
por ano;
W – capacidade útil de um veículo;
Tc – tempo de ciclo.
A variável "A" não será considerada no cálculo da função de produção para que seu resultado
possa ser equiparado com o resultado da simulação, o qual considera apenas um dia de
simulação. A finalidade do modelo é avaliar quantos veículos são necessários para a
distribuição efetiva das mercadorias a partir do ponto de apoio. Assim, as seguintes etapas
foram contempladas no cálculo da função de produção:
Cálculo do tempo de ciclo;
Cálculo do número médio de ciclos por dia;
Cálculo da quantidade de veículos necessários, com a produção diária conhecida.
Para o cálculo das variáveis citadas, foi necessária a determinação de alguns parâmetros,
obtidos através do contato direto com uma das principais distribuidoras de bebidas da região.
4.1.1. Cálculo do tempo de ciclo
A média dos tempos de carregamento e conferência, deslocamento e entrega foram definidos
para o cálculo do tempo de ciclo:
Carregamento e conferência dos veículos: 14 minutos para motos e 80 minutos para
vans;

103
Deslocamento total: 23 minutos para motos e 122 minutos para vans;
Entrega: 12 minutos para motos e 16 minutos para vans.
Assim, o tempo de ciclo é:
4.1.2. Cálculo do número médio de ciclos por dia
O cálculo do número médio de ciclos por dia (m) pode ser definido como a razão entre a
jornada de trabalho (8 horas) e o tempo de ciclo:
Como a quantidade de ciclos por dia deve ser um número inteiro, considera-se 10 ciclos por
dia para motos e 2 ciclos por dia para vans.
4.1.3. Cálculo da quantidade de veículos necessários
Segundo Novaes (1986), a função de produção adaptada ao contexto analisado é:
O valor de produção diária é calculado em função do número de pedidos que cada tipo de
veículo é designado, e cada pedido recebe uma distribuição triangular para seu tamanho,
ambos os dados fornecidos pela empresa.
Considerando o valor de produção diária e a capacidade dos veículos, além do tempo de ciclo
calculado, foi determinada a quantidade de veículos necessária através da Equação 5. Como
ambos os valores de N não apresentaram valores inteiros, uma aproximação foi realizada:
4.2. Teste do modelo
Conforme citado na revisão bibliográfica, é necessário testar o modelo construído de forma a
garantir a confiança e efetividade do mesmo. Assim, um modelo para o ponto de apoio foi
construído através do software de simulação de eventos discretos Promodel. Uma das
principais distribuidoras de bebidas da região forneceu os dados necessários para a
construção do modelo de simulação. Para o teste do modelo, as médias dos tempos também
foram utilizadas.
Na situação proposta, os caminhões toco levam a carga do Centro de Distribuição (CD) ao
ponto de apoio no começo do dia. Os veículos que fazem a distribuição a partir do ponto de
apoio chegam ao local no mesmo horário.
Ao chegar no ponto de apoio, os pedidos sofrem transbordo para os veículos menores, de
acordo com o tamanho do pedido do cliente. Os veículos podem sair com um ou mais
pedidos, dependendo da sua capacidade.
Para efeito de simplificação para a simulação, os clientes foram agregados em 3 tipos:
Clientes Moto, Clientes Van e Clientes VUC, dependendo da quantidade de cubos em seus
pedidos. A palavra “cubo” é utilizada pela empresa de distribuição como um pacote de
(1) (2)
(3)
(4)
(5)
(7)
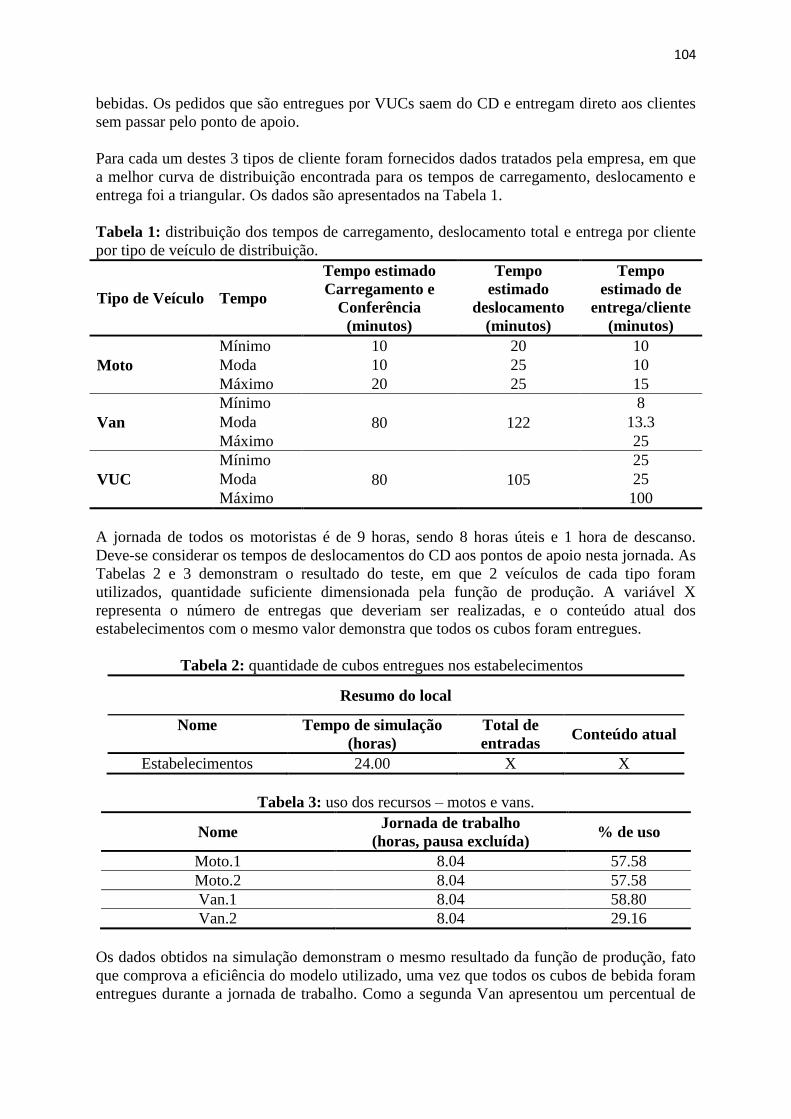
104
bebidas. Os pedidos que são entregues por VUCs saem do CD e entregam direto aos clientes
sem passar pelo ponto de apoio.
Para cada um destes 3 tipos de cliente foram fornecidos dados tratados pela empresa, em que
a melhor curva de distribuição encontrada para os tempos de carregamento, deslocamento e
entrega foi a triangular. Os dados são apresentados na Tabela 1.
Tabela 1: distribuição dos tempos de carregamento, deslocamento total e entrega por cliente
por tipo de veículo de distribuição.
Tipo de Veículo Tempo
Tempo estimado
Carregamento e
Conferência
(minutos)
Tempo
estimado
deslocamento
(minutos)
Tempo
estimado de
entrega/cliente
(minutos)
Moto
Mínimo 10 20 10
Moda 10 25 10
Máximo 20 25 15
Van
Mínimo
80
122
8
Moda 13.3
Máximo 25
VUC
Mínimo
80
105
25
Moda 25
Máximo 100
A jornada de todos os motoristas é de 9 horas, sendo 8 horas úteis e 1 hora de descanso.
Deve-se considerar os tempos de deslocamentos do CD aos pontos de apoio nesta jornada. As
Tabelas 2 e 3 demonstram o resultado do teste, em que 2 veículos de cada tipo foram
utilizados, quantidade suficiente dimensionada pela função de produção. A variável X
representa o número de entregas que deveriam ser realizadas, e o conteúdo atual dos
estabelecimentos com o mesmo valor demonstra que todos os cubos foram entregues.
Tabela 2: quantidade de cubos entregues nos estabelecimentos
Resumo do local
Nome Tempo de simulação
(horas)
Total de
entradas Conteúdo atual
Estabelecimentos 24.00 X X
Tabela 3: uso dos recursos – motos e vans.
Nome Jornada de trabalho
(horas, pausa excluída) % de uso
Moto.1 8.04 57.58
Moto.2 8.04 57.58
Van.1 8.04 58.80
Van.2 8.04 29.16
Os dados obtidos na simulação demonstram o mesmo resultado da função de produção, fato
que comprova a eficiência do modelo utilizado, uma vez que todos os cubos de bebida foram
entregues durante a jornada de trabalho. Como a segunda Van apresentou um percentual de

105
uso baixo, uma nova simulação foi realizada com apenas um recurso para este tipo de
veículo, quantidade que não foi suficiente para a entrega de todos os cubos.
O modelo proposto, uma vez testado, permite o dimensionamento com uso das distribuições
triangulares, fornecidas pela distribuidora de bebidas. Esta foi a melhor distribuição
probabilística encontrada com os dados fornecidos pela empresa. Este processo garante um
resultado mais preciso, pois as distribuições apresentam um intervalo de variabilidade alto. A
próxima seção apresenta os resultados do uso do modelo para a situação proposta.
4.3. Dimensionamento da frota
Para garantir que a variabilidade dos resultados será analisada, 100 (cem) replicações da
simulação foram realizadas. As Tabelas 4 e 5 apresentam o resultado da simulação com uso
de dois veículos de cada tipo para a distribuição a partir do ponto de apoio, solução apontada
pela função de produção.
Tabela 4: média da quantidade total de cubos entregues nos estabelecimentos, e média da
quantidade de cubos transportados pelas motos e vans
Resumo do local (média)
Nome Tempo de simulação
(horas)
Total de
entradas Conteúdo atual
Carregar moto 24.00 Y 0.00
Carregar Van 24.00 Z 0.00
Estabelecimentos 24.00 X X
Tabela 5: uso dos recursos (média das replicações) – motos e vans
Nome Jornada de trabalho (horas,
pausa excluída) % de uso
Moto.1 8.04 68.55
Moto.2 8.04 62.59
Van.1 8.04 91.91
Van.2 8.04 45.94
Os resultados, com um número maior de simulações, corroboram o resultado do teste e
confirmam que a quantidade determinada pela função de produção foi adequada, e os
veículos apresentaram um percentual de uso maior. A situação proposta prevê o uso de duas
motos e duas vans para a distribuição de pedidos de menor tamanho, com entregas a partir do
ponto de apoio, enquanto que os pedidos dos VUCs são transportados a partir do CD. Os
locais “Carregar moto” e “Carregar Van” apresentaram a média do conteúdo atual no final do
dia de operação igual a zero, o que confirma que em todas as replicações todos os cubos
foram entregues.
5. CONCLUSÕES
O uso da função de produção determinística para dimensionamento de frotas é uma solução
simples de ser aplicada, com a utilização da média dos tempos necessários. A simulação de
eventos discretos, com a função de produção determinística como teste e posterior utilização
de distribuições triangulares, possibilita resultados mais adequados à realidade uma vez que a
variabilidade probabilística da operação é considerada.
106
Verifica-se que o projeto de implantação de um ponto de apoio de abastecimento inserido no
centro da cidade possibilita a redução do número de caminhões que trafegam nessa área e de
possíveis congestionamentos. A entrega com motos ainda minimiza a dificuldade de
encontrar vagas de carga e descarga, detectada na pesquisa de campo e reuniões focais. O uso
de um ponto de apoio para pedidos de menor quantidade possibilita a entrega de
aproximadamente um terço do volume de bebida com apenas duas motos e duas vans. Além
disso, 77,86% dos estabelecimentos receberiam seus pedidos em veículos mais leves, que
ocupam menos espaço no ambiente urbano, proporcionam uma redução na emissão de
poluentes (NOx e material particulado) e no nível de ruído. Assim, integra-se a cidade no
sentido de reduzir os congestionamentos e aumentar a mobilidade, sem penalizar as
atividades comerciais e a qualidade de vida da população.
O uso da metodologia de modelagem e simulação de eventos discretos se mostrou adequada
ao estudo, uma vez que permite analisar facilmente diferentes cenários, com a mudança dos
parâmetros do sistema. Além disso, possibilitou o dimensionamento do número de veículos
necessários para a operação proposta.
Agradecimentos
Agradecemos ao Conselho Nacional de Desenvolvimento Científico e Tecnológico (CNPq) pelo apoio ao
desenvolvimento desta pesquisa.
REFERÊNCIAS BIBLIOGRÁFICAS
BOUDOIN, D.; MOREL, C.; GARDAT, M. (2013) Supply Chains and Urban Logistics Platforms. In:
Sustainable Urban Logistics : Concepts, Methods and Information Systems. Gonzalez-Feliu, J.;Semet, F.,
et al. Dordrecht: Springer Berlin Heidelberg: 1-20 p.
CASTRO R. B., LIMA JÚNIOR, O. F., DIAS, M. L. F. C. (2014) Identificação dos fatores de ineficiência na
distribuição de mercadorias em centros urbanos. XXVIII ANPET - Congresso de Pesquisa e Ensino
em Transportes, Curitiba.
CETESB (Cia Ambiental do Estado de São Paulo). (2011) Emissões veiculares no estado de São Paulo. Série
Relatórios. Disponível em < http://www.cetesb.sp.gov.br/>.
CRAINIC, T.G., RICCIARDI N., STORCHI G. (2004) Advanced freight transportation systems for congested
urban areas. Transportation Research Part C: Emerging Technologies. Volume 12, Issue 2, pages 119-
137.
CRAINIC, T.G., RICCIARDI N., STORCHI G. (2009) Models for evaluating and planning city logistics
systems. Transp Sci 43(4):432–454
CORREIA, V. A., OLIVEIRA, L. K., MATEUS, G. R. (2010) Perspectivas para a melhoria da distribuição
urbana de mercadorias. XXIV Congresso de Pesquisa e Ensino em Transportes.
DABLANC, L. (2007) Goods Transport in Large European Cities: Difficult to Organize, Difficult to
Modernize. 41 Transportation Research Part A 280, 285.
DABLANC, L. (2009) Freight transport for development toolkit: Urban Freight. Transport Research Support.
DUTRA, N. G. S., NOVAES, A. G. N., MOREIRA, M. E. P. (2006) Novos conceitos e tecnologias na
distribuição urbana de mercadorias. XXVI ENEGEP.
DEZI, G., DONDI, G., SANGIORGI, C. (2010) Urban freight transport in Bologna: Planning commercial
vehicle loading/unloading zones. Elsevier, Procedia Social and Behavioral Sciences, 2:5990–6001.
DIAS, M. L. F. C. e O. F. LIMA Jr. (2014) Uso da abordagem de living lab no desenvolvimento de inovações
em logística urbana. XXVIII ANPET, Curitiba.
HARRELL, C.; GHOSH, B. K.; BOWDEN JR, R. O. (2004) Simulation Using Promodel. New York: McGraw
Hill.
LIMA, O. F. JR. (2011) Inovação frugal: a nova rota da logística urbana. Mundo Logística, 23:24-40.
LOUREIRO, S. A. (2014) Análise dos impactos dos arranjos relacionais em transportes por modelo
multiagentes. Tese de doutorado, Universidade Estadual de Campinas.
MUÑUZURI, J., LARRAÑETA, J., ONIEVA, L., CORTÉS, P. (2005) Solutions applicable by local
administrations for urban logistics improvement. Cities, v. 22, n° 1, p. 15-28.
NOVAES, A. G. (1986) Sistemas de transportes. Volume 2: Análise da Oferta.
PATIER, D., BROWNE, M. (2010) A methodology for the evaluation of urban logistics innovations. The Sixth
International Conference on City Logistics.

107
PIARC – The World Road Association. (2012) Public sector governance of urban freight transport. Disponível
em < http://www.piarc.org >
SANCHES, P. F. JR. (2008) Logística de carga urbana: uma análise da realidade brasileira. Tese de
doutorado, Universidade Estadual de Campinas.
108
Identifying clusters to implement urban logistics
best practices: the case of São Paulo
Rodrigo Barros Castro1, Daniel Merchan2, Orlando Fontes Lima Jr3
1: Logistics and Transportation Learning Laboratory – LALT, UNICAMP, Brazil
[email protected] 2: MIT Center for Transportation and Logistics, Massachusetts Institute of Technology, 77
Masachussetts Avenue, E40-286, Cambridge, MA 02139 USA [email protected]
3: Logistics and Transportation Learning Laboratory – LALT, UNICAMP, Brazil [email protected]
Abstract
Cities have different characteristics, and policy measures applied in different urban areas can only result in different associated impacts. The purpose of this paper is to apply a data-driven methodology to identify clusters to guide São Paulo’s urban logistics policy and practice decisions. The methodology uses relevant variables for urban logistics – establishments’ concentration, population, infrastructure (road capacity and road density), and regulation data – in order to perform two statistical analysis: Principal Component Analysis and K-means clustering. The results suggest segmenting the city into five different clusters, as a basis for further cluster-specific analyses and implementation of practices. Keywords: Urban Logistics, City Logistics, Cluster, Last Mile
Urban Logistics challenges Freight transport in urban centers generates a variety of economic, environmental and social negative impacts, and an efficient transportation planning system is required to have responsive and viable operations. Congestion affects the economy of the cities because of the waste of resources and inefficiency generated by them. The emission of pollutants, the use of non-renewable fuel and waste products such as tires and oil alter its surroundings, and are relevant environmental impacts. Social impacts such as the physical consequence of pollutants emission (diseases), the accidents resulting from traffic, the high noise levels, among others can be listed (BESTUFS, 2007). Despite the negative impacts involved on its operations, cities depend on cargo transportation. City logistics plays an essential role in maintaining and retaining industrial and commercial activities, which are essential for major wealth generating activities, and for employing the population. Efficient freight transport operations increase the competitiveness of industry, and are critical to sustain the current life style in cities. Thus, urban logistics activities have to deal with conflicts between commercial interests and the urban environment (Dablanc, 2009). City logistics faces critical challenges, and the necessity to balance efficient solutions, with associated environmental and social impacts. The new urban metabolism, with changes in consumption patterns and e-commerce penetration, has made these challenges even more critical: there is a higher number of purchases to a lesser extent, which increases the number of required deliveries and needs a better transportation planning (Lima Jr., 2011). This new metabolism is not restricted to shopping, and addresses other supply chain activities, such as the growing adoption of the Just in Time concept, which reduces the storage of products and requires a greater efficiency in services (Dablanc, 2009). The increase in urban logistics operations approached by Lima Jr. (2011) exacerbates the last mile challenge, because of the increased number on unsuccessful deliveries, especially on B2C (Business to Consumer) operations. Thus, cities are experiencing a higher number of trips to the achievement of freight deliveries, fact that contributes to all negative impacts aforementioned. Therefore, the better planning of city logistics activities in a specific study area is essential in order to avoid more intense traffic (Dutra, 2004).

109
There are no global solutions or success formulas for the various challenges arising from freight forwarding in the urban environment. To mitigate these problems, the public officials and private sector operators should develop solutions or strategies according to the characteristics of each city and region. To achieve this, they also need to consider potentially conflicting objectives from the various stakeholders that influence the freight distribution process, such as retailers, government agencies, carriers, logistics operators, among others (Crainic et al., 2009). Several logistics practices have been introduced to address the challenges of city logistics. However, cities have different characteristics, and policy measures applied in different urban areas can only result in different associated impacts. Thus, it is essential to consider urban-specific characteristics to enhance the transferability and sustainability of urban logistics solutions (Alho and Silva, 2015). The objective of the project is the application of a proposed data-driven methodology in the city São Paulo, Brazil, to identify logistics clusters that could inform the implementation of urban logistics best practices in the city. With a better understanding of the city’s sub-areas, it is expected that the study will help to rationalize city logistics planning by identifying solutions that are consistent with São Paulo’s urban logistics characteristics.
Cluster Theory Analysis Clusters are the origin of cities – trade fairs grouped and facilitated the trade of products and provided security, in which cities grown and thrived thereafter. A definition of clusters states it as a grouping of similar things, such as geographical factors, type of business, or business relationships along the supply chain (United Nations, 2007). The cluster boundary delineation if often imprecise, and, according to Porter (1998), “a cluster is a geographically proximate group of interconnected companies and associated institutions in a particular field, linked by commonalities and complementarities.” Clustering activities dates back to Aristotle, and is one of the most primitive and important activities of human beings (Jian and Chen, 2009). Cluster theory analysis facilitates the exploration of natural or hidden data structure and groups commonalities in a set of data objects, aiding on the development of insights regarding the studied area. There is no defined pattern to the dimensions analysed and how to measure these dimensions on cluster theory studies, and researchers developed various methods with the purpose of developing cluster theory analysis. Company’s size, its internal structure, transport, communications, other technologies, infrastructure data, demographic data, cultural influences, among others, affect the process of clustering (United Nations, 2007). It is clear that the cluster theory methodology is not new. However, its application in distinct study fields, besides its existence in various regions of the world, with different objectives, highlights the applicability of the study. The next section presents the cluster theory analysis methodology adopted on this project.
Methodology The research study follows the methodology described in Ponce-Cueto et al. (2015): (1) Collection and processing information, in which we collected demographic, socioeconomic, regulation and infrastructure data from secondary database and using Geographic Information Systems. (2) Statistical analysis, mainly principal component analysis (PCA) and k-means clustering analysis. (3) Logistics clusters identification – a categorization of different areas of the city according to urban logistics characteristics. (4) And; finally, general recommendations for public policy aiming contributions for urban freight mobility (Ponce-Cueto et al., 2015). Figure 1 represents the data-driven methodology.
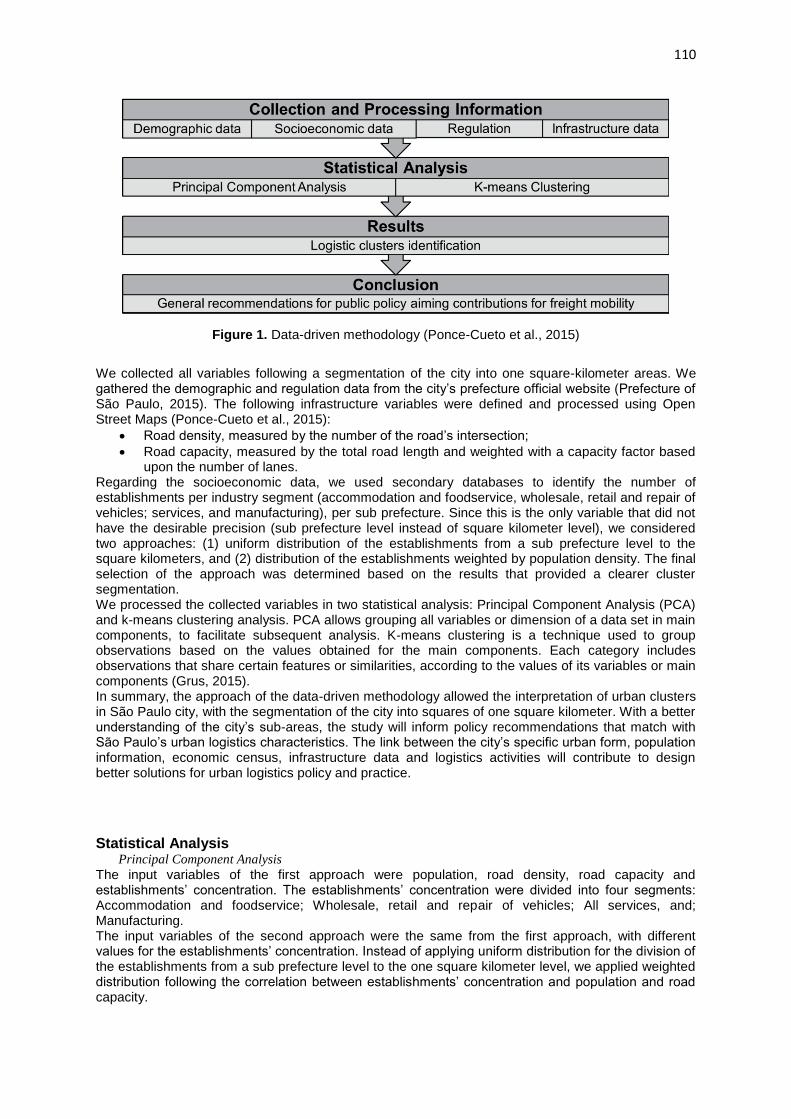
110
Figure 1. Data-driven methodology (Ponce-Cueto et al., 2015)
We collected all variables following a segmentation of the city into one square-kilometer areas. We gathered the demographic and regulation data from the city’s prefecture official website (Prefecture of São Paulo, 2015). The following infrastructure variables were defined and processed using Open Street Maps (Ponce-Cueto et al., 2015):
Road density, measured by the number of the road’s intersection;
Road capacity, measured by the total road length and weighted with a capacity factor based upon the number of lanes.
Regarding the socioeconomic data, we used secondary databases to identify the number of establishments per industry segment (accommodation and foodservice, wholesale, retail and repair of vehicles; services, and manufacturing), per sub prefecture. Since this is the only variable that did not have the desirable precision (sub prefecture level instead of square kilometer level), we considered two approaches: (1) uniform distribution of the establishments from a sub prefecture level to the square kilometers, and (2) distribution of the establishments weighted by population density. The final selection of the approach was determined based on the results that provided a clearer cluster segmentation. We processed the collected variables in two statistical analysis: Principal Component Analysis (PCA) and k-means clustering analysis. PCA allows grouping all variables or dimension of a data set in main components, to facilitate subsequent analysis. K-means clustering is a technique used to group observations based on the values obtained for the main components. Each category includes observations that share certain features or similarities, according to the values of its variables or main components (Grus, 2015). In summary, the approach of the data-driven methodology allowed the interpretation of urban clusters in São Paulo city, with the segmentation of the city into squares of one square kilometer. With a better understanding of the city’s sub-areas, the study will inform policy recommendations that match with São Paulo’s urban logistics characteristics. The link between the city’s specific urban form, population information, economic census, infrastructure data and logistics activities will contribute to design better solutions for urban logistics policy and practice.
Statistical Analysis Principal Component Analysis
The input variables of the first approach were population, road density, road capacity and establishments’ concentration. The establishments’ concentration were divided into four segments: Accommodation and foodservice; Wholesale, retail and repair of vehicles; All services, and; Manufacturing. The input variables of the second approach were the same from the first approach, with different values for the establishments’ concentration. Instead of applying uniform distribution for the division of the establishments from a sub prefecture level to the one square kilometer level, we applied weighted distribution following the correlation between establishments’ concentration and population and road capacity.
111
K-means Clustering
According to Pham et al. (2005), k-means algorithm is a popular data-clustering tool, and gives as output the K optimal number of clusters and its division. We adopted the F-Statistic for selecting the optimal number of clusters. Since the optimal statistical number (K optimal) is not necessarily the best representation of the city, and the code used allows increasing K optimal giving new clustering distributions as output, we tried the following values for k for each scenario: K optimal, K optimal + 1, K optimal + 2, and K optimal +3. After analysing the clusters map output for each K value, we selected the most representative for each scenario. The next step consists of a further analysis in order to select the most representative cluster map for São Paulo city. The most representative clusters map chosen for scenarios (1) and (2) are almost equal, and have five clusters. Since both maps are similar, and we adopted correlation between variables for the weighted distribution approach, we chose the first scenario to illustrate the city, as correlations do not necessarily imply a causal relationship.
Results We normalized the data from each cluster, in order to analyze its logistics profile. Table 1 presents the data on the real and normalized scale and Figure 2 illustrates the clusters map.
Table 1: Real and normalized clusters’ results.
Cluster Population
Road capacity
Road density
Wholesale, retail and repair of vehicles
Accommodation & food service
All services
Manufacturing
average 0 29117.88 29.48 99.01 69.85 67.05 289.46 14.09
average 1 15549.04 33.00 101.84 216.48 218.88 995.83 41.16
average 2 3428.88 10.13 28.52 12.28 10.55 42.66 2.33
average 3 10626.66 29.71 120.83 27.75 22.86 93.95 5.53
average 4 23074.57 40.47 112.43 571.00 519.00 2524.00 102.00
total 81797.03 142.78 462.63 897.37 838.35 3945.90 165.11
normalized 0 0.36 0.21 0.21 0.08 0.08 0.07 0.09
normalized 1 0.19 0.23 0.22 0.24 0.26 0.25 0.25
normalized 2 0.04 0.07 0.06 0.01 0.01 0.01 0.01
normalized 3 0.13 0.21 0.26 0.03 0.03 0.02 0.03
normalized 4 0.28 0.28 0.24 0.64 0.62 0.64 0.62
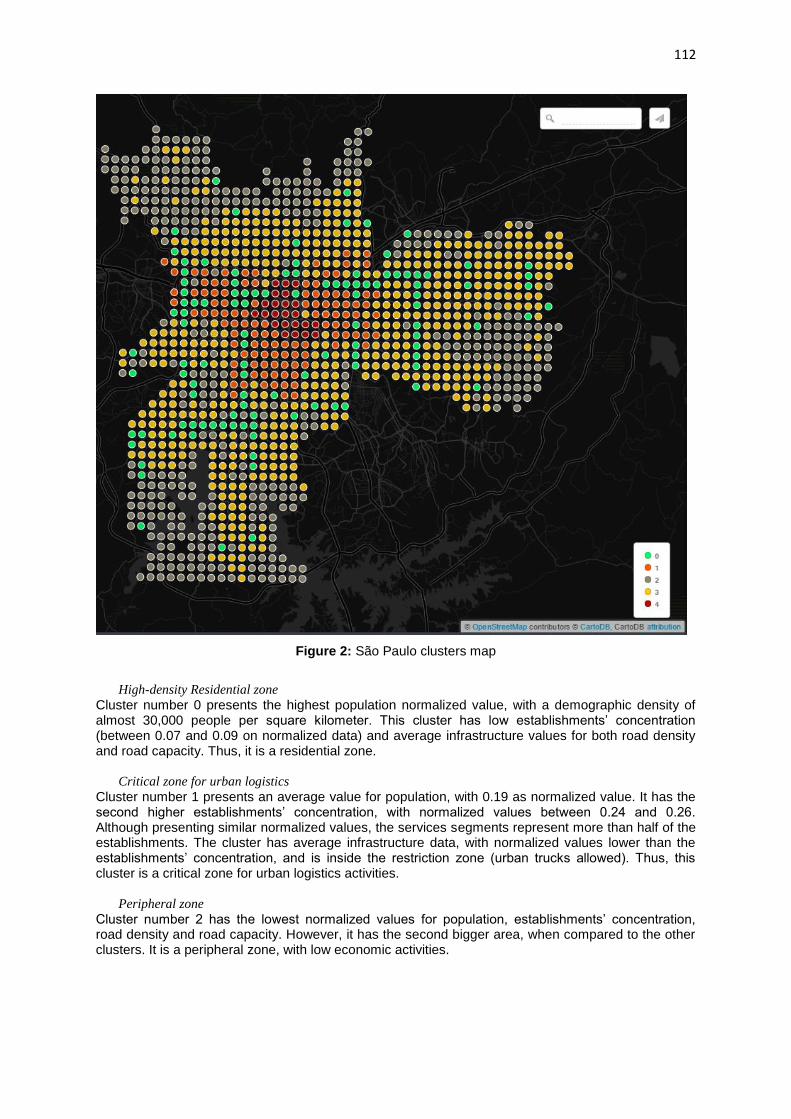
112
Figure 2: São Paulo clusters map
High-density Residential zone
Cluster number 0 presents the highest population normalized value, with a demographic density of almost 30,000 people per square kilometer. This cluster has low establishments’ concentration (between 0.07 and 0.09 on normalized data) and average infrastructure values for both road density and road capacity. Thus, it is a residential zone.
Critical zone for urban logistics
Cluster number 1 presents an average value for population, with 0.19 as normalized value. It has the second higher establishments’ concentration, with normalized values between 0.24 and 0.26. Although presenting similar normalized values, the services segments represent more than half of the establishments. The cluster has average infrastructure data, with normalized values lower than the establishments’ concentration, and is inside the restriction zone (urban trucks allowed). Thus, this cluster is a critical zone for urban logistics activities.
Peripheral zone
Cluster number 2 has the lowest normalized values for population, establishments’ concentration, road density and road capacity. However, it has the second bigger area, when compared to the other clusters. It is a peripheral zone, with low economic activities.

113
Low-density residential zone
Cluster number 3 has a low normalized value for population density (0.13) and for establishments’ concentration (between 0.2 and 0.3 on normalized data). However, this cluster presents high road density and average road capacity normalized values. In addition to the infrastructure data, it is practically outside the restriction zone, and therefore, represents a zone with high growth potential.
Central area
Cluster number 4 presents a high population density: 23074.57 inhabitants per square kilometer, with a normalized value of 0.28. This cluster contains the higher commercial activity, with a normalized value higher than 0.6 for every studied segment. Despite having its infrastructure values above average, they do not stand out as much as population or establishments’ concentration. This cluster is inside the restriction zone (urban trucks allowed). Figure 12 presents its logistics profile. This cluster represents “Sé” sub prefecture. It corresponds to the oldest occupied area of São Paulo city, initiated on the XVI century, and is known as the “old downtown”. The inhabitants’ are leaving this region over time, but as the logistics profile shows, it is still a high-populated zone. The cluster concentrates low-income population. Figure 3 illustrates the clusters’ characteristics, according to the studied variables.
Figure 3: Clusters’ characteristics
Public policy and general recommendations São Paulo’s segmentation into five different clusters presents a contribution to city logistics planning, and we will discuss some insights with the presented results, aiding outcomes specially to the last mile challenge (Table 2).

114
Table 2: Recommendations for each analysed cluster.
Cluster (0)
High-density
Residential Zone
In residential areas, policies providing vehicles speed and noise control are important to ensure adequate levels of life quality and safety. Public policies adequate to this region could also improve last mile delivery assertiveness,
specifically B2C deliveries. Further, cluster-specific analyses are suggested for the proposal of specific solutions.
Cluster (1)
Critical zone for urban logistics
There is a lack of accessibility due to low road density in comparison with establishments and population concentration, and for being inside the restriction zone. Investments in infrastructure are essential, and urban
distribution centers can aid on freight consolidation.
Cluster (2)
Peripheral zone
We recommend public policies aiming the economic development of the region. Infrastructure development is also required, with focus on ensuring
accessibility from logistics centers/industrial zones to residential/commercial areas. Slums concentration.
Cluster (3)
Low-density zone
No infrastructure constraints, since establishments and population concentration are low when compared to road density and capacity. The zone
has a high potential for economic growth.
Cluster (4)
Central zone
Very high concentration of commercial establishments and population. The cluster is known as “old downtown” and is inside the restriction area. A
satellite platform can be a great solution for freight forwarding in central areas, as well as the provision of infrastructure such as delivery bays for
parking VUC’s is critical. The use of delivery windows for freight forwarding in this area may also be explored. For companies, night deliveries can be an option to improve operational efficiency levels due to low traffic levels at
night. Further studies are needed to development of solutions.
Conclusions The study presents a cluster-based data-driven methodology applied in São Paulo city, to identify urban clusters related to city logistics. Out of the five identified clusters, two of them are inside the restriction zone for heavy vehicles: the most critical areas for urban logistics. In addition, the cluster with the higher economic activities is on São Paulo’s “old downtown”, with more than 60% of the city’s establishments (all segments). We presented freight consolidating strategies as adequate solutions for both clusters. Solutions such as night deliveries and implementation of delivery windows can also be explored, although further studies are required. Regarding the residential area, strategies aiding B2C deliveries should be adopted, increasing last mile delivery assertiveness. We classified the other regions of the city as low-density zone for urban logistics, due to the available infrastructure, and peripheral zone, with opportunities on ensuring accessibility between logistics centers/industrial zones and residential/commercial areas. Based on the results, we can conclude the quantitative methodology is efficient on analyzing urban centers, since the provided clusters are a good representation of the city, with important insights when studying freight mobility. Further studies should focus on evaluating the feasibility of proposed solutions in specific clusters as well as including additional variables, such as Human Development Index and percentage of taxes over services, to explore the impact in the cluster generation.
115
Acknowledgements The authors gratefully acknowledge CNPq, the MIT Center for Transportation and Logistics, and the Logistics and Transportation Learning Laboratory – LALT for supporting the research
References Alho, A. R., & Silva, J. A. Utilizing urban form characteristics in urban logistics analysis: a case study in Lisbon, Portugal. Journal of Transport Geography 42, 57 – 71, 2015. BESTUFS (2007). Good Practice Guide on Urban Freight, www.bestufs.net. Accessed in Oct 2015 CRAINIC, T.G., RICCIARDI N., STORCHI G. (2009) Models for evaluating and planning city logistics systems. Transp Sci 43(4):432–454 DABLANC, L. Freight transport for development toolkit: Urban Freight. Transport Research Support, 2009. DUTRA, N. O Enfoque de City Logistics na Distribuição Urbana de Encomendas. Tese (doutorado em Engenharia de Produção) – Universidade Federal de Santa Catarina. Orientador: Antônio Galvão Naclério Novaes (2004). Grus, J. (2015). Data Science From Scratch. Sebastopol, CA: O'Reilly Jiang, C., Chen, D. Research on Urban Logistics Infrastructure: An Empirical Study of China. J. Service Science & Management, 2: 80-91, 2009. LIMA, O. F. Jr. (2011) Inovação frugal: a nova rota da logística urbana. Mundo Logística, v. 23, p. 24-40. Pham, Duc Truong, Stefan S. Dimov, and C. D. Nguyen. "Selection of K in K-means clustering." Proceedings of the Institution of Mechanical Engineers, Part C: Journal of Mechanical Engineering Science 219.1 (2005): 103-119 Ponce-Cueto, E., Winkenbach, M., Merchán, D., Blanco, E. E., Lee, Y. J., Alho, A., Marujo, L. G. Segmentation of urban areas from a logistics perspective: comparative case studies in Lisbon, Madrid, Mexico City, Quito, Rio de Janeiro, and Singapore, 2015. Proceedings for Metrans 2015, available at: <http://www.metrans.org/2015-i-nuf-conference-committee> Porter, M. E. Clusters and the new economics of competition. Harvard Business Review, November/December, 1998. Prefecture of São Paulo, 2015. Available at: http://www.prefeitura.sp.gov.br/ United Nations. Logistics Sector Developments: Planning Models for Enterprises and Logistics Clusters, 2007.

116
Cluster analysis and Focus group: integrating Qualitative and Quantitative approaches on
addressing city logistics challenges
Rodrigo Barros Castroa, Sérgio Adriano Loureirob, Orlando Fontes Lima Jrc, Ana Paula Reis Noletto d
Logistics and Transportation Learning Laboratory – LALT/UNICAMP, Campinas, SP, Brazil, ZIP 13083852 –
Telephone +55 (19) 3521-2346
ABSTRACT
Freight transport in urban centers is a complex operation due to all the impacts involved, and its
planning faces critical challenges. Several qualitative and quantitative data collection techniques
have been applied in order to address urban logistics and the last mile challenges, and here we
present an overview of four commonly used methods.
The purpose of this article is to study two out of four methods, "the cluster analysis method"
and "the focus group method", to identify their advantages and disadvantages. The cluster analysis
method presents an interesting contribution to the possibility of spatially correlating important
variables to urban logistics in research, whereas the focus group method is a method that ensures
that the opinions of the stakeholders have been considered in the project. In addition, an
opportunity has been identified: the possibility to integrate the quantitative and qualitative methods
on addressing urban logistics issues, which would in turn incorporate their strengths.
Keywords: urban logistics, city logistics, cluster, focus group, methodology
JEL Classification Codes: B40, C18, R58
1. Introduction
The world is experiencing a transition in its population, migrating from rural areas to cities. The
overall growth of the urban population is 65 million people per year, and half of the world
population already lives in cities, generating over 80% of the world’s GDP (Dobbs et al., 2011). In
developing countries this urbanization is more pronounced, where in 2012 the urban population
accounted for 79% of its inhabitants (Merchán et al., 2015).
Almost all activities in urban centers require transport of any type of cargo. An efficient urban
transportation planning system is required, since urban freight transport generates a variety of
economic, environmental, and social negative impacts. Congestion affects the economy of cities due
to the waste of resources and inefficiency they generate. The emission of pollutants, the use of non-
renewable fuel, and the disgarding of waste products such as tires and oil are relevant
environmental impacts. The social impacts include diseases as physical consequences of pollutant
emissions, also accidents resulting from traffic, high noise levels, among others (BESTUFS, 2007;
Crainic, 2004).

117
Despite the negative impacts, cities depend on cargo transportation. Urban logistics plays an
essential role in maintaining and retaining industrial and commercial activities, which are essential
for major wealth generating activities, and is also a major agent of employment. Efficient freight
transport increases the competitiveness of industry, and is critical in sustaining the current life style
in cities. Thus, urban logistics creates a conflict between commercial interests and the urban
environment (Ibeas et al., 2012; Correia et al., 2010; Dablanc, 2009).
The greatest challenge is to combine solutions with efficient operations, low costs,and without
environmental and social impacts. The new urban metabolism, approached by Lima Jr. (2011), has
made these challenges even more critical. There is a higher number of purchases to a lesser extent,
which increases the number of deliveries to be made and requires better transportation planning.
The new metabolism is not restricted to shopping, but also addresses the growing adoption of the
concept Just-in-Time, which reduces the storage of products and requires a greater efficiency in
services (Dablanc, 2009).
The increase in urban freight forwarding discussed by Lima Jr (2011) exacerbates the problem of
the last mile delivery, because of the increased number of unsuccessful operations. Thus, the
number of extra trips in the achievement of freight delivery is higher. Therefore, the better planning
of deliveries in the study area is essential in order to avoid more intense traffic (Dutra, 2004).
There are no global solutions or success formulas for the various problems arising from the cargo
transportation in the urban environment. Any strategy chosen to mitigate these problems should be
developed according to the characteristics of each region. An agreement should be established
between the conflicting objectives of the various actors in the urban environment that participate in
the load distribution process, such as retailers, government officials, carriers, among others (Correia
et al., 2010; Crainic et al., 2009).
Several projects were developed to propose the best practices in urban logistics and to solve
their main problems. However, cities have different characteristics, and policy measures applied in
different urban areas will result in different impacts. Thus, it is essential to include urban form
characteristics and all stakeholders’ opinions when enhancing city logistics planning (Alho and Silva,
2015; Dablanc, 2009).
Therefore, an appropriate approach should be selected when addressing an urban logistics issue.
Urban logistics presents many reasons for requiring data gathering, such as specific projects to
produce national or local estimates concerning vehicle flows, regulation, and environmental
impacts; also, it is important to involve the public authorities, to measure and monitor performance,
to model and forecast freight transport, and to monitor commercial activities, among others
(Ambrosini et al., 2010).
An opportunity has been identified when studying the paper of Zunder et al. (2014). The authors
developed a project by adopting a mixed methods approach, combining qualitative and quantitative
strategies for collecting data. Bryman (2006) confirms this possibility, stating that mixed method
research can be adopted for various reasons. According to the author, by integrating different
methods it is possible to incorporate their various contributions.
Bryman (2006) states that this integration of qualitative and quantitative methods has become
increasingly common. Two justifications for combining these qualitative and quantitative methods
should be highlighted when addressing the city logistics issues: triangulation and expansion. The
integration can seek for convergence and corroboration, for example when identifying critical areas
for urban logistics (triangulation). Another reason for the above mentioned integration may be to
118
extend the breadth and range of enquiry by using the different methods for different inquiry
components, for example adopting the cluster analysis method for the identification of critical areas
in urban logistics, and adopting the focus group method for the development of adequate solutions
(expansion).
The purpose of this paper is to study data collection techniques that aid in city logistics planning
and urban freight transport, and to analyse how they can be integrated. We have selected and
studied two methods for data mining, the cluster analysis method (quantitative) and the focus group
method (qualitative). The best situation in which each method should be applied, according to its
advantages and/or disadvantages), has been suggested. The possiblility of integrating both
approaches and thus also incorporating their strengths is also explored.
2. Data collection techniques
In order to adequately address an urban logistics issue a proper approach needs to be adopted.
The literature regarding the subject lacks a framework on data collection techniques to identify city
logistics challenges, problems, and/or critical areas. However, Bryman (2006) listed research
methods employed in social sciences, and we have selected four commonly adopted approaches to
address city logistics issues, in which two are qualitative and two quantitative: respectively, focus
group and in-depth interviews, cluster analysis and survey. The cluster analysis method is not listed
as one of the most common methods used in social sciences, but the potential to spatially correlate
urban logistics variables and therefore build a framework of the city according to the adopted
variables, along with the application of this method in works such as Castro et al. (2016) justifies its
contribution and analysis in this paper. Several works and projects aiming to contribute to city
logistic activities have already adopted at least one of those strategies (Castro et al., 2016; Alho and
Silva, 2015; BAUDEL et al., 2015; Comi and Nuzzolo, 2015; Ducret et al., 2015; Kijewska and Iwan,
2015; Ponce-Cueto et al., 2015; Castro et al., 2014; Dias et al., 2014; Chhetri et al., 2013; NCFRP
2013; Allen et al., 2012; Ambrosini et al., 2010; Lindholm, 2010; Browne et al., 2007; and Anderson
et al., 2005), and have even integrated more than one approach in the same study (CLUB, 2014;
Zunder et al., 2014; CLUB, 2012 and Stathopoulos et al., 2012).
One of the main contributions probability-based sample surveys present comes from their
statistical potential. Applying questionnaries to a sample of a defined population allows precise
estimations of the behaviours and opinions distribution of a larger group of people. The possibility of
generalizing with statistical confidence based on probability theory separates surveys from other
research methods such as focus groups or in-depth interviews. However, the statistical estimates are
subject to a variety of errors, such as sampling error, coverage error, nonresponse error,
measurement error, and processing errors (Stern et al., 2014).
Survey types used for transportation planning include: land-use surveys, surveys of the transport
system inventory, travel pattern surveys, transport system performance surveys, demographic and
socio-economic surveys, and perception and attitude surveys.
Cluster analysis is another quantitative approach. A cluster can be defined as a grouping of
similar things, such as geographical factors, types of business, or business relationships along the
supply chain (United Nations, 2007). A cluster boundary delineation is often imprecise, and,
according to Porter (1998), “a cluster is a geographically proximate group of interconnected
companies and associated institutions in a particular field, linked by commonalities and
complementarities.”

119
Geography and spatial studies have not sufficiently explored urban freight as a research field,
which leads to the opportunity of using cluster analysis. Urban transport activities are affected by
spatial factors, such as the city’s size and density, layout and urban form, street design, urban
morphology, the land use, and the position of the city in the supply chain (Ducret et al., 2015; Allen
et al., 2012; Lindholm, 2012; Dablanc, 2011).
Several logistics practices have been introduced to address the challenges of city logistics.
However, cities have different characteristics, and policy measures applied in different urban areas
can only result in different associated impacts. Thus, it is essential to consider urban-specific
characteristics to enhance the transferability and sustainability of urban logistics solutions (Alho and
Silva, 2015). Cluster analysis facilitates the exploration of natural or hidden data structures and
group commonalities in a set of data objects, aiding in the development of insights regarding the
studied area (Jiang and Chen, 2009). Castro et al. (2016) has confirmed that the quantitative
methodology is efficient when used to analyze logistics in urban centers, providing a good
representation of the city segmented into clusters. Furthermore, Ducret et al. (2015) state that the
possibility of bringing urban analysis with spatial studies closer to urban logistics aids in reorganizing
logistics more efficiently, meeting city logistics challenges.
On the other hand, the focus group approach– a qualitative method - has as a main concept the
involvement of the stakeholders in the project – from the identification of problems to the
development of solutions.
A good definition for focus group is stated by Jenkins and Harrison (1990), “A focus group is
therefore a free ranging, non-directed, group discussion in which particular issues or items provide
an axis or focus for the group.” Focus groups are a qualitative research tool, with the objective of a
discussion that converges to the participants comprehension according the desirable issues (Dias,
2000). According to Ståhlbröst (2008), focus groups are the main tool in co-creation proceedures,
due to its interactive communication between the participants.
Jenkins and Harrison (1990) confirm that the applications of focus groups transcend the
identification of challenges or problems in a specific context, such as urban logistics. The main
indications for adopting focus groups as a research tool are: during an initial exploration with a small
population sample; during deep research in motivations, desires or lifestyle of groups; during the
comprehension of the group’s perspective; during the concepts and issues testing for future
quantitative analysis; during qualitative research monitoring; during the investigation of new
concepts or products; and for the comprehension of a specific context (CLUB, 2014).
Moreover, Hopkins (2007) states that spatial research has increasingly benefited from the
adoption of focus group analysis. It is essential to highlight then, that this tool allows broader results
with the possibility of getting insights about the partiticipants' opinion on how to solve the discussed
issues.
Another qualitative strategy are in-depth interviews, which in most cases can help explore issues
concerning city logistics activities individually. This approach provides the opportunity to gather
insight, probe for additional information, and change the direction of the discussion, according to
the circumstances. In-depth Interviews are an ideal mechanism to gain insight from industry leaders,
decision makers, and leading researchers (Holguín-Veras et al., 2014). However, interviews are
subject to bias and reflexivity – the interviewed might answer according to what they think is the
correct answer.

120
This paper focuses on two data collection approaches used for studying city logistics issues: the
cluster analysis method and the focus group method. These methods were chosen due to their
potential of spatially addressing urban logistics. Both approaches present an interesting cost-benefit,
in addition to depending on a reliable database, or on the participation of all stakeholders
respectively. The statistical analysis required by the cluster method are not exhausting, while having
the required database and the discussion towards a subject should not be onerous with the
presence of all interested stakeholders. Furthermore, this paper presents an innovative strategy: a
qualitative and quantivative approach, by combining the two methods. According to Morgan and
Spanish (1984), sociological research can benefit from the use of focus groups combined with other
data gathering methodologies.
3. Cluster analysis and urban logistics
Researchers have developed various methods with the purpose of developing cluster analysis.
However, there is no defined pattern to the dimensions analysed, nor how to measure these
dimensions in cluster analysis studies. A company’s size and its internal structure, transportation,
communications, other technologies, infrastructure data, demographic data, cultural influences,
among others, affect the process of clustering (United Nations, 2007). It is clear that the cluster
theory methodology is not new. However, its application in distinct fields of study, along with its
existence in various regions of the world with different objectives, highlights the applicability of the
study.
We analysed and compared different clusters identification methods from the works: Ponce-
Cueto et al., 2015; Alho and Silva, 2015; Chhetri et al., 2013, and; Allen et al., 2012. These papers
were selected due to their focus on city logistics activities, the relevance of the projects, and for
being relatively recent studies.
In the first paper, the purpose is to identify clusters that impact urban logistics activities and to
assist urban planning with general recommendations for public policies. The research study is based
on four steps: collection and processing information; in which demographic, socioeconomic,
regulation and infrastructure data were collected; Statistical analysis with the development of the
principal component analysis and k-means clustering analysis; Logistic cluster identification – a
categorization of different areas of the city according to urban logistics characteristics; and finally,
general recommendations for public policy aiming contributions for urban freight mobility (Ponce-
Cueto et al., 2015).
Alho and Silva (2015) present the concept of Logistics Profile, which “… suggests homogeneous
groups of urban zones with respect to three dimensions, which could be used to analyse freight
movement policy: (1) the social and built environment; (2) characteristics of the goods/products
being moved; (3) characteristics of the deliveries at the receiver establishment.” The study was
conducted with two statistical steps: The Multiple Classification Analysis (MCA) model and Two-step
cluster analysis. The author states that the Logistical Profile has the potential to be used as a starting
point for urban planning commodities and policy analysis on the subject. In the paper, Lisbon was
segmented into four logistic profiles, allowing the city planners to focus on just four separate sets of
rules and political action.
The work “Characterising spatial logistics employment clusters” studied cluster theory with a
different approach: an analysis involving logistics employment clusters. The paper identified
industries related to logistics in order to quantify its employments, and conducted a statistical
analysis (principal component analysis and autocorrelation techniques) to empirically identify and
121
spatially contextualise logistics hubs. The research offers policymakers and practitioners a
foundation on which decisions about future infrastructure investment can be evaluated to support
cluster development and achieve economies of agglomeration (Chhetri et al., 2013).
The last paper investigates relationships between road freight transport, urban form, land use,
facility location and logistics management. The main idea is the collection of demographic data,
socioeconomic data (area occupied by industries/commerce, area ocuppied by industries/commerce
per capta and per km2) and also Origin/Destination information (trips within the area, from the area
and to the area). The work studied specific factors (loaded vehicle kilometres, empty vehicle
kilometres, tonnes lifted, tonne-kilometres, and vehicle loading factors) – and provided an analysis
of the extent to which the commercial and industrial land use patterns influence the amount,
pattern and intensity of road freight transport activity, and whether the suburbanisation of
warehousing has been occurring (Allen et al., 2012).
We built an abstract of the mentioned methods in Table 1, showing common elements and
differences between the different methods. The parameters adopted (objective, data collection,
statistical analysis, result and conclusion) were chosen due to the following reasons: the objective of
each project adopting cluster analysis has a direct impact on the required data for collection; cluster
analysis usually requires statistical analysis, and; results and conclusion help the quantifying
potential and applicability of the method.
We can see that, out of the four methods studied, three (Alho and Silva, 2015; Chhetri et al.,
2013; Ponce-Cueto et al., 2015) work with similar statistical analyses: Principal Component Analysis
and Multiple Classification Analysis. Both statistical tools work with independent variables and look
for similarities between them. However, the work of Allen et al. (2012) makes use of a Origin /
Destination matrix, and lists the array information with data common to other methods such as
demographic and socioeconomic data. Although the methods present some differences, mainly
because of distinct purposes, their results have commonalities in the grouping of regions to facilitate
the local assessment.
All methods present contributions on addressing city logistics issues: the papersfrom Ponce-
Cueto et al. (2015) and Alho and Silva (2015) aid in segmentating the city so that critical areas can
be identified and proper solutions suggested; Chhetri et al. (2013) offer a founded basis that helps
to identify the lack of infrastructure for logistics activities; and Allen et al. (2012) analyze road freight
transport and its relation to urban form in order to assist planners when making transport and land
use decisions.
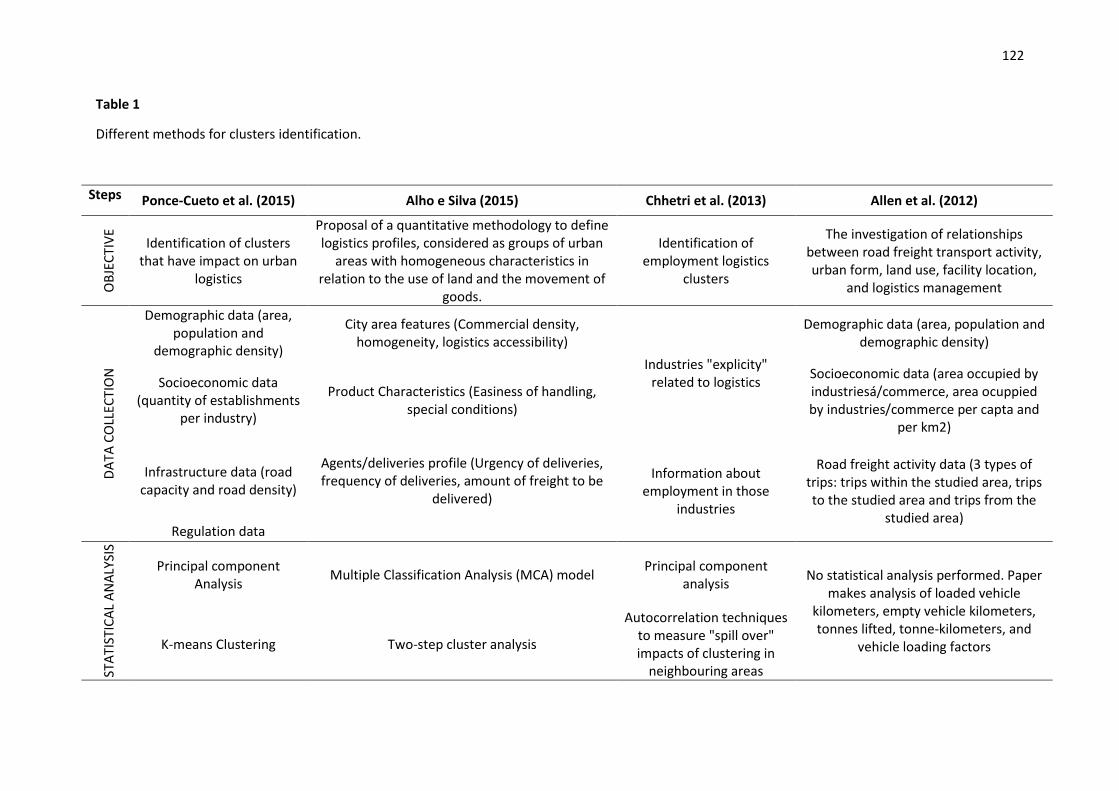
122
Table 1
Different methods for clusters identification.
Steps Ponce-Cueto et al. (2015) Alho e Silva (2015) Chhetri et al. (2013) Allen et al. (2012)
OB
JEC
TIV
E
Identification of clusters that have impact on urban
logistics
Proposal of a quantitative methodology to define logistics profiles, considered as groups of urban
areas with homogeneous characteristics in relation to the use of land and the movement of
goods.
Identification of employment logistics
clusters
The investigation of relationships between road freight transport activity, urban form, land use, facility location,
and logistics management
DA
TA C
OLL
ECTI
ON
Demographic data (area, population and
demographic density)
City area features (Commercial density, homogeneity, logistics accessibility)
Industries "explicity" related to logistics
Demographic data (area, population and demographic density)
Socioeconomic data (quantity of establishments
per industry)
Product Characteristics (Easiness of handling, special conditions)
Socioeconomic data (area occupied by industriesá/commerce, area ocuppied by industries/commerce per capta and
per km2)
Infrastructure data (road capacity and road density)
Agents/deliveries profile (Urgency of deliveries, frequency of deliveries, amount of freight to be
delivered)
Information about employment in those
industries
Road freight activity data (3 types of trips: trips within the studied area, trips to the studied area and trips from the
studied area) Regulation data
STA
TIST
ICA
L A
NA
LYSI
S
Principal component Analysis
Multiple Classification Analysis (MCA) model Principal component
analysis No statistical analysis performed. Paper
makes analysis of loaded vehicle kilometers, empty vehicle kilometers, tonnes lifted, tonne-kilometers, and
vehicle loading factors K-means Clustering Two-step cluster analysis
Autocorrelation techniques to measure "spill over" impacts of clustering in
neighbouring areas
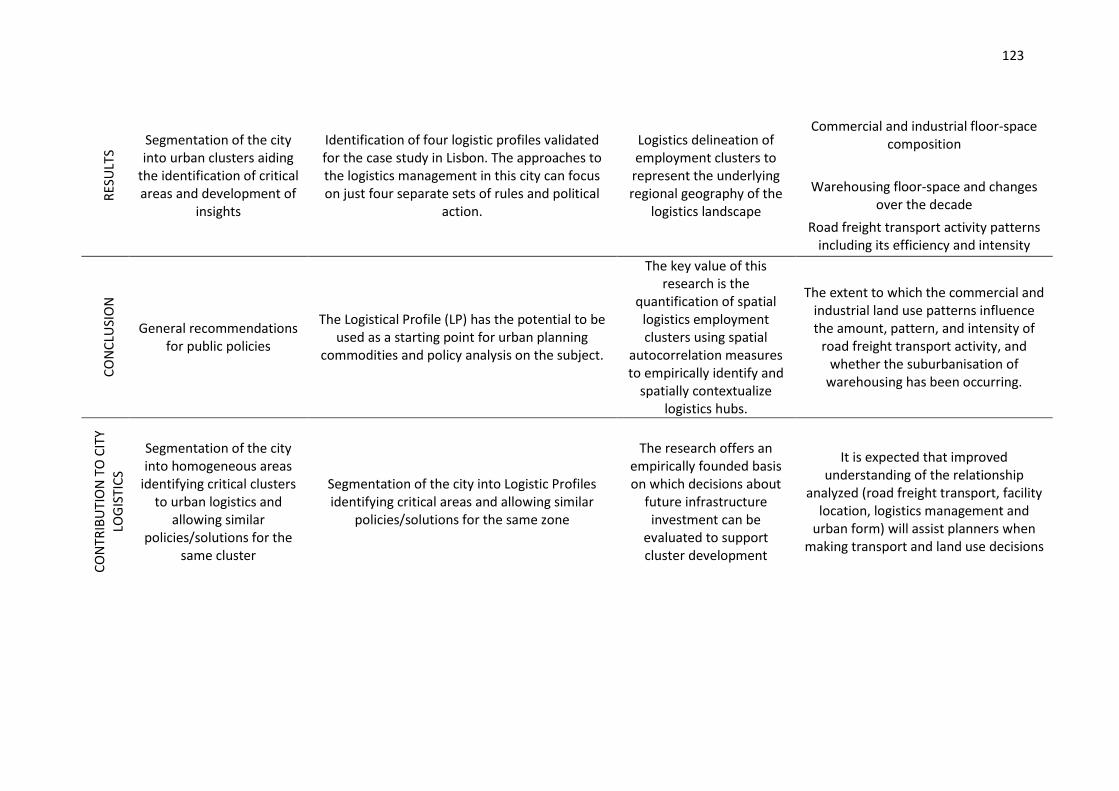
123
RES
ULT
S
Segmentation of the city into urban clusters aiding
the identification of critical areas and development of
insights
Identification of four logistic profiles validated for the case study in Lisbon. The approaches to the logistics management in this city can focus on just four separate sets of rules and political
action.
Logistics delineation of employment clusters to
represent the underlying regional geography of the
logistics landscape
Commercial and industrial floor-space composition
Warehousing floor-space and changes over the decade
Road freight transport activity patterns including its efficiency and intensity
CO
NC
LUSI
ON
General recommendations for public policies
The Logistical Profile (LP) has the potential to be used as a starting point for urban planning
commodities and policy analysis on the subject.
The key value of this research is the
quantification of spatial logistics employment clusters using spatial
autocorrelation measures to empirically identify and
spatially contextualize logistics hubs.
The extent to which the commercial and industrial land use patterns influence the amount, pattern, and intensity of
road freight transport activity, and whether the suburbanisation of
warehousing has been occurring.
CO
NTR
IBU
TIO
N T
O C
ITY
LOG
ISTI
CS
Segmentation of the city into homogeneous areas
identifying critical clusters to urban logistics and
allowing similar policies/solutions for the
same cluster
Segmentation of the city into Logistic Profiles identifying critical areas and allowing similar
policies/solutions for the same zone
The research offers an empirically founded basis on which decisions about
future infrastructure investment can be
evaluated to support cluster development
It is expected that improved understanding of the relationship
analyzed (road freight transport, facility location, logistics management and
urban form) will assist planners when making transport and land use decisions

124
4. Focus group approach and city logistics
Focus groups are a qualitative research method in which a group of individuals are asked to
respond to a given policy question with the assistance of a moderator, who probes into different
aspects of the subject. This approach emphasizes the collective discussion of a complex subject,
where the moderator steers the dialogue into the directions likely to reveal important insights
(Holguín-Veras et al., 2014). Examples of the use of the focus group approach as a data collection
technique to address urban logistics issues include: CLUB (2014), Dias and Lima Jr (2014), Zunder et
al. (2014), NCFRP (2013), Stathopoulos et al., 2012, CLUB (2012) and Browne et al. (2007).
Dias and Lima Jr (2014) present a project with the purpose of improving beverage delivery in
downtown Campinas, São Paulo. The authors used focus groups in order to define the purpose and
scope of the research, and to confirm the needs of the operation as well as a co-creation technique
to propose adequable solutions.
The project developed by Zunder et al. (2014) present as its purpose the development of a local
research strategy for city logistics issues. The focus group method was one of the data collection
techniques adopted by the authors, which aimed at contesting the relationship between the buying
system and freight activities.
The report Smart Growth and Urban Goods Movement, written by the National Cooperative
Freight Research Program (NCFRP, 2007), tries to understand the relationship between smart-
growth principles and urban goods movement, through the conducting of six total focus groups.
Stathopoulos et al. (2012) adopted the focus group approach in order to identify problems in
deliveries in Rome’s limited traffic zone. The authors noticed a large disparity for each group of
stakeholders in terms of sensitivity to policy instruments. The results allowed the development of
several policy-scenarios for further studies.
In order to measure the impacts of urban freight transport, Browne et al. (2007) developed a
study based on an analysis of urban freight operations of seven companies, adopting the focus group
technique to discuss and analyze how these operations are likely to change as a result of different
future policy scenarios.
The Brazilian Urban Logistics Center (CLUB – Centro de Logística Urbana do Brasil) also adopts
the focus group methodology as a data collection technique. The main purpose of those focus groups
is to exchange experiences and knowledge among the actors involved in urban logistics problems,
aiming at the identification of critical areas and the development of adequate solutions for the
studied cities (CLUB, 2014).

125
Fig. 1. Focus groups meetings in Brazil by CLUB (CLUB, 2014).
The procedure adopted by CLUB in the study of the aforementioned cities always started
with preliminary research with the purpose of characterizing the city’s historic development,
collecting demographic and socioeconomic data, and also studying the available infrastructure for
freight transport. This information aided the discussion between the stakeholders during the focus
groups. The questions that guided the meeting intended to determine the cities’ main problems for
freight transport and its location. After a better understanding of the cities’ main issues according to
cargo distribution, it was possible to identify solutions or best practices adequate for the observed
situations. Fig. 2 illustrates an example of the summary built from the two first questions of the focus
group hold in an important Brazilian hub city, Campinas/SP.

126
Fig. 2. Summary of Campinas/SP main problems in freight forwarding and its location (CLUB, 2012).
It is clear that the focus group presents contributions when applied as a data collection
technique in order to address urban logistics issues. Dablanc (2009) stated that it is impotant to
consider all stakeholders’ opinions to enhance city logistics planning, and the examples above show
the potential of this qualitative approach to gather stakeholders’ assessments regarding urban
logistics activities.
5. Discussion
It is clear that both approaches - cluster analysis and focus group - contribute as data collection
techniques to address urban logistics issues. They can be useful in gathering information regarding
problems in urban areas, and also in obtaining important information for development of insights
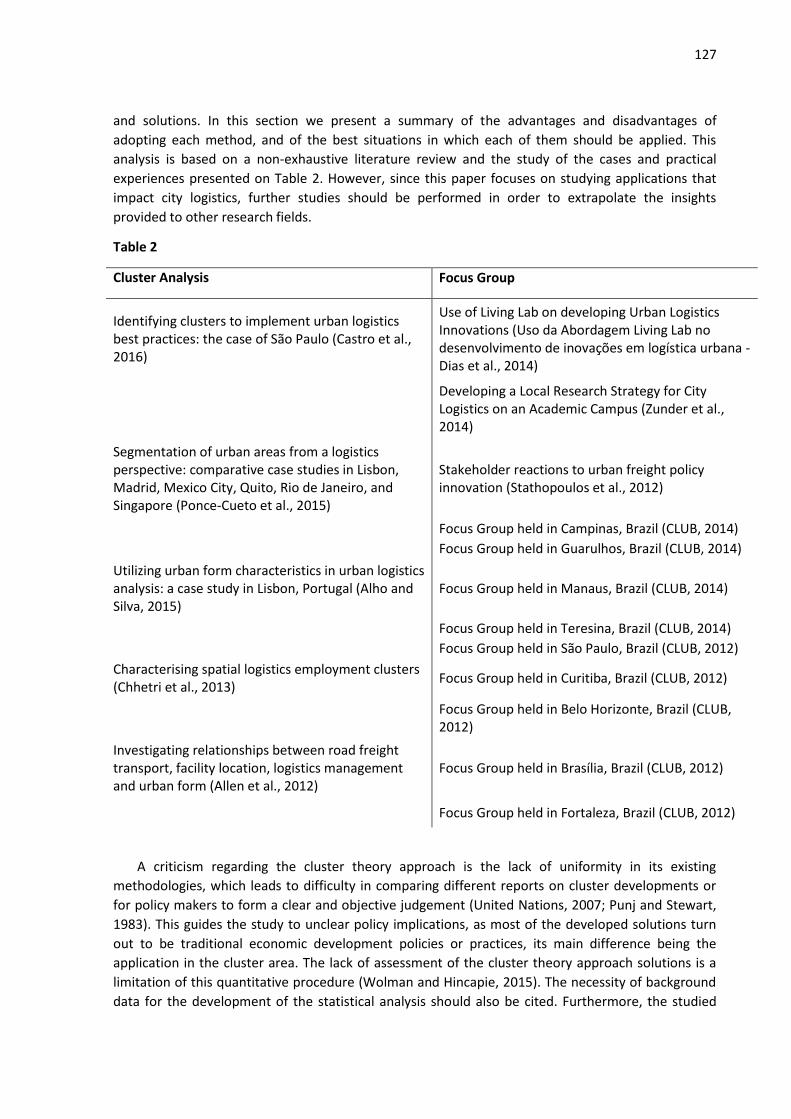
127
and solutions. In this section we present a summary of the advantages and disadvantages of
adopting each method, and of the best situations in which each of them should be applied. This
analysis is based on a non-exhaustive literature review and the study of the cases and practical
experiences presented on Table 2. However, since this paper focuses on studying applications that
impact city logistics, further studies should be performed in order to extrapolate the insights
provided to other research fields.
Table 2
Cluster Analysis Focus Group
Identifying clusters to implement urban logistics best practices: the case of São Paulo (Castro et al., 2016)
Use of Living Lab on developing Urban Logistics Innovations (Uso da Abordagem Living Lab no desenvolvimento de inovações em logística urbana - Dias et al., 2014)
Developing a Local Research Strategy for City Logistics on an Academic Campus (Zunder et al., 2014)
Segmentation of urban areas from a logistics perspective: comparative case studies in Lisbon, Madrid, Mexico City, Quito, Rio de Janeiro, and Singapore (Ponce-Cueto et al., 2015)
Stakeholder reactions to urban freight policy innovation (Stathopoulos et al., 2012)
Focus Group held in Campinas, Brazil (CLUB, 2014)
Focus Group held in Guarulhos, Brazil (CLUB, 2014)
Utilizing urban form characteristics in urban logistics analysis: a case study in Lisbon, Portugal (Alho and Silva, 2015)
Focus Group held in Manaus, Brazil (CLUB, 2014)
Focus Group held in Teresina, Brazil (CLUB, 2014)
Focus Group held in São Paulo, Brazil (CLUB, 2012)
Characterising spatial logistics employment clusters (Chhetri et al., 2013)
Focus Group held in Curitiba, Brazil (CLUB, 2012)
Focus Group held in Belo Horizonte, Brazil (CLUB, 2012)
Investigating relationships between road freight transport, facility location, logistics management and urban form (Allen et al., 2012)
Focus Group held in Brasília, Brazil (CLUB, 2012)
Focus Group held in Fortaleza, Brazil (CLUB, 2012)
A criticism regarding the cluster theory approach is the lack of uniformity in its existing
methodologies, which leads to difficulty in comparing different reports on cluster developments or
for policy makers to form a clear and objective judgement (United Nations, 2007; Punj and Stewart,
1983). This guides the study to unclear policy implications, as most of the developed solutions turn
out to be traditional economic development policies or practices, its main difference being the
application in the cluster area. The lack of assessment of the cluster theory approach solutions is a
limitation of this quantitative procedure (Wolman and Hincapie, 2015). The necessity of background
data for the development of the statistical analysis should also be cited. Furthermore, the studied
128
cluster analysis methods do not provide descriptive report about the segmented areas, requiring
additional effort to draw inferences regarding their statistical significance (Punj and Stewart, 1983).
Despite its constraints, there are some constributions from the cluster method that should be
highlighted. Clustering procedures are a helpful tool in data analysis when one desires to group
objects (or variables) according to their relative similarity. The provision of a conceptual framework
allows a better view of the economy, aiding in the direction of the regional economic policies'
development (Wolman and Hincapie, 2015). The cluster theory approach then helps in the
understanding of the regional economy, and depending on the variables included in the analisys, its
crossing with urban form and infrastructure or demographic data, which are essential aspects to
urban logistics. Castro et al. (2016) confirms the advantages of applying cluster analysis on city
logistics research, on a paper where important variables to urban logistics were correlated providing
a demographic and economic framework of the analysed city, São Paulo/Brazil, which in turn lead to
identifying critical areas for urban logistics and suggested insights that could be studied in order to
develop adequate solutions.
When analyzing the focus groups held by CLUB in important Brazilian cities, there are some
advantages of this approach that should be mentioned (CLUB, 2014):
The interaction between the stakeholders involved in the process of cargo transportation
leads to ideas that normally wouldn’t be reached by only one person or a part of the
stakeholders group;
The results can be obtained faster;
Possibility to assess the relevance of explanations and theoretical concepts by the involved
stakeholders;
Allows for the development of innovative solutions.
Furthermore, Stathopoulos et al. (2012) states that city logistics need to identify feasible and
acceptable policies, according to the main stakeholders, avoiding potential conflicts. The efficient
interaction focus groups provide combined with the fast development of innovative solutions
demonstrates the contributions this approach grants when adopted as a data collection technique.
The method can be used in order to collect information regarding needs and inefficiencies of
operations and also to gather important stakeholders’ opinions to develop appropriate solutions
(CLUB, 2014; Stathopoulos et al., 2012).
The downside of using this research method lies in group trends that can lead to compliance or a
determined bias. The compliance occurs when some participants do not provide essential
information that would appear in individual interviews (Morgan, 1988). An important limitation of
the focus group analysis relies on the fact that a test with few consumers/stakeholders should not be
a reliable indicador for a broader population (Ogawa and Piller, 2006).
Table 3 shows an analysis of the advantages and disadvantages of both approaches on
addressing urban logistics issues.
Table 3
Comparative analysis between approaches.
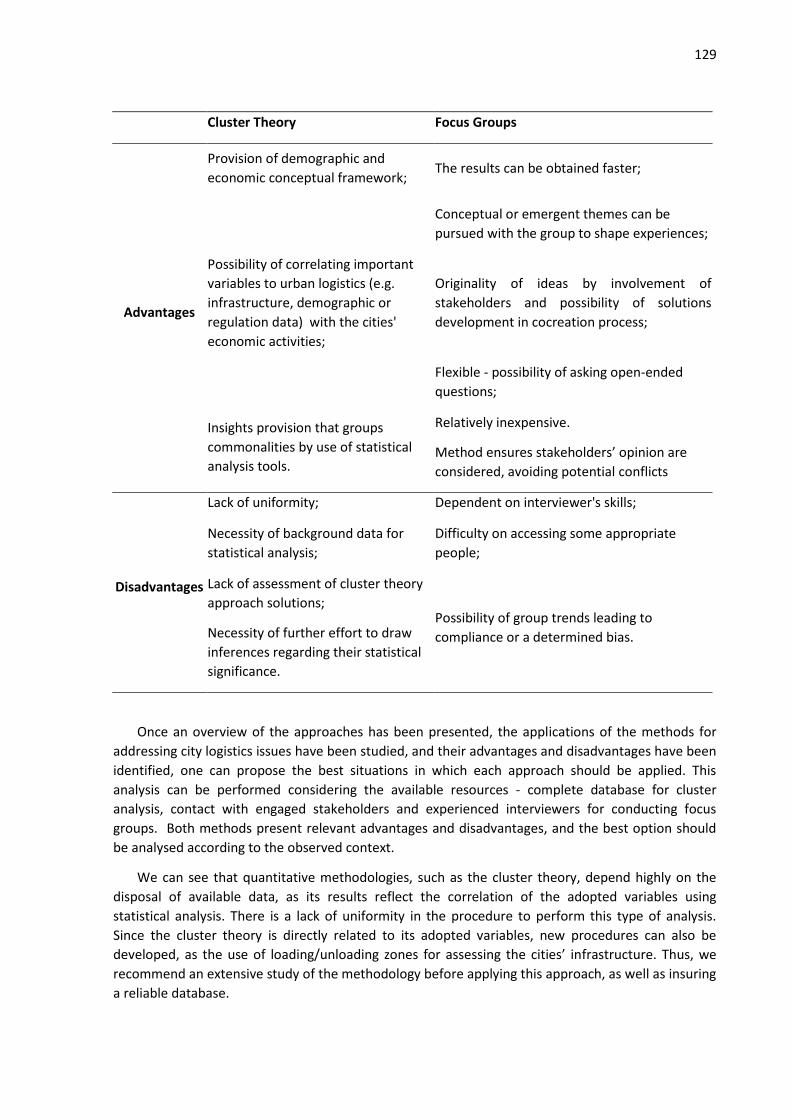
129
Cluster Theory Focus Groups
Advantages
Provision of demographic and
economic conceptual framework; The results can be obtained faster;
Conceptual or emergent themes can be
pursued with the group to shape experiences;
Possibility of correlating important
variables to urban logistics (e.g.
infrastructure, demographic or
regulation data) with the cities'
economic activities;
Originality of ideas by involvement of
stakeholders and possibility of solutions
development in cocreation process;
Flexible - possibility of asking open-ended
questions;
Insights provision that groups
commonalities by use of statistical
analysis tools.
Relatively inexpensive.
Method ensures stakeholders’ opinion are
considered, avoiding potential conflicts
Disadvantages
Lack of uniformity; Dependent on interviewer's skills;
Necessity of background data for
statistical analysis;
Difficulty on accessing some appropriate
people;
Lack of assessment of cluster theory
approach solutions;
Necessity of further effort to draw
inferences regarding their statistical
significance.
Possibility of group trends leading to
compliance or a determined bias.
Once an overview of the approaches has been presented, the applications of the methods for
addressing city logistics issues have been studied, and their advantages and disadvantages have been
identified, one can propose the best situations in which each approach should be applied. This
analysis can be performed considering the available resources - complete database for cluster
analysis, contact with engaged stakeholders and experienced interviewers for conducting focus
groups. Both methods present relevant advantages and disadvantages, and the best option should
be analysed according to the observed context.
We can see that quantitative methodologies, such as the cluster theory, depend highly on the
disposal of available data, as its results reflect the correlation of the adopted variables using
statistical analysis. There is a lack of uniformity in the procedure to perform this type of analysis.
Since the cluster theory is directly related to its adopted variables, new procedures can also be
developed, as the use of loading/unloading zones for assessing the cities’ infrastructure. Thus, we
recommend an extensive study of the methodology before applying this approach, as well as insuring
a reliable database.

130
On the other hand, qualitative methodologies, like the focus group, rely essentially on the
participation of the stakeholders involved in the studied issue. The use of the focus group approach
can be very flexible, and quickly reach results. However, care must be taken while adopting a
qualitative methodology. The interviewer must have a large experience on the studied topic, the
involvement of the stakeholders is mandatory, and the group must avoid compliance.
The analysed data collection techniques, focus group and cluster analysis, when integrated,
should present a high potential on addressing urban logistics issues. The quantitative approach can
ensure that important variables for the project have been considered without bias; the statistical
analysis can provide valuable insights regarding infrastructure, land use, demography and economic
activities; and that the stakeholders’ perceptions can be considered during the focus group in the
analysis of the studied issue and in the development of the solution. The toolkit developed by
Dablanc (2009) demonstrates the relevance of these aspects, highlighting the importance of using
data in urban freight methods and the importance of the stakeholders’ opinions when dealing with
city logistics. Furthermore, Anand et al. (2015) confirms that city logistics studies should be assessed
with respect to the stakeholders’ perceptions and elements associated with the demand and supply
side of urban movements – parameters covered by focus group and cluster analysis, respectively.
We identified two main reasons for integrating data collection techniques when addressing city
logistics issues: triangulation and expansion. CLUB (2014 and 2012) already used this strategy when
analysing urban logistics activities across Brazilian cities: their methodology adopted focus groups
and surveys to study the same issue by triangulation, converging the results of both methods to
produce the final report for each city. In their project, information such as fleet age, average speed,
delivery difficulties, fleet composition, among others were gathered through surveys and this data
was then compared with the opinions of the stakeholders regarding city logistics activities in focus
groups discussions.
Another project that aims to integrate the different methods, but with the purpose of expanding
its results, is being developed by Castro et al. (2016). The authors performed cluster analysis in São
Paulo, Brazil, and segmented the city into homogeneous clusters. This research helped the
identification of the critical zones for urban logistics in the city, and provided insights about possible
solutions. Further studies are being conducted by selecting a zone with one square kilometer inside a
critical cluster in order to develop an appropriate solution based on the stakeholders perceptions.
6. Conclusions
Urban logistics presents highly complex operations which are mainly due to the restrictions
imposed by the Government, and the congestion and high dispersal of orders in those cities. The new
urban metabolism, approached by Lima (2011), has made these challenges even more critical. There
is also the last mile problem, caused by the number of extra trips to the achievement of the delivery
of the goods. In order to study urban logistics main issues, several approaches have already been
used. Every procedure has its advantages and disadvantages, and the best option should be analysed
according to the observed context.
Both methods studied, cluster analysis and focus group, present important restrictions: the
necessity of an active contact with all important stakeholders and the presence of an experienced
interviewer to conduct focus groups, and the availability of a complete and reliable database for the
statistical tools required in the cluster analysis. Therefore, when selecting one method to address an
urban logistics issue the available resources from the reseach should be contemplated. In addition,
focus groups may be considered in a situation when results need to be obtained quickly, and the
acceptance of the stakeholders is essential. If the study needs to address specific variables, such as
131
loading/unloading zones, presenting or requiring the use of a specific database; cluster analysis may
be the adequate option.
Furthermore, the possibility of integrating quantitative and qualitative methods should be
explored. Bryman (2006) states that there are relatively few guidelines about how, when, and why
the integration of method should occur. Greene (2008) also argues that integrated mixed methods
analysis has not yet cohered into a widely accepted framework. Besides, Maxwell and Loomis (2003)
confirm the complexity of actually integrating qualitative and quantitative approaches in any
particular field of study. This leads to the opportunity of further studies into the development of a
framework on how to integrate these methods when addressing an urban logistics issue. The
integration of other qualitative or quantitative methods, such as survey or in-depth interviews,
should also be further explored.
Acknowledgment
The authors thank the National Counsel of Technological and Scientific Development (CNPq) and the
Logistics and Transportation Learning Laboratory (LALT) for the support provided to this study.
Bibliographic References
Alho, A. R., & Silva, J. A. Utilizing urban form characteristics in urban logistics analysis: a case study in Lisbon,
Portugal. Journal of Transport Geography 42, 57 – 71, 2015.
Allen, J., Browne, M., Cherrett, T. Investigating relationships between road freight transport, facility location,
logistics management and urban form. Journal of Transport Geography 24, 45–57, 2012.
Ambrosini, C., Patier, D., Routhier, J.L., 2010. Urban freight establishment and tour based surveys for policy
oriented modelling. Procedia – Social and Behavioral Sciences, 2(3). 6013-6026.
Anand, N., Van Duin, R., Quak, H., Tavasszy, L.: Relevance of city logistics modelling efforts: a review.Transp.
Rev. (2015). doi:10.1080/01441647.2015.1052112
Anderson, S., Allen, J. and Browne, M., 2005. Urban logistics––how can it meet policy makers sustainability
objectives? Journal of Transport Geography 13 (1), Elsevier, 71-81.
Baudel, T., Dablanc, L., Aguiar-Melgarejo, P., Ashton, J. Optimizing Urban Freight Deliveries: From Designing
and Testing a Prototype System to Addressing Real Life Challenges. 9th International Conference on City
Logistics, Jun 2015.
BESTUFS (2007). Good Practice Guide on Urban Freight, www.bestufs.net.Accessed in Oct 2015
Browne, M., Piotrowska, M., Woodburn, A. and Allen, J. (2007). Literature Review WM9: Part I - Urban Freight
Transport , carried out as part of Work Module 1, Green Logistics Project.
Bryman A. (2006). Integrating quantitative and qualitative research: How is it done? Qualitative Research, 6,
97–113.
CASTRO R. B., LIMA JÚNIOR, O. F., DIAS, M. L. F. C. (2014) Identificação dos fatores de ineficiência na
distribuição de mercadorias em centros urbanos. XXVIII ANPET - Congresso de Pesquisa e Ensino em
Transportes, Curitiba.
Castro, R. B., Merchan, D., Lima Jr, O. F. (2016). Identifying clusters to implement urban logistics best practices:
the case of São Paulo. 2016 MIT SCALE Latin America Conference.
CLUB - Centro de Logística Urbana do Brasil, 2012. Debates sobre logística urbana brasileira – grupos focais.
Available in: <http://www.clubbrasil.org/observatorio/relatorios.html> Accessed in Nov 2015

132
CLUB - Centro de Logística Urbana do Brasil, 2014. Debates sobre logística urbana brasileira – grupos focais.
Available in: <http://www.clubbrasil.org/observatorio/relatorios.html>Accessed in Nov 2015
Chhetri, P., Butcher, T., Corbitt, B. Characterising spatial logistics employment clusters. International Journal of
Physical Distribution & Logistics Management, Vol. 44 No. 3, 2014
Comi, A., Nuzzolo, A. Exploring the relationships between e-shopping attitudes and urban freight transport .
Transportation Research Procedia 12 (2016) 399 – 412
CORREIA, V. A.; L. K. OLIVEIRA e G. R. MATEUS (2010). Perspectivas para a melhoria da distribuição urbana de
mercadorias. XXIV Congresso de Pesquisa e Ensino em Transportes, ANPET, Salvador.
Crainic, T. G., Ricciardi, N., & Storchi, G. (2004). Advanced freight transportation systems for congested urban
areas. Transportation Research: Part C, 12 (2), 119-‐137.
CRAINIC, T.G., RICCIARDI N., STORCHI G. (2009) Models for evaluating and planning city logistics systems.
Transp Sci 43(4):432–454
DABLANC, L. Freight transport for development toolkit: Urban Freight. Transport Research Support, 2009.
Dablanc L., 2011. City distribution, a key element of the urban economy: guidelines for practitioners. In
Macharis C., Melo S. (Eds.), City distribution and urban freight transport: multiples perspectives, (pp. 13̻36),
Northampton, Edward Elgar Publishing.
DIAS, Cláudia Augusto. Grupo focal: técnica de coleta de dados em pesquisas qualitativas. Informação &
Sociedade: Estudos, v. 10, n. 2, 2000. ISSN 1809-4783. Available at: <
http://periodicos.ufpb.br/ojs2/index.php/ies/article/viewFile/330/252 > Accessed in Oct 2015
DIAS, M. L. F. C. e O. F. LIMA Jr. (2014) Uso da abordagem de living lab no desenvolvimento de inovações em
logística urbana. XXVIII ANPET, Curitiba.
Dobbs, R., Smit, S., Remes, J., Manyika, J., Roxburgh, C., & Restrepo, A. (2011). Urban World: Mapping the
Economic Power of Cities. McKinsey Global Institute.
Ducret, R., Roset, B., Lemarié B., 2015. Cluster analysis and spatial modeling for urban freight. Identifying
homogeneous urban zones based on urban form and logistics characteristics. In: Taniguchi, E., Thompson, R.G.
(Eds.) 9th International Conference on City Logistics, Tenerife, Canary Islands, Spain, 17-19 June 2015. Kyoto
University, Kyoto, pp. 358-373.
DUTRA, N. O Enfoque de City Logistics na Distribuição Urbana de Encomendas. Tese (doutorado em Engenharia
de Produção) – Universidade Federal de Santa Catarina. Orientador: Antônio Galvão Naclério Novaes (2004).
Greene, J.C., 2008. Is Mixed Methods Social Inquiry a Distinctive Methodology? J. Mix. Methods Res. 2, 7–22.
doi:10.1177/1558689807309969
Holguín-Veras, J., Wang, C., Browne, M., Hodge, S.D. and Wojtowicz, J. (2014), The New York City Off-Hour
Delivery Project: Lessons for City Logistics, Procedia Social and Behavioral Sciences, 125, 36-48.
Hopkins, P. E. (2007). Thinking critically and creatively about focus groups. Area, 39(4), 528–535.
Ibeas, A., Moura, J. L., Nuzzolo, A., Comi, A. (2012). Urban freight transport demand: transferability of survey
results analysis and models. Procedia – Social and Behavioral Sciences, v. 54, p. 1068 – 1079.
Jenkins, M. and Harrison, S.K. (1990), “Focus groups: a discussion”, British Food Journal, Vol. 92 No. 9, pp. 33-
37.
Jiang, C., Chen, D. Research on Urban Logistics Infrastructure: An Empirical Study of China. J. Service Science &
Management, 2: 80-91, 2009.

133
Kijewska, K., Iwan, S. (2016). Analysis of the functioning of urban deliveries in the city centre and its
environmental impact based on Szczecin example. Transportation Research Procedia 12 ( 2016 ) 739 – 749
LIMA, O. F. Jr. (2011) Inovação frugal: a nova rota da logística urbana. Mundo Logística, v. 23, p. 24-40.
Lindholm, M. 2010. A sustainable perspective on urban freight transport: Factors affecting local authorities in
the planning procedures. Procedia Social and Behavioral Sciences, 2, 6205–6216.
Lindholm M., 2012, How Local Authority Decision Makers Address Freight Transport in the Urban Area,
Procedia - Social and Behavioral Sciences, vol. 39, 134̻145.
Maxwell, J. A., Loomis, D. M. (2003) Mixed Methods Design: An Alternative Approach. In A. Tashakkori and C.
Teddlie (eds) Handbook of Mixed Methods in Social and Behavioral Research, pp. 209-40. Thousand Oaks, CA:
Sage.
Merchán, D., Blanco, E., & Bateman, A. (2015). Urban Metrics for Urban Logistics: Building an Atlas for Urban
Freight Policy Makers. 14th International Conference on Computers in Urban Planning and Urban
Management. Cambridge.
Morgan, D.L., Spanish, M.T., 1984. Focus groups: a new tool for qualitative research. Qualitative Sociology 7,
253–270.
MORGAN, D. L. (1988) Focus Group as qualitative research. Newbury Park, Calif: Sage.
NCFRP - National Cooperative Freight Research Program, (2013). Smart Growth and Urban Goods Movement.
Report 24. Transportation Research Board of the National Academies.
OGAWA, S., PILLER, F. T. Reducing the risks of new product development. MIT Sloan Management Revier,
Winter 2006, vol. 47 n. 2.
Ponce-Cueto, E., Winkenbach, M., Merchán, D., Blanco, E. E., Lee, Y. J., Alho, A., Marujo, L. G. Segmentation of
urban areas from a logistics perspective: comparative case studies in Lisbon, Madrid, Mexico City, Quito, Rio de
Janeiro, and Singapore, 2015. Proceedings for Metrans 2015, available at: <http://www.metrans.org/2015-i-
nuf-conference-committee>
Porter, M. E. Clusters and the new economics of competition. Harvard Business Review, November/December,
1998.
Punj, G., & Stewart, D. W.. (1983). Cluster Analysis in Marketing Research: Review and Suggestions for
Application. Journal of Marketing Research, 20(2), 134–148. http://doi.org/10.2307/3151680
STÅHLBRÖST, Anna. Forming future IT : The living lab way of user involvement. 2008. 139 p. (Doctoral thesis).
Division of Informatics, Luleå University of Technology, Luleå, 2008. Available at:<http://epubl.ltu.se/1402-
1544/2008/62/> Accessed in Oct 2015
Stathopoulos, A., Valeri, E., Marcucci, E. Stakeholder reactions to urban freight policy innovation. (2012)
Journal of Transport Geography, 22, pp. 34-45.
Stern, M. J., Bilgen, I., Dillman, D. A. The State of Survey Methodology: Challenges, Dilemmas, and New
Frontiers in the Era of the Tailored Design. Field Methods August 2014 26: 284-301, first published on February
10, 2014.
United Nations. Logistics Sector Developments: Planning Models for Enterprises and Logistics Clusters, 2007.
Wolman, H., Hincapie, D. Clusters and Cluster-Based Development Policy. Economic Development Quarterly
2015, Vol. 29(2) 135–149
Zunder, T., Aditjandra, P., Carnaby, B (2014) Developing a local research strategy for city logistics on an
academic campus. International Journal of Urban Sciences, 18(2), 262‐277,
http://dx.doi.org/10.1080/12265934.2014.926830
Top Related