


Línguas
Páginas
Legal


Av. Bandeirantes, 3900 - Monte Alegre - CEP: 14040-900 - Ribeirão Preto-SP
Fone (16) 3602-4331/Fax (16) 3602-3884 - e-mail: [email protected] site:www.fearp.usp.br
Texto para Discussão
Série Economia
TD-E 05 / 2010
OBSERVABILITY AND ENDOGENOUS
ORGANIZATIONS
Prof. Dr. Gabriel de Abreu Madeira

Av. Bandeirantes, 3900 - Monte Alegre - CEP: 14040-900 - Ribeirão Preto-SP
Fone (16) 3602-4331/Fax (16) 3602-3884 - e-mail: [email protected] site:www.fearp.usp.br
Universidade de São Paulo
Faculdade de Economia, Administração e Contabilidade
de Ribeirão Preto
Reitor da Universidade de São Paulo João Grandino Rodas Diretor da FEA-RP/USP Rudinei Toneto Junior Chefe do Departamento de Administração André Lucirton Costa Chefe do Departamento de Contabilidade Adriana Maria Procópio de Araújo Chefe do Departamento de Economia Walter Belluzzo Junior
CONSELHO EDITORIAL
Comissão de Pesquisa da FEA-RP/USP
Faculdade de Economia, Administração e Contabilidade de Ribeirão Preto
Avenida dos Bandeirantes,3900
14049-900 Ribeirão Preto – SP
A série TEXTO PARA DISCUSSÃO tem como objetivo divulgar: i) resultados de trabalhos em desenvolvimento na FEA-RP/USP; ii) trabalhos de pesquisadores de outras instituições considerados de relevância dadas as linhas de pesquisa da instituição. A série foi subdividida em função das principais áreas de atuação da FEA-RP/USP: Economia, Administração e Contabilidade. Veja o site da CPq na Home Page da FEA-RP: www.fearp.usp.br. Informações: e-mail: [email protected]
Observability and Endogenous Organizations
Weerachart T. Kilenthong∗ and Gabriel A. Madeira†
INCOMPLETE, PLEASE DO NOT CIRCULATE
February 8, 2010
Abstract
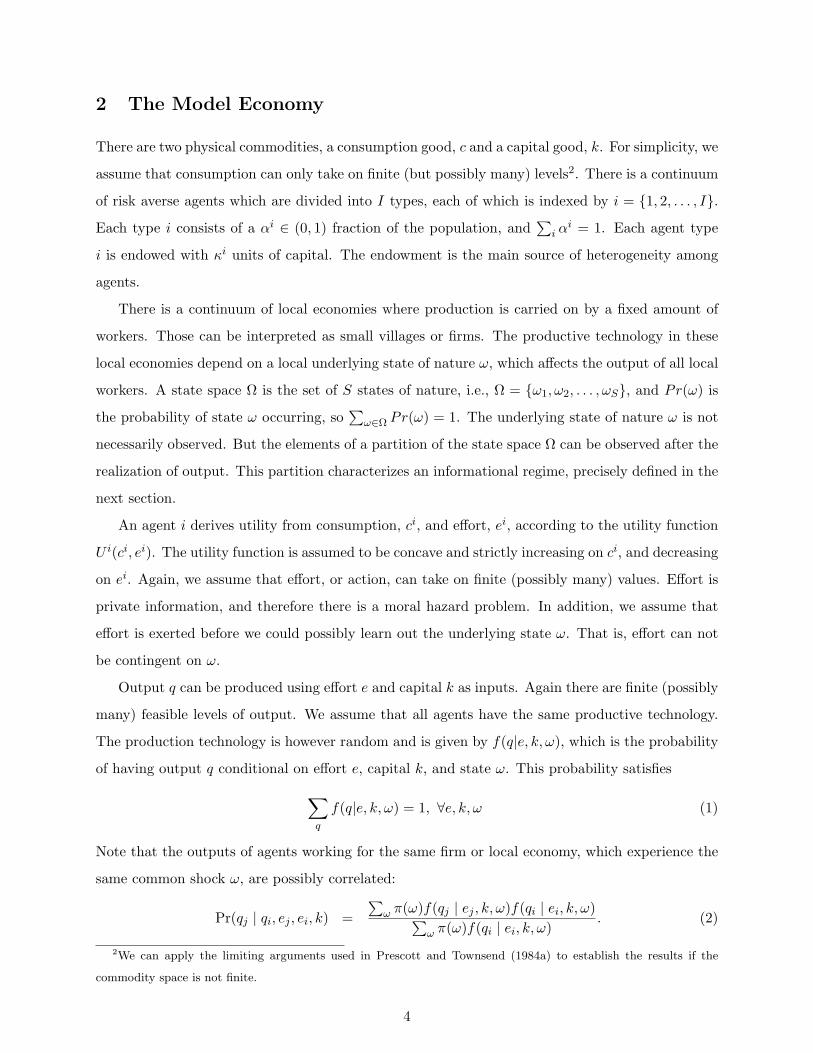
This paper establishes a relationship between the observability of common shocks and opti-
mal organizational design under a multiagent moral hazard environment. We show that, with
sufficient information about common shocks, a cooperative organization can be optimal even if
outputs are highly correlated. This is consistent with the empirical observation that cooperative
arrangements may be more prevalent when outputs are correlated. The model is then embedded
in a Walrasian equilibrium model where choices of organization and investment on information
about common shocks are determined jointly. Numerical results reveal that both cooperative
and individualistic regimes can coexist in equilibrium. The interplay between organization,
investment in information, and inequality is thus analyzed.
JEL Classification Numbers: D23,D71,D85,O17.
Keywords: Risk sharing, general equilibrium, mechanism design, relative performance, opti-
mal organization, aggregate uncertainty.
1 Introduction
Economic agents are often organized in cooperative groups, where they take decisions jointly and
share relevant information. These cooperative arrangements, however, coexist with more individ-
ualistic, competitive regimes. Several examples show that even members of apparently similar
communities, act coordinately in some cases and independently in others. Data from Indian vil-
lages (e.g., Townsend and Mueller, 1998; Mueller et al., 2002) show that while some landowners
have their land farmed by groups of individuals acting cooperatively, others divide up their land in
several plots, and employ a single worker or family in each of them. This duality between coopera-
tive and individualistic arrangements has also been observed in credit contracts: many microcredit∗University of the Thai Chamber of Commerce, Bangkok, Thailand, Email: weerachart [email protected]†Universidade de Sao Paulo, Email: [email protected]
1
arrangements are one-per-credit contracts, but recently group joint liability credit has been widely
adopted in developing economies (Ahlin and Townsend (2007)). Such variability can also be ob-
served in developed economies: big industrial conglomerates many times coexists with smaller firms
producing similar goods. In this paper, we present a model that suggests that the availability of
information about aggregate shocks may be an important ingredient to determine if individuals
will be organized one way or the other.
This variability of organizational regimes has motivated a theoretical literature, based on multi-
agent moral hazard models (e.g., Holmstrom and Milgrom, 1990; Ramakrishnan and Thakor, 1991;
Itoh, 1993; Prescott and Townsend, 2002), which establishes that cooperation or competition can
be optimal, depending on the economic environment. The contractual advantage of cooperation
comes from the fact that, when workers act cooperatively, there are incentives for mutual enforce-
ment of optimal levels of effort. Cooperative groups, however, can potentially collude and make
side payments to mitigate incentives. On the other hand, the correlation of outputs is informative
about the efforts of others. Hence, relative performance will be an optimal arrangement when
outputs are strongly correlated across agents. This result conflicts with the empirical observation
that cooperative arrangements are sometimes more prevalent when outputs are highly correlated
(e.g., Ahlin and Townsend, 2007).
Our model overcomes this inconsistency by adding the possibility of (costly) observability
(Holmstrom, 1979) of common shocks that drives the correlation of the outputs. We prove that
even with highly correlated outputs, perfect observability of common shocks will make cooperative
arrangements optimal. Intuitively, from the contractual point of view, outputs are not correlated
when the common shock is perfectly observed. Therefore, as in Ramakrishnan and Thakor (1991);
Itoh (1993), the relative performance regime looses the advantage, and the group regime is domi-
nating even though, from an ex ante perspective, outputs are highly correlated.
We also put the standard multiagent moral hazard model into a Walrasian equilibrium frame-
work where individuals trade memberships in productive organizations (e.g., Prescott and Townsend,
2006). The organizational affiliation of each individual and the investment on observability of com-
mon shocks are jointly determined in a competitive equilibrium model. When endogenous organiza-
tion and investment on observability are jointly modeled, the relationship between organizational
format and output correlation is subtler. If aggregate shocks are too relevant, there are strong
incentives for investment on information. If such investment produces perfect observability of out-
puts, cooperation will certainly emerge. Also, the willingness to pay for information or the value
of information should be heterogeneous across individuals with different wealths. Results about
2

these interplays between wealth distribution, organization and information acquisition, as provided
by our equilibrium formulation, can help interpreting cross sectional data and generate testable
implications for the model.
Our results may help explaining the transitions between cooperative and individualistic regimes
that are often observed. Indeed, some studies (e.g. Barkey and Van Rossem (1997)) have docu-
mented instability of organization over times. Madeira and Townsend (2008) present a dynamic
model of endogenous groups where the progression of utility promises over time drives changes in
inequality and wealth that originate formation and dissolution of groups1. In steady state, both
regimes coexists, with transitions in both directions. However, this stationary persistence of tran-
sitions contrasts with the waves of mass regime switching, such as the corporate mergers in the late
90’s and the relatively recent proliferation of joint liability microcredit contracts. From our model,
those can possibly result from advances in information technology.
This paper also belongs to the risk sharing literature. Individuals inside our cooperative groups
share risk, so they can be interpreted as risk sharing groups or networks. Although some groups
of individuals achieve successful amounts of risk sharing (Fafchamps and Gubert (2007), Goldstein
(2000) and Grimard (1997)), most of the empirical tests reject risk sharing within villages (e.g.
Deaton (1992), Townsend (1994) and Jalan and Ravallion (1999)). Further, Chiappori et al. (2006)
shows that some family networks and villages in Thailand are successful to share risk, but others
perform poorly.
The remaining of the paper is organized as follows. Section 2 describes the basic environment,
the informational structure and the process of information acquisition. Section 3 presents the two
possible productive organizational regimes, and characterizes optimal arrangements within them.
It also presents theoretical and numerical results determining how optimality of organizational
type relates with availability of common information. Section 4 models Walrasian markets of
memberships in the organizations. The choices of investment in information and organizational
affiliation are jointly determined by an equilibrium in this market. The welfare theorems and the
existence theorem are proved in Section 5. Section 6 presents numerical examples of the competitive
equilibria. Section 7 concludes the paper.1The relationship between wealth, inequality and optimal organizational regime is the object of Prescott and
Townsend (2002)
3
2 The Model Economy
There are two physical commodities, a consumption good, c and a capital good, k. For simplicity, we
assume that consumption can only take on finite (but possibly many) levels2. There is a continuum
of risk averse agents which are divided into I types, each of which is indexed by i = 1, 2, . . . , I.
Each type i consists of a αi ∈ (0, 1) fraction of the population, and∑
i αi = 1. Each agent type
i is endowed with κi units of capital. The endowment is the main source of heterogeneity among
agents.
There is a continuum of local economies where production is carried on by a fixed amount of
workers. Those can be interpreted as small villages or firms. The productive technology in these
local economies depend on a local underlying state of nature ω, which affects the output of all local
workers. A state space Ω is the set of S states of nature, i.e., Ω = ω1, ω2, . . . , ωS, and Pr(ω) is
the probability of state ω occurring, so∑
ω∈Ω Pr(ω) = 1. The underlying state of nature ω is not
necessarily observed. But the elements of a partition of the state space Ω can be observed after the
realization of output. This partition characterizes an informational regime, precisely defined in the
next section.
An agent i derives utility from consumption, ci, and effort, ei, according to the utility function
U i(ci, ei). The utility function is assumed to be concave and strictly increasing on ci, and decreasing
on ei. Again, we assume that effort, or action, can take on finite (possibly many) values. Effort is
private information, and therefore there is a moral hazard problem. In addition, we assume that
effort is exerted before we could possibly learn out the underlying state ω. That is, effort can not
be contingent on ω.
Output q can be produced using effort e and capital k as inputs. Again there are finite (possibly
many) feasible levels of output. We assume that all agents have the same productive technology.
The production technology is however random and is given by f(q|e, k, ω), which is the probability
of having output q conditional on effort e, capital k, and state ω. This probability satisfies∑q
f(q|e, k, ω) = 1, ∀e, k, ω (1)
Note that the outputs of agents working for the same firm or local economy, which experience the
same common shock ω, are possibly correlated:
Pr(qj | qi, ej , ei, k) =∑
ω π(ω)f(qj | ej , k, ω)f(qi | ei, k, ω)∑ω π(ω)f(qi | ei, k, ω)
. (2)
2We can apply the limiting arguments used in Prescott and Townsend (1984a) to establish the results if the
commodity space is not finite.
4

Notice that this correlation is explicitly modeled a result of common shocks. Conditional on the
common shocks, outputs are uncorrelated across agents. This clearly violates the condition in
Holmstrom (1979) under which the information will be valuable. However, we will show that this
information about the common shocks still be valuable for multi-agent organizations. It is valuable
under a multi-agent organization because this potential correlation provides useful information for
incentives, especially when relative performance evaluation is an ingredient of contracts.
2.1 Informational Regimes
An information regime is a partition of Ω, under the information technology z and is denoted by Fz.
Let a subset As ⊂ Ω be a typical member of an information structure, i.e. As ∈ Fz. With abusive
of notation, we will call As an observed state s. For notational convenience, let Sz denote the
number of subsets of Ω in Fz, that is, Fz = A1, . . . , ASz. For example, the coarsest informational
structure (with the least information about states of nature) is F0 = (ω1, ω2, ω3, ω4). Under
this informational regime, we cannot distinguish any common state from each other. On the other
hand, the finest information structure (we can distinguish all states of nature from one another) is
F2 = (ω1) , (ω2) , (ω3) , (ω4).
For a given regime Fz, we can define a modified production function for each subset As ∈ Fz as
(using Bayes’ rule)
Pr(q|e, k, s) =
∑ω∈As f(q|e, k, ω)Pr(ω)
Pr(As)(3)
where Pr(As) =∑
ω∈As Pr(ω) is the probability of having an common state in As. In addition,
this production function satisfies the following probability condition∑q
Pr(q|e, k, s) =∑q
∑ω∈As f(q|e, k, ω)Pr(ω)
Pr(As)=
∑ω∈As Pr(ω)
∑q f(q|e, k, ω)
Pr(As)= 1 (4)
Information Cost
The informational regime z can be thought as the amount of information available about ingredients
that are relevant for local production. It could include, for instance, information about weather
conditions or sectoral economic indicators. This kind of information can be obtained at some cost,
so we allow for possibility that the informational partition can be made finer with some investment
on information. An informational structure Fz can be obtained at a cost of C(z). The cost is
increasing in the accuracy of the information; C(z) ≥ C(z′) for Fz ⊂ Fz′ . In words, the cost is
larger when the information regime is finer. This cost is assumed to be per unit of firms participating
in the regime. The information cost is paid ex ante in units of capital.
5

3 Firms as Optimal Contracts: A Principal-Agent Formulation
Each individual is employed by a firm or local economy. Since workers are risk averse, they poten-
tially benefit from risk-sharing contracts provided by a risk neutral outsider, or principal 3. Effort
is unobserved, however. Hence, there is moral hazard. As a result, it is optimal to impose output
dependency of consumption in order to provide incentives. This is also the reason why it may be
desirable to invest in observability of states of nature.
We consider two classes of organization determining the feasible contractual arrangements; (i)
relative performance firms, and (ii) group firms.
Within a group firm, economic decisions are taken jointly between the agents. There is mutual
observability of effort and side payments among workers. This is sometimes advantageous, as it
allows mutual monitoring across workers: one individual will be punished by a bad performance
of the others, so she will make sure that the others make the desirable amount of effort. However,
mutual observability of effort is not always optimal: when outputs are too strongly correlated
(which, in the current environment, means that common shocks are very important), there may be
collusion among agents. Intuitively, all workers inside a firm could collude and coordinate with low
effort: low output for all workers would look like a bad common shock.
Relative performance evaluation then emerges as an useful incentive tool. In relative perfor-
mance firms, there is no mutual observability of efforts. Workers are placed in separate environ-
ments so they cannot share information about efforts, and each agent is rewarded separately. If
one agent performs poorly compared with the others, she will be punished, while if she performs
well compared with the others she will be rewarded. These comparative compensation schemes are
particularly useful when outputs are highly correlated so the output of one individual is informative
about the distribution of outputs of others.
In addition to organizational regime, a firm is described by the informational regime z, a capital
input k, and an incentive compatible distribution of consumption. Without loss of generality, we
can focus only on efficient firms, and these can be described from its organizational regime, its
informational regime, its capital input, and the expected utility of each agent.
This section characterizes efficient firms, taking as given the capital input k, the informational
regime z, and expected utility levels of each agent. The determination of k, z and utility promises
follow from the competitive equilibrium. For expositional convenience, we assume that there are
only two agents inside each firms, but this can be easily extended to the case of N agents.3In the general equilibrium decentralization, the outsider will be modeled as an intermediary
6
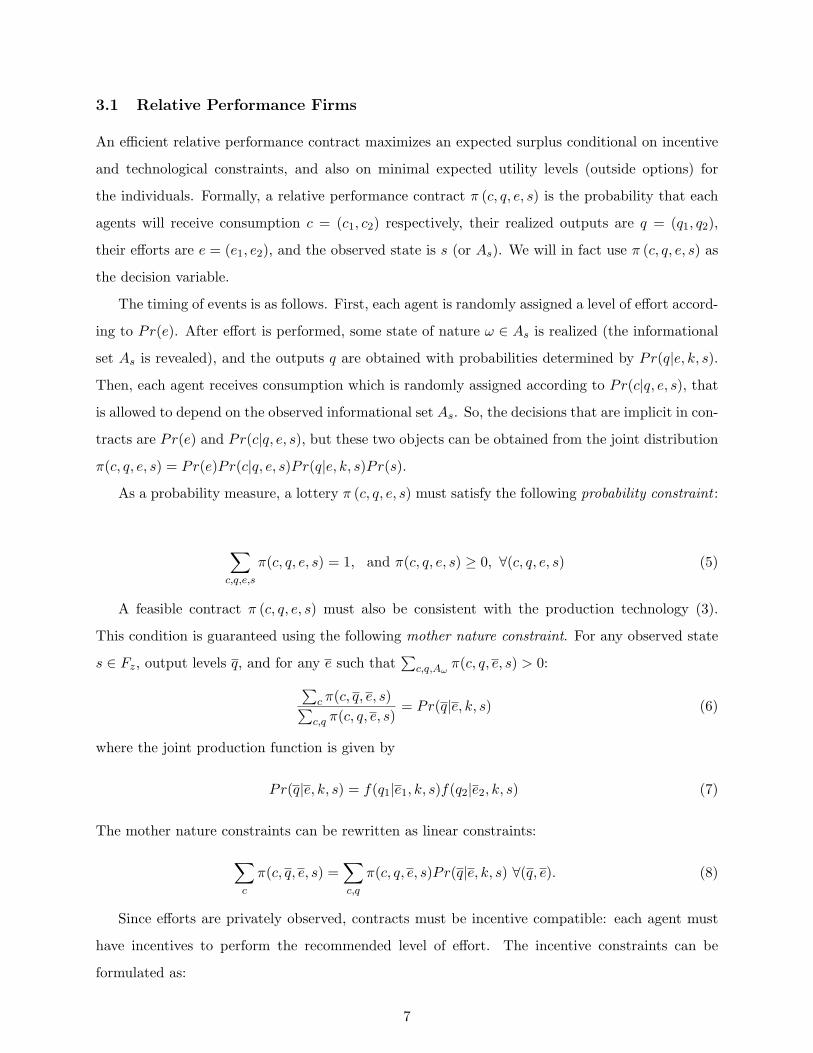
3.1 Relative Performance Firms
An efficient relative performance contract maximizes an expected surplus conditional on incentive
and technological constraints, and also on minimal expected utility levels (outside options) for
the individuals. Formally, a relative performance contract π (c, q, e, s) is the probability that each
agents will receive consumption c = (c1, c2) respectively, their realized outputs are q = (q1, q2),
their efforts are e = (e1, e2), and the observed state is s (or As). We will in fact use π (c, q, e, s) as
the decision variable.
The timing of events is as follows. First, each agent is randomly assigned a level of effort accord-
ing to Pr(e). After effort is performed, some state of nature ω ∈ As is realized (the informational
set As is revealed), and the outputs q are obtained with probabilities determined by Pr(q|e, k, s).
Then, each agent receives consumption which is randomly assigned according to Pr(c|q, e, s), that
is allowed to depend on the observed informational set As. So, the decisions that are implicit in con-
tracts are Pr(e) and Pr(c|q, e, s), but these two objects can be obtained from the joint distribution
π(c, q, e, s) = Pr(e)Pr(c|q, e, s)Pr(q|e, k, s)Pr(s).
As a probability measure, a lottery π (c, q, e, s) must satisfy the following probability constraint :
∑c,q,e,s
π(c, q, e, s) = 1, and π(c, q, e, s) ≥ 0, ∀(c, q, e, s) (5)
A feasible contract π (c, q, e, s) must also be consistent with the production technology (3).
This condition is guaranteed using the following mother nature constraint. For any observed state
s ∈ Fz, output levels q, and for any e such that∑
c,q,Aωπ(c, q, e, s) > 0:∑
c π(c, q, e, s)∑c,q π(c, q, e, s)
= Pr(q|e, k, s) (6)
where the joint production function is given by
Pr(q|e, k, s) = f(q1|e1, k, s)f(q2|e2, k, s) (7)
The mother nature constraints can be rewritten as linear constraints:
∑c
π(c, q, e, s) =∑c,q
π(c, q, e, s)Pr(q|e, k, s) ∀(q, e). (8)
Since efforts are privately observed, contracts must be incentive compatible: each agent must
have incentives to perform the recommended level of effort. The incentive constraints can be
formulated as:
7

∑c,q,e−i,s
π(c, q, ei, e−i, s)ui(ci, ei) ≥∑
c,q,e−i,s
π(c, q, ei, e−i, s)Pr(q|ei, e−i, k, s)Pr(q|ei, e−i, k, s)
ui(ci, ei), ∀ei (9)
The contract also needs to assure that individuals will get an utility level not smaller than the
promised expected utility, ui. This participation constraint can be expressed as:
∑c,q,e,s
π(c, q, e, s)ui(ci, ei) ≥ ui, ∀i (10)
Since effort is performed before the observed state s is revealed, the distribution of effort must
be independent of the distribution of s. That is, for any vector of effort levels e :
∑c,q
π(c, q, e, s) = Pr(As)∑c,q,s
π(c, q, e, s), ∀e and s ∈ 1, ..., Sz (11)
Constraints (5), (8) and (11) guarantee that the choosing π(c, q, e, s) is equivalent to choosing Pr(e)
and Pr(c|q, e, s)4.
An optimal relative performance policy π∗(c, q, e, s) solves:
Program 1:
maxπ
∑c,q,e,s
π(c, q, e, s)(q1 + q2 − c1 − c2) (12)
subject to constraints (5)-(11).
3.2 Group Firms
Another organizational form available for the individuals in each location is the group regime, where
decisions are taken jointly by both agents. Again, for a group, a contract can be characterized as
Pr(e) and Pr(c|q, e, s). However given these objects, individuals inside a group can potentially
collude and use a combination of coordinated effort levels and side payments to promote local
Pareto improvements. The principal anticipate this possibility and focuses only on collusion-proof
contracts. In these collusion proof contracts, whenever vectors of effort, e, and consumption, c, are
recommended, it must be the case that, for a pair of given positive weights, µ1 and µ2:4 Notice also that From (5) and (11), we also know that
∑(c, q, e, s) = Pr(As) for all s ∈ 1, ..., Sz, that is, there
is consistency between the probabilities in π and the probabilities of the informational sets given z.
8

∑c,q,s
Pr(c|e, q, s)Pr(q|e, k, s)∑i
µiui(ci) ≥∑c,q,s
Pr(c|e, q, s)Pr(q|e, k, s)∑i
µiui(ci(c)) (13)
for any e and any c(c) ≡ [c1(c), c2(c)] such that c1(c) + c2(c) = c1 + c2 ≡ cA, where cA can
be interpreted as the common consumption within a group. When ui is concave and separable
(ui(ci, ei) = ui(ci)− vi), this implies that c is a function of cA and µ ≡ (µ1, µ2) given by:
c(cA, µ) = arg maxc
∑i
µiui(ci) (14)
s.t.∑i
ci = cA.
So, a group contract can be formulated as, first, the choice (possibly random) of the inside-group
Pareto weights (Pr(µ)), and then the choice (possibly random) of effort (Pr(e|µ)) and finally
of common consumption conditional on outputs, effort and µ (Pr(cA|q, e, s, µ), (the choices of µ
immediately determines the whole vector c as a function of cA and µ). We will first character-
ize the constraints of the problem after the choice of Pr(µ). Again, the choices of Pr(e|µ) and
Pr(cA|q, e, s, µ) can now be expressed by the joint distribution (conditional on µ) πµ(cA, q, e, s) =
Pr(e|µ)Pr(q|e, k, s)Pr(cA|q, e, s, µ)Pr(As). Again, this joint distribution, πµ, is a probability dis-
tribution, so:
∑cA,q,e,s
πµ(cA, q, e, s) = 1, πµ(cA, q, e, s) ≥ 0, ∀(cA, q, e, s). (15)
Again, πµ must be subject to a mother nature constraint that guarantees consistency with the
productive technology:
∑cA
πµ(cA, q, e, s) = Pr(q|e, k, s)∑cA,q
πµ(cA, q, e, s),∀(q, e, s). (16)
The incentive constraints for a group with Pareto weights µ1 and µ2, which is follow directly
from (13) are:
9
∑cA,q,s
πµ(cA, q, e, s)∑i
µiui(ci(cA, µ), e) ≥
∑cA,q,s
πµ(cA, q, e, s)Pr(q|e, k, s)Pr(q|e, k, s)
∑i
µiui(ci(cA, µ), e),∀(e, e) (17)
Notice that there is an unique incentive constraint for the group regime, which reflects the fact
that decisions are taken jointly. The participation constraint for the group regime is:∑cA,q,e,s
πµ(cA, q, e, s)ui(ci(cA, µ), e) ≥ ui, i = 1, 2 (18)
Finally, the distribution of effort must be independent of the information set As, so:
∑cA,q
π(cA, q, e, s) = Pr(As)∑cA,q,s
π(cA, q, e, s), ∀(s, e) (19)
The problem, optimal group arrangements are thus given by:
Program 2:
maxπµ,P r(µ)
∑cA,q,e,µ
πµ(cA, q, e, s) · Pr(µ) · (q1 + q2 − cA) (20)
s.t.(14) to (19).
3.3 Comparing Regimes
As it is shown by Prescott and Townsend (2002) and Madeira and Townsend (2008), both the
relative performance and the group regimes may be optimal. The relative performance regime
tends to dominate for low levels of inequality and intermediate levels of surplus, while the group
regime dominates for high inequality and high or low levels of surplus. In this section, we show
that the optimal regime also depends on the informational state z. Proposition 1 shows that, in the
symmetric case where the utility of both agents is the same, a group contract generates a higher
surplus than a relative performance contract with the same utility for all agents when the common
shocks are perfectly observed. Notice that a key assumption is that all output correlation comes
from the common shocks ω. Conditional on ω, outputs are (ex post) uncorrelated across agents.
In this sense, the result is consistent with the finding in Ramakrishnan and Thakor (1991); Itoh
(1993), which show that group regimes dominate when outputs are not correlated.
10

Proposition 1. Suppose there is full observability of common shocks Fz = (w1) , ..., (wS) . Then,
for any relative performance contract with u1=u2, there exists a feasible group contract with the
same utility to the agents that generate weakly higher surplus. Further, when the optimal level
of effort under relative performance is not the lowest one, the feasible group contract generates a
strictly higher surplus with the same utility for the agents.
Proof. See Appendix. Q.E.D.
For non-symmetric cases, our numerical examples suggest that this result holds. We assume
that u(c) = c0.5 − e, and admit two possible values for e (high effort and low effort): eh = 4 and
el = 0. We also assume two possible values for q (high output, or success, and low output, or
failure): qh = 20 and ql = 2, and admit two possible states, 1 and 2 (so Ω = 1, 2) with equal
probability, Pr(ω = 1) = Pr(ω = 2) = 0.5. The distribution of outputs conditional on effort is
presented in Table 2, and the joint distribution of outputs in Table ??.
Table 1: Distribution of output, f(q|e, ω).
Output level ω = 1 ω = 2
eh el eh el
h = 1 0.95 0.05 0.50 0.50
h = 2 0.05 0.95 0.50 0.50
Table 2: Joint distribution of outputs: f(q1, q2|e1, e2).
Output vector (eh, eh) (eh, el) (el, eh) (el, el)
(qh, qh) 0.5762 0.1487 0.1487 0.1263
(qh, ql) 0.1487 0.5762 0.1263 0.1487
(ql, qh) 0.1487 0.1263 0.5762 0.1487
(ql, ql) 0.1263 0.1487 0.1487 0.5762
Technically we solve two linear programming problems, Program 1 and Program 2 for different
pairs of utility (u1, u2) when agents cannot observe the common shocks, that is, Fz = 1, 2. Figure
1 illustrates the difference between surplus under relative performance (a solution to Program 1)
and the surplus under group regime (a solution to Program 2). As in Prescott and Townsend (2002)
and Madeira and Townsend (2008), for some combinations of inequality and surplus (allocations
with low inequality and intermediate levels of wealth) the relative performance regime generates
11
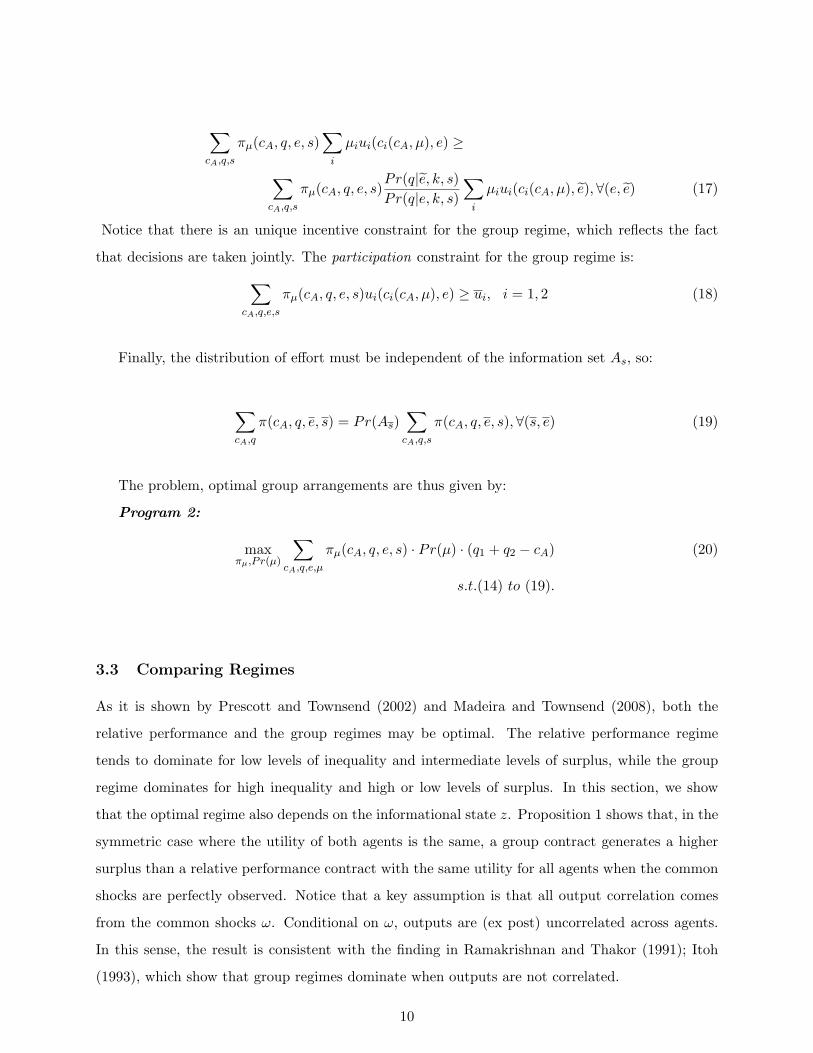
higher surpluses while, for others (high inequality, extreme values for wealth), the group regime is
more efficient.
Figure 1: Surplus under Relative Performance minus surplus under groups: Coarse Filtration
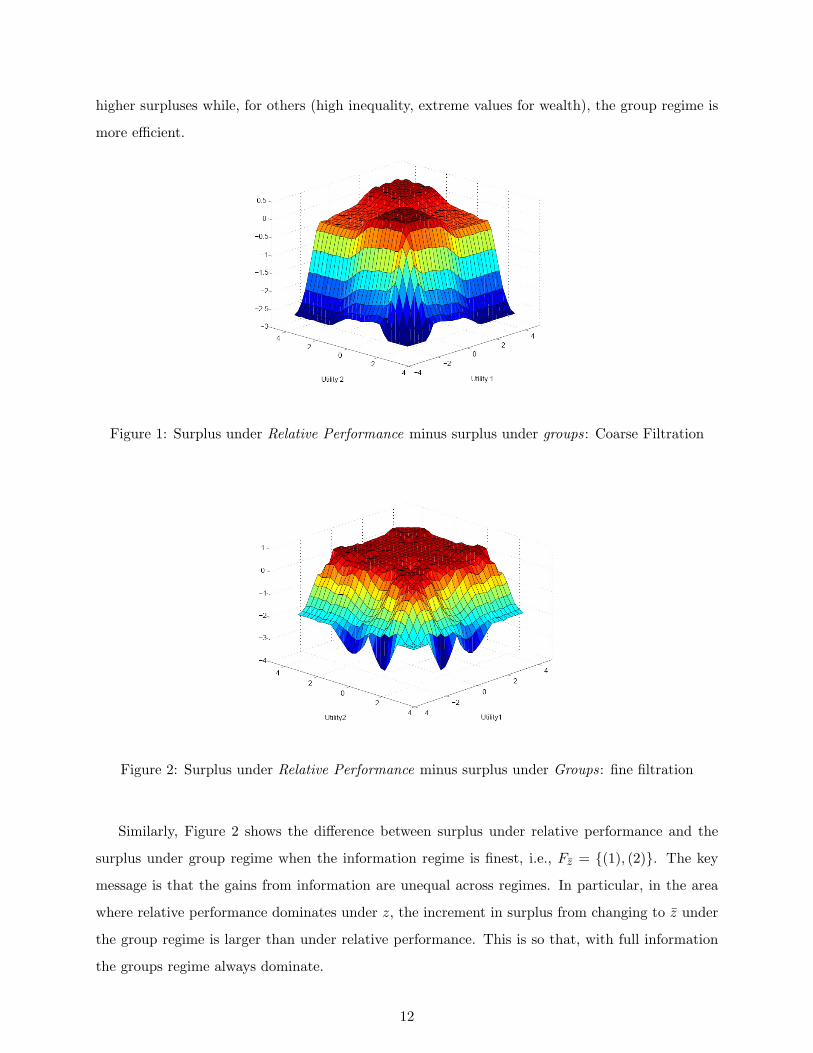
Figure 2: Surplus under Relative Performance minus surplus under Groups: fine filtration
Similarly, Figure 2 shows the difference between surplus under relative performance and the
surplus under group regime when the information regime is finest, i.e., Fz = (1), (2). The key
message is that the gains from information are unequal across regimes. In particular, in the area
where relative performance dominates under z, the increment in surplus from changing to z under
the group regime is larger than under relative performance. This is so that, with full information
the groups regime always dominate.
12

The heterogeneity in the gains from information or the value of information across regimes
can be seen clearly from Figure 3 and Figure 4, which show that gains from adopting a finer
informational regimes under relative performance and group regimes, respectively. It is clear that,
under both regimes, there is a surplus gain from a finer informational set. Notice that this example
is an extreme case that makes it easy to understand the gains from information: under state 2,
there is no dependency of output on effort. This means that making consumption conditional on
output given state 2 does not provide any additional incentive for high effort. So, conditional on
state 2 full insurance is optimal, but this can only be imposed when there is information about
state.
Figure 3: Relative Performance: surplus with fine filtration minus surplus with coarse filtration
3.4 Complete Characterization of Firms
From the analysis presented, it is possible to fully characterize the contracts under both regimes just
from the type of organization, informational regime, amounts of capital and utility promises for all
individuals. More formally, the set of potential firms can be defined as B = b = (o, z, k, u1, u2),
where o is the type of organization (group or relative performance firm), z is the information
regime, k is the amount of capital and ui is the utility promise of agent i. As in the next section,
this will define a commodity in our general equilibrium model. In other words, each individual
will be (possibly randomly) assigned to a position of a firm, which implicitly includes choices of
organization and investment on information.
13

Figure 4: Groups: surplus with fine filtration minus surplus with coarse filtration
4 Competitive Equilibrium with Endogenous Organization
This section formulates a competitive equilibrium with endogenous organizations and informational
regimes. As stated earlier, we consider only two types of firms, relative-performance and group-
evaluation firms, discussed in the previous section.
4.1 Consumption Possibility Set
Let B be a finite set of all potential firms (optimal contracts with different capital input, different
organizational and informational regimes, and different promised utility levels). A typical firm b
specifies capital input, k(b), organization form (either relative-performance or group-evaluation),
information regime, z(b), promised expected utility for the jth position, v(b, j). In addition, each
firm b is associated with a (average) surplus S(b). With a continuum of firms, the average surplus
from each firm is equal to the expected surplus of the firm (we here apply a law of large number).
Denote the probability of an agent type i is working at position j in firm b ∈ B by xi (b, j).
With continuum of agents, xi (b, j) can be interpreted as the fraction of agent assigned to a bundle
(b, j).
As a probability measure, a lottery must satisfy
∑(b,j)
xi (b, j) = 1 (21)
which is called a probability constraint.
14

The consumption possibility set is then defined by
Xi =
xi ≥ 0 :∑(b,j)
xi (b, j) = 1
(22)
The linearity of the constraints ensures the convexity of the consumption possibility set Xi.
The preferences over Xi are defined accordingly as
∑(b,j)
xi (b, j) v (b, j) (23)
4.2 Pareto Optimal Allocations
Each viable firm must have every positions filled. This gives us a club or matching condition (see
Prescott and Townsend (2006)): for each firm b,
∑i
αixi (b, j) =∑i
αixi(b, j′
)= δ (b) , ∀j, j′ (24)
where δ (b) is the measure of active firm b.
The average consumption must be equal to the average production. In other words, the average
net transfers from all firms f all types must be zero. The resource constraint is given by
∑b
δ (b)S (b) = 0 (25)
where S (b) is the average or expected surplus of firms type b.
The resource constraint for capital is given by
∑b
δ (b) [k(b) + C(b)] =∑i
αiκi (26)
where C(b) = C(z(b)) is the information cost incurring to a firm b with an informational regime
Fz. This constraint states that average capital input and information cost (in unit of capital) is no
larger than the average endowment of capital available. The first term on the LHS is the average
capital input. The second term is the average information cost. The RHS is the average endowment
of capital.
We characterize the constrained optimality using the following Pareto program. Let λi ≥ 0 be
the Pareto weight of agent type i. There is no loss of generality to normalize the weights such that∑i λ
i = 1. A constrained Pareto optimal allocation solves the following Pareto program.
15
Pareto Program
max(xi,δ)
∑i
λiαi∑(b,j)
xi (b, j) v (b, j) (27)
subject to
∑(b,j)
xi (b, j) = 1, ∀i (28)
∑i
αixi (b, j) = δ (b) , ∀j, b (29)∑b
δ (b) [k(b) + C(b)] =∑i
αiκi (30)∑b
δ (b)S (b) = 0 (31)
Note that the Pareto program includes all incentive constraints which are embedded in the grids
of potential firms.
It is clear that the objective function is linear in x, and thereby it is continuous and weakly
concave. As discussed earlier, the feasible set X is non-empty, compact, and convex. Therefore, a
solution to the Pareto program for given positive Pareto weights exists and is a global maximum.
The proof of the equivalence between Pareto optimal allocations and the solutions to the program
is omitted for brevity (see Prescott and Townsend (1984b) for a similar proof).
4.3 Competitive Equilibrium
Following Prescott and Townsend (2006), we define Walrasian equilibrium as follows.
Let P (b, j) be the price of a bundle (b, j) or the price of the jth position in firm b. Note that
the price of the capital good is 1 as it is the numeraire good. Each agent is infinitesimally small
relative to the entire economy and will take all prices as given. The market-makers introduced
below will also act competitively.
Workers: Each agent i, taking prices P (b, j) as given, chooses xi in period t = 0 to maximize
his utility:
maxxi
∑(b,j)
xi (b, j) v (b, j) (32)
subject to the probability constraint
∑(b,j)
xi (b, j) = 1, (33)
16

and the budget constraint
∑(b,j)
P (b, j)xi (b, j) ≥ κi (34)
The budget constraint (34) states that the agent sells all her endowment κi and uses this income
to buy lotteries xi.
Each agent then is assigned to a firm according to the lottery by market-makers. With the
continuum of agents, the probability of the lottery can be interpreted as a fraction of agents.
Market-Makers: The primary role of a market-maker is to create firms by assigning workers
to organizations and generate information about aggregate states. With constant returns to scale,
the profit of a market-maker must be zero and the number of market-makers becomes irrelevant.
Therefore, without loss of generality we assume there is one representative market-maker, which
takes prices as given.
In particular, the market-maker buys consumption goods and produce firms. The market-maker
issues (sells) y (b, j) ∈ R+ units of each bundle (b, j), at the unit price P (b, j). By doign so, he has
to create δ(b) units of firms b. Note that the market-maker can issue any non-negative number of a
bundle; that is, the number of a bundle issued does not have to be between zero and one and is not
a lottery. It is the number of bundles. Let y ∈ L be the vector of the number of bundles issued.
By issuing or selling (b, j), the market-maker promises to deliver state-contingent transfers
−S (b) in units of consumption. The average net transfers of all firms must be no more than zero.
The market-clearing constraint for the surplus is then
∑b
δ(b)S (b) ≥ 0 (35)
This transfers can be interpreted as state-contingent financial contracts among firms.
By creating δ(b) units of firms b, the market-maker must fill all positions within the firms: for
each b,
δ(b) = y (b, j) = y(b, j′
), ∀j, j′ (36)
The market-maker must deliver the promised capital to each firm b, k(b). In addition, it must
pay for the information C(b). It ensures that by buying K units of capital from individuals:
∑b
δ(b) [k(b) + C(b)] = K (37)
17

The objective of a market-maker is to maximize its profit by choosing (δ,y,K), taking prices
P (b, j) as given:
max(δ,y,K)
∑(b,j)
P (b, j) y (b, j)−K
subject to (35)-(37). The first term is the total revenue of the market-maker and the bracketed
term denotes its total (market) cost.
Using the club or matching condition, (36), we can rewrite
∑(b,j)
P (b, j) y (b, j) =∑b
δ (b)
∑j
P (b, j)
Using the above condition and (37), we can rewrite the the problem as
maxδ
∑b
δ (b)
∑j
P (b, j)− [k(b) + C(b)] + PSS (b)
(38)
where PS is the Lagrange multiplier for the surplus constraint (37). This profit-maximization
problem is a well-defined linear program whose (linear) constraints satisfy Slater’s condition (Uzawa
(1958)). In addition, the existence of an optimum to the market-maker’s problem requires that for
any bundle (b, j), ∑j
P (b, j) ≤ k(b) + C(b)− PSS (b) (39)
where it holds with equality if y (b, j) > 0. Here∑
j P (b, j) is the revenue from the sale of the
memberships of firm b. This condition is in fact the necessary and sufficient condition for the
saddle-point problem (38).
Define k(b) + C(b) as the input cost of the creating firm b firm, and −PSS (b) as its financing
cost. The market-maker considers the sum of both input cost and financing cost as its total cost
for creating a firm. The optimal condition states that the market-maker will create a firm only if it
does not cause a total loss. On the other hand, the revenue cannot be strictly larger than the total
cost. Otherwise, the market-maker will create an unbounded amount of such firm, which cannot
be in equilibrium. In addition, the total profit of the market-maker in equilibrium is zero.
Market Clearing: The market-clearing condition for capital input is∑(b)
δ (b) k(b) =∑i
αiκi (40)
Similarly, the market-clearing conditions for lotteries are∑i
αixi (b, j) = y (b, j) , ∀ (b, j) (41)
18

Definition 1. A competitive equilibrium is a specification of allocation (x,y, δ), and the price of
a position j in a firm b,P (b, j), such that
(i) for each i, xi ∈ Xi solves (32) subject to (34), taking prices P (b, j) as given,
(ii) for the market-maker, y, δ, PS solves (38), taking prices P (b, j) as given,
(iii) markets for capital input and lotteries clear, i.e. (40)-(41) hold,
5 Existence and Welfare Theorems
As in the classical general equilibrium model, the economy is a well-defined convex economy, i.e.,
the commodity space is Euclidean, the consumption set is compact and convex, the utility function
is linear. As a result, the first and second welfare theorems hold, and a competitive equilibrium
exists. In particular, this section proves that the competitive equilibrium is constrained optimal and
any constrained optimal allocation can be supported by a competitive equilibrium with transfers.
Then, we will use Negishi’s method to prove the existence of a competitive equilibrium.
The standard contradiction argument will be used to prove the following first welfare theorem.
We also assume that there is no local satiation point in the consumption set.
Assumption 1. For any xi ∈ Xi, there exists xi ∈ Xi such that
U i(xi)> U i
(xi)
(42)
where U i(xi)
is the expected utility of agent i derived from allocation xi.
This assumption is easily satisfied using reasonable specifications of the grid of promised utility.
For example, with a strictly increasing utility function, if we include a very large promised utility
into the grid (larger than what can be attained with endowments), then the local nonsatiation
assumption will be satisfied.
Theorem 1. With local nonsatiation of preferences (Assumption 1), a competitive equilibrium
allocation is (constrained) Pareto optimal.
The Second Welfare theorem states that any Pareto optimal allocation, corresponding to strictly
positive Pareto weights, can be supported as a competitive equilibrium with transfers, precisely
defined later. The standard approach applies here. In particular, we will first prove that any
constrained optimal allocation can be decentralized as a compensated equilibrium. To prove this
19
result, we show that a solution to the Pareto program is also a solution to expenditure minimization
and profit maximization problems in equilibrium. Since all the optimization problems are well-
defined concave problems, the Kuhn-Tucker conditions are necessary and sufficient. Hence, we will
show that the Kuhn-Tucker conditions of Pareto program are equivalent to the ones of consumers’
and intermediary’s problems in equilibrium. In addition, the resource constraints in the Pareto
programs are equivalent to the market-clearing conditions in equilibrium. Then, we will use a
standard cheaper-point argument (see Debreu (1954)) to show that any compensated equilibrium
is a competitive equilibrium with transfers.
Theorem 2. Any Pareto optimal allocation corresponding with strictly positive Pareto weights
λh > 0,∀h can be supported as a competitive equilibrium with transfers.
We use Negishi’s mapping method (Negishi (1960)) to prove the existence of competitive equi-
librium. The proof benefits from the second welfare theorem. Specifically, a part of the mapping
applies the theorem in that the solution to the Pareto program is a competitive equilibrium with
transfers. We can show that a fixed-point of the mapping exists and it represents a competitive
equilibrium without transfers.
Theorem 3. For any positive endowments, a competitive equilibrium exists.
6 Numerical Examples
This section presents numerical examples of competitive equilibria, and discusses the interplay
between organization, investment in information, and inequality. In particular, we will solve the
Pareto Program whose solution is a (constrained) Pareto optimal, and employ the second wel-
fare theorem to discover the corresponding competitive equilibrium. The equilibrium prices are
computed using the following relationships:
P (b, j) =µm(b, j)µk
(43)
PS =µSµk
(44)
where µm(b, j), µk, µS are the Lagrange multipliers with respect to the matching constraint (29),
the resource constraint (30), and the surplus constraint (31), respectively. Accordingly, the capital
endowments that support the competitive equilibrium allocation can be derived from the budget
constraint:
κi =∑(b,j)
P (b, j)xi(b, j) (45)
20

Similarly to examples in Section 3.3, the following numerical examples assume that u(c) =
c0.5 − e, and admit two possible values for e (high effort and low effort): eh = 4 and el = 0.
We also assume two possible values for q (high output, or success, and low output, or failure):
qh = 20 and ql = 2, and admit two possible states, 1 and 2 (so Ω = 1, 2) with equal probability,
Pr(ω = 1) = Pr(ω = 2) = 0.5. The production technology is given by f(q+k|e, ω, k) = f(q|e, ω)+k,
where f(q|e, ω) is defined according to the distribution in Table 2 as in Section 3.3. There are two
types of agents, type 1 and type 2. In addition, we assume that, at a cost of C(2) = 0.96, every ω
will be observed.
Figures 5 displays the probabilities of relative performance assignment for different combinations
of aggregate endowment and Pareto weights. It reveals that the regime dominance profile changes
when the possibility of investment in the observability of common shocks is introduced.
As in the standard multi-agent moral hazard model, relative performance tends to dominate for
low inequality and intermediate wealth levels (e.g., Prescott and Townsend, 2002). However, the
area of relative performance dominance is not continuous when it is possible to observe the common
shocks. In particular, there is a region with group domination between two separate areas with
relative performance domination. This strip represents an area where information is very valuable.
Indeed, as it is shown in Figure 6, the probability of investment on information is high at this area
relative to its neighborhood.
Figure 5: Probability of assignment to the Relative Performance regime.
Tables I to IV describe examples of competitive equilibria for different initial endowment levels,
Pareto weights of types and fraction of types in the population. Each column corresponds to a
position (in the 7th line) for a given type (in the 8th line) in an organization (indexed in line 2)
21

Figure 6: Probability of investment on information.
that is chosen with positive probability. This probability (that the type in line 8 is assigned to
the position in line 7 of the organization indexed in line 2) is presented in line 1. Lines 3 and 4
describes the utility of the first and second positions in each contract and lines 5 and 6 are indicators
of organizational arrangement and investment in observability of common shocks. More specifically,
in line 5, ”1” indicates the group regime, while ”0” indicates the relative performance regime. In
line 6, ”1” indicates that there is investment in observability and ”0” indicates no investment in
observability. Line 9 shows the price of the contract indexed in line 2 for the position in line 7.
Just below the tables, w1 and w2 denote the initial capital endowments os types 1 and 2.
Table I
Table II describes the symmetric case where both types of agent have the same Pareto weight.
Notice that both kinds of organization are observed with positive probability. In this example,
groups are only observed in organizations that investment on observability of common shocks. But
this is not always the case. Table II presents an example where Pareto weights are different across
22
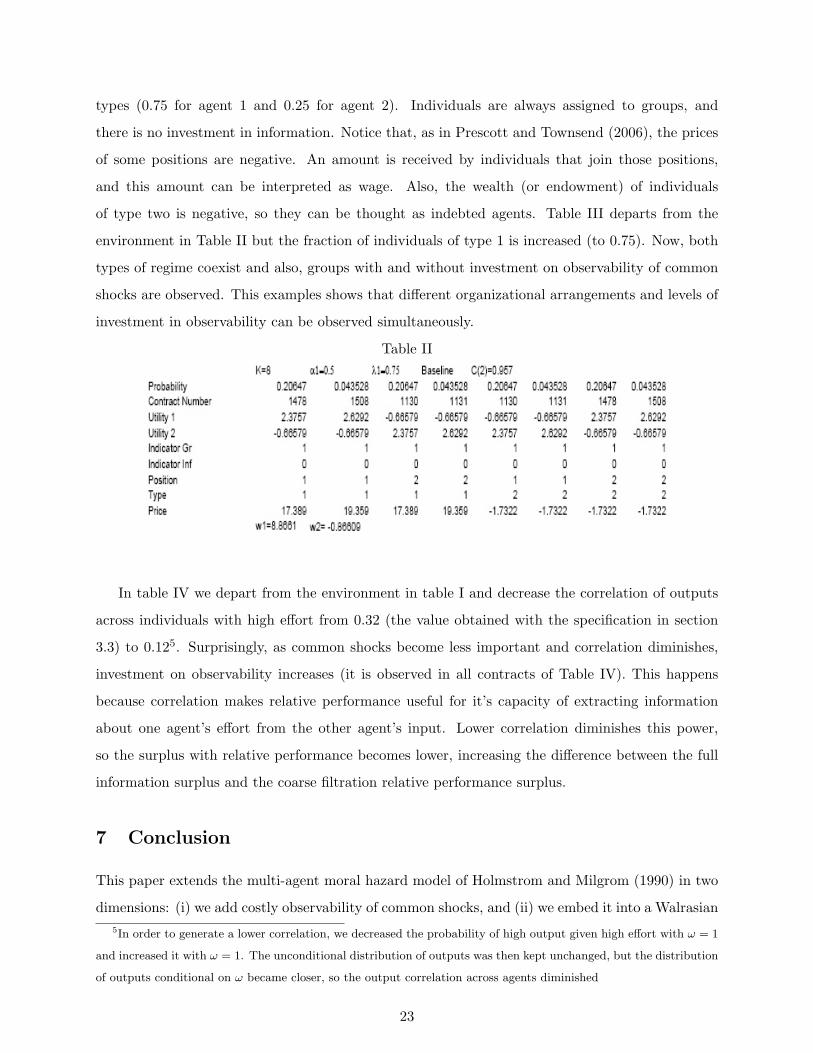
types (0.75 for agent 1 and 0.25 for agent 2). Individuals are always assigned to groups, and
there is no investment in information. Notice that, as in Prescott and Townsend (2006), the prices
of some positions are negative. An amount is received by individuals that join those positions,
and this amount can be interpreted as wage. Also, the wealth (or endowment) of individuals
of type two is negative, so they can be thought as indebted agents. Table III departs from the
environment in Table II but the fraction of individuals of type 1 is increased (to 0.75). Now, both
types of regime coexist and also, groups with and without investment on observability of common
shocks are observed. This examples shows that different organizational arrangements and levels of
investment in observability can be observed simultaneously.
Table II
In table IV we depart from the environment in table I and decrease the correlation of outputs
across individuals with high effort from 0.32 (the value obtained with the specification in section
3.3) to 0.125. Surprisingly, as common shocks become less important and correlation diminishes,
investment on observability increases (it is observed in all contracts of Table IV). This happens
because correlation makes relative performance useful for it’s capacity of extracting information
about one agent’s effort from the other agent’s input. Lower correlation diminishes this power,
so the surplus with relative performance becomes lower, increasing the difference between the full
information surplus and the coarse filtration relative performance surplus.
7 Conclusion
This paper extends the multi-agent moral hazard model of Holmstrom and Milgrom (1990) in two
dimensions: (i) we add costly observability of common shocks, and (ii) we embed it into a Walrasian5In order to generate a lower correlation, we decreased the probability of high output given high effort with ω = 1
and increased it with ω = 1. The unconditional distribution of outputs was then kept unchanged, but the distribution
of outputs conditional on ω became closer, so the output correlation across agents diminished
23
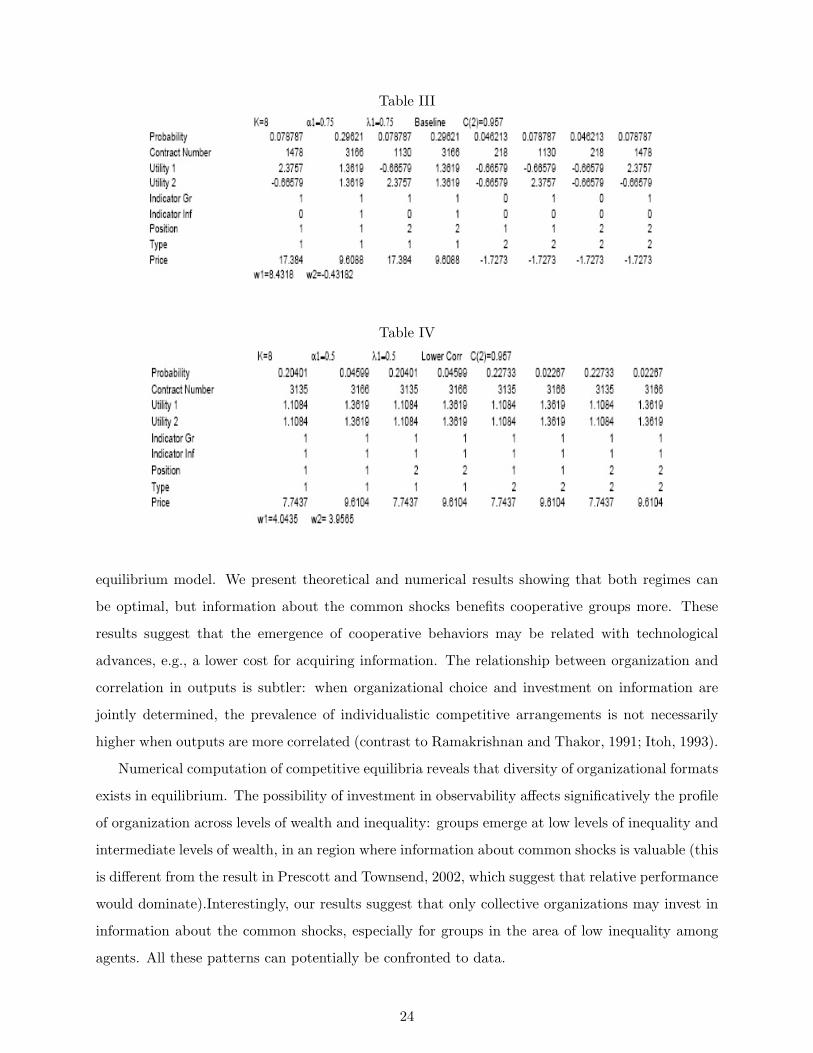
Table III
Table IV
equilibrium model. We present theoretical and numerical results showing that both regimes can
be optimal, but information about the common shocks benefits cooperative groups more. These
results suggest that the emergence of cooperative behaviors may be related with technological
advances, e.g., a lower cost for acquiring information. The relationship between organization and
correlation in outputs is subtler: when organizational choice and investment on information are
jointly determined, the prevalence of individualistic competitive arrangements is not necessarily
higher when outputs are more correlated (contrast to Ramakrishnan and Thakor, 1991; Itoh, 1993).
Numerical computation of competitive equilibria reveals that diversity of organizational formats
exists in equilibrium. The possibility of investment in observability affects significatively the profile
of organization across levels of wealth and inequality: groups emerge at low levels of inequality and
intermediate levels of wealth, in an region where information about common shocks is valuable (this
is different from the result in Prescott and Townsend, 2002, which suggest that relative performance
would dominate).Interestingly, our results suggest that only collective organizations may invest in
information about the common shocks, especially for groups in the area of low inequality among
agents. All these patterns can potentially be confronted to data.
24

The current framework accept a number of extensions. A dynamic version of the model could
be informative about co-movements and transitions, and also generate patterns of evolution of
organizational form as agents learn about the environment and the production process. In addition,
we are working on a model with optimal size of organizations and it’s interplay with availability of
information about shocks.
References
Ahlin, C. and R. Townsend (2007). Selection into and across credit contracts: theory and field
research. Journal of Econometrics 136 (2), 665–698.
Barkey, K. and R. Van Rossem (1997). Networks of Contention: Villages and Regional Structure in
the Seventeenth-Century Ottoman Empire 1. American Journal of Sociology 102 (5), 1345–1382.
Chiappori, P., K. Samphantharak, S. Schulhofer-Wohl, and R. Townsend (2006). Heterogeneity
and Risk Sharing in Thai Villages. Manuscript, University of Chicago.
Deaton, A. (1992). Household saving in LDCs: Credit markets, insurance and welfare. The
Scandinavian Journal of Economics, 253–273.
Fafchamps, M. and F. Gubert (2007). The formation of risk sharing networks. Journal of Devel-
opment Economics 83 (2), 326–350.
Goldstein, M. (2000). Chop Time, No Friends: Risk and Intrahousehold Insurance in Southern
Ghana.”. Manuscript, London School of Economics.
Grimard, F. (1997). Household consumption smoothing through ethnic ties: Evidence from Cote
dIvoire. Journal of Development Economics 53 (2), 391–422.
Holmstrom, B. (1979). Moral hazard and observability. The Bell Journal of Economics, 74–91.
Holmstrom, B. and P. Milgrom (1990). Regulating Trade Among Agents. Journal of Institutional
and Theoretical Economics: JITE 146, 85–105.
Itoh, H. (1993). Coalitions, incentives, and risk sharing. Journal of Economic Theory 60 (2),
410–427.
Jalan, J. and M. Ravallion (1999). Are the poor less well insured? Evidence on vulnerability to
income risk in rural China. Journal of Development Economics 58 (1), 61–81.
25

Madeira, G. and R. Townsend (2008). Endogenous groups and dynamic selection in mechanism
design. Journal of Economic Theory 142 (1), 259–293.
Mueller, R., E. Prescott, and D. Sumner (2002). Hired hooves: Transactions in a south Indian
village factor market. The Australian Journal of Agricultural and Resource Economics 46, 233–
255.
Negishi, T. (1960). Welfare economics and existence of an equilibrium for a competitive economy.
Metroeconomica 12 (2-3), 92–97.
Prescott, E. and R. Townsend (1984a). General Competitive Analysis in an Economy with Private
Information. International Economic Review 25 (1), 1–20.
Prescott, E. and R. Townsend (1984b). Pareto Optima and Competitive Equilibria with Adverse
Selection and Moral Hazard. Econometrica 52 (1), 21–45.
Prescott, E. and R. Townsend (2002). Collective organizations versus relative performance con-
tracts: Inequality, risk sharing, and moral hazard. Journal of Economic Theory 103 (2), 282–310.
Prescott, E. and R. Townsend (2006). Firms as Clubs in Walrasian Markets with Private Informa-
tion. Journal of Political Economy 114 (4), 644–671.
Ramakrishnan, R. and A. Thakor (1991). Cooperation versus competition in agency. Journal of
Law, Economics, and Organization 7 (2), 248–283.
Townsend, R. (1994). Risk and insurance in village India. Econometrica: Journal of the Econo-
metric Society , 539–591.
Townsend, R. and R. Mueller (1998). Mechanism design and village economies: From credit to
tenancy to cropping groups. Review of Economic Dynamics 1 (1), 119–172.
Uzawa, H. (1958). The Kuhn-Tucker Theorem in Concave Programming. Stanford Mathematical
Studies in the Social Sciences.
A Proof of Proposition 1
Proposition 1 Suppose there are two possible levels for effort and output. Suppose also that
Fz = w1, ..., wS . Then, any relative performance arrangement with u1=u2 generates a surplus that
26
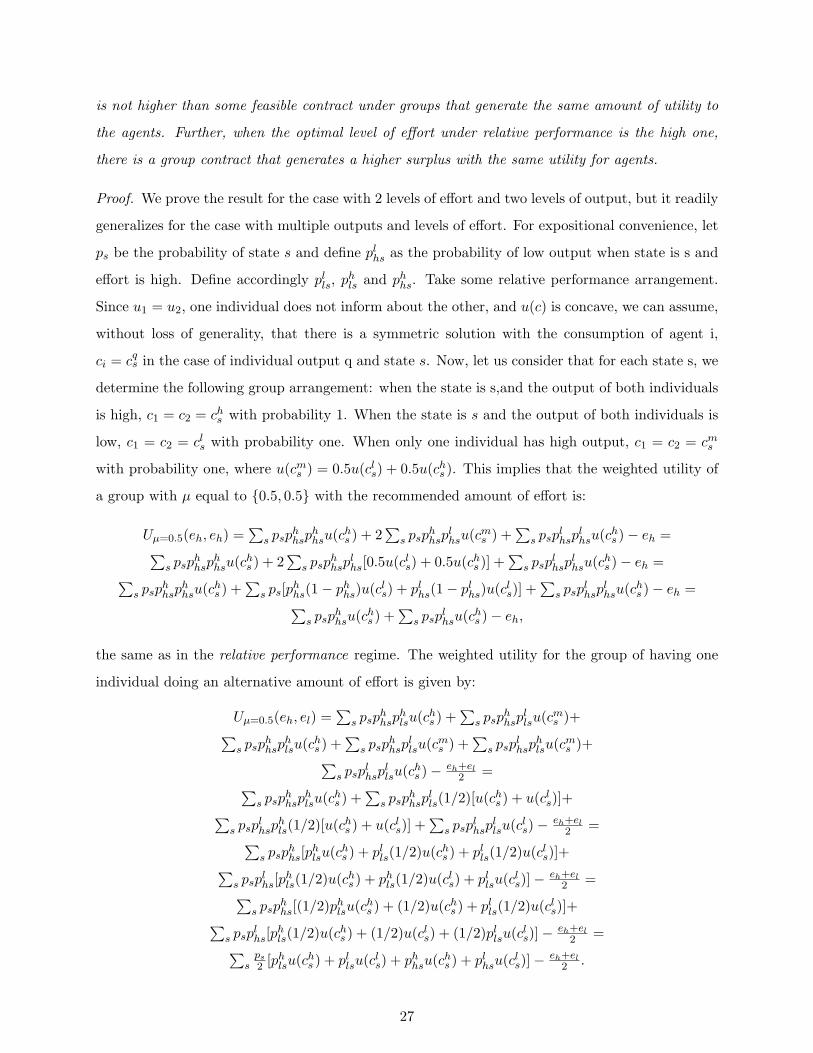
is not higher than some feasible contract under groups that generate the same amount of utility to
the agents. Further, when the optimal level of effort under relative performance is the high one,
there is a group contract that generates a higher surplus with the same utility for agents.
Proof. We prove the result for the case with 2 levels of effort and two levels of output, but it readily
generalizes for the case with multiple outputs and levels of effort. For expositional convenience, let
ps be the probability of state s and define plhs as the probability of low output when state is s and
effort is high. Define accordingly plls, phls and phhs. Take some relative performance arrangement.
Since u1 = u2, one individual does not inform about the other, and u(c) is concave, we can assume,
without loss of generality, that there is a symmetric solution with the consumption of agent i,
ci = cqs in the case of individual output q and state s. Now, let us consider that for each state s, we
determine the following group arrangement: when the state is s,and the output of both individuals
is high, c1 = c2 = chs with probability 1. When the state is s and the output of both individuals is
low, c1 = c2 = cls with probability one. When only one individual has high output, c1 = c2 = cms
with probability one, where u(cms ) = 0.5u(cls) + 0.5u(chs ). This implies that the weighted utility of
a group with µ equal to 0.5, 0.5 with the recommended amount of effort is:
Uµ=0.5(eh, eh) =∑
s psphhsp
hhsu(chs ) + 2
∑s psp
hhsp
lhsu(cms ) +
∑s psp
lhsp
lhsu(chs )− eh =∑
s psphhsp
hhsu(chs ) + 2
∑s psp
hhsp
lhs[0.5u(cls) + 0.5u(chs )] +
∑s psp
lhsp
lhsu(chs )− eh =∑
s psphhsp
hhsu(chs ) +
∑s ps[p
hhs(1− phhs)u(cls) + plhs(1− plhs)u(cls)] +
∑s psp
lhsp
lhsu(chs )− eh =∑
s psphhsu(chs ) +
∑s psp
lhsu(chs )− eh,
the same as in the relative performance regime. The weighted utility for the group of having one
individual doing an alternative amount of effort is given by:
Uµ=0.5(eh, el) =∑
s psphhsp
hlsu(chs ) +
∑s psp
hhsp
llsu(cms )+∑
s psphhsp
hlsu(chs ) +
∑s psp
hhsp
llsu(cms ) +
∑s psp
lhsp
hlsu(cms )+∑
s psplhsp
llsu(chs )− eh+el
2 =∑s psp
hhsp
hlsu(chs ) +
∑s psp
hhsp
lls(1/2)[u(chs ) + u(cls)]+∑
s psplhsp
hls(1/2)[u(chs ) + u(cls)] +
∑s psp
lhsp
llsu(cls)−
eh+el2 =∑
s psphhs[p
hlsu(chs ) + plls(1/2)u(chs ) + plls(1/2)u(cls)]+∑
s psplhs[p
hls(1/2)u(chs ) + phls(1/2)u(cls) + pllsu(cls)]−
eh+el2 =∑
s psphhs[(1/2)phlsu(chs ) + (1/2)u(chs ) + plls(1/2)u(cls)]+∑
s psplhs[p
hls(1/2)u(chs ) + (1/2)u(cls) + (1/2)pllsu(cls)]−
eh+el2 =∑
sps2 [phlsu(chs ) + pllsu(cls) + phhsu(chs ) + plhsu(cls)]−
eh+el2 .
27

The last equality comes from the fact that plhs + phhs = 1 . In the relative performance regime, the
gain from higher consumption given high effort perfectly compensates the higher disutility of high
effort, so: ∑s ps[p
hlsu(chs ) + pllsu(cls)] =
∑s ps[p
hhsu(chs ) + plhsu(cls)] + el − eh.
Substituting above, we have:
Uµ=0.5(eh, el) =∑
s ps[phhsu(chs ) + plhsu(cls) + el−eh
2 ]− eh+el2 =
∑s ps[p
hhsu(chs ) + plhsu(cls)]− eh,
which implies that the group has no gain in adopting low effort for one individual. Straightforward
analogous procedure reveals that the group also does not have any incentive to adopt low effort by
both individuals. Clearly, the participation, mother nature and compatibility with state distribution
constraints are valid. However, since u is strictly convex, cms < (chs + cls)/2, which implies that the
group regime produce the same utility pair with lower cost, and higher surplus. Q.E.D.
28
Top Related