0$12) !#$%&' (')*&+$' ,-##-#.$#' /.0' #$%+(.' (.' & · ISTAG - IST Advisory Group GSR - Galvanic...
78
Universidade do Minho Escola de Engenharia Dino Mickael Ribeiro da Costa Effects of music preference and selection on stress management Novembro de 2014
-
Upload
duongxuyen -
Category
Documents
-
view
219 -
download
3
Transcript of 0$12) !#$%&' (')*&+$' ,-##-#.$#' /.0' #$%+(.' (.' & · ISTAG - IST Advisory Group GSR - Galvanic...

Universidade do Minho
Escola de Engenharia
Dino Mickael Ribeiro da Costa
Effects of music preference and selection on stress management
Novembro de 2014

Universidade do Minho
Dissertação de Mestrado
Escola de Engenharia
Departamento de Informática
Dino Mickael Ribeiro da Costa
Effects of music preference and selection on stress management
Mestrado em Engenharia Informática
Trabalho realizado sob orientação de
Paulo Jorge Freitas de Oliveira Novais Davide Rua Carneiro
Novembro de 2014

Declaração
Nome: Dino Mickael Ribeiro da Costa
Endereço eletrónico: [email protected]
Cartão de Cidadão: 13639652
Título da Dissertação: Effects of music preference and selection on stress management
Orientador: Paulo Jorge Freitas de Oliveira NovaisCoorientador: Davide Rua Carneiro
Ano de conclusão: 2014
Designação do Mestrado: Mestrado Em Engenharia InformáticaÁrea de Especialização: Sistemas Inteligentes
É AUTORIZADA A REPRODUÇÃO INTEGRAL DESTA TESE/TRABALHO APENAS PARAEFEITOS DE INVESTIGAÇÃO, MEDIANTE DECLARAÇÃO ESCRITA DO INTERESSADO,QUE A TAL SE COMPROMETE;.
Universidade do Minho, / /
Assinatura:
AC K N OW L E D G E M E N T S
During my academic career until the completion of this project I had many great experiences andalso many difficulties and it was only possible due to the support of many people to whom I amgrateful.
First and foremost, I would like to express my gratitude to my supervisors, Paulo Novais andDavide Carneiro. Their expertise, understanding, and patience inspired me to work harder andbetter in this project and have set an example that I hope to match one day.
Furthermore, I am very grateful to the ISLab members, to my research grant colleague andto others colleagues who I have had the pleasure of meeting at Minho’s University, for the ex-changes of knowledge in so diverse areas, the skills and the encouragement they gave me duringthe deployment of this project, which in the overall helped enrich it.
I would also like to thank my longtime friends, who always accompanied me from high schooluntil now and made me laugh on my happiest moments and supported me on my saddest mo-ments. A big thank you for being part of my life and I hope to preserve them forever. Particularattention to Alexis Oliveira for his great friendship and I do appreciate him for always supportingme during this long journey and also for alerting me when it was necessary. Claudia Silva, FlaviaSantos and Laura Dias whom have always supported me and are always present, thank you.
I would also like to thank my friends of the graduation who still supporting me despite thedistance and the good jokes when it is necessary and exchanges of knowledge on diverse areasonly and also to the fantastic people I met this year who supported me in this last phase of myacademic journey, from the companionship in the library to the very pleasant evening and I wishto keep in my life.
Finally, I am very grateful to my parents Maria Jacinta da Costa and Agostinho da Costaand my brother Kevin, who have always supported me and Encouraged me in the advance ofthis project and they did everything for me to have a good education and civic training. I feelfortunate to belong to this great family, a very special thanks.
iii

This work was developed in the context of the project CAMCoF - Context-aware Mul-timodalCommunication Framework funded by ERDF - European Regional Development Fund throughthe COMPETE Programme (operational programme for competi-tiveness) and by National Fundsthrough the FCT - Fundação para a Ciência e a Tecnologia (Portuguese Foundation for Scienceand Technology) with in project FCOMP-01-0124-FEDER-028980.

A B S T R AC T
In this busy society of ours, people push their limits to work better and harder/longer in orderto remain competitive with their peers. The activities of the working population have increaseddaily which have, in turn, created more stressful situations and conditioned the welfare as wellas the physical and mental abilities of the person. Nonetheless, working longer hours does notnecessarily improve productivity nor performance. In order to prevent the negative consequencesof this increasing trend, the evolution of performance throughout the workday should be moreclosely monitored.It is acknowledged that, during the day, the user is subjected to various factorsthat can affect his performance, such as stress. Stress is an ever-present factor these days and canbe considered a major health problem. However, there also positives aspects, and this has madeit an increasingly interesting topic of study in the scientific community.
This work focuses on the interaction of stress with music, a broad phenomenon which ispresent in all societies. More specifically, we study the effects of music on human stress levelsand emotions while performing daily activities, through the analysis the performance, try to un-derstand how decreases along the day and how different types of music affect this phenomenon.The hypothesis presented here is analysed through a research study, which enables us to under-stand the effect of music on people and on their lives, more precisely in their performance atwork. The results show not only that the type of music matters, but also that it is important tonote the individual’s objective in each moment, as well as his personal preferences regardingmusic. With the results the aim is to create a music recommendation system based on the user’sstress level and the user’s performance, through the user’s interaction with the computer.
v

R E S U M O
Na sociedade atual as pessoas são cada mais vezes testadas até aos seus limites para poderemtrabalhar mais e melhor, a fim de manter a competitividade ao máximo nível. As atividades dodia a dia da população continuam aumentar, o que cria situações de mais stress condicionandoo bem-estar, bem como as capacidades físicas e mentais da pessoa. No entanto, trabalhar maishoras não significa necessariamente uma melhora da produtividade ou performance. A fim deevitar as consequências negativas desta tendência crescente, a evolução da performance ao longode um dia de trabalho deve ser acompanhado mais de perto. É importante perceber que durante odia as pessoas estão sujeitas a vários factores que podem afetar a sua performance, como o stress.O stress é um factor cada vez mais presente nos dias de hoje e pode ser considerado um problema.No entanto, há também aspectos positivos, tornando-se um tema cada vez mais interessante deestudo na comunidade científica.
Neste trabalho é realizado um estudo, que terá como objectivo perceber a interação do stresscom a música, um fenómeno presente em todas as sociedades. Especificamente, estudar osefeitos da música a nível de stress e emoções durante a execução das atividades diárias, atravésda análise da performance, no qual tentamos entender como está decresce ao longo do dia e comodiferentes tipos de musica afeta este fenómeno. Esta hipótese apresentada é analisada através doestudo da performance, no qual nos permite entender os efeitos da musica nas pessoas e nasuas vidas, mais precisamente das suas performance durante os seus trabalhos. Os resultadosdemonstra nos que não é so importante o tipo de musica, mas tambem é importante perceber oobjectivo do utilizador bem como as suas preferencias musicais. Com os resultados obtidos oprincipal objectivo é criar um sistema de recomendação de musica baseado nos níveis de stresse performance do utilizador, através da interação do utilizador com o computador.
vi

C O N T E N T S
Abstract . . . . . . . . . . . . . . . . . . . . . . . . . . . . . . . . . . . . . . . . vi
Resumo . . . . . . . . . . . . . . . . . . . . . . . . . . . . . . . . . . . . . . . . vii
Glossary . . . . . . . . . . . . . . . . . . . . . . . . . . . . . . . . . . . . . . . . 1
1 I N T RO D U C T I O N . . . . . . . . . . . . . . . . . . . . . . . . . . . . . . . . 11.1 Motivation . . . . . . . . . . . . . . . . . . . . . . . . . . . . . . . . . . 11.2 Scope of the Dissertation . . . . . . . . . . . . . . . . . . . . . . . . . . 21.3 ISLab Project . . . . . . . . . . . . . . . . . . . . . . . . . . . . . . . . 31.4 Objectives . . . . . . . . . . . . . . . . . . . . . . . . . . . . . . . . . . 41.5 Methodology of work / research . . . . . . . . . . . . . . . . . . . . . . 41.6 Structure of the document . . . . . . . . . . . . . . . . . . . . . . . . . . 5
2 A M B I E N T I N T E L L I G E N C E . . . . . . . . . . . . . . . . . . . . . . . . . . 72.1 What is Ambient Intelligence? . . . . . . . . . . . . . . . . . . . . . . . 72.2 Sensing . . . . . . . . . . . . . . . . . . . . . . . . . . . . . . . . . . . 92.3 Recommendation Systems . . . . . . . . . . . . . . . . . . . . . . . . . 12
3 S T R E S S A N D M U S I C . . . . . . . . . . . . . . . . . . . . . . . . . . . . . . 143.1 Definition of Stress . . . . . . . . . . . . . . . . . . . . . . . . . . . . . 143.2 Stressors . . . . . . . . . . . . . . . . . . . . . . . . . . . . . . . . . . . 163.3 What is Music? . . . . . . . . . . . . . . . . . . . . . . . . . . . . . . . 173.4 Performance vs Stress and Music . . . . . . . . . . . . . . . . . . . . . . 183.5 Related Projects . . . . . . . . . . . . . . . . . . . . . . . . . . . . . . . 203.6 Analysis of the related projects . . . . . . . . . . . . . . . . . . . . . . . 23
4 DATA C O L L E C T I O N . . . . . . . . . . . . . . . . . . . . . . . . . . . . . . 254.1 Motivation . . . . . . . . . . . . . . . . . . . . . . . . . . . . . . . . . . 264.2 Study Design . . . . . . . . . . . . . . . . . . . . . . . . . . . . . . . . 28
4.2.1 Interaction Patterns . . . . . . . . . . . . . . . . . . . . . . . . . 284.3 Long Duration Study . . . . . . . . . . . . . . . . . . . . . . . . . . . . 32
4.3.1 Goals and Objectives . . . . . . . . . . . . . . . . . . . . . . . . 324.3.2 Method . . . . . . . . . . . . . . . . . . . . . . . . . . . . . . . 324.3.3 Results . . . . . . . . . . . . . . . . . . . . . . . . . . . . . . . 35
vii

Contents
4.4 Conclusion and Critical Analysis . . . . . . . . . . . . . . . . . . . . . . 41
5 M O N I T O R A N D R E C O M M E N DAT I O N S Y S T E M . . . . . . . . . . . . . . . 435.1 Description . . . . . . . . . . . . . . . . . . . . . . . . . . . . . . . . . 445.2 Objectives . . . . . . . . . . . . . . . . . . . . . . . . . . . . . . . . . . 445.3 Architecture . . . . . . . . . . . . . . . . . . . . . . . . . . . . . . . . . 45
5.3.1 Communication . . . . . . . . . . . . . . . . . . . . . . . . . . . 475.4 Recommendation and Monitoring System . . . . . . . . . . . . . . . . . 49
5.4.1 Historic Performance . . . . . . . . . . . . . . . . . . . . . . . . 505.4.2 Real Time Performance . . . . . . . . . . . . . . . . . . . . . . . 515.4.3 Recommendation System . . . . . . . . . . . . . . . . . . . . . . 535.4.4 Web Interface . . . . . . . . . . . . . . . . . . . . . . . . . . . . 565.4.5 Conclusion . . . . . . . . . . . . . . . . . . . . . . . . . . . . . 57
6 C O N C L U S I O N S A N D F U T U R E W O R K . . . . . . . . . . . . . . . . . . . . 596.1 Synthesis of the work undertaken . . . . . . . . . . . . . . . . . . . . . . 606.2 Relevant Work . . . . . . . . . . . . . . . . . . . . . . . . . . . . . . . . 616.3 Future Work . . . . . . . . . . . . . . . . . . . . . . . . . . . . . . . . . 61
viii

L I S T O F F I G U R E S
Figure 1 SmartHome . . . . . . . . . . . . . . . . . . . . . . . . . . . . 8Figure 2 Sensor:Blood Volume Pulse (BVP) . . . . . . . . . . . . . . . . 10Figure 3 Sensor:Galvanic Skin Response (GSR) . . . . . . . . . . . . . . 11Figure 4 Sensor:Temperature . . . . . . . . . . . . . . . . . . . . . . . . 11Figure 5 Stress vs Performance. . . . . . . . . . . . . . . . . . . . . . . . 19Figure 6 Preliminary validation of the approach . . . . . . . . . . . . . . 27Figure 7 High-level view of the architecture . . . . . . . . . . . . . . . . 28Figure 8 Final questionnaire . . . . . . . . . . . . . . . . . . . . . . . . 33Figure 9 Results of how relaxing each Cluster . . . . . . . . . . . . . . . 35Figure 10 Results of Features with Improved Performance . . . . . . . . . 36Figure 11 Performances in each cluster . . . . . . . . . . . . . . . . . . . 37Figure 12 Relation Performance vs Metrics . . . . . . . . . . . . . . . . . 38Figure 13 Graph metric of clusters - Participant Davide. . . . . . . . . . . 39Figure 14 All performances . . . . . . . . . . . . . . . . . . . . . . . . . 40Figure 15 Answers from questionnaires . . . . . . . . . . . . . . . . . . . 40Figure 16 Stress vs Performance . . . . . . . . . . . . . . . . . . . . . . . 43Figure 17 Architecture . . . . . . . . . . . . . . . . . . . . . . . . . . . . 46Figure 18 Communication - Architecture . . . . . . . . . . . . . . . . . . 48Figure 19 Menu . . . . . . . . . . . . . . . . . . . . . . . . . . . . . . . . 49Figure 20 Historic Performance . . . . . . . . . . . . . . . . . . . . . . . 50Figure 21 Real Time . . . . . . . . . . . . . . . . . . . . . . . . . . . . . 52Figure 22 Survey . . . . . . . . . . . . . . . . . . . . . . . . . . . . . . . 54Figure 23 Recommendation System . . . . . . . . . . . . . . . . . . . . . 55Figure 24 Web Interface . . . . . . . . . . . . . . . . . . . . . . . . . . . 57
ix

L I S T O F E Q UAT I O N S
4.1 Velocity equation . . . . . . . . . . . . . . . . . . . . . . . . . . . . . . . . . . 294.2 Average distance of the mouse to the straight line equation . . . . . . . . . . . . 304.3 The Signed Sum of Angles equation . . . . . . . . . . . . . . . . . . . . . . . . 314.4 Absolute Sum of Angles equation . . . . . . . . . . . . . . . . . . . . . . . . . 31
x

AC RO N Y M S
Aml - Ambient Inteligent
bmp - heart beats per minute
BVP - Blood Volume Pulse
CAMCoF - Context-aware Multimodal Communication Framework
EEG - electroencephalogram
ISLab - Intelligent Systems Laboratory
ISTAG - IST Advisory Group
GSR - Galvanic Skin Response
MIREX - Music Information Retrieval Evaluation eXchange
ISMIR - Music Information Retrieval
SSL - Secure Socket Layers
VE - Virtual Environment
UM - University of Minho
Aml - Ambient Inteligent
xi
1
I N T RO D U C T I O N
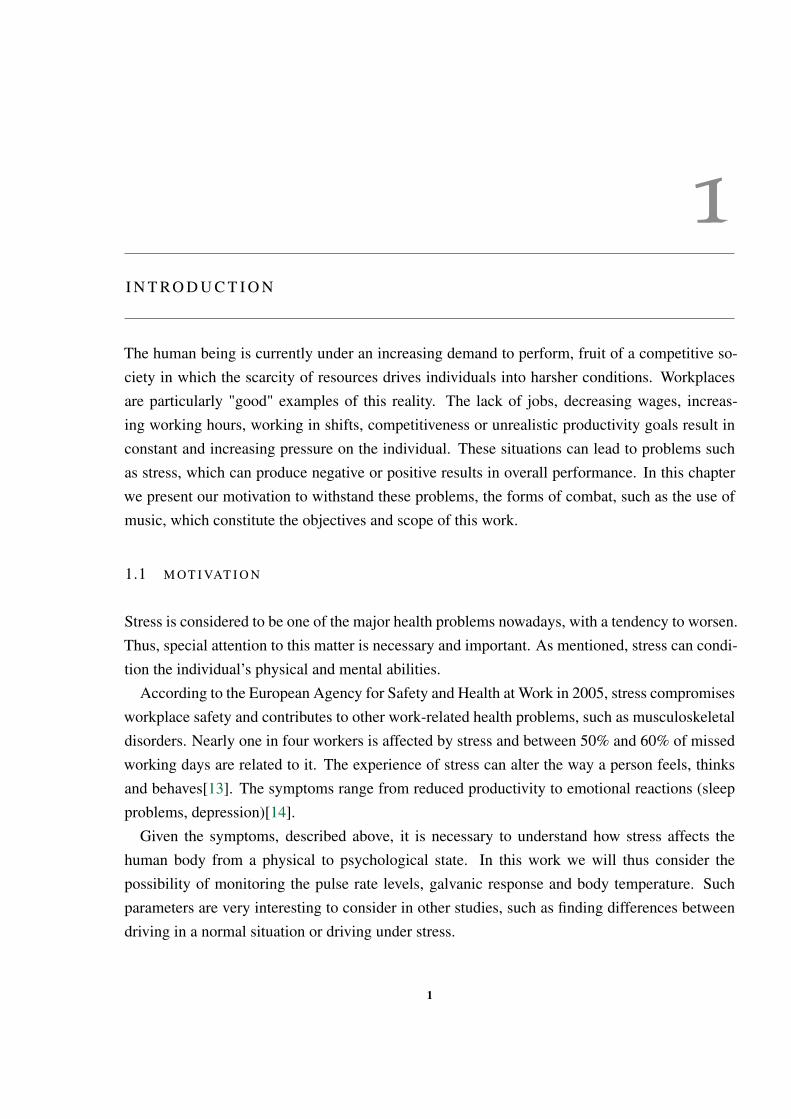
The human being is currently under an increasing demand to perform, fruit of a competitive so-ciety in which the scarcity of resources drives individuals into harsher conditions. Workplacesare particularly "good" examples of this reality. The lack of jobs, decreasing wages, increas-ing working hours, working in shifts, competitiveness or unrealistic productivity goals result inconstant and increasing pressure on the individual. These situations can lead to problems suchas stress, which can produce negative or positive results in overall performance. In this chapterwe present our motivation to withstand these problems, the forms of combat, such as the use ofmusic, which constitute the objectives and scope of this work.
1.1 M OT I VAT I O N
Stress is considered to be one of the major health problems nowadays, with a tendency to worsen.Thus, special attention to this matter is necessary and important. As mentioned, stress can condi-tion the individual’s physical and mental abilities.
According to the European Agency for Safety and Health at Work in 2005, stress compromisesworkplace safety and contributes to other work-related health problems, such as musculoskeletaldisorders. Nearly one in four workers is affected by stress and between 50% and 60% of missedworking days are related to it. The experience of stress can alter the way a person feels, thinksand behaves[13]. The symptoms range from reduced productivity to emotional reactions (sleepproblems, depression)[14].
Given the symptoms, described above, it is necessary to understand how stress affects thehuman body from a physical to psychological state. In this work we will thus consider thepossibility of monitoring the pulse rate levels, galvanic response and body temperature. Suchparameters are very interesting to consider in other studies, such as finding differences betweendriving in a normal situation or driving under stress.
1
1.2. Scope of the Dissertation
Over the years, many scientists have studied ways to combat and influence stress, for examplethe effects of color or music on people. In this work, one decided to study the influence of music.Why did we decide to study music? Because music is present everywhere, everybody likesmusic and music has a form of expression that cannot be put into words. Over the years musichas always been connected to us, in many areas ranging from entertainment to war or religion,serving a myriad of purposes both socially and individually. Given the major importance ofmusic in all human societies throughout history, and particularly in digital society, music plays arelevant role in world economy[25].
Why do people like music and why does it play with our emotions? Because when people hearmusic, the brain tries to predict what sound they will hear next. Usually these predictions are metas the “thing” we call music and it has to have some kind of structure or sound pattern. However,sometimes those predictions are violated and we hear something unexpected. These surpriseskeep our mind interested in the given music[23]. Music distracts people from pain and fatigue,elevates mood, increases endurance, reduces perceived effort and may even promote metabolicefficiency. With so much of our work now being done on computers, music has become animportant way to “optimize the boring”. Music has increasingly become apart of the modern-day work session[31].
Furthermore, in the perspective of user performance during daily tasks (e.g. work), which willbe evaluated in this work, stress and music can affect performance positively or negatively. Inaddition, if the user is affected by stress, or some other factor, music could be a way of being ableto calm down, as will be demonstrated in this dissertation. Does music actually make you moreproductive? More focused? More creative? Or is it a form of distraction (loose focus)?. Thesemany questions are raised and will be analyzed in our study, regarding the user’s performance.With the increasing importance of music in our society, and considering a wide range of musicalstyles and user preferences, one will study how music influences the user’s stress level whilehe/she performs daily tasks and activities.
1.2 S C O P E O F T H E D I S S E RTAT I O N
Following the facts described in the previous sub-section, and in order to answer the question thatwas raised “How does music influence the level of stress on the user while performing daily tasksand activities ?”, the main aim and motivation of the study is to create a music recommendationsystem. The system will monitor the user’s stress level and performance in real time, combined
2

1.3. ISLab Project
with with the possibility to change the style of the music being played in order to control his/herstress level or to help control performance.
A possible application scenario is the system recognizing that the user is experiencing a highstress level and recommending a pause in the activity being performed, changing the music styleto one that generally calms the user down. This kind of tool can contribute to a better quality oflife, guiding and helping the user to remain calm, make better decisions and perform better indaily activities such as work tasks.
1.3 I S L A B P RO J E C T
The work presented in this document is integrated in the project CAMCoF - Context-aware Mul-timodal Communication Framework, being developed at the Intelligent Systems Laboratory (IS-Lab) at the University of Minho (UM)[7].
The main objective of this project is to develop a framework to model the users’ context,focusing on stress, and to provide this information for a Virtual Environment (VE) so that richercommunication processes can be developed. These communication processes will allow usersto communicate in ways that are closer to face-to-face communication. The framework will benon-intrusive in order to facilitate more accurate and frequent monitoring. Thus, the estimationof stress will be based on the transparent analysis of the users’ behavior and interaction patterns.
The proposal of this project is supported by previous work, in which a group of ISLab memberssuccessfully measured changes in a non-intrusive way using motion detection and smartphonesequipped with basic sensors. From this hardware, they were able to extract features such astouch patterns, touch duration, touch intensity, and touch accuracy, acceleration on the handhelddevice, the amount of movement and a measure of cognitive performance. During preliminarytests, nearly 20 volunteers (students and teachers from the university) were requested to play agame that required them to perform mental calculations in a calm and then in a stressed state. Onaverage, each participant showed significant differences in half of the parameters studied whencomparing calm and stressed measurements.
Sustained by the preliminary results, the group now aims to acquire more appropriate and pre-cise sensors that will allow them to develop a more accurate framework for modeling stress. Thisapproach will provide meaningful context of information to the users of a VE in the form of sim-ple emotional avatars that can complement what is being said by using non-verbal information.It will result in more efficient communication processes, which will more accurately resemblethe context of the richness of face-to-face communication.
3
1.4. Objectives
1.4 O B J E C T I V E S
The main goal of this study is to create a music recommendation system based on the user’sstress level and performance level acquired, through data collected by the keyboard and mouse,and aimed at managing the user’s stress. In the pursuit for a better system, this system will informthe user of the dangers of being under stress for prolonged periods, and how it may lead to badchoices in very different situations (e.g. driving, taking binding decision in interpersonal relation-ships). This system will allow the user to analyze his/her potentially unhealthy behaviours thusenabling a possible personal reflection. Through that change in behaviours, the aim of improvinglife quality is achieved. Another objective of the system is to learn the user’s personal musicalpreferences in order to improve the efficiency of the recommendation mechanism.The objectives for the dissertation are:
• The analysis of the state of the art concerning the following sensors: Heart Beat, SkinResponse and Body Temperature. Specifically, one will study (in a preliminary validationof the approach) the standard values of these sensors in the human body when the userlistens to randomly selected music and songs and try to understand if this affects the user(when calm or under stress);
• The definition of a dynamic system to classify a user’s level of stress and performancethrough the sensors mentioned, keyboard and mouse;
• The presentation of a questionnaire to the participants of the study in order to understandtheir musical preferences and how they perceive the effects of music in their daily lives;
• The development of a study to understand the effects of different types of music on the userin the workplace, while performing regular tasks, or in a similar simulated environment(this study will be conducted in the Intelligent Systems Lab);
• The use of machine learning tools for the data collected in the study described above inorder to build a personalized model for each user;
• The development of develop a recommendation system based on this model;
1.5 M E T H O D O L O G Y O F W O R K / R E S E A R C H
To accomplish the previously mentioned objectives, an Action - Research methodology will befollowed. This methodology starts by identifying the problem so that a hypothesis can be formu-
4

1.6. Structure of the document
lated, and on which the development will be based. Subsequently, the information is recompiled,organized and analysed, continuously building a proposal for solving the identified problem. Fi-nally, one can reach conclusions based on the results obtained during the investigation. For thisresearch model to be followed, six complementary stages were defined to achieve the plannedobjectives. The stages defined are described ahead:
• The specification of the problem and its characteristics;
• A constant and incremental update and review of the state of the art;
• The idealization, and gradual and interactive development of the proposed model;
• The experimentation and implementation of the solution for the development of a proto-type;
• A result analysis and the formulation of conclusions;
• A constant diffusion of the knowledge and results obtained, as well as of the experiments,to the scientific community;
1.6 S T RU C T U R E O F T H E D O C U M E N T
This document begins with the introductory chapter (Chapter 1). In this chapter the motivation,scope and objectives of the project are presented. The he research methodology followed duringthe progress of this project is also shown.
Chapter 2 will introduce the concept of Ambient Intelligence. It starts with a brief descriptionof the concept. Next, it presents some other concepts such as that of the recommendation systemand a brief explanation of intelligent components and sensor environments.
Chapter 3 presents a detailed description of stress, which starts by emphasising historical de-scriptions of stress. Later, some aspects of stress, such as stress types or the influence of externalfactors, are presented. Afterwards, there is a brief explanation of music and the relationship be-tween performance, stress and music, as well as the effects of these on the user’s performance.Finally , this section presents and analyses some related projects.
Chapter 4 describes the process of data collection. This chapter begins with an explanation ofthe preliminary validation of the approach (motivation). This comprises a test, by using sensors,to prove that music affects people in different ways. Afterwards, the study in this dissertation isdescribed, from the methodology and collection of information to the presentation of results.
5

1.6. Structure of the document
In Chapter 5, the Recommendation and Monitoring System developed is presented. Initially,the objectives, architecture and the communication used is presented for development. It alsopresents the implementation decisions, as well as the final system developed.
Finally, in Chapter 6, some conclusions about the project are presented. It also presents therelevant work developed during the undertaking of this project, some work that will be carriedout in the future and a brief description of the project.
6

2
A M B I E N T I N T E L L I G E N C E
This section presents the definition of Ambient Intelligence (Aml), it details the main componentsbehind in Aml,which is the main concept on which this work is grounded, so that it is importantto explain and understand it.
2.1 W H AT I S A M B I E N T I N T E L L I G E N C E ?
Ambient Intelligence (Aml) refers to a seamless and invisible computing environment that is“aware” of our presence and context, and which is sensitive, adaptive and responsive to our needs[21]. The concept was introduced by the IST Advisory Group (ISTAG),and is defined by a newparadigm, this emerged as a result of three new key technologies: Ubiquitous Computing [41],Ubiquitous Communication [28] and Intelligent User Interfaces [29], this is starting to changethe way we see computers.
Aml is comparable to a large computer with other tools, where these tools communicateamongst themselves, with the ability to automatically adapt to the users’ daily tasks and ac-tivities. In intelligent environments, computers are tools that learn what we like, what we do,our habits and our preferences, so they can simplify our lives. Moreover, they are shrinking insize and have now been hidden in common devices so that we do not notice them at all. Amlenvironments can be found in diverse places, such as homes, offices, meeting rooms, schools,hospitals, control centres, transports, tourist attractions, stores, sports facilities, music devices orothers. In these environments one finds devices, which are currently commonplace items: mobilephones, air conditioning systems, laptops, media servers, PDAs or others. Similar, these devicesare connected through a control network so that they can be controlled or control other devicesfrom any point of the network.
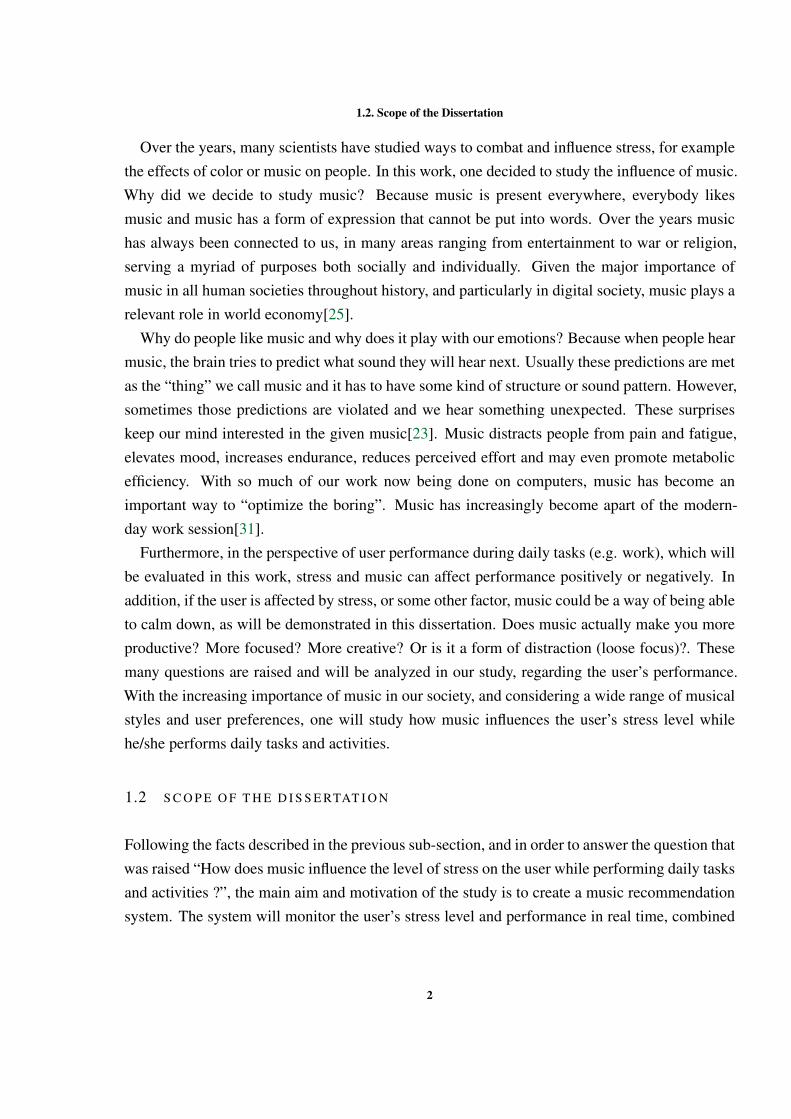
In Aml it is important to mention that components are as hidden as possible (Figure 1). Theideal intelligent environment should appear to be a perfectly normal environment, embedding its
7
2.1. What is Ambient Intelligence?
Figure 1: Example of Ambient Intelligence - SmartHome[33].
components in common devices, noticeable only through its actions. In Aml, each componenthas its functions and, together, their job is to ensure people’s well-being and safety. For thisthis to be done (efficiently?), the users’ preferences must be known, which constitutes one ofthe important characteristics of Aml. It learns preferences by interacting with the user: it studiesone’s behaviours, learns what one usually does and when one usually does something. Therefore,if the system learns the user’s habits, that’s mean that environment will be unique, depending onthe people who interact with the system. We can thus say that another important characteristicof Aml is that it is personalized [6].
Nowadays, technological devices have more capabilities, especially those which are mobile.Theses devices can obtain data from the environment such as location, temperature, user move-ments and user habits. These devices include the already commonplace smartphones, as well asmore innovative alternatives such as Google Glass. These allow for the implementation of Amlsystems which have the capacity to adapt to the user’s preferences and are thus personalized andsensitive .
8

2.2. Sensing
2.2 S E N S I N G
In the previous section Ambient Intelligence was described as a system that learns our behaviors,adapts to us, hides in common devices, is aware of our context and is able to predict our actions.It is important now to describe the components that make it possible for Aml to perform correctly.
Aml really depends on the sensors, for correctly reading as much data about the environ-ment or users as possible, as this data is the basic information for any decision from the system.Nowadays, these sensors are more hidden as possible, from common flood detectors, alarms,gas detectors as sensors luminosity to temperature and humidity, making it possible to read theenvironmental parameters. With this the environment can be monitored in order to maintain thepreferences, the needs or the safety of the person. The knowledge about environment and user isvery important for the performance of the service provided.
In smart environments, the perfect scenario is one where all components are as invisible aspossible, where the user does not perceive anything about the data collection regarding the envi-ronment and himself. These sensors collect data in a non-intrusive way. In this work, informationwas collected concerning users during activities: the user’s performance in terms of features ex-tracted from the use of the keyboard and the mouse, whether the user was or was not under stressor listening to some music. This information will be described in the study relating to Musicinteraction for this work.
When information about the user or his environments is necessary and there are no non-intrusive sensors, which collect necessary information such as the number of times the user’sheart beats per minute (bpm), intrusive sensors must be used. For this work and for the scope ofwork in ISLab described above, one needs to use these types of sensors to monitor the user’s vitalsigns during the study (preliminary validation of the approach) One can thus better understandhow music influences the user’s performance during activities. Over the course of the exercise,the participant is connected to the biofeedback unit. This consists of :
• A blood Volume Pulse (BVP) – The blood volume pulse refers to the amount of bloodcontained in an area. By indexing rapid changes in blood flow, the BVP meter indicatesone’s level of psychophysiological relaxation or arousal. These sensors provide informa-tion in different forms. For this work, one has highlighted the Heart Rate, the numbersof times the heart beats per minute. This value is 75 beats/min for a resting young, adultmale. Resting rates slower than 60 beats/minute (bradycardia) and faster than 100 beat-s/min (tachycardia) may indicate cardiovascular disorder. Another element of information
9

2.2. Sensing
is the Stress Index where, if the values are between 1 and 3, the user is unstressed and, ifthey range between 4 and 6, the user is very stressed[40].
More light/higher BVP signal = blood volume is increasing and so is relaxation.Less light/lower BVP signal = blood volume is decreasing;
Relaxation is decreasing and arousal is increasing [40].
Figure 2: Sensor for measuring the heartbeat - Blood Volume Pulse (BVP)[40].
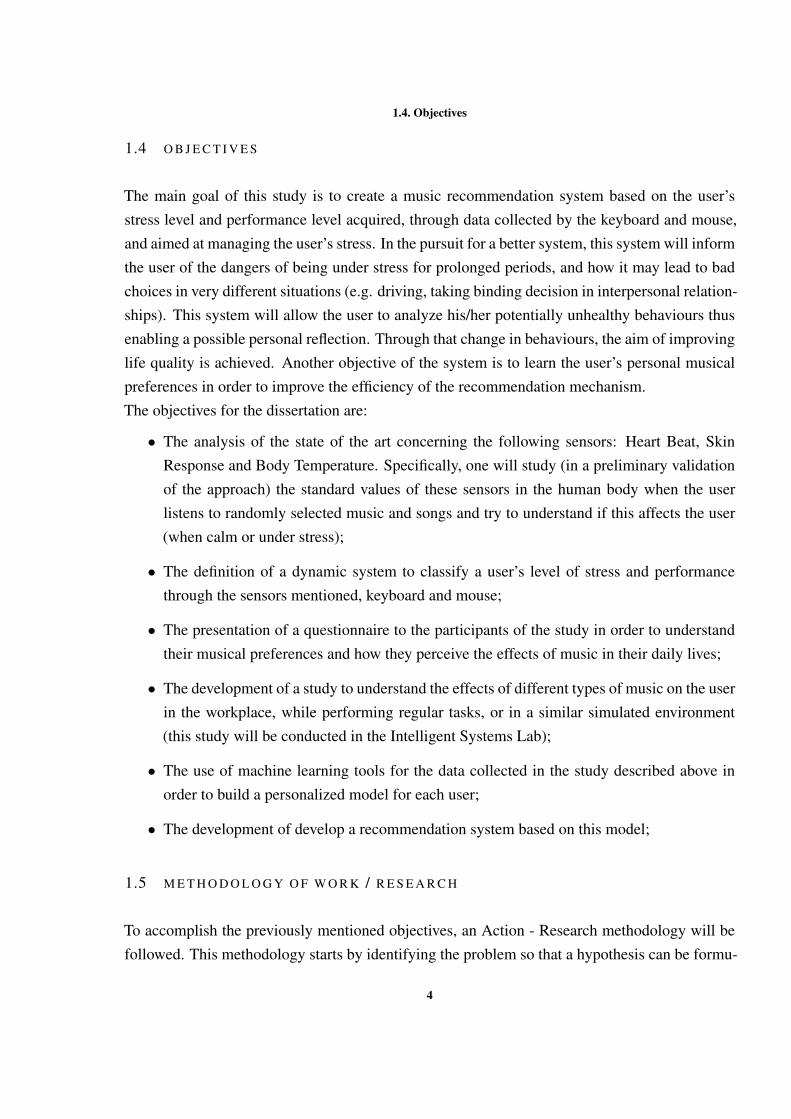
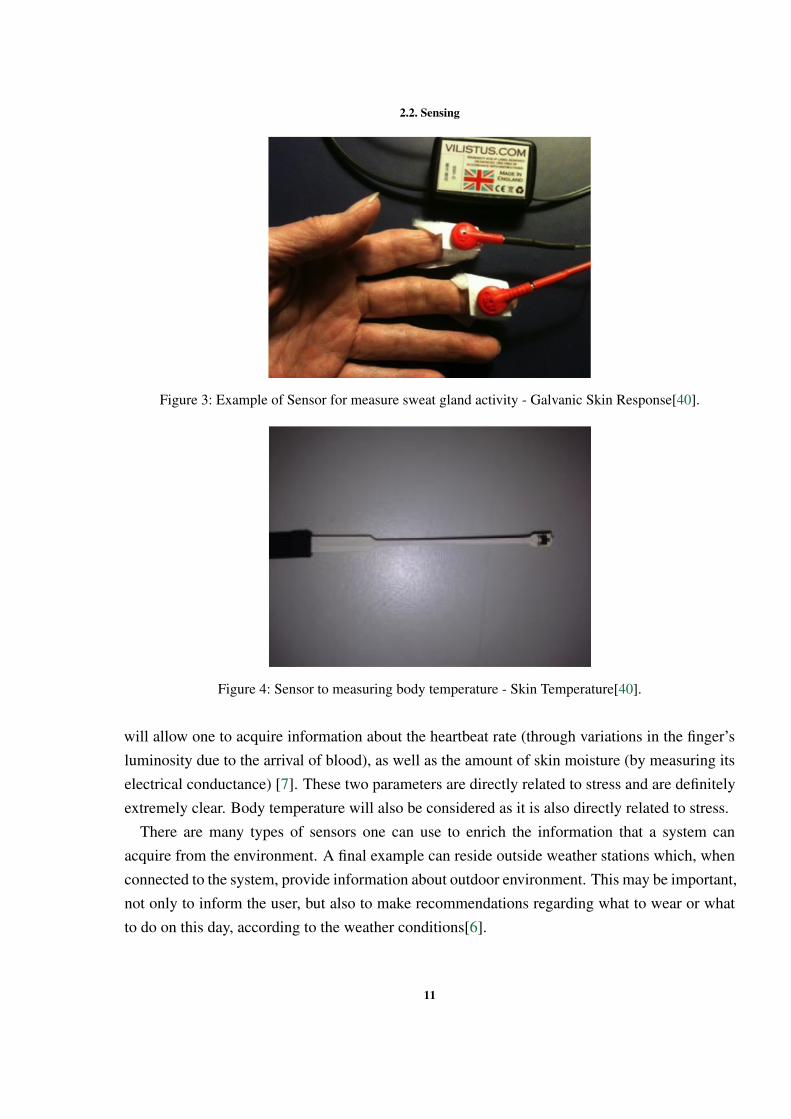
• The Galvanic Skin Response (GSR) - Taped to the index and middle fingers,these elec-trodes produce a tiny current across the skin to measure sweat gland activity and, thus,psychophysical relaxation and arousal[40].
High sweat gland activity and high electrical skin conductance = psychophysical arousal,tension, and stress OR possible arousal of the autonomic nervous system by gamma
brainwaves
Low sweat gland activity = low arousal/relaxation [40]
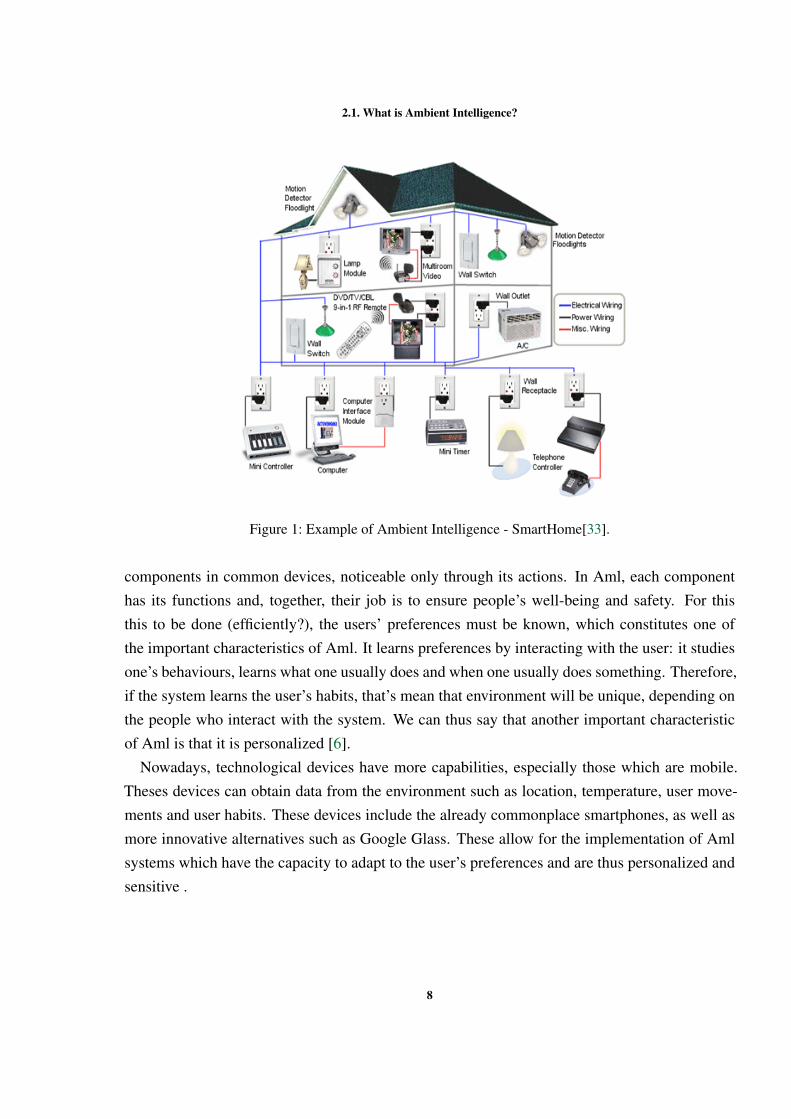
• Skin Temperature - is often measured at the fingertips and is a lagging indicator of arousalor relaxation in that it changes less quickly than other physiological measures. This sen-sor transmits the temperature of the user’s body and it is interesting to see and analyzetemperature when the user is under stress and not stressed[40].
This work will attempt to measure stress, through sensors that allow us to observe importantvalues in the human body during an activity. These sensors will activate when touched and
10
2.2. Sensing
Figure 3: Example of Sensor for measure sweat gland activity - Galvanic Skin Response[40].
Figure 4: Sensor to measuring body temperature - Skin Temperature[40].
will allow one to acquire information about the heartbeat rate (through variations in the finger’sluminosity due to the arrival of blood), as well as the amount of skin moisture (by measuring itselectrical conductance) [7]. These two parameters are directly related to stress and are definitelyextremely clear. Body temperature will also be considered as it is also directly related to stress.
There are many types of sensors one can use to enrich the information that a system canacquire from the environment. A final example can reside outside weather stations which, whenconnected to the system, provide information about outdoor environment. This may be important,not only to inform the user, but also to make recommendations regarding what to wear or whatto do on this day, according to the weather conditions[6].
11
2.3. Recommendation Systems
2.3 R E C O M M E N DAT I O N S Y S T E M S
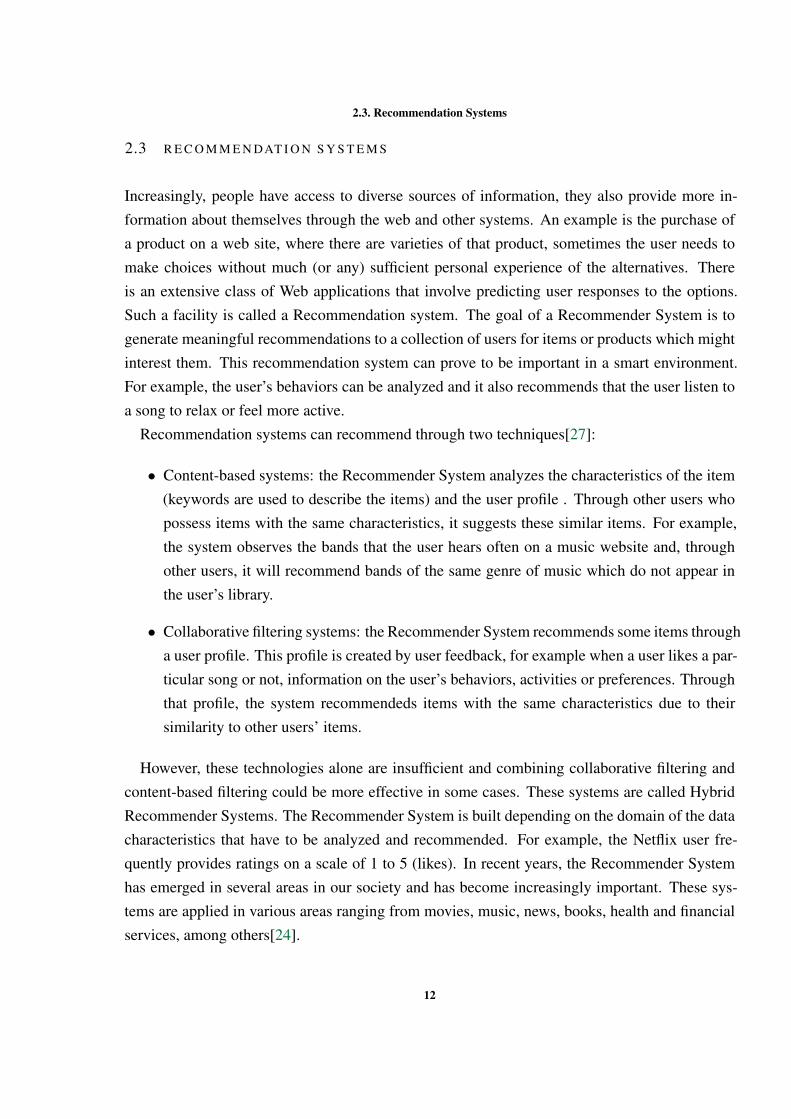
Increasingly, people have access to diverse sources of information, they also provide more in-formation about themselves through the web and other systems. An example is the purchase ofa product on a web site, where there are varieties of that product, sometimes the user needs tomake choices without much (or any) sufficient personal experience of the alternatives. Thereis an extensive class of Web applications that involve predicting user responses to the options.Such a facility is called a Recommendation system. The goal of a Recommender System is togenerate meaningful recommendations to a collection of users for items or products which mightinterest them. This recommendation system can prove to be important in a smart environment.For example, the user’s behaviors can be analyzed and it also recommends that the user listen toa song to relax or feel more active.
Recommendation systems can recommend through two techniques[27]:
• Content-based systems: the Recommender System analyzes the characteristics of the item(keywords are used to describe the items) and the user profile . Through other users whopossess items with the same characteristics, it suggests these similar items. For example,the system observes the bands that the user hears often on a music website and, throughother users, it will recommend bands of the same genre of music which do not appear inthe user’s library.
• Collaborative filtering systems: the Recommender System recommends some items througha user profile. This profile is created by user feedback, for example when a user likes a par-ticular song or not, information on the user’s behaviors, activities or preferences. Throughthat profile, the system recommendeds items with the same characteristics due to theirsimilarity to other users’ items.
However, these technologies alone are insufficient and combining collaborative filtering andcontent-based filtering could be more effective in some cases. These systems are called HybridRecommender Systems. The Recommender System is built depending on the domain of the datacharacteristics that have to be analyzed and recommended. For example, the Netflix user fre-quently provides ratings on a scale of 1 to 5 (likes). In recent years, the Recommender Systemhas emerged in several areas in our society and has become increasingly important. These sys-tems are applied in various areas ranging from movies, music, news, books, health and financialservices, among others[24].
12

2.3. Recommendation Systems
In our work, the recommendation system developed will be based on the Collaborative filteringtechnique since, during the learning period of the system, all users will answer short question-naires. These will indicate, for example, if you like the songs/music on/for that day, which willhelp the system to recommend other songs/styles of music. These recommendations may also beevaluated by the user.
13
3
S T R E S S A N D M U S I C
After introducing the concept of Ambient Intelligence as seamless and invisible computing envi-ronments, the tools used to measure and evaluate the user (sensors) and the systems that analyzethe data collected and subsequently advise/recommend these to the user (Recommendation Sys-tem), we must more thoroughly understand which environmental factors can affect the user, forexample stress.
This section describes Stress and Music, due to the fact that they constitute central topics forthis work. Furthermore, one must understand the relation between them, as well as prior workundertaken in this area. Since we are analyzing the the user’s performance at work on a dailybasis, it is also important to understand how stress affects the day-to-day work level. We will tryto understand the effects of music on stress levels, with a subsequent evaluation of performance.
3.1 D E F I N I T I O N O F S T R E S S
"Everyone knows what stress is, but nobody really knows"Hans Selye
The definition of stress is still not consensual in the scientific community, remaining as anopen topic of discussion. In fact, stress involves a multiplicity of factors, many of them sub-jective, leading to multiple interpretations that make it difficult to be objectively defined. Thus,some researchers argue that such a concept is elusive because it is poorly defined (Cox, 1985)[8]while others prefer not to provide an actual definition of the concept until a more accurate andconsensual view of the phenomenon is reached.
One of the first definitions of stress was proposed by Selye[32]. According to this author, stresscan be seen as a non-specific response of the body to external demands. These demands (the loador stimulus that triggered a response) are denominated stressors while the internal body changes
14

3.1. Definition of Stress
that they produce constitute the actual stress response. Selye was also the first to document thechemical and hormonal changes which occur in the body due to stress[7].
Stress constitutes a response to various situations and this response can be emotional,physiologicalor both for example, increased blood pressure, and increased stomach acid. Stress can also affectthe mind, with occasional nightmares, negativity and impaired judgment. Behaviours, such asmore drinking and smoking are affected too, which is also the case for emotions like the lossof confidence and, ultimately, depression. However, stress can produce positive effects: for ex-ample, when a person is in danger, stress can prepare us to take defensive action, it also fuelscreativity and motivates us to achieve.
From a point of view of high levels of stress, two types can be identified: acute and chronicstress. Acute stress results from recent demands, as well as from the anticipation of demands inthe near future. Acute stress is thrilling and exciting in small doses, but too much is exhausting.A fast run down a challenging ski slope, for example, is exhilarating early in the day. That sameski run late in the day is taxing and wearing. Acute stress symptoms are perceived by mostpeople. It constitutes a laundry list of what has gone awry in their lives: the auto accident thatcrumpled the car fender, the loss of an important contract, a deadline they are rushing to meet,their child’s occasional problems at school and so on. Most common symptoms are Emotionaldistress, Muscular problems, etc[4].
On the other hand, there is long-term chronic stress. This type of stress results, for example,from social and health conditions, dysfunctional families, among many other issues [7]. This isthe grinding stress that wears people away day after day, year after year. Chronic stress destroysbodies, minds and lives. It wreaks havoc through long-term attrition. It is the stress generatedby poverty, dysfunctional families, being trapped in an unhappy marriage or in a despised job orcareer. Chronic stress occurs when a person never sees a way out of a miserable situation [4] .This type of stress appears for an undetermined time, and when people reach their limit and thengo over the edge, the consequences/solutions are suicide, violence, heart attacks, strokes, andperhaps cancer.
Reducing your stress levels can not only make you feel better immediately, but will also pro-tect your health long-term. Various exit strategies for reducing stress can be used, such as tryingto identify the root of stress and attempting to register the causes, thoughts and moods. If oneis able to understand these, then a plan to address these issues can be established. One shouldalso set reasonable expectations for oneself and draw up a list of all one’s commitments, assess-ing priorities and then eliminating any tasks that are not absolutely essential. Another possible
15
3.2. Stressors
solution is to get help, if you continue to feel overwhelmed, consulting a psychologist or anotherlicensed mental health professional can help you to learn how to manage stress effectively[3].
3.2 S T R E S S O R S
After describing “what stress is”, it is important to understand which factors cause stress. Thesecauses are called stressors.
”A stressor is a chemical or biological event, environmental condition, externalstimulus and event that causes stress to an organism.“[2]
As the previous sentences states, stressors create physical, chemical and mental responseswithin the body. The internal body changes that they produce constitute the actual stress response.Stressors may be different from person to person. The effects on users can be both physiologicaland physical. These stressors are present everywhere, it is not easy to work with them sinceeach person will react differently to various situations. One can observe these stressors fromone’s point of view and classify them as being positive or negative stressors. Positive stressorsare characterized as those which motivate, excite, or improve people’s performance. A list ofpossible stressors are: starting a new job, marriage, taking a vacation, retiring, learning a newhobby or the birth of a child. On the other hand, the so-called negative stressors cause anxiety, areassociated with unpleasant feelings and can lead to mental and physical problems. Examples ofnegative stressors include the death of a relative, unemployment, sleep problems, legal problems,financial problems [17].
Another way to classify stressors is through events or experiences, such as environmentalstressors, crises/catastrophes, major life events, daily troubles/microstressors. Examples of en-vironmental stressors include loud sound levels and over-illumination. Workplace stressors arealso common and include deadlines, work competition, schedules or the lack of security. A goodexample of how stressors affect us daily is provided by the observation of our daily activities,such as when people are late for work and on the way to work, they get caught in traffic, thusfeeling stress and this is aggravated by the possible negative consequences of arriving late atwork. There are, of course, a number of other sources of stress in our lives, but these and theireffects will always be different from person to person[17].
16

3.3. What is Music?
3.3 W H AT I S M U S I C ?
Music constitutes a predominant worldwide art. From the times of Indian tribes to the rise ofmodern societies, music has had a particularly strong artistic presence in our culture. Severalbiochemical processes are involved in the process of attributing a feeling or an emotion to eachsingle chord.
Music is used in many activities in our society, from a simple sportsman training for a compe-tition to a doctor performing surgery [36]. It is used in various medical areas to control emotionsand reduce anxiety and stress (see Standley, 1986)[36]. Miluk-Kolasa, Matejek and Stupnicki(1996)[36]. Miluk-Kolasa, Matejek and Stupnicki (1996) [36] examined the reduction of pre-surgical anxiety using an individually designed music program (IDMP) [19]. Since patients whoheard music showed lower systolic blood pressure, heart rate, cardiac volume, blood glucoseand high skin temperature, it was concluded that music had the effect of reducing pre-surgicalanxiety [19]. This supports the main idea and motivation of this (Silva) work [36], using musicto influence the level of stress level of the human body.
Among many other areas, music is used in many of modern-day workplaces (e.g. shoppingmalls, individual stores, surgery rooms, collective transportation). Even if music is not playingopenly through installed sound systems, workers are often allowed to work while listening totheir personal music by using headphones, which happens frequently in software developmentcompanies.
Especially in commercial environments, such as shopping stores or malls, the strategies forselecting music are often driven by the objective of activating people, inducing heightened shop-ping behavior. Moreover, [Yalch 1990][42] concludes that specific types of music should be usedin particular areas of the store so as to appeal to different types of consumers.
In a 2012 study by C. J. Bacon of Sheffield Hallam University, Karageorghis and their col-leagues, participants who cycled in time to music required 7 percent less oxygen to do the samework as cyclists who did not synchronize their movements with background music[35].
The human body is constantly monitoring itself. After a certain period of exercise and the exactduration varies from person to person—physical fatigue begins to set in. The body recognizessigns of extreme exertion, rising levels of lactate in the muscles, a thrumming heart, increasedsweat production and decides it needs a break. Music competes with this physiological feedbackfor the brain’s conscious attention [31].
Music has many positive aspects, which have already been described above, but one mightalso acknowledge the negative side of music. Many people prefer to work in their jobs without
17
3.4. Performance vs Stress and Music
music, or with the normal noise produced by the environment. Researchers have shown that amoderate noise level can really get creative juices flowing, yet, too much noise has the oppositeeffect[38]. Certain types of music can totally destroy some people’s focus on work.
3.4 P E R F O R M A N C E V S S T R E S S A N D M U S I C
Numerous studies have highlighted the negative effects of this lifestyle. [37] shows positive meancorrelations between overall health symptoms, physiological and psychological health symptoms,and hours of work. [10] analyzes the impact of overtime and long work hours on occupationalinjuries and illnesses, thus concluding that these variables depend more on the amount of timeworked rather than on the risk level of the job. In [16],the effects of shift work and extendedwork hours are analysed at different levels, including family and social life, performance, fatigue,productivity and health, among others.
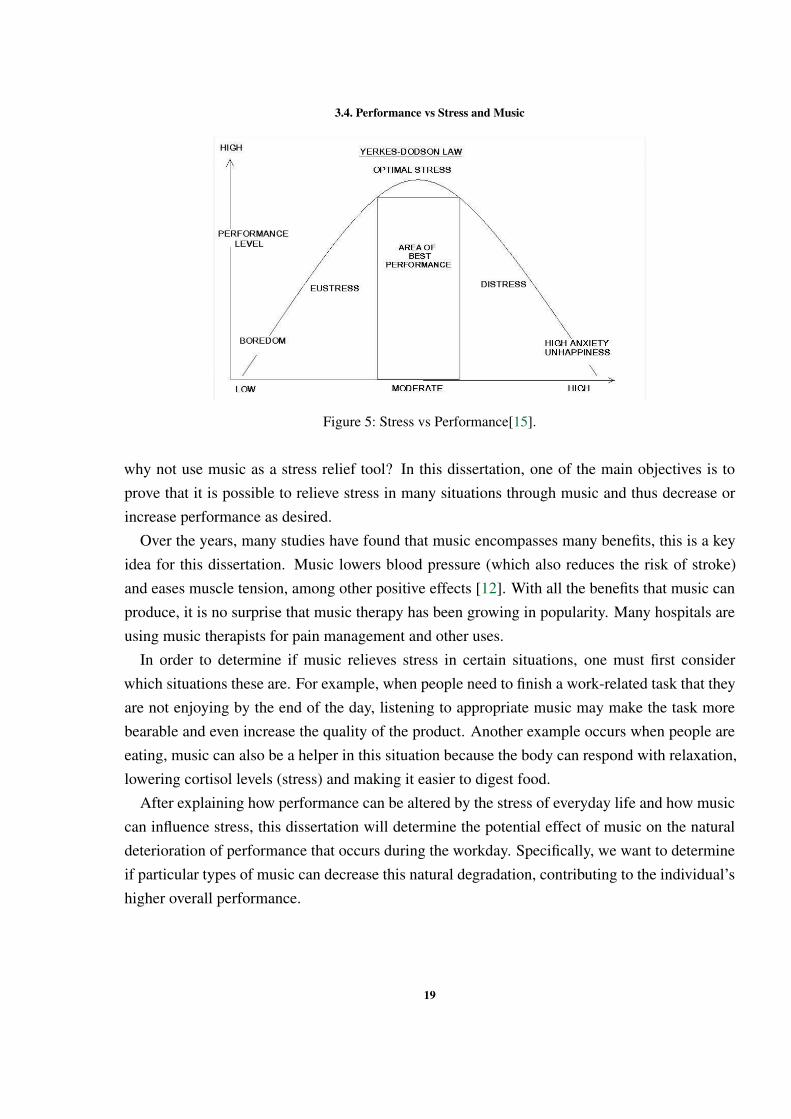
As addressed in detail in [5], there is currently an overwork culture, which is further encour-aged by greedy management techniques and job insecurity. While the main objective of manage-ment is to increase production, this does not necessarily happen, nor will it increase productivity.There is thus the need to improve performance or productivity by other means that do not gener-ate such negative effects. This dissertation presents such an approach through the use of music.Indeed, musical selection affects many different aspects of one’s life , including one’s physiology,mood or motivation. This performance can be affected due to various reasons, for example pres-sure (life stressors), which causes stress. As already described above, stress can be both positiveor negative, and can thus affect performance differently. Figure 5 [15] presents a possible rela-tionship of stress with performance (the Yerkes-Dobson principle). According to this principle,stress will in- crease one’s performance and even one’s health and, as it rises, it is referred to as"eustress". When stress reaches a certain point, however, performance and well being suffer, andthis is called "distress" [15].
The center zone is the area of best performance and, in order to keep one’s performance atoptimal levels, this depends largely on how well you take care of your body, mind and spirit,how far you are able to control your emotions, attitudes and how well you manage all of thedemands made by life. During one’s day, it is always difficult to maintain control over oneselfbecause unpredictable situations happen all the time, there are mood changes, and one remainsunder stress (unconsciously). Many people try to control these mood states or reduce factors likestress, through music. Thus, after having described music and stress, it is important to understandthe relation that exists between them. Both music and stress affect the body in many ways. So,
18
3.4. Performance vs Stress and Music
Figure 5: Stress vs Performance[15].
why not use music as a stress relief tool? In this dissertation, one of the main objectives is toprove that it is possible to relieve stress in many situations through music and thus decrease orincrease performance as desired.
Over the years, many studies have found that music encompasses many benefits, this is a keyidea for this dissertation. Music lowers blood pressure (which also reduces the risk of stroke)and eases muscle tension, among other positive effects [12]. With all the benefits that music canproduce, it is no surprise that music therapy has been growing in popularity. Many hospitals areusing music therapists for pain management and other uses.
In order to determine if music relieves stress in certain situations, one must first considerwhich situations these are. For example, when people need to finish a work-related task that theyare not enjoying by the end of the day, listening to appropriate music may make the task morebearable and even increase the quality of the product. Another example occurs when people areeating, music can also be a helper in this situation because the body can respond with relaxation,lowering cortisol levels (stress) and making it easier to digest food.
After explaining how performance can be altered by the stress of everyday life and how musiccan influence stress, this dissertation will determine the potential effect of music on the naturaldeterioration of performance that occurs during the workday. Specifically, we want to determineif particular types of music can decrease this natural degradation, contributing to the individual’shigher overall performance.
19

3.5. Related Projects
3.5 R E L AT E D P RO J E C T S
Several projects in related fields have been analyzed during this research work. Presented beloware some of these, showing work developed in this field of research by our peers. A brief anal-ysis of the presented projects follows, comparing these with the project shown here. Particularattention has been given to the first project presented, since we have used its proposed musicclassification method in our study.
Music Emotion Classification
This study was developed by the University of Pompeu Fabra, in 2007. The purpose of this studyis to describe the MIREX Audio Music Mood Classification [22]and the Music Information Re-trieval Evaluation eXchange (MIREX), an annual evaluation campaign for Music InformationRetrieval (MIR) algorithms, joined to the International Society (and Conference) for Music In-formation Retrieval (ISMIR).
The same type of music may evoke different emotions in different humans, so it is a challeng-ing task to assign a kind of emotion to a particular song/type of music. One of the main problemsin this matter is the lack of a standard and good quality dataset with audio clips and emotionalinformation. Due to this fact, each author has to gather his own data-set and present results basedon it, making it impossible to compare the results of different studies. This problem was studiedmore actively in the 20th century, when several researchers investigated the relationship betweenemotions and particular musical attributes such as mode, harmony, time, rhythm and dynamics.Mood classification of audio music is one of the tasks included in MIREX, where re- searcherscan submit their classification systems to be tested and ranked. In this study they described howa content-based similarity measure can help to classify a collection of music files according tomood.
Most studies in music emotion classification are based on datasets collected by the authorson the Internet. These datasets are usually pre-classified with emotions, through tags, takenfor instance from sites. This study helped us during our work, since we used the Mirex AudioMusic Classification for the music selected for the study. This classification creates groups ofmusic styles that evoke similar emotions in people. Therefore, our first goal was to create asimilar dataset with the same organization described above, because the MIREX dataset is secretand exclusive, and thus not available to everyone. In order to define the music dataset, we
20
3.5. Related Projects
collected music from ALLMUSIC [1]. This website contains digital music repositories, whichare subdivided into moods and classified with tags by users.
Modeling a stress signal
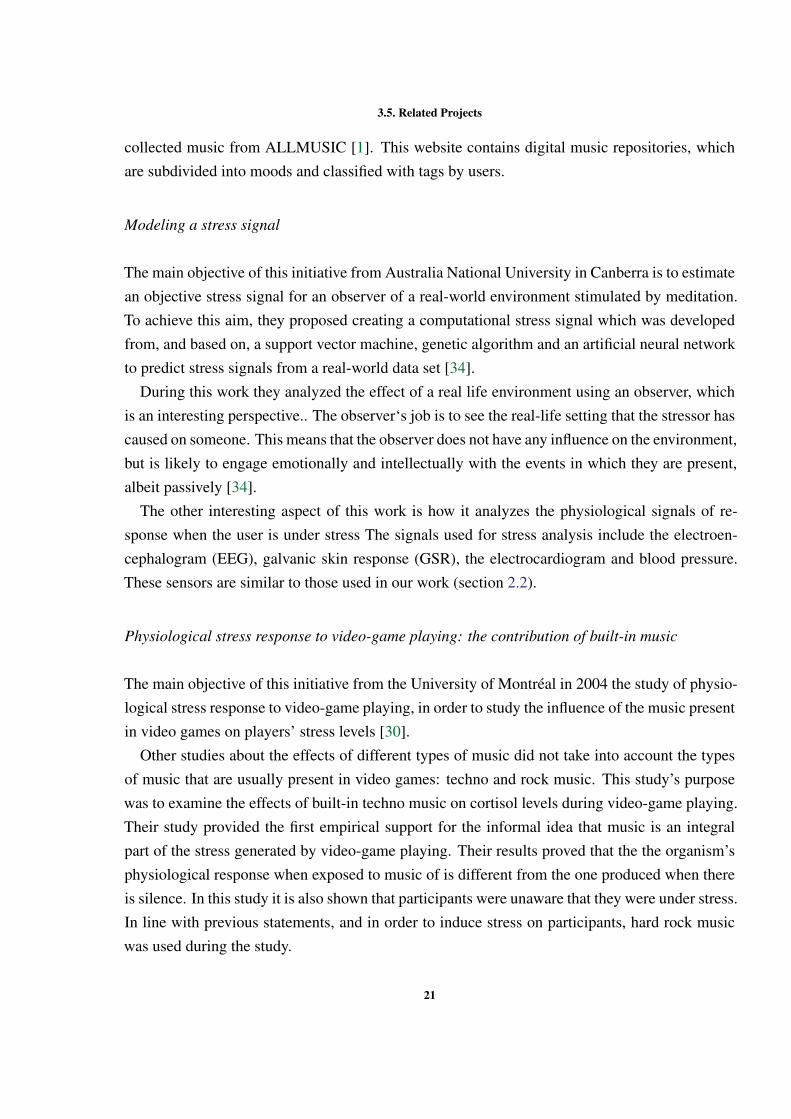
The main objective of this initiative from Australia National University in Canberra is to estimatean objective stress signal for an observer of a real-world environment stimulated by meditation.To achieve this aim, they proposed creating a computational stress signal which was developedfrom, and based on, a support vector machine, genetic algorithm and an artificial neural networkto predict stress signals from a real-world data set [34].
During this work they analyzed the effect of a real life environment using an observer, whichis an interesting perspective.. The observer‘s job is to see the real-life setting that the stressor hascaused on someone. This means that the observer does not have any influence on the environment,but is likely to engage emotionally and intellectually with the events in which they are present,albeit passively [34].
The other interesting aspect of this work is how it analyzes the physiological signals of re-sponse when the user is under stress The signals used for stress analysis include the electroen-cephalogram (EEG), galvanic skin response (GSR), the electrocardiogram and blood pressure.These sensors are similar to those used in our work (section 2.2).
Physiological stress response to video-game playing: the contribution of built-in music
The main objective of this initiative from the University of Montréal in 2004 the study of physio-logical stress response to video-game playing, in order to study the influence of the music presentin video games on players’ stress levels [30].
Other studies about the effects of different types of music did not take into account the typesof music that are usually present in video games: techno and rock music. This study’s purposewas to examine the effects of built-in techno music on cortisol levels during video-game playing.Their study provided the first empirical support for the informal idea that music is an integralpart of the stress generated by video-game playing. Their results proved that the the organism’sphysiological response when exposed to music of is different from the one produced when thereis silence. In this study it is also shown that participants were unaware that they were under stress.In line with previous statements, and in order to induce stress on participants, hard rock musicwas used during the study.
21

3.5. Related Projects
The Effects of Different Types of Music on Perceived and Physiological Measures of Stress
A very interesting study was undertaken in 2002 and studied the effects of different types ofmusic on perceived and physiological measures of stress [20]. This study was developed bythe University of South Alabama. For this study, 31 males and 29 females rated their levelof relaxation and completed the State-Trait Anxiety Inventory (STAI) after they were told thatthey would be taking a stressful, mental test. During the study, the contributor then listened todifferent types of music or was silent, the level of skin temperature, frontalis muscle activity andheart rate was recorded during this period. Participants subsequently rated their relaxation andanxiety levels after listening to music or in silence.
The results of the research suggest that music may have an effect on the cognitive componentof stress response. In this study, it was hypothesized that individuals who listened to classicalmusic, or music they believed was relaxing, perceived themselves to be more relaxed and lessanxious than those who listened to hard rock music. The final results of this study supported thishypothesis, since participants who listened to hard rock music reported that they were not morerelaxed after listening to this genre of music.
Precategorized Stimulative and Sedative Music
In 1973, Dale Taylor studied the Subject Responses to Precategorized Stimulative and SedativeMusic [39]. The purpose of this study was to determine the accuracy with which musical selec-tion have been classified as being stimulative or sedative. This report remains pertinent todaydue to its categorization of some music into stimulative or sedative, which is used as a standard.
The Impact of Listening to Music on Cognitive Performance
This recent work by Arielle S. Dolegui aimed to study the impact of different genres of music,played at different volume levels, on the cognitive abilities of college students while they com-pleted academic tasks. The study focused on two distinct music genres and their influence onperformance, anxiety, and concentration. Participants had to indicate their preferred genre of mu-sic and were requested to repeat a set of numbers backwards while listening to either stimulative,sedative, or no music.
This study used five different arithmetic tests to measure cognitive performance. The testsconsisted of 20 different operations: 5 multiplication, 5 division, 5 addition, and 5 subtraction
22

3.6. Analysis of the related projects
problems. The order of operations was randomized throughout the tests. No question involvedoperations with more than a three-digit number. The five tests were similar in difficulty. Loudmusic was defined as heavy-rock metal music, and the song used in that condition was “NotReady to Die”. Soft music was defined as classical piano-only music, and the piece that wasused in that condition was “Morning Light”[11].
The results of the research are interesting because we were able to compare them with the re-sults of our study. It indicated that participants performed worse while listening to their preferredtype of music (music can serve as a distracting factor) and that the best results were obtainedwhen there was no music condition. The results also showed that participants who listened tosedative music performed better than those who listened to stimulative music (a stronger distrac-tor, which then obstructs cognitive processing). The first group also performed better than thanthose who listened to no music at all. Interestingly, there was no difference when the scores fromsoft music played at high volume were compared to scores from loud music at high volume.
3.6 A N A LY S I S O F T H E R E L AT E D P RO J E C T S
Many projects have been developed over the last years, revolving around the main themes de-scribed above, such as Music, Performance and Stress. Some of these have been presented here,showing their objectives, challenges, and some of the results obtained at the end. All these stud-ies proved to be important, providing a greater understanding of the various factors involved andcontributing to an optimized/in-depth study through the results observed.
Music Emotion Classification, described by Mirex, is a study that many researchers participatein each year. It essentially allows for a better understanding of the relationship between emotionsand particular music attributes, such as mode. This study proved to be of great use to us, due toits method of classification of music into 5 clusters (like a folder with songs of different musicstyles). Through this, we were able to understand that there are similarities between clusters(how music affects us), which we had to bear in mind in our results.
All the studies referred above were important to understand various factors, which includedevaluating the user’s performance when he/she was subjected to factors such as stress and music.There are several ways to evaluate stress and evaluating vital signs is one of these. In Modelinga stress signal study, the values of the vital signals are checked through sensors. This allows usto realize how sensors are used in studies, so that we used similar sensors in our pre-tests.
Still reviewing the last referenced study (The Impact of Listening to Music on Cognitive Per-formance), the results are very interesting, for example, the fact that when the volume of music
23

3.6. Analysis of the related projects
is lower or higher, this does not change the results. We did not highlight this detail in our studywhere each user listens to music at the volume he wishes through headphones. Yet, i may beinteresting to note this study, because it is similar in many aspects to ours. On a closer analysis,the method of the study uses math exercises, however, the analysis lies in establishing if the mu-sic is effective in short spaces of time (if it takes more time). The repetition of exercises (evenchanging the exercises), has no reverse effects on results. Compared to our study, the participantsperform their work, but listen to music for much longer periods of time (morning or afternoon).A very important conclusion reached after the analysis of some previous work is the possibilityof monitoring systems interfering in the behavior of the people being analyzed.
24
4
DATA C O L L E C T I O N
Human-computer interaction is an increasingly interesting research field. As our interactionswith technology grow, so does the knowledge that can be built about us by common devices suchas Smartphones or computers (and their software).
In the last years, we have shown that particularly stressful periods or peaks of fatigue changeour interaction with these devices. Specifically, they change the performance of this interaction.While short periods of stress might even improve it, prolonged periods or fatigue may signifi-cantly decrease it. In this context, the aim of this study is to establish if listening to specifictypes of music may contribute to further improve or worsen the performance of the computeruser. With this research, we aim to develop music recommendation strategies that can improvethe experience of the user while interacting with a computer, whether for work or leisure.
For the main goal of this dissertation, it is necessary to collect the user’s interaction with acomputer. By using mouse, keyboard and intrusive sensors, a software application was devel-oped. In order to analyze the user’s interaction patterns, in both a normal and stressed state, theparticipants of the study worked normally on their daily computer tasks while listening to music.In this dissertation we focused on the preliminary validation of the approach and study.
In the preliminary validation of the approach, we carried out tests to prove that music affectspeople in different ways. By using the sensors described in the previous chapter, we were able toprove that this approach makes sense and demonstrated the motivation of our work in this area.The Long Duration Study was implemented, in which we used only non-intrusive sensors, mouseand keyboard, in order to collect the user’s interaction with the computer in normal activities.During this study, the user listened to different types of music to determine if, during the activity,the user felt more or less stressed. In this study, the users had to answer questionnaires. In these,we created user profiles with the purpose of understanding if music produces particular feelingson the user during the activity, like fury, happiness, or others.
25

4.1. Motivation
4.1 M OT I VAT I O N
As has already been shown, there are several good reasons to study this area,several projectsover the years have proven that music generates different effects on people. In the preliminaryvalidation of the approach, we decided to use intrusive sensors, namely Galvanic Skin Response,Blood Volume Pulse and Skin Temperature. These sensors allowed us to measure the user’s vitalsigns during the study, so as to better understand how music influences the user’s performanceduring activities. These tests were carried out by people from the Intelligent Systems Lab at theUniversity of Minho. The participants played four mental games, a Memory Game, a Reaction-time Game, a Concentration Game and an Accuracy Game. The purpose of these games was totest the user’s cognitive abilities, such as memory, concentration and reaction[26].
These games were played twice by each participant (in 2 phases). In the first phase, eachparticipant could choose one cluster from five clusters, in the second phase, this was accompaniedby the participant’s preferred music (participants played games while listening to the music). Intwo phases of the test, we measured the participant’s vital signs through the 3 sensors. In Figure 6presents the results of the participant Kevin both graphs reveal that there are differences whengoing from one phase to another, more or less starting from the seventh minute. In the uppergraph, the results of Skin Conductance are presented ( a method of measuring the electricalconductance of the skin), where the values in the first phase are low and showed the participantto be calm and apathetic, in line with the music he heard. In phase 2, the user began to listento his favorite songs, which produced greater activation, this was demonstrated by the highervalues of Skin Conductance, which means more excitement or stress. The lower graph presentsthe results of Resistance (Skin resistance, the inverse of Skin Conductance), when the values ofResistance are higher, this mean that the participant is calmer. There is a change in the values ofResistance when the second phase begins.
In the Blood Volume Pulse sensor, values were constant, between 60 and 85 beats per minute.The Skin Temperature sensor also consistently recorded normal values for the human body. Thevalues of Skin Conductance and Resistance may indicate that the user has, in fact, become ex-cited, but there might not have been enough time to notice obvious differences in these vitalsigns (Blood Volume and Skin Temperature). With feedback from the user, we observed that theuser had been more excited in phase 2 and that the scores were better. Generally, all participantsdemonstrated that there were differences between phase1 and phase2 through the sensor valuesand feedback from each participant.
26

4.1. Motivation
Figure 6: Results of the preliminary validation of the approach - Skin Conductance and Resistance.
During the study, we were able to perceive the state of the participants in the proposed activities(mood). Most of the participants who chose a random cluster in the first phase, and who did notlike the music style at all, showed discomfort, this even caused possible irritation over the courseof a longer time period. We were able to observe that the preferred music in phase 2 affectedeach user differently. For some users, it had a relaxing effect while, for others, it had the oppositeeffect, arousing the person.
After this preliminary validation of the approach and the results obtained, we were more mo-tivated to carry out the main study, observing the effects of music (music styles) on the user. Inthe main study the user was subjected to several different styles of music, ranging from quieterto more aggressive. Another important aspect was to maintain the repetition of the games, oneof the significant factors, besides the excitement caused by the music, was that the participantcould produce better scores by having to repeat the games. We can compare this aspect to thatof a person’s routine in a job. One must take into account that the user in the main study willbe working and that a good performance over time may not be motivated by music in the sameway However, one must also consider that repeating tasks or not having stressors are importantaspects, too.
27

4.2. Study Design
4.2 S T U DY D E S I G N
Specifically, one studied the influence of different types of music on two variables: the interactionpatterns of the users with computers and the behaviors in the environment.
4.2.1 Interaction Patterns
Interaction patterns are described by a number of features, which are extracted from the logof activity of the mouse and the keyboard. This log contains particular events, issued by theOperating System, their timestamp and other important information such as coordinates, whenapplicable. The following events are considered:
Figure 7: A high-level view of the architecture.
• MOV, timestamp, posX, posY - an event describing the movement of the mouse, at a giventime, to coordinates (posX, posY) in the screen;
• MOUSE_DOWN, timestamp, [Left|Right], posX, posY - this event describes the first halfof a click (when the mouse button is pressed down), in a given time. It also describes whichof the buttons was pressed (left or right) and the position of the mouse in that instant;
• MOUSE_UP, timestamp, [Left|Right], posX, posY - an event similar to the previous onebut describing the second part of the click, when the mouse button is released;
• MOUSE_WHEEL, timestamp, dif - this event describes a mouse wheel scroll of amountdif, in a given time;
• KEY_DOWN, timestamp, key - identifies that given key from the keyboard was presseddown, at a given time;
28

4.2. Study Design
• KEY_UP, timestamp, key - describes the release of at given key from the keyboard, in agiven time;
These events were considered in order to build the following features, that describe the inter-action patterns of the user with the computer:
• Velocity - The distance travelled by the mouse (in pixels) over the time (in milliseconds).The velocity is computed for each interval defined by two consecutive MOUSE_UP andMOUSE_DOWN events. Let us assume two consecutive MOUSE_UP and MOUSE-_DOWN events, mup and mdo, respectively in the coordinates (x_1,y_1 ) and (x_2,y_2), which occurred respectively at the moments time_1 and time_2. Let us also assume twovectors pos_x and pos_y, of size n,holding the coordinates of the consecutive MOUSE-_MOV events between mup and mdo. The velocity between the two clicks is given by
r_dist(time_2−time_1) , in which r_dist represents the distance travelled by the mouse and is givenby equation 4.1:
r_dist =n−1
∑i=1
√(posxi+1 − posxi)2 + (posyi+1 − posyi)2 (1)
Equation 4.1: Velocity equation
• Acceleration - The velocity of the mouse (in pixels/milliseconds) over the time (in millisec-onds). A value of acceleration is computed for each interval defined by two consecutiveMOUSE_UP and MOUSE_DOWN events, using the intervals and data computed for theVelocity.
• Down Time - the timespan between two consecutive KEY_DOWN and KEY_UP events,i.e., for how long was a given key pressed.
• Time Between Keys - the timespan between two consecutive KEY_UP and KEY_DOWNevents, i.e., how long did the individual took to press another key.
• Time Between Clicks - the timespan between two consecutive MOUSE_UP and MOUSE_DOWN events, i.e., how long did it took the individual to perform another click.
• Double Click Duration - the timespan between two consecutive MOUSE_UP events, when-ever this time span is inferior to 200 milliseconds. Wider timespans are not considereddouble clicks.
29

4.2. Study Design
• Average Excess of Distance - this feature measures the average excess of distance that themouse travelled between each two consecutive MOUSE_UP and MOUSE_DOWN events.Let us assume two consecutive MOUSE_UP and MOUSE_DOWN events, mup and mdo,respectively in the coordinates (x_1,y_1 ) and (x_2,y_2 ). To compute this feature, first thedistance is measured in a straight line between the coordinatesof mup and mdo as sdist =sqrt(x2 − x1)
2 + (y2 − y1)2. Then, it is measured the distance actually travelled by the
mouse by summing the distance between each two consecutive MOV events. Let us as-sume two vectors posx and posy, of size n, keeping the coordinates of the consecutiveMOV events between mup and mdo. The distance actually travelled by the mouse, r_distis given by equation 1. The average excess of distance between the two consecutive clicksis thus given by rdist
sdist .
• Average Distance of the Mouse to the Straight Line - in a few words, this feature measuresthe average distance of the mouse to the straight line defined between two consecutiveclicks. Let us assume two consecutive MOUSE_UP and MOUSE_DOWN events, mupand mdo, respectively in the coordinates (x_1,y_1 ) and (x_2,y_2 ). Let us also assume twovectors posx and posy, of size n, holding the coordinates of the consecutive MOUSE_MOVevents between mup and mdo. The sum of the distances between each position and thestraight line defined by the points (x_1,y_1 ) and (x_2,y_2 ) is given by equation 2, inwhich ptLineDist returns the distance between the specified point and the closest point onthe infinitely-extended line defined by (x_1,y_1 ) and (x_2,y_2 ). The average distance ofthe mouse to the straight line defined by two consecutive clicks is thus given by sdist
n .
s_dist =n−1
∑i=0
ptLinedist(posxi, posyi) (2)
Equation 4.2: Average distance of the mouse to the straight line equation
• Distance of the Mouse to the Straight Line - this feature is similar to the previous onein the sense that it will compute the s_dists between two consecutive MOUSE_UP andMOUSE_DOWN events, mup and mdo, according to equation 2. However, it returns thissum rather than the average value during the path.
• Signed Sum of Angles - with this feature the aim is to determine if the movement of themouse tends to "turn" more to the right or to the left. Let us assume three consecutive MOV
30
4.2. Study Design
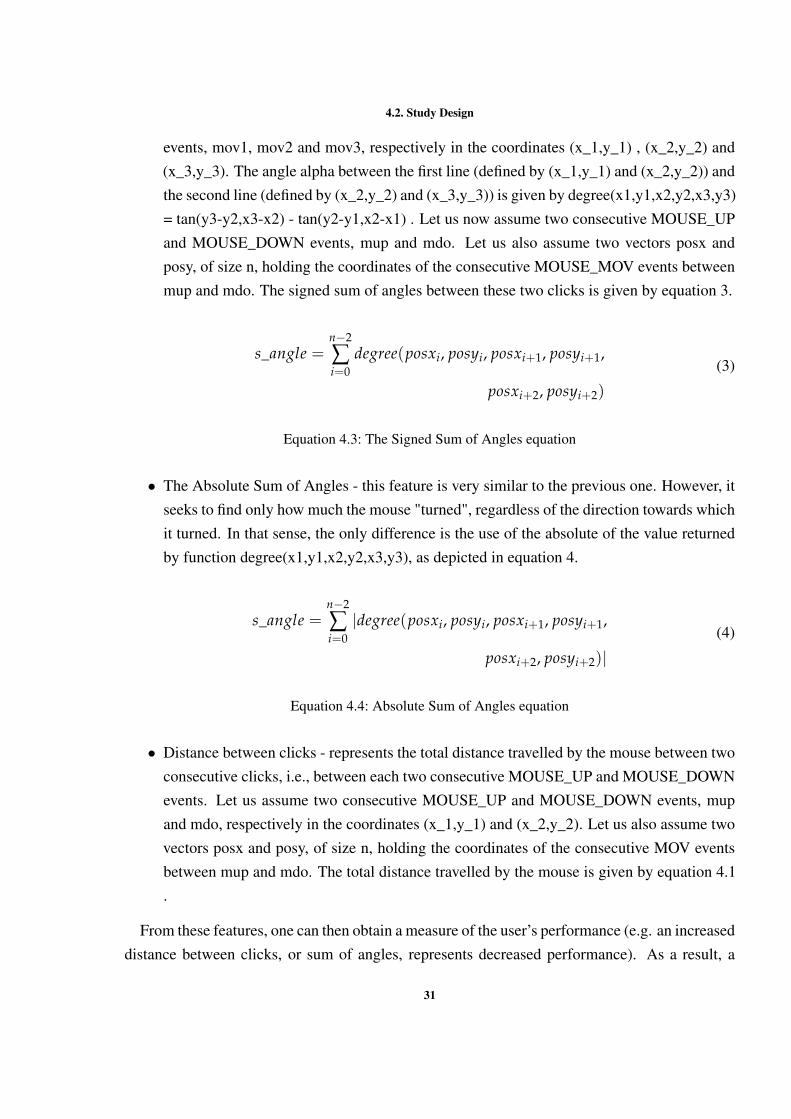
events, mov1, mov2 and mov3, respectively in the coordinates (x_1,y_1) , (x_2,y_2) and(x_3,y_3). The angle alpha between the first line (defined by (x_1,y_1) and (x_2,y_2)) andthe second line (defined by (x_2,y_2) and (x_3,y_3)) is given by degree(x1,y1,x2,y2,x3,y3)= tan(y3-y2,x3-x2) - tan(y2-y1,x2-x1) . Let us now assume two consecutive MOUSE_UPand MOUSE_DOWN events, mup and mdo. Let us also assume two vectors posx andposy, of size n, holding the coordinates of the consecutive MOUSE_MOV events betweenmup and mdo. The signed sum of angles between these two clicks is given by equation 3.
s_angle =n−2
∑i=0
degree(posxi, posyi, posxi+1, posyi+1,
posxi+2, posyi+2)
(3)
Equation 4.3: The Signed Sum of Angles equation
• The Absolute Sum of Angles - this feature is very similar to the previous one. However, itseeks to find only how much the mouse "turned", regardless of the direction towards whichit turned. In that sense, the only difference is the use of the absolute of the value returnedby function degree(x1,y1,x2,y2,x3,y3), as depicted in equation 4.
s_angle =n−2
∑i=0|degree(posxi, posyi, posxi+1, posyi+1,
posxi+2, posyi+2)|(4)
Equation 4.4: Absolute Sum of Angles equation
• Distance between clicks - represents the total distance travelled by the mouse between twoconsecutive clicks, i.e., between each two consecutive MOUSE_UP and MOUSE_DOWNevents. Let us assume two consecutive MOUSE_UP and MOUSE_DOWN events, mupand mdo, respectively in the coordinates (x_1,y_1) and (x_2,y_2). Let us also assume twovectors posx and posy, of size n, holding the coordinates of the consecutive MOV eventsbetween mup and mdo. The total distance travelled by the mouse is given by equation 4.1.
From these features, one can then obtain a measure of the user’s performance (e.g. an increaseddistance between clicks, or sum of angles, represents decreased performance). As a result, a
31
4.3. Long Duration Study
wide range of possibilities become real, such as the study of the effects of fatigue or stress onperformance [11, 4] or, as in this case, the effects of musical selection.
4.3 L O N G D U R AT I O N S T U DY
4.3.1 Goals and Objectives
The main goal of this study is to determine the influence of music on the interaction of users withcomputers, as well as on their behavior within the environment. Determining the existence ofthese changes and measuring their magnitude will allow for the development of a recommenda-tion system aimed at improving individual performance indicators.
The main objectives of the study are:
• To determine if music produces an effect on the interaction patterns of the users with thecomputer;
• To determine if different types of music produce different effects on the variable;
• To study and quantify the effects of different types of music on the variable;
• To determine if users are conscious of the effects measured or, at least, of some effect atsome level;
• To determine if the effects observed can be generalized to the population in general (e.g.type of music A affects 95% of the population in a similar way) or if only personalizedmodels will be sufficiently accurate;
4.3.2 Method
This experimental study took place in the Intelligent Systems Lab at the University of Minho. Inthis lab, numerous students and researchers spend their day working with a specific computer andare allowed to listen to music using headphones. 12 participants were selected to take part in thisstudy, aged between 20 and 28, with an average age of 24.3 . Prior to their participation in thestudy, each individual filled in a questionnaire aimed at determining their musical preferences.Moreover, at the end of each day, they also filled in another questionnaire to determine theirsubjective opinion about the musical selection of the day. With the help of psychologists from
32

4.3. Long Duration Study
the School of Psychology at the University of Minho, these questionnaires were drawn up andgrounded on affective standards such as valence, activation and dominance (Figure 9). Valencemeans that something caused positive or negative emotions in a participant, in this case, whatkinds of emotions were provoked by the music in question. Activation relates to whether theparticipant feels more active or calmer after the study, in this case after hearing musics duringdaily work. Dominance is related to whether the participant lost control over the activity that wastaking place due external factors (music) during the study.
These three affective norms are related, so that the questions were constructed in line withthese principles. After carrying out a more critical analysis, these questionnaires allowed usto establish which of the participants’ emotions were caused by music: fear, anger, surprise,sadness, and so forth.
Figure 8: Questionnaire to classify the musics/songs (clusters) at the end of each work day.
33
4.3. Long Duration Study
The selected individuals were requested to participate in the study for five days. During theirparticipation, they did not need to change any of their routines: the only request was that theycarried out their usual tasks while listening to the music provided, using their headphones. Therecording of their performance indicators was carried out in the background, through a log appli-cation that required no interaction at all. The independent variable in this study was thus musicalselection. Five different types of music were used, firstly, they were classified and then put for-ward by [18] in the form of five so-called mood clusters. Each cluster contained music classifiedas follows:
• Cluster 1: passionate, rousing, confident, boisterous, rowdy;
• Cluster 2: rollicking, cheerful, fun, sweet, amiable/good natured;
• Cluster 3: literate, poignant, wistful, bittersweet, autumnal, brooding;
• Cluster 4: humorous, silly, campy, quirky, whimsical, witty, wry;
• Cluster 5: aggressive, fiery, tense/anxious, intense, volatile, visceral;
The dependent variable was the performance of the participants, measured in terms of thefeatures described above. Before the actual start of the data collection, each participant filledin a first questionnaire, meant to establish a profile for each participant. In this questionnaire,each participant provided some standard demographic data, rated some songs from the differentclusters according to their level of activation or valence (from the participant’s point of view) andanswered some questions which would allow us to perceive their musical preferences. Duringthe actual study, each participant took part in five different moments of data collection, each oneon a different day. On each day, the participant heard music from one of the different clustersduring the whole period of work, a minimum of 3 hours.
At the end of each day, each participant answered another questionnaire aimed at determininghow the type of music made them feel, concerning their performance at work (e.g. was the partic-ipant consciously aware of some effect?). Moreover, it was also the aim of this questionnaire todetermine if the music truly induced the desired state in the participant. The data collected, fromboth the questionnaires and the performance monitoring software, was analyzed using statisticalsoftware.The results are described further ahead in this work.
34
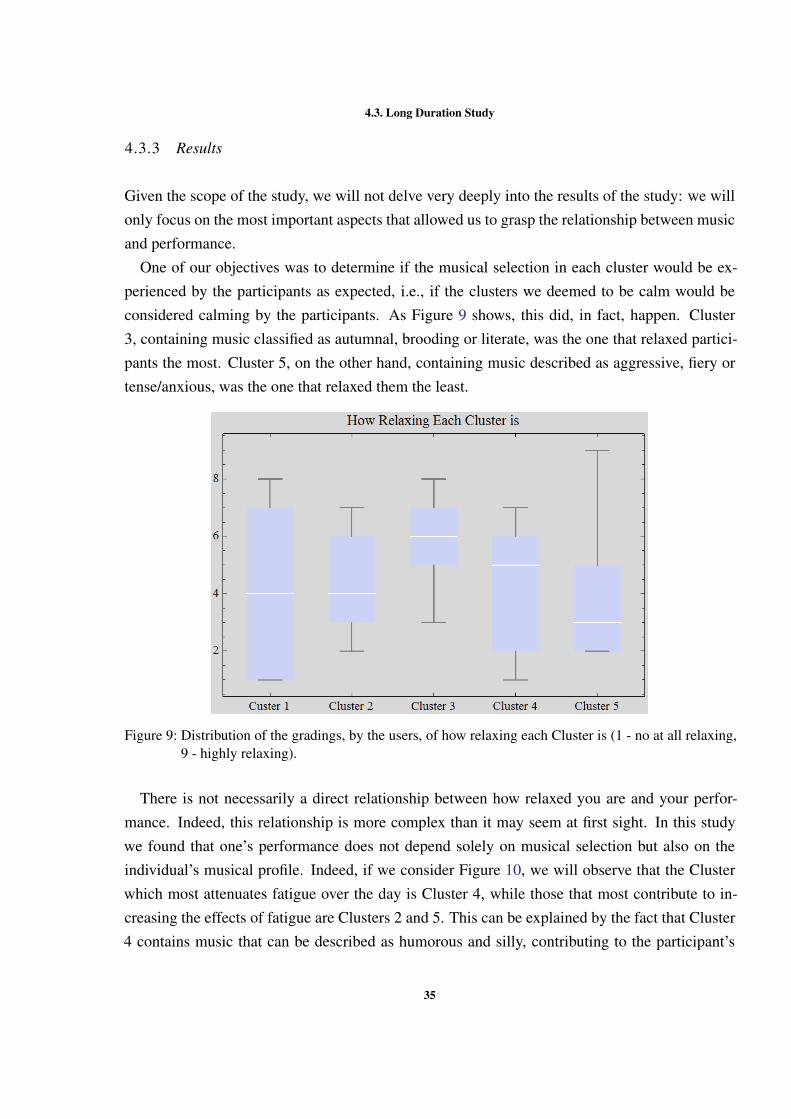
4.3. Long Duration Study
4.3.3 Results
Given the scope of the study, we will not delve very deeply into the results of the study: we willonly focus on the most important aspects that allowed us to grasp the relationship between musicand performance.
One of our objectives was to determine if the musical selection in each cluster would be ex-perienced by the participants as expected, i.e., if the clusters we deemed to be calm would beconsidered calming by the participants. As Figure 9 shows, this did, in fact, happen. Cluster3, containing music classified as autumnal, brooding or literate, was the one that relaxed partici-pants the most. Cluster 5, on the other hand, containing music described as aggressive, fiery ortense/anxious, was the one that relaxed them the least.
Figure 9: Distribution of the gradings, by the users, of how relaxing each Cluster is (1 - no at all relaxing,9 - highly relaxing).
There is not necessarily a direct relationship between how relaxed you are and your perfor-mance. Indeed, this relationship is more complex than it may seem at first sight. In this studywe found that one’s performance does not depend solely on musical selection but also on theindividual’s musical profile. Indeed, if we consider Figure 10, we will observe that the Clusterwhich most attenuates fatigue over the day is Cluster 4, while those that most contribute to in-creasing the effects of fatigue are Clusters 2 and 5. This can be explained by the fact that Cluster4 contains music that can be described as humorous and silly, contributing to the participant’s
35

4.3. Long Duration Study
good mood and motivation. Though somewhat similar, Cluster 2 is calmer and activates peopleless. Cluster 5 contains heavy music, which over longer periods, will wear the participants out,producing negative effects. These characteristics can help one to understand the observed differ-ences. Although these differences are visible when observing the entire population, this is stillmore interesting when one considers individual participants and their musical profile. Indeed, wesaw that people who enjoy heavy music more are positively affected and experience improvedperformance over a longer timespan with the heavier clusters. They are activated by this musicin a positive manner and work more efficiently. These are also people who possess higher base-line activation, i.e., they are naturally more "stressed". People that are naturally calmer, on theother hand, find this music annoying and sometimes hurtful to the ear, as a result, they are unableto concentrate, which affects their performance. These individuals thus perform better at workwhen listening to calmer music.
Figure 10: Distribution of the percentage of features in which each participant improved their performanceover the day, for each Cluster.
On analyzing a case of 12 individuals who carried out this study, the participant "Davide"obtained the following performance classifications, represented in Figure 11. One can observebetter ranking in Cluster 2, which means that over time the participant improved his performance.In Clusters 3 and 4, the participant obtained a lower classification. The data collected allows usto observe the metric values over time for each cluster, which changes to high and low values.On analyzing each day for each cluster, we can generally observe if each of the metric valuesrose or dropped. In Figure 11, the upper table presents the general assessments of the metric
36

4.3. Long Duration Study
values, which are represented by "+" and "-". The symbol "+" means that the average valueswere positive in the aspect of performance (values may have increased or decreased over time),for example, if the KeyDown metric in a cluster has a "+", this means that the values over timedropped (there are a few exceptions where values rise, for example in a pause), thus contributingto increased performance. The symbol "-" means that the average values were negative in theaspect of performance, which could mean that over time, due to fatigue or stress, the user tooklonger to press the keys on the keyboard and the time of writing was therefore longer, whichhelps to reduce user performance. This form of representation allows one to calculate the valueof overall performance (e.g. if all the metrics in the cluster had "+"), and the overall performancewould then be 100%. The percentages shown in the lower table of Figure 11 are constructed bystarting with the counting of "+", this means that, in thirteen metrics evaluated for example incluster 2, 84% of these metrics had positive values that contributed to the increased performanceon that day. Considering the performances below 50%, one can say that performance droppedover time, because the values of more than half of the metrics evolved negatively in terms ofperformance ("-").
Figure 11: Classification of performances in each cluster. - Participant Davide.
In order to evaluate overall user performance, one needs to understand the values calculatedby the metrics, since an increase in metric values does not always mean higher performance. InFigure 12, for example, if the TimeBetweenKeys metric values rise over time, this means theuser takes longer to press between keys, which may signify a break in concentration or tiredness,and can thus not be related to increased performance. If one is conclude that there has been
37
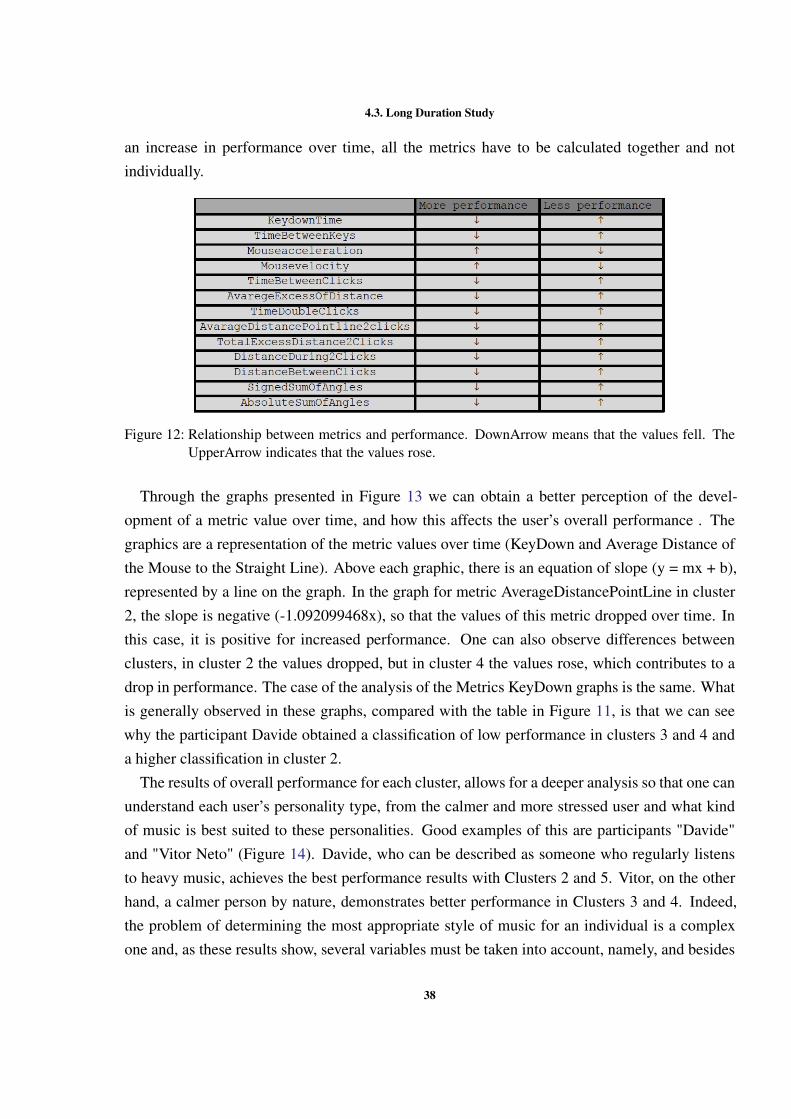
4.3. Long Duration Study
an increase in performance over time, all the metrics have to be calculated together and notindividually.
Figure 12: Relationship between metrics and performance. DownArrow means that the values fell. TheUpperArrow indicates that the values rose.
Through the graphs presented in Figure 13 we can obtain a better perception of the devel-opment of a metric value over time, and how this affects the user’s overall performance . Thegraphics are a representation of the metric values over time (KeyDown and Average Distance ofthe Mouse to the Straight Line). Above each graphic, there is an equation of slope (y = mx + b),represented by a line on the graph. In the graph for metric AverageDistancePointLine in cluster2, the slope is negative (-1.092099468x), so that the values of this metric dropped over time. Inthis case, it is positive for increased performance. One can also observe differences betweenclusters, in cluster 2 the values dropped, but in cluster 4 the values rose, which contributes to adrop in performance. The case of the analysis of the Metrics KeyDown graphs is the same. Whatis generally observed in these graphs, compared with the table in Figure 11, is that we can seewhy the participant Davide obtained a classification of low performance in clusters 3 and 4 anda higher classification in cluster 2.
The results of overall performance for each cluster, allows for a deeper analysis so that one canunderstand each user’s personality type, from the calmer and more stressed user and what kindof music is best suited to these personalities. Good examples of this are participants "Davide"and "Vitor Neto" (Figure 14). Davide, who can be described as someone who regularly listensto heavy music, achieves the best performance results with Clusters 2 and 5. Vitor, on the otherhand, a calmer person by nature, demonstrates better performance in Clusters 3 and 4. Indeed,the problem of determining the most appropriate style of music for an individual is a complexone and, as these results show, several variables must be taken into account, namely, and besides
38

4.3. Long Duration Study
Figure 13: Graph metric of clusters - Participant Davide.
the type of music, the individual’s musical profile . Moreover, the subject’s objective l at the time(e.g. Does he need to complete a task quickly? Does he prefer to work calmly?), as well as thetimespan (e.g. One tends to grow tired of a type of music if one listens to it for prolonged periodsof time) should also be included in the future.
To supplement the results obtained, it is also important to note the answers to questionnaires.On observing Andre’s responses (Figure 15) and the values of the general performances corre-sponding to Andre (Figure 14), the following questions were asked:
• a) - What feelings / how do you feel after hearing the songs?
• b) - How did you feel at the beginning of the day?
• c) - Did you like these songs?
• d) - Do you think these songs allowed you to relax?
• e) - Would you rather have done the same activities today, without this kind of music?
39
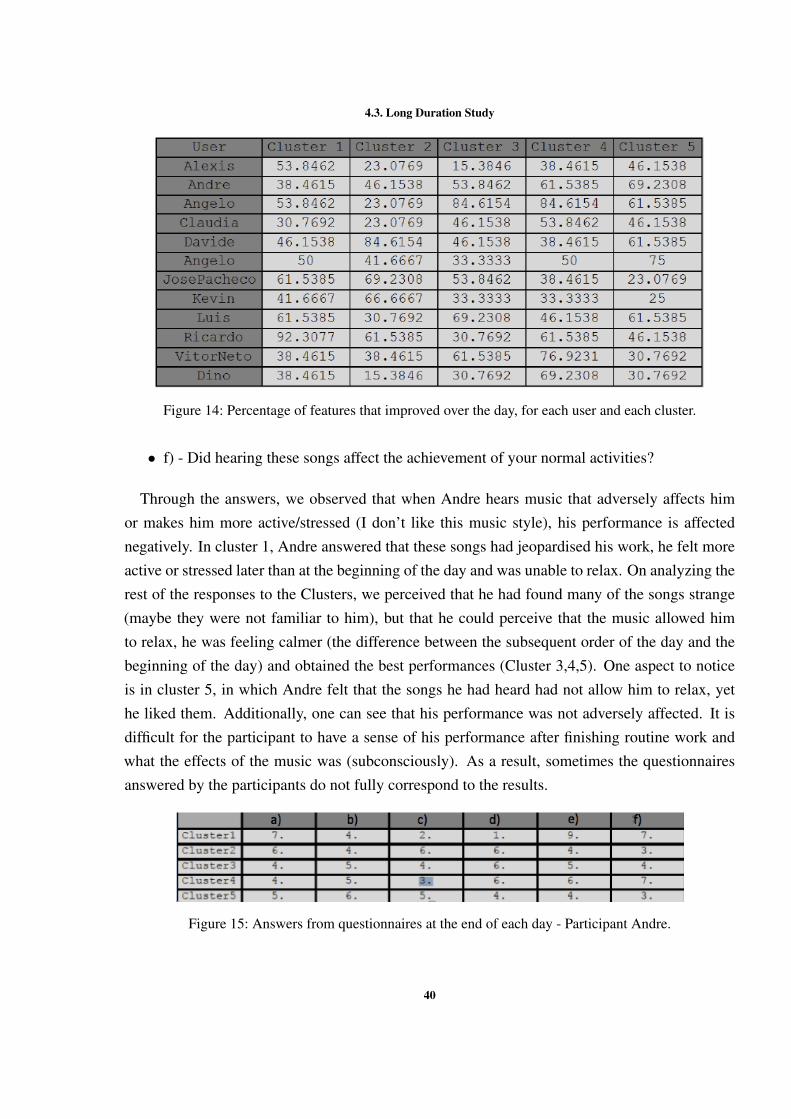
4.3. Long Duration Study
Figure 14: Percentage of features that improved over the day, for each user and each cluster.
• f) - Did hearing these songs affect the achievement of your normal activities?
Through the answers, we observed that when Andre hears music that adversely affects himor makes him more active/stressed (I don’t like this music style), his performance is affectednegatively. In cluster 1, Andre answered that these songs had jeopardised his work, he felt moreactive or stressed later than at the beginning of the day and was unable to relax. On analyzing therest of the responses to the Clusters, we perceived that he had found many of the songs strange(maybe they were not familiar to him), but that he could perceive that the music allowed himto relax, he was feeling calmer (the difference between the subsequent order of the day and thebeginning of the day) and obtained the best performances (Cluster 3,4,5). One aspect to noticeis in cluster 5, in which Andre felt that the songs he had heard had not allow him to relax, yethe liked them. Additionally, one can see that his performance was not adversely affected. It isdifficult for the participant to have a sense of his performance after finishing routine work andwhat the effects of the music was (subconsciously). As a result, sometimes the questionnairesanswered by the participants do not fully correspond to the results.
Figure 15: Answers from questionnaires at the end of each day - Participant Andre.
40

4.4. Conclusion and Critical Analysis
4.4 C O N C L U S I O N A N D C R I T I C A L A N A LY S I S
Music is reflected in the people through emotions, ranging from fear and anger to happiness andwell being. These states are represented in our music repository through the clusters. Emotionscan be induced in people, as was demonstrated in this study.
After the preliminary validation of the approach and the main study, which was based on astudy conducted regarding the effects of music in related projects, one can say that the resultsobtained were extremely satisfactory. They helped to comprehend various situations, with thepurpose of trying to understand if the person has experienced an evolution of his performanceover time in his daily work, if there has been an influence of stress factors on the person or iffactors such as music help to improve performance, and so on.
During our daily work, there have been always factors that are potentially stressful, such astime, our boss, work efficiency, amongst many more other factors. One might consider thatmusic can be a way to combat this stress, helping the person to relax in a situation such as ameeting. It was important to realize that there are basically two types of personalities regardingthe music factor. From the results,we can see that there are people who hear their favorite musicand become relaxed, so that music works as a tranquilizer. It can also work as a stimulant, makingthe person more lively and can constitute an extra supplement of energy in some situations. Eachcluster contains a list of music (style of music) that produced different effects on the participants,from feeling good while hearing the music to general discomfort. We may think that a cluster iscomparable to the type of music lists that currently exist, such as the music list which encouragessport or study, amongst so many others. An important aspect observed is that for people who hadmusical training, the effect of music is not so obvious. This might be due to the fact that theyhave already heard numerous different styles of music and the brain has already been trained toappreciate or ignore some styles of music.
Overall performance was measured by using a set of calculations with sets of metric values,which may not be the correct path to follow, however, we believe that there is no more correct ormore perfect form. Our way of observing performance over time was by calculating the metrics,but some contradictions could emerge. If the user pauses in his work this affects the metricvalues, which will then be higher or lower (depending on the metric) This will, in turn, affectthe overall average of this metric and, consequently, the value for overall performance. Trying tosolve this problem in the construction of our system proved to be complicated, but when overalluser performance was built, we were able to produce a filter for the inapplicable values (userpauses at work), for example zero values. Another detail that should be seen in future work, is
41

4.4. Conclusion and Critical Analysis
that of attributing more importance to some other metric. If one could assess the type of workthe user is doing at the time, then one would be more certain of the performance. For example,if the user is working only with a keyboard (type text), the values for the mouse will be almostzero, which may greatly influence the evaluation of overall performance. Thus, the objective wasto remove the metric values for the mouse when a performance evaluation takes place.
Finally, when evaluating the questionnaires, we noticed that it was rather difficult for the userto evaluate themselves. An important aspect that could have been evaluated was whether theuser was experiencing an external factor on that day which might have affected his work, andthen somehow try to evaluate this aspect when assessing overall performance. Our ideal, is toeventually try to eliminate questionnaires in the future, so that our system will automaticallyperceive various issues presented in the questionnaires.
The results of this study allowed us to realize various problems, which have already beendescribed One of these was how difficult it can be to evaluate a user’s performance, with bothan external factor as well as music constituting an additional stress factor. Our recommendationsystem will be built on the basis of this result and on what we learned from this study. It will,thus, be possible to recommend specific music or styles of music for certain objectives (e.g. ameeting), depending on the person’s personality. The recommendation system must be subjectedto a period of learning, which will be described in the next chapter.
42

5
M O N I T O R A N D R E C O M M E N DAT I O N S Y S T E M
Based on the study performed in this dissertation, and in order to try to understand the evolutionof user performance in daily work, monitoring is necessary. All monitoring is based on observa-tion and evaluation. The observation of this system in particular is carried out by recording theevents caused the mouse and keyboard are handled by a user. These records are associated withthe metrics described in the previous chapter. Associated with this observation, the system alsohas the ability to recommend styles of music based on user goals and performance in real time.
Figure 16: Stress vs Performance.
Over a working day, we are subject to various situations that influence our work rate. Thesesituations can create stress, which influences the performance level of our work. There are userswho respond well to stress, increasing their level of performance at work, while others react tostress in an adverse manner, which is harmful to their health. This tool allows the user to be
43

5.1. Description
able to evaluate and try to understand if he responds well to stress. He can then ask the system torecommend which music increases his performance or, in situations of stress which music allowshim to relax. In this chapter, we will describe the objectives of the system, its architecture as wellas how our monitoring and recommendation system was implemented.
5.1 D E S C R I P T I O N
With the help of a service which calculates Metrics through behavioral biometrics, this recom-mendation and monitoring system has the ability to evaluate the user’s performance. The rec-ommendation and monitoring in our system was undertaken through an interface, where eachmodule has one interface. To complete the monitoring of users, a web interface was developed,where it is possible to monitor performance and to observe the music style suggested for eachuser.
The architecture must respect the following features:
• The historical Performance module, which allows one to view and load previous perfor-mances. This information allows the system to create graphs for each metric (e.g.: Key-down) and also updates the historic performances of the user
• The on-line module, where users can see their performances in real time. When comparedwith the user’s previous records, one canz analyse if performance has increased (acting)or decreased. This module still allows the user to hear music from the previously createdrepository
• The Music Recommendation System module is a simple interface, from which users canchoose their current objectives at any moment (e.g.: to be able to relax for a creative task)and the system will recommend music to help with these objectives
5.2 O B J E C T I V E S
The main objective of this recommendation and monitoring system lies in the monitoring of theuser’s performance at work and the selection of the most appropriate style of music at a giventime. In order for the system to be implemented successfully, the following objectives were set:
• To understand the effects of different kinds of music on the user, while in the workplace,while performing regular tasks or in a similar environment.
44

5.3. Architecture
• The system will build a personalized model based on data collected from each user.
• Based on models for each user, the system must be able to suggest different types of musicfor different objectives (e.g. relaxing). Besides assigning an objective, the user can alsoassign a weight to Performance and Musical Preference. In other words, by placing ahigher weight on Performance, this will result in music that will contribute more to theuser’s activation, despite his preferences. On the other hand, music that is more in linewith the user’s taste r will be selected, despite less effective results being expected withregard to performance.
• To analyze user performance in a selected environment, and with the objectives defined bythe ambient manager, this system recommends a specific style of music (e.g. If there isa scheduled brainstorming session, the manager may decide to put on activating music inorder to stimulate ideas and actions).
5.3 A R C H I T E C T U R E
When designing a recommendation and monitoring system, one is confronted by some chal-lenges. One of these is: how the system has collected information from the users and determinestheir performance over time. Using this information, this system has to be able to recommend astyle of music to help improve or tone down the user’s performance (relaxing or stressing). Thereare many important variables that were worked through in order to be able to make recommenda-tions to the user. Indeed, different styles of music for each user may produce different results, forexample, listening to rock music is relaxing for some people, while for others it can be stressful.To meet these challenges, the platform was built in a logical and simple way, from the momentof data collection to the recommendation service.
Figure 17 illustrates the architecture used for the platform, where different parts of the platformare connected by a network. On the left side of the figure one represented one user interface,whose data was collected. This interface was developed by investigation carried out by theISLAB group, whom we integrated in this work. We opted for the development of the client(the computers used by the individuals in the environment) in C# using the KeyboardHook andMouseHook. These libraries allow access to all mouse events on any keyboard where the userperformed the same task.
This user interface (C#) connects to the system which we developed in this work. It suppliesthe user’s data in real time (keyboard and mouse) to the system, which contains a server (the
45

5.3. Architecture
Figure 17: Architecture of the Recommendation and Monitoring System.
central part of the Figure - Monitoring and Recommendation System). Our system stores thisinformation (it is received every x time) and, after receiving it, sends it to another server (MetricsService) to process. Metrics Service was developed by the investigation of the ISLAB group andis a service that awaits requests from users and can respond or only save/manage the information,it also calculates metrics through behavioral biometrics services. In real time, this Metrics Ser-vice processes the data and responds with an object of metrics (averages of the values obtainedthrough the user interface). In real time with the responses obtained at the Metrics Service, oursystem then stores and manages the data. This data is compared with the user’s history , and itis possible to show if this performance increases or decreases, it further generates graphs, wherethe progress of metrics over time is shown. Our system allows the user to upload his performanceand create a record (on offline mode). Data processing is equal to the real time of service.
46

5.3. Architecture
Our system was also created to enable music recommendation, and to help the user in hisobjectives (Recommendation Interface). Using a minimalist interface, the users are able to assigntheir objectives (these can be calm or active), indicating if there are important feelings afterlistening to the music and if the user has any music preferences. To assist recommendation andlink it to this information, an algorithm was created for this purpose, the user’s recorded profileis then able to recommend appropriate music/songs from the repository.
Finally, in order for a normal user to see his own performance over time, or so that the user cansee the music recommended by the system on any machine or anywhere else, the web interfacewas developed. It is still possible for an Ambient manager to control the workroom, if there isa scheduled brainstorming session, the manager may decide to put on activating music in orderto stimulate ideas and actions. A distributed and accessible system was thus created, and anycomputer can access our system through the Internet. This web interface communicates withthe Metrics service (which can be anywhere), every x time, and keeps updated information. Theavailable and developed interfaces in our system and web interface will be explained further on.
5.3.1 Communication
Since information must be shared, all the modules of the system mentioned in the previoussections have to be connected.. In order to monitor a user, it is initially necessary to observethe user and his behavior, and then transform the observed data into useful information for themonitoring context. For this purpose, we built a model based on the client-server, where theclient and server are separated by a network. It is important to realize that the Metrics servicecan be anywhere, and does not need to be on user’s computers, the idea is for it to be accessibleto any user through the Internet (server). The recommendation system and the user interfaceare usually on the user’s computer (localhost/client), but one can include our system on anothercomputer without the user. For the platform to work correctly, it is essential for the Metricsservice and our recommendation system to be running. However, behind this model there is adependence on Internet connection in order for the monitoring to be able to perform .
As can be seen in Figure 18, the Metrics service, our recommendation system and the userinterface, all need to work in real time to begin to collect data. The data collected in the userinterface (client) will be encrypted before sending it to the server. Using SSL (Secure SocketLayers), data will be encrypted and then sent to the server. The Data encryption is required for theregistration of all user input personal data, so that passwords or other such personal informationis protected and kept safe when collected. The communication between the interface and the
47
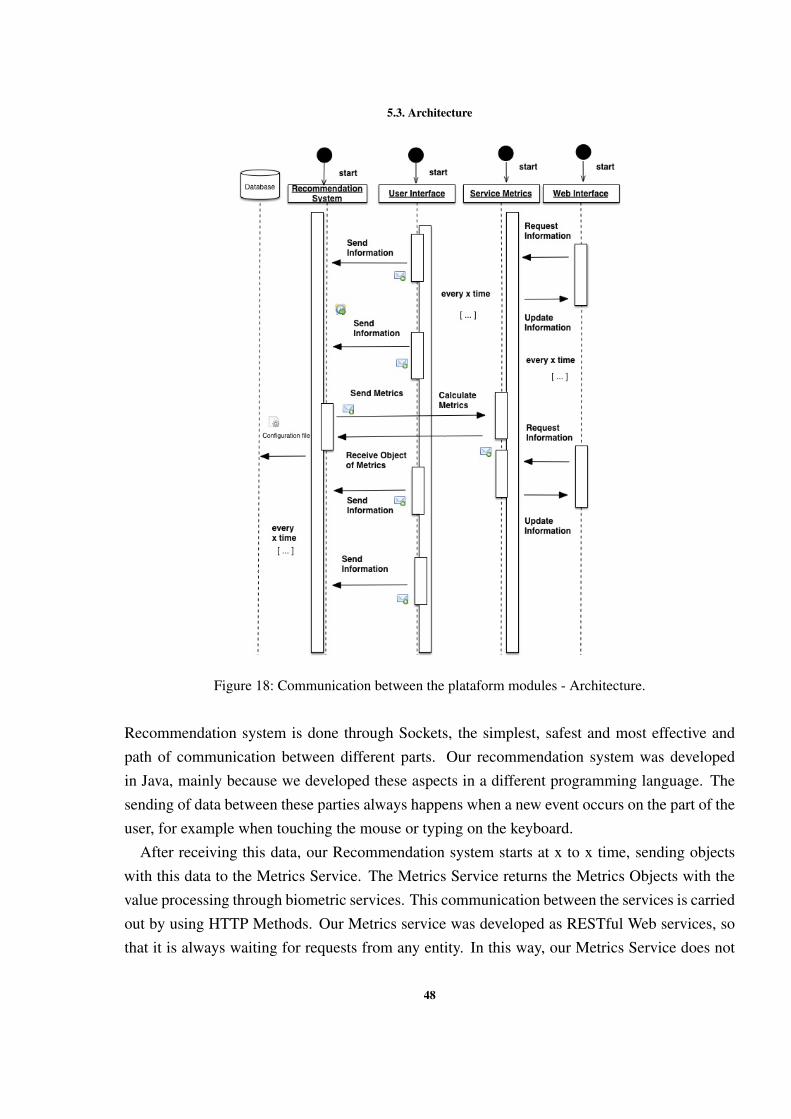
5.3. Architecture
Figure 18: Communication between the plataform modules - Architecture.
Recommendation system is done through Sockets, the simplest, safest and most effective andpath of communication between different parts. Our recommendation system was developedin Java, mainly because we developed these aspects in a different programming language. Thesending of data between these parties always happens when a new event occurs on the part of theuser, for example when touching the mouse or typing on the keyboard.
After receiving this data, our Recommendation system starts at x to x time, sending objectswith this data to the Metrics Service. The Metrics Service returns the Metrics Objects with thevalue processing through biometric services. This communication between the services is carriedout by using HTTP Methods. Our Metrics service was developed as RESTful Web services, sothat it is always waiting for requests from any entity. In this way, our Metrics Service does not
48

5.4. Recommendation and Monitoring System
need to be in the same physical location as the users and can be accessed by more than one. Thiswhole process of communication from the interface to the service is performed in real time.
Our recommendation system allows the users to upload their old performances and create theirrecord (Record of Performances). The communication is equal to real time, but one need not bein communication with the user interface. The recommendation system loads the file, cuts the fileand saves it into objects. After that, it is sent to the Metrics Service, which stores the responses.
As can also be observed in Figure 18, there is a web interface, which communicates in the sameway as the recommendation system communicates with the Metrics Service, by using HTTPMethods. The web interface will make requests for information and will update the page, makingit possible to visualize the environment in groups or for one particular user. All communication isundertaken in a simple and accessible manner, it is important to note that both the web interfaceand the Metrics Service can be accessed from anywhere.
5.4 R E C O M M E N DAT I O N A N D M O N I T O R I N G S Y S T E M
Figure 19: Menu - first interface seen by user.
In order to implement the Recommendation and monitoring system, some decisions weremade in terms of the representation of strategic information and information storage (as men-
49

5.4. Recommendation and Monitoring System
tioned in the previous sub- chapters). Our system was designed and built using minimal steps,so that the user has what he wants in a simple, logical and effective way. The system is fast toevaluate the user’s performance, when compared to his recorded performance or what kind ofmusic the user must hear to reach certain objectives. Through this simple interface, the user canchoose what to do with a simple press of the button. Through this menu shown, users have accessto three modules that will be explained in the following sub-chapters, in Figure 19.
5.4.1 Historic Performance
For this recommendation system to be able to recommend styles of music to the user and help himto achieve his objectives (e.g to relax), it has to learn more about the user, such as his previousperformances, in order to create a record for the user. It is thus essential for the user to perceive,through graphs and other information, if he has had a good performance throughout the day andalso try to understand what types of music affected his daily objectives.
Figure 20: Interface of Registered/Recorded Performance - first option from the Main Menu.
This module has a simple interface, as can be seen in Figure 20, in which a user can viewthe uploaded information processed by metrics with a few clicks. In the study performed inthis dissertation, and through interaction with the computer, users generate data files every day
50

5.4. Recommendation and Monitoring System
(during the morning or afternoon). These are processed by the Metrics Service, when we get themetrics to observe performance during this work. The system allows the user to upload thesefiles, which will then be processed and stored. The system can create a history of performancesand general performance. This overall performance is created by comparing all the performances,in particular the largest and smallest values of each metric. This overall performance will allowfor a point of reference, in order to compare data recorded for the user in real time.
To better understand this information simply and quickly, the system creates graphs where thevalues of the metrics (it increases or decreases) are presented over time. The interface presentsfour graphs with the records of the most important metrics over time, but also presents a tablewith the averages of all the metrics. When the user clicks over each metric, he is presented witha graph showing values for that metric over time.
It is important to remember that, when most of the metrics are presented in a line graph, ifthe line is going up, this does not mean that there is improved performance, such as the case ofthe Keydown metric. The highest value in Keydown Metric simply means that the user is takinglonger to write something. This aspect contributes to a decrease in performance .
This module is important for the creation of each user’s history. However, by observing thedata (data processed in metrics) from their days of work, users try to make a critical evaluation.Many questions arise, for example, if performance goes up or down during the day, if the userhas to have more breaks during working hours, if certain styles of music make the user subcon-sciously relax or help to improve similar aspects. All the data generated and processed by thismodule is important for the next module, this will be explained in the following sub-chapter.
5.4.2 Real Time Performance
Following on from the explanation of theRecorded Performance module, and what we can expectfrom this module, such as the overall performance of each user, in this subchapter it is importantto explain how the user can observe (in real time) his behaviour and realize if his performancehas risen or dropped.
In our daily lives, there are moments of stress and moments to relax. During our work, con-sciously or subconsciously, we decrease or increase our work rate. Depending on the task to beachieved, we sometimes need to relax (e.g. a meeting) or increase performance. One possibleway to achieve these objectives is to listen to certain music that can act as a stimulant or depres-sant. Through the interface, this module shows the user’s performance in real-time during the day.Using this information, the user can then proceed with an analysis, for example, if the method
51

5.4. Recommendation and Monitoring System
of work is suited to his daily objectives or, for example, if he needs more breaks throughout theday.
Figure 21: Interface of Real Time Performance - second option from the Main Menu.
When starting this module, a simple and fast interface is visible, and with few clicks one canquickly do what is intended. The interface presents two graphs: the graph on the left presents ametric that the user wants to view, and this graph changes when it receives new values from theuser (interface C#). The graph on the right shows the calculated values of the user’s performances.This chart will change the values calculated and, whenever the user clicks the performance buttonor every half hour, the system will update the values of the user’s performances.
This module was developed with the intention of running in real time, so that an internal serverwas created for this purpose. The buttons in the lower right corner of the interface, allow one tostart or shut down the server. A server only makes sense if users connect to it, then in this case,we consider that the user is our interface developed in C#, previously referred in this dissertation.Interface C# is a socket which connects to our server. The data received from this interface (user)is stored by our server and sent to the Metrics Service, it is subsequently processed and sentback to our server (identical to the Historic performance process). The user still has a buttonthat allows him to select the type of metric. He can change the graph on the left - by default itdisplays the values of metric KeyDown - to another type of metric, such as mouse speed.
52

5.4. Recommendation and Monitoring System
When the user starts the server, the system asks if he wants to hear the music/song. If theanswer is yes, it asks for the user to choose one type of cluster (previously mentioned in thisstudy ) from the repository, and then the styles of music he wants to hear. The sets of buttonsin the lower left corner of the interface, allow the user to control the music. Its functionality issimilar to a classic media player. Each cluster contains music of different styles and each clusteris ranked according to feelings. The recommendation system will suggest different music andtypes of clusters for each user.
The system must learn about the user and only the stored the data received by the Metricsservice is insufficient. The user needs to provide information for the system to know the user’stype of personality, what the effects of certain music/songs or some music styles are, from angerto relaxation. For some people, Cluster1 contains music, which produces a calming and relaxingeffect, while for others it has the reverse effect. For the five different clusters, and when beginningwith the use of this platform, the system recommends that each cluster be heard on different days(5 days), while always doing the same work. When the user has finished his task and stops thesystem (server), the system shows a quick questionnaire to fill out (if the user has not filled in thequestionnaire for that cluster).
The questionnaire that people answered in the study for this dissertation, is presented on thisinterface, Figure 22. Once has the user filled out the questionnaire, the system stores and pro-cesses this information. All this data will be weighed on the recommendation algorithm to sug-gest music or styles of music. After being saved on the system, the information generated inthis module will be crossed with the previously stored information (Historic Performance). Thisdata-crossing will create or update the user’s historical performance, as well as the data for eachcluster, relating to general performance. These questionnaires are based on the same principle asthe questionnaire filled in during the study at the end of each session.
Thus, this real-time monitoring module, together with the Music Recommendation system,creates a powerful tool which has the ability to learn about the user and suggest, depending onthe objectives. The next subchapter will explain the music/song recommendation model.
5.4.3 Recommendation System
One of the main objectives of this dissertation is to create a structure whose main objective is theselection of the most appropriate style of music at a given time. These recommendations will bebased on the user’s recorded/historical performance (created in the two modules described above)and the user’s music profile, which was built by using the questionnaires during the period of
53

5.4. Recommendation and Monitoring System
Figure 22: Questionnaires for users to fill out for each cluster.
learning the system. In order to be able to recommend, the system also has to know the user’sobjectives , for example if on a particular morning, at a specific time or at that very instant, theuser wants to relax for some reason. The user can determine his objectives through the interface,Figure 23, simply by assigning the weights in question (0-100) through the algorithm to thesystem, so that this is able to recommend music.
This Recommendation system has a repository of music, which was created during our study.The repository contains five clusters, each cluster is classified according to the feelings causedby the music. When new music is added to the repository, the system administrator will classifyit, providing the music with weights relating to each cluster. For example, cluster 2 is ranked asjoyful music and cluster 4 is ranked as being funny music, so that there are similarities betweenthe clusters. If song X belongs to cluster 2, it will have a greater weight in cluster 2, yet, it willalso be attributed a great weight in cluster 4, while the other cluster will be given a small orzero weight. This method of classification can be considered a limitation, and possible future
54

5.4. Recommendation and Monitoring System
Figure 23: Interface of Recommendation System - third option from the Main Menu.
work will be to solve it. The songs present in the repository were previously classified, as wasmentioned in the previous sub-chapter.
After this classification in our repository, the system must learn more details about the user.The questionnaires answered by the user provide di information, which helps to create a userprofile. From these profiles, we know how each individual feels about each type of music, howmuch they like it, how relaxing/ activating they find it or to which extent they would have pre-ferred to have carried out their activities without listening to this particular type of music. Asdemonstrated in this study, person X can feel relaxed when listening to music from cluster 1,while another person is extremely stressed by this style of music, proving that each person has adifferent personality in relation to music. Therefore, in order for the system to be able to suggest,it first has to learn what the user profile for that user is.
The recorded/Historic performances, the repository of music, the user profile and the abilityof the system to learn over time are all important features, but the system must know whatto recommend . To this end, users also provide their current objective by using a minimalistinterface. At any moment, the objective can be ‘to relax’ (e.g. when the user is involved ina creative task), ‘to activate’ (e.g. when the user needs to complete a given task quickly) or,regardless of performance issues, simply to listen to their favorite songs . Besides assigning anobjective, the user also assigns a weight to Performance and Musical Preference. That is, placinga bigger weight on Performance will result in songs that contribute more to the user’s activation,
55

5.4. Recommendation and Monitoring System
despite his preferences. On the other hand, songs that are more to the user’s taste will be selected,despite less effective results being expected in relation to performance. These variables, as wellas the weights assigned by the user, are used by optimization functions to attribute a score toeach Cluster, at any moment, normalized in the interval [0,1]. To prevent people from gettingtired of constantly listening to the same type of music, songs are then selected from all the fiveClusters on a frequency that is proportional to these scores (e.g. if Cluster 1 has twice the scoreof Cluster 2, songs from Cluster 1 will be selected with twice the probability).
This system also has the capacity to autonomously suggest, for example if the user’s perfor-mance has declined over time during the afternoon, it then suggests breaks or listening to a pre-ferred style of music to change this state. In future work, it may be possible to adapt the systemin order to try to understand other types of user behaviors in relation to stress and performancelevels.
5.4.4 Web Interface
The modules described above, have the ability of allowing the user to observe his own perfor-mance, thus evaluating himself. Taking this into consideration, a web interface was developed atan industrial level. This web interface will communicate with our Metrics Service (which con-tains the updated user infor- mation) and will collate and provide information about users, suchas their performances, the songs suggested, and so on.
It can do so at two different levels: the user-level (in which the system optimizes the musicalselection for a given user) and the group-level (in which it does so for a group of people). Theprocess is similar for both cases and the system is a distributed one. Each user interacts with aparticular computer, which monitors his performance and the client himself.
In this group-level case, a selection of background music was selected, a similar process wasused for the user-level. However, in this case,it is the ambient manager that determines theobjective for the environment. If there is a scheduled brainstorming session, the manager maydecide to put on activating music in order to stimulate ideas and actions. On the other hand, if theend of the day is approaching, the manager may decide to play more relaxing music as individualsare already tired and listening to activating music in this context may produce negative effects.
In the case of the user-level, if the user has a meeting at the end of the morning and observes,through the system, that his performance has dropped and feels increasingly stressed as a result,then he can determine by using the interface what music he wants to listen to in order to relax.Based on these objectives, the system crosses the data about the user and determines which style
56
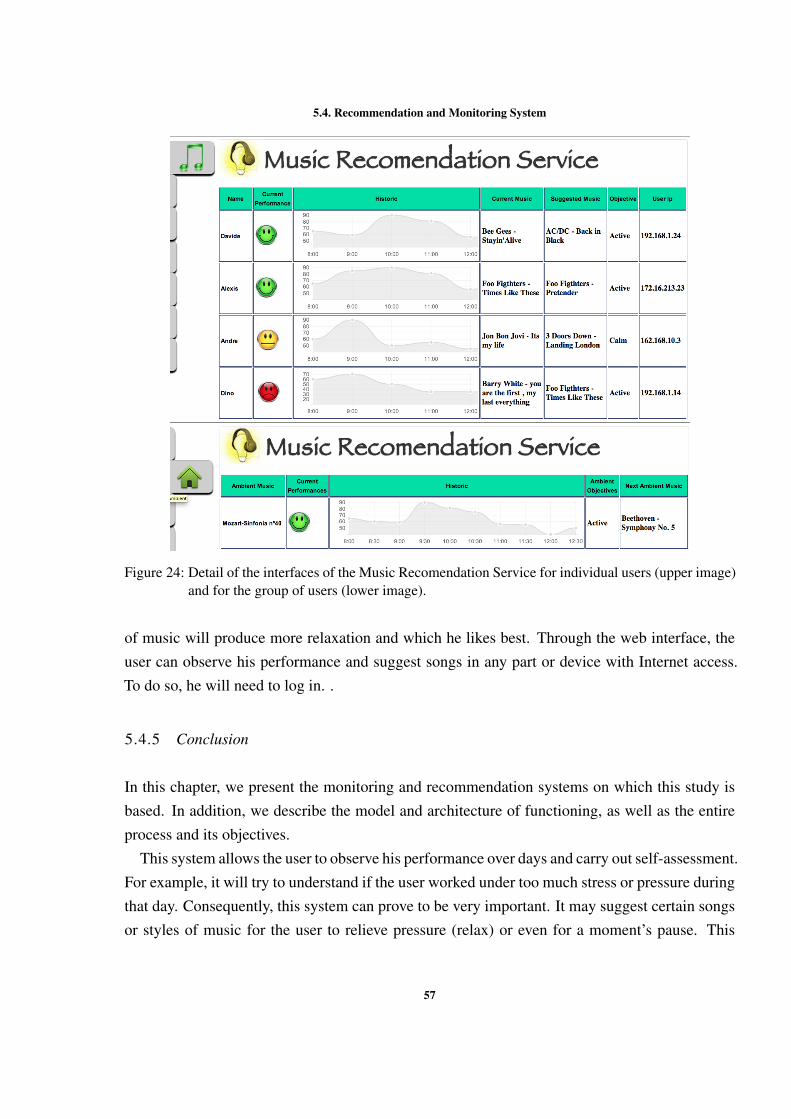
5.4. Recommendation and Monitoring System
Figure 24: Detail of the interfaces of the Music Recomendation Service for individual users (upper image)and for the group of users (lower image).
of music will produce more relaxation and which he likes best. Through the web interface, theuser can observe his performance and suggest songs in any part or device with Internet access.To do so, he will need to log in. .
5.4.5 Conclusion
In this chapter, we present the monitoring and recommendation systems on which this study isbased. In addition, we describe the model and architecture of functioning, as well as the entireprocess and its objectives.
This system allows the user to observe his performance over days and carry out self-assessment.For example, it will try to understand if the user worked under too much stress or pressure duringthat day. Consequently, this system can prove to be very important. It may suggest certain songsor styles of music for the user to relieve pressure (relax) or even for a moment’s pause. This
57

5.4. Recommendation and Monitoring System
system constantly learns and updates the user profile in terms of his performances (recorded/his-torical) and musical profile.
In future work on this platform, one could develop new techniques to try to understand other ofthe user’s habits, such as pausing during work, so that the system may suggest shorter or longerbreaks. The system will allow the user to introduce his music preferences in the repository and,after some sessions, it will automatically analyze the effects of this music on the user (possibleelimination of the job of the administrator, which evaluates the new music/song by cluster). An-other possible implementation is to create types of users, such as a profile. These profiles couldbe adapted to the user, such as a profile for meetings, a profile to animate, a profile to relax, andso on. For example, if the user has a meeting in half an hour, the profile changes to meeting, andthe system will then recommend music that will produce calmness.
58

6
C O N C L U S I O N S A N D F U T U R E W O R K
Stress and Fatigue, and their negative effects, are currently causing growing concern. Theseeffects generate an impact not only at personal or health levels, but also at social (e.g. ourreduced time for social and enjoyable activities) and economical ones (companies’ costs withabsenteeism and reduced productivity are on the rise). Given the current economic scenario,targeting the source of the problem (e.g. decreasing hours of work , imposing more favourablelegislation) may not be the most realistic or time-efficient solution. In that sense, alternativesshould be sought to minimize these negative effects.
In this dissertation, we looked at the possibility of using music to attenuate the negative effectsof stress, fatigue or other negative factors on the individual. Specifically, we analyzed how perfor-mance, measured in terms of the interaction between the mouse and keyboard, decreases alongthe day and how different types of music affect this phenomenon. The aim of creating a musicrecommendation system based on the user’s stress level and the user’s performance, through theuser’s interaction with the computer, was accomplished. Thereby, this work contributed with anew way to solve one of the greatest health and safety challenges that developed countries arefacing today. This system allows the user to analyze his potentially unhealthy behaviours for pos-sible personal reflection, it also learns the user’s personal musical preferences in order to improvethe efficiency of the recommendation mechanism. This work is important in our community inthat it obtains more user data in a simple way from various situations, which will improve andcustomize the ambient of intelligence (section 2.1).
We conclude that the relationship is a complex one, it involves variables other than the type ofmusic, it includes the individual’s objective at each moment, as well as his personal preferencesregarding music. The collected data in the experimental study was used to define optimizationfunctions that are used to maximize different aspects of this relationship: the selection of theuser’s favourite songs/music, the selection of the most active music for users or the selection ofmusic that calms them the most. My goals in this work are different when compared to other
59
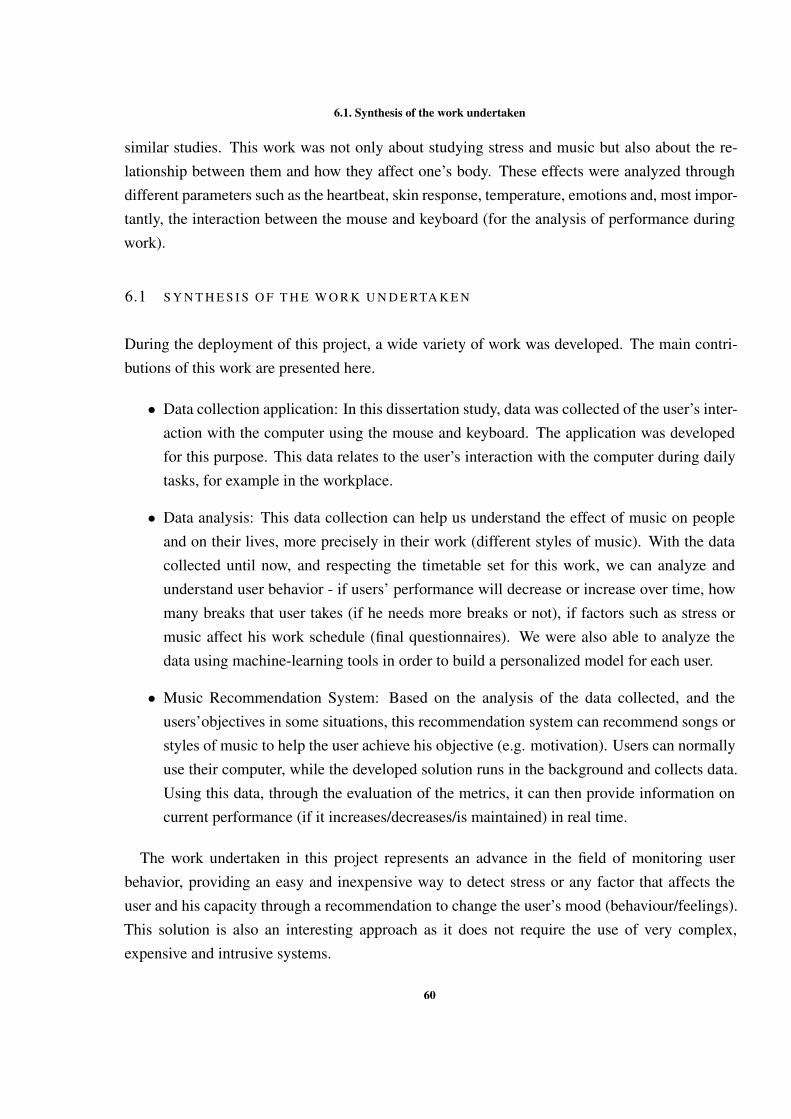
6.1. Synthesis of the work undertaken
similar studies. This work was not only about studying stress and music but also about the re-lationship between them and how they affect one’s body. These effects were analyzed throughdifferent parameters such as the heartbeat, skin response, temperature, emotions and, most impor-tantly, the interaction between the mouse and keyboard (for the analysis of performance duringwork).
6.1 S Y N T H E S I S O F T H E W O R K U N D E RTA K E N
During the deployment of this project, a wide variety of work was developed. The main contri-butions of this work are presented here.
• Data collection application: In this dissertation study, data was collected of the user’s inter-action with the computer using the mouse and keyboard. The application was developedfor this purpose. This data relates to the user’s interaction with the computer during dailytasks, for example in the workplace.
• Data analysis: This data collection can help us understand the effect of music on peopleand on their lives, more precisely in their work (different styles of music). With the datacollected until now, and respecting the timetable set for this work, we can analyze andunderstand user behavior - if users’ performance will decrease or increase over time, howmany breaks that user takes (if he needs more breaks or not), if factors such as stress ormusic affect his work schedule (final questionnaires). We were also able to analyze thedata using machine-learning tools in order to build a personalized model for each user.
• Music Recommendation System: Based on the analysis of the data collected, and theusers’objectives in some situations, this recommendation system can recommend songs orstyles of music to help the user achieve his objective (e.g. motivation). Users can normallyuse their computer, while the developed solution runs in the background and collects data.Using this data, through the evaluation of the metrics, it can then provide information oncurrent performance (if it increases/decreases/is maintained) in real time.
The work undertaken in this project represents an advance in the field of monitoring userbehavior, providing an easy and inexpensive way to detect stress or any factor that affects theuser and his capacity through a recommendation to change the user’s mood (behaviour/feelings).This solution is also an interesting approach as it does not require the use of very complex,expensive and intrusive systems.
60
6.2. Relevant Work
6.2 R E L E VA N T W O R K
The work developed and documented in this dissertation was integrated in the CAMCoF - Context-Aware Multimodal Communication Framework project which is taking place at the IntelligentSystems Laboratory (ISLab) at the University of Minho.
Part of the work presented in this dissertation was documented in the following publication,having been presented at the 8th International Symposium on Intelligent Distributed Computing.
da Costa, M., Carneiro, D., Dias, M., & Novais, P. (2015). How Musical Selection Impacts thePerformance of the Interaction with the Computer. In Intelligent Distributed Computing VIII,
Studies in Computational Intelligence, Volume 570, pp. 19-28. Springer InternationalPublishing. [9].
6.3 F U T U R E W O R K
The objectives of this work have been accomplished. However, some additional work must bedone in order to increase the accuracy and validity of the developed system.
In future work, we will address this problem in more detail, namely by including additionalvariables that can better shape the relationship between music, performance and fatigue and byanalysing different music classification mechanisms. This should be interesting, in order to provein a more conventional way that users can be affected by music, and that more sensors can beused to measure vital signs intrusively . These sensors could interact with this system, such asa mobile phone, which can already measure the heart beat without the user realizing it. Perhapsnew metrics and parameters could be studied, thus allowing for a more perfect detection of stress.
Finally, the study of advances in technologies, which occur continuously, as well as the possi-ble advantages that they could provide to this project should also be carried out.
61
B I B L I O G R A P H Y
[1] ALLMusic. Allmusic, 2014. URL http://www.allmusic.com/moods.
[2] Answer. Stressor, 2005. URL http://www.answers.com/topic/stressor#
cite_note-1.
[3] American Psychological Association. How stress affects your health, 2010. URL http:
//www.apa.org/helpcenter/stress-facts.pdf.
[4] American Psychological Association. Stress - different kinds of stress, 2010. URL http:
//www.apa.org/helpcenter/stress-kinds.aspx.
[5] M. Willing Slaves Bunting. How the Overwork Culture is Ruling Our Lives. HarperPeren-nial (June 6, 2005), 2005. ISBN 978-0007163724. Includes indexes.
[6] Davide Carneiro, Ricardo Costa, Paulo Novais, João Neves, 1963 Machado, José, and JoséNeves. Simulating and monitoring ambient assisted living. Master’s thesis, 2008.
[7] Davide Carneiro, José Carlos Castillo, Paulo Novais, Antonio Fernández-Caballero, andJosé Neves. Multimodal behavioral analysis for non-invasive stress detection. Expert Syst.
Appl., 39(18):13376–13389, 2012.
[8] Richard H Cox. Sport psychology : concepts and applications / Richard H. Cox. Dubuque,Iowa : W.C. Brown, 1985. ISBN 0697001415 (pbk.). Includes indexes.
[9] Mickael da Costa, Davide Carneiro, Marcelo Dias, and Paulo Novais. How musical se-lection impacts the performance of the interaction with the computer. In Intelligent Dis-
tributed Computing VIII - Proceedings of the 8th International Symposium on Intelligent
Distributed Computing, IDC 2014, Madrid, Spain, September 3-5, 2014, pages 19–28,2014. doi: 10.1007/978-3-319-10422-5_4. URL http://dx.doi.org/10.1007/
978-3-319-10422-5_4.
[10] Erickson J. B. Delbos R. G. Banks S. M Dembe, A. E. The impact of overtime and longwork hours on occupational injuries and illnesses: new evidence from the united states.Occupational and environmental medicine, 2005.
62

Bibliography
[11] A. S. Dolegui. The impact of listening to music on cognitive performance. 2013. URLhttp://www.studentpulse.com/a?id=762.
[12] M.S. Elizabeth Scott. Music and your body: How music affects us and why music therapypromotes health, 2011. URL http://stress.about.com/od/tensiontamers/
a/music_therapy.htm.
[13] Europe Agency for Safety and Health Work. Psychosocial risks and stress at work, June2010. URL https://osha.europa.eu/en/topics/stress.
[14] Europe Agency for Safety and Health Work. Stress - definition and symptoms, June2010. URL https://osha.europa.eu/en/topics/stress/definitions_
and_causes.
[15] Michael Haggstrom. Stress & performance, 2013. URL http://www.
calgarycounsellors.com/stress-management-counselling/.
[16] J. M Harrington. Health effects of shift work and extended hours of work. Occupational
and Environmental medicine, 2001.
[17] Natalie Reiss Ph.D. Harry Mills, Ph.D. and Ph.D. Mark Dombeck. Types of stressors(eustress vs. distress), 2014. URL http://www.sevencounties.org/poc/view_doc.php?type=doc&id=15644&cn=117.
[18] Downie J. S. Laurier C. Bay M. Ehmann A. F. Hu, X. The 2007 MIREX Audio Mood
Classification Task: Lessons Learned. ISMIR, September 2008.
[19] Makoto Iwanaga. Subjective and physiological responses to music stimuli controlled overactivity and preference. Joumal of Music Therapy., 1999.
[20] B. Arke K. Capeless B. Cooksey A. Steadman J. L. Burns, E. Labbé and C. Gonzales.The effects of different types of music on perceived and physiological measures of stress.Journal of music therapy, 39, Jan 2002.
[21] F. Scapolo J. Leijten K. Ducatel, M. Bogdanowicz and J. C. Burgelman. Scenarios forambient intelligence in 2010. Technical report,IST Advisory Group, 2001.
[22] Cyril Laurier and Perfecto Herrera. Audio music mood classification using support vectormachine. 2007.
63
Bibliography
[23] D.J. Levitin. This Is Your Brain on Music: The Science of a Human Obsession. DuttonBooks, 2006.
[24] Prem Melville and Vikas Sindhwani. Recommender systems.
[25] Renato Panda and R.P. Paiva. Music emotion classification: Dataset acquisition and com-parative analysis. In 15th International Conference on Digital Audio Effects – DAFx’12,n/a, 2012.
[26] André Pimenta. Mental games, June 2013. URL http://islab.di.uminho.pt/
apimenta/games/game1.php.
[27] Anand Rajaraman and Jeffrey David Ullman. Mining of Massive Datasets. CambridgeUniversity Press, New York, NY, USA, 2011. ISBN 1107015359, 9781107015357.
[28] R.J. Rienks, A. Nijholt, and D. Reidsma. Meetings and meeting support in ambient in-telligence. In Th.A. Vasilakos and W. Pedrycz, editors, Ambient Intelligence, Wireless Net-
working and Ubiquitous Computing, Mobile communication series, pages 359–378. ArtechHouse, Norwood, MA, USA, 2006. ISBN=1-58053-963-7.
[29] G. Riva, F. Vatalaro, F. Davide, and M. Alcañiz, editors. Ambient Intelligence - The evo-
lution of technology, communication and cognition towards the future of human-computer
interaction. OCSL Press, 2005.
[30] O. Dionne-Fournelle M. Crête S. Hébert, R. Béland and S. J. Lupien. Physiological stress re-sponse to video-game playing:the contribution of built-in music. Life sciences, 76:2371–80,2005.
[31] Ferris Jabr ScientificAmerican. Let’s get physical: The psychology of effective workoutmusic, March 2013. URL http://www.scientificamerican.com/article/
psychology-workout-music/.
[32] H. Selye. The stress of life. Number vol. 5. McGraw-Hill, 1956. URL http://books.
google.pt/books?id=DGFIAAAAMAAJ.
[33] Home Services. Smart home automation, 2013. URL http://derekakelly.com/
home-services/smart-home-automation/.
[34] Nandita Sharma and Tom Gedeon. Modeling a stress signal. Appl. Soft Comput., 14:53–61,2014.
64
Bibliography
[35] South Yorkshire-UK. Sheffield Hallam University, Sheffield. Effect of music-movementsynchrony on exercise oxygen consumption. THE JOURNAL OF SPORTS MEDICINE
AND PHYSICAL FITNESS, 2012.
[36] ANDRESSA MELINA BECKER DA SILVA. InfluÊncia da mÚsica na percepÇÃo deesforÇo. IBM Systems Journal.
[37] Cooper C. Fried Y.-Shirom A Sparks, K. The effects of hours of work on health:a meta-
analytic review. Number vol. 70. Journal of occupational and organizational psychology,1997.
[38] Gregory Ciotti Sparring Mind. How music affects your productivity, 2014. URL http:
//www.sparringmind.com/music-productivity/.
[39] D. B. Taylor. Subject responses to precategorized and sedative music. Journal of Music
Therapy, X, Jan 1973.
[40] Vilistus Mind Mirror 6 User Manual. Vilistus Biofeedback, United Kingdom, apr. 2013.
[41] Mark Weiser, Rich Gold, and John Seely Brown. The origins of ubiquitous computingresearch at parc in the late 1980s. IBM Systems Journal, 38(4):693–696, 1999.
[42] Spangenberg E. Yalch, R. Effects of store music on shopping behavior. Journal of Con-
sumer Marketing, 1990.
65