Alignment of Management Priorities, Manufacturing Flexibility and
24
Brazilian Journal of Operations & Production Management Volume 2, Number 1, 2005, pp. 5-0 5 Alignment of Management Priorities, Manufacturing Flexibility and Performance in Small Companies Rogerio Odivan Brito Serrão Industrial Engineering Department, PUC-Rio (Pontifical Catholic University of Rio de Janeiro), Rio de Janeiro, RJ, Brazil E-mail: [email protected] Paulo Roberto Tavares Dalcol Industrial Engineering Department, PUC-Rio (Pontifical Catholic University of Rio de Janeiro), Rio de Janeiro, RJ, Brazil E-mail: [email protected] Abstract Manufacturing flexibility can be used to achieve competitive advantage. Since flexibility is a relative concept, the level of required flexibility is defined by the market, i.e., it is defined by competitors and competitive environment. An important characteristic of manufacturing flexibility is its multidimensionality (dimensions and elements). Manufacturing flexibility has to be analyzed from the point of view of the dynamics of the relationships among its dimensions and the effective response a company has to give to all demands from its competitive marketplace. Depending on the management priorities, some manufacturing flexibility dimensions can be more emphasized and used as a competitive weapon to improve performance. This paper discusses the alignment (meaning the coherence between what is perceived and what is used) of actual manufacturing flexibility, considering the scope and achievability factors of five flexibility dimensions, and important aspects of management priorities and manufacturing performance based on a literature review and on a field work involving five small companies. Some related patterns are identified and show the managers’ perspective about these questions in the manufacturing flexibility context. Keywords: manufacturing flexibility, management priorities, small companies, manufacturing performance Introduction Manufacturing flexibility can be defined as an ability (Slack, 1992; Upton, 1994; D’Souza and Williams, 2000; Frazelle, 1986) or capability (Golden and Powell, 2000;
Transcript of Alignment of Management Priorities, Manufacturing Flexibility and
Brazilian Journal of Operations & Production ManagementVolume 2, Number 1, 2005, pp. 5�-�0
5�
Alignment of Management Priorities, Manufacturing Flexibility and Performance in Small Companies
Rogerio Odivan Brito SerrãoIndustrial Engineering Department, PUC-Rio (Pontifical Catholic University of Rio de Janeiro), Rio de Janeiro, RJ, Brazil E-mail: [email protected]
Paulo Roberto Tavares DalcolIndustrial Engineering Department, PUC-Rio (Pontifical Catholic University of Rio de Janeiro), Rio de Janeiro, RJ, Brazil E-mail: [email protected]
AbstractManufacturing flexibility can be used to achieve competitive advantage. Since
flexibility is a relative concept, the level of required flexibility is defined by the market, i.e., it is defined by competitors and competitive environment. An important characteristic of manufacturing flexibility is its multidimensionality (dimensions and elements). Manufacturing flexibility has to be analyzed from the point of view of the dynamics of the relationships among its dimensions and the effective response a company has to give to all demands from its competitive marketplace. Depending on the management priorities, some manufacturing flexibility dimensions can be more emphasized and used as a competitive weapon to improve performance. This paper discusses the alignment (meaning the coherence between what is perceived and what is used) of actual manufacturing flexibility, considering the scope and achievability factors of five flexibility dimensions, and important aspects of management priorities and manufacturing performance based on a literature review and on a field work involving five small companies. Some related patterns are identified and show the managers’ perspective about these questions in the manufacturing flexibility context.
Keywords: manufacturing flexibility, management priorities, small companies, manufacturing performance
IntroductionManufacturing flexibility can be defined as an ability (Slack, 1992; Upton, 1994;
D’Souza and Williams, 2000; Frazelle, 1986) or capability (Golden and Powell, 2000;
Brazilian Journal of Operations & Production ManagementVolume 2, Number 1, 2005, pp. 5�-�0
5�
Zelenovic, 1982) that an organization has to change (Slack, 1992; Upton, 1994) or react when dealing with environmental changes, considering the time, cost, and effort involved (Upton, 1994).
In the manufacturing strategy context, flexibility has been studied as a factor that influences both the strategies and the performance of a firm (examples of recent studies are Kathuria, 2000; Das, 2001; Chang et al., 2003; Pagell and Krause, 2004; Dreyer and Gronhaug, 2004). When flexibility is associated with another source of competitive advantage (e.g. time, cost, quality) its relationships and trade-offs are mentioned as subjects for further studies. The influence of manufacturing flexibility on performance is significant to the competitiveness of a firm.
Several small companies have viewed new opportunities for insertion, growth and expansion in their competitive environment mainly due to the intense process of industrial restructuring that took place in large companies. However, one can notice that if business opportunities are increasing for small companies, requirements for them to remain competitive also increase, while many uncertainties that previously applied only to large companies are being transferred to them. Also, the poor availability of resources and the difficulties in developing new technologies or accessing existing ones lead small companies to search for efficient means to manage their available resources.
Such aspects suggest that small companies should necessarily be more prepared to remain active in the industry. In this sense, manufacturing flexibility can be a key component in competitive advantage for such companies. However, this possibility must be carefully studied, because the adaptive/reactive position of small companies could cause a differentiation in their flexibility requirements, usually making them more intensive in certain flexibility dimensions than in others.
The objective of this study is to analyze the alignment, i.e. the coherence between what is perceived and what is used, between actual manufacturing flexibility considering the scope and achievability of five flexibility dimensions and important aspects of management priorities and manufacturing performance based on a literature review and on a field work involving five small companies. Some related patterns are identified considering the managers’ perspective regarding these aspects in the manufacturing flexibility context.
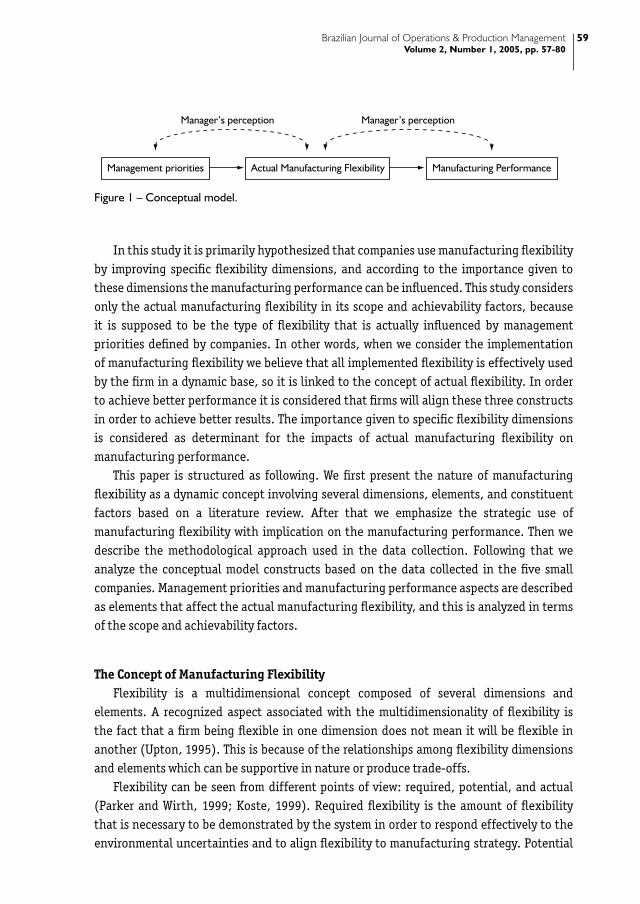
The following conceptual model (Figure 1) shows the linkages among the variables. It will be used to examine general aspects of the alignment of actual manufacturing flexibility (according to the importance given to certain flexibility dimensions) with several management priorities and manufacturing performance aspects. Our analysis is based on the managers’ perception and considers the coherence between what is perceived and what is used in order to assess the alignment among these constructs.
Brazilian Journal of Operations & Production ManagementVolume 2, Number 1, 2005, pp. 5�-�0
5�
In this study it is primarily hypothesized that companies use manufacturing flexibility by improving specific flexibility dimensions, and according to the importance given to these dimensions the manufacturing performance can be influenced. This study considers only the actual manufacturing flexibility in its scope and achievability factors, because it is supposed to be the type of flexibility that is actually influenced by management priorities defined by companies. In other words, when we consider the implementation of manufacturing flexibility we believe that all implemented flexibility is effectively used by the firm in a dynamic base, so it is linked to the concept of actual flexibility. In order to achieve better performance it is considered that firms will align these three constructs in order to achieve better results. The importance given to specific flexibility dimensions is considered as determinant for the impacts of actual manufacturing flexibility on manufacturing performance.
This paper is structured as following. We first present the nature of manufacturing flexibility as a dynamic concept involving several dimensions, elements, and constituent factors based on a literature review. After that we emphasize the strategic use of manufacturing flexibility with implication on the manufacturing performance. Then we describe the methodological approach used in the data collection. Following that we analyze the conceptual model constructs based on the data collected in the five small companies. Management priorities and manufacturing performance aspects are described as elements that affect the actual manufacturing flexibility, and this is analyzed in terms of the scope and achievability factors.
The Concept of Manufacturing Flexibility Flexibility is a multidimensional concept composed of several dimensions and
elements. A recognized aspect associated with the multidimensionality of flexibility is the fact that a firm being flexible in one dimension does not mean it will be flexible in another (Upton, 1995). This is because of the relationships among flexibility dimensions and elements which can be supportive in nature or produce trade-offs.
Flexibility can be seen from different points of view: required, potential, and actual (Parker and Wirth, 1999; Koste, 1999). Required flexibility is the amount of flexibility that is necessary to be demonstrated by the system in order to respond effectively to the environmental uncertainties and to align flexibility to manufacturing strategy. Potential
Manager’s perception Manager’s perception
Management priorities Manufacturing PerformanceActual Manufacturing Flexibility
Figure 1 – Conceptual model.
Brazilian Journal of Operations & Production ManagementVolume 2, Number 1, 2005, pp. 5�-�0
�0
flexibility is related to the amount of flexibility that a system can potentially achieve to be used. Usually, potential flexibility can be associated to machinery capacity, worker skills, etc. Actual flexibility is the amount of flexibility that the production system has actually used or demonstrated by the time it is measured. Actual flexibility can be improved by using the potential flexibility properly.
Flexibility is dynamic or static depending on the uncertainties in the competitive environment (Hyun and Ahn, 1992). The static aspect of flexibility usually corresponds to the process technology, and the capacity of a manufacturing system in dealing with uncertainty is defined according to fixed product and production structure. As a result, in a changing context, static flexibility is less efficient, except when, for example, Advanced Manufacturing Technology (AMT) is well implemented. On the other hand, the dynamic aspect of flexibility can deal with frequent changes in the competitive environment and is related to the capacity a system has to deal with variation in a non-stationary environment. This dynamics inserts the concept of learning and understanding level of a production system into the flexibility nature. Thus, continuous incremental improvements and knowledge acquisition are some practices associated with the concept of dynamic flexibility and represent a differentiation from the concept of static flexibility.
Also, flexibility can be internal or external (Upton, 1994). Internal flexibility represents the set of capabilities and operation strategies that a company has to respond to environment uncertain (what can be done). External flexibility is a source of competitive advantage that can be seen in a particular context (what can be seen by the marketplace). It corresponds to the different ways a company can respond to, for example, variations in aggregate demand for product, frequent demand for customization, and opportunities to reach market share by improving product mix.
Flexibility Dimensions and ElementsSeveral studies on manufacturing flexibility have been directed towards conceptual
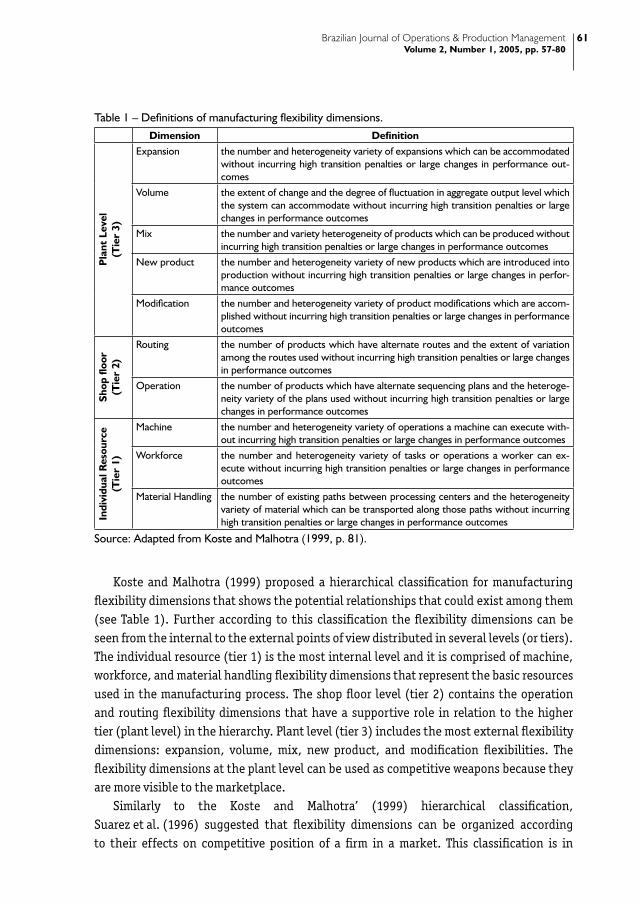
approaches and classifications of flexibility dimensions, such as those by Gerwin (1987), Gupta and Goyal (1989), Shewchuk and Moodie (1998), Koste and Malhotra (1999), and D’Souza and Williams (2000). Among them, the work by Koste and Malhotra (1999) is worth mentioning for their mapping of several definitions found in the literature and the composition of ten dimensions that, according to the authors, are the most important and commonly noted in researches, which represent a consensus in the diverse points of view they listed. Such ten dimensions are flexibilities related to: machine, workforce, material handling, routing, operation, expansion, volume, mix, new products and product modifications. These dimensions are defined in Table 1.
Brazilian Journal of Operations & Production ManagementVolume 2, Number 1, 2005, pp. 5�-�0
�1
Koste and Malhotra (1999) proposed a hierarchical classification for manufacturing flexibility dimensions that shows the potential relationships that could exist among them (see Table 1). Further according to this classification the flexibility dimensions can be seen from the internal to the external points of view distributed in several levels (or tiers). The individual resource (tier 1) is the most internal level and it is comprised of machine, workforce, and material handling flexibility dimensions that represent the basic resources used in the manufacturing process. The shop floor level (tier 2) contains the operation and routing flexibility dimensions that have a supportive role in relation to the higher tier (plant level) in the hierarchy. Plant level (tier 3) includes the most external flexibility dimensions: expansion, volume, mix, new product, and modification flexibilities. The flexibility dimensions at the plant level can be used as competitive weapons because they are more visible to the marketplace.
Similarly to the Koste and Malhotra’ (1999) hierarchical classification, Suarez et al. (1996) suggested that flexibility dimensions can be organized according to their effects on competitive position of a firm in a market. This classification is in
Table 1 – Definitions of manufacturing flexibility dimensions.Dimension Definition
Pla
nt L
evel
(Tie
r �)
Expansion the number and heterogeneity variety of expansions which can be accommodated without incurring high transition penalties or large changes in performance out-comes
Volume the extent of change and the degree of fluctuation in aggregate output level which the system can accommodate without incurring high transition penalties or large changes in performance outcomes
Mix the number and variety heterogeneity of products which can be produced without incurring high transition penalties or large changes in performance outcomes
New product the number and heterogeneity variety of new products which are introduced into production without incurring high transition penalties or large changes in perfor-mance outcomes
Modification the number and heterogeneity variety of product modifications which are accom-plished without incurring high transition penalties or large changes in performance outcomes
Shop
floo
r (T
ier
2)
Routing the number of products which have alternate routes and the extent of variation among the routes used without incurring high transition penalties or large changes in performance outcomes
Operation the number of products which have alternate sequencing plans and the heteroge-neity variety of the plans used without incurring high transition penalties or large changes in performance outcomes
Indi
vidu
al R
esou
rce
(Tie
r 1)
Machine the number and heterogeneity variety of operations a machine can execute with-out incurring high transition penalties or large changes in performance outcomes
Workforce the number and heterogeneity variety of tasks or operations a worker can ex-ecute without incurring high transition penalties or large changes in performance outcomes
Material Handling the number of existing paths between processing centers and the heterogeneity variety of material which can be transported along those paths without incurring high transition penalties or large changes in performance outcomes
Source: Adapted from Koste and Malhotra (1999, p. 81).
Brazilian Journal of Operations & Production ManagementVolume 2, Number 1, 2005, pp. 5�-�0
�2
accordance with the perception of these dimensions by the customers. They identify two main groups: “first-order” flexibilities and “lower-order” flexibilities. According to them, “first-order” flexibilities are those that directly affect the competitive position of a firm and are represented by dimensions that can be perceived and clearly interpreted by customers (e.g. mix, new product, and volume). “Lower-order” flexibilities are those that have their final competitive effect expressed through one of the first-order flexibilities.
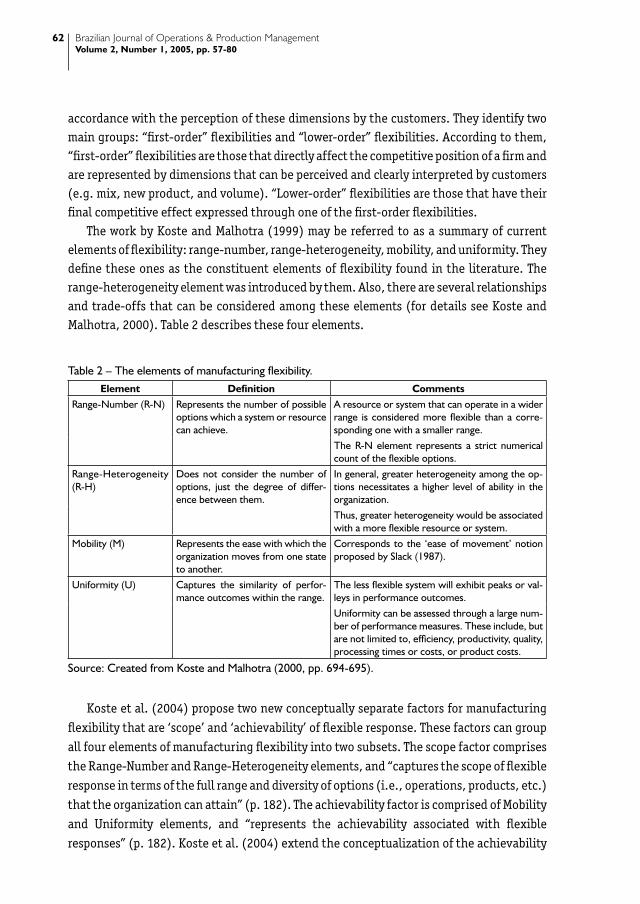
The work by Koste and Malhotra (1999) may be referred to as a summary of current elements of flexibility: range-number, range-heterogeneity, mobility, and uniformity. They define these ones as the constituent elements of flexibility found in the literature. The range-heterogeneity element was introduced by them. Also, there are several relationships and trade-offs that can be considered among these elements (for details see Koste and Malhotra, 2000). Table 2 describes these four elements.
Table 2 – The elements of manufacturing flexibility.Element Definition Comments
Range-Number (R-N) Represents the number of possible options which a system or resource can achieve.
A resource or system that can operate in a wider range is considered more flexible than a corre-sponding one with a smaller range.The R-N element represents a strict numerical count of the flexible options.
Range-Heterogeneity (R-H)
Does not consider the number of options, just the degree of differ-ence between them.
In general, greater heterogeneity among the op-tions necessitates a higher level of ability in the organization.Thus, greater heterogeneity would be associated with a more flexible resource or system.
Mobility (M) Represents the ease with which the organization moves from one state to another.
Corresponds to the ‘ease of movement’ notion proposed by Slack (1987).
Uniformity (U) Captures the similarity of perfor-mance outcomes within the range.
The less flexible system will exhibit peaks or val-leys in performance outcomes.Uniformity can be assessed through a large num-ber of performance measures. These include, but are not limited to, efficiency, productivity, quality, processing times or costs, or product costs.
Source: Created from Koste and Malhotra (2000, pp. 694-695).
Koste et al. (2004) propose two new conceptually separate factors for manufacturing
flexibility that are ‘scope’ and ‘achievability’ of flexible response. These factors can group
all four elements of manufacturing flexibility into two subsets. The scope factor comprises
the Range-Number and Range-Heterogeneity elements, and “captures the scope of flexible
response in terms of the full range and diversity of options (i.e., operations, products, etc.)
that the organization can attain” (p. 182). The achievability factor is comprised of Mobility
and Uniformity elements, and “represents the achievability associated with flexible
responses” (p. 182). Koste et al. (2004) extend the conceptualization of the achievability
Brazilian Journal of Operations & Production ManagementVolume 2, Number 1, 2005, pp. 5�-�0
��
factor saying that “it captures the short-term (transient) and long-term (duration)
penalties that the organization incurs in invoking the flexible response” (p. 182). These
factors will be used in this paper to describe the flexibility dimensions in the five small
companies and compare their levels of flexible response.
Also, it is clear that in terms of competitive advantage the main set of dimensions to
be considered in a manufacturing strategy is the one that is usually better perceived by
customers, i.e., external flexibility (plant level). Internal flexibility still is important and
can be seeing as support for the external one. This paper focused on three external flexibility
dimensions (mix, new product, and modification) because they are directly related to a
firm’s competitiveness (Chang, 2003), and on two internal dimensions (workforce and
machine). Since actual flexibility is the main subject of empirical research (Koste, 1999)
this study also focus on it.
In the following sections we describe the methodological approach for the field study,
and the analysis of the alignment of management priorities, manufacturing performance,
and actual manufacturing flexibility according to the managers’ perspective.
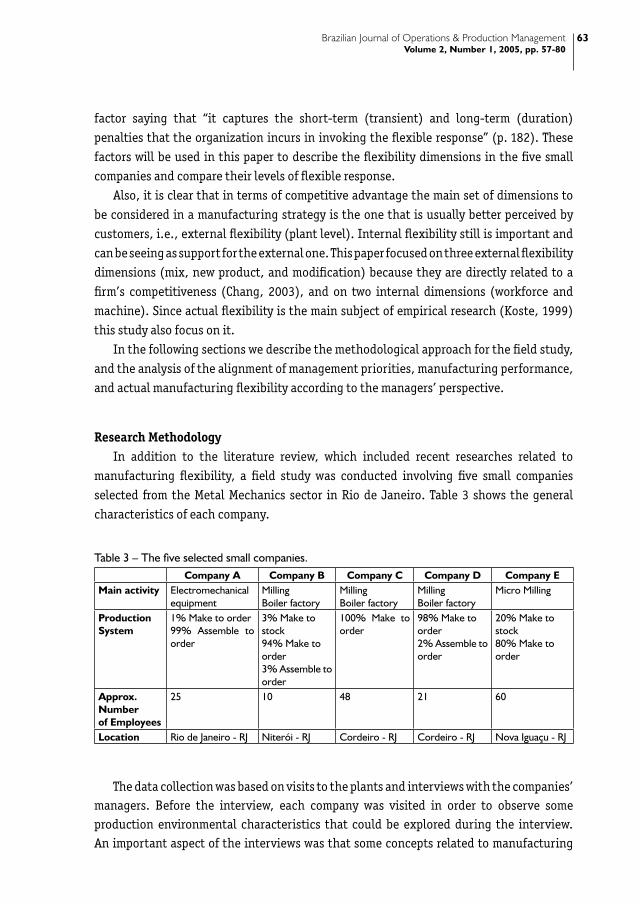
Research MethodologyIn addition to the literature review, which included recent researches related to
manufacturing flexibility, a field study was conducted involving five small companies
selected from the Metal Mechanics sector in Rio de Janeiro. Table 3 shows the general
characteristics of each company.
Table 3 – The five selected small companies.Company A Company B Company C Company D Company E
Main activity Electromechanicalequipment
MillingBoiler factory
MillingBoiler factory
MillingBoiler factory
Micro Milling
ProductionSystem
1% Make to order99% Assemble to order
3% Make tostock94% Make to order3% Assemble to order
100% Make to order
98% Make to order2% Assemble to order
20% Make to stock80% Make to order
Approx.Numberof Employees
25 10 48 21 60
Location Rio de Janeiro - RJ Niterói - RJ Cordeiro - RJ Cordeiro - RJ Nova Iguaçu - RJ
The data collection was based on visits to the plants and interviews with the companies’ managers. Before the interview, each company was visited in order to observe some production environmental characteristics that could be explored during the interview. An important aspect of the interviews was that some concepts related to manufacturing
Brazilian Journal of Operations & Production ManagementVolume 2, Number 1, 2005, pp. 5�-�0
��
flexibility were previously clarified in order to avoid any misunderstanding or personal interpretation about them that could be divergent (e.g. definitions to manufacturing flexibility dimensions).
For the data presented in this study, we used a structured questionnaire to obtain general information about the management priorities, the importance given to ten dimensions of manufacturing flexibility, and the implementation of main flexibility dimensions according to the managers’ perception. The questionnaire was adapted from the one used by Koste (1999), and some new items were included. The grades use 5-points and 7-points Likert scales. Figure 2 to Figure 9 use 5-points scale that stands for: 1) not important; 2) of some importance; 3) important; 4) very important; and 5) extremely important. Table 5 to Table 10 use 7-points scale that stands for: 1) strongly disagree; 2) moderately disagree; 3) slightly disagree; 4) neither agree nor disagree; 5) slightly agree; 6) moderately agree; and 7) strongly agree.
Management Priorities in the CompaniesConcerning management priorities related to production, some positioning definitions
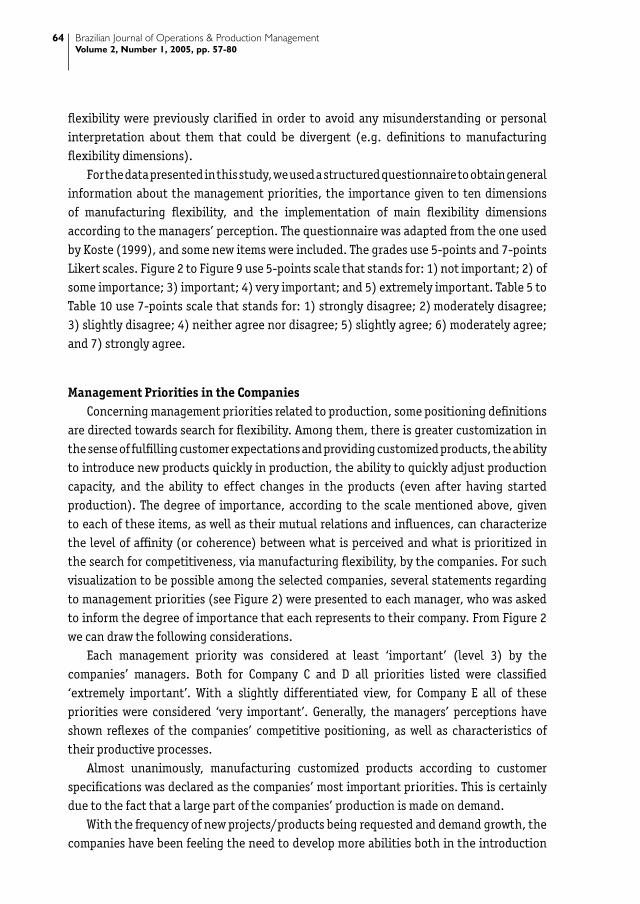
are directed towards search for flexibility. Among them, there is greater customization in the sense of fulfilling customer expectations and providing customized products, the ability to introduce new products quickly in production, the ability to quickly adjust production capacity, and the ability to effect changes in the products (even after having started production). The degree of importance, according to the scale mentioned above, given to each of these items, as well as their mutual relations and influences, can characterize the level of affinity (or coherence) between what is perceived and what is prioritized in the search for competitiveness, via manufacturing flexibility, by the companies. For such visualization to be possible among the selected companies, several statements regarding to management priorities (see Figure 2) were presented to each manager, who was asked to inform the degree of importance that each represents to their company. From Figure 2 we can draw the following considerations.
Each management priority was considered at least ‘important’ (level 3) by the companies’ managers. Both for Company C and D all priorities listed were classified ‘extremely important’. With a slightly differentiated view, for Company E all of these priorities were considered ‘very important’. Generally, the managers’ perceptions have shown reflexes of the companies’ competitive positioning, as well as characteristics of their productive processes.
Almost unanimously, manufacturing customized products according to customer specifications was declared as the companies’ most important priorities. This is certainly due to the fact that a large part of the companies’ production is made on demand.
With the frequency of new projects/products being requested and demand growth, the companies have been feeling the need to develop more abilities both in the introduction
Brazilian Journal of Operations & Production ManagementVolume 2, Number 1, 2005, pp. 5�-�0
�5
of new products into production and in the quick adjustment of capacities. This can be
observed with the similarity of the graphs that represent these two management priorities
in Figure 2.
The analysis from Figure 2 shows that the companies are interested in all management
priorities related to manufacturing flexibility. It is an important result that shows
managers interested in remaining competitive in dealing with several demands created
by the marketplace. Although it is quite important for being aligned with manufacturing
flexibility, the managers have to guarantee that their production systems can effectively
and efficiently respond to these demands, so that they can use flexibility in a competitive
manner. The high levels attributed to the management priorities represent an important
aspect in searching for competitiveness via manufacturing flexibility.
Manufacturing Performance in the CompaniesManufacturing performance can be assessed in many different points of view.
For example, Das (2001) used a scale based on dimensions of cost, quality, delivery,
manufacturing cycle time, customization responsiveness and new product introduction.
1 2 3 4 5
Ability to make design changes in theproducts after production has started
Ability to quickly adjust capacitywithin a short time period
Ability to quickly introduce newproducts into production
Customazing product to customerspecification
Importance Level
Company A
Company B
Company C
Company D
Company E
Figure 2 – Degree of importance of diverse management priorities in the production.
Brazilian Journal of Operations & Production ManagementVolume 2, Number 1, 2005, pp. 5�-�0
��
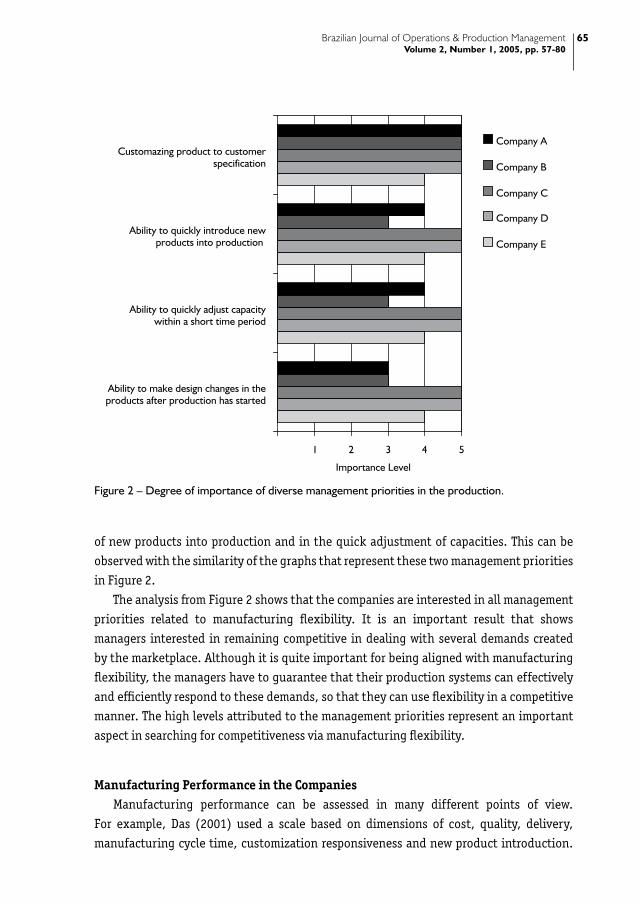
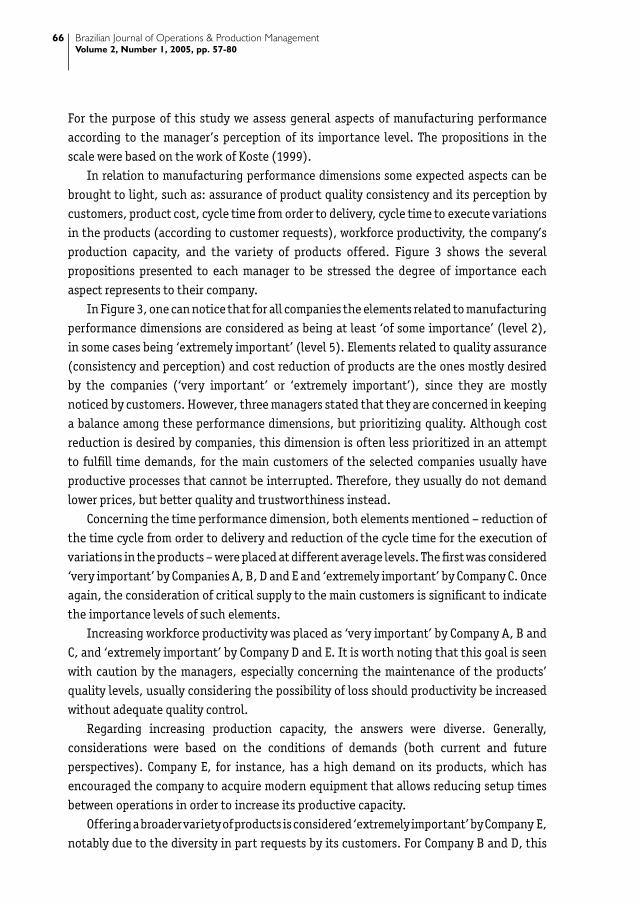
For the purpose of this study we assess general aspects of manufacturing performance
according to the manager’s perception of its importance level. The propositions in the
scale were based on the work of Koste (1999).
In relation to manufacturing performance dimensions some expected aspects can be
brought to light, such as: assurance of product quality consistency and its perception by
customers, product cost, cycle time from order to delivery, cycle time to execute variations
in the products (according to customer requests), workforce productivity, the company’s
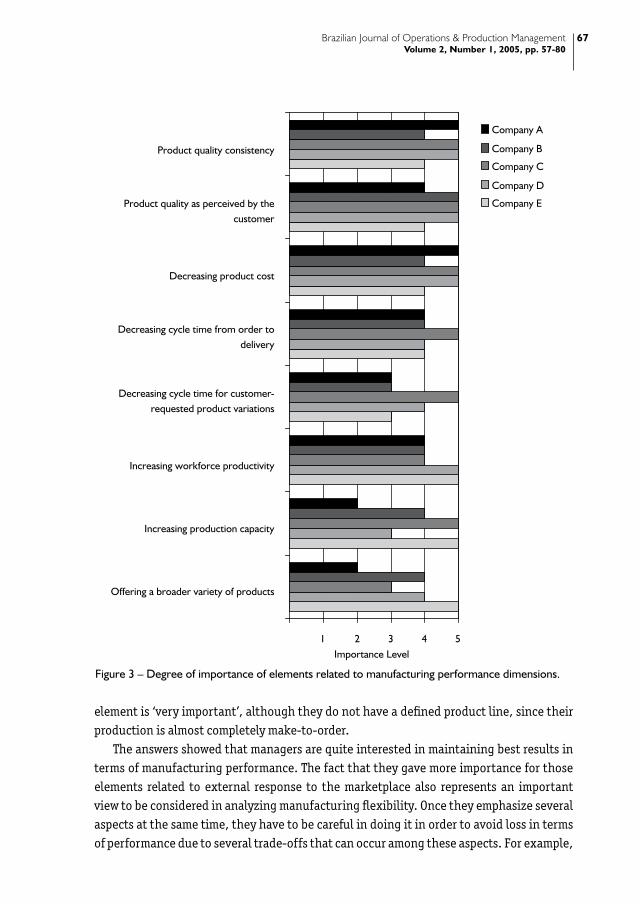
production capacity, and the variety of products offered. Figure 3 shows the several
propositions presented to each manager to be stressed the degree of importance each
aspect represents to their company.
In Figure 3, one can notice that for all companies the elements related to manufacturing
performance dimensions are considered as being at least ‘of some importance’ (level 2),
in some cases being ‘extremely important’ (level 5). Elements related to quality assurance
(consistency and perception) and cost reduction of products are the ones mostly desired
by the companies (‘very important’ or ‘extremely important’), since they are mostly
noticed by customers. However, three managers stated that they are concerned in keeping
a balance among these performance dimensions, but prioritizing quality. Although cost
reduction is desired by companies, this dimension is often less prioritized in an attempt
to fulfill time demands, for the main customers of the selected companies usually have
productive processes that cannot be interrupted. Therefore, they usually do not demand
lower prices, but better quality and trustworthiness instead.
Concerning the time performance dimension, both elements mentioned – reduction of
the time cycle from order to delivery and reduction of the cycle time for the execution of
variations in the products – were placed at different average levels. The first was considered
‘very important’ by Companies A, B, D and E and ‘extremely important’ by Company C. Once
again, the consideration of critical supply to the main customers is significant to indicate
the importance levels of such elements.
Increasing workforce productivity was placed as ‘very important’ by Company A, B and
C, and ‘extremely important’ by Company D and E. It is worth noting that this goal is seen
with caution by the managers, especially concerning the maintenance of the products’
quality levels, usually considering the possibility of loss should productivity be increased
without adequate quality control.
Regarding increasing production capacity, the answers were diverse. Generally,
considerations were based on the conditions of demands (both current and future
perspectives). Company E, for instance, has a high demand on its products, which has
encouraged the company to acquire modern equipment that allows reducing setup times
between operations in order to increase its productive capacity.
Offering a broader variety of products is considered ‘extremely important’ by Company E,
notably due to the diversity in part requests by its customers. For Company B and D, this
Brazilian Journal of Operations & Production ManagementVolume 2, Number 1, 2005, pp. 5�-�0
��
element is ‘very important’, although they do not have a defined product line, since their production is almost completely make-to-order.
The answers showed that managers are quite interested in maintaining best results in terms of manufacturing performance. The fact that they gave more importance for those elements related to external response to the marketplace also represents an important view to be considered in analyzing manufacturing flexibility. Once they emphasize several aspects at the same time, they have to be careful in doing it in order to avoid loss in terms of performance due to several trade-offs that can occur among these aspects. For example,
1 2 3 4 5
Offering a broader variety of products
Increasing production capacity
Increasing workforce productivity
Decreasing cycle time for customer-requested product variations
Decreasing cycle time from order todelivery
Decreasing product cost
Product quality as perceived by thecustomer
Product quality consistency
Importance Level
Company A
Company B
Company C
Company D
Company E
Figure 3 – Degree of importance of elements related to manufacturing performance dimensions.
Brazilian Journal of Operations & Production ManagementVolume 2, Number 1, 2005, pp. 5�-�0
��
since they highly emphasized the importance of quality aspects they can incur in a trade-offs between quality, cost, and flexibility, i.e., while they emphasize higher levels of quality it can be hard to ensure higher levels of flexibility without increasing costs.
The Implementation of Manufacturing Flexibility DimensionsTo verify if the companies are actually acquiring flexibility and improving their
manufacturing performance, we can analyze first the importance given to several flexibility dimensions, and finally their effective use of such dimensions.
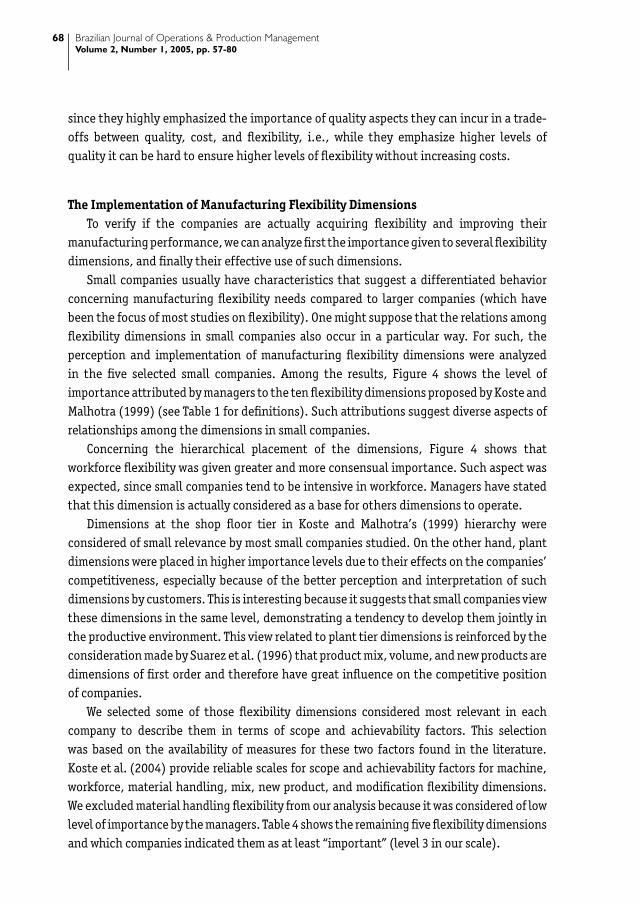
Small companies usually have characteristics that suggest a differentiated behavior concerning manufacturing flexibility needs compared to larger companies (which have been the focus of most studies on flexibility). One might suppose that the relations among flexibility dimensions in small companies also occur in a particular way. For such, the perception and implementation of manufacturing flexibility dimensions were analyzed in the five selected small companies. Among the results, Figure 4 shows the level of importance attributed by managers to the ten flexibility dimensions proposed by Koste and Malhotra (1999) (see Table 1 for definitions). Such attributions suggest diverse aspects of relationships among the dimensions in small companies.
Concerning the hierarchical placement of the dimensions, Figure 4 shows that workforce flexibility was given greater and more consensual importance. Such aspect was expected, since small companies tend to be intensive in workforce. Managers have stated that this dimension is actually considered as a base for others dimensions to operate.
Dimensions at the shop floor tier in Koste and Malhotra’s (1999) hierarchy were considered of small relevance by most small companies studied. On the other hand, plant dimensions were placed in higher importance levels due to their effects on the companies’ competitiveness, especially because of the better perception and interpretation of such dimensions by customers. This is interesting because it suggests that small companies view these dimensions in the same level, demonstrating a tendency to develop them jointly in the productive environment. This view related to plant tier dimensions is reinforced by the consideration made by Suarez et al. (1996) that product mix, volume, and new products are dimensions of first order and therefore have great influence on the competitive position of companies.
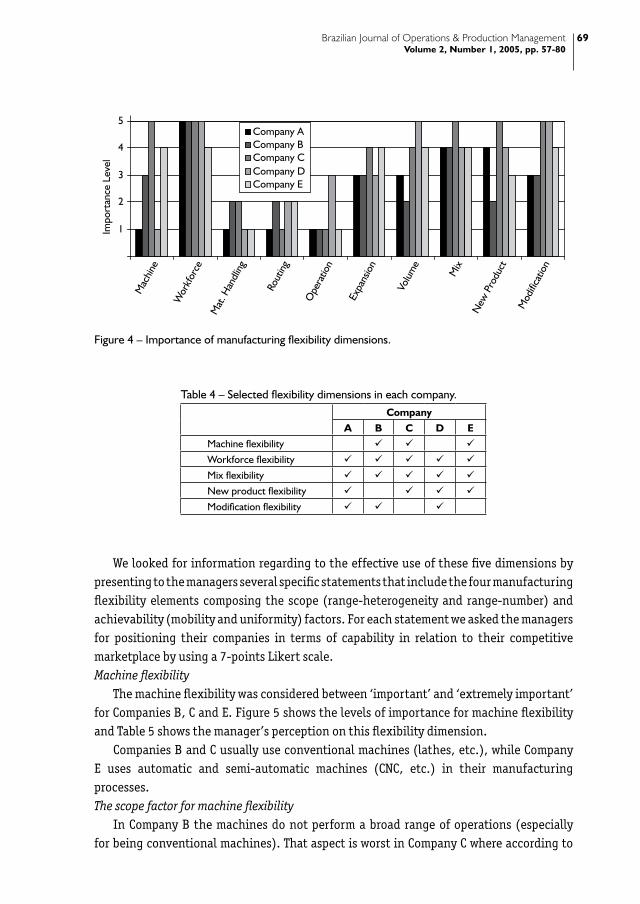
We selected some of those flexibility dimensions considered most relevant in each company to describe them in terms of scope and achievability factors. This selection was based on the availability of measures for these two factors found in the literature. Koste et al. (2004) provide reliable scales for scope and achievability factors for machine, workforce, material handling, mix, new product, and modification flexibility dimensions. We excluded material handling flexibility from our analysis because it was considered of low level of importance by the managers. Table 4 shows the remaining five flexibility dimensions and which companies indicated them as at least “important” (level 3 in our scale).
Brazilian Journal of Operations & Production ManagementVolume 2, Number 1, 2005, pp. 5�-�0
��
1
2
3
4
5M
achi
ne
Wor
kfor
ce
Mat
. Han
dlin
g
Rout
ing
Ope
ratio
n
Expa
nsio
n
Volu
me
Mix
New
Pro
duct
Mod
ifica
tion
Impo
rtan
ce L
evel
Company ACompany BCompany CCompany DCompany E
Figure 4 – Importance of manufacturing flexibility dimensions.
We looked for information regarding to the effective use of these five dimensions by presenting to the managers several specific statements that include the four manufacturing flexibility elements composing the scope (range-heterogeneity and range-number) and achievability (mobility and uniformity) factors. For each statement we asked the managers for positioning their companies in terms of capability in relation to their competitive marketplace by using a 7-points Likert scale.Machine flexibility
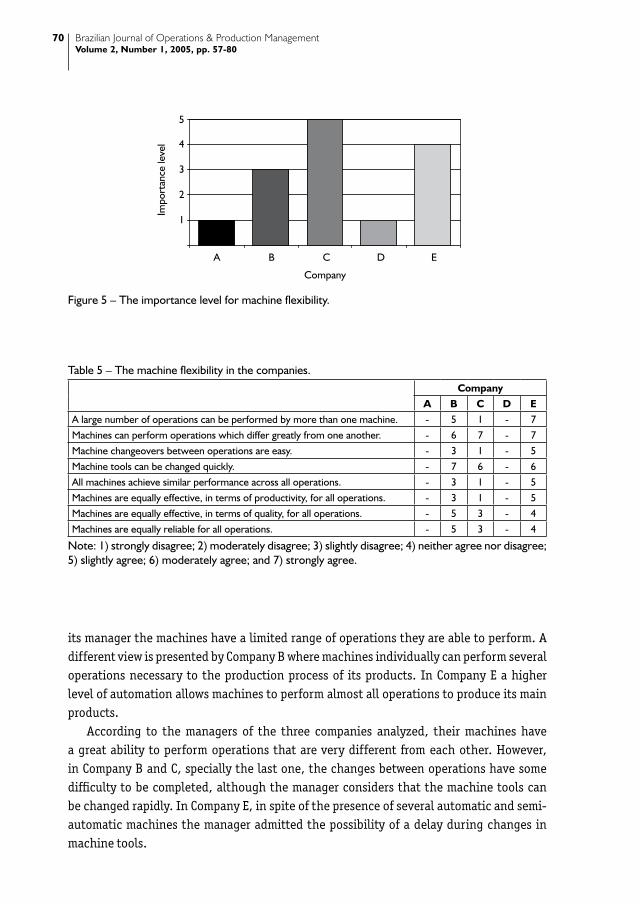
The machine flexibility was considered between ‘important’ and ‘extremely important’ for Companies B, C and E. Figure 5 shows the levels of importance for machine flexibility and Table 5 shows the manager’s perception on this flexibility dimension.
Companies B and C usually use conventional machines (lathes, etc.), while Company E uses automatic and semi-automatic machines (CNC, etc.) in their manufacturing processes.The scope factor for machine flexibility
In Company B the machines do not perform a broad range of operations (especially for being conventional machines). That aspect is worst in Company C where according to
Table 4 – Selected flexibility dimensions in each company.Company
A B C D EMachine flexibility
Workforce flexibility
Mix flexibility
New product flexibility
Modification flexibility
Brazilian Journal of Operations & Production ManagementVolume 2, Number 1, 2005, pp. 5�-�0
�0
its manager the machines have a limited range of operations they are able to perform. A different view is presented by Company B where machines individually can perform several operations necessary to the production process of its products. In Company E a higher level of automation allows machines to perform almost all operations to produce its main products.
According to the managers of the three companies analyzed, their machines have a great ability to perform operations that are very different from each other. However, in Company B and C, specially the last one, the changes between operations have some difficulty to be completed, although the manager considers that the machine tools can be changed rapidly. In Company E, in spite of the presence of several automatic and semi-automatic machines the manager admitted the possibility of a delay during changes in machine tools.
1
2
3
4
5
A B C D E
Company
Impo
rtan
ce le
vel
Figure 5 – The importance level for machine flexibility.
Table 5 – The machine flexibility in the companies.Company
A B C D EA large number of operations can be performed by more than one machine. - 5 1 - 7Machines can perform operations which differ greatly from one another. - 6 7 - 7Machine changeovers between operations are easy. - 3 1 - 5Machine tools can be changed quickly. - 7 6 - 6All machines achieve similar performance across all operations. - 3 1 - 5Machines are equally effective, in terms of productivity, for all operations. - 3 1 - 5Machines are equally effective, in terms of quality, for all operations. - 5 3 - 4Machines are equally reliable for all operations. - 5 3 - 4
Note: 1) strongly disagree; 2) moderately disagree; 3) slightly disagree; 4) neither agree nor disagree; 5) slightly agree; 6) moderately agree; and 7) strongly agree.
Brazilian Journal of Operations & Production ManagementVolume 2, Number 1, 2005, pp. 5�-�0
�1
The achievability factor for machine flexibility
From the point of view of Company B the machines, while considering the range of
operations, do not present most similarities in performance, even most of the time they are
equally efficient in terms of productivity. For these two aspects the manager in Company C
positioned its machines in a low level and the manager in Company E in a moderate level.
In Company B all machines are considered equally effective in terms of quality and
similarly reliable in performing all operations. In Company C, quality and reliability can
differ among machines, what incur in caution while defining the operation schedule. The
manager in Company C did not answer this statement.
Workforce flexibility
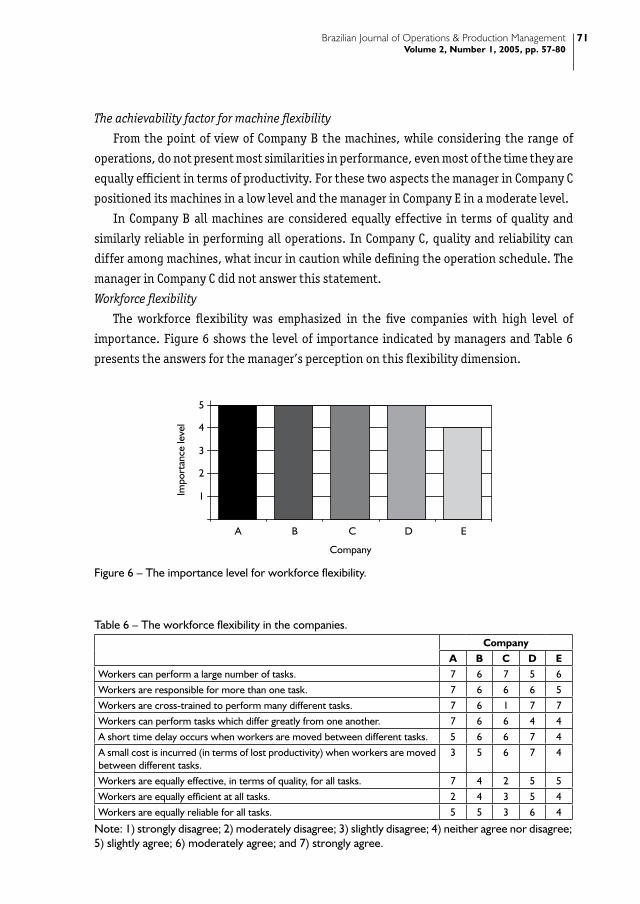
The workforce flexibility was emphasized in the five companies with high level of
importance. Figure 6 shows the level of importance indicated by managers and Table 6
presents the answers for the manager’s perception on this flexibility dimension.
Table 6 – The workforce flexibility in the companies.Company
A B C D EWorkers can perform a large number of tasks. 7 6 7 5 6Workers are responsible for more than one task. 7 6 6 6 5Workers are cross-trained to perform many different tasks. 7 6 1 7 7Workers can perform tasks which differ greatly from one another. 7 6 6 4 4A short time delay occurs when workers are moved between different tasks. 5 6 6 7 4A small cost is incurred (in terms of lost productivity) when workers are moved between different tasks.
3 5 6 7 4
Workers are equally effective, in terms of quality, for all tasks. 7 4 2 5 5Workers are equally efficient at all tasks. 2 4 3 5 4Workers are equally reliable for all tasks. 5 5 3 6 4
Note: 1) strongly disagree; 2) moderately disagree; 3) slightly disagree; 4) neither agree nor disagree; 5) slightly agree; 6) moderately agree; and 7) strongly agree.
1
2
3
4
5
A B C D E
Company
Impo
rtan
ce le
vel
Figure 6 – The importance level for workforce flexibility.
Brazilian Journal of Operations & Production ManagementVolume 2, Number 1, 2005, pp. 5�-�0
�2
The scope factor for workforce flexibilityConsidering the importance of the presence of a qualified workforce, the managers
considered that the workers have multiple abilities that allow them to perform a great range of tasks. Further in Companies A, B and C the operations are very different from each other. To ensure, or improve, the variety of abilities of their workers the companies (except Company C) have frequent generalized training process for them. Finally, in each company the workers frequently receive the responsibility for more than one task.The achievability factor for workforce flexibility
In Company A, although the workers are equally effective in terms of quality while performing their tasks, the same cannot be said in relation to their efficiency in the tasks. In Companies B, D and E these two related statements received similar comments from the managers who said that workers often have low levels of group performance, frequently due to the existence of differences in individual abilities. In Company C the effectiveness in terms of quality and the efficiency in performing the tasks were considered slightly similar among workers. For all companies these aspects certainly do not allow workers to be equally reliable in performing all tasks.
Also from the managers’ point of view, the time delay to move workers from one task to another are usually short. However, for Company A the cost in terms of productivity that occurs during this change is relatively high sometimes.Mix flexibility
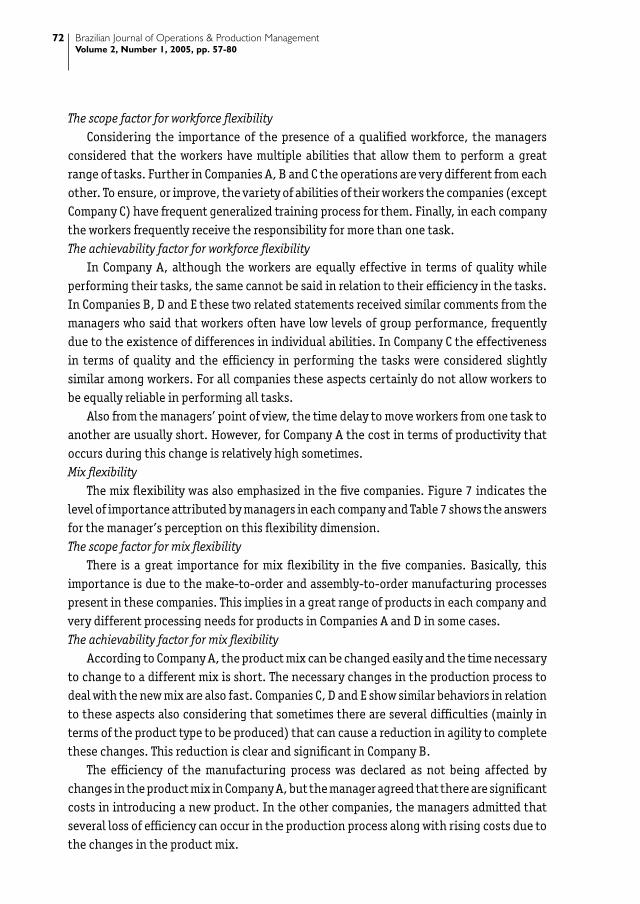
The mix flexibility was also emphasized in the five companies. Figure 7 indicates the level of importance attributed by managers in each company and Table 7 shows the answers for the manager’s perception on this flexibility dimension.The scope factor for mix flexibility
There is a great importance for mix flexibility in the five companies. Basically, this importance is due to the make-to-order and assembly-to-order manufacturing processes present in these companies. This implies in a great range of products in each company and very different processing needs for products in Companies A and D in some cases.The achievability factor for mix flexibility
According to Company A, the product mix can be changed easily and the time necessary to change to a different mix is short. The necessary changes in the production process to deal with the new mix are also fast. Companies C, D and E show similar behaviors in relation to these aspects also considering that sometimes there are several difficulties (mainly in terms of the product type to be produced) that can cause a reduction in agility to complete these changes. This reduction is clear and significant in Company B.
The efficiency of the manufacturing process was declared as not being affected by changes in the product mix in Company A, but the manager agreed that there are significant costs in introducing a new product. In the other companies, the managers admitted that several loss of efficiency can occur in the production process along with rising costs due to the changes in the product mix.
Brazilian Journal of Operations & Production ManagementVolume 2, Number 1, 2005, pp. 5�-�0
��
Table 7 – The mix flexibility in the companies.Company
A B C D EA large number of products are produced in the plant. 7 5 6 7 7The processing requirements for the products produced in the plant vary greatly from one product to another.
7 5 2 7 4
The products produced in the plant are very different from one another. 7 6 6 7 4The cost of including a product in the product mix is small. 5 3 5 6 4The product mix produced by the plant can be changed easily. 7 3 5 6 5The time required to change to a different product mix is short. 7 4 5 5 4The manufacturing system can quickly changeover to a different product mix. 7 4 5 5 5The efficiency of the production process is not affected by changes in product mix. 7 5 5 5 4
Note: 1) strongly disagree; 2) moderately disagree; 3) slightly disagree; 4) neither agree nor disagree; 5) slightly agree; 6) moderately agree; and 7) strongly agree.
1
2
3
4
5
A B C D E
Company
Impo
rtan
ce le
vel
Figure 7 – The importance level for mix flexibility.
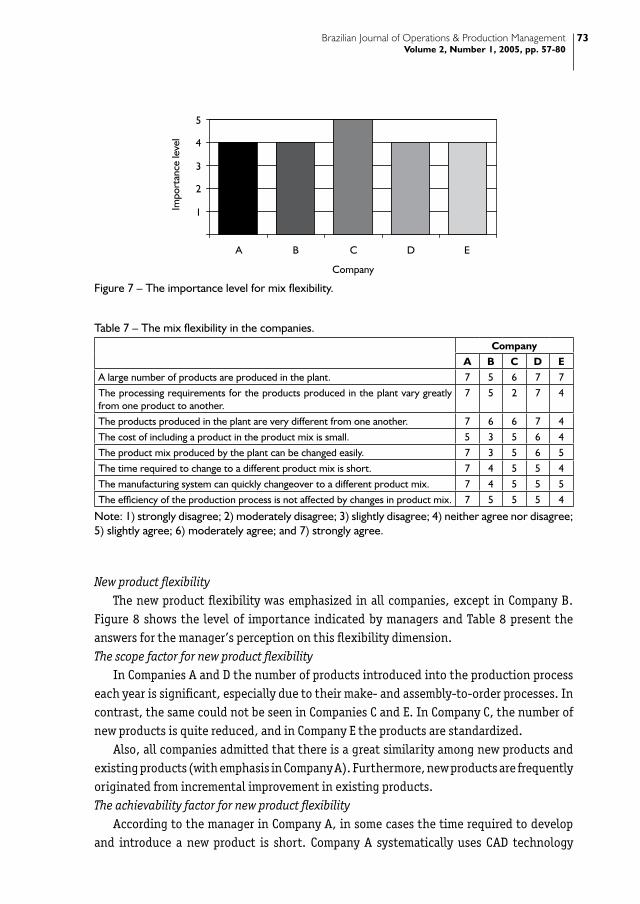
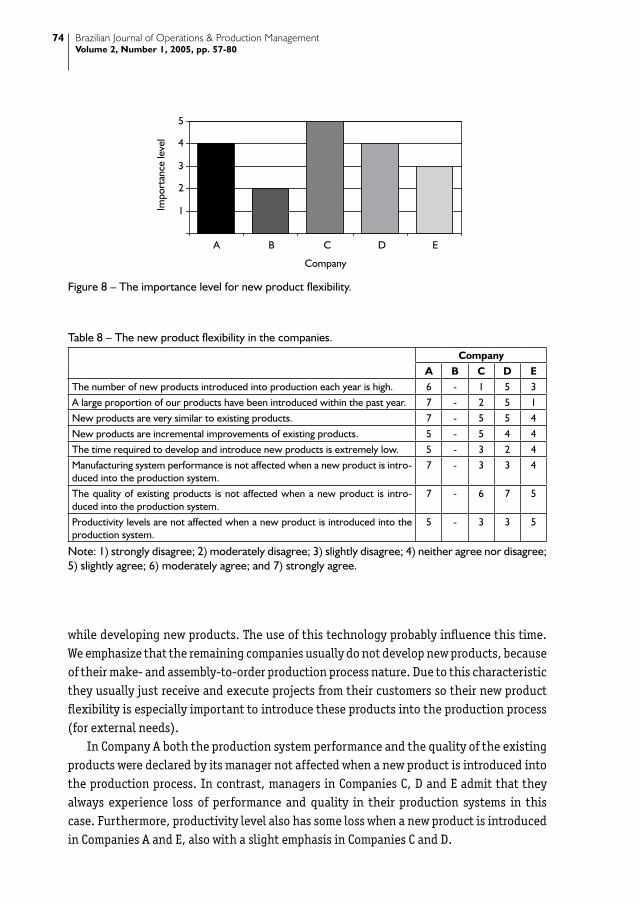
New product flexibilityThe new product flexibility was emphasized in all companies, except in Company B.
Figure 8 shows the level of importance indicated by managers and Table 8 present the answers for the manager’s perception on this flexibility dimension.The scope factor for new product flexibility
In Companies A and D the number of products introduced into the production process each year is significant, especially due to their make- and assembly-to-order processes. In contrast, the same could not be seen in Companies C and E. In Company C, the number of new products is quite reduced, and in Company E the products are standardized.
Also, all companies admitted that there is a great similarity among new products and existing products (with emphasis in Company A). Furthermore, new products are frequently originated from incremental improvement in existing products.The achievability factor for new product flexibility
According to the manager in Company A, in some cases the time required to develop and introduce a new product is short. Company A systematically uses CAD technology
Brazilian Journal of Operations & Production ManagementVolume 2, Number 1, 2005, pp. 5�-�0
��
Table 8 – The new product flexibility in the companies.Company
A B C D EThe number of new products introduced into production each year is high. 6 - 1 5 3A large proportion of our products have been introduced within the past year. 7 - 2 5 1New products are very similar to existing products. 7 - 5 5 4New products are incremental improvements of existing products. 5 - 5 4 4The time required to develop and introduce new products is extremely low. 5 - 3 2 4Manufacturing system performance is not affected when a new product is intro-duced into the production system.
7 - 3 3 4
The quality of existing products is not affected when a new product is intro-duced into the production system.
7 - 6 7 5
Productivity levels are not affected when a new product is introduced into the production system.
5 - 3 3 5
Note: 1) strongly disagree; 2) moderately disagree; 3) slightly disagree; 4) neither agree nor disagree; 5) slightly agree; 6) moderately agree; and 7) strongly agree.
1
2
3
4
5
A B C D E
Company
Impo
rtan
ce le
vel
Figure 8 – The importance level for new product flexibility.
while developing new products. The use of this technology probably influence this time. We emphasize that the remaining companies usually do not develop new products, because of their make- and assembly-to-order production process nature. Due to this characteristic they usually just receive and execute projects from their customers so their new product flexibility is especially important to introduce these products into the production process (for external needs).
In Company A both the production system performance and the quality of the existing products were declared by its manager not affected when a new product is introduced into the production process. In contrast, managers in Companies C, D and E admit that they always experience loss of performance and quality in their production systems in this case. Furthermore, productivity level also has some loss when a new product is introduced in Companies A and E, also with a slight emphasis in Companies C and D.
Brazilian Journal of Operations & Production ManagementVolume 2, Number 1, 2005, pp. 5�-�0
�5
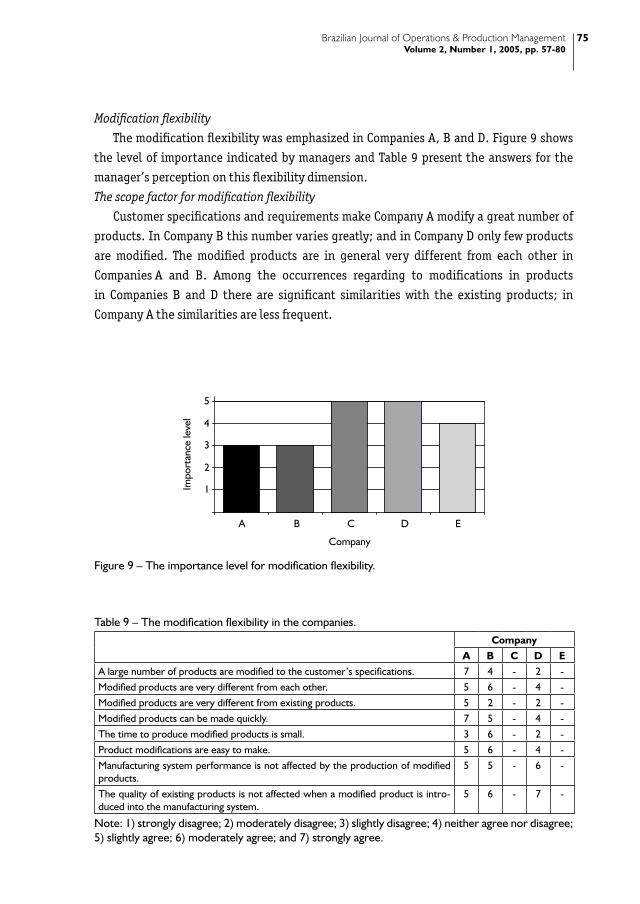
Modification flexibility
The modification flexibility was emphasized in Companies A, B and D. Figure 9 shows
the level of importance indicated by managers and Table 9 present the answers for the
manager’s perception on this flexibility dimension.
The scope factor for modification flexibility
Customer specifications and requirements make Company A modify a great number of
products. In Company B this number varies greatly; and in Company D only few products
are modified. The modified products are in general very different from each other in
Companies A and B. Among the occurrences regarding to modifications in products
in Companies B and D there are significant similarities with the existing products; in
Company A the similarities are less frequent.
Table 9 – The modification flexibility in the companies.Company
A B C D EA large number of products are modified to the customer’s specifications. 7 4 - 2 -Modified products are very different from each other. 5 6 - 4 -Modified products are very different from existing products. 5 2 - 2 -Modified products can be made quickly. 7 5 - 4 -The time to produce modified products is small. 3 6 - 2 -Product modifications are easy to make. 5 6 - 4 -Manufacturing system performance is not affected by the production of modified products.
5 5 - 6 -
The quality of existing products is not affected when a modified product is intro-duced into the manufacturing system.
5 6 - 7 -
Note: 1) strongly disagree; 2) moderately disagree; 3) slightly disagree; 4) neither agree nor disagree; 5) slightly agree; 6) moderately agree; and 7) strongly agree.
1
2
3
4
5
A B C D E
Company
Impo
rtan
ce le
vel
Figure 9 – The importance level for modification flexibility.
Brazilian Journal of Operations & Production ManagementVolume 2, Number 1, 2005, pp. 5�-�0
��
The achievability factor aspects
The manager in Company A declared that modifications in products can be done quickly, however it can occur some cases in which these modifications intrinsically bring difficulties that make them hard to be completed easily, also with a time increment in the production process for these products. In contrast, in Company B it is easy to make changes in products, usually without any time penalty. In Company D, the necessary time and the agility to make modifications in products vary greatly, but this process usually causes a time penalty in the production system.
Finally, all managers agree that production system performance and quality of their existing products are not significantly affected when a modified product is introduced in production. However, they admit that negative effects in performance and quality can occur even slightly.
The Alignment of Scope and Achievability FactorsKoste and Malhotra (2000) consider the individual contribution of each of the four
elements of manufacturing flexibility (range-number, range-heterogeneity, mobility, and uniformity). According to their point of view, greater flexibility is attributed to the resource or system with larger range-number, larger range-heterogeneity, greater mobility, and greater uniformity. This view can be extended to the analysis of scope and achievability factors, considering that a company effectively uses its manufacturing flexibility when it can reach higher levels of both scope (range-number and range-heterogeneity) and achievability (mobility and uniformity) factors. Although it is quite difficult to demonstrate higher levels for both factors (Koste et al., 2004), we can consider that the more a firm acquires improvements in these factors more flexible will it be. We conducted a comparative analysis considering the relative aspect of manufacturing flexibility. Our purpose was to look for differences in terms of scope and achievability factors that can define the level of flexibility in each company. In other words, we analyze the alignment of scope and achievability factors, which means the coherence between what is perceived and what is demonstrated by the companies.
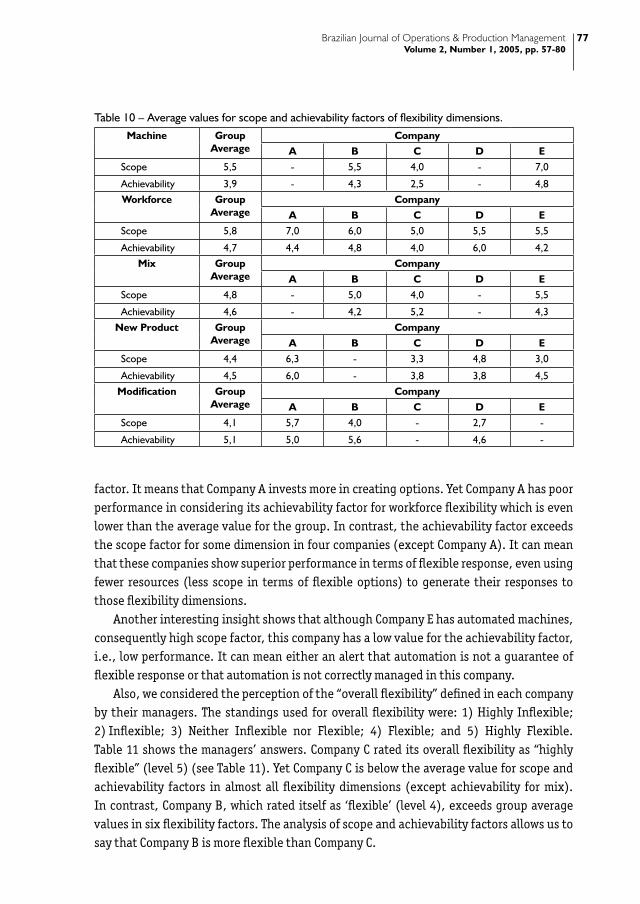
Table 10 shows the average values for scope and achievability factors of the manufacturing flexibility dimensions in the companies. These factors were calculated by averaging range-number and range-heterogeneity elements for obtaining the scope factor, and averaging mobility and uniformity elements for obtaining the achievability factor. We can consider these values to better differentiate the companies in terms of flexible response.
Considering that all dimensions present in Table 10 were considered at least ‘important’ (see Figure 4 for importance levels), we can get some insights from this table. Looking at the implementation of flexibility dimensions in Company A, we can observe that for workforce, new product, and modification flexibilities the scope factor exceed the achievability
Brazilian Journal of Operations & Production ManagementVolume 2, Number 1, 2005, pp. 5�-�0
��
Table 10 – Average values for scope and achievability factors of flexibility dimensions.Machine Group
AverageCompany
A B C D EScope 5,5 - 5,5 4,0 - 7,0
Achievability 3,9 - 4,3 2,5 - 4,8Workforce Group
AverageCompany
A B C D EScope 5,8 7,0 6,0 5,0 5,5 5,5
Achievability 4,7 4,4 4,8 4,0 6,0 4,2Mix Group
AverageCompany
A B C D EScope 4,8 - 5,0 4,0 - 5,5
Achievability 4,6 - 4,2 5,2 - 4,3New Product Group
AverageCompany
A B C D EScope 4,4 6,3 - 3,3 4,8 3,0
Achievability 4,5 6,0 - 3,8 3,8 4,5Modification Group
AverageCompany
A B C D EScope 4,1 5,7 4,0 - 2,7 -
Achievability 5,1 5,0 5,6 - 4,6 -
factor. It means that Company A invests more in creating options. Yet Company A has poor performance in considering its achievability factor for workforce flexibility which is even lower than the average value for the group. In contrast, the achievability factor exceeds the scope factor for some dimension in four companies (except Company A). It can mean that these companies show superior performance in terms of flexible response, even using fewer resources (less scope in terms of flexible options) to generate their responses to those flexibility dimensions.
Another interesting insight shows that although Company E has automated machines, consequently high scope factor, this company has a low value for the achievability factor, i.e., low performance. It can mean either an alert that automation is not a guarantee of flexible response or that automation is not correctly managed in this company.
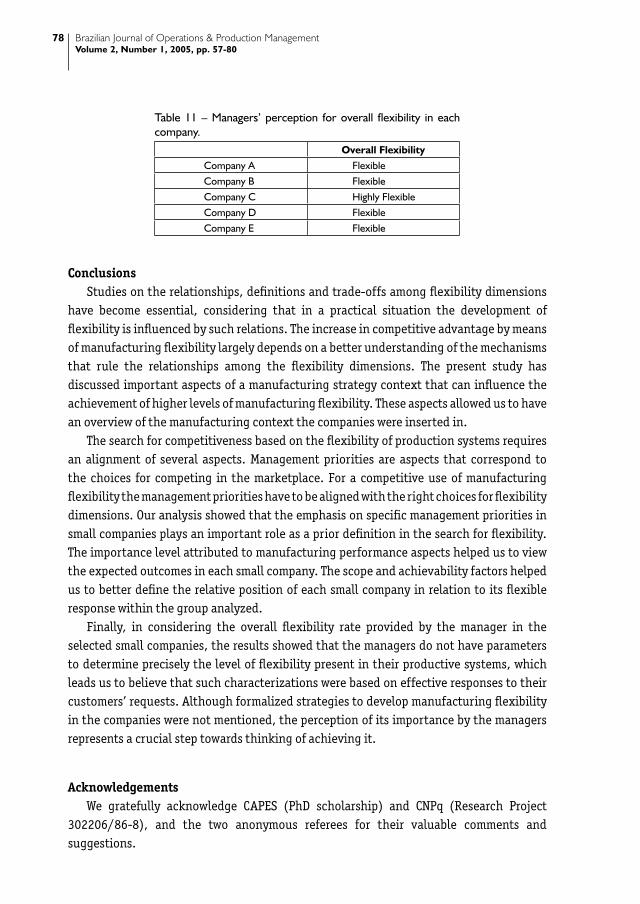
Also, we considered the perception of the “overall flexibility” defined in each company by their managers. The standings used for overall flexibility were: 1) Highly Inflexible; 2) Inflexible; 3) Neither Inflexible nor Flexible; 4) Flexible; and 5) Highly Flexible. Table 11 shows the managers’ answers. Company C rated its overall flexibility as “highly flexible” (level 5) (see Table 11). Yet Company C is below the average value for scope and achievability factors in almost all flexibility dimensions (except achievability for mix). In contrast, Company B, which rated itself as ‘flexible’ (level 4), exceeds group average values in six flexibility factors. The analysis of scope and achievability factors allows us to say that Company B is more flexible than Company C.
Brazilian Journal of Operations & Production ManagementVolume 2, Number 1, 2005, pp. 5�-�0
��
ConclusionsStudies on the relationships, definitions and trade-offs among flexibility dimensions
have become essential, considering that in a practical situation the development of flexibility is influenced by such relations. The increase in competitive advantage by means of manufacturing flexibility largely depends on a better understanding of the mechanisms that rule the relationships among the flexibility dimensions. The present study has discussed important aspects of a manufacturing strategy context that can influence the achievement of higher levels of manufacturing flexibility. These aspects allowed us to have an overview of the manufacturing context the companies were inserted in.
The search for competitiveness based on the flexibility of production systems requires an alignment of several aspects. Management priorities are aspects that correspond to the choices for competing in the marketplace. For a competitive use of manufacturing flexibility the management priorities have to be aligned with the right choices for flexibility dimensions. Our analysis showed that the emphasis on specific management priorities in small companies plays an important role as a prior definition in the search for flexibility. The importance level attributed to manufacturing performance aspects helped us to view the expected outcomes in each small company. The scope and achievability factors helped us to better define the relative position of each small company in relation to its flexible response within the group analyzed.
Finally, in considering the overall flexibility rate provided by the manager in the selected small companies, the results showed that the managers do not have parameters to determine precisely the level of flexibility present in their productive systems, which leads us to believe that such characterizations were based on effective responses to their customers’ requests. Although formalized strategies to develop manufacturing flexibility in the companies were not mentioned, the perception of its importance by the managers represents a crucial step towards thinking of achieving it.
AcknowledgementsWe gratefully acknowledge CAPES (PhD scholarship) and CNPq (Research Project
302206/86-8), and the two anonymous referees for their valuable comments and suggestions.
Table 11 – Managers’ perception for overall flexibility in each company.
Overall FlexibilityCompany A FlexibleCompany B FlexibleCompany C Highly FlexibleCompany D FlexibleCompany E Flexible
Brazilian Journal of Operations & Production ManagementVolume 2, Number 1, 2005, pp. 5�-�0
��
ReferencesChang, Shih-Chia et al. (2003) “Manufacturing Flexibility and Business Strategy: an
Empirical Study of Small and Medium Sized Firms”, International Journal of Production
Economics, Vol. 83, pp. 13-26.
Das, A. (2001) “Towards Theory Building in Manufacturing Flexibility”, International
Journal of Production Research, Vol. 39, No. 18, pp. 4153-4177.
D’Souza, D. E., Williams, F. P. (2000) “Toward a Taxonomy of Manufacturing Flexibility
Dimensions”, Journal of Operations Management, Vol. 18, No. 5, pp. 577-593.
Dreyer, B., Gronhaug, K. (2004) “Uncertainty, Flexibility, and Sustained Competitive
Advantage”, Journal of Business Research, Vol. 57, pp. 484-494.
Frazelle, E. H. (1986) “Flexibility: a Strategic Response in Changing Times”, Industrial
Engineering, Vol. 18, No. 3, pp. 17-20.
Gerwin, D. (1987) “An Agenda for Research on the Flexibility of Manufacturing Process”,
International Journal of Operations and Production Management, Vol. 7, No. 1, pp. 38-49.
Golden, W., Powell, P. (2000) “Towards a Definition of Flexibility: in Search to the Holy
Grail?”, Omega, Vol. 28, No. 4, pp. 373-384.
Gupta, Y. P., Goyal, S. (1989) “Flexibility of Manufacturing Systems: Concepts and
Measurements”, European Journal of Operational Research, Vol. 43, pp. 119-135.
Hyun, Jae-Ho, Ahn, Byong-Hun. (1992) “A Unifying Framework for Manufacturing
Flexibility”, Manufacturing Review, Vol. 5, No. 4, pp. 251-260.
Kathuria, R., Partovi, F. Y. (2000) “Aligning Work Force Management Practices with
Competitive Priorities and Process Technology: a Conceptual Examination”, The Journal of
High Technology Management Research, Vol. 11, No. 2, pp. 215-234.
Koste, L. L. (1999) “Measurement of Manufacturing Flexibility and its Implications for
Supply Chain Management”, Ph.D. Dissertation, Darla Moore School of Business, University
of South Carolina.
Koste, L. L., Malhotra, M. K. (1999) “A Theoretical Framework for Analyzing the
Dimensions of Manufacturing Flexibility”, Journal of Operations Management, Vol. 18,
No. 1, pp. 75-93.
Koste, L. L., Malhotra, M. K. (2000) “Trade-offs Among the Elements of Flexibility: a
Comparison from the Automotive Industry”, Omega, Vol. 28, No. 6, pp. 693-710.
Koste, L. L. et al. (2004) “Measuring Dimensions of Manufacturing Flexibility”, Journal
of Operations Management, Vol. 22, pp. 171–196.
Pagell, M., Krause, D. (2004) “Re-exploring the Relationship Between Flexibility and
the External Environment”, Journal of Operations Management, Vol. 21, pp. 629-649.
Parker, R. P., Wirth, A. (1999) “Manufacturing Flexibility: Measures and Relationships”,
European Journal of Operational Research, Vol. 118, No. 3, pp. 429-449.
Slack, N. (1992), The Manufacturing Advantage: Achieving Competitive Manufacturing
Operations, Mercury Books.
Brazilian Journal of Operations & Production ManagementVolume 2, Number 1, 2005, pp. 5�-�0
�0
Slack, N (1987), “The flexibility of manufacturing systems”, International Journal of Production and Operations Management, Vol. 7, No.4, pp. 35-45.
Shewchuk, J. P., Moodie, C. L. (1998) “Definition and Classification of Manufacturing Flexibility Types and Measures”, The International Journal of Flexible Manufacturing Systems, Vol. 10, pp. 325-349.
Suarez, F. F. et al. (1996) “An Empirical Study of Manufacturing Flexibility in Printed Circuit Board Assembly”, Operations Research, Vol. 44, No. 1, pp. 223-240.
Upton, D. M. (1995) “What Really Makes Factories Flexible?”, Harvard Business Review, pp. 74-84.
Upton, D. M. (1994) “The Management of Manufacturing Flexibility”, California Management Review, Vol. 36, No. 2, pp. 72-89.
Zelenovic, D. M. (1982) “Flexibility – a Condition for Effective Production Systems”, International Journal of Production Research, Vol. 20, No. 3, pp. 319-337.
BiographyRogerio Odivan Brito Serrão is a Ph.D. candidate in industrial engineering in the
Industrial Engineering Department at the Pontifical Catholic University of Rio de Janeiro. He received his M.Sc. degree in industrial engineering from there in 2001 and his B.Sc. degree in mechanical engineering from Federal University of Pará.
Paulo Roberto Tavares Dalcol currently is an Associate Professor in the Industrial Engineering Department at the Pontifical Catholic University of Rio de Janeiro. He received his M.Sc. degree in industrial engineering from there in 1972 and a Ph.D. degree in industrial sociology from the Imperial College of Science and Technology, University of London, in 1985. his teaching and research interests are in design and control of production and manufacturing systems, technology and production organization, and manufacturing flexibility.