
Apresentacao 4 q08_finalv2
29
4Q08 Earnings
-
Upload
generalshoppingriweb -
Category
Documents
-
view
159 -
download
0
Transcript of Apresentacao 4 q08_finalv2

4Q08 Earnings

Disclaimer
This presentation contains statements that are forward-looking within the meaning of Section 27A of the Securities Act of 1933 and Section 21E of the Securities Exchange Act of 1934. Such forward-looking statements are only predictions and are not guarantees of future performance. Investors are cautioned that any such forward-looking statements are and will be, as the case may be, subject to many risks, uncertainties and factors relating to the operations and business environments of General Shopping and its subsidiaries that may cause the actual results of the companies to be materially different from any future results expressed or implied in such forward-looking statements.
This material is published solely for informational purposes and is not to be construed as a solicitation or an offer to buy or sell any securities or related financial instruments and should not be treated as giving investment advice. It is not targeted to the specific investment objectives, financial situation or particular needs of any recipient. No representation or warranty, either express or implied, is provided in relation to the accuracy, completeness or reliability of the information contained herein. This material should not be regarded by recipients as a substitute for the exercise of their own judgment.
Any opinions expressed in this material are expressed as of this date and subject to change without notice and General Shopping is not under the obligation to update or keep current the information contained herein. General Shopping and the respective affiliates, directors, partners and employees accept no liability whatsoever for any loss or damage of any kind arising out of the use of all or any part of this material. You should consult with your own legal, regulatory, tax, business, investment, financial and accounting advisers to the extent that you deem it necessary, and make your own investment, hedging and trading decision (including decisions regarding the suitability of this transaction) based upon your own judgment and advice from such advisers as you deem necessary and not upon any views expressed in this material.
1
Agenda
Financial Performance
Company Overview
Sector Overview
2

3Financial Performance

Gross Revenue (R$ million)
17.6 17.0 17.9 17.824.5
2.9 3.4 4.5
6.0
3.3
4Q07 1Q08 2Q08 3Q08 4Q08Rent Revenues Service Revenues
+ 46.3%
4
Total Gross Revenue
R$ Million 4Q07 1Q08 2Q08 3Q08 4Q08Rent 17.6 17.0 17.9 17.8 24.5
Services 3.3 2.9 3.4 4.5 6.0Total 20.9 19.9 21.3 22.3 30.5

Same Store X New Portfolio (Turn Around)
5
Total Gross Revenue
Same Store 4Q07 1Q08 2Q08 3Q08 4Q08GLA (Thousand) 86,699 86,699 86,699 93,791 110,065Rent (R$ / m²) 146.8 116.4 118.8 114.0 153.2Services (R$ / m²) 36.2 27.9 32.5 32.5 40.0
New Portfolio 4Q07 1Q08 2Q08 3Q08 4Q08GLA (Thousand) 55,358 84,877 84,877 77,785 64,665Rent (R$ / m²) 69.9 81.5 89.6 91.9 113.1Services (R$ / m²) 3.0 6.0 6.3 18.2 25.6
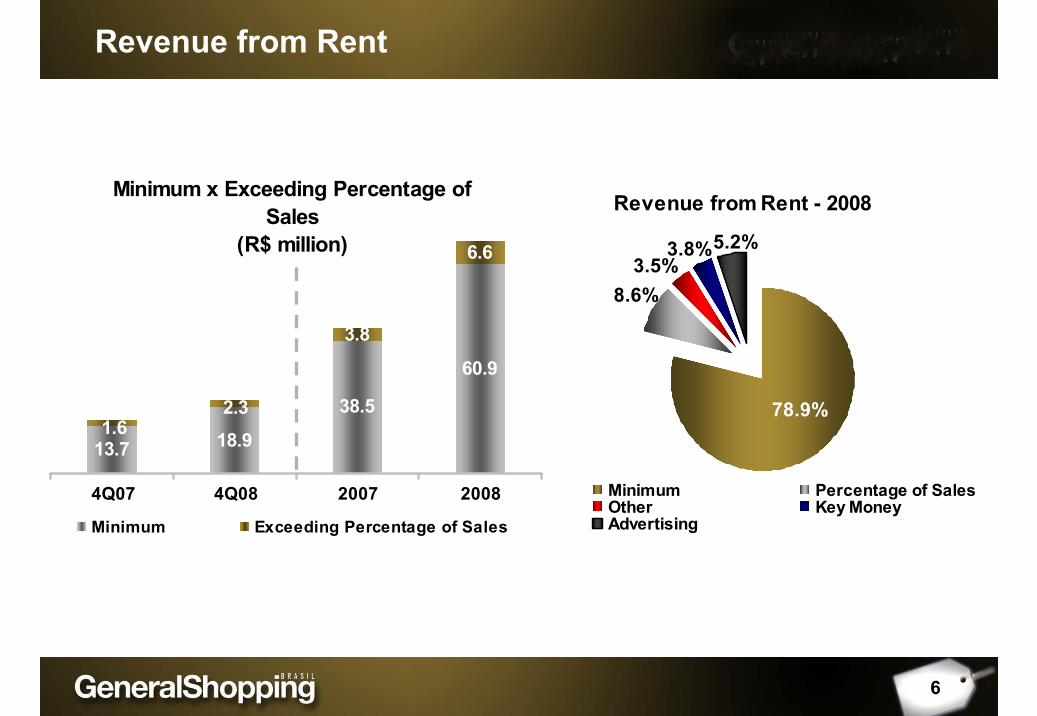
Minimum x Exceeding Percentage of Sales
(R$ million)
13.7 18.9
38.5
60.9
3.8
6.6
2.31.6
4Q07 4Q08 2007 2008
Minimum Exceeding Percentage of Sales
Revenue from Rent - 2008
8.6%
78.9%
3.5%5.2%3.8%
Minimum Percentage of SalesOther Key MoneyAdvertising
6
Revenue from Rent

Same Store Lease(1)
(R$ million)
13.2
9.89.511.7
9.4
4Q07* 1Q08 2Q08 3Q08 4Q08*
+ 12.5%
7
(1) Refers to minimum rent. For better analysis Shopping Light and Suzano Shopping were considered in all quarters* Includes “double” rent from satellite stores in December
Revenue from Rent

8
Revenue from Services (R$ million)
Management 0.03 0.21 0.11 0.73
Water 0.13 0.48 0.52 1.06
Energy 0.92 1.05 3.97 3.33
Parking 2.26 4.32 7.12 11.68
4Q07 4Q08 2007 2008
3.346.06
11.72
16.80Revenues from Services - 2008
19.8%
69.5%
6.4% 4.3%
Parking Energy Water Management
Revenue from Services
Innovation in Services

Vacancy
9
3.8%
4.5%
3.7% 3.7%3.4%
2.5%(1)
1.4%
2.4%
1.7%2.5%(2)
5.1%5.0%
6.0%6.6%6.5%
4Q07 1Q08 2Q08 3Q08 4Q08
GSB Same Store New Portfolio
(1) Including Shopping Light(2) Including Suzano Shopping
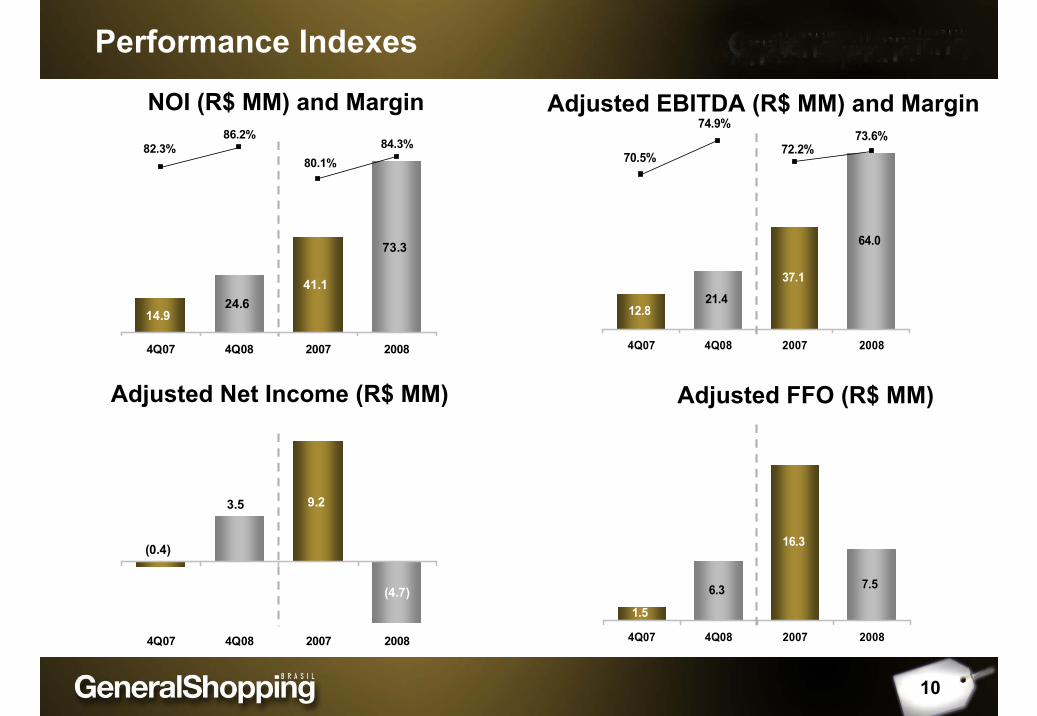
14.9
41.124.6
73.3
80.1%84.3%82.3%
86.2%
4Q07 4Q08 2007 2008
12.8
37.1
64.0
21.4
70.5%
74.9%
72.2%73.6%
4Q07 4Q08 2007 2008
10
NOI (R$ MM) and Margin Adjusted EBITDA (R$ MM) and Margin
9.2
(0.4)
3.5
(4.7)
4Q07 4Q08 2007 2008
1.5
16.3
7.56.3
4Q07 4Q08 2007 2008
Adjusted Net Income (R$ MM) Adjusted FFO (R$ MM)
Performance Indexes

Cash x Debt (R$ million)
219.2
504.7
4Q08Cash Debt
11
Cash X Debt
R$ Million 2009 2010 2011 After 2011 Total %BNDES 96.1 20.7 0.0 0.0 116.8 23.1%Other banks 120.0 0.0 0.0 0.0 120.0 23.8%CCI 33.1 31.8 31.8 171.2 267.9 53.1%Total 249.2 52.5 31.8 171.2 504.7 100.0%
Amortization Schedule

Subsequent Events
12
Subsequent Events - Indebtedness (R$ million)
504.7
335.6
15.115.240.212.0
86.7
Debt as of12/31/2008
BNDESAmortization
(Jan/09)
TricuryAmortization
(Jan/09)
Bic BancoAmortization
(Jan/09)
BNDESAmortization
(Mar/09)
BNDES Discount(Mar/09)
Current Debt
R$ Million 2009 2010 2011 After 2011 Total %Other banks 62.1 5.6 0.0 0.0 67.7 20.2%CCI 33.1 31.8 31.8 171.2 267.9 79.8%Total 95.2 37.4 31.8 171.2 335.6 100.0%
Updated Amortization Schedule

13Company Overview

Differentials
Market-driven company with retail approachMarket-driven company with retail approach
B and C consumption classes as target marketB and C consumption classes as target market
Innovative complementary servicesInnovative complementary services
Majority ownership: 87.3% average interestMajority ownership: 87.3% average interest
14

General Shopping Brasil
15
Poli Shopping 50.0% 4,527 2,264 52 15,400Internacional Shopping 100.0% 75,958 75,958 292 -Auto Shopping 100.0% 11,477 11,477 80 -Santana Parque Shopping 50.0% 26,538 13,269 176 -Shopping Light 50.1% 14,140 7,092 134 -Suzano Shopping 100.0% 19,583 19,583 174 -Cascavel JL Shopping 85.5% 8,877 7,590 80 2,953Top Center Shopping 100.0% 6,166 6,166 55 -Americanas Prudente 100.0% 10,276 10,276 56 -Americanas Osasco 100.0% 3,218 3,218 19 -Shopping do Vale 84.4% 16,487 13,913 94 -Shopping Unimart 100.0% 10,233 10,233 91 -
87.3% 207,480 181,039 1,303 18,353
Convention Center 100.0% 25,730 25,730Sulacap 90.0% 32,000 28,800São Bernardo Project 50.0% 30,000 15,000Barueri Project 96.0% 25,000 24,000Itupeva Project (1) 50.0% 17,357 8,679
78.6% 130,087 102,209
Shopping Center Interest Total GLA (m²)
Own GLA(m²)
Nº Stores
Own GLA Expansion (m2)
Greenfield Interest Total GLA (m²)
Own GLA(m²)
(1) Considering an additional call of 20% stake

Portfolio
77,485
13,120
26,5388,877
6,16610,276
3,21816,487
10,233 6,463 3,000 3,454
15,400
30,000
17,357
25,00032,000
25,730
14,14011,477
356,421
Total GLA Evolution (m2)
Growth : 360%
Oct06
Jul07
Greenfields
Acquisitions
Expansions
Poli and Internacional
Shopping
Auto Shopping
Shopping Light
SuzanoShopping
Santana Parque
Shopping
Cascavel JL Shopping
Shopping Americanas
Pres. Prudente
Top Center Shopping São Paulo
Shopping Americanas
Osasco
Shopping do Vale
UnimartShopping
SuzanoShopping Expansion
InternacionalShopping Expansion
Cascavel JL Shopping Expansion
PoliShoppingExpansion
Convention Center
SulacapProject
BarueriProject
Outlet Project
São Bernardo do Campo
Project
TOTAL GLA
Dec08
16

Internacional Shopping Guarulhos - Expansion
17

Suzano Shopping - Expansion
18
East Wing Expansion West Wing Expansion
Parking ExpansionNova Entrada PrincipalNew Main Entrance
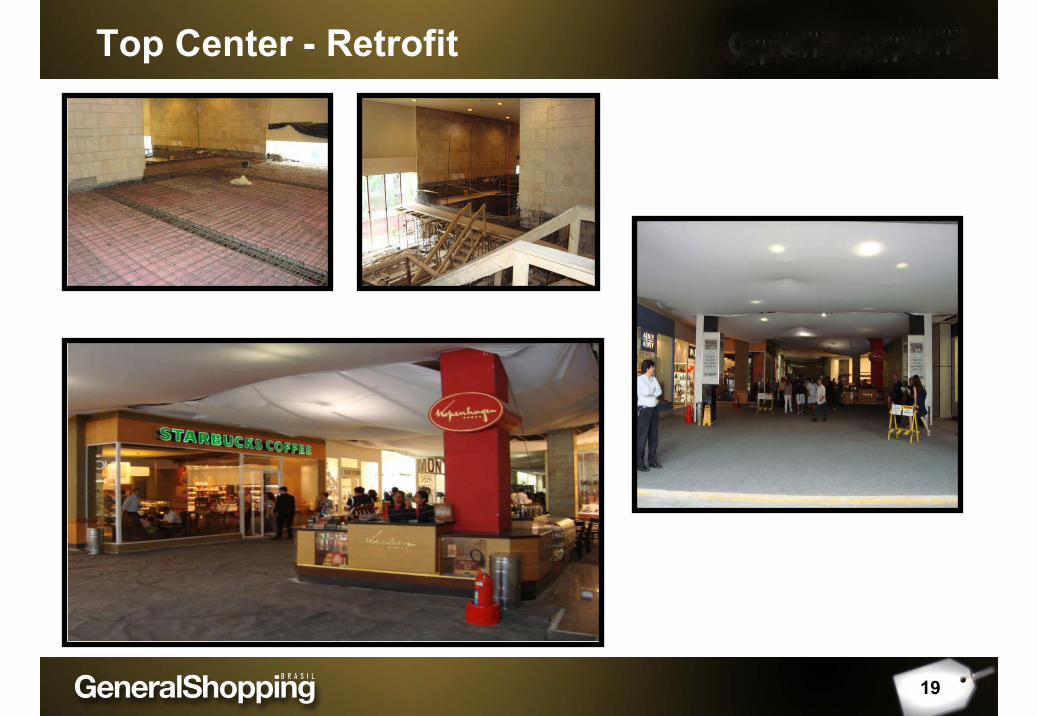
Top Center - Retrofit
19
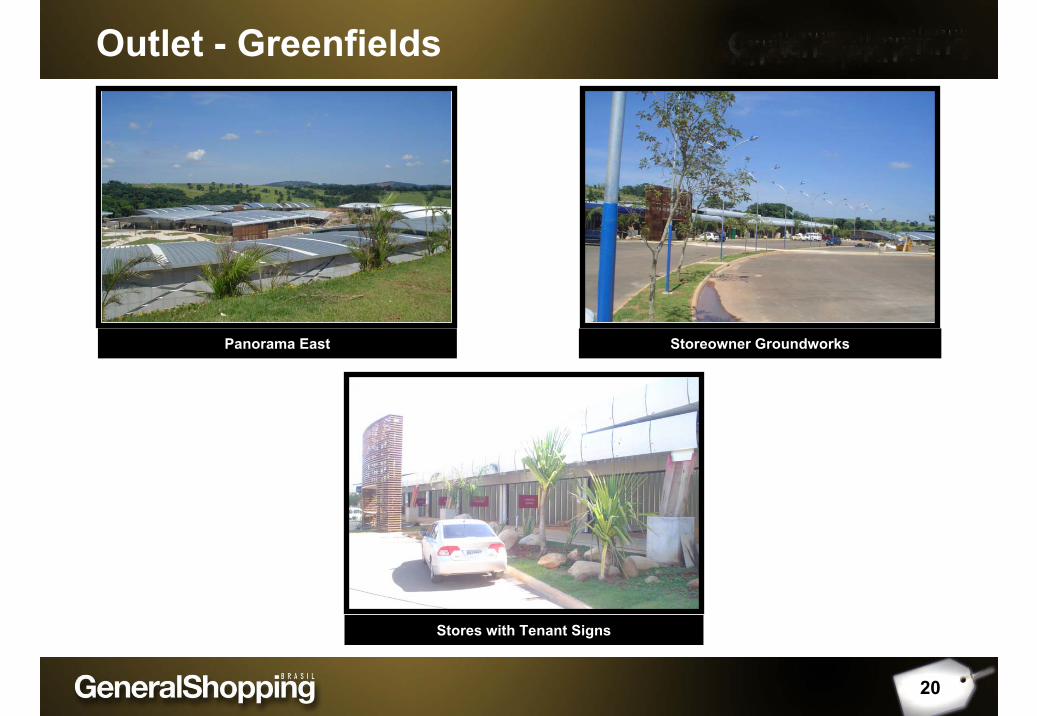
Outlet - Greenfields
20
Stores with Tenant Signs
Panorama East Storeowner Groundworks
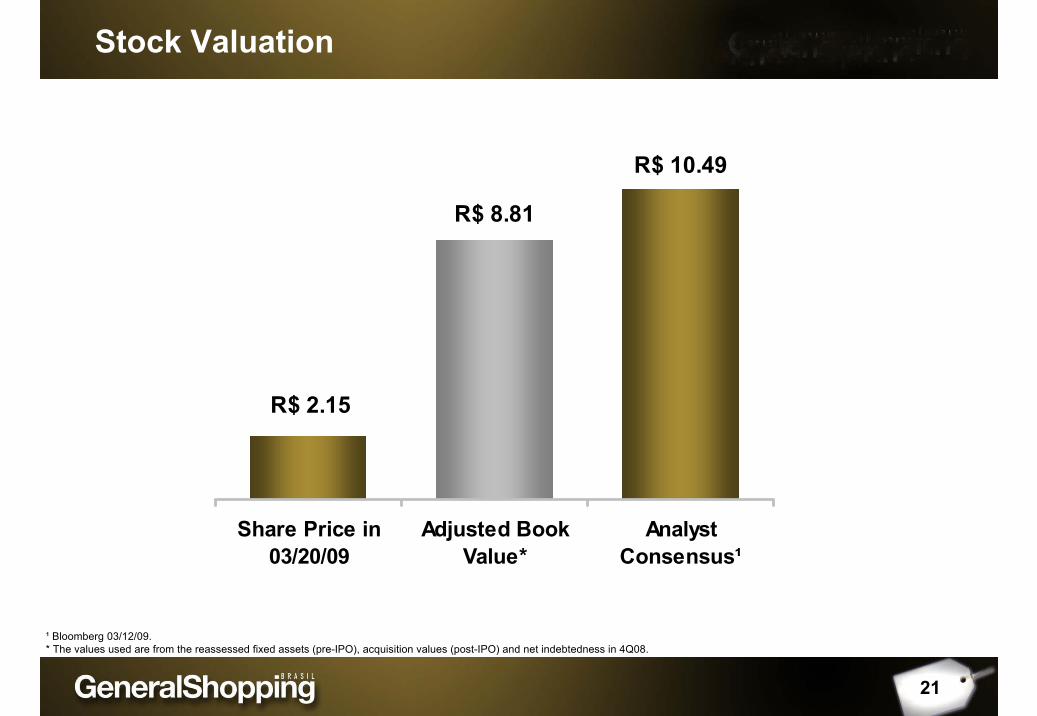
Stock Valuation
R$ 10.49
R$ 8.81
R$ 2.15
Share Price in03/20/09
Adjusted BookValue*
AnalystConsensus¹
21
¹ Bloomberg 03/12/09.* The values used are from the reassessed fixed assets (pre-IPO), acquisition values (post-IPO) and net indebtedness in 4Q08.

Shareholders
Market-making activities (through broker Ágora Senior) since October/07
40.59%
59.41%
Free float Controlling Stake
No. sharesControlling shareholder 29,990,000Free float 20,490,600Total 50,480,600
Listed since July 2007
22

23Sector Overview
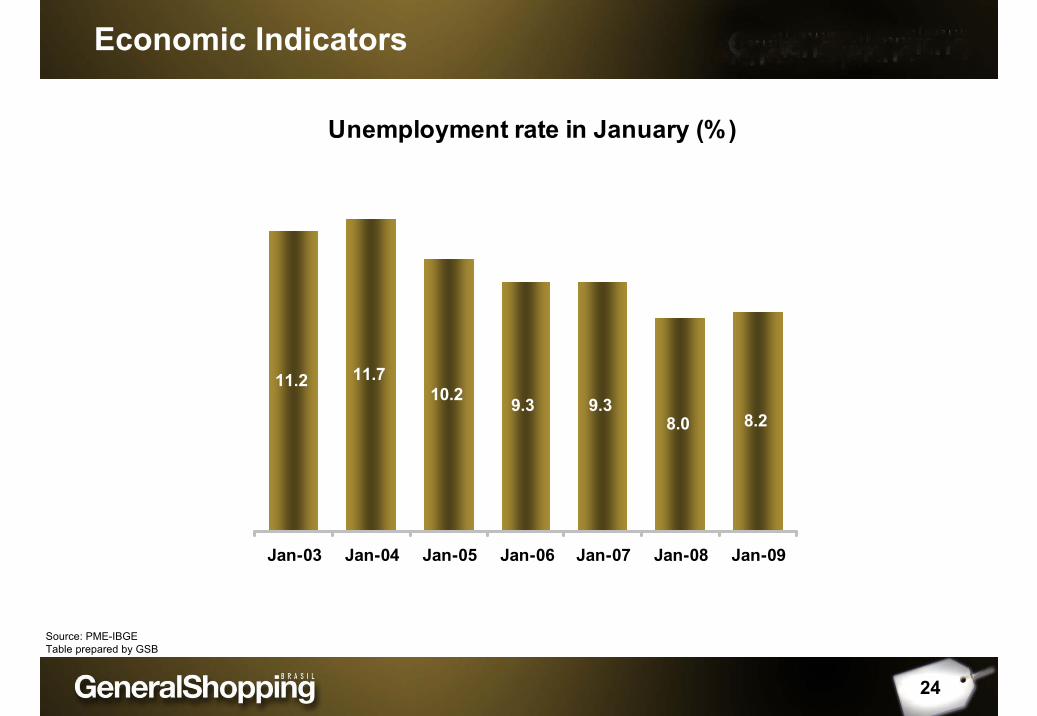
24
Source: PME-IBGETable prepared by GSB
Unemployment rate in January (%)
11.2 11.710.2 9.3 9.3
8.0 8.2
Jan-03 Jan-04 Jan-05 Jan-06 Jan-07 Jan-08 Jan-09
Economic Indicators
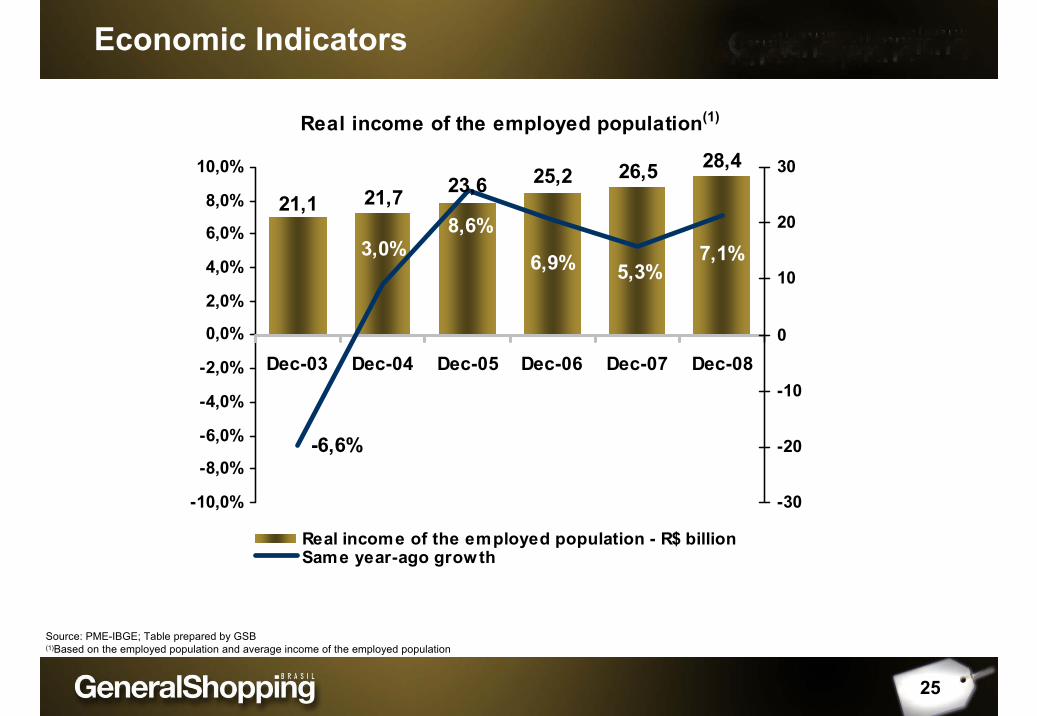
Real income of the employed population(1)
28,426,521,1 21,7 23,6 25,2
-6,6%
3,0%8,6%
6,9% 5,3%7,1%
-10,0%
-8,0%
-6,0%
-4,0%
-2,0%
0,0%
2,0%
4,0%
6,0%
8,0%
10,0%
Dec-03 Dec-04 Dec-05 Dec-06 Dec-07 Dec-08
-30
-20
-10
0
10
20
30
Real income of the employed population - R$ billionSame year-ago growth
25
Source: PME-IBGE; Table prepared by GSB(1)Based on the employed population and average income of the employed population
Economic Indicators

26
(1) Source: FGV study “Crônicas de uma crise anunciada:choques externos e a nova classe média” – February 2009Source: FGVTable prepared by GSB
Economic Indicators
AB Class C Class D Class E ClassDec-03 10.66 42.99 16.40 29.95Dec-04 11.66 47.57 15.50 25.27Dec-05 13.18 46.72 16.60 23.50Dec-06 14.07 49.98 14.86 21.09Dec-07 14.76 51.88 14.14 19.22Dec-08 15.33 53.81 13.18 17.68
Income Class Evolution in Brazil (%)
Oct/08 - Nov/08 Nov/08 - Dec/08 Dec/08 -Jan/09 Sep/08- Jan09
2,100 to 4,800 -3.5% -4.2% 0.2% 3.7% -1.9%4,800 to 9,600 -12.9% -3.3% -0.2% 5.9% -11.0%
Over 9,600 -14.1% -6.9% 2.5% 3.5% -15.2%
Consumer Confidence Index (FGV)
Family Income (R$) Sep/08 - Oct/08

Retail Growth in 2008
Source: IBGE
27
Jan-08 Feb-08 Mar-08 Apr-08 May-08 jun-08 Jul-08 Aug-08 Sep-08 Oct-08 Nov-08 Dec-08
Supermarkets and hypermarkets 19.1 18.4 18.3 10.6 21.7 15.2 18.8 20.0 11.7 18.9 17.7 13.3
Fabrics, clothing and footwear 19.0 16.4 16.1 25.7 9.5 16.0 14.6 10.8 15.9 7.2 -2.4 0.8
Furniture and white/durable goods 11.6 17.8 9.3 22.1 11.1 11.5 15.8 9.2 17.1 12.0 2.8 3.3
Pharmaceutical, medical, orthopedicand cosmetics products
16.5 14.8 10.9 17.4 15.5 12.3 19.3 12.4 21.1 17.5 17.3 18.1
Office supplies and equipment, personalcomputers and telecom
6.1 18.2 6.9 9.5 13.4 19.8 14.8 18.5 34.5 22.9 8.1 19.1
Books, newspapers, magazines and stationery 9.8 19.0 11.5 13.3 13.6 14.6 11.5 6.8 14.5 10.9 12.7 16.7
Other personal and domestic products 33.8 31.7 32.9 14.0 23.3 25.3 28.6 22.1 23.4 18.9 14.0 10.1
Vehicles, motorcycles and autoparts 23.2 33.6 17.4 32.1 17.3 30.2 28.7 5.4 31.7 -5.2 -18.9 -5.1
Total 18.5 22.9 15.9 20.6 17.0 20.3 22.9 12.6 21.8 8.9 1.2 5.6
ABRASCE 7.9 17.1 17.4 7.3 11.0 9.5 15.2 15.4 21.3 7.3 10.9 5.3
Activities Annual growth (%)

GSB INVESTOR RELATIONS
Alessandro Poli VeroneziInvestor Relations Director
Marcio SniokaInvestor Relations Manager
55 11 3159-5100
www.generalshopping.com.br
Contacts
28