Apresenta??o Corporativa - Morgan Stanley*
31
Corporate Presentation February 2015
Transcript of Apresenta??o Corporativa - Morgan Stanley*
8/9/2019 Apresenta??o Corporativa - Morgan Stanley*
http://slidepdf.com/reader/full/apresentao-corporativa-morgan-stanley 1/31
Corporate PresentationFebruary 2015
8/9/2019 Apresenta??o Corporativa - Morgan Stanley*
http://slidepdf.com/reader/full/apresentao-corporativa-morgan-stanley 2/31
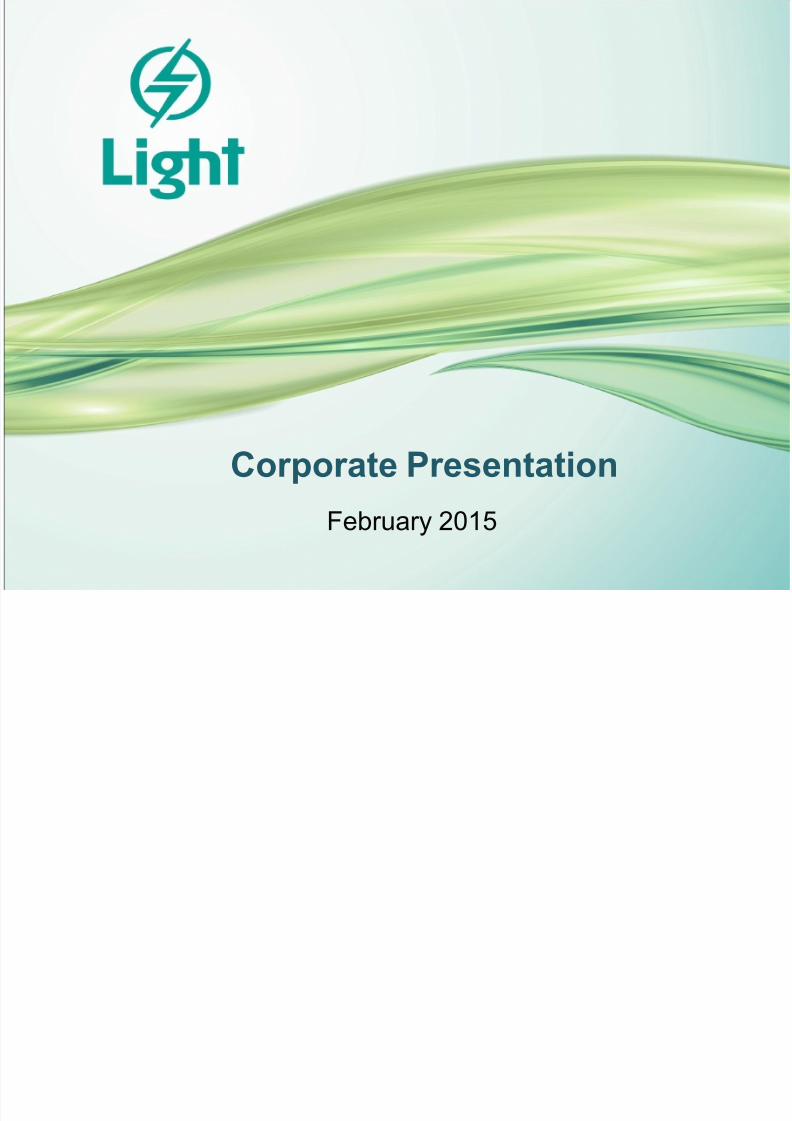
Light HoldingsDiversified structure which is comprised of the distribution, generation
and commercialization segments.
2
8/9/2019 Apresenta??o Corporativa - Morgan Stanley*
http://slidepdf.com/reader/full/apresentao-corporativa-morgan-stanley 3/31
4
56
7
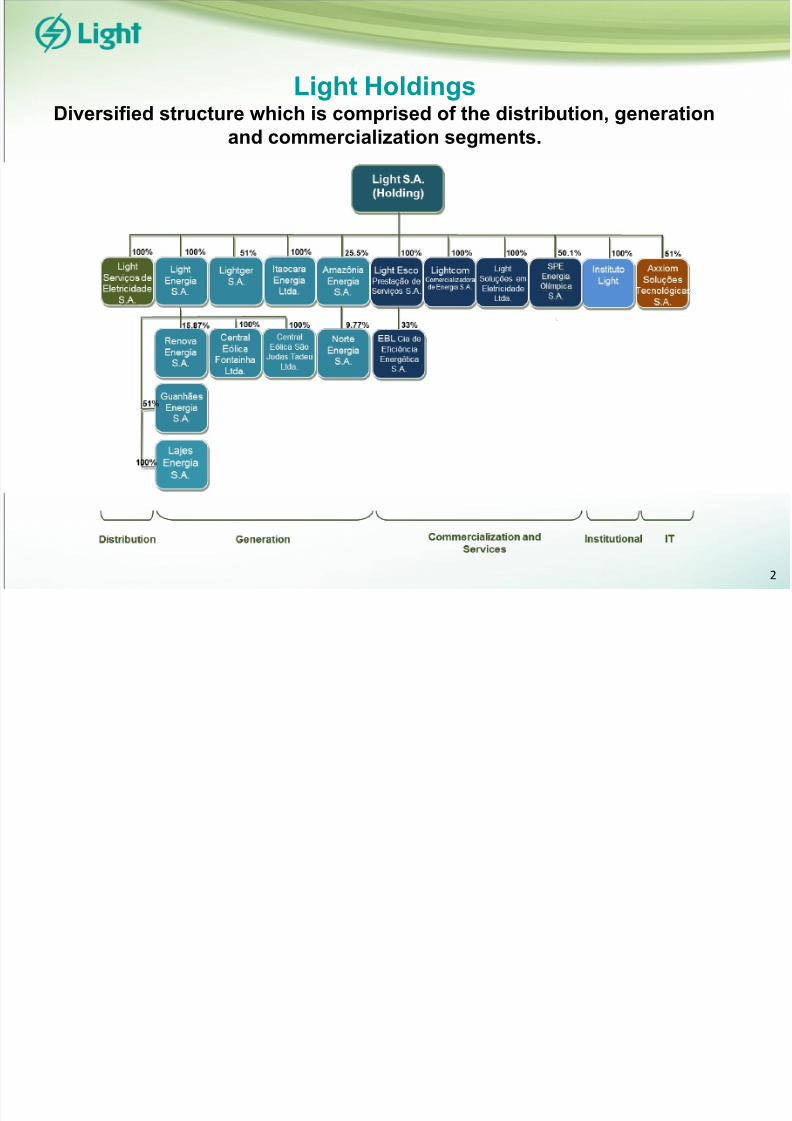
Light in numbers
Amazônia Energia
Renova
Guanhães Energia
Generation
Complexo de Lajes
Distribution RJ State ConcessionArea %
Population¹ 16 mn 11 mn 68%
Area¹ 44,000 Km² 11,000 Km² 25%
GDP¹ R$ 407 bn R$ 207 bn 51%
# Consumers 7 mn 4 mn 57%
# Municipalities 92 31 34%
5
HPP Ilha dos Pombos
SHP Paracambi
HPP Santa Branca
1
2
3
1 IBGE (2010)
4
6
7
3
8/9/2019 Apresenta??o Corporativa - Morgan Stanley*
http://slidepdf.com/reader/full/apresentao-corporativa-morgan-stanley 4/31
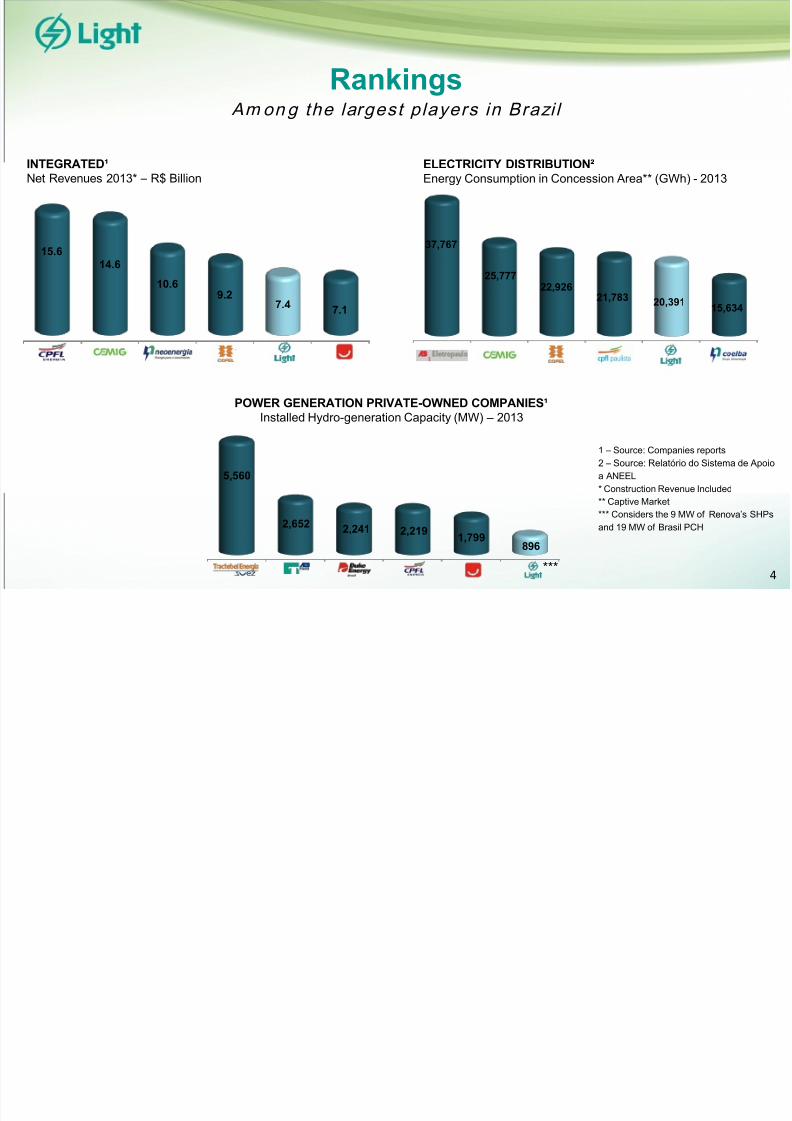
Rankings Am on g the larges t p layers in Brazi l
INTEGRATED¹Net Revenues 2013* – R$ Billion
POWER GENERATION PRIVATE-OWNED COMPANIES¹Installed Hydro-generation Capacity (MW) – 2013
37,767
25,777 22,92621,783 20,391 15,634
15.6
10.69.2
7.4 7.1
5,560
2,652 2,241 2,219 1,799896
ELECTRICITY DISTRIBUTION²Energy Consumption in Concession Area** (GWh) - 2013
1 – Source: Companies reports2 – Source: Relatório do Sistema de Apoioa ANEEL* Construction Revenue Included** Captive Market*** Considers the 9 MW of Renova’s SHPsand 19 MW of Brasil PCH
*** 4
14.6
8/9/2019 Apresenta??o Corporativa - Morgan Stanley*
http://slidepdf.com/reader/full/apresentao-corporativa-morgan-stanley 5/31
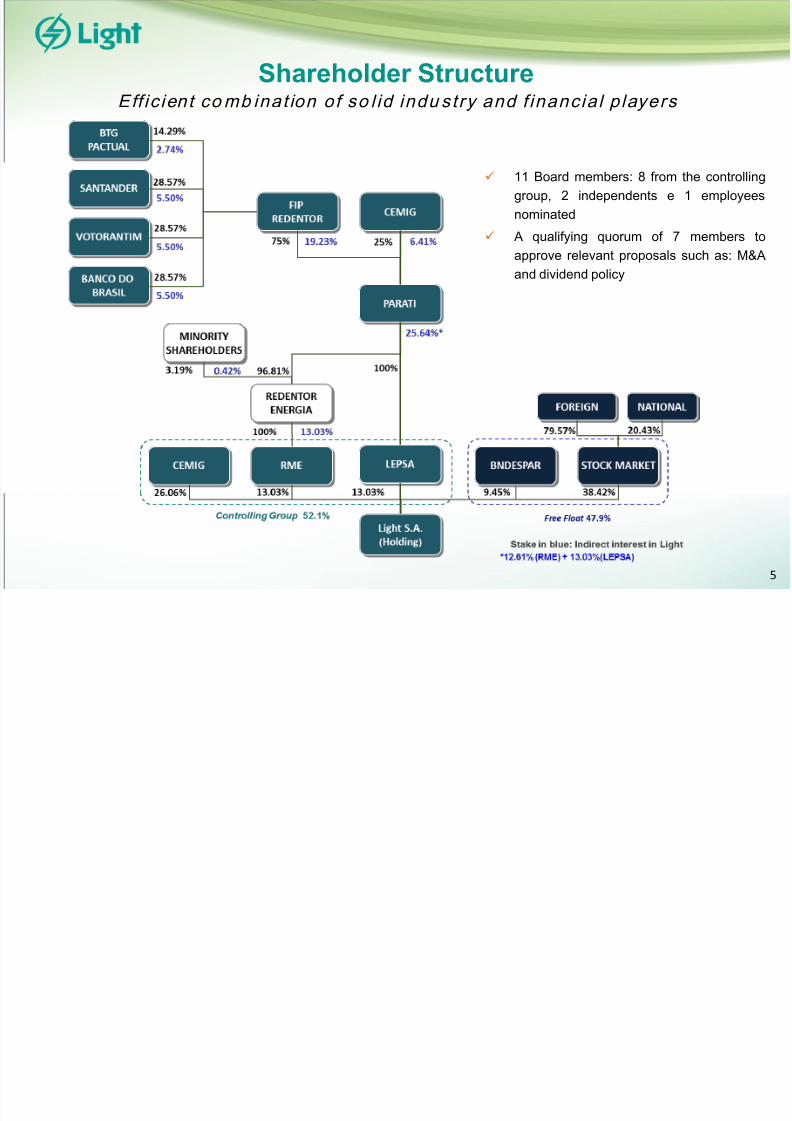
Shareholder StructureEff ic ien t co mb ina t ion o f so l id indu s t ry and f inanc ia l p layer s
11 Board members: 8 from the controllinggroup, 2 independents e 1 employeesnominated
A qualifying quorum of 7 members toapprove relevant proposals such as: M&A
and dividend policy
5
8/9/2019 Apresenta??o Corporativa - Morgan Stanley*
http://slidepdf.com/reader/full/apresentao-corporativa-morgan-stanley 6/31
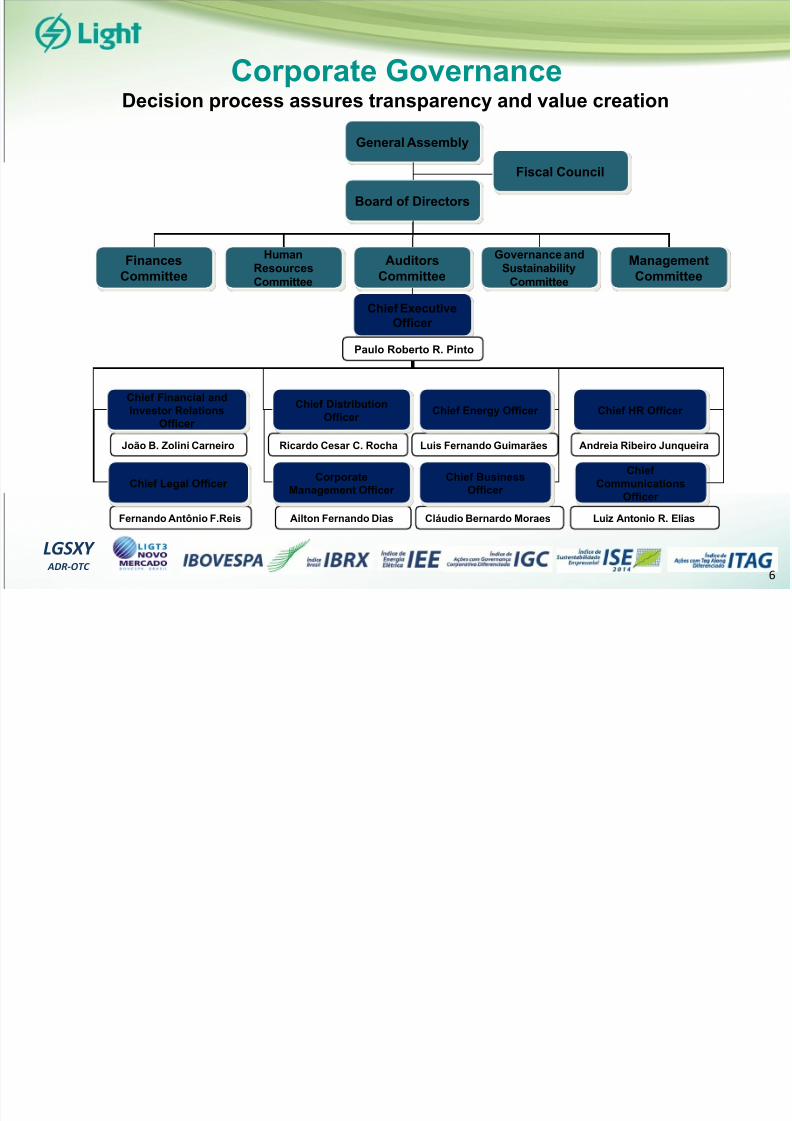
Corporate GovernanceDecision process assures transparency and value creation
General Assembly
Fiscal Council
Board of Directors
Auditors
Committee
Governance andSustainability
Committee
HumanResourcesCommittee
Finances
Committee
Management
Committee
Chief ExecutiveOfficer
João B. Zolini Carneiro Ricardo Cesar C. Rocha Luis Fernando Guimarães Andreia Ribeiro Junqueira
Fernando Antônio F.Reis Ailton Fernando Dias Cláudio Bernardo Moraes
Paulo Roberto R. Pinto
ChiefCommunications
Officer
Luiz Antonio R. Elias
LGSXY ADR-OTC
6
Chief Financial and
Investor RelationsOfficer
Chief Legal Officer
Chief HR OfficerChief Distribution
Officer Chief Energy Officer
Chief BusinessOfficer
CorporateManagement Officer
8/9/2019 Apresenta??o Corporativa - Morgan Stanley*
http://slidepdf.com/reader/full/apresentao-corporativa-morgan-stanley 7/31
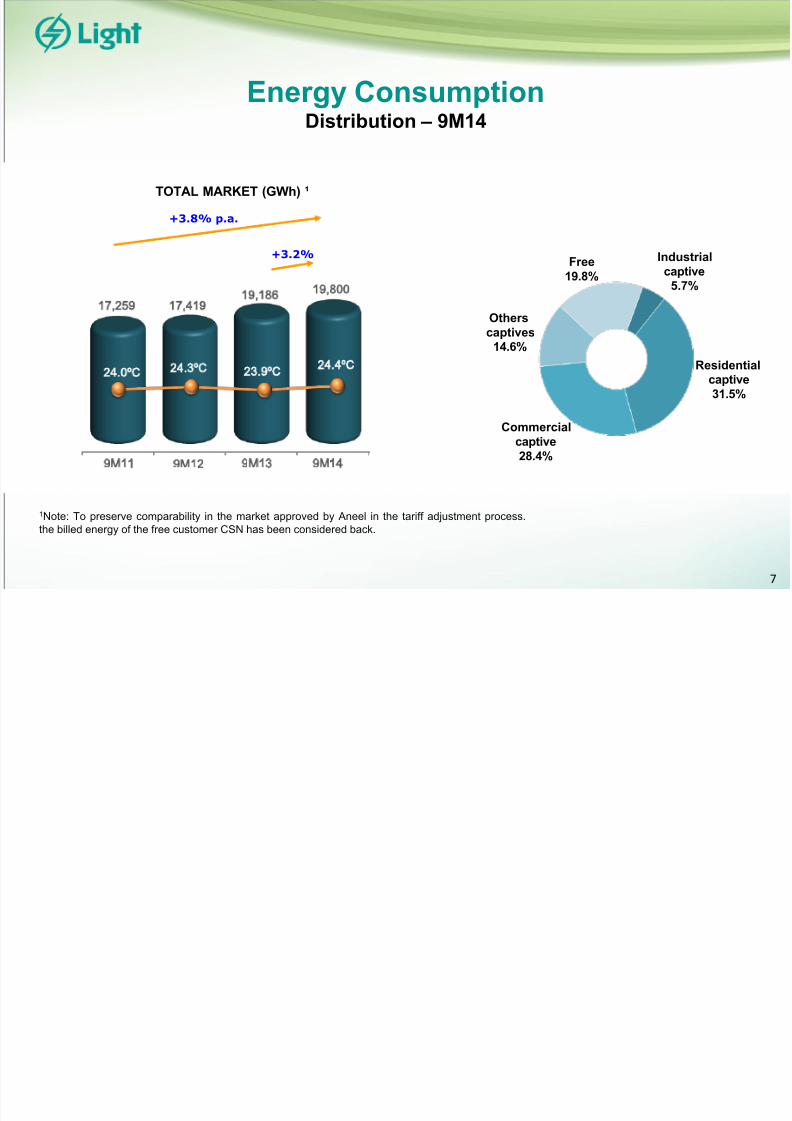
Energy Consumption Distribution – 9M14
7
1Note: To preserve comparability in the market approved by Aneel in the tariff adjustment process.the billed energy of the free customer CSN has been considered back.
TOTAL MARKET (GWh) ¹
Industrial
captive5.7%
Free
19.8%
Otherscaptives
14.6%
Commercialcaptive28.4%
Residentialcaptive31.5%
+3.2%
+3.8% p.a.
19,18617,4197,259
19,800
23.9ºC 24.4ºC
9M12M11
24.3ºC24.0ºC
9M13 9M14
8/9/2019 Apresenta??o Corporativa - Morgan Stanley*
http://slidepdf.com/reader/full/apresentao-corporativa-morgan-stanley 8/31
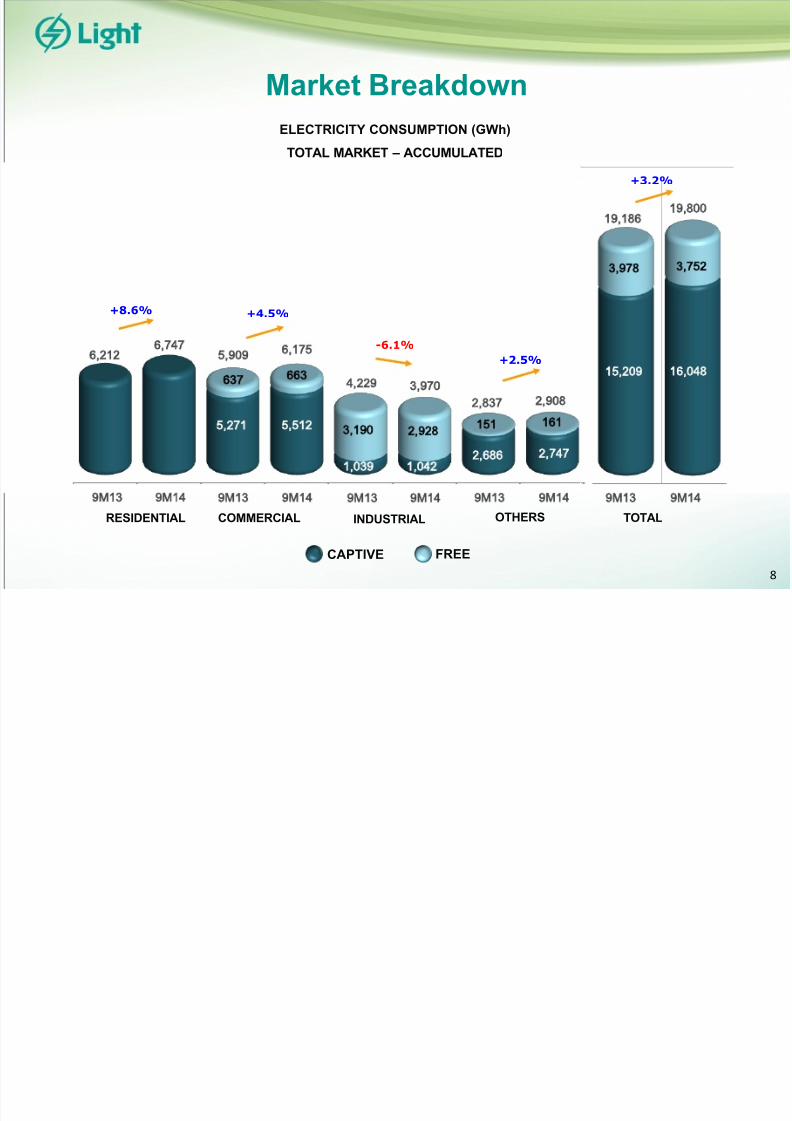
Market Breakdown
8
ELECTRICITY CONSUMPTION (GWh)
TOTAL MARKET – ACCUMULATED
FREECAPTIVE
RESIDENTIAL INDUSTRIALCOMMERCIAL OTHERS TOTAL
+3.2%
9M13 9M14
15,209 16,048
19,186
3,978 3,752
19,800
+2.5%
2,686 2,747
2,837
151 161
2,908
+4.5%
5,909
637 663
6,175
1,039 1,042
4,229
3,190 2,928
3,970
+8.6%
6,2126,747
9M13 9M14 9M13 9M14 9M13 9M14 9M13 9M14
-6.1%
5,271 5,512
8/9/2019 Apresenta??o Corporativa - Morgan Stanley*
http://slidepdf.com/reader/full/apresentao-corporativa-morgan-stanley 9/31
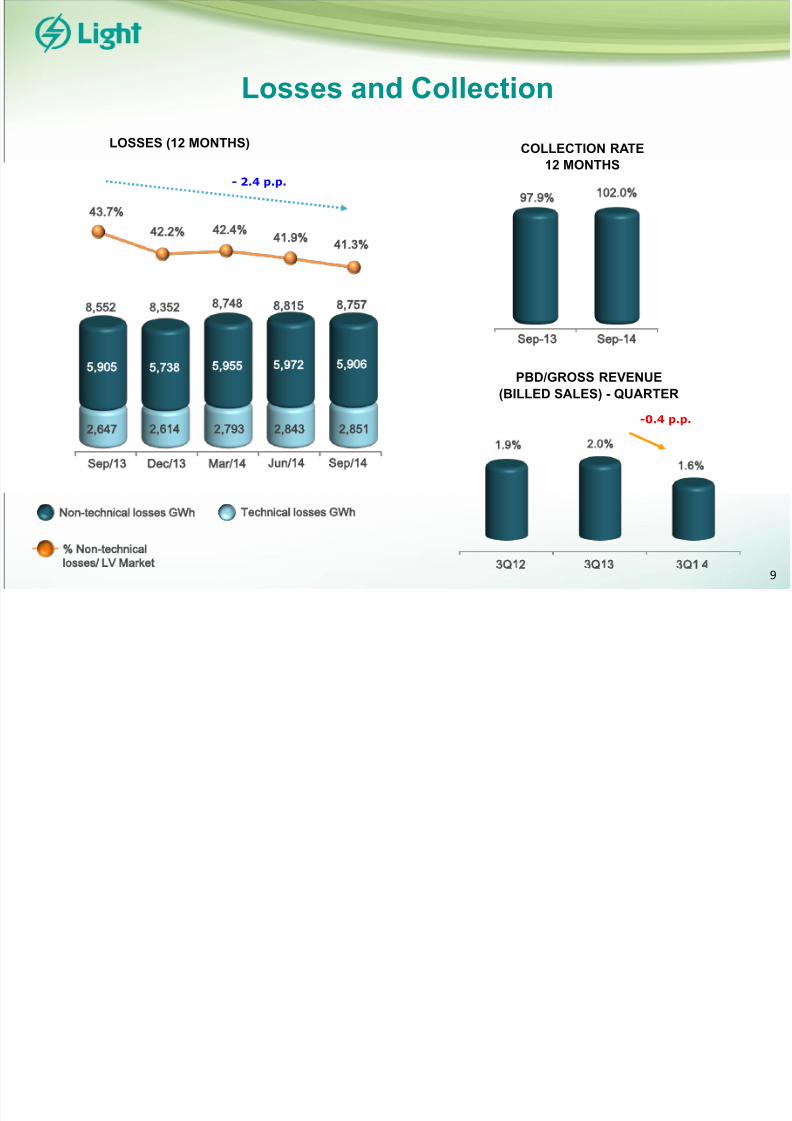
Losses and Collection
9
LOSSES (12 MONTHS)
% Non-technicallosses/ LV Market
Non-technical losses GWh Technical losses GWh
PBD/GROSS REVENUE(BILLED SALES) - QUARTER
COLLECTION RATE12 MONTHS
97.9% 102.0%
Sep-13 Sep-14
Sep/14ep/13 Mar/14 Jun/14ec/13
43.7%
5,738
2,614
8,552
41.3%
5,972
2,843
8,352
41.9%
5,906
2,851
8,815
5,905
2,647
8,757
- 2.4 p.p.
42.2% 42.4%
5,955
2,793
8,748
3Q12 3Q1 4Q13
1.9% 2.0%
1.6%
-0.4 p.p.

8/9/2019 Apresenta??o Corporativa - Morgan Stanley*
http://slidepdf.com/reader/full/apresentao-corporativa-morgan-stanley 10/31
Loss Reduction StrategyEfficient combination between technology and effective management
Outisde of Communities
Communities
CUSTOMERS ENERGY AND STATUS
Retail and residential clients(Low Voltage)
4,100,000
Low VoltageLargest Clients
22,000
LargeClients
(hight andmed voltage)
7,600
11,500 GWh (48%)100% Concluded
2,700 GWh (11%)1/3 as of today until 2015
10,000 GWh (41%)APZ
10
2010 2011 2013012
115
Sep/14
351
3079
102227
432
272
330
7
122
197
131
570
439
8/9/2019 Apresenta??o Corporativa - Morgan Stanley*
http://slidepdf.com/reader/full/apresentao-corporativa-morgan-stanley 11/31
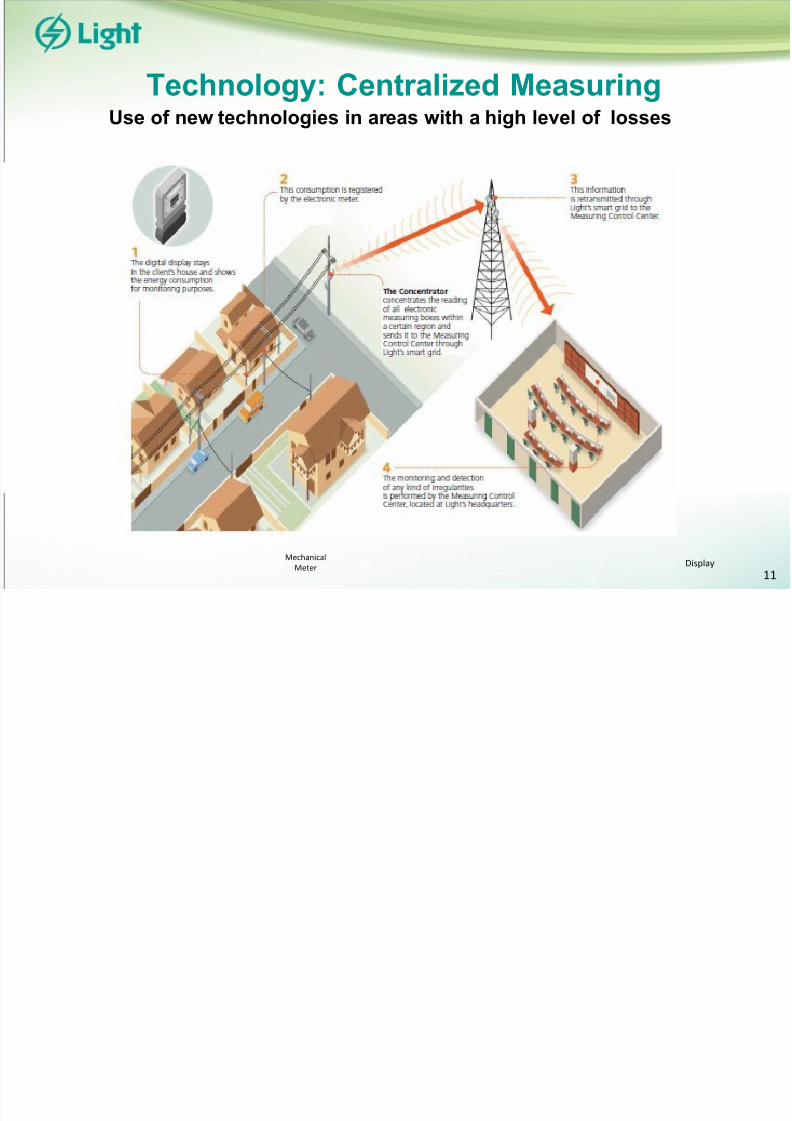
MechanicalMeter Display
11
Technology: Centralized MeasuringUse of new technologies in areas with a high level of losses

8/9/2019 Apresenta??o Corporativa - Morgan Stanley*
http://slidepdf.com/reader/full/apresentao-corporativa-morgan-stanley 12/31
Focused in areas with 10,000 to 20,000 clients with high level of losses anddelinquency;
Fully-dedicated teams of technicians and commercial agents;
Results constantly and accurately monitored by Light;
Result-linked remuneration for services provided;
29 units implemented with 511 thousand
clients (12% of total);200 thousands additional clients per year .
Zero Losses AreaProject: “Light Legal”
12
ELECTRONICMETERS
WORKFORCEMANAGEMENT
PARTNERSHIP WITH THE STATEGOVERNMENT
8/9/2019 Apresenta??o Corporativa - Morgan Stanley*
http://slidepdf.com/reader/full/apresentao-corporativa-morgan-stanley 13/31
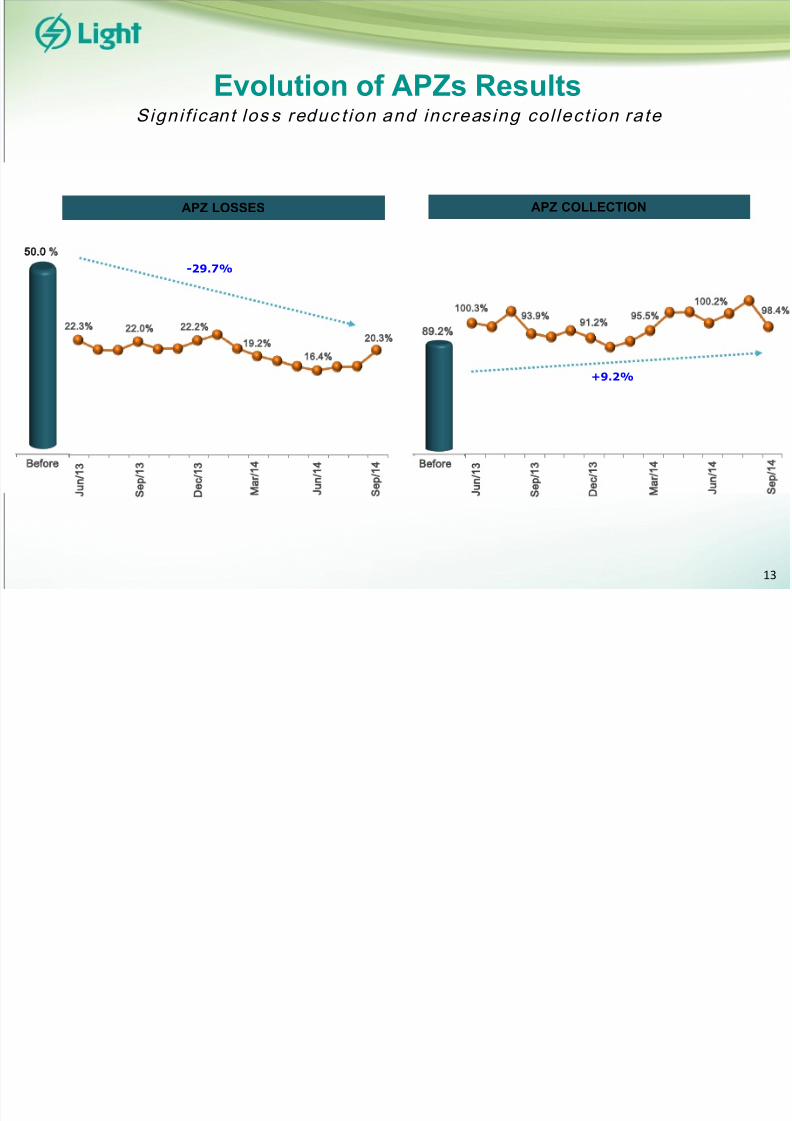
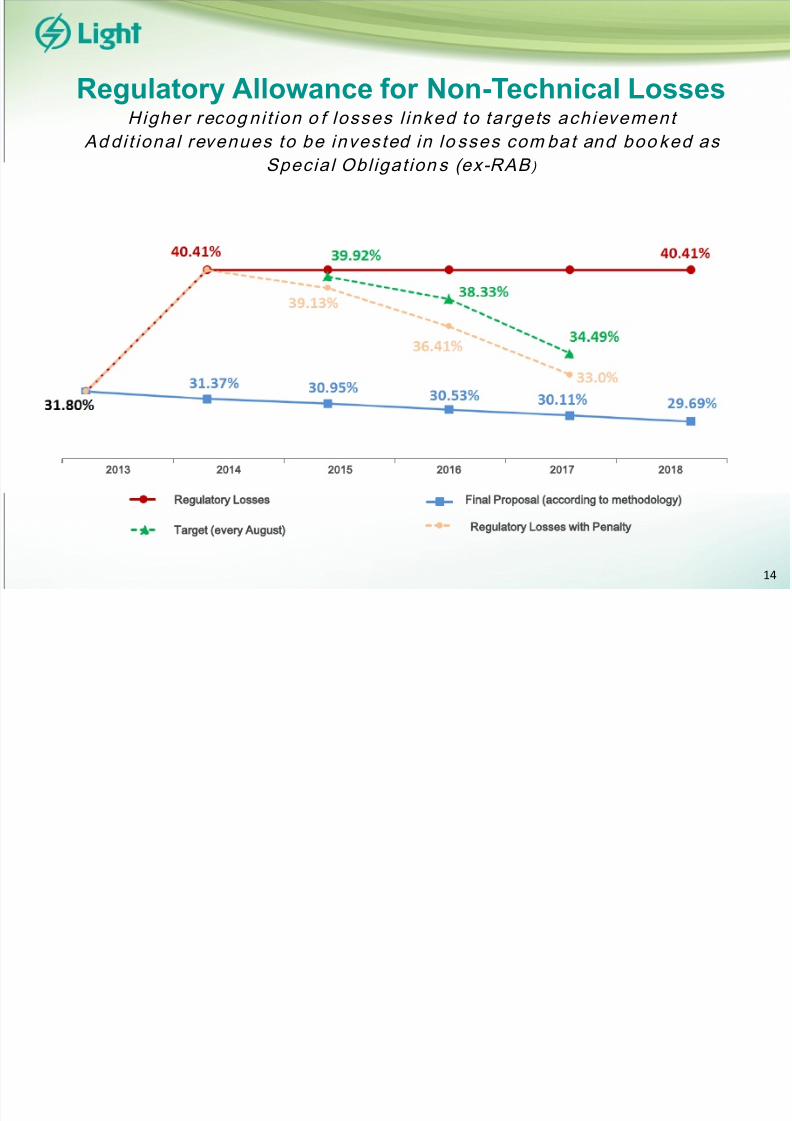
APZ COLLECTIONAPZ LOSSES
Evolution of APZs ResultsSign i f ican t lo s s r educ t ion and inc reas ing co l lec t ion r a te
Before
50.0 %
19.2%89.2%
95.5%
Before
100.2%98.4%00.3%
93.9%
20.3%22.3% 22.0%
13
Ma1
J
1
S
1
J
1
S
1
Ma1
S
1
J
1
S
1
-29.7%
+9.2%
D
1
91.2%
D
1
22.2%
J
1
16.4%
8/9/2019 Apresenta??o Corporativa - Morgan Stanley*
http://slidepdf.com/reader/full/apresentao-corporativa-morgan-stanley 14/31

8/9/2019 Apresenta??o Corporativa - Morgan Stanley*
http://slidepdf.com/reader/full/apresentao-corporativa-morgan-stanley 15/31
Generation
8/9/2019 Apresenta??o Corporativa - Morgan Stanley*
http://slidepdf.com/reader/full/apresentao-corporativa-morgan-stanley 16/31
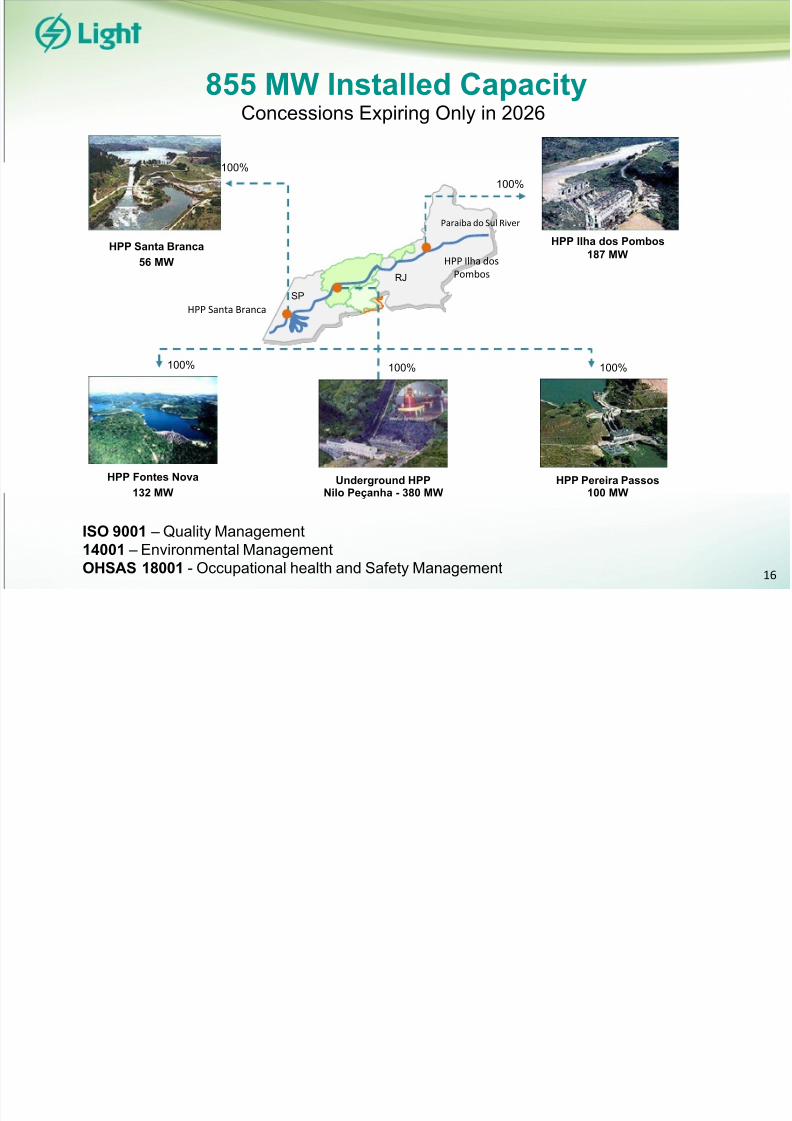
855 MW Installed CapacityConcessions Expiring Only in 2026
16
HPP Santa Branca56 MW
HPP Ilha dos Pombos187 MW
HPP Fontes Nova132 MW
Underground HPPNilo Peçanha - 380 MW
HPP Pereira Passos100 MW
SPRJ
HPP Santa Branca
Paraiba do Sul River
HPP Ilha dos
Pombos
100%100%
100%100%100%
ISO 9001 – Quality Management
14001 – Environmental ManagementOHSAS 18001 - Occupational health and Safety Management

8/9/2019 Apresenta??o Corporativa - Morgan Stanley*
http://slidepdf.com/reader/full/apresentao-corporativa-morgan-stanley 17/31
Contracted Energy (Free) Hedgevailable Energy
17
2015 2016 2017 2018 2019 2020 2021
28 28 28 28 28 28549 549 549 549 549 549 549
486 456 480 438
337247 232
35 66 41 83
184274 289
Average selling price in 2015-2021: R$ 169/MWh (base date: January, 2015)
Assured Energy: 549 MWaverageEnergy commercialization focused on the free market
28

8/9/2019 Apresenta??o Corporativa - Morgan Stanley*
http://slidepdf.com/reader/full/apresentao-corporativa-morgan-stanley 18/31
8/9/2019 Apresenta??o Corporativa - Morgan Stanley*
http://slidepdf.com/reader/full/apresentao-corporativa-morgan-stanley 19/31
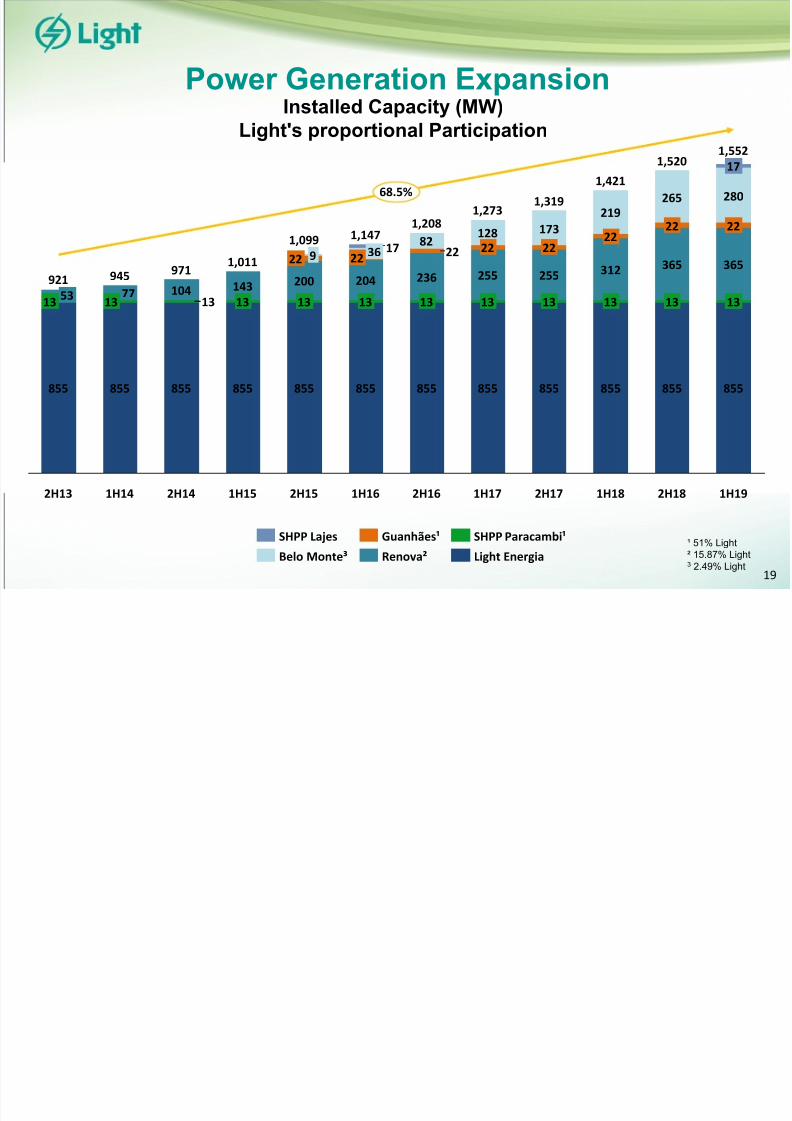
82 128 173
219265 280
13
2217
855
13255
22
1H17 1H19
1,552
855
13
365
22
104
1H14
945
855
1377
2H13
921
855
13 53
17
2H18
1,520
855
13
365
22
1H18
1,421
855
68.5%
13
312
22
2H17
13200
22 9
1H15
1,011
855
13143
2H14
971
855
1H16
1,147
1,319
13204
22 36
2H15
1,099
855
1,273
855
13255
22
2H16
1,208
855
13236
855
Light Energia
SHPP Paracambi¹
Renova²
Guanhães¹
Belo Monte³
SHPP Lajes ¹ 51% Light
² 15.87% Light3 2.49% Light
Power Generation ExpansionInstalled Capacity (MW)
Light's proportional Participation
19

8/9/2019 Apresenta??o Corporativa - Morgan Stanley*
http://slidepdf.com/reader/full/apresentao-corporativa-morgan-stanley 20/31
RESULTS
8/9/2019 Apresenta??o Corporativa - Morgan Stanley*
http://slidepdf.com/reader/full/apresentao-corporativa-morgan-stanley 21/31
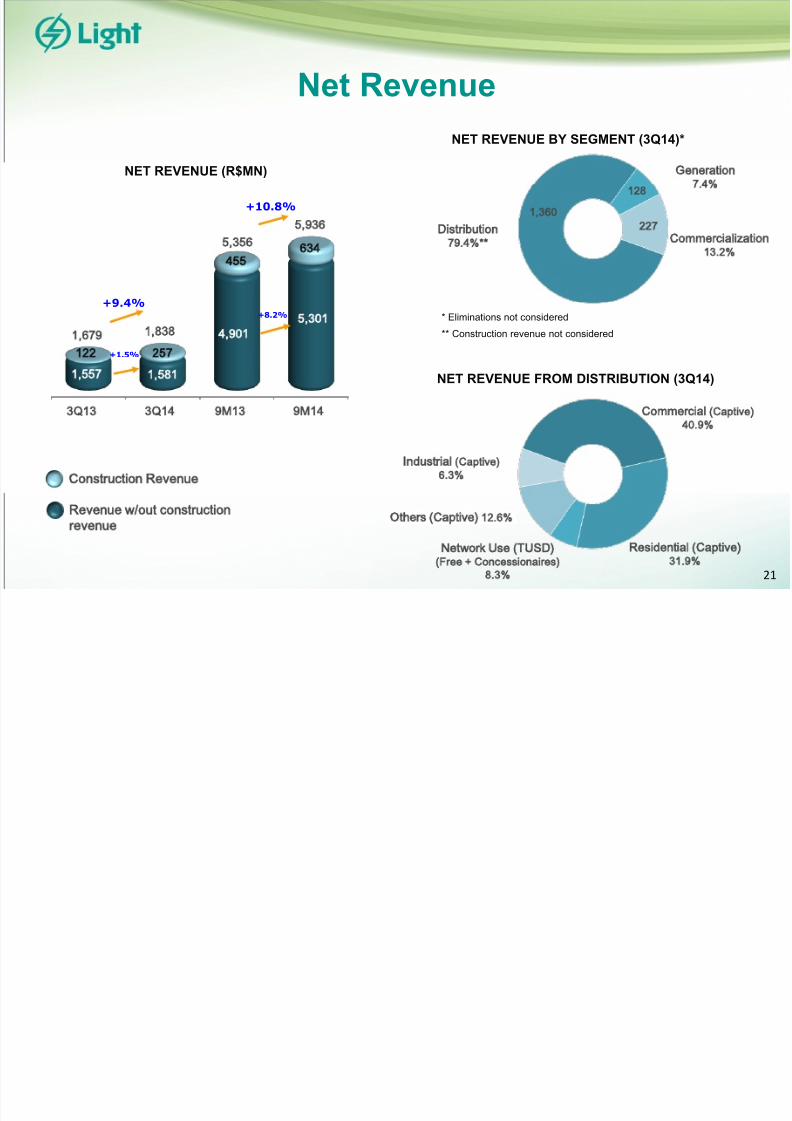
Net Revenue
Industrial (Captive)6.3%
NET REVENUE (R$MN) Generation 7.4%
Distribution 79.4%**
NET REVENUE BY SEGMENT (3Q14)*
Commercialization 13.2%
* Eliminations not considered
** Construction revenue not considered
NET REVENUE FROM DISTRIBUTION (3Q14)
Commercial (Captive)40.9%
Others (Captive) 12.6%
Network Use (TUSD)(Free + Concessionaires)
8.3%
Residential (Captive)31.9%
Construction Revenue
Revenue w/out constructionrevenue
3Q14 9M13Q13 9M14
+9.4%
1,557 1,581
634455
1,679
5,356
4,9015,301
25722
1,838
5,936+10.8% 1,360
128
227
21
+1.5%
+8.2%
8/9/2019 Apresenta??o Corporativa - Morgan Stanley*
http://slidepdf.com/reader/full/apresentao-corporativa-morgan-stanley 22/31
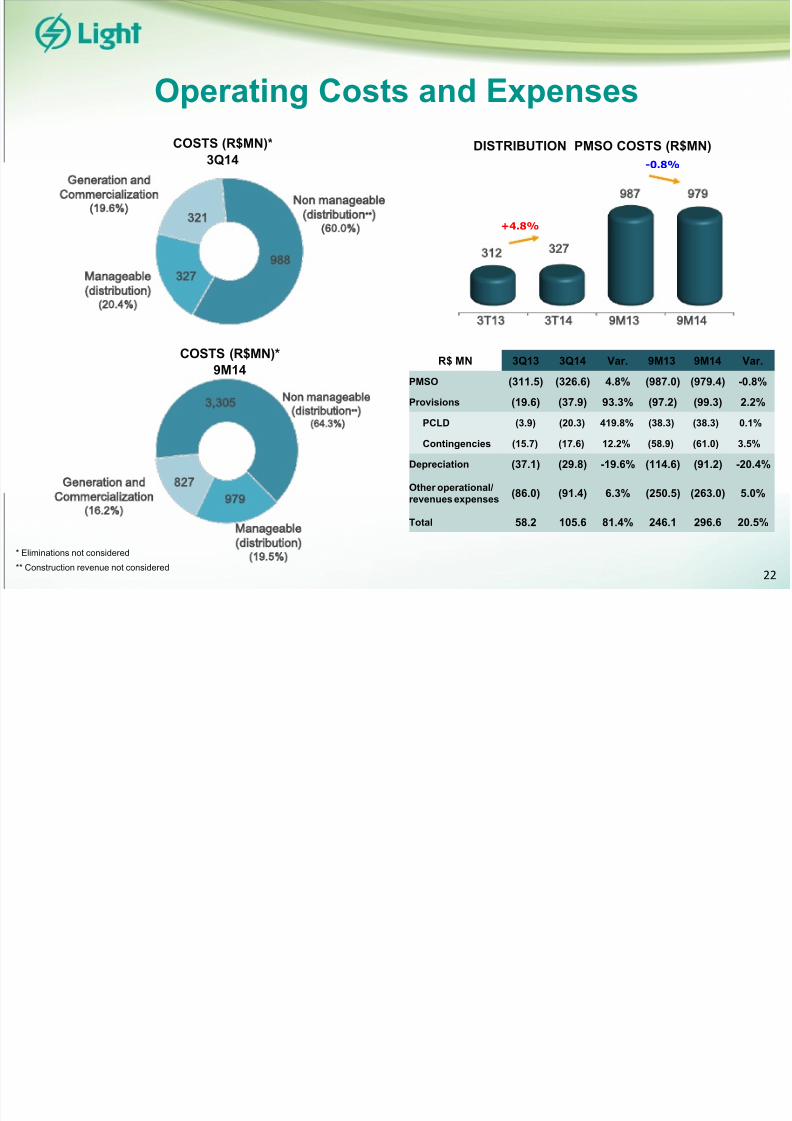
Operating Costs and Expenses
Manageable(distribution)(20.4%)
Generation andCommercialization
(19.6%)Non manageable
(distribution **)(60.0%)
* Eliminations not considered** Construction revenue not considered
DISTRIBUTION PMSO COSTS (R$MN)COSTS (R$MN)*3Q14
COSTS (R$MN)*9M14
Non manageable(distribution **)
(64.3%)
Generation andCommercialization
(16.2%)
Manageable(distribution)
(19.5%)
R$ MN 3Q13 3Q14 Var. 9M13 9M14 Var.
PMSO (311.5) (326.6) 4.8% (987.0) (979.4) -0.8%
Provisions (19.6) (37.9) 93.3% (97.2) (99.3) 2.2%
PCLD (3.9) (20.3) 419.8% (38.3) (38.3) 0.1%
Contingencies (15.7) (17.6) 12.2% (58.9) (61.0) 3.5%
Depreciation (37.1) (29.8) -19.6% (114.6) (91.2) -20.4%
Other operational/revenues expenses (86.0) (91.4) 6.3% (250.5) (263.0) 5.0%
Total 58.2 105.6 81.4% 246.1 296.6 20.5%
327
321
988
3,305
979827
312 327
+4.8%
3T14T13 9M14M13
987 979
-0.8%
22
8/9/2019 Apresenta??o Corporativa - Morgan Stanley*
http://slidepdf.com/reader/full/apresentao-corporativa-morgan-stanley 23/31
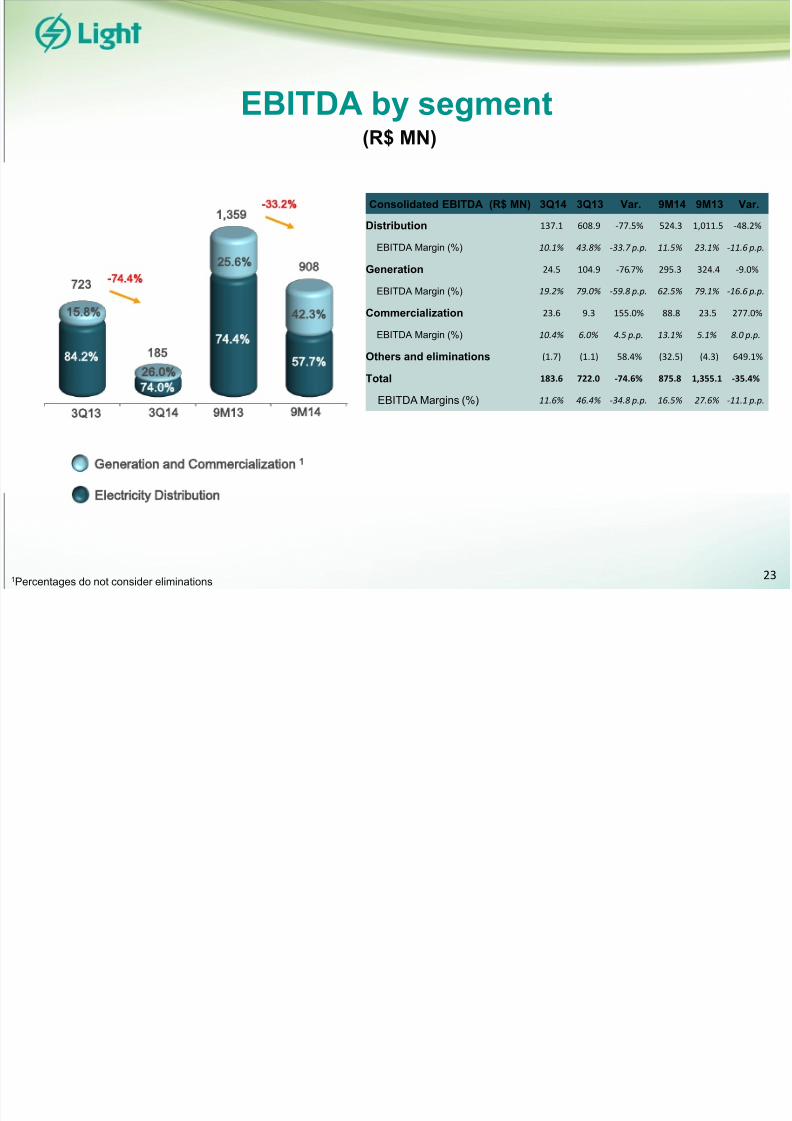
EBITDA by segment(R$ MN)
23
Generation and Commercialization 1
Electricity Distribution
56.0%
Consolidated EBITDA (R$ MN) 3Q14 3Q13 Var. 9M14 9M13 Var.
Distribution 137.1 608.9 -77.5% 524.3 1,011.5 -48.2%
EBITDA Margin (%) 10.1% 43.8% -33.7 p.p. 11.5% 23.1% -11.6 p.p.
Generation 24.5 104.9 -76.7% 295.3 324.4 -9.0%
EBITDA Margin (%) 19.2% 79.0% -59.8 p.p. 62.5% 79.1% -16.6 p.p.
Commercialization 23.6 9.3 155.0% 88.8 23.5 277.0%
EBITDA Margin (%) 10.4% 6.0% 4.5 p.p. 13.1% 5.1% 8.0 p.p.
Others and eliminations (1.7) (1.1) 58.4% (32.5) (4.3) 649.1%
Total 183.6 722.0 -74.6% 875.8 1,355.1 -35.4%
EBITDA Margins (%) 11.6% 46.4% -34.8 p.p. 16.5% 27.6% -11.1 p.p.
185
-74.4%723
26.0%74.0%
15.8%
84.2%
3Q13 3Q14 9M13 9M14
74.4%
57.7%
25.6%
42.3%
-33.2%
908
1,359
1Percentages do not consider eliminations
8/9/2019 Apresenta??o Corporativa - Morgan Stanley*
http://slidepdf.com/reader/full/apresentao-corporativa-morgan-stanley 24/31
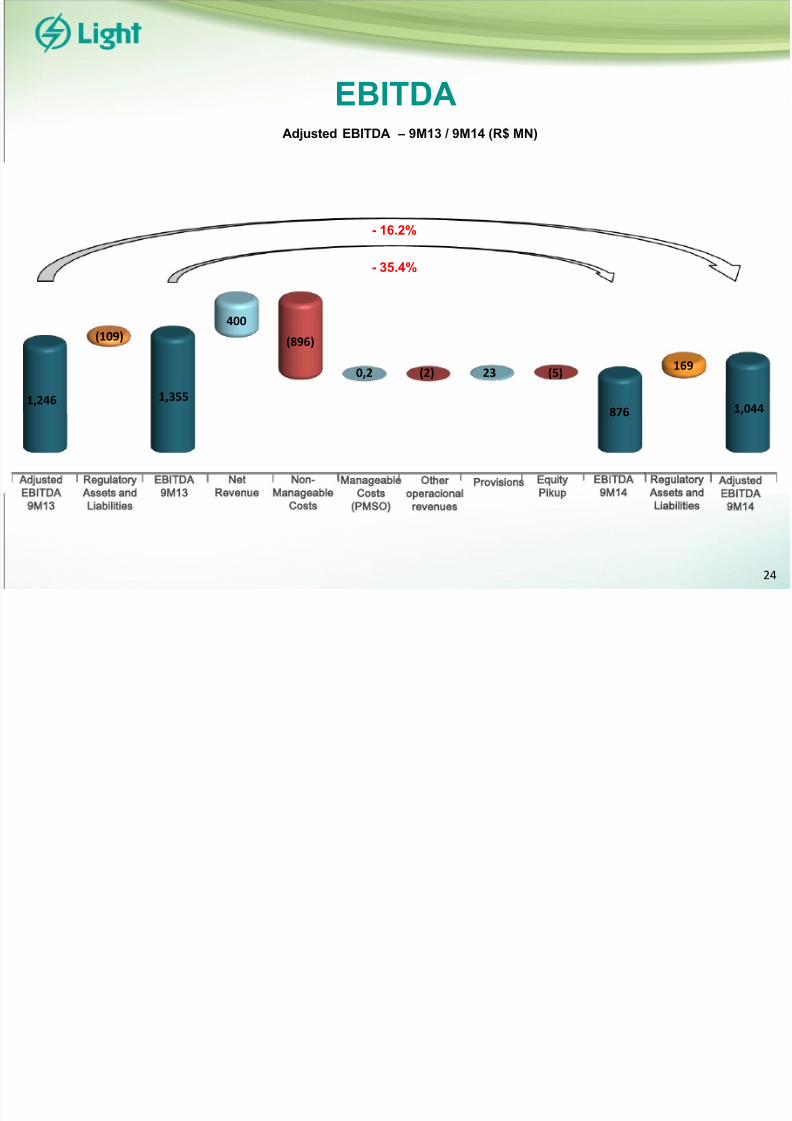
EBITDA
EBITDA9M13
EBITDA9M14
NetRevenue
Non-Manageable
Costs
ManageableCosts
(PMSO)
ProvisionsegulatoryAssets andLiabilities
RegulatoryAssets andLiabilities
AdjustedEBITDA
9M13
AdjustedEBITDA
9M14
Adjusted EBITDA – 9M13 / 9M14 (R$ MN)
Otheroperacional
revenues
EquityPikup
- 16.2%
- 35.4%
1,246
(109)
1,355
400
(896)
0,2 (2) 23 (5)
876
169
1,044
24
8/9/2019 Apresenta??o Corporativa - Morgan Stanley*
http://slidepdf.com/reader/full/apresentao-corporativa-morgan-stanley 25/31
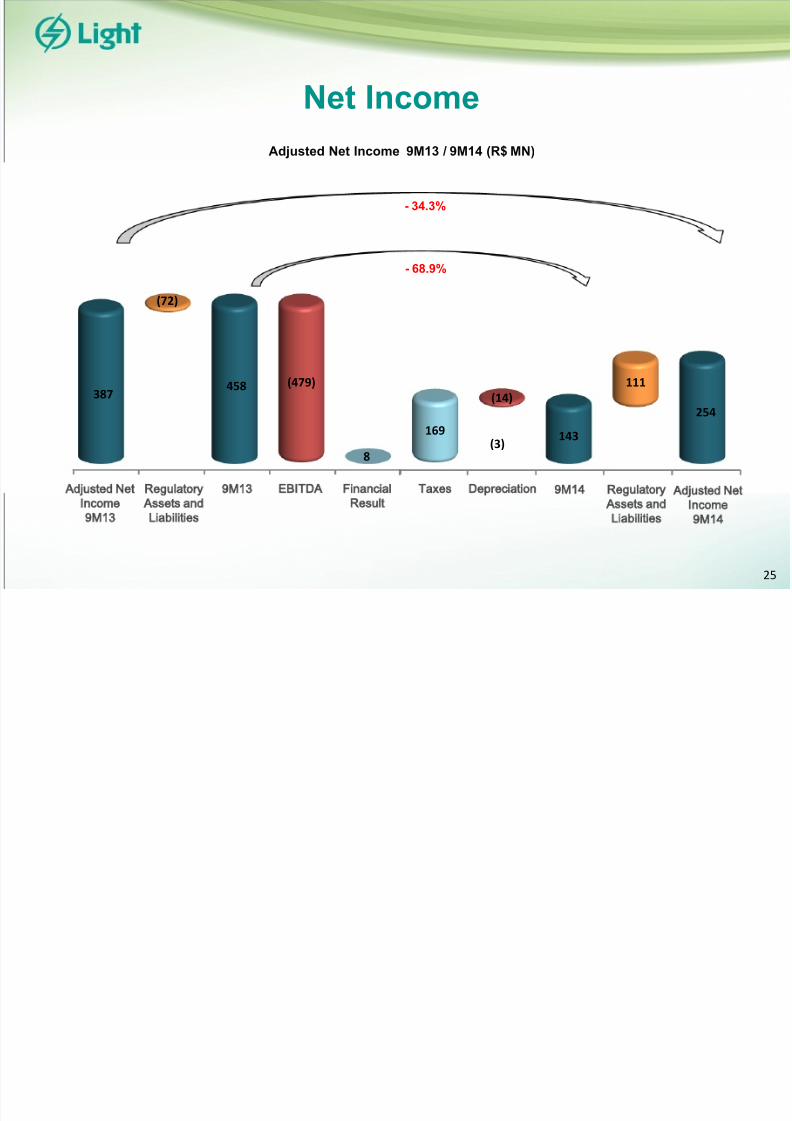
Net Income
9M13 9M14BITDA FinancialResult
Taxes Depreciation
Adjusted Net Income 9M13 / 9M14 (R$ MN)
RegulatoryAssets andLiabilities
RegulatoryAssets andLiabilities
Adjusted NetIncome9M13
Adjusted NetIncome9M14
(3)
- 68.9%
- 34.3%
387
(72)
458 (479)
8
169
(14)
143
111
254
25
8/9/2019 Apresenta??o Corporativa - Morgan Stanley*
http://slidepdf.com/reader/full/apresentao-corporativa-morgan-stanley 26/31

8/9/2019 Apresenta??o Corporativa - Morgan Stanley*
http://slidepdf.com/reader/full/apresentao-corporativa-morgan-stanley 27/31
Indebtedness
Average Term: 3.7 yearsAMORTIZATION SCHEDULE* (R$ MN)
27*Considering Hedge
* Principal only
Nominal Cost Real Cost
COST OF DEBT
2012011 3T14
2.24%
8.21%
4.47%
11.27%
4.25%
11.03%
2013
9.68%
3.55%
261
7911,055
866
1,210
721 733479
581
TJLP12.0%
CDI73.3%
IPCA10.8%
Others3.5%
U /Euro *0.3%
4,151.6
5,229.65,543.6
NET DEBT
Net Debt / EBITDA
Sep/13 Sep/14un/14
2.993.39
2.68
8/9/2019 Apresenta??o Corporativa - Morgan Stanley*
http://slidepdf.com/reader/full/apresentao-corporativa-morgan-stanley 28/31
8/9/2019 Apresenta??o Corporativa - Morgan Stanley*
http://slidepdf.com/reader/full/apresentao-corporativa-morgan-stanley 29/31
8/9/2019 Apresenta??o Corporativa - Morgan Stanley*
http://slidepdf.com/reader/full/apresentao-corporativa-morgan-stanley 30/31
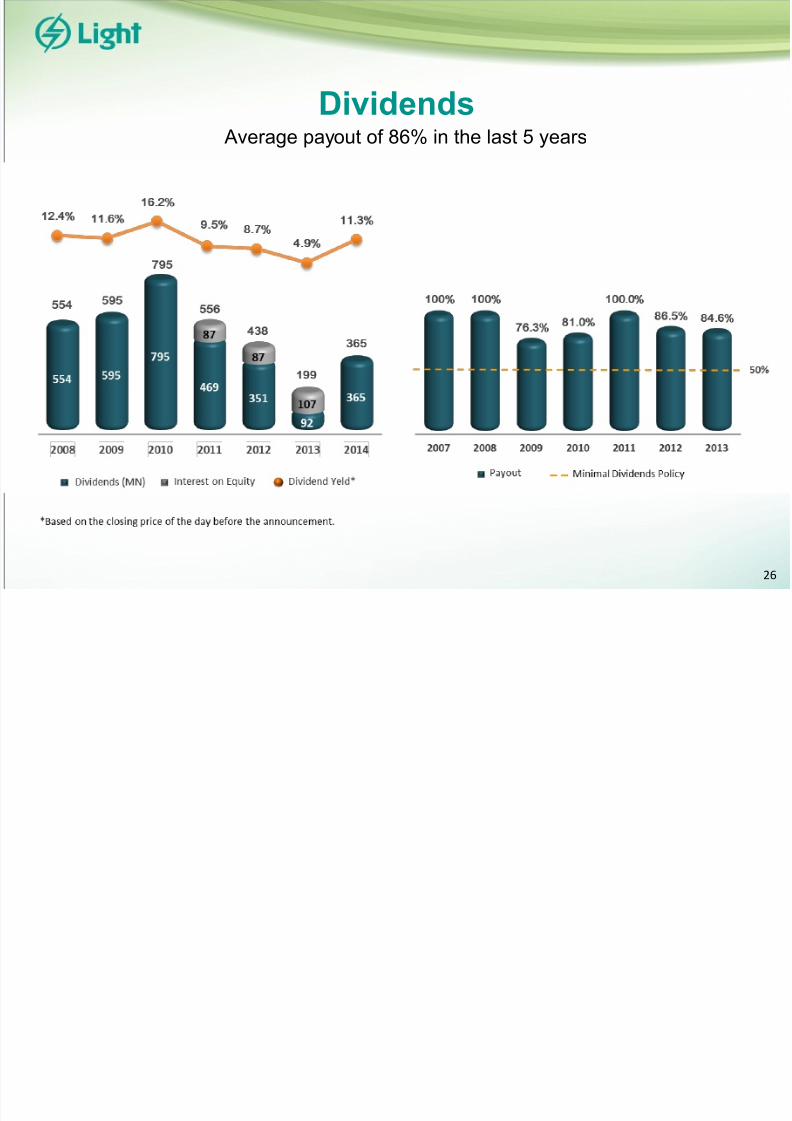
Disclaimer
This presentation may include forward-looking statements according to Brazilian regulations and international movablevalues. These statements are based on certain assumptions and analyses made by the Company in accordance with itsexperience, the economic environment, market conditions and future events expected, many of which are out of theCompany’s control. Important factors that can lead to significant differences between the actual results and statements onfuture events or business-oriented results include the Company’s strategy, the Brazilian and international economicconditions, technology, financial strategy, developments of the public service industry, hydrological conditions, conditions of
the financial market, uncertainty regarding the results of its future operations, plans, goals, expectations and intentions,among others. Because of these factors, the Company’s actual results may significantly differ from those indicated or implicitin the statements on events or future results.
The information and opinions herein must not be understood as recommendation to potential investors, and no investmentdecision should be based on the veracity, the updated or completeness of this information or opinions. None of theCompany’s professionals or parts related to them or its representatives will have any responsibility for any losses that canelapse from the use or the contents of this presentation.
This material includes declarations on future events submitted to risks and uncertainties, which are based on currentexpectations and projections on future events and trends that can affect the Company’s businesses. These declarationsinclude projections of economic growth and demand and supply of energy, in addition to information on competitive position,regulatory environment, potential growth opportunities and other subjects. Various factors can adversely affect the estimatesand assumptions on which these declarations are based on.
30
8/9/2019 Apresenta??o Corporativa - Morgan Stanley*
http://slidepdf.com/reader/full/apresentao-corporativa-morgan-stanley 31/31
Contacts
João Batista Zolini CarneiroCFO and IRO
Gustavo WerneckSuperintendent of Finance and Investor Relations
+55 21 2211 [email protected]
Mariana da Silva Rocha IR Manager
+ 55 21 2211 [email protected]
http://ri.light.com.br/ www.facebook.com/lightri twitter.com/LightRI