“Bailando no MUNDO” Ao clicar Temple Wat Rachnadda, Bangkok, Thailandia.

Rev. Caatinga, Mossoró, v. 31, n. 1, p. 28 – 39, jan. – mar., 2018
Universidade Federal Rural do Semi-Árido Pró-Reitoria de Pesquisa e Pós-Graduação
https://periodicos.ufersa.edu.br/index.php/caatinga
ISSN 0100-316X (impresso) ISSN 1983-2125 (online)
http://dx.doi.org/10.1590/1983-21252018v31n104rc
28
GENETIC DIVERSITY ASSESSMENT AMONG TALL COCONUT PALM1
KAMILA MARCELINO BRITO SOBRAL2, MANOEL ABÍLIO DE QUEIROZ3, CARLOS ALBERTO DA SILVA
LEDO4, CARINA MENDES LOIOLA5, JÉSSICA BARROS ANDRADE2, SEMÍRAMIS RABELO RAMALHO
RAMOS5*
ABSTRACT - The tall coconut (Cocos nucifera L.) has great socioeconomic importance in Brazil and was first
introduced on the coast of the north-eastern region, where it has been exploited in a semi-extractivist manner.
The goal of this study was to quantify the genetic divergence between accessions introduced and preserved at
the International Coconut Genebank for Latin America and the Caribbean, estimate the efficiency of descriptors
used in the discrimination of the accessions, and indicate the essential descriptors for the activities of
characterisation and evaluation. The accessions used were: Polynesia Tall; Tonga Tall; West African Tall;
Rennel Tall; Rotuma Tall; Vanuatu Tall; Malayan Tall and Brazilian Tall Praia-do-Forte. Thirty-five
quantitative descriptors recommended for the species were used. Genetic divergence was estimated by the
Mahalanobis’s generalised distance and the cluster analysis was performed using the unweighted pair group
method with arithmetic mean (UPGMA). The relative importance of the descriptors was measured according to
Singh and Jolliffe’s methods, and the variables were selected taking into consideration the matching
information in the two methods, eliminating those that were discarded in the two procedures. The agronomic
characteristics indicated that the first canonical variable explained 90.25% of total variance. The most efficient
descriptors for detecting the genetic divergence were: fruit equatorial circumference; nut polar and equatorial
circumference; quantity of liquid endosperm; total fruit weight; nut weight; stem height; girth of stem at 1,5m
height; number of leaflets; and number of bunches. The most dissimilar accessions according to the agronomic
characteristics were Rotuma Tall and West African Tall, which can be primarily indicated as genitors for the
formation of segregating populations in breeding programmes.
Keywords: Cocos nucifera L.. Genetic resources. Genetic variability. Germplasm.
DIVERSIDADE GENÉTICA ENTRE ACESSOS DE COQUEIRO-GIGANTE
RESUMO - O coqueiro-gigante (Cocos nucifera L.) tem grande importância socioeconômica no Brasil e foi
primeiramente introduzido no litoral da região Nordeste, onde é explorado de forma semi-extrativista. O
objetivo desse trabalho foi quantificar a divergência genética entre os acessos introduzidos e conservados no
Banco Internacional de Germoplasma de Coco para América Latina e Caribe, verificar a eficiência dos
descritores utilizados na discriminação dos acessos e indicar os essenciais para etapas de caracterização e
avaliação. Foram avaliados os acessos: Gigante-da-Polinésia; Gigante-de-Tonga; Gigante-do-Oeste-Africano;
Gigante-de-Rennel; Gigante-de-Rotuma; Gigante-de-Vanuatu; Gigante-da-Malásia e Gigante-da-Praia-do-
Forte. Utilizou-se 35 descritores quantitativos recomendados para a espécie. A divergência genética foi
estimada pela distância generalizada de Mahalanobis e o agrupamento foi realizado pelo método UPGMA. A
importância relativa dos descritores foi mensurada de acordo com os métodos de Singh e Jolliffe e as variáveis
foram selecionadas levando-se em consideração as informações coincidentes nos dois métodos, eliminando-se
aqueles que foram descartados em ambos os procedimentos. Utilizando as características agronômicas
detectou-se que a primeira variável canônica explicou 90,25% da variância total. Os descritores mais eficientes
para detecção da divergência genética foram: circunferência equatorial do fruto, circunferência polar e
equatorial da noz, volume do endosperma, peso total do fruto e noz, altura de estipe, circunferência do estipe a
150 cm do solo, número de folíolos e número de cachos por planta. Os acessos mais dissimilares pelas
características agronômicas foram o Gigante-de-Rotuma e Gigante-do-Oeste-Africano, os quais podem ser
prioritariamente indicados como genitores para a formação de populações segregantes em programas de
melhoramento.
Palavras-chave: Cocos nucifera L.. Recursos genéticos. Variabilidade genética. Germoplasma.
____________________ *Corresponding author 1Received for publication in 06/19/2016; accepted in 04/11/2017.
Paper extracted from the doctoral thesis of the first author. 2Department of Biological Sciences, Universidade Estadual de Feira de Santana, Feira de Santana, BA, Brazil; [email protected], [email protected]. 3Department of Technology and Social Sciences, Universidade do Estado da Bahia, Juazeiro, BA, Brazil; [email protected]. 4Embrapa Mandioca e Fruticultura, Cruz das Almas, BA, Brasil; [email protected]. 5Embrapa Tabuleiros Costeiros, Aracaju, SE, Brasil; [email protected], [email protected].

GENETIC DIVERSITY ASSESSMENT AMONG TALL COCONUT PALM
K. M. B. SOBRAL et al.
Rev. Caatinga, Mossoró, v. 31, n. 1, p. 28 – 39, jan. – mar., 2018 29
INTRODUCTION
The coconut tree (Cocos nucifera L.) is an
exotic species which, being useful for the Portuguese
colonizers in their expeditions to America, was
introduced in the State of Bahia, north-eastern region
of Brazil in 1553 (HARRIES, 1977). The natural
populations are integrated into the landscapes of
coastal areas and the common coconut variety found
in Bahia is very similar to other varieties seen in
Jamaica, South America, and West and East Africa
(ROMNEY; DIAS, 1979), as well as to other
varieties belonging to the Indo-Atlantic group
(MARTINEZ et al., 2009).
Brazil has 271,000 hectares cultivated with
coconut tree, spread across almost the entire national
territory (FAOSTAT, 2016). About 70% of coconut
production is located in the north-eastern coastal
strip and part of the northern region. However, the
areas of production are still mostly exploited in a
semi-extractivist manner. The cultivation has low
average productivity due to the cultivation of
non-improved genotypes that feature low productive
potential and production instability, as well as
susceptibility to biotic and abiotic stresses.
In addition, the genetic basis of the
germplasm grown in Brazil is narrow, as well as the
preserved germplasm. However, it is worth
mentioning that a Brazilian coconut breeding
programme began in the 1980s. To that end,
accessions were introduced to create the genebank of
the species (ARAGÃO et al., 1999). Due to
numerous technical limitations for safe movement of
the germplasm, the genebank is composed of a small
number of accessions. However, it is the second most
important genebank of the Americas, the main one of
South America, and the only one in Brazil, consisting
of accessions from different geographical regions of
the world and collected on the coast of the northeast
region of Brazil. In 2006, the genebank was linked to
the International Coconut Genetic Resources
Network (COGENT-BIOVERSTY) and, thus,
elevated to the international category, being named
International Coconut Genebank for Latin America
and the Caribbean (ICG-LAC) (LOIOLA et al.,
2016).
Although Brazil is the fourth largest world
producer, there is still a small demand on the part of
the public and private sectors in the search for new
genotypes and, consequently, genetic variability. In
addition, the cultivation still features problems
caused by pests and diseases, such as the threat of
lethal yellowing disease (LYD), classified in Brazil
as Pest AI by the Ministry of Agriculture, Livestock
and Food Supply (MAPA). This disease has caused
serious losses in Mexico, Jamaica, and other
Caribbean regions (OROPEZA et al., 2005). Thus,
the knowledge about the characteristics of preserved
accessions, as well as the estimation of the genetic
variability, will increase the possibility of use and
meeting the needs of preventive breeding
programmes in the country.
The objectives of the present study were to
quantify the genetic divergence among accessions of
tall coconut preserved in the ICG-LAC, and estimate
the efficiency of descriptors used in the
discrimination of the accessions to indicate the
essential descriptors for the activities of
characterisation and evaluation of coconut
germplasm.
MATERIAL AND METHODS
From May to August 2015, eight accessions
of tall coconut preserved at the ICG-LAC located in
the Betume Experimental Field, Neópolis city, State
of Sergipe, Brazil (10°26' S; 36°32' W; and 28 m
altitude) were evaluated.
According to the Köppen classification, the
climate of the Neopolis is A’s type (tropical rainy
with dry summer). The average annual rainfall is
1,270 mm, of which 71.8% occurs during the rainy
season (April to September) and 28.2% during the
dry season (October to March). The average annual
temperature is around 24.7 °C and the average
relative humidity is 76.67%. The soil of the
experimental field is classified as quartzarenic neosol
with low natural fertility. The fertilisation was
carried out according to the soil and foliar analyses.
The plants were grown under unirrigated conditions.
The culture treatments consisted of chemical
crowning and mechanised undergrowth cleaning
between planting lines.
In the experimental design, the accessions
were arranged in random blocks with three replicates
and 32 useful plants aged 33 years per plot, at a
spacing of 9 x 9 x 9 m in equilateral triangle, except
for the Vanuatu Tall and Malayan Tall, which had
only two replicates due to losses in the installation of
the genebank. For the activity of evaluation, 10
plants of each accession were selected, namely:
Polynesia Tall (PYT); Brazilian Tall Praia-do-Forte
(BRTPF); Tonga Tall (TONT); West African Tall
(WAT); Rennel Island Tall (RIT); Rotuman Tall
(RTMT); Vanuatu Tall (VTT) and Malayan Tall
(MLT) .
To evaluate the vegetative descriptors, the
leaf number 14 in each plant was used. Three fruits/
plant/accession/replicate for the evaluation of fruit
components were used. Inflorescences were marked
and the fruits were harvested eleven months after
fruiting.
The quantitative descriptors present in the
descriptive list (IPGRI, 1995), were used, namely:
HS = stem height (m); CS20 = girth of stem at 20cm

GENETIC DIVERSITY ASSESSMENT AMONG TALL COCONUT PALM
K. M. B. SOBRAL et al.
Rev. Caatinga, Mossoró, v. 31, n. 1, p. 28 – 39, jan. – mar., 2018 30
above soil level (cm); CS150 = girth of stem at 1.5 m
height (m); HLS11 = height of 11 leaf scars (cm);
NGL = number of green leaves (unit); LL = leaf
length (m); PL = petiole length (m); PW = petiole
width (cm); PT = petiole thickness (mm);
NL = number of leaflets (unit); LLT = leaflet length
(m); LW - leaflet width (cm); NFF = number of
female flowers (unit); NI = number of
inflorescences; FED = fruit equatorial diameter (cm);
FPD = fruit polar diameter (cm); FPC = fruit polar
circumference (cm); FEC = fruit equatorial
circumference (cm); NPD = nut polar diameter
(mm); NED = nut equatorial diameter (mm);
NPC = nut polar circumference (cm); NEC = nut
equatorial circumference (cm); VLE = quantity of
liquid endosperm (ml); SSC = soluble solid content
of endosperm (°Brix); pH = pH of the endosperm
(pH); TWF = total fruit weight (kg); FWWLE = fruit
weight without liquid endosperm (kg), SAW = solid
albumen weight (kg); EDW = endocarp weight (kg);
NW = nut weight (kg); EPW = epicarp weight (kg);
TSA = thickness solid albumen (mm);
TE = thickness endocarp (mm); NF = number of
fruits (unit); and NB = number of bunches (unit).
The selection of descriptors was performed by
means of two procedures: (1) direct selection,
through which it was excluded the descriptors that
presented the highest weighting coefficient in
absolute value (eigenvector) in the canonical variable
of smaller eigenvalue, starting from the last
component to one whose eigenvalue did not exceed
0.70 (JOLLIFFE, 1972, 1973); and (2) the method
proposed by Singh (1981), taking into account the
relative contribution of each descriptor for genetic
divergence. Variables with values below 4% were
considered as likely to be discarded. The analyses of
canonical variables and selection of variables were
carried out using the GENES software (CRUZ,
2013). The final disposal of the variables was carried
out taking into consideration the matching
information of the two methods, eliminating those
that had been discarded in the two procedures.
In order to assist the decision regarding the
disposal of a particular variable, it was estimated the
partial Pearson correlation coefficients among the
discarded and the selected variables. The partial
correlation coefficients were obtained from the
matrix of sums of squares and products from the
residue obtained in the multivariate analysis of
variance using the SAS statistical package (SAS
INSTITUTE, 2003).
For the selected variables, a cluster analysis
was performed, considering the Mahalanobis’s
generalised distance. The hierarchical clustering was
obtained from the genetic distance matrix using the
unweighted pair group method with arithmetic mean
(UPGMA) (SNEATH; SOKAL, 1973). All the
cluster analyses were performed using the GENES
software (CRUZ, 2013). The consistency of the
clusters was determined by the cophenetic
correlation coefficient according to Sokal and Rohlf
(1962). The significance of the cophenetic
correlation coefficients was calculated using Mantel
test with 1,000 permutations (MANTEL, 1967). The
cut-off point was defined using the pseudo-t2
method obtained with the NbClust package of the R
computer program (CHARRAD et al., 2015).
RESULTS AND DISCUSSION
The analysis of the agronomic characteristics
by means of canonical variables explained about
90.25% of total variance in the first variable. Among
the descriptors used FEC, NPC, NEC, VLE, TWF,
NW were those that contributed the most to this
variation (Tables 1 and 2). It was possible to observe
that there was consistency in the selected descriptors
to determine the genetic divergence, mainly by size
and weight of fruit, which are characteristics of great
commercial importance (Table 2).
Table 1. Eigenvalue, total variance (%), and total accumulated variance (%) for each canonical variable using agronomic
characteristics.
Canonical Variable Eigenvalue Total
Variance (%)
Total Accumulated
Variance (%)
VC1 51303.07 90.25 90.25
VC2 3419.81 6.02 96.27
VC3 1809.98 3.18 99.45
VC4 221.78 0.39 99.84
VC5 77.59 0.14 99.98
VC6 8.43 0.01 100.00
VC7 2.19 0.00 100.00
1

GENETIC DIVERSITY ASSESSMENT AMONG TALL COCONUT PALM
K. M. B. SOBRAL et al.
Rev. Caatinga, Mossoró, v. 31, n. 1, p. 28 – 39, jan. – mar., 2018 31
Table 2. Relative contribution of diversity characteristics according to Singh (1981) and the analysis of the weighting
coefficients obtained by canonical variables of agronomic characteristics.
*FPD: fruit polar diameter (cm); FPC: fruit polar circumference (cm); FEC: fruit equatorial
circumference (cm); NPC: nut polar circumference (cm); NEC: nut equatorial circumference (cm);
VLE: quantity of liquid endosperm (ml); SSC: soluble solid content of endosperm (ºBRIX); pH: pH
of the endosperm; TWF: total fruit weight (kg); NW: nut weight (kg); TSA: thickness solid albumen
(mm); TE: thickness endocarp (mm); NED: nut equatorial diameter (mm).
Using the vegetative descriptors, it was
observed that the first canonical variable was
responsible for 81.73% of the total variance, and the
descriptors HS, CS150, NL and NB were those that
contributed the most to the divergence among the
evaluated accessions. These descriptors are related to
the development, nutrition and production of plants,
and they can be measured quickly when compared
with the fruit descriptors of low-cost, effective for
the differentiation of accessions (Tables 3 and 4).
According to Cruz, Ferreira and Pessoni (2011),
since there is a concentration of large proportion of
total variance in the first variables (above 80%); it is
possible to study genetic divergence by means of
geometric distances between genotypes in scatter
charts.
As well as the results presented, other works
have also used canonical variables in order to
evaluate the descriptors responsible for the
divergence variance. Ribeiro, Soares and Ramalho
(1999) assessed accessions of tall coconut and
obtained a total variation of 95.12% among the first
three canonical variables. However, it can be
observed a wide use of canonical variables, probably
due to the lack of an experimental design, or because
the data do not indicate normality. For this reason,
other techniques, such as that of main
components, were used (ZIZUMBO-VILLARREAL;
COLUNGA-GARCÍAMARÍN, 2001; LOIOLA,
2014; OYOO et al., 2015; YAO et al., 2015).
Table 3. Eigenvalue, total variance (%), and total accumulated variance (%) for each canonical variable using vegetative
characteristics.
Canonical
Variable Eigenvalue
Total
Variance (%)
Total Accumulated
Variance (%)
VC1 75587.57 81.73 81.73
VC2 14789.02 15.99 97.72
VC3 2086.19 2.26 99.98
VC4 10.63 0.01 99.99
VC5 4.57 0.00 100.00
VC6 2.65 0.00 100.00
VC7 1.15 0.00 100.00
VC8 0.00 0.00 100.00
1
Variable * Singh
Sij (%) VC 1 (90.16%) VC 2 (5.64%)
FPD 1.88 16.26 8.03
FPC 4.65 21.14 -18.51
FEC 5.69 -41.94 -0.63
NPC 7.50 -43.62 2.10
NEC 17.83 78.70 -8.60
VLE 15.11 -40.85 10.62
SSC 0.16 0.15 2.80
pH 1.08 -14.40 -0.95
TWF 2.57 39.27 13.94
NW 15.32 -36.60 -4.89
TSA 6.95 7.07 3.83
TE 0.77 -6.95 1.84
NED 20.50 24.39 -3.54
1

GENETIC DIVERSITY ASSESSMENT AMONG TALL COCONUT PALM
K. M. B. SOBRAL et al.
Rev. Caatinga, Mossoró, v. 31, n. 1, p. 28 – 39, jan. – mar., 2018 32
Table 4. Relative contribution of diversity characteristics according to Singh (1981) and the analysis of the weighting
coefficients, obtained by canonical variables of vegetative characteristics.
Variable * Singh
Sij (%) VC 1 (92.12%) VC 2 (7.28%)
HS 25.23 13.63 1.89
CS20 5.03 -6.33 0.84
CS150 28.00 15.29 -1.77
HLS11 0.41 2.58 3.02
NGL 8.66 8.13 -5.25
LL 3.88 -8.33 -11.13
PL 0.36 2.13 7.63
NL 12.81 10.74 -1.83
LLT 3.44 -3.96 6.03
LW 1.39 -1.32 2.39
PT 5.73 -6.21 -6.79
NF 1.95 1.21 11.86
NB 3.13 16.50 -4.25
1 *HS = stem height (m); CS20 = girth of stem at 20cm above soil level (cm); CS150 = girth of stem
at 1.5 m height (m); HLS11 = height of 11 leaf scars (cm); NGL = number of green leaves (unit);
LL = leaf length (m); PL = petiole length (m); NL = number of leaflets (unit); LLT = leaflet length
(m); LW - leaflet width (cm); PT = petiole thickness (mm); NF: number of fruit (unit); NB: number
of bunches (unit).
Canonical variables analyses, when used in
studies on genetic divergence, are aimed at
identifying similar genotypes in scatter charts
(CRUZ; FERREIRA; PESSONI, 2011). The results
obtained in the present study allowed a
two-dimensional graphic visualisation of the
accessions of tall coconut using the first and the
second canonical variables (Figures 1 and 2).
The comparison between the two scatter
charts indicated that the accessions did not cluster
equally, resulting in the formation of different
clusters. This fact was due to the characteristics
analysed, which were quantitative, controlled by
many genes, and had strong environmental
interference. Although the clusters were not exactly
the same, there were few changes, because among
the eight accessions assessed, only the MLT and the
TONT were not matched in the two groups of data.
Figure 1 show that the accessions PYT, RTMT,
TONT remained closer to each other, and the
BRTPF, WAT, VTT, MLT and RTI formed a second
group. On the other hand, the morphological
descriptors indicated that the accessions of PYT,
RTMT and MLT were more similar, and the
accessions BRTPF, TONT, VTT, WAT and RIT
formed a second group (Figure 2).
Figure 1. Score dispersion in eight accessions of tall coconut with respect to the first two canonical variables (CV1 and
CV2), and accumulated variance (%), based on agronomic characteristics.

GENETIC DIVERSITY ASSESSMENT AMONG TALL COCONUT PALM
K. M. B. SOBRAL et al.
Rev. Caatinga, Mossoró, v. 31, n. 1, p. 28 – 39, jan. – mar., 2018 33
Figure 2. Score dispersion in eight accessions of tall coconut with respect to the first two canonical variables (CV1 and
CV2), and accumulated variance (%), based on vegetative characteristics.
The following descriptors were discarded:
FED, FWWLE, SAW, EDW, EPW, NDP, PT, PW
and NL. According to Singh’s coefficient (1981), the
descriptor VLE was the most important among the
selected descriptors (26.70%), followed by NEC
(17.16%), HS (17.04%), and NPC (12.85%) (Table
5).
It is worth mentioning the permanence of the
descriptors HLS11 and LW, because, although they
were discarded by Singh (1981) and Jolliffe’s (1972,
1973) criterion, they are important to infer about
plant development (Table 5). While the descriptor
HLS11 is related to plant development with respect
to the stem growth rate―which is more intense in
the early years of the plant―the measurement of the
LW is related to a good plant development and
nutritional status.
The partial correlations established were
significant and positive for the majority of the
descriptors evaluated and demonstrated that the
disposal of selected characteristics would not cause
loss of information in case they were not used in the
next evaluations made in the genebank, given that
the selected descriptors had correlations of 1% of
significance with the discarded descriptors for the
majority of the correlations. The pH and SSC did not
show significant difference with the discarded
descriptors. These characteristics are chemical and
do not have a specific relationship with size and
weight of the fruit; however, they are important to
determine the quality of the water (Table 6).
By means of the partial Pearson correlation, it
was possible to observe that the descriptors relating
to size, weight and thickness of the fruit components
were correlated, indicating that using a smaller
number of descriptors can reduce time and cost and,
at the same time, provide the required information
about the studies on genetic divergence between
accessions of tall coconut. The same fact was
observed with respect to the vegetative
characteristics PT and PW, which were significant
with respect to the descriptors relating to the foliar
structure (Table 7).
For the characteristics relating to vegetative
descriptors, the closest accessions were the TONT
and MLT, and the most distant were RIT and VTT
(Table 9). The divergence found between the
accessions of RTMT and WAT can be explained by
the geographic origin, because they belong to distinct
populations, given that the WAT is from the Ivory
Coast and the RTMT from the Fiji Islands. The same
fact occurs with the divergence between the RIT and
VTT, which are original from the South Pacific, but
from different countries, the RIT is from the
Solomon Islands and the VTT from Vanuatu.
From a predictive perspective, it can be
affirmed that the accessions with major
dissimilarities with respect to those of Indo-Atlantic
origin can assist in the selection of progenitors for
important crossbreeding for genetic breeding
programs in Brazil, for example, crossbreeding
aimed at preventive breeding for lethal yellowing.
This disease is caused by a phytoplasma and severely
affects coconut production in some areas of the
Americas and the Caribbean, such as those located in
Jamaica, Florida, Belize, Cuba, Haiti, Honduras,
Dominican Republic, and Mexico (MARINHO;
BATISTA; MILLER, 2002; OROPEZA et al., 2005;
MYRIE et al., 2014), since reports have indicated
that this disease has been decimating many
plantations. Despite the fact that Brazil has already
initiated studies and contingency measures, if the
dissemination rate continues growing, the
phytoplasma can reach South America. Some studies
conducted with the production of hybrids have
obtained good results relating to resistance, for
example, crossbreeding between the Sri Lanka
Dwarf and Vanuatu Tall (DARE et al., 2010).

GENETIC DIVERSITY ASSESSMENT AMONG TALL COCONUT PALM
K. M. B. SOBRAL et al.
Rev. Caatinga, Mossoró, v. 31, n. 1, p. 28 – 39, jan. – mar., 2018 34
Table 5. Pre-selected and selected variables based on Singh and Jolliffe’s methods.
Variables
Pre-selected
Selected Singh
Jolliffe
Sij (%) Discarded
Discarded
FDP 0.28 D3
S S
FED 3.02 D10
D9 D
FPC 7.44 S
D5 S
FEC 4.65 S
D10 S
NPC 12.85 S
S S
NEC 17.16 S
D11 S
VLE 26.70 S
D4 S
SSC 0.86 D6
S S
pH 0.20 D1
S S
TWF 7.37 S
D3 S
FWWLE 3.98 D12
D7 D
SAW 1.47 D7
D6 D
EDW 0.24 D2
D12 D
NW 4.36 S
D2 S
EPW 2.39 D9
D8 D
TSA 0.62 D4
S S
TE 0.64 D5
S S
NPD 3.90 D11
D1 D
NED 1.86 D8
S S
HS 17.04 S S S
CS20 5.20 S D1 S
CS150 2.61 D5 S S
HLS11 3.18 D7 D2 D
NGL 2.02 D3 S S
LL 6.41 S D3 S
PL 4.72 S D6 S
PT 3.96 D8 D7 D
PW 1.51 D1 D4 D
NL 3.11 D6 S S
LLT 1.76 D2 S S
LW 2.31 D4 D8 D
NF 10.81 S S S
NB 5.71 S D5 S
1 S = selected, D = discarded *FPD = fruit polar diameter (cm); FED = fruit equatorial diameter (cm); FPC = fruit
polar circumference (cm); FEC = fruit equatorial circumference (cm); NPC = nut polar circumference (cm);
NEC = nut equatorial circumference (cm); VLE = quantity of liquid endosperm (ml); SSC = soluble solid content
of endosperm (°Brix); pH = pH of the endosperm (pH); TWF = total fruit weight (kg); FWWLE = fruit weight
without liquid endosperm (kg), SAW = solid albumen weight (kg); EDW = endocarp weight (kg); NW = nut
weight (kg); EPW = epicarp weight (kg); TSA = thickness solid albumen (mm); TE = thickness endocarp (mm);
NPD = nut polar diameter (mm); NED = nut equatorial diameter (mm); HS = stem height (m); CS20 = girth of
stem at 20cm above soil level (cm); CS150 = girth of stem at 1.5 m height (m); HLS11 = height of 11 leaf scars
(cm); NGL = number of green leaves (unit); LL = leaf length (m); PL = petiole length (m); PT = petiole thickness
(mm); PW = petiole width (cm); NL = number of leaflets (unit); LLT = leaflet length (m); LW - leaflet width (cm
NF = number of fruits (unit); and NB = number of bunches (unit).

GENETIC DIVERSITY ASSESSMENT AMONG TALL COCONUT PALM
K. M. B. SOBRAL et al.
Rev. Caatinga, Mossoró, v. 31, n. 1, p. 28 – 39, jan. – mar., 2018 35
Table 6. Partial correlation coefficients between the discarded and the selected variables based on agronomic
characteristics.
Selected*
Discarded
FED FWWLE SAW EDW EPW NPC
FPD 0.66** 0.64** 0.51ns 0.66** 0.75** 0.43ns
FPC 0.83** 0.83** 0.59* 0.82** 0.79** 0.57*
FEC 0.94** 0.91** 0.82** 0.92** 0.73** 0.83**
NPC 0.85** 0.89** 0.90** 0.90** 0.58* 0.92**
NEC 0.85** 0.78** 0.94** 0.88** 0.41ns 0.97**
VLE 0.93** 0.84** 0.89** 0.93** 0.52* 0.90**
SSC -0.23ns -0.20ns -0.05ns -0.14ns -0.44ns 0.09ns
pH 0.11ns -0.04ns 0.28ns 0.10ns 0.02ns 0.25ns
TWF 0.94** 0.96** 0.74** 0.95** 0.82** 0.76**
NW 0.88** 0.84** 0.95** 0.92** 0.50ns 0.95**
TSA 0.08ns -0.06ns 0.49ns -0.01ns -0.36ns 0.42ns
TE 0.47ns 0.58* 0.27ns 0.60* 0.49ns 0.29ns
NED 0.80** 0.78** 0.96** 0.84** 0.37ns 0.98**
1
Table 7. Partial correlation coefficients between the discarded and the selected variables based on vegetative
characteristics.
Selected*
Discarded
HLS11 PT PW LW
HS 0.22ns -0.29ns 0.09ns -0.33ns
CS20 0.13ns 0.24ns 0.37ns -0.21ns
CS150 -0.06ns 0.08ns -0.30ns 0.06ns
NGL -0.07ns 0.55* 0.54ns 0.25ns
LL -0.09ns 0.56* 0.73** -0.11ns
PL -0.31ns 0.67** 0.58* 0.12ns
NL 0.31ns 0.26ns 0.60ns 0.26ns
LLT 0.26ns 0.18ns 0.49ns 0.14ns
NF -0.29ns 0.42ns 0.80** -0.20ns
1
**and *significant to 1 and 5%, respectively, by the teste of t.; nsnot significant. *FPD: fruit polar
diameter (cm); FPC: fruit polar circumference (cm); FEC: fruit equatorial circumference (cm); NPC:
nut polar circumference (cm); NEC: nut equatorial circumference (cm); VLE: quantity of liquid
endosperm (ml); SSC: soluble solid content of of endosperm (ºBRIX); pH:pH of the endosperm;
TWF: total fruit weight (kg); NW: nut weight (kg); TSA: thickness solid albumen (mm); TE:
thickness endocarp (mm); NED: nut equatorial diameter (mm); FED = fruit equatorial diameter (cm);
FWWLE = fruit weight without liquid endosperm (kg), SAW = solid albumen weight (kg);
EDW = endocarp weight (kg); EPW = epicarp weight (kg); NPC = nut polar circumference (cm).
**and *significant to 1 and5%, respectively, by the teste of t t; nsnot significant. *HS = stem
height (m); CS20 = girth of stem at 20cm above soil level (cm); CS150 = girth of stem at
1.5 m height (m); NGL = number of green leaves (unit); LL = leaf length (m); PL = petiole
length (m); NL = number of leaflets (unit); LLT = leaflet length (m); NF = number of fruits
(unit); HLS11 = height of 11 leaf scars (cm); PT = petiole thickness (mm); PW = petiole
width (cm); LW - leaflet width (cm).
GENETIC DIVERSITY ASSESSMENT AMONG TALL COCONUT PALM
K. M. B. SOBRAL et al.
Rev. Caatinga, Mossoró, v. 31, n. 1, p. 28 – 39, jan. – mar., 2018 36
Among all the accessions evaluated up to
now, those originating in Southeast Asia exhibit
higher resistance to lethal yellowing, suggesting that
the ancestors of these populations had contracted the
same disease or another similar one and, thus,
became resistant or tolerant (BAUDOUIN et al.,
2009). Due to the genetic proximity between the
WAT and all populations of tall coconut established
in Brazil (RIBEIRO et al., 2010; LOIOLA, 2014;
LOIOLA et al., 2016) there is a need for strategic
planning involving studies on plant pathology,
molecular genetics, and breeding for assessing and
obtaining cultivars and hybrids that are resistant to
lethal yellowing. In case this disease occurs in
Brazil, large losses in plantations across the country
will be probably observed.
Crossbreeding can also be carried out on the
basis of commercial characteristics, such as weight
of fruit and nut, solid albumen, and water volume.
According to the study conducted by Ribeiro et al.
(2000), the accession of RTMT featured large fruits
weighing around 1,543 g, had great fruit
composition, with high albumen weight (536 g), and
greater weight of copra (309 g). The accession of
WAT featured fruits weighting 1,041 g, only
surpassing the accession of VTT (909 g); however, it
featured greater epicarp percentage (146.4%). The
endosperm was little thick, but rich in oil and
proteins, and was more homogeneous. These
accessions exhibited greatest genetic distances
according to agronomic characteristics (Table 8), and
had commercial characteristics, such as, greater
weight of copra, high weight of albumen, weight of
epicarp, and high oil content, which can jointly or
separately meet the industry and agriculture
demands. In this way, the crossing between these
two accessions WAT and RTMT can strengthen
breeding programmes for the production of new
hybrids with promising commercial characteristics in
Brazil.
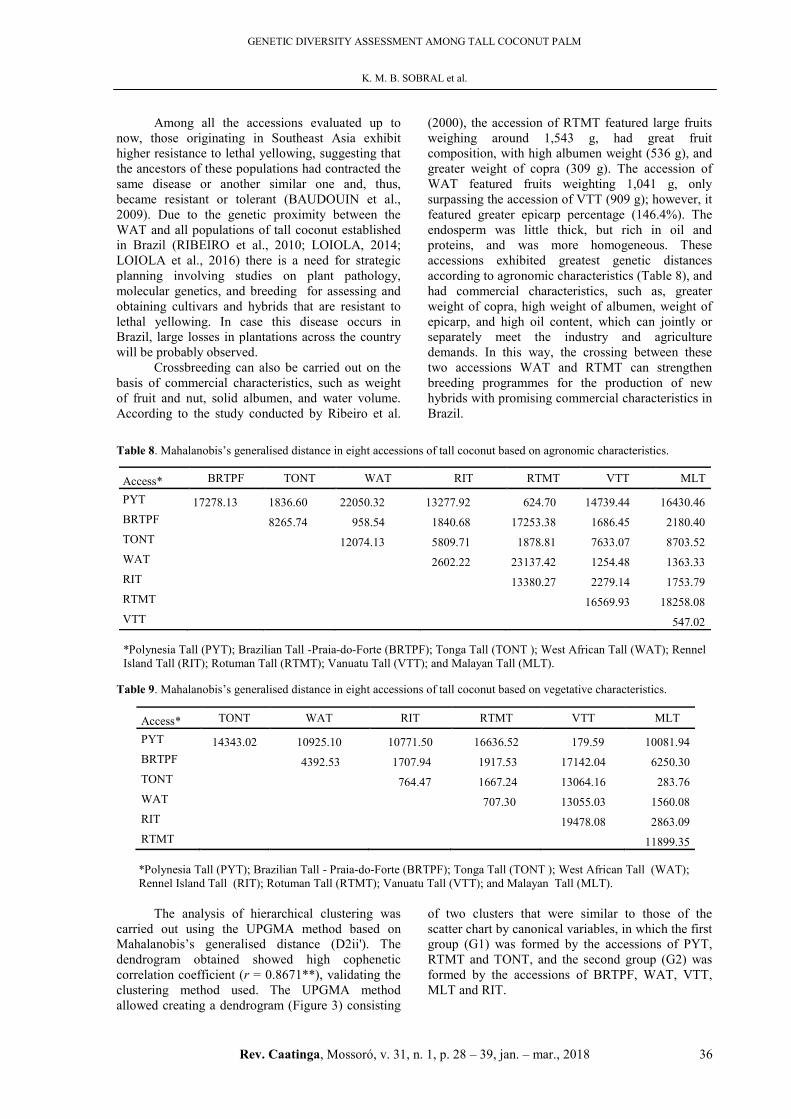
Table 8. Mahalanobis’s generalised distance in eight accessions of tall coconut based on agronomic characteristics.
Access* BRTPF TONT WAT RIT RTMT VTT MLT
PYT 17278.13 1836.60 22050.32 13277.92 624.70 14739.44 16430.46
BRTPF 8265.74 958.54 1840.68 17253.38 1686.45 2180.40
TONT 12074.13 5809.71 1878.81 7633.07 8703.52
WAT 2602.22 23137.42 1254.48 1363.33
RIT 13380.27 2279.14 1753.79
RTMT 16569.93 18258.08
VTT 547.02
1 *Polynesia Tall (PYT); Brazilian Tall -Praia-do-Forte (BRTPF); Tonga Tall (TONT ); West African Tall (WAT); Rennel
Island Tall (RIT); Rotuman Tall (RTMT); Vanuatu Tall (VTT); and Malayan Tall (MLT).
Table 9. Mahalanobis’s generalised distance in eight accessions of tall coconut based on vegetative characteristics.
Access* TONT WAT RIT RTMT VTT MLT
PYT 14343.02 10925.10 10771.50 16636.52 179.59 10081.94
BRTPF 4392.53 1707.94 1917.53 17142.04 6250.30
TONT 764.47 1667.24 13064.16 283.76
WAT 707.30 13055.03 1560.08
RIT 19478.08 2863.09
RTMT 11899.35
1 *Polynesia Tall (PYT); Brazilian Tall - Praia-do-Forte (BRTPF); Tonga Tall (TONT ); West African Tall (WAT);
Rennel Island Tall (RIT); Rotuman Tall (RTMT); Vanuatu Tall (VTT); and Malayan Tall (MLT).
The analysis of hierarchical clustering was
carried out using the UPGMA method based on
Mahalanobis’s generalised distance (D2ii'). The
dendrogram obtained showed high cophenetic
correlation coefficient (r = 0.8671**), validating the
clustering method used. The UPGMA method
allowed creating a dendrogram (Figure 3) consisting
of two clusters that were similar to those of the
scatter chart by canonical variables, in which the first
group (G1) was formed by the accessions of PYT,
RTMT and TONT, and the second group (G2) was
formed by the accessions of BRTPF, WAT, VTT,
MLT and RIT.

GENETIC DIVERSITY ASSESSMENT AMONG TALL COCONUT PALM
K. M. B. SOBRAL et al.
Rev. Caatinga, Mossoró, v. 31, n. 1, p. 28 – 39, jan. – mar., 2018 37
Figure 3. Dendrogram based on Mahalanobis’s generalised distance and the UPGMA method for eight accessions of tall
coconut based on agronomic characteristics.
The vegetative descriptors were used to
analyse the same accessions and obtained a new
dendrogram (Figure 4) that differed from the first
(Figure 3) generated by the agronomic descriptors.
Two groups were formed: the G1 group with the
accessions of PYT, RTMT and MLT; and the G2
group with the accessions of BRTPF, TONT, VTT,
WAT and RIT. This result was similar to that found
by the dispersion of canonical variables for this
group of data (Figure 4). However, despite having
differentiated the accessions and exhibited similarity
with the results of the canonical variables, it is worth
pointing out that the value for the cophenetic
correlation was r = 0.7008**, which was considered
poor (SOKAL; ROHLF, 1962).
Perera et al. (2003) assessed 94 varieties of
coconut palm by means of microsatellite markers and
observed that the accessions had been distributed
into different groups, in which the accessions of RIT,
VTT, MLT, and TONT were similar and were
clustered together; however, the accessions of RTMT
and WAT were in separate clusters. Thus, there were
differences between the results obtained from the
vegetative evaluation of fruit components
(carpological) and those obtained by Perera et al.
(2003). This fact occurred because the use of
molecular techniques provides information relating
to the sharing of genes and the genetic distance,
whereas studies assessing phenotypic
characterisation show the gene expression.
Therefore, since many of these characteristics are
quantitative, they are subjected to strong
environmental influence.
These studies complement each other. They
provide a set of predictive information about the
accessions, informing about the genetic proximity
and how they will develop in the environment. Thus,
they provide and make information available to
breeders and those working on improvement
programmes in order to promote a more extensive
use of the accessions.
For breeding works, it is important to use
accessions with greater genetic divergence, better
commercial and agronomic characteristics. In
addition, these accessions should be resistant to pests
and diseases. In the present work, it was possible to
observe the genetic divergence between the
preserved accessions through vegetative and
agronomic characteristics, demonstrating that the
selection is possible for intra-varietal crosses.
Figure 4. Dendrogram based on Mahalanobis’s generalised distance and the UPGMA method for eight accessions of tall
coconut based on vegetative characteristics.

GENETIC DIVERSITY ASSESSMENT AMONG TALL COCONUT PALM
K. M. B. SOBRAL et al.
Rev. Caatinga, Mossoró, v. 31, n. 1, p. 28 – 39, jan. – mar., 2018 38
CONCLUSIONS
The selected descriptors were efficient in
determining the genetic divergence among
accessions of tall coconut palm. The descriptors
listed as essential and recommended were: fruit
equatorial circumference; nut polar and equatorial
circumference; quantity of liquid endosperm; total
fruit weight; nut weight; stem height; girth of stem at
1,5m height; number of leaflets; and number of
bunches. The most dissimilar accessions due to the
agronomic characteristics were the Rotuma Tall and
the West African Tall, which can primarily be
indicated as genitors for genetic breeding
programmes.
REFERENCES
ARAGÃO, W. M. et al. Seleção de cultivares de
coqueiro para diferentes ecossistemas do Brasil. In:
QUEIROZ, M. A.; GOEDERT, C. O.; RAMOS, S.
R. R. (Eds.). Recursos genéticos e melhoramento
de plantas para o Nordeste brasileiro. Petrolina:
Embrapa Semiárido, 1999. Disponível em: <http://
www.cpatsa.embrapa.br:8080/catalogo/livrorg/
coco.pdf>. Acesso em: 24 abr. 2016.
BAUDOUIN, L. et al. General overview of genetic
research and experimentation on coconut varieties
tolerant/resistant to Lethal Yellowing. Oilseeds and
Fats, Crops and Lipid, Les Ulis, v. 16, n. 2, p. 127-
131, 2009.
CHARRAD, M. et al. NbClust: An examination of
indices for determining the number of clusters. R
package version 1.4. Disponível em: <https://cran.r-
project.org/web/packages/NbClust/index.html>.
Acesso em: 20 jan. 2015.
CRUZ, C. D.; FERREIRA, F. M.; PESSONI, L. A.
Biometria Aplicada ao Estudo da Diversidade
Genética. 1. ed. Viçosa, MG: UFV, 2011. 620 p.
CRUZ, C. D. GENES - A Software Package for
Analysis in Experimental Statistics and Quantitative
Genetics. Acta Scientiarum, Maringá, v. 35, n. 3, p.
271-276, 2013.
DARE, D. et al. Evaluation of some basic traits of a
promising coconut hybrid: Sri Lankan green dwarf
crossed to Vanuatu tall (SGD x VTT). Journal of
Science and Technology, Kumasi, v. 30, n. 3, p. 9-
14, 2010.
FAOSTAT. Culturas ano 2014. Disponível em:
<http://faostat.fao.org/site/567/DesktopDefault.aspx?
PageID=567#ancor>. Acesso em: 10 mar. 2016.
HARRIES, H. C. The Cape Verde region: (1499-
1549): the key to coconut in the western hemisphere?
Turrialba, Turrialba, Costa Rica, v. 27, n. 3, p. 227-
231, 1977.
INTERNATIONAL PLANT GENETIC
RESOURCES INSTITUTE - IPGRI. Descritors for
Coconut (Cocos nucifera L.). Rome, Italy, 1995, 68
p.
JOLLIFFE, I. T. Discarding variables in a principal
component analysis. I. Artificial data. Applied
Statistics, London, v. 21, n. 2, p. 160-173, 1972.
JOLLIFFE, I. T. Discarding variables in a principal
component analysis. II: real data. Journal of the
Royal Statistical Society Series C - Applied
Statistics, London, v. 22, n. 1, p. 21-31, 1973.
LOIOLA, C. M. Diversidade genética em coqueiro
-gigante (Cocos nucifera L.) por meio de
marcadores microssatélites e características
morfoagronômicas. 2014. 100 f. Dissertação
(Doutorado em Fitotecnia: Área de Concentração em
Agricultura Tropical) - Universidade Federal Rural
do Semiárido, Mossoró, 2014.
LOIOLA, C. M. et al. Genetic relationships among
tall coconut palm (Cocos nucifera L.) accessions of
the International Coconut Genebank for Latin
America and the Caribbean (ICG-LAC), evaluated
using microsatellite markers (SSRs). PLoS ONE,
San Francisco, v. 11, n. 3, p. 1-7, 2016.
MANTEL, N. The detection of disease clustering
and generalized regression approach. Cancer
Research, Birmingham, v. 27, n. 2, p. 209-220,
1967.
MARINHO, V. L. A.; BATISTA, M. F.; MILLER,
R. Praga quarentenária A1 amarelecimento letal
do coqueiro “Coconut Lethal Yellowing”. Brasília,
DF: Embrapa Recursos Genéticos e Biotecnologia,
2002. 4 p. (Embrapa Recursos Genéticos e
Biotecnologia. Comunicado técnico, 73).
MARTINEZ, R. T. et al. Characterization of the
genetic diversity of the Tall coconut (Cocos nucifera
L.) in the Dominican Republic using microsatellite
(SSR) markers. Tree Genetics & Genomes, New
York, v. 6, n. 1, p. 73-81, 2009.
MYRIE, W. A. et al. First report of lethal yellowing
disease associated with subgroup 16SrIV-A
phytoplasmas in Antigua, West Indies. New disease
Reports, London , v. 29, n. 12, p. 12, 2014.
OROPEZA, C. et al. Coconut lethal yellowing. In:
BATUGAL, P.; RAMANATHA RAO, V.; OLIVER,
J. (Eds.). Coconut Genetic Resources, Malaysia:
GENETIC DIVERSITY ASSESSMENT AMONG TALL COCONUT PALM
K. M. B. SOBRAL et al.
Rev. Caatinga, Mossoró, v. 31, n. 1, p. 28 – 39, jan. – mar., 2018 39
International Plant Genetic Resources Institute, 2005.
p. 349-363.
OYOO, M. E. et al. In-situ morphological
characterization of coconut in the Coastal Lowlands
of Kenya. African Journal of Plant Science, Ebène,
v. 2, n. 2, p. 65-74, 2015.
PERERA, L. et al. Studying genetic relationships
among coconut varieties/populations using
microsatellite markers. Euphytica, Wageningen, v.
132, n. 1, p. 121–128, 2003.
RIBEIRO, F. E.; SOARES, A. R.; RAMALHO, M.
A. P. Divergência genética entre populações de
coqueiro gigante do Brasil. Pesquisa Agropecuária
Brasileira, Brasília, v. 34, n. 9, p. 1615-1622, 1999.
RIBEIRO, F. E. et al. Ecótipos de coqueiro gigante
no Brasil. Aracaju, SE: EMBRAPA-CPATC, 2000.
p. 25.
RIBEIRO, F. E. et al. Population structures of
Brazilian tall coconut (Cocos nucifera L.) by
microsatellite markers. Genetics and Molecular
Biology, Ribeirão Preto, v. 33, n. 4, p. 696-702,
2010.
ROMNEY, D. H.; DIAS, B. C. Coconut varieties in
Bahia state. In: Session of the FAO technical
working party on coconut production, protection and
processing, 5. FAO, 1979. p. 4.
SAS INSTITUTE. SAS Technical Report. SAS/
STAT software: Changes and Enhancement,
Release 9.0, Cary NC: SAS Institute. 2003.
SINGH, D. The relative importance of characters
affecting genetic divergence. The Indian Journal of
Genetic and Plant Breeding, New Delhi, v. 41, n.
2, p. 237-245, 1981.
SNEATH, P. H.; SOKAL, R. R. Numerical
taxonomy: The principles and practice of
numerical classification. San Francisco: W. H.
Freeman, 1973. 573 p.
SOKAL, R. R.; ROHLF, F. J. The comparison of
dendrograms by objective methods. Taxon, Berlin,
v. 11, n. 2, p. 33-40, 1962.
ZIZUMBO-VILLARREAL, D.; COLUNGA-
GARCÍAMARÍN, P. Morpho-physiological
variation and phenotypic plasticity in Mexican
populations of coconut (Cocos nucifera L,), Genetic
Resources and Crop Evolution, Germany, v. 48, n.
6, p. 547-554, 2001.
YAO, S. D. M. et al. Fiabilité d’une liste minimale
de descripteurs agromorphologiques recommandée
par le COGENT dans l’étude de la diversité
génétique du cocotier (Cocos nucifera L.). Journal
of Animal &Plant Sciences, Lahore, v. 26, n. 1, p.
4006-4022, 2015.
This work is licensed under a Creative Commons Attribution-CC-BY https://creativecommons.org/licenses/by/4.0/