Associação Nacional dos Centros de Pós-Graduação em … · Associação Nacional dos Centros...
21
Associação Nacional dos Centros de Pós-Graduação em Economia 42º Encontro Nacional de Economia Área 12 : Economia Social e Demografia Econômica JEL: J12, I30, I32, R11 The impacts of changing family structure on income, inequality and poverty Alexandre Gori Maia (Universidade Estadual de Campinas) Camila Strobl Sakamoto (Universidade Estadual de Campinas) Abstract: This paper analyzes the impact of changing family structure on the income distribution in Brazil between 1981 and 2011. Specifically, the paper evaluates how changes in the composition of the types of families within the richest and poorest family groups contributed (i) to increase per capita income, (ii) to reduce inequality and (iii) to reduce the poverty. Additionally, the paper provides a comparison between rural and urban areas in order to understand how these dynamics had different impacts on more developed (urban) and less developed (rural) areas. Results highlight that changes observed in the family structure were more pronounced among the richest families, contributing to increase the income of the richest families and the income inequality between richest and poorest families, as well as between urban and rural areas. The overall impact on poverty reduction was insignificant. Finally, the paper investigates the per capita income composition by different types of income source (labor, pensions and others) and changes in the period of analysis. Key-words: Demography, Family, Poverty, Inequality, Rural Urban. Os impactos das mudanças na estrutura das famílias sobre a renda, desigualdade e pobreza Resumo: O artigo analisa os impactos das mudanças na estrutura das famílias sobre a distribuição de renda no Brasil entre 1981 e 2011. Especificamente, avalia-se como as mudanças na composição da população mais ricas e mais pobres por diferentes tipos de família contribuíram (i) para o crescimento da renda per capita, (ii) para reduzir a desigualdade e (iii) para reduzir a pobreza. Adicionalmente, o artigo oferece uma comparação entre as áreas rurais e urbanas, buscando compreender como essas dinâmicas têm diferentes impactos nas áreas mais desenvolvidas (urbano) e menos desenvolvidas (rural). Os resultados destacam que as mudanças observadas na estrutura das famílias foram mais intensas entre as famílias mais ricas, contribuindo para o crescimento da renda dos mais ricos e a desigualdade de renda entre as famílias mais ricas e mais pobres, assim como contribuíram para o aumento da desigualdade rural-urbana. No geral, o impacto sobre a pobreza foi insignificante. Por fim, investiga-se a composição da renda domiciliar per capita por diferentes tipos de fontes de renda (trabalho, aposentadorias e outras) e as mudanças no período analisado. Palavras-chave: Demografia, Família, Pobreza, Desigualdade, Rural-Urbano.
Transcript of Associação Nacional dos Centros de Pós-Graduação em … · Associação Nacional dos Centros...
Associação Nacional dos Centros de Pós-Graduação em Economia
42º Encontro Nacional de Economia
Área 12: Economia Social e Demografia Econômica
JEL: J12, I30, I32, R11
The impacts of changing family structure on income, inequality and poverty
Alexandre Gori Maia (Universidade Estadual de Campinas)
Camila Strobl Sakamoto (Universidade Estadual de Campinas)
Abstract: This paper analyzes the impact of changing family structure on the income distribution in
Brazil between 1981 and 2011. Specifically, the paper evaluates how changes in the composition of
the types of families within the richest and poorest family groups contributed (i) to increase per
capita income, (ii) to reduce inequality and (iii) to reduce the poverty. Additionally, the paper
provides a comparison between rural and urban areas in order to understand how these dynamics
had different impacts on more developed (urban) and less developed (rural) areas. Results highlight
that changes observed in the family structure were more pronounced among the richest families,
contributing to increase the income of the richest families and the income inequality between richest
and poorest families, as well as between urban and rural areas. The overall impact on poverty
reduction was insignificant. Finally, the paper investigates the per capita income composition by
different types of income source (labor, pensions and others) and changes in the period of analysis.
Key-words: Demography, Family, Poverty, Inequality, Rural Urban.
Os impactos das mudanças na estrutura das famílias sobre a renda, desigualdade e pobreza
Resumo: O artigo analisa os impactos das mudanças na estrutura das famílias sobre a distribuição
de renda no Brasil entre 1981 e 2011. Especificamente, avalia-se como as mudanças na
composição da população mais ricas e mais pobres por diferentes tipos de família contribuíram (i)
para o crescimento da renda per capita, (ii) para reduzir a desigualdade e (iii) para reduzir a
pobreza. Adicionalmente, o artigo oferece uma comparação entre as áreas rurais e urbanas,
buscando compreender como essas dinâmicas têm diferentes impactos nas áreas mais
desenvolvidas (urbano) e menos desenvolvidas (rural). Os resultados destacam que as mudanças
observadas na estrutura das famílias foram mais intensas entre as famílias mais ricas, contribuindo
para o crescimento da renda dos mais ricos e a desigualdade de renda entre as famílias mais ricas
e mais pobres, assim como contribuíram para o aumento da desigualdade rural-urbana. No geral,
o impacto sobre a pobreza foi insignificante. Por fim, investiga-se a composição da renda
domiciliar per capita por diferentes tipos de fontes de renda (trabalho, aposentadorias e outras) e
as mudanças no período analisado.
Palavras-chave: Demografia, Família, Pobreza, Desigualdade, Rural-Urbano.
1
Introduction
Demographic changes have important implications for income distribution and social
inequalities (McLanahan & Percheski, 2008). First, the volume and distribution of resources depend
directly on the size and the distribution of families among the poorest and richest households
(Barros, et al., 2001). Additionally, demographic dynamics tend to affect the labor force supply and
the dependency ratio differently across social groups, impacting indirectly on the income
distribution and living conditions of the poorest and richest families (Lee, 2005).
Demographic changes use to be in sync with economic development (Ashraf, et al., 2011).
For instance, changes in the family structure tend to be driven by the wealthier population, with
higher levels of education (Economic Commission for Latin America and the Caribbean, 2005). In
the short term, this dynamic usually increases income inequality between the richest and poorest
families, since the dependency ratio of the former group reduces faster (Almas, et al., 2011).
However, when these changes are followed by the poorest social segments, it may contribute to
reduce poverty and to attenuate income inequality. In the long run, despite the heterogeneity of
effects between different social groups, when the demographic transition attains the high stages
observed in the developed nations, the benefits tend to be positive for all the social segments
(Bloom et al., 2010).
Brazil provides a rich reference to analyze the impacts of demographic changes on income
distribution. In this country, demographic changes have occurred in a relatively short period, at the
same time that the country witnessed a substantial reduction in its high levels of poverty and
inequality. According to Instituto de Pesquisa Econômica Aplicada (2012), the Brazilian fertility
rate dropped from 4.3 children per woman in 1981 to 1.7 in 2011. Moreover, the poverty rate was
significantly reduced from 33% to 7% in the same period, as well as the differences between the per
capita income of the poorest and richest families, both within and between rural and urban areas
(Maia & Buainain, 2011).
This paper analyzes the impacts of changes in the family structure on the income distribution
in Brazil between 1981 and 2011. More specifically, the paper evaluates how changes in the
composition of the family structure within the richest and poorest family groups contributed to
increase per capita income, and to reduce poverty and inequality. We provide a comparison between
rural and urban areas in order to understand how these dynamics had different impacts on more
developed (urban) and less developed (rural) areas. The dynamics of the income distribution is also
analyzed according to the source of income, providing additional elements to understand how the
family types were benefited by different socioeconomic factors (labor market, pensions and other
sources) in the last decades.
Results highlight that, besides increasing per capita income, the faster dynamics of
demographic changes among the wealthiest families contributed, per se, to increase inequality
between more developed and less developed regions, as well as between the poorest and richest
families within these regions. The overall impact on poverty reduction was insignificant. Analyses
are based on a comprehensive methodology of decomposition that allow us to estimate the specific
contribution of changes in the family structure of the richest and poorest families on the variation of
per capita income, poverty and inequality. The paper uses a detailed categorization of the family
structure that considers both differences in the family relations and fertility rates.
1. Literature review
1.1. Family structure and income inequality
2
Among the components of demographic changes affecting income distribution, family
structure plays a central role as a mechanism for the reproduction of inequalities (McLanahan &
Percheski, 2008). Family experiences are associated with the opportunities that their members
encounter in the economy and in the labor market, which may vary considerably across social
groups and family types. Moreover, since children’s life chances are strongly influenced by family
experiences, changes in the family structure tend to affect both inequality and intergenerational
mobility (Parson, 1949).
Studies have highlighted the rise of single-headed families, especially single-mothers, and
its implication on income distribution (Martin, 2006). Besides putting additional individuals at risk
of poverty, the fast growth of female-headed families among the most vulnerable social groups has
also played an important role in reproducing and increasing inequalities in developed nations
(Ellwood & Jencks, 2004). Single-mothers are the only potential earner in the household and tend to
be subjected to lower hourly wages than men and their married women counterparts (Cancian &
Reed, 2001). Moreover, children living far from a biological parent are more likely to live in
poverty, which will probably affect their future expectancies and ability to move up the income
ladder (McLanahan & Percheski, 2008).
But the growth of single-mother families is not the only important demographic change in
the family structure. Cohabitation, decline in marriage, increases in divorce, non-marital
childbearing, delays in the marrying age, and late pregnancy resulted in a diversity of new forms of
family living arrangements (Martin, 2006; Cancian & Reed, 2001). Changes in the relationships
between family members, especially women’s empowerment, are crucial to understand changes
occurred in recent decades (Lesthaeghe, 1995). Results suggest a loss of centrality of the marriage
in the family formation (dissociation between marriage and reproduction), as well as the emergence
and dissemination of new types of families. There is a growing number of single parent families and
the so-called beanpole families (characterized by a small number of family members in each
generation, they are "long" and "thin"). These changes are related to several factors, such as the
fertility reduction, late motherhood, high longevity, increasing number of divorces, and increasing
number of stepchildren (new families with children from past marriages).
The impacts of these and other important demographic changes, such as fertility reduction
and population aging, have been analyzed between the richest and the poorest countries (Hausmann
& Székely, 2001), as well as between the richest and poorest families within these countries (Bloom
et al. 2010). First, the rise of the single-parent and other economically vulnerable family types tend
to place upward pressure on poverty rates (Iceland, 2003). On the other hand, the growth of
cohabitation, women employment and the overall fertility decline acted conversely, restraining the
rise in poverty (Cancian & Reed, 2001). Moreover, changes in the distribution of these family types
among the social groups also affected income inequality. For instance, the income of cohabitating
families has shown itself to be more equally distributed in relation to the income of nuclear and
single-headed families (Martin, 2006). Additionally, the faster reduction in the number of children
born among the more affluent families can contribute to increase inequality. Income inequality can
also rise if families become increasingly divided into groups with one earner and groups with two
earners (Lerman, 1996).
1.2. Social and demographic trends in Brazil
In recent decades, Brazil witnessed pronounced demographic changes in addition to
substantial socioeconomic improvements. In the 1980s, the number of children per woman fell
dramatically, even among the poorest families (Cariello, 2013). In the 1990s, the absolute number
of children stopped growing for the first time, as a result of the falling fertility witnessed one decade
before. The fertility rate continued dropping in the 2000s: from 2.2 children per woman in 2002 to
1.7 in 2011 (Instituto de Pesquisa Econômica Aplicada, 2012). The differences between income
3
strata also reduced considerably. In 1992, the richest 20% had a fertility rate of 1.4 per woman and
the poorest had 4.7; in 2011 these rates reduced to 0.9, and 3.6, respectively. In other words, the
ratio of the number of children per woman between these groups reduced from 3.3 to 2.7. In a
relatively short period, the Brazilian richest women are now experiencing extremely low fertility
rates, comparable to those observed in developed countries like Italy, Spain, and Japan. The country
also has a high aging population, caused by both a great decline in fertility and a fast increase in life
expectancy.
Simultaneously, Brazil experienced significant changes in their living conditions, especially
in the years 2000. After a long period of economic instability in the 1980s and early 1990s, poverty
and income inequality have been reduced considerably since mid-90s (Barros, et al., 2011). Many
factors have been pointed as central determinants of such socioeconomic improvements. The
country was specially benefited by the increasing prices of commodities and growing exports in the
2000s, boosting economic growth and socioeconomic improvements. Moreover, institutional factors
also contributed to attenuate poverty and inequality, such as income cash transfer programs (Bolsa
Família) and rural pensions (Maia & Buainain, 2011). Non-labor income has risen faster than labor
income over the past decades, especially in rural areas. As a result, in spite of the fact that rural
areas in Brazil are historically characterized by poor living conditions, poverty reduced faster in
these areas, as well as the urban-rural inequality.
The family structure in Brazil has also changed progressively since the 1980s (Leone, et al.,
2010). The most significant changes were related to an increasing share of single head units,
couples without children, and single mothers with children. On the other hand, the share of nuclear
and extended families (those characterized by diverse generations living together) reduced
substantially. Now the elderly also have a higher empowerment in the households, as a consequence
of social program targeted to this population, such as the Benefício de Prestação Continuada
program and the rural pension (Beltrão, et al., 2005). Moreover, cash transfer programs, such as
Bolsa Familia, also contributed to attenuate socioeconomic conditions of the more vulnerable
family groups, reducing poverty and inequality
2. Materials and Methods
Analyses are based on data of the Brazilian National Household Sample Survey (PNAD)
from 1981 to 2011, provided by the Brazilian Institute of Geography and Statistics (IBGE). PNAD
is a cross-sectional survey applied annually and is nationally representative of the Brazilian
territory, with the slight exception of a few remote rural areas in six northern states, which
represented less than 3% of the Brazilian population in 2000 (Instituto Brasileiro de Geografia e
Estatística, 1995)1. The long period of analysis, 30 years, and the huge changes witnessed in the
period attenuate potential noises generated by annual fluctuation in the relation between
demographic changes and income distribution.
The categorization of the family structure considers both differences in the family relations
(single-headed, couples and extended families) and differences in the fertility rate, expressed by the
number and age of the children. As a result, ten types of families were considered: i) single male
unit; ii) single female unit; iii) couple without children; iv) couple with children under 14; v) couple
with (at least one) children 14 or older; vi) single mother with children under 14; vii) single mother
with (at least one) children 14 or older; viii) single father with children under 14; ix) single father
1 PNAD excludes the rural areas of the states of Rondônia, Acre, Amazonas, Roraima, Pará and Amapá. Since 2004,
these areas were added to the PNAD sampling survey. However, in order to maintain historical comparability, those
areas were not considered in this study.
4
with (at least one) children 14 or older; x) extended family2. People living in collective households
and those live-in domestic workers with their relatives were excluded in our analysis.
We compared the impacts of changes in the family structure on the per capita income of the
10% richest and the 40% poorest families. We also considered differences between urban and rural
areas in order to analyze in what extend such changes affected differently the income distribution in
more developed (urban) and less developed (rural) areas.
Decomposing variation in the per capita income
In order to evaluate the impacts of changes in the family structure on the dynamics of the
income distribution, we first decomposed the variation in the per capita family income (PCFI) in
two sources: (i) changes in the participation of the types of families (composition effect, CE); and
(ii) changes in the per capita income of each type of family (within effect, WE). Supposes, initially,
as the variation in the PCFI between periods and . This variation can be represented by
the weighted sum of the variation witnessed in each type of family:
k
g
ggYpY1
)( (1)
Where gp is the proportion of the g-th type of family and gY is its respective PCFI.
Making some adjustments, expression (1) can be rewritten as:
k
g
gg
k
g
gggg WECEYpYYpY11
)( (2)
Where gp is the average share of the g-th type of family in periods and , gY is the
respective average PCFI for this type of family, and Y the average PCFI for all families in the
same periods. The first term in expression (2), CE, represents the composition effect, i.e., the share
of the variation in the PCFI due to changes in the relative participation of the g-th type of family. In
turn, the second term WE represents the within effect and expresses the share of the variation in the
PCFI due to changes in the PCFI of the g-th type of family.
We computed this decomposition for the whole population, for the 10% richest and the 40%
poorest families, as well as for the urban and rural families. This analysis allows inferring, for
example, if the monetary gains of each social group were due to changes in the family structures or
due to the income dynamics itself. The greater the value of the CE, the greater is the impact of
changes in the family structure on the income variation for the respective social group.
Decomposing variation in the poverty rate
First, we defined poverty rate as the ratio between the population living on less than $2.00 a
day at international prices (R$ 3.6 per day in 2011) and the whole population. We then used similar
procedures to decompose the variation in the poverty rate (PR) in two sources: (i) changes in the
participation of the types of families (composition effect on poverty, CEP); and (ii) changes in the
poverty rate of each type of family (within effect on poverty, WEP). The variation in the poverty
rate between periods and can be represented by the weighted sum of the variation witnessed
in each type of family:
2 The extended family is composed by different types of relatives and/or aggregates.
Y
5
k
g
gg PRpPR1
)( (3)
Where PRg is the poverty rate of the g-th type of family. Making the necessary adjustments,
we have:
k
g
gg
k
g
gggg WEPCEPPRpPRPRpPR11
)( (4)
Where gPR is the average poverty rate of the g-th type of family in periods and , and
PR is the average poverty rate for all families in the same periods. The first term in expression (4),
CEP, represents the composition effect on poverty, i.e., the share of the variation in the poverty rate
due to changes in the relative participation of the g-th type of family. In turn, the second term WEP
represents the within effect on poverty and expresses the share of the variation in the poverty rate
due to changes in the poverty of the g-th type of family.
Decomposing variation in the inequality rate
Finally, we evaluate the impacts of changes in the composition of the family structure on the
inequality variation. Analyses are based on the inequality ratio (IR), a ratio between the PCFI of the
10% richest and the 40% richest families:
40
10
Y
YIR (5)
Where 10
Y is the PCFI of the 10% richest families and 10
Y is the PCFI of the 40% poorest
families. In turn, the variation in the IR between periods and can be represented by:
1 tt IRIRIR (6)
Make some adjustments we have:
14040
1
1010
1
140
10
t
t
t
t
t
tIR
YY
YYIR
Y
YIR (7)
Merging equations (2) and (7) we have:
1
1
404040
1
1
101010
1
tk
g
ggt
k
g
ggt
IR
WECEY
WECEY
IR (8)
In other words, the variation in the inequality ratio depends both on the composition effects
(CE10
and CE40
) and within effects (WE10
and WE40
) of the richest 10% and the poorest 40%
families. Now, making counterfactual simulations, we can estimate the direct impact of two main
sources of variation on the IR: (i) changes in the participation of the types of families (composition
effect on inequality, CEI); and (ii) changes within each type of family (within effect on inequality,
WEI):
6
1
1
4040
1
1
1010
1
tk
g
gt
k
g
gt
IR
CEY
CEY
CEI (9)
1
1
4040
1
1
1010
1
tk
g
gt
k
g
gt
IR
WEY
WEY
WEI (10)
The CEI (expression 9) represents the expected variation in the IR if changes in the PCFI of
the 10% richest and the 40% poorest families were restricted to the composition effect, i.e., changes
in the family structure. In turn, the WEI in (expression 10) represents the expected variation in the
IR if changes in the PCFI were restricted to the within effect, i.e., changes in the PCFI within the
family types. Since the variation in the IR (expression 6) does not allow a simple linear
decomposition between CEI and WEI, we have also to consider the interaction effect on inequality
(IEI), this means, changes that depend simultaneously on the variation of the CE and the WE and
cannot be linearly decomposed. Thus, the total variation in the IR will be given by:
IEIWEICEIIR (11)
Finally, we investigated the composition of PCFI. Three types of income source were
considered: work (income from all jobs); retirement (government sponsored or private pension
plans, and income from permanence allowance) and other sources (income from donations, rentals,
investments, social programs, and so on).
3. Results
3.1. Family Structure
Table 1 shows the income distribution in urban areas according to the type of family and
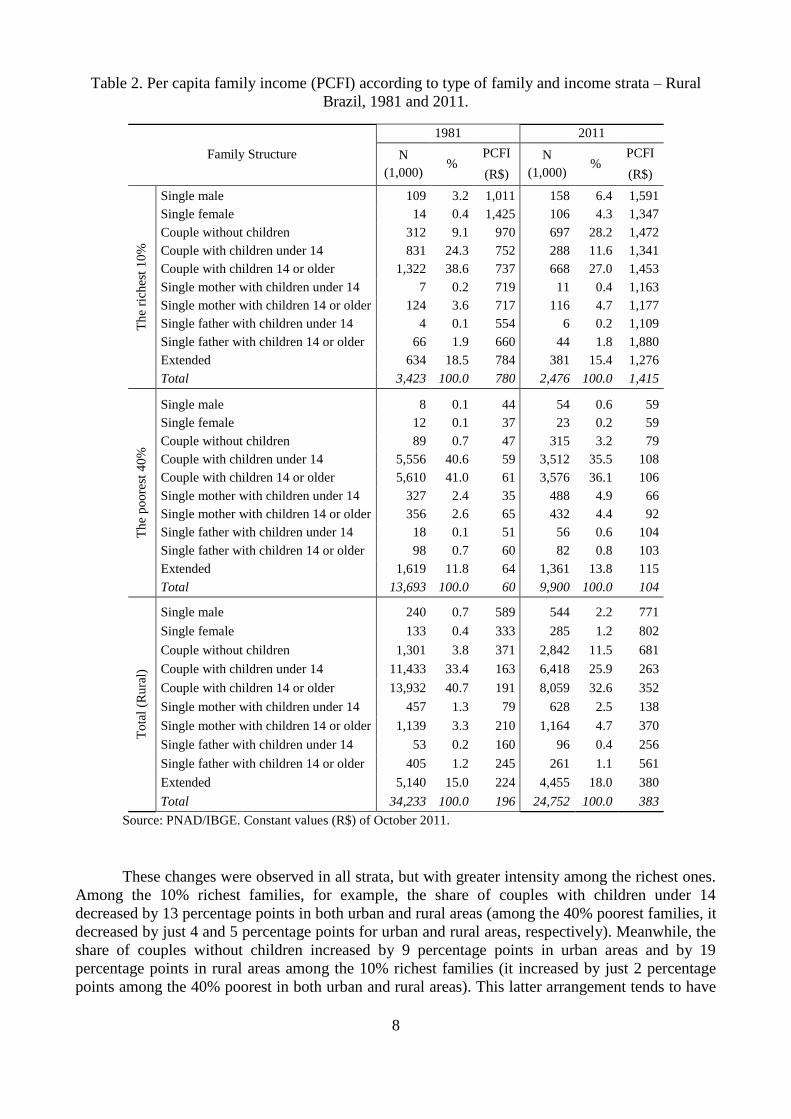
income stratum between 1981 and 2011. Similar results are presented to rural families in Table 2.
First, results highlight the fast growth of the urban population (72.8 million people between 1981
and 2011) and the sharp decrease of the rural population (9.5 million people in the same period).
Unlike the demographic dynamics in developed countries, the transition from rural to urban
population occurred in a relatively short period in Brazil. According to Tafner (2006), more than 24
million people moved from rural to urban areas between the 1980s and the 1990s.
In 2011, the main differences between family structures in urban and rural areas were, first,
the higher share of traditional nuclear families in the rural areas (51% of couples with children in
urban areas and 58% in rural areas). On the other hand, single female units and single mothers with
children were more frequent in urban areas (14% of single female heads in urban areas and 8% in
rural areas). Independent of the types of family, differences between PCFI are expressive. The ratio
between urban and rural PCFI varies between 1.7 (for single fathers) and 2.5 (for couples with
children). Overall, the average PCFI is 2.1 higher in urban areas.
The main change observed between 1981 and 2011 was the sharp decrease of the share of
nuclear families, especially couples with children under 14 (a drop of 9 percentage points in the
urban areas and 8 percentage points in the rural areas). Despite this reduction, couples with children
still accounted for more than half of the Brazilian population in 2011. On the other hand, the share
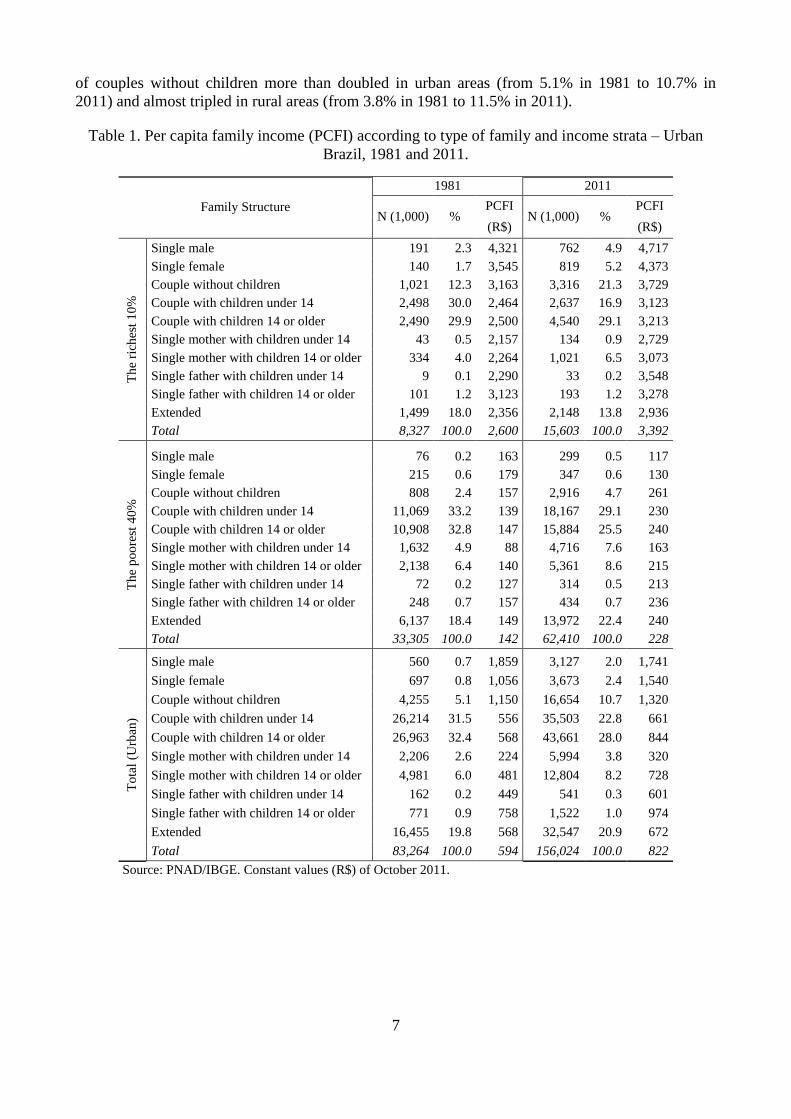
7
of couples without children more than doubled in urban areas (from 5.1% in 1981 to 10.7% in
2011) and almost tripled in rural areas (from 3.8% in 1981 to 11.5% in 2011).
Table 1. Per capita family income (PCFI) according to type of family and income strata – Urban
Brazil, 1981 and 2011.
Family Structure
1981 2011
N (1,000) % PCFI
N (1,000) % PCFI
(R$) (R$)
Th
e ri
ches
t 1
0%
Single male 191 2.3 4,321 762 4.9 4,717
Single female 140 1.7 3,545 819 5.2 4,373
Couple without children 1,021 12.3 3,163 3,316 21.3 3,729
Couple with children under 14 2,498 30.0 2,464 2,637 16.9 3,123
Couple with children 14 or older 2,490 29.9 2,500 4,540 29.1 3,213
Single mother with children under 14 43 0.5 2,157 134 0.9 2,729
Single mother with children 14 or older 334 4.0 2,264 1,021 6.5 3,073
Single father with children under 14 9 0.1 2,290 33 0.2 3,548
Single father with children 14 or older 101 1.2 3,123 193 1.2 3,278
Extended 1,499 18.0 2,356 2,148 13.8 2,936
Total 8,327 100.0 2,600 15,603 100.0 3,392
Th
e p
oo
rest
40
%
Single male 76 0.2 163 299 0.5 117
Single female 215 0.6 179 347 0.6 130
Couple without children 808 2.4 157 2,916 4.7 261
Couple with children under 14 11,069 33.2 139 18,167 29.1 230
Couple with children 14 or older 10,908 32.8 147 15,884 25.5 240
Single mother with children under 14 1,632 4.9 88 4,716 7.6 163
Single mother with children 14 or older 2,138 6.4 140 5,361 8.6 215
Single father with children under 14 72 0.2 127 314 0.5 213
Single father with children 14 or older 248 0.7 157 434 0.7 236
Extended 6,137 18.4 149 13,972 22.4 240
Total 33,305 100.0 142 62,410 100.0 228
To
tal
(Urb
an)
Single male 560 0.7 1,859 3,127 2.0 1,741
Single female 697 0.8 1,056 3,673 2.4 1,540
Couple without children 4,255 5.1 1,150 16,654 10.7 1,320
Couple with children under 14 26,214 31.5 556 35,503 22.8 661
Couple with children 14 or older 26,963 32.4 568 43,661 28.0 844
Single mother with children under 14 2,206 2.6 224 5,994 3.8 320
Single mother with children 14 or older 4,981 6.0 481 12,804 8.2 728
Single father with children under 14 162 0.2 449 541 0.3 601
Single father with children 14 or older 771 0.9 758 1,522 1.0 974
Extended 16,455 19.8 568 32,547 20.9 672
Total 83,264 100.0 594 156,024 100.0 822
Source: PNAD/IBGE. Constant values (R$) of October 2011.
8
Table 2. Per capita family income (PCFI) according to type of family and income strata – Rural
Brazil, 1981 and 2011.
Family Structure
1981 2011
N
(1,000) %
PCFI N
(1,000) %
PCFI
(R$) (R$)
Th
e ri
ches
t 1
0%
Single male 109 3.2 1,011 158 6.4 1,591
Single female 14 0.4 1,425 106 4.3 1,347
Couple without children 312 9.1 970 697 28.2 1,472
Couple with children under 14 831 24.3 752 288 11.6 1,341
Couple with children 14 or older 1,322 38.6 737 668 27.0 1,453
Single mother with children under 14 7 0.2 719 11 0.4 1,163
Single mother with children 14 or older 124 3.6 717 116 4.7 1,177
Single father with children under 14 4 0.1 554 6 0.2 1,109
Single father with children 14 or older 66 1.9 660 44 1.8 1,880
Extended 634 18.5 784 381 15.4 1,276
Total 3,423 100.0 780 2,476 100.0 1,415
Th
e p
oo
rest
40
%
Single male 8 0.1 44 54 0.6 59
Single female 12 0.1 37 23 0.2 59
Couple without children 89 0.7 47 315 3.2 79
Couple with children under 14 5,556 40.6 59 3,512 35.5 108
Couple with children 14 or older 5,610 41.0 61 3,576 36.1 106
Single mother with children under 14 327 2.4 35 488 4.9 66
Single mother with children 14 or older 356 2.6 65 432 4.4 92
Single father with children under 14 18 0.1 51 56 0.6 104
Single father with children 14 or older 98 0.7 60 82 0.8 103
Extended 1,619 11.8 64 1,361 13.8 115
Total 13,693 100.0 60 9,900 100.0 104
To
tal
(Ru
ral)
Single male 240 0.7 589 544 2.2 771
Single female 133 0.4 333 285 1.2 802
Couple without children 1,301 3.8 371 2,842 11.5 681
Couple with children under 14 11,433 33.4 163 6,418 25.9 263
Couple with children 14 or older 13,932 40.7 191 8,059 32.6 352
Single mother with children under 14 457 1.3 79 628 2.5 138
Single mother with children 14 or older 1,139 3.3 210 1,164 4.7 370
Single father with children under 14 53 0.2 160 96 0.4 256
Single father with children 14 or older 405 1.2 245 261 1.1 561
Extended 5,140 15.0 224 4,455 18.0 380
Total 34,233 100.0 196 24,752 100.0 383
Source: PNAD/IBGE. Constant values (R$) of October 2011.
These changes were observed in all strata, but with greater intensity among the richest ones.
Among the 10% richest families, for example, the share of couples with children under 14
decreased by 13 percentage points in both urban and rural areas (among the 40% poorest families, it
decreased by just 4 and 5 percentage points for urban and rural areas, respectively). Meanwhile, the
share of couples without children increased by 9 percentage points in urban areas and by 19
percentage points in rural areas among the 10% richest families (it increased by just 2 percentage
points among the 40% poorest in both urban and rural areas). This latter arrangement tends to have
9
higher levels of income in comparison with other nuclear families, except among the poorest rural
families, where children usually contribute to the familiar agricultural production.
Other important change was the increasing share of single heads with or without children.
Single mother with children under 14 is the most vulnerable group and grew especially among the
poorest families, in urban and rural areas (5 and 4 percentage points among the 40% poorest
families in urban and rural areas, respectively). Among the richest families, both single male and
female units increased substantially, and they present the highest PCFI among all types of family.
Extended families represent another expressive group in the family structure, especially
among the poorest urban families (22% in 2011). The dynamic of the family structure also indicate
an increasing representativeness of this group among the most vulnerable families (4 percentage
points in urban areas and 2 percentage points in rural areas) and decreasing participation among the
richest group (4 percentage points in urban areas and 3 percentage point in rural areas). Among the
poorest families, this type of family with distant relatives and aggregates may indicate a strategic
defense, i.e., the need for sharing resources among family members. As a result, it presents one of
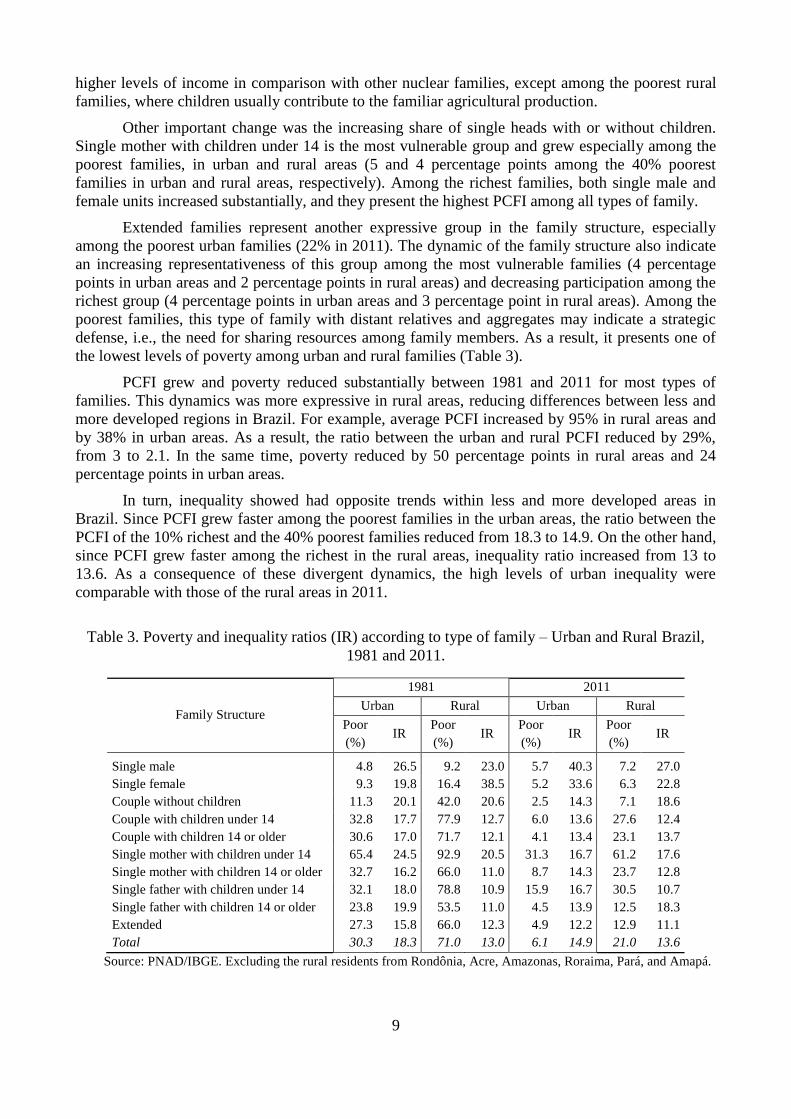
the lowest levels of poverty among urban and rural families (Table 3).
PCFI grew and poverty reduced substantially between 1981 and 2011 for most types of
families. This dynamics was more expressive in rural areas, reducing differences between less and
more developed regions in Brazil. For example, average PCFI increased by 95% in rural areas and
by 38% in urban areas. As a result, the ratio between the urban and rural PCFI reduced by 29%,
from 3 to 2.1. In the same time, poverty reduced by 50 percentage points in rural areas and 24
percentage points in urban areas.
In turn, inequality showed had opposite trends within less and more developed areas in
Brazil. Since PCFI grew faster among the poorest families in the urban areas, the ratio between the
PCFI of the 10% richest and the 40% poorest families reduced from 18.3 to 14.9. On the other hand,
since PCFI grew faster among the richest in the rural areas, inequality ratio increased from 13 to
13.6. As a consequence of these divergent dynamics, the high levels of urban inequality were
comparable with those of the rural areas in 2011.
Table 3. Poverty and inequality ratios (IR) according to type of family – Urban and Rural Brazil,
1981 and 2011.
Family Structure
1981 2011
Urban Rural Urban Rural
Poor
(%) IR
Poor
(%) IR
Poor
(%) IR
Poor
(%) IR
Single male 4.8 26.5 9.2 23.0 5.7 40.3 7.2 27.0
Single female 9.3 19.8 16.4 38.5 5.2 33.6 6.3 22.8
Couple without children 11.3 20.1 42.0 20.6 2.5 14.3 7.1 18.6
Couple with children under 14 32.8 17.7 77.9 12.7 6.0 13.6 27.6 12.4
Couple with children 14 or older 30.6 17.0 71.7 12.1 4.1 13.4 23.1 13.7
Single mother with children under 14 65.4 24.5 92.9 20.5 31.3 16.7 61.2 17.6
Single mother with children 14 or older 32.7 16.2 66.0 11.0 8.7 14.3 23.7 12.8
Single father with children under 14 32.1 18.0 78.8 10.9 15.9 16.7 30.5 10.7
Single father with children 14 or older 23.8 19.9 53.5 11.0 4.5 13.9 12.5 18.3
Extended 27.3 15.8 66.0 12.3 4.9 12.2 12.9 11.1
Total 30.3 18.3 71.0 13.0 6.1 14.9 21.0 13.6
Source: PNAD/IBGE. Excluding the rural residents from Rondônia, Acre, Amazonas, Roraima, Pará, and Amapá.
10
Finally, it is also worth highlighting the high levels of inequality among the single head
units. Although single male and single female units are characterized by high levels of PCFI and
low levels of poverty, they present the highest levels of inequality in both urban and rural areas.
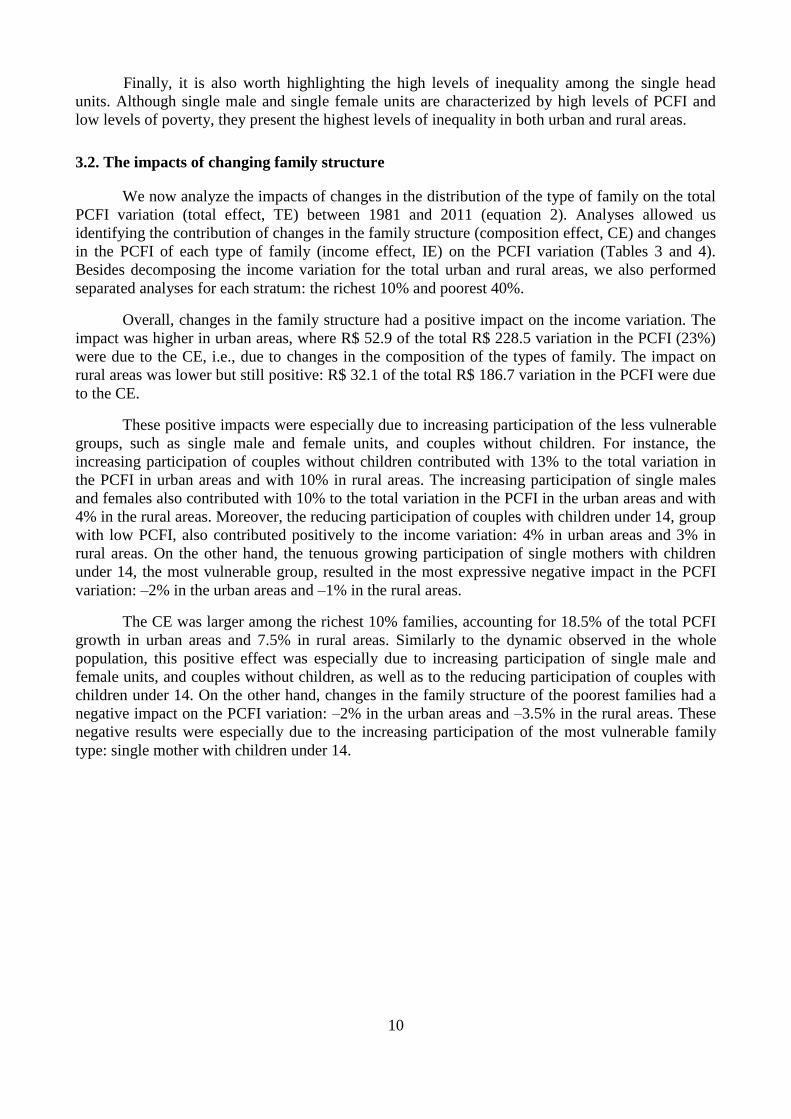
3.2. The impacts of changing family structure
We now analyze the impacts of changes in the distribution of the type of family on the total
PCFI variation (total effect, TE) between 1981 and 2011 (equation 2). Analyses allowed us
identifying the contribution of changes in the family structure (composition effect, CE) and changes
in the PCFI of each type of family (income effect, IE) on the PCFI variation (Tables 3 and 4).
Besides decomposing the income variation for the total urban and rural areas, we also performed
separated analyses for each stratum: the richest 10% and poorest 40%.
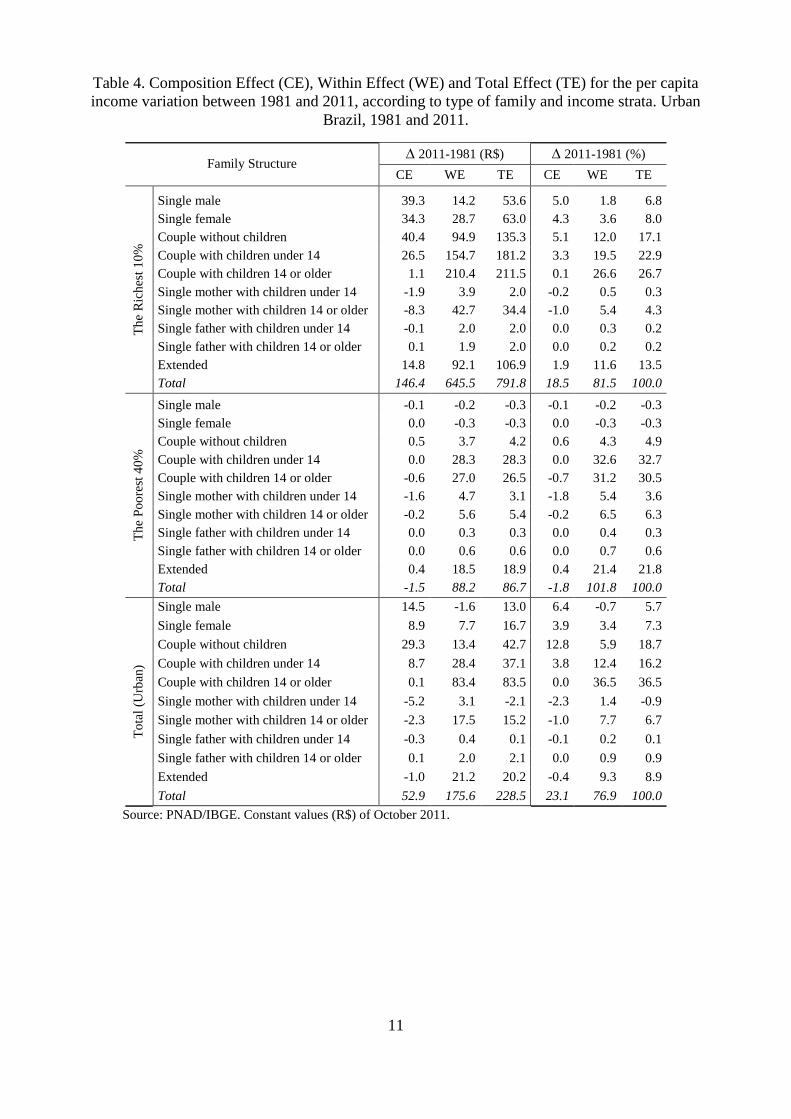
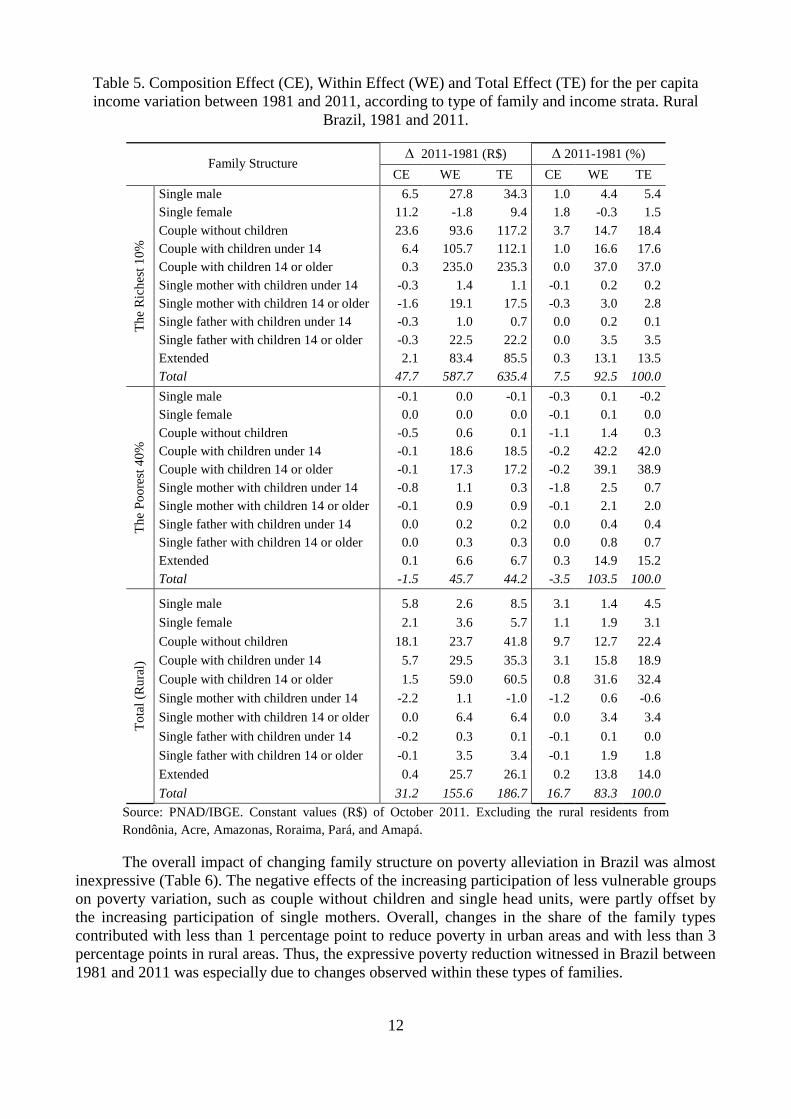
Overall, changes in the family structure had a positive impact on the income variation. The
impact was higher in urban areas, where R$ 52.9 of the total R$ 228.5 variation in the PCFI (23%)
were due to the CE, i.e., due to changes in the composition of the types of family. The impact on
rural areas was lower but still positive: R$ 32.1 of the total R$ 186.7 variation in the PCFI were due
to the CE.
These positive impacts were especially due to increasing participation of the less vulnerable
groups, such as single male and female units, and couples without children. For instance, the
increasing participation of couples without children contributed with 13% to the total variation in
the PCFI in urban areas and with 10% in rural areas. The increasing participation of single males
and females also contributed with 10% to the total variation in the PCFI in the urban areas and with
4% in the rural areas. Moreover, the reducing participation of couples with children under 14, group
with low PCFI, also contributed positively to the income variation: 4% in urban areas and 3% in
rural areas. On the other hand, the tenuous growing participation of single mothers with children
under 14, the most vulnerable group, resulted in the most expressive negative impact in the PCFI
variation: –2% in the urban areas and –1% in the rural areas.
The CE was larger among the richest 10% families, accounting for 18.5% of the total PCFI
growth in urban areas and 7.5% in rural areas. Similarly to the dynamic observed in the whole
population, this positive effect was especially due to increasing participation of single male and
female units, and couples without children, as well as to the reducing participation of couples with
children under 14. On the other hand, changes in the family structure of the poorest families had a
negative impact on the PCFI variation: –2% in the urban areas and –3.5% in the rural areas. These
negative results were especially due to the increasing participation of the most vulnerable family
type: single mother with children under 14.
11
Table 4. Composition Effect (CE), Within Effect (WE) and Total Effect (TE) for the per capita
income variation between 1981 and 2011, according to type of family and income strata. Urban
Brazil, 1981 and 2011.
Family Structure 2011-1981 (R$) 2011-1981 (%)
CE WE TE CE WE TE
Th
e R
ich
est
10
%
Single male 39.3 14.2 53.6 5.0 1.8 6.8
Single female 34.3 28.7 63.0 4.3 3.6 8.0
Couple without children 40.4 94.9 135.3 5.1 12.0 17.1
Couple with children under 14 26.5 154.7 181.2 3.3 19.5 22.9
Couple with children 14 or older 1.1 210.4 211.5 0.1 26.6 26.7
Single mother with children under 14 -1.9 3.9 2.0 -0.2 0.5 0.3
Single mother with children 14 or older -8.3 42.7 34.4 -1.0 5.4 4.3
Single father with children under 14 -0.1 2.0 2.0 0.0 0.3 0.2
Single father with children 14 or older 0.1 1.9 2.0 0.0 0.2 0.2
Extended 14.8 92.1 106.9 1.9 11.6 13.5
Total 146.4 645.5 791.8 18.5 81.5 100.0
Th
e P
oo
rest
40
%
Single male -0.1 -0.2 -0.3 -0.1 -0.2 -0.3
Single female 0.0 -0.3 -0.3 0.0 -0.3 -0.3
Couple without children 0.5 3.7 4.2 0.6 4.3 4.9
Couple with children under 14 0.0 28.3 28.3 0.0 32.6 32.7
Couple with children 14 or older -0.6 27.0 26.5 -0.7 31.2 30.5
Single mother with children under 14 -1.6 4.7 3.1 -1.8 5.4 3.6
Single mother with children 14 or older -0.2 5.6 5.4 -0.2 6.5 6.3
Single father with children under 14 0.0 0.3 0.3 0.0 0.4 0.3
Single father with children 14 or older 0.0 0.6 0.6 0.0 0.7 0.6
Extended 0.4 18.5 18.9 0.4 21.4 21.8
Total -1.5 88.2 86.7 -1.8 101.8 100.0
To
tal
(Urb
an)
Single male 14.5 -1.6 13.0 6.4 -0.7 5.7
Single female 8.9 7.7 16.7 3.9 3.4 7.3
Couple without children 29.3 13.4 42.7 12.8 5.9 18.7
Couple with children under 14 8.7 28.4 37.1 3.8 12.4 16.2
Couple with children 14 or older 0.1 83.4 83.5 0.0 36.5 36.5
Single mother with children under 14 -5.2 3.1 -2.1 -2.3 1.4 -0.9
Single mother with children 14 or older -2.3 17.5 15.2 -1.0 7.7 6.7
Single father with children under 14 -0.3 0.4 0.1 -0.1 0.2 0.1
Single father with children 14 or older 0.1 2.0 2.1 0.0 0.9 0.9
Extended -1.0 21.2 20.2 -0.4 9.3 8.9
Total 52.9 175.6 228.5 23.1 76.9 100.0
Source: PNAD/IBGE. Constant values (R$) of October 2011.
12
Table 5. Composition Effect (CE), Within Effect (WE) and Total Effect (TE) for the per capita
income variation between 1981 and 2011, according to type of family and income strata. Rural
Brazil, 1981 and 2011.
Family Structure 2011-1981 (R$) 2011-1981 (%)
CE WE TE CE WE TE
Th
e R
ich
est
10
%
Single male 6.5 27.8 34.3 1.0 4.4 5.4
Single female 11.2 -1.8 9.4 1.8 -0.3 1.5
Couple without children 23.6 93.6 117.2 3.7 14.7 18.4
Couple with children under 14 6.4 105.7 112.1 1.0 16.6 17.6
Couple with children 14 or older 0.3 235.0 235.3 0.0 37.0 37.0
Single mother with children under 14 -0.3 1.4 1.1 -0.1 0.2 0.2
Single mother with children 14 or older -1.6 19.1 17.5 -0.3 3.0 2.8
Single father with children under 14 -0.3 1.0 0.7 0.0 0.2 0.1
Single father with children 14 or older -0.3 22.5 22.2 0.0 3.5 3.5
Extended 2.1 83.4 85.5 0.3 13.1 13.5
Total 47.7 587.7 635.4 7.5 92.5 100.0
Th
e P
oo
rest
40
%
Single male -0.1 0.0 -0.1 -0.3 0.1 -0.2
Single female 0.0 0.0 0.0 -0.1 0.1 0.0
Couple without children -0.5 0.6 0.1 -1.1 1.4 0.3
Couple with children under 14 -0.1 18.6 18.5 -0.2 42.2 42.0
Couple with children 14 or older -0.1 17.3 17.2 -0.2 39.1 38.9
Single mother with children under 14 -0.8 1.1 0.3 -1.8 2.5 0.7
Single mother with children 14 or older -0.1 0.9 0.9 -0.1 2.1 2.0
Single father with children under 14 0.0 0.2 0.2 0.0 0.4 0.4
Single father with children 14 or older 0.0 0.3 0.3 0.0 0.8 0.7
Extended 0.1 6.6 6.7 0.3 14.9 15.2
Total -1.5 45.7 44.2 -3.5 103.5 100.0
To
tal
(Ru
ral)
Single male 5.8 2.6 8.5 3.1 1.4 4.5
Single female 2.1 3.6 5.7 1.1 1.9 3.1
Couple without children 18.1 23.7 41.8 9.7 12.7 22.4
Couple with children under 14 5.7 29.5 35.3 3.1 15.8 18.9
Couple with children 14 or older 1.5 59.0 60.5 0.8 31.6 32.4
Single mother with children under 14 -2.2 1.1 -1.0 -1.2 0.6 -0.6
Single mother with children 14 or older 0.0 6.4 6.4 0.0 3.4 3.4
Single father with children under 14 -0.2 0.3 0.1 -0.1 0.1 0.0
Single father with children 14 or older -0.1 3.5 3.4 -0.1 1.9 1.8
Extended 0.4 25.7 26.1 0.2 13.8 14.0
Total 31.2 155.6 186.7 16.7 83.3 100.0
Source: PNAD/IBGE. Constant values (R$) of October 2011. Excluding the rural residents from
Rondônia, Acre, Amazonas, Roraima, Pará, and Amapá.
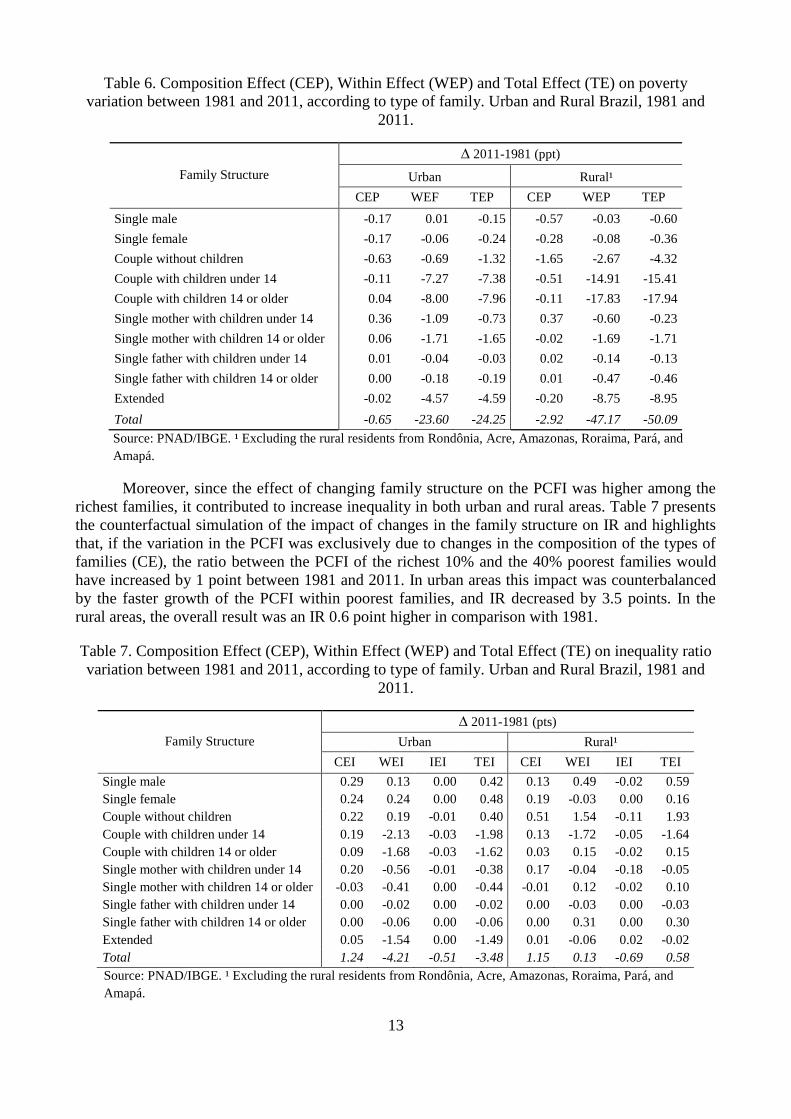
The overall impact of changing family structure on poverty alleviation in Brazil was almost
inexpressive (Table 6). The negative effects of the increasing participation of less vulnerable groups
on poverty variation, such as couple without children and single head units, were partly offset by
the increasing participation of single mothers. Overall, changes in the share of the family types
contributed with less than 1 percentage point to reduce poverty in urban areas and with less than 3
percentage points in rural areas. Thus, the expressive poverty reduction witnessed in Brazil between
1981 and 2011 was especially due to changes observed within these types of families.
13
Table 6. Composition Effect (CEP), Within Effect (WEP) and Total Effect (TE) on poverty
variation between 1981 and 2011, according to type of family. Urban and Rural Brazil, 1981 and
2011.
Family Structure
2011-1981 (ppt)
Urban Rural¹
CEP WEF TEP CEP WEP TEP
Single male -0.17 0.01 -0.15 -0.57 -0.03 -0.60
Single female -0.17 -0.06 -0.24 -0.28 -0.08 -0.36
Couple without children -0.63 -0.69 -1.32 -1.65 -2.67 -4.32
Couple with children under 14 -0.11 -7.27 -7.38 -0.51 -14.91 -15.41
Couple with children 14 or older 0.04 -8.00 -7.96 -0.11 -17.83 -17.94
Single mother with children under 14 0.36 -1.09 -0.73 0.37 -0.60 -0.23
Single mother with children 14 or older 0.06 -1.71 -1.65 -0.02 -1.69 -1.71
Single father with children under 14 0.01 -0.04 -0.03 0.02 -0.14 -0.13
Single father with children 14 or older 0.00 -0.18 -0.19 0.01 -0.47 -0.46
Extended -0.02 -4.57 -4.59 -0.20 -8.75 -8.95
Total -0.65 -23.60 -24.25 -2.92 -47.17 -50.09
Source: PNAD/IBGE. ¹ Excluding the rural residents from Rondônia, Acre, Amazonas, Roraima, Pará, and
Amapá.
Moreover, since the effect of changing family structure on the PCFI was higher among the
richest families, it contributed to increase inequality in both urban and rural areas. Table 7 presents
the counterfactual simulation of the impact of changes in the family structure on IR and highlights
that, if the variation in the PCFI was exclusively due to changes in the composition of the types of
families (CE), the ratio between the PCFI of the richest 10% and the 40% poorest families would
have increased by 1 point between 1981 and 2011. In urban areas this impact was counterbalanced
by the faster growth of the PCFI within poorest families, and IR decreased by 3.5 points. In the
rural areas, the overall result was an IR 0.6 point higher in comparison with 1981.
Table 7. Composition Effect (CEP), Within Effect (WEP) and Total Effect (TE) on inequality ratio
variation between 1981 and 2011, according to type of family. Urban and Rural Brazil, 1981 and
2011.
Family Structure
2011-1981 (pts)
Urban Rural¹
CEI WEI IEI TEI CEI WEI IEI TEI
Single male 0.29 0.13 0.00 0.42 0.13 0.49 -0.02 0.59
Single female 0.24 0.24 0.00 0.48 0.19 -0.03 0.00 0.16
Couple without children 0.22 0.19 -0.01 0.40 0.51 1.54 -0.11 1.93
Couple with children under 14 0.19 -2.13 -0.03 -1.98 0.13 -1.72 -0.05 -1.64
Couple with children 14 or older 0.09 -1.68 -0.03 -1.62 0.03 0.15 -0.02 0.15
Single mother with children under 14 0.20 -0.56 -0.01 -0.38 0.17 -0.04 -0.18 -0.05
Single mother with children 14 or older -0.03 -0.41 0.00 -0.44 -0.01 0.12 -0.02 0.10
Single father with children under 14 0.00 -0.02 0.00 -0.02 0.00 -0.03 0.00 -0.03
Single father with children 14 or older 0.00 -0.06 0.00 -0.06 0.00 0.31 0.00 0.30
Extended 0.05 -1.54 0.00 -1.49 0.01 -0.06 0.02 -0.02
Total 1.24 -4.21 -0.51 -3.48 1.15 0.13 -0.69 0.58
Source: PNAD/IBGE. ¹ Excluding the rural residents from Rondônia, Acre, Amazonas, Roraima, Pará, and
Amapá.
14
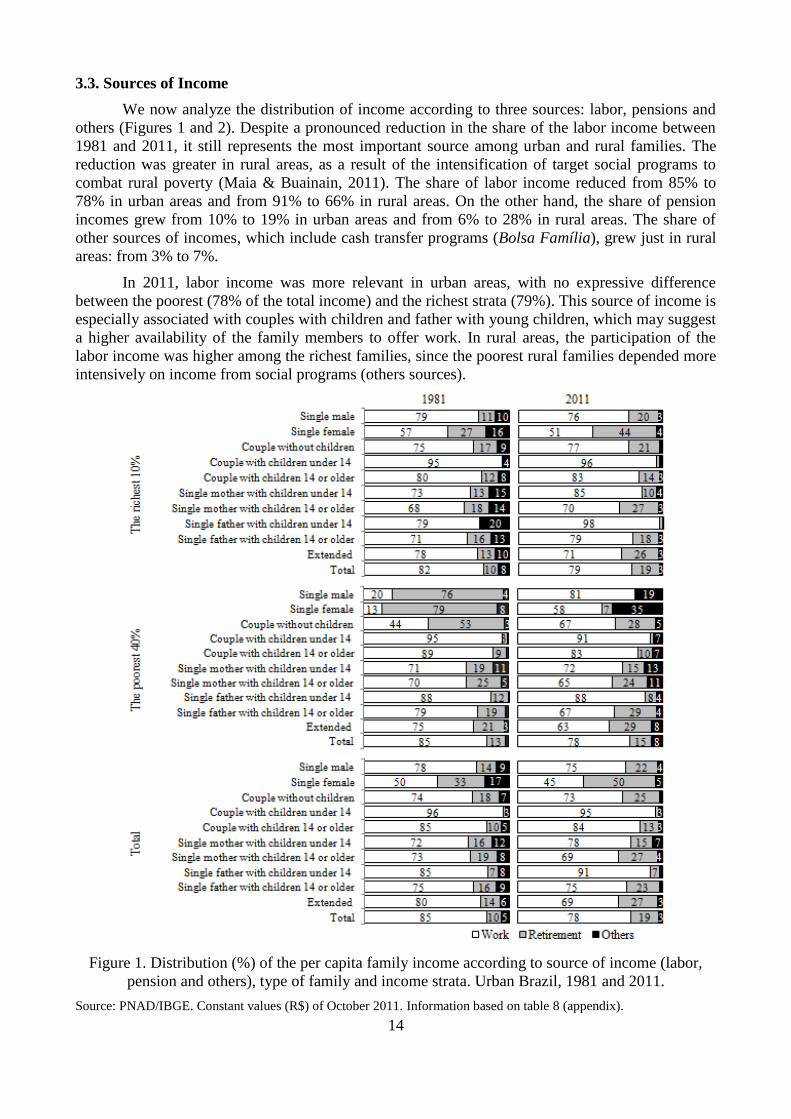
3.3. Sources of Income
We now analyze the distribution of income according to three sources: labor, pensions and
others (Figures 1 and 2). Despite a pronounced reduction in the share of the labor income between
1981 and 2011, it still represents the most important source among urban and rural families. The
reduction was greater in rural areas, as a result of the intensification of target social programs to
combat rural poverty (Maia & Buainain, 2011). The share of labor income reduced from 85% to
78% in urban areas and from 91% to 66% in rural areas. On the other hand, the share of pension
incomes grew from 10% to 19% in urban areas and from 6% to 28% in rural areas. The share of
other sources of incomes, which include cash transfer programs (Bolsa Família), grew just in rural
areas: from 3% to 7%.
In 2011, labor income was more relevant in urban areas, with no expressive difference
between the poorest (78% of the total income) and the richest strata (79%). This source of income is
especially associated with couples with children and father with young children, which may suggest
a higher availability of the family members to offer work. In rural areas, the participation of the
labor income was higher among the richest families, since the poorest rural families depended more
intensively on income from social programs (others sources).
Figure 1. Distribution (%) of the per capita family income according to source of income (labor,
pension and others), type of family and income strata. Urban Brazil, 1981 and 2011.
Source: PNAD/IBGE. Constant values (R$) of October 2011. Information based on table 8 (appendix).
15
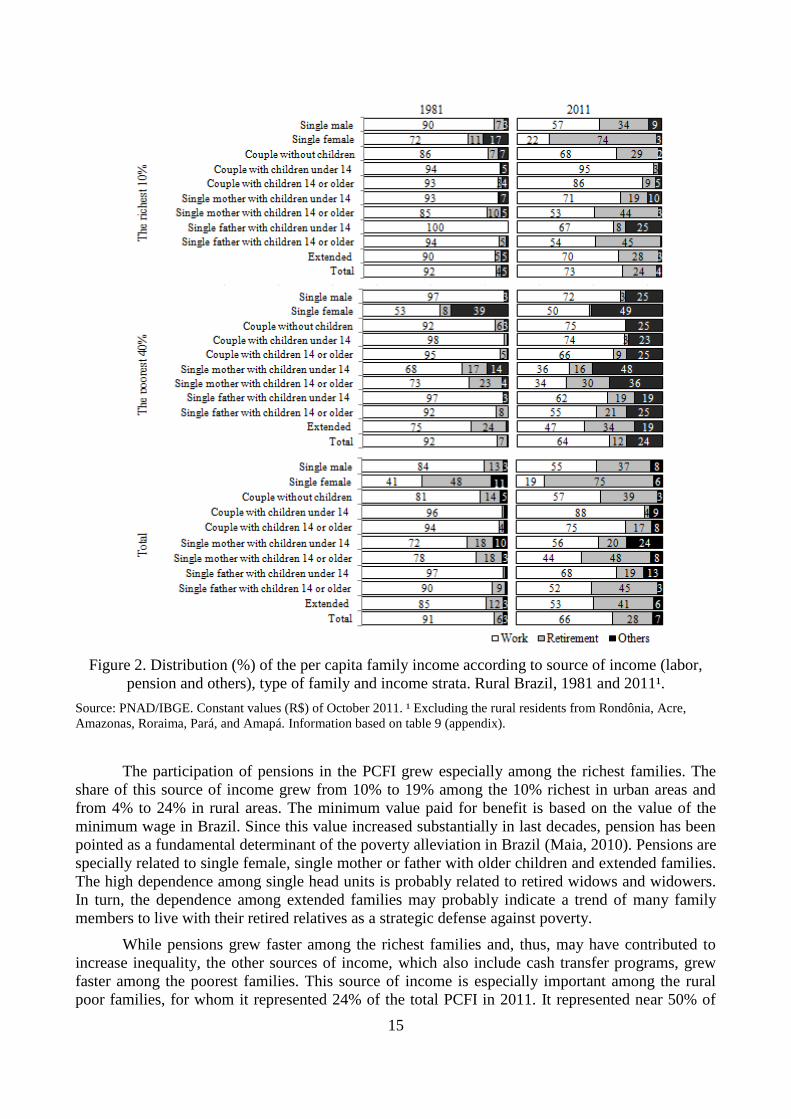
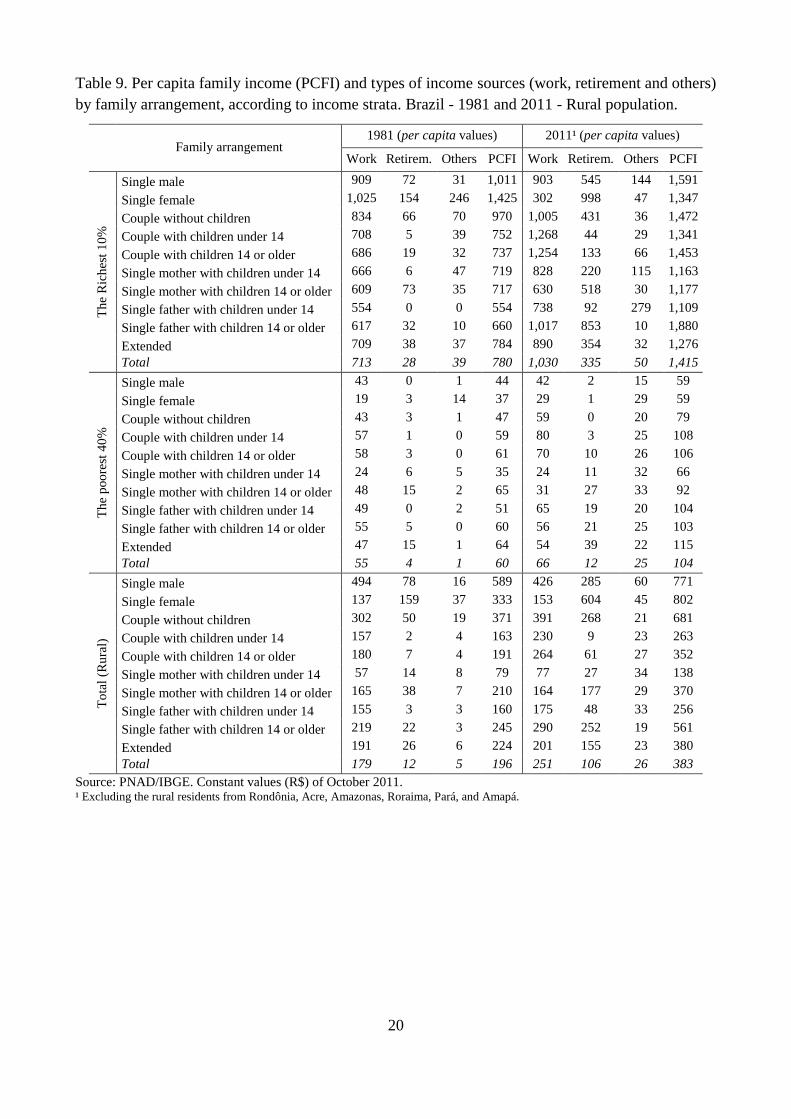
Figure 2. Distribution (%) of the per capita family income according to source of income (labor,
pension and others), type of family and income strata. Rural Brazil, 1981 and 2011¹.
Source: PNAD/IBGE. Constant values (R$) of October 2011. ¹ Excluding the rural residents from Rondônia, Acre,
Amazonas, Roraima, Pará, and Amapá. Information based on table 9 (appendix).
The participation of pensions in the PCFI grew especially among the richest families. The
share of this source of income grew from 10% to 19% among the 10% richest in urban areas and
from 4% to 24% in rural areas. The minimum value paid for benefit is based on the value of the
minimum wage in Brazil. Since this value increased substantially in last decades, pension has been
pointed as a fundamental determinant of the poverty alleviation in Brazil (Maia, 2010). Pensions are
specially related to single female, single mother or father with older children and extended families.
The high dependence among single head units is probably related to retired widows and widowers.
In turn, the dependence among extended families may probably indicate a trend of many family
members to live with their retired relatives as a strategic defense against poverty.
While pensions grew faster among the richest families and, thus, may have contributed to
increase inequality, the other sources of income, which also include cash transfer programs, grew
faster among the poorest families. This source of income is especially important among the rural
poor families, for whom it represented 24% of the total PCFI in 2011. It represented near 50% of
16
the total PCFI among two of the most vulnerable family types in the rural poverty: single female
and single mother with children under 14.
4. Final considerations
Brazil has a huge income inequality, one of the largest in the world, and a low level of per
capita income. Between 1981 and 2011, this country witnessed substantial changes in its family
structure, with relevant impacts on income distribution. The average family size declined from 5.0
in 1981 to 3.4 in 2011, in part because fertility decreased but also due to changes in the family
structure. The share of traditional nuclear families reduced sharply, increasing the participation of
couples without children and single-headed families. The increasing share of extended families with
several primary income earners is also noticeable, characterizing the process of population
transition of developing countries that have occurred in a short period of time (Chu & Jiang, 1997).
The sharp decrease of nuclear families and the rise of couples without children in both rural
and urban areas reflect mostly a sharp decline in the fertility rates. In rural areas, we have also to
consider the migration of many young members from rural to urban areas, in search of better job
opportunities. Overall, changes in the family structure contributed significantly to the income
dynamics among rural and urban families. First, the reduced number of dependent children had
clearly a positive impact on per capita income. However, this positive contribution (i) was greater in
urban areas, and (ii) was restricted to the higher income strata. Among the poorest families, changes
in the family structure had a negative effect on the income distribution, contributing to reduce
average per capita income and to increase inequality within urban and rural areas. Similarly to what
happened in developed nations (see, for instance, McLanahan & Percheski, 2008; Martin, 2006;
Lerman, 1996; Karoly & Burtless, 1995), the fast increase of single-headed families in the bottom
strata, especially single-mother families, subjecting an increasing share of families to low hourly
wages and to the risk of poverty.
Poverty rates continue to be substantially high among single-mother families, which
contributed to attenuate the positive impact of the increasing number of couples without children on
poverty reduction in Brazil. The overall impact of changing family structure on poverty was almost
inexpressive, in both urban and rural areas. High income inequality within each family group also
helps to explain why the positive impact that changing family structure had on PCFI did not reflect
more significantly in poverty alleviation. The average PCFI of the 10% richest families is more than
10 times higher than the PCFI of the 40% poorest families for all family types, especially those
formed by single-headed units. Inequality is lower within extended families, since sharing the
household with additional earners provides economies of scale and helps to attenuate the
socioeconomic condition of many traditional families in vulnerable conditions.
Changes in the family structure were more pronounced in urban areas, contributing to
increase inequality between more developed and less developed areas. The lower impact of the
demographic changes on the poorest and on the less developed areas gives rise to two main
hypotheses: i) the richest population would be the main beneficiary of the demographic changes
(i.e., being favored by the higher education levels and consequently by the more pronounced
reduction in the fertility rate), ii) the intergenerational mobility of the families, where demographic
changes observed in the transition between the generations within the families would remove these
poor families from the lower tenths of the income strata. Unfortunately, the second hypothesis
cannot be investigated more accurately, since there is no longitudinal data available in Brazil to
analyze family mobility. Nevertheless, the demographic changes that have occurred among the
poorest families in Brazil are noticeable (IPEA, 2012). A direct consequence of the fertility
reduction among the poorest families would be the reduction of the dependency ratio and growth of
the PCFI, resulting in many poor families leaving the lower tenths of the income strata.

17
Despite the negative contribution of the demographic changes to the income differences
between urban and rural families, the income inequality between these areas reduced significantly
in this period. The income growth of the poorest families arose from a broad variety of sources,
such as higher wages, labor-force participation, pension and cash transfer programs (Barros, et al.,
2007). All sources of income (labor, pension, and others) grew faster in rural areas, contributing to
reduce urban-rural inequality. First, it is worth highlighting recent improvements in the Brazilian
labor market, as a result of higher rates of formalization and new labor regulations (increasing
minimum wage) (Sakamoto & Maia, 2012). The poorest segments were especially benefited, since
the Brazilian minimum wage grew faster than the average wage (Saboia, 2010). Retirement are the
second most important source of income and increased substantially for both urban areas and
especially rural areas. Moreover, several modifications implemented in the Federal Constitution of
1988 greatly benefited the rural population, such as less restrictive conditions for granting the
benefits, and the reduction of the minimum age to start collecting the benefits (Beltrão, et al., 2005).
Finally, cash transfer programs implemented since the mid-1990s clearly contributed to improve
socioeconomic conditions of the poorest family, particularly in rural areas (Maia & Buainain,
2011). In the short term, these social policies showed positive impacts on the income distribution.
Finally, it is worth noting that our results do not represent causal relationships. In other
words, we cannot definitively say that poverty is caused by changes in family structure (Iceland,
2003). Nevertheless, results highlight that a significant share of the population in Brazil has not yet
benefited from the changes in the family structure. When considered alone, these changes
demonstrated regressive effects and have increased the income inequality in Brazil. However, the
poorest families seem to have especially benefited from the economic growth experienced in Brazil
in recent years, which contributed considerably to increase income and to reduce the levels of
inequality and poverty in Brazil.
Bibliography
Almas, I., Havnes, T. & Mogstad, M. Baby booming inequality? Demographic change and earnings
inequality in Norway, 1967–2000. Journal of Economic Inequality, Volume 9, pp. 629-650,
2011.
Ashraf, Q. H., Weil, D. N. & Wilde, J. The effect of intervention to reduce fertility on economic
growth. NBER Working Paper Series, Issue 17377, 2011.
Barros, R. P. B., Firpo, S., Barreto, R. G. & Leite, P. G. P. Demographic changes and poverty in
Brazil. In: N. Birdsall, A. C. Kelley & S. Sinding, eds. Population matters: demographic change,
economic growth, and poverty in the developing world. Oxford: Oxford University Press, 2001.
Barros, R. P. et al. Sobre a evolução recente da pobreza e da desigualdade no Brasil. In: J. A. d.
Castro & F. M. Vaz, eds. Situação Social Brasileira: monitoramento das condições de vida 1.
Brasília: IPEA, 2011.
Barros, R. P. d., Foguel, M. N. & Ulyssea, G. (Org.). Desigualdade de renda no Brasil: uma análise
da queda recente. 2 ed. Rio de Janeiro: IPEA, 2007.
Beltrão, K. I., Camarano, A. A. & Mello, J. L. Mudanças nas condições de vida dos idosos rurais
brasileiros: resultados não esperados dos avanços da seguridade social. Texto para Discussão,
IPEA, Issue 1066, 2005.
Bloom, D. E., Danning, D., Fink, G. & Finlay, J. E. Microeconomic foundations of the demographic
dividend. Harvard School of Public Health, 2010.
Cancian, M. & Reed, D. Changes in family structure: implications for poverty and related policy.
In: S. H. Danziger & R. H. Haveman, eds. Understanding poverty. New York and Cambridge:
Russel Sage Foundation and Harvard University Press, pp. 69-96, 2001.
Cariello, R. O enigma e o demógrafo. Revista Piaiuí, May, n. 80, 2013.
18
Chu, C. Y. C. & Jiang, L. Demographic transition, family structure, and income inequality. The
Review of Economic and Statistics, 79(4), pp. 665-669, 1997.
Economic Commission for Latin America and the Caribbean. Panorama social de América Latina,
Santiago: CEPAL, 2005.
Ellwood, D. & Jencks, C. The uneven spread of single-parent families: What do we know? Where
do we look for answers?. In: K. Neckerman, ed. Social Inequality. New York: Russell Sage
Found, pp. 3-78, 2004.
Hausmann, R. & Székely, M. Inequality and the family in Latin America. In: N. Birdsall, A. C.
Kelley & S. Sinding, eds. Population matters: demographic change, cconomic Growth, and
poverty in the developing world. Oxford: Oxford University, 2001.
Iceland, J. Why poverty remains high: the role of income growth, economic inequality, and changes
in family structure, 1949-1999. Demography, 40(3), pp. 499-519, 2003.
Instituto Brasileiro de Geografia e Estatística. Manual de entrevista da pesquisa básica da PNAD
de 1995, Rio de Janeiro: IBGE, 1995.
Instituto de Pesquisa Econômica Aplicada. Tendências demográficas mostradas pela PNAD 2011,
Rio de Janeiro: Comunicado do IPEA, n. 157, IPEA, 2012.
Karoly, L. A. & Burtless, G. Demographic change, rising earnings inequality, and the distribution
of personal well-being, 1959-1989. Demography, 32(3), pp. 379-405, 1995.
Lee, C. Rising income inequality in the United States, 1968-2000: impacts of changing labor
supplu, wages and family structure. NBER Working Paper Series, Issue Working Paper 11836,
pp. 1-36, 2005.
Leone, E. T., Maia, A. G. & Baltar, P. E. Mudanças na composição das famílias e impactos sobre a
redução da pobreza no Brasil. Economia e Sociedade, 19(1), pp. 59-77, 2010.
Lerman, R. I. The impact of the changing US family structure on child poverty and income
inequality. Economica, Supplement: Economic Policy and IncomeDistribution, 63(250), pp.
S119-S139, 1996.
Lesthaeghe, R. The second demographic transition in western countries. In: K. O. Mason & A.
Jensen, eds. Gender and family change in industrialized countries. Oxford: Clarendon Press,
1995.
Maia, A. G. A contribuição das fontes de rendimento na dinâmica da distribuição espacial de renda
no Brasil. Economia Contemporânea, 20(3), pp. 1-30, 2010.
Maia, A. G. & Buainain, A. M. Pobreza objetiva e subjetiva no Brasil. Confins, Issue 13, 2011.
Martin, M. A. Family structure and income inequality in families with dhildren, 1976 to 2000.
Demography, 43(3), pp. 421-445, 2006.
McLanahan, S. & Percheski, C. Family structure and the reproduction of inequalities. Annual
Review of Sociology, Volume 34, pp. 257-276, 2008.
Parson, T. The social structure of the family. In: R. Ashen, ed. The family: its function and destiny.
New York: Harper & Broth, 1949.
Saboia, J. Elasticidades dos rendimentos do trabalho em relação ao salário mínimo: a experiência de
um período recente de crescimento do salário mínimo. Economia e Sociedade, 19(2), pp. 359-
380, 2010.
Sakamoto, C. & Maia, A. G. Dinâmica do mercado de trabalho agrícola e impactos sobre a
distribuição de rendimentos nos anos 2000. Revista da ABET, 11(2), pp. 11-31, 2012.
Tafner, P. Brasil: o estado de uma nação. Rio de Janeiro: IPEA, 2006.
19
Appendix:
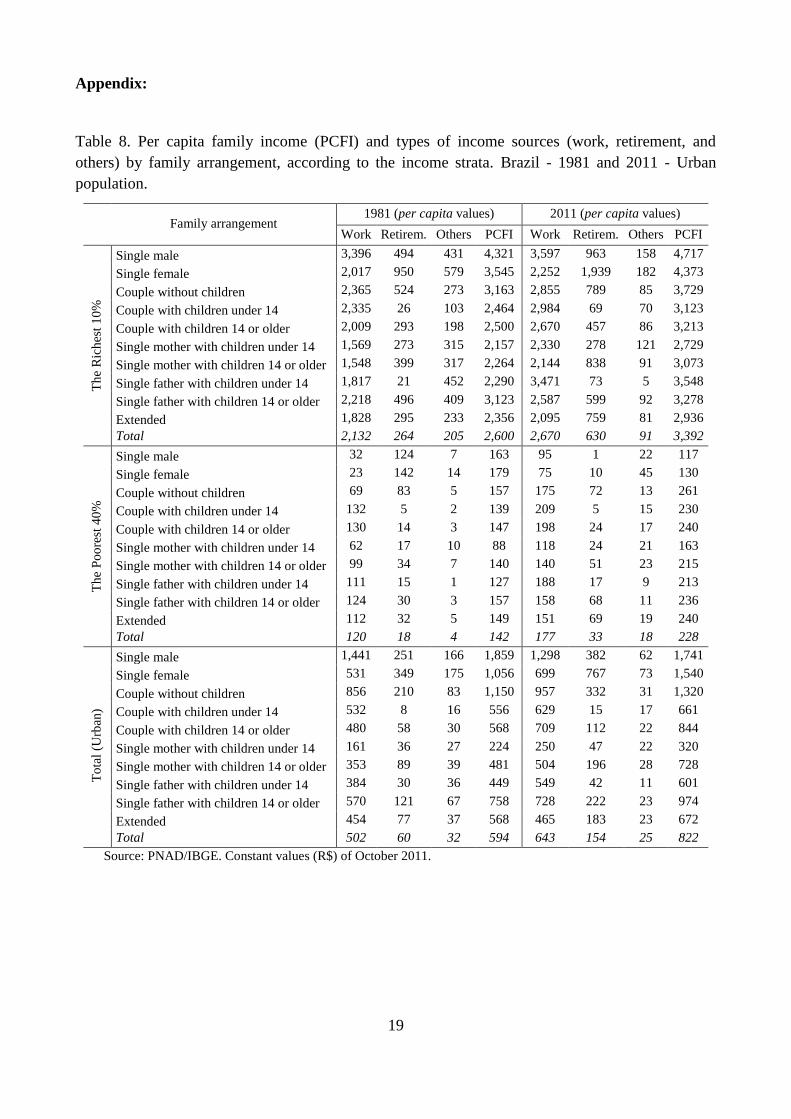
Table 8. Per capita family income (PCFI) and types of income sources (work, retirement, and
others) by family arrangement, according to the income strata. Brazil - 1981 and 2011 - Urban
population.
Family arrangement 1981 (per capita values) 2011 (per capita values)
Work Retirem. Others PCFI Work Retirem. Others PCFI
Th
e R
ich
est
10
%
Single male 3,396 494 431 4,321 3,597 963 158 4,717
Single female 2,017 950 579 3,545 2,252 1,939 182 4,373
Couple without children 2,365 524 273 3,163 2,855 789 85 3,729
Couple with children under 14 2,335 26 103 2,464 2,984 69 70 3,123
Couple with children 14 or older 2,009 293 198 2,500 2,670 457 86 3,213
Single mother with children under 14 1,569 273 315 2,157 2,330 278 121 2,729
Single mother with children 14 or older 1,548 399 317 2,264 2,144 838 91 3,073
Single father with children under 14 1,817 21 452 2,290 3,471 73 5 3,548
Single father with children 14 or older 2,218 496 409 3,123 2,587 599 92 3,278
Extended 1,828 295 233 2,356 2,095 759 81 2,936
Total 2,132 264 205 2,600 2,670 630 91 3,392
Th
e P
oo
rest
40
%
Single male 32 124 7 163 95 1 22 117
Single female 23 142 14 179 75 10 45 130
Couple without children 69 83 5 157 175 72 13 261
Couple with children under 14 132 5 2 139 209 5 15 230
Couple with children 14 or older 130 14 3 147 198 24 17 240
Single mother with children under 14 62 17 10 88 118 24 21 163
Single mother with children 14 or older 99 34 7 140 140 51 23 215
Single father with children under 14 111 15 1 127 188 17 9 213
Single father with children 14 or older 124 30 3 157 158 68 11 236
Extended 112 32 5 149 151 69 19 240
Total 120 18 4 142 177 33 18 228
To
tal
(Urb
an)
Single male 1,441 251 166 1,859 1,298 382 62 1,741
Single female 531 349 175 1,056 699 767 73 1,540
Couple without children 856 210 83 1,150 957 332 31 1,320
Couple with children under 14 532 8 16 556 629 15 17 661
Couple with children 14 or older 480 58 30 568 709 112 22 844
Single mother with children under 14 161 36 27 224 250 47 22 320
Single mother with children 14 or older 353 89 39 481 504 196 28 728
Single father with children under 14 384 30 36 449 549 42 11 601
Single father with children 14 or older 570 121 67 758 728 222 23 974
Extended 454 77 37 568 465 183 23 672
Total 502 60 32 594 643 154 25 822
Source: PNAD/IBGE. Constant values (R$) of October 2011.
20
Table 9. Per capita family income (PCFI) and types of income sources (work, retirement and others)
by family arrangement, according to income strata. Brazil - 1981 and 2011 - Rural population. Family arrangement
1981 (per capita values) 2011¹ (per capita values)
Work Retirem. Others PCFI Work Retirem. Others PCFI
Th
e R
ich
est
10
%
Single male 909 72 31 1,011 903 545 144 1,591
Single female 1,025 154 246 1,425 302 998 47 1,347
Couple without children 834 66 70 970 1,005 431 36 1,472
Couple with children under 14 708 5 39 752 1,268 44 29 1,341
Couple with children 14 or older 686 19 32 737 1,254 133 66 1,453
Single mother with children under 14 666 6 47 719 828 220 115 1,163
Single mother with children 14 or older 609 73 35 717 630 518 30 1,177
Single father with children under 14 554 0 0 554 738 92 279 1,109
Single father with children 14 or older 617 32 10 660 1,017 853 10 1,880
Extended 709 38 37 784 890 354 32 1,276
Total 713 28 39 780 1,030 335 50 1,415
Th
e p
oo
rest
40
%
Single male 43 0 1 44 42 2 15 59
Single female 19 3 14 37 29 1 29 59
Couple without children 43 3 1 47 59 0 20 79
Couple with children under 14 57 1 0 59 80 3 25 108
Couple with children 14 or older 58 3 0 61 70 10 26 106
Single mother with children under 14 24 6 5 35 24 11 32 66
Single mother with children 14 or older 48 15 2 65 31 27 33 92
Single father with children under 14 49 0 2 51 65 19 20 104
Single father with children 14 or older 55 5 0 60 56 21 25 103
Extended 47 15 1 64 54 39 22 115
Total 55 4 1 60 66 12 25 104
To
tal
(Ru
ral)
Single male 494 78 16 589 426 285 60 771
Single female 137 159 37 333 153 604 45 802
Couple without children 302 50 19 371 391 268 21 681
Couple with children under 14 157 2 4 163 230 9 23 263
Couple with children 14 or older 180 7 4 191 264 61 27 352
Single mother with children under 14 57 14 8 79 77 27 34 138
Single mother with children 14 or older 165 38 7 210 164 177 29 370
Single father with children under 14 155 3 3 160 175 48 33 256
Single father with children 14 or older 219 22 3 245 290 252 19 561
Extended 191 26 6 224 201 155 23 380
Total 179 12 5 196 251 106 26 383
Source: PNAD/IBGE. Constant values (R$) of October 2011. ¹ Excluding the rural residents from Rondônia, Acre, Amazonas, Roraima, Pará, and Amapá.