BFAP BASELINE • Agricultural Outlook 2014 -2023 BFAP BASELINE · 2018-08-08 · 6 BFAP BASELINE...
160
BFAP BASELINE • Agricultural Outlook 2014 -2023 BFAP BASELINE Agricultural Outlook 2014 - 2023 AFRICAN FOOD SYSTEMS August 2014
Transcript of BFAP BASELINE • Agricultural Outlook 2014 -2023 BFAP BASELINE · 2018-08-08 · 6 BFAP BASELINE...

BFAP BASELINE • Agricultural Outlook 2014 -2023
BFAP BASELINEAgr icultural Outlook2014 - 2023
AFRICAN FOOD
SYSTEMS
August 2014


AFRICAN FOOD
SYSTEMS
B F A P B A S E L I N EAgr i cu l t u r a l Out look
2014 - 2023
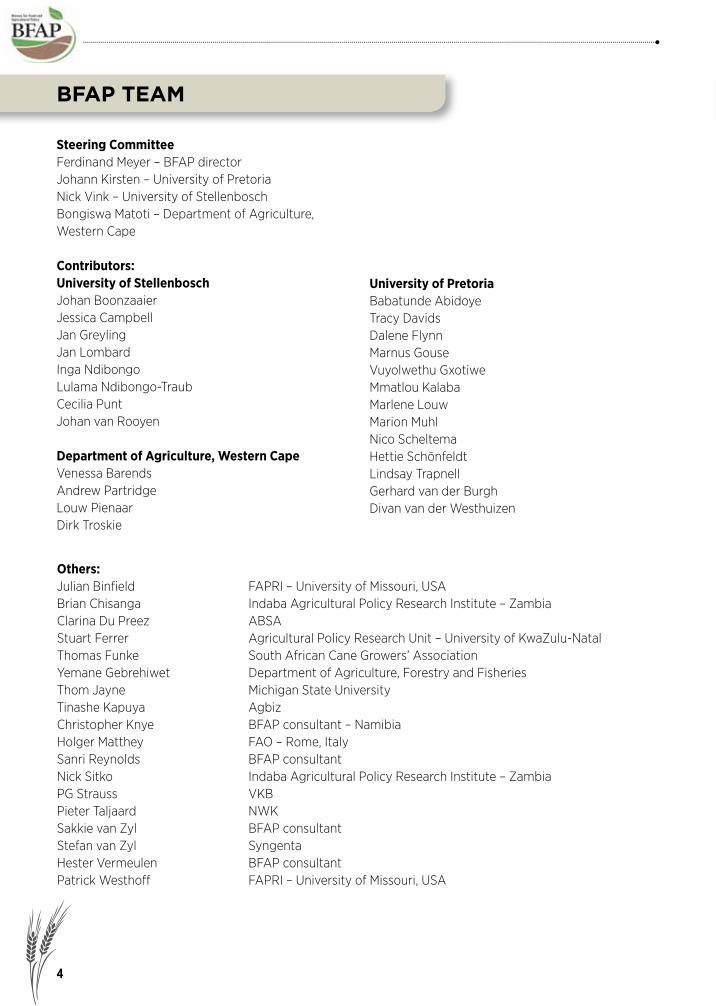
Steering CommitteeFerdinand Meyer – BFAP directorJohann Kirsten – University of PretoriaNick Vink – University of StellenboschBongiswa Matoti – Department of Agriculture, Western Cape
Contributors:University of StellenboschJohan BoonzaaierJessica CampbellJan GreylingJan LombardInga NdibongoLulama Ndibongo-TraubCecilia PuntJohan van Rooyen
Department of Agriculture, Western CapeVenessa BarendsAndrew PartridgeLouw PienaarDirk Troskie
University of PretoriaBabatunde AbidoyeTracy DavidsDalene FlynnMarnus GouseVuyolwethu Gxotiwe Mmatlou KalabaMarlene LouwMarion Muhl Nico ScheltemaHettie SchönfeldtLindsay TrapnellGerhard van der BurghDivan van der Westhuizen
Others:Julian Binfi eld FAPRI – University of Missouri, USABrian Chisanga Indaba Agricultural Policy Research Institute – ZambiaClarina Du Preez ABSAStuart Ferrer Agricultural Policy Research Unit – University of KwaZulu-NatalThomas Funke South African Cane Growers’ AssociationYemane Gebrehiwet Department of Agriculture, Forestry and FisheriesThom Jayne Michigan State University Tinashe Kapuya AgbizChristopher Knye BFAP consultant – NamibiaHolger Matthey FAO – Rome, ItalySanri Reynolds BFAP consultantNick Sitko Indaba Agricultural Policy Research Institute – ZambiaPG Strauss VKB Pieter Taljaard NWKSakkie van Zyl BFAP consultant Stefan van Zyl SyngentaHester Vermeulen BFAP consultantPatrick Westhoff FAPRI – University of Missouri, USA
BFAP TEAM
4

BFAP BASELINE • Agricultural Outlook 2014 -2023
ACKNOWLEDGEMENTS
Main Sponsors of the BFAP Baseline:National Agricultural Marketing Council (NAMC)ABSA AgribusinessDepartment of Agriculture, Western Cape
Others:agri benchmark, Thünen Institute, Braunschweig, GermanyCitrus Growers Association of Southern Africa (CGA)Department of Agriculture Forestry and Fisheries (DAFF)ExcelsusFood and Agricultural Policy Research Institute (FAPRI), University of MissouriFood and Agricultural Organization of the United Nations (FAO)GWK Ltd.Grain SAHortgro Services (SAAPPA)John DeereMaize TrustNWK Ltd.Overberg AgriPotatoes SA (PSA)Protein Research Foundation (PRF)Red Meat Producers’ Organisation (RPO)Senwes Ltd.South African Breweries (SAB)South African Cane Growers’ AssociationSouth African Feedlot Association (SAFA)South African Grain Information Service (SAGIS)South African Poultry Association (SAPA)South African Pork Producers Organisation (SAPPO)South African Table Grape Industry (SATI)South African Wine Industry Information & Systems (SAWIS)Syngenta
5
6
BFAP BASELINE • Agricultural Outlook 2014 -2023
FOREWORD
FOUNDED IN 2004, the Bureau for Food and Agricultural Policy (BFAP), with offi ces at the University of Pretoria, the University of Stellenbosch, and the Western Cape Department of Agriculture, consists of 45 public and private sector analysts and experts who pool their knowledge and research to inform decision-making within South Africa’s food and beverage sector. BFAP has become a valuable resource to the agro-industrial complex by providing analyses of future policy and market scenarios and measuring their impact on farm and fi rm profi tability. BFAP is also partnering with various international institutions and is part of the newly established Regional Network of Agricultural Policy Research Institutes (ReNAPRI) in Eastern and Southern Africa. The Bureau consults to both national and multinational private sector entities as well as to government in all spheres. BFAP acknowledges and appreciates the tremendous insight of numerous industry specialists over the past years. The fi nancial support from the National Agricultural Marketing Council (NAMC), the Western Cape Department of Agriculture and ABSA Agribusiness towards the development and publishing of this Baseline is also gratefully acknowledged. Although all industry partners’ comments and suggestions are taken into consideration, BFAP’s own views are presented in the baseline publication.
Disclaimer: The views expressed in this report refl ect those of BFAP and do not constitute any specifi c advice as to decisions or actions that should be taken. Whilst every care has been taken in preparing this document, no representation, warranty, or undertaking (expressed or implied) is given and no responsibility or liability is accepted by BFAP as to the accuracy or completeness of the information contained herein. In addition, BFAP accepts no responsibility or liability for any damages of whatsoever nature which any person may suffer as a result of any decision or action taken on the basis of the information contained herein. All opinions and estimates contained in this report may be changed after publication at any time without notice.

7
BFAP BASELINE • Agricultural Outlook 2014 -2023
BFAP TEAM. . . . . . . . . . . . . . . . . . . . . . . . . . . . . . . . . . . . . . . . . . . . . . . . . . . . . . . . . . . . . . . . . . . . . . . . . . . . . . . . . . . . . . . 4
ACKNOWLEDGEMENTS . . . . . . . . . . . . . . . . . . . . . . . . . . . . . . . . . . . . . . . . . . . . . . . . . . . . . . . . . . . . . . . . . . . . . . . . . . 5
FOREWORD . . . . . . . . . . . . . . . . . . . . . . . . . . . . . . . . . . . . . . . . . . . . . . . . . . . . . . . . . . . . . . . . . . . . . . . . . . . . . . . . . . . . . 6
TABLE OF CONTENTS . . . . . . . . . . . . . . . . . . . . . . . . . . . . . . . . . . . . . . . . . . . . . . . . . . . . . . . . . . . . . . . . . . . . . . . . . . . . 7
CONTEXT AND PURPOSE OF THE BASELINE . . . . . . . . . . . . . . . . . . . . . . . . . . . . . . . . . . . . . . . . . . . . . . . . . . . . . . . 8
EXECUTIVE SUMMARY AND IMPLICATIONS . . . . . . . . . . . . . . . . . . . . . . . . . . . . . . . . . . . . . . . . . . . . . . . . . . . . . . . . 9
OVERVIEW. . . . . . . . . . . . . . . . . . . . . . . . . . . . . . . . . . . . . . . . . . . . . . . . . . . . . . . . . . . . . . . . . . . . . . . . . . . . . . . . . . . . . . 11
KEY BASELINE ASSUMPTIONS . . . . . . . . . . . . . . . . . . . . . . . . . . . . . . . . . . . . . . . . . . . . . . . . . . . . . . . . . . . . . . . . . . . . 23
SOUTH AFRICAN OUTLOOK . . . . . . . . . . . . . . . . . . . . . . . . . . . . . . . . . . . . . . . . . . . . . . . . . . . . . . . . . . . . . . . . . . . . 26
SUMMER GRAINS . . . . . . . . . . . . . . . . . . . . . . . . . . . . . . . . . . . . . . . . . . . . . . . . . . . . . . . . . . . . . . . . . . . . . . . . . . . . . 26
WINTER GRAINS . . . . . . . . . . . . . . . . . . . . . . . . . . . . . . . . . . . . . . . . . . . . . . . . . . . . . . . . . . . . . . . . . . . . . . . . . . . . . 34
OILSEEDS AND OILSEED PRODUCTS . . . . . . . . . . . . . . . . . . . . . . . . . . . . . . . . . . . . . . . . . . . . . . . . . . . . . . . . . . 38
SUGARCANE AND SUGAR . . . . . . . . . . . . . . . . . . . . . . . . . . . . . . . . . . . . . . . . . . . . . . . . . . . . . . . . . . . . . . . . . . . . 49
MEAT . . . . . . . . . . . . . . . . . . . . . . . . . . . . . . . . . . . . . . . . . . . . . . . . . . . . . . . . . . . . . . . . . . . . . . . . . . . . . . . . . . . . . . . . 53
MILK AND DAIRY PRODUCTS . . . . . . . . . . . . . . . . . . . . . . . . . . . . . . . . . . . . . . . . . . . . . . . . . . . . . . . . . . . . . . . . . 63
POTATOES . . . . . . . . . . . . . . . . . . . . . . . . . . . . . . . . . . . . . . . . . . . . . . . . . . . . . . . . . . . . . . . . . . . . . . . . . . . . . . . . . . . 67
CITRUS . . . . . . . . . . . . . . . . . . . . . . . . . . . . . . . . . . . . . . . . . . . . . . . . . . . . . . . . . . . . . . . . . . . . . . . . . . . . . . . . . . . . . . 70
TABLE GRAPES . . . . . . . . . . . . . . . . . . . . . . . . . . . . . . . . . . . . . . . . . . . . . . . . . . . . . . . . . . . . . . . . . . . . . . . . . . . . . . . 81
APPLES AND PEARS. . . . . . . . . . . . . . . . . . . . . . . . . . . . . . . . . . . . . . . . . . . . . . . . . . . . . . . . . . . . . . . . . . . . . . . . . . . 85
CONSUMER TRENDS AND ANALYSIS . . . . . . . . . . . . . . . . . . . . . . . . . . . . . . . . . . . . . . . . . . . . . . . . . . . . . . . . . . . . . 90
FARMING SYSTEMS ANALYSIS . . . . . . . . . . . . . . . . . . . . . . . . . . . . . . . . . . . . . . . . . . . . . . . . . . . . . . . . . . . . . . . . . . .110
FUTURE SCENARIOS FOR SOUTHERN AFRICAN MAIZE TRADE . . . . . . . . . . . . . . . . . . . . . . . . . . . . . . . . . . . .137
THE FUTURE OF AFRICAN AGRICULTURE: EXAMINING THE TRENDS
SHAPING THE AFRICAN FOOD SYSTEM. . . . . . . . . . . . . . . . . . . . . . . . . . . . . . . . . . . . . . . . . . . . . . . . . . . . . . . . . .147
TABLE OF CONTENTS

8
BFAP BASELINE • Agricultural Outlook 2014 -2023
THE 2014 EDITION of the BFAP baseline presents an outlook of agricultural production, consumption, prices and trade in South Africa for the period 2014 to 2023 and relates these results to anticipated investment trends and trade fl ows on the African continent. This outlook is based on assumptions about a range of economic, technological, environmental, political, institutional, and social factors. The outlook for South Africa is generated by the BFAP sector model and specifi c trade scenarios are simulated in partnership with the Regional Network of African Policy Research Institutes (ReNAPRI), using the fi rst version of the ReNAPRI Agricultural Outlook model, as developed in partnership with the Food and Agricultural Policy Research Institute (FAPRI) at the University of Missouri. Both the models are econometric, recursive, partial equilibrium models. For each commodity, the important components of supply and demand are identifi ed and equilibrium established in each market by means of balance sheet principles where demand equals supply. A number of critical assumptions have to be made for baseline projections. One of the most important of these is that average weather conditions will prevail in Southern Africa and around the world: therefore yields grow constantly over the baseline as technology improves. Assumptions with respect to the outlook of macroeconomic conditions are based on a combination of projections developed by the International Monetary Fund (IMF) and the World Bank. Baseline projections for world commodity markets are generated by FAPRI at the University of Missouri. Once the critical assumptions are captured in the BFAP sector model, the outlook for all commodities is simulated within a closed system of equations. This implies that, for example, any shocks in the grain sector are transmitted to the livestock sector and vice versa. This year’s baseline takes the latest trends, policies and market information into consideration and is constructed in such a way that the decision maker can form a picture of an equilibrium in agricultural markets, given the assumptions made.
However, markets are extremely volatile and the probability that future prices will not match baseline projections is therefore high. Given this uncertainty, the baseline projections should be interpreted as one possible scenario that could unfold, where temporary factors (e.g. weather issues) play out over the short run and permanent factors (e.g. biofuels policies) cause structural shifts in agricultural commodity markets over the long run. The baseline, therefore, serves as a benchmark against which alternative exogenous shocks can be measured and understood. In addition, the baseline serves as an early-warning system to inform role-players in the agricultural industry about the potential effect of long-term structural changes on agricultural commodity markets, such as the impact of a sharp increase in input prices or the impact of improvements in technology on the supply response. To summarise, the baseline does NOT constitute a forecast, but rather represents a benchmark of what COULD happen under a particular set of assumptions. Inherent uncertainties, including policy changes, weather, and other market variations ensure that the future is highly unlikely to match baseline projections. Recognising this fact, BFAP incorporates scenario planning and risk analyses in the process of attempting to understand the underlying risks and uncertainties of agricultural markets. Some of the boxes in the publication present limited results of various analyses conducted through 2013. In the farm-level chapter of this baseline, scenarios and risk analyses are presented to illustrate the volatile outcome of future projections. Further stochastic (risk) analyses are not published in the baseline, but prepared independently on request from clients. The BFAP baseline 2014 should be regarded as only one of the tools in the decision-making process of the agricultural sector, and other sources of information, experience, planning and decision making techniques have to be taken into consideration.
CONTEXT AND PURPOSE OF THE BASELINE

9
BFAP BASELINE • Agricultural Outlook 2014 -2023
THE 2014 EDITION of the BFAP Baseline is set within a turbulent macroeconomic environment. South Africa’s economic growth slowed to the lowest level in almost 5 years in 2013 and following continued labour unrest, particularly in the mining sector, the fi rst quarter of 2014 marked a contraction of the economy for the fi rst time since 2009. With infl ation at the highest level since 2009, consumers are fi nding their expendable income under increasing pressure with the result that the consumer confi dence index has declined continuously since mid-2012, reaching a decadal low in the third quarter of 2013. While the dynamic consumer environment through the past decade refl ected signifi cant income growth and class mobility, increasing debt levels combined with low consumer confi dence point to reduced spending in the short term outlook. The macroeconomic environment underlying the baseline projections refl ects a downward adjustment in economic growth rates globally; the OECD and IMF project dampened economic growth rates, particularly in key emerging economies such as China and India. South African agriculture will, therefore, increasingly look to rapidly growing African economies as potential markets. The outlook for the South African economy also remains cautious and while a recovery is expected in the long run, growth remains below 4% per annum over the 10 year period. Nevertheless, demand for food products continues to grow in the long run, primarily due to increasing population numbers. Oil prices are expected to trade sideways in the medium term, before increasing gradually from 2016 onwards to reach $125 per barrel for the benchmark Brent crude by 2023. Having depreciated sharply against major international currencies in 2013 and 2014, the value of the Rand is expected to strengthen marginally in 2015, followed by a gradual depreciation over the next decade. Within the global context, bumper harvests of the 2013/14 production season have resulted in rapidly declining farm gate prices for most crops. While prices are not expected to plummet to pre-2006 levels, the projected stabilisation in the long run will be well below the price levels of the past three years. In contrast, a confl uence of factors including weather
conditions and various disease outbreaks have restricted the supply of livestock products, pushing prices to record levels. While prices are expected to stabilise in the long run, higher projected prices in the medium term, combined with reduced feed costs, have set the scene for renewed profi tability in the livestock sector. In South Africa, area under fi eld crops reached the highest level in 10 years in 2013, however adverse weather conditions impacted negatively on production volumes, resulting in lower stock levels and record prices. Looking to the future, under the assumption of normal weather conditions, yields are set to improve continuously over the next decade due to technological improvement and, despite an expected consolidation in area planted, production of major fi eld crops will expand to meet rising demand. In light of the increasing demand for meat products, which implies growing demand for protein feed, higher relative returns are expected to drive a shift in crop area from cereals to oilseeds. Following the bumper crop anticipated in 2014, ample supply domestically as well as in the global market will result in lower prices and in the context of rising input costs, producer margins are set to come under pressure in the medium term. Continuous improvements in productivity levels will be critical to the long term success of agricultural producers. Continued pressure on consumer spending power, combined with higher prices results in a downward adjustment of growth rates in the demand for meat products for the second consecutive year. Nevertheless, fi rm prices in the global market, combined with continued depreciation in the exchange rate will support higher prices over the next decade, particularly in the poultry industry where imported products supplement domestic demand. The expected decline in feed grain prices results in improved meat to feed price ratios, supporting profi tability in intensive livestock production. The horticultural sectors enjoyed a bumper season in 2013; signifi cant volumes of high quality fruit entered the market and the weaker exchange rate supported higher returns in the export market. While rising input costs remain a concern, favourable returns are expected to encourage investment in
EXECUTIVE SUMMARY AND IMPLICATIONS

10
BFAP BASELINE • Agricultural Outlook 2014 -2023
the fruit sector, resulting in expansion of the area in production over the next decade. Citrus presents a new inclusion in the 2014 Baseline. The optimistic outlook generated is based on the assumption of continued access to the EU market. In this regard further Citrus Black Spot occurrences present signifi cant uncertainty and illustrate the importance of diversifi ed markets in export orientated industries. Gross value added in the agricultural sector is set to reach an all-time high in 2014, yet from 2015 to 2017, the impact of lower prices will result in a substantial decline in both net farm income and gross value added in the sector. Driven largely by fi rm gross returns from both horticulture and livestock products, gross value added by the agricultural sector will recover to expand by an annual average of 2.2% in the long term, which represents a signifi cant decline from the growth registered through the past 10 years. South Africa’s net trade position in the agricultural sector improved in 2013. A surplus of approximately R25 billion from the sector refl ects substantial export volumes in high value products in the horticultural subsector, as well as improved reporting of trade within the SADC region. From a regional perspective, the positive trade balance is a result of increased exports to the EU and Africa, the only two regions where South Africa registered a positive trade balance. Under the assumptions associated with the 2014 Baseline, aggregated trade volumes in the sector are not projected to change signifi cantly, however relative shifts in products traded should account for a positive trade balance in value terms over the next decade. While poultry imports are projected to expand, signifi cant reductions in oilcake imports are anticipated and while cereal exports are expected to decline, export volumes in the horticultural sector are projected to expand in response to favourable returns. In
addition, under an enabling environment that incentivises investment, the National Development Plan identifi ed 140 thousand additional hectares of high potential, irrigated area that could support expansion in high value, labour intensive industries in the future. Competitiveness of labour, both in terms of productivity and cost, will remain one of the primary determinants of which specifi c industries will expand, as the nature of the products dictate the extent to which labour can be replaced by mechanisation. To summarise, the 2014 edition of the BFAP baseline presents an agricultural sector that is characterised by substantial reductions in profi t margins relative to the past 5 years. In order to remain sustainable and competitive in the global context, continuous intensifi cation will need to be supported by the adoption of improved technology, in a sustainable manner. In a medium-term scenario of stagnant commodity prices, farming units and agribusinesses that do not possess the critical economies of scale will come under increasing pressure. The potential additional cost burden and uncertainty related to land reform could therefore come at a very sensitive stage for the agricultural industry. The South African agricultural sector has always operated in an uncertain environment and the future will be no different. The impact of adverse weather conditions on global food prices was evident in the past three years and changes in the macroeconomic environment could potentially result in a very different Outlook. Given the uncertainties related to both income growth and global food prices the focus on African Food Systems highlights the key drivers and mega-trends that will shape the development of a region with immense potential. Different plausible scenarios are presented, resulting in far ranging outcomes related to investment in the region.

11
BFAP BASELINE • Agricultural Outlook 2014 -2023
REAL VALUE ADDED by the agricultural sector accelerated by 5% in 2013, a substantial increase from the 3.1% registered in 2012. Increased value added in the agricultural sector was attributed to growth in real income in the sector, as derived from growth in animal products, horticulture and fi eld crops during 2013. As a result, the real net farming income increased by 5.8% during 2013. Growth in animal production is expected to spur growth of the agricultural sector through 2014 and despite the projected softening of global commodity prices, both net farming income and gross value added of the sector are projected to show moderate growth of 2.5% over the next decade.
Real gross value of fi eld cropsThe real income of fi eld crops during 2013 is mainly attributed to maize (49.3%), sugar (16.1%), wheat (11%), sunfl ower seed (5.8%) and soya beans (5.3%); together these fi ve commodities accounted for 88% of the total real income of fi eld crops. During 2013, real gross income of maize and wheat contracted by 1.3% and 2.1%, respectively. Real income of sugar and soya beans showed signifi cant growth of 31.2% and 20.7%, respectively, while sunfl ower seed registered moderate growth of 6.7%. Despite their insignifi cant
share in real income, canola, dry beans, lucerne and sorghum increased by 42.2%, 26.2% and 21.5% and 8.3%, respectively during 2013. Conversely the real income from groundnuts, barley and tobacco contracted by 28.9%, 8.8% and 6.9%, respectively. Despite the decline in income from maize and wheat, the total real gross value of fi eld crops increased moderately by 5.3% in 2013 as a result of substantial growth in income from sugar. The projected decline in the price of maize, barley, sugarcane and wheat together with the area contraction for maize, wheat and soya beans is expected to reduce this growth in the real income of fi eld crops to a modest 1.2% in 2014. A sharp decline in global commodity prices is projected to drive the real gross value of fi eld crops lower in 2015 and 2016, followed by a modest recovery refl ecting average annual growth of 1.5% per annum from 2016 to 2023.
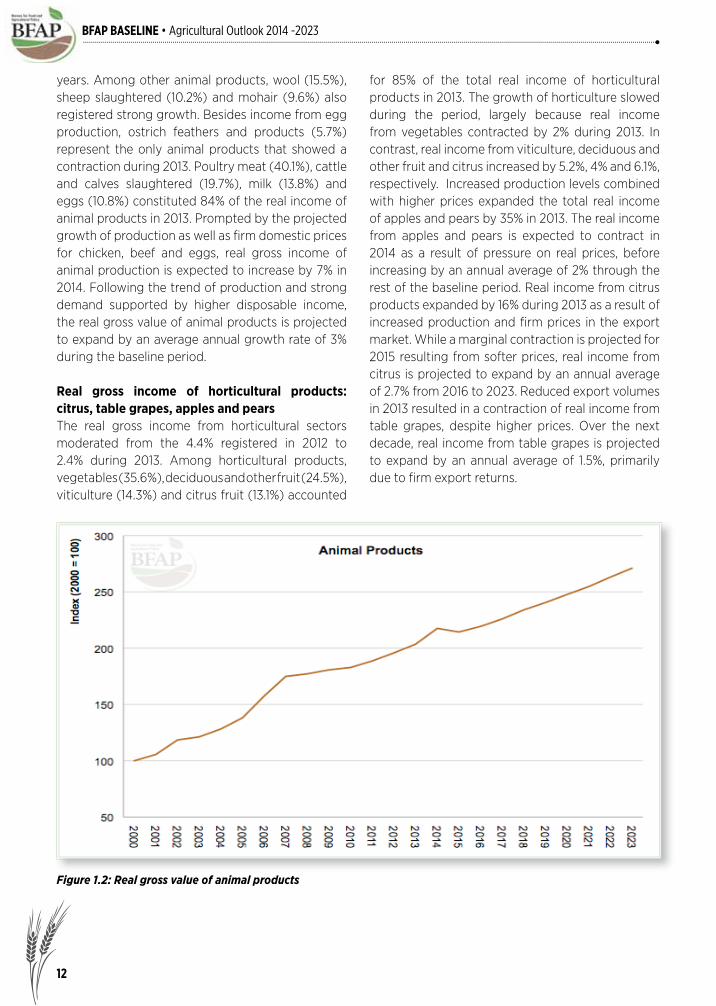
Real gross value of animal productsSpurred by the moderate growth of real income from poultry meat (5.7%), cattle and calves slaughtered (4%) and milk (1.8%) that compensated for the reduced real income from eggs (1.9%), real gross income of animal products increased by 4% in 2013; the highest growth in the past 5
OVERVIEW
Figure 1.1: Real gross value of fi eld crops
12
BFAP BASELINE • Agricultural Outlook 2014 -2023
years. Among other animal products, wool (15.5%), sheep slaughtered (10.2%) and mohair (9.6%) also registered strong growth. Besides income from egg production, ostrich feathers and products (5.7%) represent the only animal products that showed a contraction during 2013. Poultry meat (40.1%), cattle and calves slaughtered (19.7%), milk (13.8%) and eggs (10.8%) constituted 84% of the real income of animal products in 2013. Prompted by the projected growth of production as well as fi rm domestic prices for chicken, beef and eggs, real gross income of animal production is expected to increase by 7% in 2014. Following the trend of production and strong demand supported by higher disposable income, the real gross value of animal products is projected to expand by an average annual growth rate of 3% during the baseline period.
Real gross income of horticultural products: citrus, table grapes, apples and pearsThe real gross income from horticultural sectors moderated from the 4.4% registered in 2012 to 2.4% during 2013. Among horticultural products, vegetables (35.6%), deciduous and other fruit (24.5%), viticulture (14.3%) and citrus fruit (13.1%) accounted
Figure 1.2: Real gross value of animal products
for 85% of the total real income of horticultural products in 2013. The growth of horticulture slowed during the period, largely because real income from vegetables contracted by 2% during 2013. In contrast, real income from viticulture, deciduous and other fruit and citrus increased by 5.2%, 4% and 6.1%, respectively. Increased production levels combined with higher prices expanded the total real income of apples and pears by 35% in 2013. The real income from apples and pears is expected to contract in 2014 as a result of pressure on real prices, before increasing by an annual average of 2% through the rest of the baseline period. Real income from citrus products expanded by 16% during 2013 as a result of increased production and fi rm prices in the export market. While a marginal contraction is projected for 2015 resulting from softer prices, real income from citrus is projected to expand by an annual average of 2.7% from 2016 to 2023. Reduced export volumes in 2013 resulted in a contraction of real income from table grapes, despite higher prices. Over the next decade, real income from table grapes is projected to expand by an annual average of 1.5%, primarily due to fi rm export returns.

13
BFAP BASELINE • Agricultural Outlook 2014 -2023
Figure 1.3: Real gross income of citrus, table grapes, apples and pears
Figure 1.4: Real gross income of the agricultural sector

14
BFAP BASELINE • Agricultural Outlook 2014 -2023
Real gross income of the agricultural sectorDuring 2013, real income from fi eld crops, horticulture and animal products increased by 5.3%, 2.4% and 3.9%, respectively. As a result, the total real income of the agricultural sector showed a 3.8% expansion. The share of real income from animal products, horticulture and fi eld crops to the total real income of the agricultural sector was 52.4%, 27.5% and 20%, respectively. During 2014, the agricultural sector is expected to register growth of 4.8% in real gross income. Despite modest projected income growth from fi eld crops over the baseline period, gross income from the agricultural sector as a whole is projected to expand by an annual average of 2.5% over the next decade, supported by strong projected growth in real income from animal products and horticulture over the baseline period.
Real intermediate input expenditureReal intermediate input expenditure refers to all purchased inputs that are used during the production season. Among these expenditures fuel, fertiliser, feed, farm services and maintenance and repairs amount to 67% of the total real intermediate input
Figure 1.5: Real intermediate input expenditure
expenditure. The other main intermediate input expenditures are animal health and crop protection, electricity, seed and plants and packing material. The real growth of expenditure was modest for farm services (0.9%), fuel (1%), farm feeds (0.8%) and fertilisers (0.3%), resulting in a modest increase of 1.7% in real intermediate input expenditure in 2013. Real intermediate input expenditure is expected to grow by 2% during 2014, mainly driven by the exchange rate depreciation which will raise the cost of most inputs. During the baseline period, average annual growth of 2.5% is projected, fl owing from the projected rise in animal production, petrol prices and the depreciation of the exchange rate.
Real gross value added in the agricultural sectorThe real gross value added of the agricultural sector is the contribution of the sector to the economy (GDP), which is calculated as the difference between the gross income of the agricultural sector (including the value of own construction and change in livestock inventory) and intermediate input expenditure. Having increased by 3.3% in 2012, real gross value added of the agricultural sector accelerated by 5%

15
BFAP BASELINE • Agricultural Outlook 2014 -2023
Figure 1.6: Real gross value added of the agricultural sector
during 2013, driven by substantial growth in gross income of the agricultural sector, which offsets the moderate growth of real intermediate input expenditure. The projected higher growth of the gross income in 2014 that offsets a moderate growth of intermediate input expenditure is expected to prompt a 6.9% growth of the real value added of the agricultural sector. During the baseline period the real gross value added of the sector is projected to grow by an average annual growth rate of 2.2%, driven mainly by the growth in the gross income of animal products and horticulture.
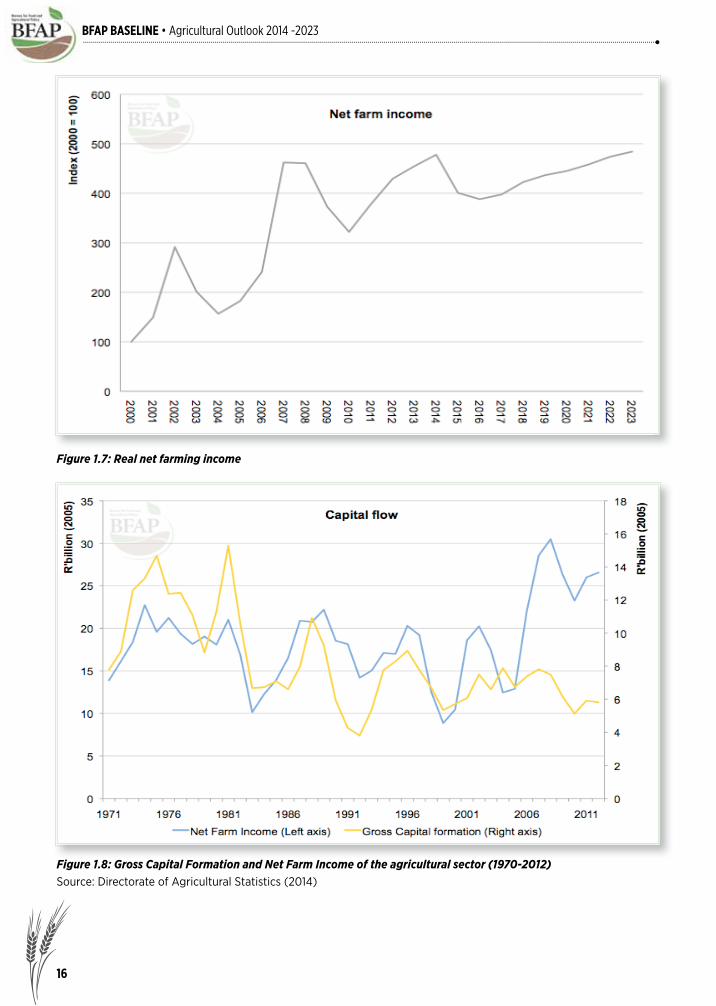
Net farm income, gross capital formation and the value of farm assetsNet farming income of the agricultural sector shows the producer’s income, following payment of all intermediate inputs, rent, interest, labour remuneration and an allowance for depreciation. Following growth of 21% registered in 2012, the nominal net farming income growth moderated to 13.7% in 2013 as a result of higher expenditure on
labour remuneration and rent paid which increased by 4.4% and 5.2%, respectively, in 2012 and accelerated by 5.9% and 5.8%, respectively in 2013. The increase in interest payments, however, remained the same as the previous year (8.8%). In real terms, net farming income increased by 6% during 2013. The projected higher growth rate for gross income is also expected to propel the real net farming income by 6.4% in 2014. After showing a contraction for the next two years due to lower commodity prices, the growth rate of real net farming income is projected to recover and show a 2.4% growth over the rest of the baseline period. Research on the nature of agricultural capital fl ows is very limited, but preliminary results present an interesting picture. Figure 1.8 shows the gross capital formation (GCF) and net farm income (NFI) of the agricultural sector for the period 1970 to 2012 in 2005 Rand values. An evaluation of gross capital formation reveals that it showed a moderately declining trend from the mid-1970s to late 1990s, followed by a minor increasing trend thereafter.
16
BFAP BASELINE • Agricultural Outlook 2014 -2023
Figure 1.7: Real net farming income
Figure 1.8: Gross Capital Formation and Net Farm Income of the agricultural sector (1970-2012)Source: Directorate of Agricultural Statistics (2014)

17
BFAP BASELINE • Agricultural Outlook 2014 -2023
Figure 1.9: Real agricultural debt
During these same periods net farm income showed a similar trend of decline towards the late 1990s and increase thereafter, but at a much greater rate in comparison to GCF. This increase in NFI until 2012, though signifi cant, was still 19% lower than the peak level achieved in 1974. The turning point between these periods of convergence and divergence coincides with the completion of the deregulation of agricultural marketing and thus the removal of indirect subsidies in 1999. This was supported by the liberalization of agricultural trade during the early 1990s, the removal of sanctions, various exchange shocks and other factors. Broadly speaking this trend is indicative, however, of an increase in capital effi ciency, given the great increase in NFI, minor increase in GCF and removal of subsidies. The sustainability of this trend should be called into question, however. It is possible that slow growth in GCF is due to producers opting to invest their profi ts outside of the sector. This could erode the capacity to sustain and expand the current increase in net farm income over the long term.
Real agricultural debtThe Land Bank and commercial banks held 30% and 55.7% of total agricultural debt respectively in 2013. Debt within the sector, from both banks combined, grew by 18% during 2013. As a result, the nominal debt of the agricultural sector increased by 15.5% following a 12% increase in 2012. The interest rate charged by the Land Bank and the commercial banks declined from 8.16% and 8.91%, respectively in 2012 to 8.13% and 8.41% in 2013. During 2013, the debt burden (which is the percentage of the total debt to the total asset value) further accelerated from 33.8% in 2012 to 36% as a result of a signifi cant growth in the value of debt (18% higher in 2013, relative to 2012) compared to the sector’s asset values (7% higher in 2013, relative to 2012). A moderate average annual growth rate projected for the net farming income and gross capital formation during the baseline is expected to escalate the debt burden to reach 38.9% in 2023.
AGRICULTURAL TRADE IN CONTEXT Trade AgreementsFollowing the establishment of the World Trade

18
BFAP BASELINE • Agricultural Outlook 2014 -2023
Organisation (WTO) in 1995, South Africa has implemented a number of trade agreements. The implementation of the fi rst trade agreement with the then 15 members of the European Union (EU) started in 2000 and the agreement extends to others as the EU membership, which currently consists of 28 countries, increases. The trade arrangement known as the Trade, Development and Cooperation Agreement (TDCA) was implemented over twelve years, covering more than 90% of agricultural and non-agricultural products. The remaining 10% included sensitive sectors, which were mainly agricultural products from the EU, while South Africa opted to leave out motor vehicles, clothing and textiles as sensitive products. The EU eventually liberalised only 61% of agricultural products while South Africa liberalised 81%. This asymmetric liberalisation allowed the EU to maintain tariffs on more products beyond the twelve year implementation period. The products excluded from free trade by the EU include beef, sugar, maize, cut fl owers, fruit and fruit juices. In the same year that South Africa implemented the TDCA, the Southern African Development Community (SADC) trade protocol was implemented by 12 out of 15 SADC members. In 2008, the SADC free trade area (FTA) was launched, allowing up to 85% of trade within the SADC region to take place free of customs duties. Implementation of the SADC FTA is not yet complete as Malawi, Mozambique, Tanzania and Zimbabwe have requested an extension on their original implementation period. Sugar is the only agricultural product that is currently classifi ed as sensitive and is thus excluded from free trade by several countries (SACU, Malawi and Mozambique). In 2008, South Africa concluded a FTA with the European Free Trade Association (EFTA), consisting of Iceland, Liechtenstein, Norway and Switzerland. South Africa completed the FTA as part of the Southern African Customs Union (SACU) consisting of Botswana, Lesotho, Namibia, South Africa and Swaziland; however SACU signed an agricultural agreement with individual member states, and not with EFTA as a group. As a result of this concession, the rules of origin have been tightened in such a way that any product originating from within SACU does not move freely within the EFTA territory.
Currently, South Africa is in the process of establishing the tripartite-FTA (TFTA) through SADC, the East African Community (EAC) and the Common Markets of East and Southern Africa (COMESA). If the TFTA is established, it will be the largest on the continent, consisting of 26 countries with an estimated population of 600 million and combined gross domestic product (GDP) of about US$ 1 trillion (2012 estimates). This also forms part of the great African market which is considered by global suppliers as being an attractive, growing and unfulfi lled potential. In addition to the various FTA’s, South Africa is also a member of a group consisting of Brazil, Russia, India and China (BRICS). Considering economic growth through the past decade, BRICS represents one of the largest and fastest growing country groups within the developing regions. In contrast to the TDCA, SACU-EFTA and SADC FTA, BRICS has no existing trade agreement that has been notifi ed to the WTO; however considering the attractiveness of the BRIC markets, which account for 40% of global population and combined GDP of $15 trillion (2012 estimate) that has been growing at an annual average of 6.7% between 2000 and 2012, a WTO compliant trade arrangement is foreseeable.
Trade performanceFigure 1.10 illustrates the value of South African agricultural exports to selected regions since 2001. The total value of agricultural exports in 2013 was approximately R97 billion. Africa accounted for nearly half of all these exports with an amount of R43 billion. This was contributed mostly by intra SACU trade, which was not fully reported in previous years1. More complete reporting of intra SACU trade resulted in a 146% increase in trade with the rest of Africa and hence Africa (mainly SADC) represents the leading export destination for South African agricultural exports. The value of agricultural exports destined for the EU was R24 billion in 2013, representing the second largest market, following Africa. BRIC, Asia, America and Oceania contributed around R5 billion each. The BRIC market has been rising steadily following the recession, while America declined marginally from 2012 to 2013.
1 Prior to 2013, South Africa was not reporting its trade with SACU partners. However those SACU countries which reported, always reported their trade with South Africa. Researchers and other users of trade data relied heavily on data reported by industry as-sociations and other private groups that shared such information. However, the 2013 trade data reported by international trade databases and United Nations institutions such as the COMTRADE and the International Trade Centre (ITC) have shown that South Africa has reported trade with its trade partners at each and every product level.

19
BFAP BASELINE • Agricultural Outlook 2014 -2023
Figure 1.10: South African Agricultural Exports by region Source: Compiled from ITC’s Trade Map
Figure 1.11: South African Agricultural Imports by region Source: Compiled from ITC’s Trade Map

20
BFAP BASELINE • Agricultural Outlook 2014 -2023
Considering the trade balance, South Africa had a surplus in the agricultural sector of about R25 billion in 2013. All of it is attributed to trade with the EU and Africa, as illustrated by Figure 1.12. Trade with all other regions refl ected a defi cit in 2013. The largest defi cits were recorded with BRIC and America’s trade. The defi cit with Asia is showing signs of recovery from 2012. The surplus with the EU and Africa is substantial and hence it overshadowed the defi cits of the fi ve other partners combined.
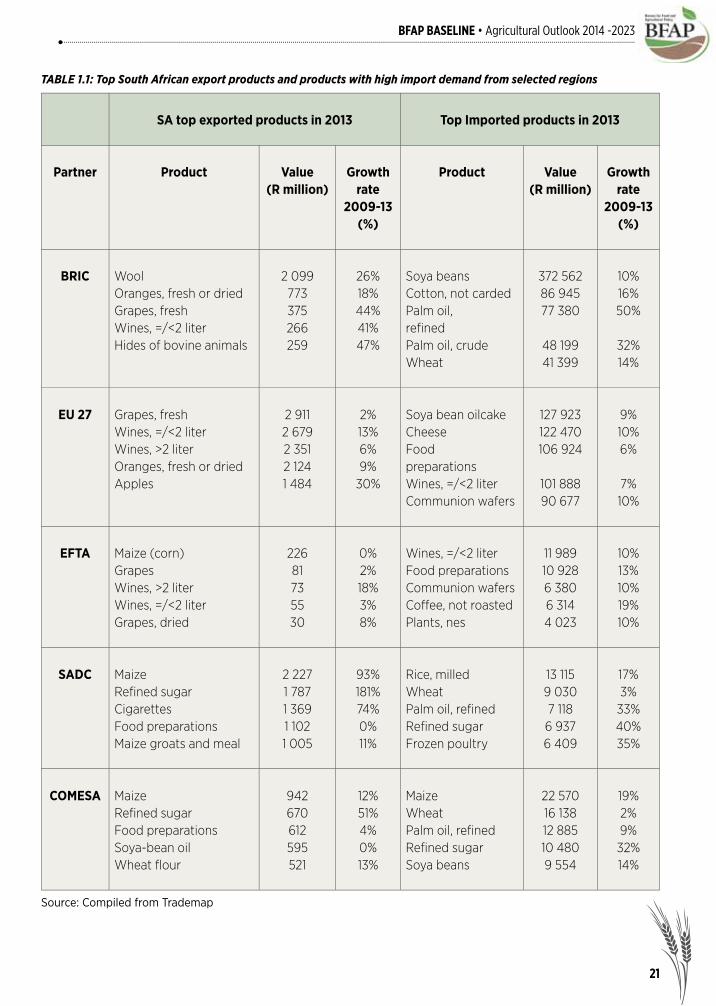
Product performance with selected partnersTable 1.1 indicates South Africa’s top fi ve agricultural products, as exported to selected partner groups, as well as the most popular imported products by those partners, ranked by value of 2013 trade. The purpose is to evaluate whether South Africa typically exports products for which import demand within these regions is high. The table further indicates the average annual growth rate for the fi ve year period post-recession, 2009 – 2013.
Few matches between South Africa’s export supply and trade partners’ import demand were found in non-African partner regions. The top imported products by the BRIC group are soya beans, cotton, palm oil and wheat, while South Africa’s top exports consists of animal fats, oranges, grapes, wines and hides. The average growth rates of these top imported products between 2009 and 2013 ranged between 10% and 50% per annum. The fastest growing exports to the BRIC group consisted of fresh grapes, wines and hides, all with an average of more than 40% per annum in the same period. The same mix of fruits and wines is also exported to the EU, which demands mostly soya-bean oilcake, cheese, food preparations and communion wafers. Post-recession import demand however grew at less than 10% per annum in the EU, which is relatively slow compared to the BRIC import demand growth during the same period. South African export growth of the top fi ve products destined for the EU was also relatively slow, except for apples, which expanded at
Figure 1.12: South African agricultural trade balance by region Source: Compiled from ITC’s Trade Map
21
BFAP BASELINE • Agricultural Outlook 2014 -2023
TABLE 1.1: Top South African export products and products with high import demand from selected regions
Source: Compiled from Trademap
SA top exported products in 2013 Top Imported products in 2013
Partner Product Value (R million)
Growth rate
2009-13 (%)
Product Value(R million)
Growth rate
2009-13 (%)
BRIC WoolOranges, fresh or driedGrapes, freshWines, =/<2 liter Hides of bovine animals
2 099773375266259
26%18%44%41%47%
Soya beansCotton, not cardedPalm oil, refi nedPalm oil, crudeWheat
372 56286 94577 380
48 19941 399
10%16%50%
32%14%
EU 27 Grapes, freshWines, =/<2 liter Wines, >2 literOranges, fresh or driedApples
2 9112 6792 3512 1241 484
2%13%6%9%
30%
Soya bean oilcakeCheeseFood preparationsWines, =/<2 liter Communion wafers
127 923122 470106 924
101 88890 677
9%10%6%
7%10%
EFTA Maize (corn)GrapesWines, >2 literWines, =/<2 liter Grapes, dried
22681735530
0%2%18%3%8%
Wines, =/<2 liter Food preparationsCommunion wafersCoffee, not roastedPlants, nes
11 98910 9286 3806 3144 023
10%13%10%19%10%
SADC MaizeRefi ned sugarCigarettesFood preparationsMaize groats and meal
2 2271 7871 3691 1021 005
93%181%74%0%11%
Rice, milledWheat Palm oil, refi nedRefi ned sugarFrozen poultry
13 1159 0307 1186 9376 409
17%3%
33%40%35%
COMESA Maize Refi ned sugarFood preparationsSoya-bean oil Wheat fl our
942670612595521
12%51%4%0%13%
Maize Wheat Palm oil, refi nedRefi ned sugarSoya beans
22 57016 13812 88510 4809 554
19%2%9%32%14%

22
BFAP BASELINE • Agricultural Outlook 2014 -2023
a rate of 30% per annum. Only one product matched both import demand and export supply to the EU, namely wines which are exported in two litres or less. The same match of wines is found in exports to the EFTA group, which exhibits similar import demand as the EU, the only difference being that EFTA import demand includes coffee and plants as opposed to the EU’s soya-bean oil cake and cheese. South African exports to the EFTA group are also similar to that destined for the EU, with the addition of maize instead of apples. While stronger than the EU, growth rates in both exports and imports of products traded with EFTA remains weak relative to the BRIC group, with no product exceeding annual growth of 20%. In the two African regions, there was one product match with SADC and two with COMESA. Both SADC and COMESA showed signifi cant growth in import demand for refi ned sugar, a product exported by South Africa, while COMESA also imports a substantial amount of maize. South Africa fulfi ls only 4% of COMESA’s demand for maize however, as the leading maize importers in COMESA are North African countries like Egypt and Libya, which are supplied by Ukraine, Russia, Argentina and Brazil. The growth rates of products demanded by COMESA and SADC, and supplied by South Africa are relatively strong; refi ned sugar exports increased by 181% and 51% to SADC and COMESA, respectively, while total import demand for refi ned sugar increased by 40% and 32% respectively. Maize trade on the other hand fl uctuates depending on whether the regions had a surplus or defi cit of the staple food crop. Sugar trade between South Africa and the regional partners also presents an interesting case. The leading import product by South Africa from SADC and COMESA is raw cane sugar, which represents the main input to the refi ned sugar exported into these regions. This may point to milling capacity shortages within SADC and COMESA. High domestic prices for refi ned sugar in South Africa also results in refi ned sugar being imported from Brazil into South Africa. South Africa increased sugar tariffs from $358/ton to $754/ton in 2014, which is likely to negatively affect imports into South Africa. The overall implication is that there is an absence of South African products amongst the top imported products by the selected trading partners. This
is particularly clear in non-African regions. South Africa has preferential market access in the form of FTAs in three of these markets, and therefore one would expect higher trade fl ows within these regions. While the absence of matching products in the BRIC may be explained by the fact that BRIC is a diverse group, in terms of geography, language, culture and preferences, the main reason for South Africa’s absence in the top imported products in 2013 remains supply capacity. South African production of products such as palm oil, wheat, soya beans, cotton, rice and coffee remains limited.
CONCLUSIONSIn 2013 the substantial change in South African agricultural trade was a result of improved reporting of trade within SACU, which was previously not offi cially reported in full. Improved reporting led to Africa accounting for half of total South African exports, while it has also substantially increased the trade balance from almost zero, to R25 billion for the year. South Africa concluded a number of FTAs to provide South African producers with an opportunity to supply developed and developing markets. Within the developed markets, only one product (wines, exported in two litres or less) from the fi ve most important products exported by South Africa matched products characterised by high import demand in partner regions. African partners showed strong import demand for maize and refi ned sugar, both products exported in high volumes from South Africa. South Africa exports refi ned sugar to the same regions where raw sugar imports originate from, indicative of milling capacity limitations within these African partner regions. South African sugar imports from Brazil however may be negatively affected by newly increased sugar tariffs. Overall, there is clear evidence that South Africa’s production capacity is limited in products that are in high demand by trading partners. Highly imported products by the partners offer South African producers market opportunities in food preparations (EFTA and EU), frozen poultry, maize and refi ned sugar (SADC and COMESA). Other products imported in high volumes, characterised by high growth rates such as in BRIC, offer limited opportunities due to lack of supply by South Africa.

23
BFAP BASELINE • Agricultural Outlook 2014 -2023
PoliciesThe baseline assumes that current international as well as domestic agricultural policies will be maintained. In a global setting, this assumes that all countries adhere to their bilateral and multilateral trade obligations, including their WTO commitments. On the domestic front, current policies are maintained. With the deregulation of agricultural markets in the mid-nineties, many non-tariff trade barriers and some direct trade subsidies to agriculture were replaced by tariff barriers. In the case of maize and wheat, variable import tariffs were introduced. The variable import tariff for wheat was replaced by a 2% ad valorem tariff in 2006. However, in December 2008 the original variable import levy system was re-introduced, and the reference price that triggers the variable import levy on wheat was adjusted upwards from $157/ton to $215/ton. Following the sharp increase in world price levels in 2012, the industry submitted a request for a further increase in the reference price, which was accepted in 2013, increasing the reference price to $294/ton.
KEY BASELINE ASSUMPTIONS
Although global maize prices have traded signifi cantly higher than the reference price in recent years, international prices are expected to fall below the reference price in 2015 and 2016, resulting in a small tariff, which returns to zero from 2017 onwards as prices recover. An import duty on wheat is also triggered in 2016 as international prices are expected to decline below the reference price of $294/ton. Ad valorem tariffs are applied in the case of oilseeds. In the case of meat and dairy products, a combination of fi xed rate tariffs and/or ad valorem tariffs is implemented. Tariffs on imported chicken were increased substantially in October 2013, however a signifi cant share of total imports originate from the European Union and therefore carry no duty under the TDCA. The projected tariff levels, as derived from the FAPRI projections of world commodity prices, are presented in Table 2.1.
2013 2014 2015 2016 2017 2018 2019 2020 2021 2022 2023
R/ton
Maize tariff: (Ref price = US$ 110)
0 0 54 46 0 0 0 0 0 0 0
Wheat tariff:(Ref price = US$ 294)
0 0 0 465 343 316 298 329 370 382 402
Sunfl ower seed tariff: 9.4% of fob
470 438 400 407 417 439 453 463 473 484 494
Sunfl ower cake tariff: 6.6% of fob
181 162 144 147 153 160 164 169 173 177 181
Sorghum tariff: 3% of fob
77 69 64 66 68 72 75 75 77 79 81
Soya bean tariff: 8% of fob
390 392 340 351 360 380 394 404 414 424 434
Soya bean cake tariff: 6.6% of fob
297 331 293 295 309 325 336 350 360 370 379
Table 2.1: Key policy assumptions

24
2013 2014 2015 2016 2017 2018 2019 2020 2021 2022 2023
Tons
Cheese, TRQ quantity 1199 1199 1199 1199 1199 1199 1199 1199 1199 1199 1199
Butter, TRQ quantity 1167 1167 1167 1167 1167 1167 1167 1167 1167 1167 1167
SMP, TRQ quantity 4470 4470 4470 4470 4470 4470 4470 4470 4470 4470 4470
WMP, TRQ quantity 213 213 213 213 213 213 213 213 213 213 213
Percentage
Cheese, in-TRQ 19.0 19.0 19.0 19.0 19.0 19.0 19.0 19.0 19.0 19.0 19.0
Butter, in-TRQ 15.8 15.8 15.8 15.8 15.8 15.8 15.8 15.8 15.8 15.8 15.8
SMP, in-TRQ 19.2 19.2 19.2 19.2 19.2 19.2 19.2 19.2 19.2 19.2 19.2
WMP, in-TRQ 19.2 19.2 19.2 19.2 19.2 19.2 19.2 19.2 19.2 19.2 19.2
c/kg
Cheese, above TRQ rate 500 500 500 500 500 500 500 500 500 500 500
Butter, above TRQ rate 500 500 500 500 500 500 500 500 500 500 500
SMP, above TRQ rate 450 450 450 450 450 450 450 450 450 450 450
WMP, above TRQ rate 450 450 450 450 450 450 450 450 450 450 450
Beef tariff: max (40%*fob,240c/kg)
1042 1393 1393 1383 1387 1413 1419 1448 1512 1584 1660
Lamb tariff: max (40%* fob,200c/kg)
1399 1766 1711 1744 1805 1862 1898 1976 2061 2174 2255
Chicken tariff:(Whole frozen): 82%
228 828 804 828 860 914 949 987 1025 1064 1103
Chicken Tariff (Carcass): 31%
104 120 120 120 120 120 120 120 120 120 120
Chicken Tariff:(Boneless Cuts): 12%
104 299 291 299 311 330 343 357 370 385 399
Chicken Tariff (Offal): 30%
152 202 196 202 210 222 231 240 250 259 269
Chicken Tariff:(Bone in portions): 37%
221 583 567 583 606 644 669 696 722 750 777
Pork tariff: max (15%* fob, 130c/kg)
196 275 249 242 239 261 287 305 305 305 314
Table 2.1: Key policy assumptions (continued)

BFAP BASELINE • Agricultural Outlook 2014 -2023
25
Macroeconomic assumptionsThe baseline simulations are largely driven by the outlook for a number of key macroeconomic indicators. Projections for these indicators are
mostly but not exclusively based on information provided by the OECD, the IMF and Global Insight.
2013 2014 2015 2016 2017 2018 2019 2020 2021 2022 2023
Millions
Total population of SA
51.1 51.4 51.7 52.0 52.3 52.6 53.0 53.3 53.6 53.9 54.2
US $/barrel
U.S. refi ners acquisition oil
104.0 104.6 104.0 105.4 108.2 111.1 113.8 116.6 119.5 122.2 125.0
SA cents/Foreign currency
Exchange rate (SA cents/US$)
937 1061 1030 1065 1098 1154 1188 1223 1258 1294 1332
Exchange rate (SA cents/Euro)
1229 1469 1411 1453 1491 1559 1597 1636 1673 1713 1754
Percentage change
Real GDP per capita
2.50 2.64 3.17 3.75 3.83 3.66 3.57 3.51 3.49 3.56 3.57
GDP defl ator 5.76 5.95 5.79 5.58 5.73 5.53 5.35 5.54 5.62 5.63 5.61
Percentage
Weighted prime interest rate
8.50 8.56 8.63 8.69 8.75 8.82 8.88 8.94 9.01 9.07 9.13
Table 2.2: Key macro-economic assumptions

26
S u m m e r g ra i n s
South African outlook
GLOBAL MAIZE SITUATION AND TRENDS
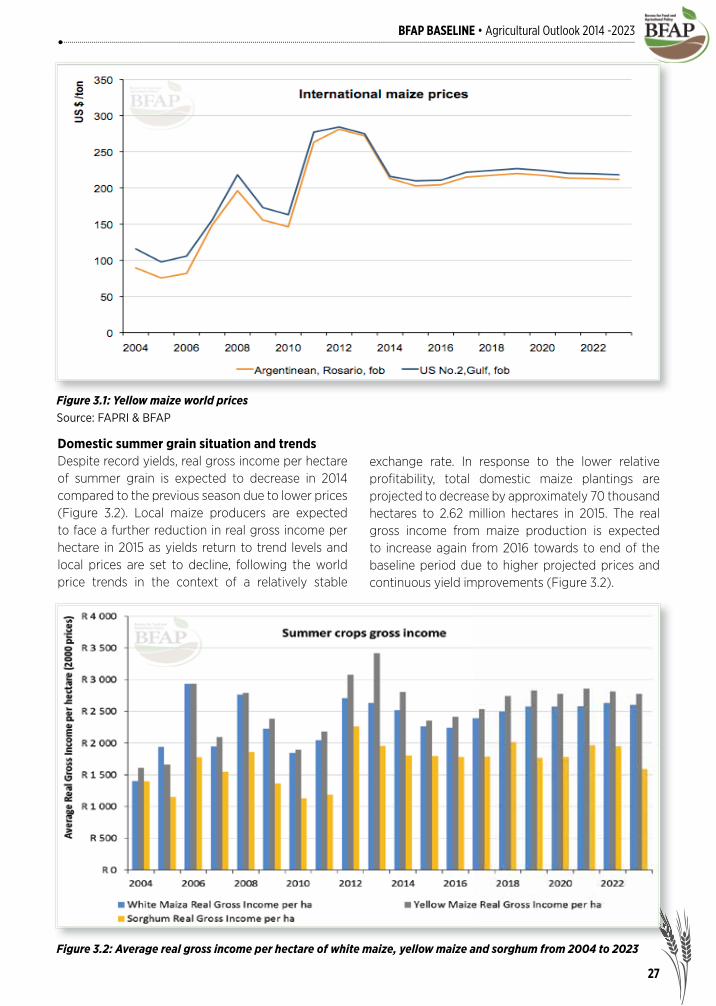
WORLD MAIZE PRODUCTION REACHED new record levels in 2013/14 as favourable growing conditions resulted in record crops in the US and other maize producing countries in the Northern hemisphere. Following the record production and rising stock levels, international maize prices plummeted by more than 30% in the second half of 2013 (Figure 3.1). World maize prices are expected
Following the record production and rising stock levels, international maize prices plummeted by more than 30% in the second half of 2013. World maize prices are expected to continue trading lower in 2015 and 2016 as production continues to expand.
to continue trading lower in 2015 and 2016 as production continues to expand. World demand is likely to catch up with production over the medium term which will lend support to international prices. From 2020 towards the end of the baseline period international prices are projected to decline slightly again as the growth in world production is expected to outpace the growth in demand.
27
BFAP BASELINE • Agricultural Outlook 2014 -2023
Domestic summer grain situation and trendsDespite record yields, real gross income per hectare of summer grain is expected to decrease in 2014 compared to the previous season due to lower prices (Figure 3.2). Local maize producers are expected to face a further reduction in real gross income per hectare in 2015 as yields return to trend levels and local prices are set to decline, following the world price trends in the context of a relatively stable
Figure 3.1: Yellow maize world pricesSource: FAPRI & BFAP
Figure 3.2: Average real gross income per hectare of white maize, yellow maize and sorghum from 2004 to 2023
exchange rate. In response to the lower relative profi tability, total domestic maize plantings are projected to decrease by approximately 70 thousand hectares to 2.62 million hectares in 2015. The real gross income from maize production is expected to increase again from 2016 towards to end of the baseline period due to higher projected prices and continuous yield improvements (Figure 3.2).
BFAP BASELINE • Agricultural Outlook 2014 -2023
28
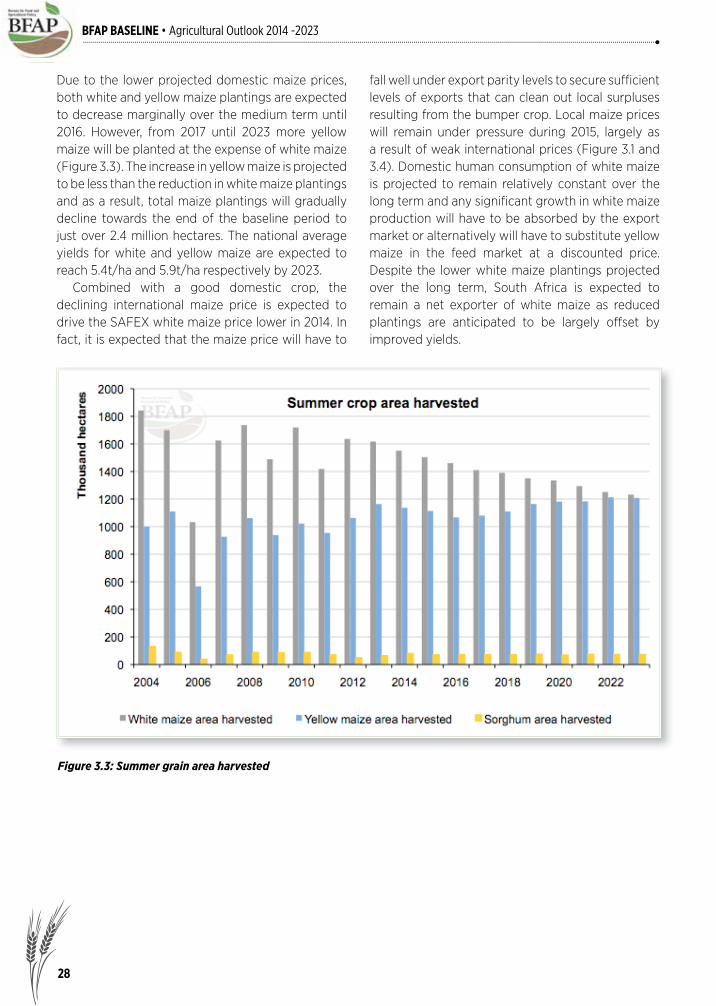
Due to the lower projected domestic maize prices, both white and yellow maize plantings are expected to decrease marginally over the medium term until 2016. However, from 2017 until 2023 more yellow maize will be planted at the expense of white maize (Figure 3.3). The increase in yellow maize is projected to be less than the reduction in white maize plantings and as a result, total maize plantings will gradually decline towards the end of the baseline period to just over 2.4 million hectares. The national average yields for white and yellow maize are expected to reach 5.4t/ha and 5.9t/ha respectively by 2023. Combined with a good domestic crop, the declining international maize price is expected to drive the SAFEX white maize price lower in 2014. In fact, it is expected that the maize price will have to
fall well under export parity levels to secure suffi cient levels of exports that can clean out local surpluses resulting from the bumper crop. Local maize prices will remain under pressure during 2015, largely as a result of weak international prices (Figure 3.1 and 3.4). Domestic human consumption of white maize is projected to remain relatively constant over the long term and any signifi cant growth in white maize production will have to be absorbed by the export market or alternatively will have to substitute yellow maize in the feed market at a discounted price. Despite the lower white maize plantings projected over the long term, South Africa is expected to remain a net exporter of white maize as reduced plantings are anticipated to be largely offset by improved yields.
Figure 3.3: Summer grain area harvested

29
BFAP BASELINE • Agricultural Outlook 2014 -2023
Figure 3.4: White maize production, domestic use, net trade and prices
Figure 3.5: Total maize domestic consumption

30
BFAP BASELINE • Agricultural Outlook 2014 -2023
In line with the white maize price, the SAFEX yellow maize price is projected to decrease during 2014 and 2015, following weaker international prices (Figure 3.6). Yellow maize production will decline marginally in 2015 as the area under production shrinks, yet over the long run the area is expected to expand, reaching a level of 1.2 million hectares by 2023. Strong growth is projected for maize feed demand over the baseline period which will provide support to the local yellow maize price over the long term (Figure 3.6). Feed demand increased by 42% over the past decade and it is expected to increase by a further 39%, which implies that by 2023 more than 7 million tons of maize will be fed to animals compared to human consumption of around 4.7 million tons.
Domestic sorghum situation and trendsOver the past few years South Africa has moved from being a net exporter of sorghum to being a net importer. The area under sorghum production has declined as profi t margins of maize have been
Figure 3.6: Yellow maize production, domestic use, net trade and prices
outperforming the profi t margins on sorghum due to the rapid rise in maize yields and genetic modifi cation applications that is available in maize and not in sorghum. Disappointing yields in 2013 due to the drought resulted in strong local sorghum prices and producers responded by increasing sorghum are planted to 79 thousand hectares, an increase of 25% relative to the 63 thousand hectares planted in 2013. The higher plantings and the return of normal yields in 2014 will result in a surplus supply of sorghum in 2014, causing a decline in the local sorghum price (Figure 3.8) and therefore a reduction in hectares planted in 2015. Over the long run sorghum plantings will fl uctuate around 70 thousand hectares, which implies that at trend yields, the local market will be fi nely balanced with just enough sorghum produced for local consumption. This will make the future price of sorghum very volatile. The bottom line remains however that sorghum prices will have to trade at a premium above maize prices to attract more hectares.

31
BFAP BASELINE • Agricultural Outlook 2014 -2023
Box 3.1: Climate Change Adaptation: Perspectives on Food Security in South Africa
BFAP was commissioned to do a study on “Climate Change Adaptation: Perspectives on Food Security in South Africa” that forms part of the larger “Long-Term Adaptation Scenarios Flagship Research Programme (LTAS) for South Africa” project led by the Department of Environmental affairs and supported by the South African Biodiversity Institute (SANBI) in 2014. This study evaluated the impact of four possible climate scenarios on the South African maize and wheat industry for the period 2014 to 2030 in order to deliver high level policy messages on possible food security and employment impacts. The four climate scenarios tested were identifi ed in previous phases of the larger LTAS study (DEA, 2013) and are divided according to the extent of temperature and rainfall changes. The “warmer” scenarios assume a long term increase in temperature of less than 3°C above the 1961–2000 average, and are subdivided into wetter or drier scenarios depending on an increase or decrease in mean annual precipitation (MAP) at a national level. The hotter scenarios assume a long term increase in temperature of more than 3°C above the 1961–2000 average, and are also subdivided into wetter or drier scenarios. The results of the study will be published by the Department of Environmental Affairs (DEA, 2014) later this year.
Figure 3.7: Sorghum production, domestic use, net trade and prices

32
BFAP BASELINE • Agricultural Outlook 2014 -2023
Box 3.2: Sorghum for Bio-ethanol use
According to the Draft Position Paper published by government in January 2014, sorghum is regarded as the reference crop for the production of bioethanol. Two ethanol plants are currently planned that will use sorghum as feedstock for the production of bio-ethanol; one in Bothaville and one in Cradock. At a blending rate of 2%, more than 600 thousand tons of sorghum will be required, which is about three times as much as what is currently produced. BFAP illustrated the potential impact on the industry if sorghum is used as feedstock for the production of bioethanol. Two scenarios where analysed; one where sorghum yields continue along the same trends as the past and a second scenario where yields increase signifi cantly faster.
Figure 3.8: Sorghum gross returns
Key observations: Under the E2 scenario sorghum prices jump back to import parity levels and similar to the current production season, the area under sorghum production will expand. Yet the expansion will not be suffi cient to meet the local demand for sorghum for the production of bio-ethanol. Figure 3.8 clearly illustrates that although the gross returns for sorghum improve signifi cantly under the E2 scenario, they do not reach the gross return levels projected for maize. This phenomenon is also evident from historic numbers where sorghum returns did increase rapidly in 2011 and 2012 when

33
BFAP BASELINE • Agricultural Outlook 2014 -2023
ReferencesDEA, 2014. Climate Change Adaptation: Perspectives on Food Security in South Africa. Pretoria, South Africa.DEA, 2013. Long-Term Adaptation Scenarios Flagship Research Programme (LTAS) for South Africa. Climate Change Trends and Scenarios for South Africa. Pretoria, South Africa.
the industry switched to import parity levels, yet the returns were still below the actual returns that materialized for maize farmers. Under the E2-yield growth scenario, a shock is introduced on the yield growth path and compared to the projected national average yield of 3.29t/ha by 2013 under the baseline and E2 scenario; the national average sorghum yield is boosted to reach 4.23t/ha by 2023. Under this assumption, Figure 3.8 suggests that sorghum returns will be more in line with the returns achieved for maize and the area under sorghum will expand suffi ciently so that by 2023, a surplus of sorghum will be produced. At that stage, the model projects that sorghum prices will break away from import parity levels and drop sharply. On the back of lower prices, the area under production will contract and prices will increase again. This typical market volatility is illustrated in the outlying years in Figure 3.8.
34
BFAP BASELINE • Agricultural Outlook 2014 -2023
W i n t e r g ra i n s
South African outlook
THE 2013 WORLD WHEAT crop exceeded expectations and resulted in a 10% increase in stocks at the end of the 2013/14 marketing season. Despite the good crop and rising stock levels, the price of US Hard Red Winter wheat declined by only 3% on average in 2013/14 as there was a strong demand for good quality wheat on the world market. World wheat production is projected to decrease slightly in 2014 as yields return to trend levels following the previous season’s highs. With ample wheat stocks available and growth in production projected to outperform the growth in demand should normal weather prevail, world wheat prices are projected to come under pressure over the medium term. Prices will increase again from 2017, before moving largely sideways towards the end of the baseline period (Figure 4.1).
Despite the good crop and rising stock levels, the price of US Hard Red Winter wheat declined by only 3% on average in 2013/14 as there was a strong demand for good quality wheat on the world market.
A strong growth in demand for beer, especially in some Far Eastern and South America countries resulted in fi rm global demand for malting barley, while supplies were constrained prior to 2012. This situation pushed prices to record levels on the world market in 2012. The high prices for malting barley encouraged larger plantings, and together with favourable growing conditions, world production has exceeded demand since 2013. Consequently, the international prices for malting barley declined signifi cantly and are projected to continue their downward trend until 2016, and then to move in unison with international wheat prices for the remainder of the baseline period (Figure 4.1).

35
BFAP BASELINE • Agricultural Outlook 2014 -2023
Figure 4.1: World winter grain prices
Source: FAPRI & BFAP
Figure 4.2: Average real gross income per hectare of wheat and barley in the winter rainfall areas from 2004 to
2023
Figure 4.1: World winter grain prices
Domestic winter grain situation and trendsDry land wheat producers in the summer rainfall area decreased wheat plantings in 2013 due to low moisture levels and improved profi t margins for soya beans and maize. The higher SAFEX wheat price in 2013 offset the effect of slightly lower average yields in the winter rainfall area during the 2013 season and resulted in an average gross income per hectare in real terms comparable to 2012 (Figure 4.2). The stable average real gross income per hectare of
wheat production in the winter rainfall area over the past two seasons is expected to boost wheat plantings in this area in 2014 (Figure 4.2). However, the increase in wheat plantings in the winter rainfall area will not be suffi cient to make up for the decrease in wheat plantings in the summer rainfall area and the total local wheat acreage is projected to decline marginally during 2014.

36
BFAP BASELINE • Agricultural Outlook 2014 -2023
Over the longer term, wheat producers in especially the western part of the winter rainfall area are projected to progressively incorporate other crops such as canola, in what is considered to be a more sustainable crop rotation system. Wheat plantings in the winter rainfall area are projected to consolidate just below 250 thousand hectares by the end of the baseline period (Figure 4.3). The wheat area planted in the summer rainfall region under dryland conditions has been declining and will continue to decline further as wheat is regarded as a risky crop and with new varieties of soya beans performing well in trials, more areas are shifting from wheat to summer crops like soya beans and maize. The wheat area under irrigation is set to remain relatively stable with most of the hectares being planted in a double cropping system. The average SAFEX wheat price is projected
to increase during 2014 compared to the previous season, as the depreciation of the exchange rate offsets the effects of the lower international price. A lower local wheat price is projected for 2015 due to the projected drop in the international wheat price, after which it will rise again towards the end of the baseline period on the back of further depreciation of the exchange rate. Local wheat consumption is expected to dip in 2014 because of the higher projected prices and the weak economic conditions before it will increase again in 2015 towards the end of the baseline period (Figure 4.4). However, due to the projected decline in local wheat plantings in the long term, South Africa will increasingly rely on imports to supply in the growing local demand. Already in 2015, South Africa may import more wheat than is locally produced to supplement the production shortfall.
Figure 4.3: Winter grain area harvested

37
BFAP BASELINE • Agricultural Outlook 2014 -2023
Domestic barley situation and trendsBarley producers experienced a slightly higher average gross income per hectare in real terms because of higher prices during 2013, despite marginally lower average yields during the past season. Should favourable weather conditions prevail during 2014, the higher prices are projected to cause a small increase in barley plantings and production. The prospects of an increase in the inland malting
Figure 4.4: Wheat production, consumption, trade and price
Figure 4.5: Barley production, consumption, trade and producer price
capacity as well as the introduction of new barley varieties which comply with the required quality specifi cations and improved yield potential will lead to a gradual increase in local production in the inland irrigation area. It is projected that the increase in production will come close to meeting the growth in local demand and only small quantities of imports will be required by the end of the baseline period (Figure 4.5).
38
BFAP BASELINE • Agricultural Outlook 2014 -2023
O i l s e e d s a n d Oilseed products
South African outlookA substantial increase in area planted to oilseeds as well as good yields in several countries contributed to a signifi cant increase in world oilseed production during 2013/14.
GLOBAL OILSEED SITUATION AND TRENDS
A SUBSTANTIAL INCREASE IN area planted to oilseeds as well as good yields in several countries contributed to a signifi cant increase in world oilseed production during 2013/14. Most of the production increase is attributed to an increase in soya bean production but notable bigger crops were also achieved in sunfl ower seed and canola. Despite
strong demand, fundamentals remain bearish on the world market. International prices are projected to decrease until 2016 after which they will consolidate and trade sideways towards 2023 under the assumption of normal weather conditions (Figure 5.1).

39
BFAP BASELINE • Agricultural Outlook 2014 -2023
Figure 5.1: World Oilseed Prices
Source: FAPRI & International Grains Council
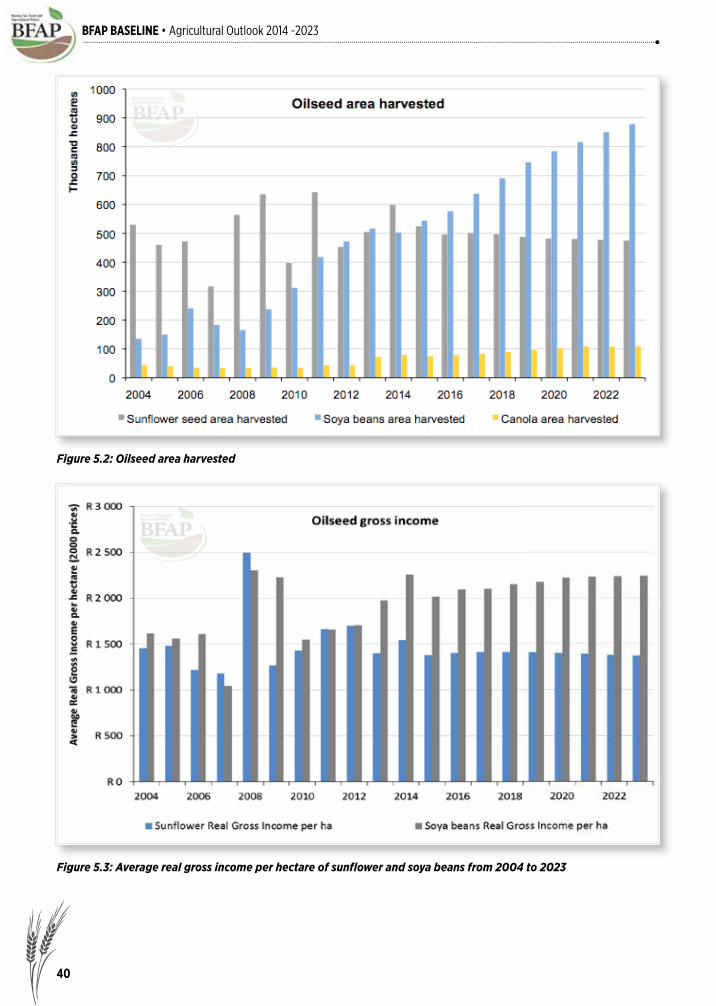
Domestic oilseed situation and trendsThe average real gross income of sunfl ower production declined in 2013 due to lower yields caused by the drought in the western parts of the summer rainfall area. However, sunfl ower producers responded well to the high crop prices that prevailed during the 2014 planting season by increasing sunfl ower plantings by 19% to almost 600 thousand hectares. Given the increase in plantings, together with a recovery in yields, the local 2014 sunfl ower crop is expected to increase by 50% relative to the previous season. Due to the larger crop and lower international prices, the average SAFEX sunfl ower price for 2014 is projected to decline by 14% compared to 2013.
Current projections indicate a decline in the average SAFEX sunfl ower price in real terms, as the local sunfl ower price is projected to increase at a slower rate than agricultural goods infl ation. However, sunfl ower yields are expected to increase gradually over time to reach a national average of almost 1.6t/hectares over the next ten years. As a consequence, gross returns will remain relatively constant in real terms, which will ensure that a fi ne balance is maintained in the local sunfl ower market with the total area under production dipping just below 500 thousand hectares but production remaining constant due to increasing yields.
40
BFAP BASELINE • Agricultural Outlook 2014 -2023
Figure 5.2: Oilseed area harvested
Figure 5.3: Average real gross income per hectare of sunfl ower and soya beans from 2004 to 2023

41
BFAP BASELINE • Agricultural Outlook 2014 -2023
Figure 5.4: Soya bean production, domestic use, net trade and prices
Local soya bean production showed tremendous growth over the past decade as more producers in the summer rainfall area become aware of the benefi ts of soya beans in a crop rotation program and the lower input needs of soya beans compared to maize. Soya bean plantings expanded from 135 thousand hectares in 2004 to more than 500 thousand hectares in 2013. Although producers might experience price pressure in the short term due to lower international prices, soya bean plantings are expected to continue to increase to reach approximately 900 thousand hectares by 2023 as growing yields are projected to raise average gross income in real terms over the baseline period. National average yields are expected to reach 2.3t/ha by 2023, which will boost domestic soya bean production to approximately 2 million tons. The rising local availability of soya beans and the large local demand for soya bean oilcake encouraged
greater investment in local crushing capacity. Some of these crushing plants are already in production and gradually increasing the utilization rate as the locally produced soya bean cake fi nds its way into the domestic market. Additional crushing capacity that will come into production in the near future may result in a short supply situation with regard to soya beans. This will have a positive impact on the producer price of soya beans as prices will move away from export parity and trade more in line with the derived price from the soya bean cake and oil. This break away from export parity levels was already anticipated in the 2013 Baseline and presents a structural break in the discovery of soya bean prices in South Africa. Taking the soya bean-maize price ratio into consideration, it implies that this ratio will swing more in favour of soya beans, which will boost the expansion in the area under production.

42
BFAP BASELINE • Agricultural Outlook 2014 -2023
Figure 5.5: Sunfl ower seed production, domestic use, trade and prices
Box 5.1: Applying the US principle of price premiums for oil content in the South African market.2
Processors generally prefer sunfl ower hybrids that combine genetics for high oil yield and hulling characteristics, yet in South Africa, premiums are not necessarily paid for a higher oil yield as is the case in the United States. The South African industry is set on an average oil content of 38%, with no distinction for higher oil content. Sunfl ower seed that is imported from markets likes Russia and Ukraine are typically characterized by an oil content higher than 38% and it is not uncommon for imported seed to realize a premium above locally produced seed. The United States currently provides a 2% price premium for every 1% of oil content exceeding the norm of 40% (NSA, 2011). Over the past decade, the domestic sunfl ower industry has remained stagnant with basically no growth in the production and consumption of seed, raising the question of what could provide additional incentives for the industry to expand. A potential premium for higher oil yields could prompt producers to prioritize higher oil-yield per ton and follow optimal growing guidelines as opposed to regarding sunfl owers as a catch crop. In order to quantify the potential effect of a premium on higher oil yields in South Africa, data from cultivars evaluated in the 2010/2011 Agricultural Research Council (ARC-GCI) national trial was used (ARC-GCI, 2011). Table 5.1 indicates that when US principles are applied the potential premium results in an increase of R 633/ton in the producer price based on October 2013 price levels. From the evaluation conducted for the South African Grain Laboratories’ (SAGL) national sunfl ower quality report, it is evident that producers are in fact already producing high oil content seeds (SAGL, 2013). The SAGL reported a sample mean of 43% oil yield realized from seeds delivered to silos in the south-western
2 An extract from the report: “An evaluation of the South African Sunfl ower Complex”, compiled by BFAP for the Protein Research Foundation in 2013.

43
BFAP BASELINE • Agricultural Outlook 2014 -2023
region of the Free State, which is signifi cantly higher than the standardized perceived norm of 38%. Even a 6% premium implied by this oil yield could provide a signifi cant incentive, potentially resulting in a gain of R317/ton (Oct. 2013 SAFEX price). Crushing capacity in the sunfl ower industry is currently under-utilized by approximately 300 thousand tons per annum (excluding the new dual sunfl ower-soya bean facilities that have been built), which would indicate that the hypothetically increased production could be absorbed. Nevertheless, despite under-utilization of current crushing capacity, South Africa remains a net importer of both sunfl ower oil and sunfl ower oilcake, which implies that even without paying the proposed premium it seems as if the relative profi tability from current crushing margins is not suffi cient to induce additional crushing domestically. Consequently a
Assumptions based on 2% Premium for every 1% above 40%3, calculated on the SAFEX spot price
Crude oil contribution (% extraction from 1ton of seed)
46%4 oil yield, calculated as Dry Matter Base (DMB)
a 6% higher oil yield, results in a 12% Premium
SAFEX (Avg. Oct 2013) R 5 277
Producers gain per ton of high-oil yielding seed delivered R 633
Table 5.1: Producers gain based on the higher oil content premium
Source: BFAP (2013)
more detailed study looking into the viability of an additional oil premium would be required before any conclusions can be drawn. From 2009 to 2012, the average annual value of sunfl ower oilcake imports was R154 million, equivalent to 88 thousand tons. Assuming that current extraction rates remain unchanged, this implies that an additional 206 thousand tons of sunfl ower seed would be required if South Africa was to produce an additional 88 thousand tons of oilcake domestically. Sunfl ower oil production would amount to 78 thousand tons per annum, equivalent to average annual imports of sunfl ower oil from 2009-2012. More importantly, domestic crushing capacity would be fully optimized under this scenario, as the average total harvested crop for the same period was only 610 thousand tons.
3 South Africa has no formal specifi cation for a “norm” oil content to be delivered. The Agricultural Product Standards Act 1990 (Act 119 of 1990) states that an FH1 grade sunfl ower should be a seed of a “high oil yield”, without specifying what a high oil yield is. The industry established norm is generally that all sunfl ower delivered on SAFEX should be above a 36% oil yield and preferably at a 38% norm. The 38% norm was also used by ITAC (2006) in their anti-dumping investigation of refi ned sunfl ower oil. To draw the comparison, a similar norm (40%) as the United States was used.
4 Mean moisture free oil concentration (%) based on the ARC-GCI national cultivar trial evaluation (ARC-GCI, 2011:8)

44
BFAP BASELINE • Agricultural Outlook 2014 -2023
Canola production showed a signifi cant increase in 2013 as producers in the Western Cape increased plantings in response to the good prices and yields obtained in 2012. Despite the lower yield in 2013, producers are projected to increase plantings by a further 8 thousand hectares (11%) in 2014 due to good crop prices and the perceived benefi ts of canola as part of a rotational cropping program. Although the local canola price is projected to decline over the next two seasons because of
lower international prices, production is projected to continue to increase over the next decade. The prospective introduction of new cultivars including genetically modifi ed varieties will have a positive long term effect on average yields and the average gross income per hectare, which will encourage producers to include canola on a larger scale in their crop rotation program. The expanded local availability of canola will eventually lead to an increase in local crushing capacity.
Figure 5.6: Canola production, domestic use and prices

45
BFAP BASELINE • Agricultural Outlook 2014 -2023
Global oilcake situation and trendsInternational soya bean oilcake prices are mostly used as the benchmark for other oilcakes as soya bean oilcake is the most important oilcake produced and consumed in the world market. World soya bean oilcake prices are projected to follow international soya bean prices lower until 2016 before rising marginally over the rest of the baseline period. Sunfl ower oilcake will follow the same pattern as soya bean oilcake over the baseline projection but due to its lower protein content and feed value compared to soya beans it trades at a discount.
Domestic soya bean oilcake situation and trendsCurrent domestic consumption of soya bean oilcake is estimated to be approximately 1.2 million tons of which local production will provide just over 600 thousand tons, with imports supplying the defi cit. Consumption is projected to increase over the baseline period to approximately 1.8 million tons
by 2023 and most of it will be supplied by local production due to the expected expansion of local soya bean crushing capacity. Despite the larger local production of soya bean oilcake, local soya bean oilcake prices will remain a function of international prices and the exchange rate until suffi cient oilcake is produced in the local market to break away from import parity levels. Domestic consumption of sunfl ower oilcake is projected to increase from approximately 400 thousand tons in 2014 to 550 thousand tons by 2023. As local production is expected to remain relatively constant over the baseline period, most of the increase in consumption will have to be provided by imports. The actual amounts that will be imported will be infl uenced to a large extent by the availability of good quality sunfl ower oilcake on the world market and its price relative to other available oilcakes such as soya bean or cotton oilcake.
Figure 5.7: Soya bean and sunfl ower oilcake world prices
Source: FAPRI & International Grains Council

46
BFAP BASELINE • Agricultural Outlook 2014 -2023
Figure 5.8: Soya bean oilcake production, consumption, trade and prices
Figure 5.9: Sunfl ower oilcake production, consumption, trade and prices

47
BFAP BASELINE • Agricultural Outlook 2014 -2023
Global vegetable oil situation and trendsSouth Africa is a net importer of vegetable oils and therefore local prices are mainly determined by international prices and the Rand/Dollar exchange rate. International soya bean oil prices are expected to decline by 16% in 2014 relative to 2013 due to higher crushing of soya beans. A further, but lesser decline is projected during 2015 and 2016 before it will consolidate and increase marginally towards the end of the baseline period. In contrast, a slight increase is projected for sunfl ower oil prices during 2014 as it is expected that sunfl ower oil exports from the Black Sea region might be interrupted due to the present confl ict. Sunfl ower oil is likely to follow soya bean oil lower in 2015 and 2016 before trading slightly upwards towards 2023 (Figure 5.10).
Domestic sunfl ower oil situation and trendsThe local sunfl ower oil price is expected to be higher on average during 2014 compared to 2013 due to a higher international price and a weaker exchange rate. However, prices are projected to decrease again in 2015 due to the projected decline in international prices before, rising continuously towards 2023 because of the projected depreciation of the exchange rate and slightly higher international prices by the end of the baseline projections. Local sunfl ower oil production is expected to remain relatively constant around 300 thousand tons. Only modest growth in consumption of less than 2 percent per annum is anticipated over the outlook, which will be met by imported sunfl ower oil (Figure 5.11).
Figure 5.10: Vegetable oil world prices
Source: FAPRI & International Grains Council
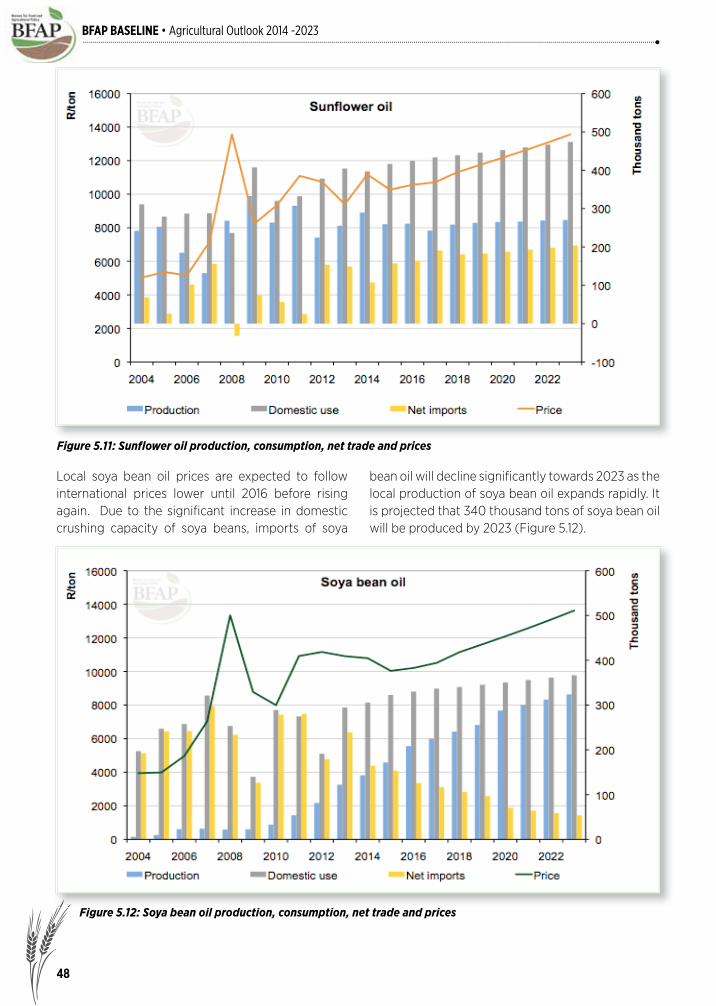
48
BFAP BASELINE • Agricultural Outlook 2014 -2023
Figure 5.11: Sunfl ower oil production, consumption, net trade and prices
Figure 5.12: Soya bean oil production, consumption, net trade and prices
Local soya bean oil prices are expected to follow international prices lower until 2016 before rising again. Due to the signifi cant increase in domestic crushing capacity of soya beans, imports of soya
bean oil will decline signifi cantly towards 2023 as the local production of soya bean oil expands rapidly. It is projected that 340 thousand tons of soya bean oil will be produced by 2023 (Figure 5.12).

49
BFAP BASELINE • Agricultural Outlook 2014 -2023
Sugarcane & sugar
South African outlook
The South African sugar industry fi nds itself at a crossroads. The industry is currently reviewing a number of its processes and planning strategic interventions to bring sustainability back into the production and processing of sugarcane and sugar.
THE SOUTH AFRICAN SUGAR industry fi nds itself at a crossroads. Coming from an era where it was highly regulated while producing large surpluses of sugar with favourable profi t margins for producers and millers, the environment has changed. Area and production are shrinking and milling companies’ investment sentiments are potentially shifting under signifi cantly tighter profi t margins with much lower throughput at a number of mills. Furthermore, the price discovery mechanism used to set the notional price for sugar has led to the elevation of local sugar prices that are now in line with import parity levels and the local industry is faced with increased competition from imported sugar.
Tighter margins and shifting sentiments have taken their toll and the area under sugarcane production has declined by 15% or close to 60 thousand hectares. The average mill utilization has also declined and for the past three years reached just over 80% with some mills in the coastal areas below 70%. Interesting to note is that contrary to other industries, where a contraction in hectares normally goes along with an increase in yields due to intensifi cation, this has not been the case in the sugar industry. The increasing prevalence of Eldana (African sugarcane borer) in the coastal areas has forced growers to shorten their cutting cycles, which has reduced yields and the quality of cane delivered. Industry experts further

50
BFAP BASELINE • Agricultural Outlook 2014 -2023
Figure 6.1: Sugarcane area and price
argue that a number of external infl uences such as urbanisation in the coastal regions, land claims and unsuccessful land reform projects in the midlands areas have resulted in a decline in hectares under production. There is generally a lack of incentive to reinvest in the establishment of new ratoons since almost 30% of the sugarcane area is under land claims. The industry is currently reviewing a number of its processes and planning strategic interventions to bring sustainability back into the production and processing of sugarcane and sugar. A new Sugar Act has been developed by the industry and is currently under review at the Department of Trade and Industry. Under the new Sugar Act, it is envisaged that the principle of vertical slicing will be introduced, which provides the opportunity for growers to share in the revenue of sales of products other than cane and molasses, such as bioethanol. This implies that the industry will also be in need of a revenue sharing
model that goes beyond the current division of proceeds based on the sales of sugar and molasses only. Apart from catering for alternative sources of income in a new payment system, it also has to be ensured that a new cane payment system drives the correct incentives and rewards for effi ciencies and investment in alternative sources of income. The 2014 BFAP baseline assumes that these interventions will be implemented successfully over the medium term and the industry will fi nd a new sustainable equilibrium. However, the industry will fi rst go through a process of consolidation where some of the marginal production areas could fall out of production. Furthermore, closure of one or two mills is also a possibility to increase the throughput at the existing mills in order to boost the effi ciencies of the mills, which have been declining over the past few seasons. As can be expected, it will be the marginal hectares that fall out of production. The coastal areas

51
BFAP BASELINE • Agricultural Outlook 2014 -2023
Figure 6.2: Sugar production, consumption and the RV price
have been worst hit by the prevalence of Eldana and consecutive droughts. Over the long run, coastal areas will also experience more pressure from the rising minimum wages and mechanization is not an option in most of the coastal areas due to the steep slopes. As the area under production is declining the average yields will start to increase gradually as the relative shares of highly productive land and hectares under irrigation start to increase. Whereas the net revenue is expected to decline in real terms over the next four years as total costs increase at a faster rate than total revenue, the increase in yields will be suffi cient that by 2019 net revenue in real terms will increase again and the area under sugarcane will stabilize around 350 thousand hectares. Under the baseline assumption of normal weather conditions between 18 and 19 million tons of cane will be produced per annum over the baseline. In terms of consumption, per capita consumption in South Africa has increased by 32% over the past decade. With real per capita
GDP increasing at a much slower rate over the next ten years, local consumption of sugar is expected to increase by approximately 13% over the baseline period. Recoverable value (RV) prices are expected to rise from their current level of around R3500/ton to R4900/ton by 2023. This will boost sugarcane prices from R421/ton to R549/ton by 2023. More importantly, the model has been set to continue determining prices on a cost plus fair return basis and not to trade at import parity levels over the outlook period. Because import parity prices increased drastically over the past decade, this pricing mechanism has been absorbed in the market. However, as international prices have lost steam and declined, local prices rose above the import parity prices and imports of sugar increased rapidly. This causes a dilemma for the industry as more imports lead to higher volumes that have to be exported again at a loss due to the surplus removal scheme.

52
BFAP BASELINE • Agricultural Outlook 2014 -2023
Figure 6.3: 64/36 ethanol & cogeneration division: income and margins
Box 6.1: Sustainable sugar production in SA5
In principle, the best position for the sugar industry to be in over the long run is to reduce the losses incurred by surpluses in the export market. Although the short term solution will involve the further consolidation of hectares under production in marginal areas, over the long-run additional local demand for sugarcane can be generated beyond the use of sugar and molasses only. The introduction of the new sugar act will provide opportunity for growers and millers to share in the same revenue pool created by additional income. There are a number of investment opportunities that are currently being reviewed and the solutions differ depending on the unique characteristics of the various production regions. In any new investment such as cogeneration and bioethanol production, millers and growers should have equal opportunity for investment and revenue sharing. The formula should be structured in such way that the initial investment receives the appropriate future revenue fl ow. It should be a holistic approach where a range of options are considered for investment and revenue sharing. In Figure 6.3, the potential income from adding cogeneration and bioethanol to the revenue pool is compared to the income under the baseline where only sugar and molasses are produced. The grey bar presents the income per hectare and the yellow marker the level of gross margin. For example, for the coastal region the total income is R29 996/ha and the margin R7 736/ha. When introducing ethanol at the mandatory blending level of 2% and cogeneration with a 64/36 division of proceeds, the model illustrates that coastal and northern irrigation farmers will benefi t from the new revenue streams, due to the higher fi bre content of sugarcane produced in the coastal and northern regions, yet midland farms actually end up with a smaller gross margin per hectare, due to the lower return from cogeneration processes relative to other regions. For the coastal farmers, total revenue will increase to R32 500/ha and the net margin will increase to R8 151/ha. Hence, farmers in the coastal areas are approximately R400/ha better off in a scenario where ethanol and cogeneration are added as alternative income streams.
5 Extract from the report: “Understanding the Factors that have Impacted on Cane Production in the South African Sugar Industry”, compiled by BFAP for the South African Cane Growers Association in 2014
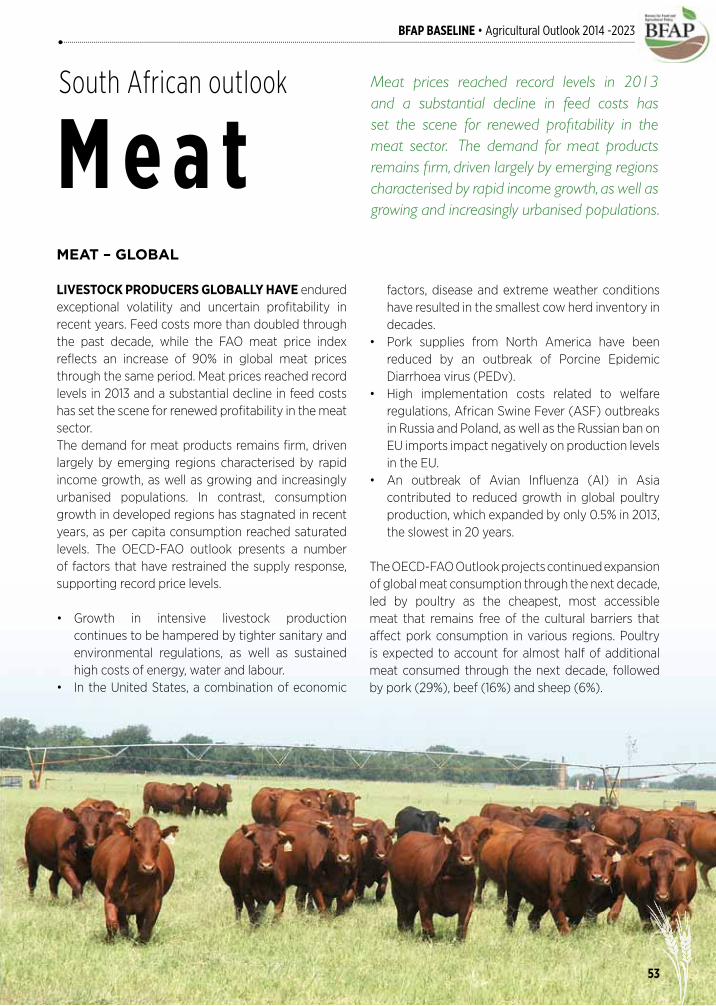
53
BFAP BASELINE • Agricultural Outlook 2014 -2023
M e a t South African outlook Meat prices reached record levels in 2013
and a substantial decline in feed costs has set the scene for renewed profi tability in the meat sector. The demand for meat products remains fi rm, driven largely by emerging regions characterised by rapid income growth, as well as growing and increasingly urbanised populations.
MEAT – GLOBAL
LIVESTOCK PRODUCERS GLOBALLY HAVE endured exceptional volatility and uncertain profi tability in recent years. Feed costs more than doubled through the past decade, while the FAO meat price index refl ects an increase of 90% in global meat prices through the same period. Meat prices reached record levels in 2013 and a substantial decline in feed costs has set the scene for renewed profi tability in the meat sector. The demand for meat products remains fi rm, driven largely by emerging regions characterised by rapid income growth, as well as growing and increasingly urbanised populations. In contrast, consumption growth in developed regions has stagnated in recent years, as per capita consumption reached saturated levels. The OECD-FAO outlook presents a number of factors that have restrained the supply response, supporting record price levels.
• Growth in intensive livestock production continues to be hampered by tighter sanitary and environmental regulations, as well as sustained high costs of energy, water and labour.
• In the United States, a combination of economic
factors, disease and extreme weather conditions have resulted in the smallest cow herd inventory in decades.
• Pork supplies from North America have been reduced by an outbreak of Porcine Epidemic Diarrhoea virus (PEDv).
• High implementation costs related to welfare regulations, African Swine Fever (ASF) outbreaks in Russia and Poland, as well as the Russian ban on EU imports impact negatively on production levels in the EU.
• An outbreak of Avian Infl uenza (AI) in Asia contributed to reduced growth in global poultry production, which expanded by only 0.5% in 2013, the slowest in 20 years.
The OECD-FAO Outlook projects continued expansion of global meat consumption through the next decade, led by poultry as the cheapest, most accessible meat that remains free of the cultural barriers that affect pork consumption in various regions. Poultry is expected to account for almost half of additional meat consumed through the next decade, followed by pork (29%), beef (16%) and sheep (6%).

54
BFAP BASELINE • Agricultural Outlook 2014 -2023
Indications are that improved profi tability has induced a phase of herd rebuilding that will support higher beef prices in the short term. As production expands, beef prices are expected to ease from 2017 towards the end of the outlook period. Higher beef prices will support the demand for poultry, resulting in nominal poultry prices trading largely sideways in the short term despite lower feed costs, before increasing marginally in the second half of the outlook in line with stronger feed prices. Pork prices are expected to remain in a downward cycle until 2017, before recovering towards 2020. Uncertainty remains regarding the extent to which various disease outbreaks will affect the medium term outlook for pork prices and if the effect is prolonged, prices could be signifi cantly higher in the short term. Following a rapid decline from record peaks in 2011, lamb prices are expected to increase marginally through the outlook period, underpinned by fi rm import demand from Asia and the EU.
Meat and eggs – South AfricaSouth African livestock markets have been characterised by the same volatility and uncertainty evident in international markets in recent years. Despite a degree of substitutability between different meat products, inherently different production systems and fundamental differences in equilibrium pricing conditions cause continuous changes in relative meat prices as individual industries respond differently to changes in exogenous drivers. While 2013 marked a return to profi tability in the global context, a substantial depreciation in the exchange rate combined with severe drought conditions in South Africa and neighbouring countries denied domestic producers the same relief. The demand for beef products has fl uctuated since 2008, due to an unstable economic environment and continuous shifts in relative meat prices. At the same time, beef supply has been governed by extreme weather conditions in South Africa, as well as neighbouring countries, resulting in a particularly volatile market. Following fi rm prices in 2011 and
Figure 7.1: World meat prices
Source: FAPRI & BFAP updates

55
BFAP BASELINE • Agricultural Outlook 2014 -2023
2012, an increase of more than 200 thousand animals slaughtered nationally in 2013 compared to 2012 refl ects an infl ux of live cattle imports from neighbouring countries, as well as herd reductions in South Africa, resulting in reduced beef prices. While the lingering effects of the drought has maintained high slaughter numbers in the fi rst quarter of 2014, April slaughters fell well short of 2013 levels, supporting a fi rm rebound in price levels that is expected to continue as the effect of reduced live imports and lower domestic stock numbers becomes evident. Calf prices fell sharply in 2012 in response to high feed costs which reduced feedlot margins. Substantial increases in live cattle imports resulted in further pressure on calf prices in 2013, evident in a decline of 6% relative to 2012 levels. Reduced feed grain prices in 2014 will support improved feedlot margins and as recent stock reductions start to impact the market, signifi cant increases in calf prices are expected from 2014 onwards. Typically produced in pasture based systems, the effect of drought conditions was also evident in lamb / mutton supply in 2013; national slaughters increased by more than 750 thousand head relative to 2012 levels. Despite a historically strong correlation with international prices, expanded supply domestically resulted in lower domestic prices in 2013, despite rising import parity levels. South African pork and chicken prices show a strong correlation to international markets due to the country’s reliance on imported products in order to supplement domestic demand. At the same time, intensive use of feed grains in the production system renders these industries particularly vulnerable to rising feed costs. Having reached record levels in 2012, high feed prices persisted in 2013 due to extreme weather conditions experienced in some parts of the country. While competitively priced imports prevented signifi cant increases in domestic chicken prices in 2012, placing extreme pressure on producer margins, a substantial depreciation in the exchange rate and higher international prices increased the cost of imported chicken in 2013 (Figure 7.2). Domestic prices followed, yielding an increase of 7.7% in the weighted average net sales realisation for frozen
chicken in 2013. While all domestic chicken prices respond to changes in import parity levels, sensitivity varies across different product types - higher import parity prices in 2013 led to an increase of 9.5% in the price of whole frozen chicken from 2012 to 2013, while the price of individually quick frozen (IQF) pieces increased by only 4% in the same period. Nevertheless, the cost of imported chicken products is expected to remain high through the outlook, lending support to domestic price levels. South Africa is a small player in the global pork market and as a net importer of pork products, prices are guided by global trends. Despite continued pressure from high feed costs, domestic pork prices increased by only 3% in 2013, refl ecting the marginal increase in international prices, before increasing further in the early parts of 2014 on the back of higher international prices. Continued growth in meat consumption is projected for the next decade, however a confl uence of macroeconomic factors results in higher meat prices and slower consumption growth through the next decade relative to the past. While income growth remains a key driver of increased meat consumption, relative prices and consumer preferences drive the choice between various meat types over time. Chicken remains the most affordable source of protein and while consumption is projected to increase by only 34% over the next decade (compared to 81% through the past 10 years), it continues to dominate the meat market, accounting for 73% of additional meat consumed by 2023. Pork consumption is set to grow the fastest of all meat types over the outlook period, yet an expansion of 41% through the next ten years (compared to 53% through the past decade) accounts for only 10% of additional meat consumed by 2023, refl ecting its small share in total meat consumption. The demand for beef is projected to increase by 20% through the next decade (compared to 12% through the past 10 years), accounting for 15% of additional meat consumed by 2023. As the most expensive meat alternative, lamb / mutton is typically consumed by high income consumers that spend a small share of total income on food and hence the response to higher prices is less sensitive. Following a contraction through the past decade, sheep meat

56
BFAP BASELINE • Agricultural Outlook 2014 -2023
Figure 7.2: Chicken domestic price vs. import parity price comparison
Figure 7.3: SA meat consumption

57
BFAP BASELINE • Agricultural Outlook 2014 -2023
* Note that historic production and consumption data has been revised to include offal
Figure 7.4: SA chicken production, consumption and chicken-maize price ratio
Over the past 5 years, domestic poultry production has failed to expand suffi ciently to meet growing consumption levels, resulting in spiralling imports. While chicken consumption is projected to surpass 2.6 million tons by 2023, approaching 50kg per capita, production is expected to expand to almost 2 million tons by 2023, resulting in 680 thousand tons of chicken being imported by 2023. The general duty on imported chicken was increased in 2014, supporting higher prices; however imports originating from the European Union remain duty free under the Trade Development and Cooperation Agreement (TDCA), reducing the impact of higher tariffs in the domestic market. The chicken to maize price ratio remains a key indicator of profi tability in the industry (Figure 7.4), which has been highly uncertain in recent years. Profi tability improved rapidly in 2009 as grain prices
started to plummet, but a gradual decline followed and 2012 marked record lows that refl ect higher feed costs and stagnant chicken prices. The price ratio increased only marginally in 2013, after which the projection of easing maize prices support a substantial improvement to 2015. In the long run, the chicken to maize price ratio is projected to stabilise well above recent levels, encouraging investment that will expand domestic production. While many uncertainties will infl uence the rate at which domestic production levels expand through the next decade, expansion of domestic soya crushing will be one of the most signifi cant. Should crushing expand to the extent that the price of domestically produced protein meal breaks away from import parity levels, profi tability will improve substantially, resulting in a rapid increase in the rate of production growth.

58
BFAP BASELINE • Agricultural Outlook 2014 -2023
Exceptionally high feed costs following the US drought in 2012 drove the egg to maize price ratio to its lowest level in the past decade and continuously high maize prices prevented any signifi cant improvement in 2013. The sustained pressure of high feed costs was refl ected in reduced egg production in 2013, supporting higher egg prices following a continuous decline through the past 3 years. Having increased continuously through the past decade, consumption levels declined for the fi rst time in 2013 as a result of higher prices. Nevertheless, domestic egg consumption is projected to increase by 27% through the next decade, exceeding 540 thousand tons by 2023; more than 10kg per capita. Easing grain prices will support improved profi tability from 2014 and in the long run, egg prices are projected to increase faster than maize prices on a continuous basis, resulting in ever improving output to input price ratios that will support the expansion of the domestic industry in order to match fi rm consumption growth (Figure 7.5). While changes in feed prices impact profi tability in all livestock sectors, beef production exhibits
greater fl exibility in the feeding system than pork and poultry. The cost of feed is less infl uential in beef price levels; however supply can be volatile and is more sensitive to extreme weather conditions which cause unexpected changes in herd numbers. Following stock reductions in 2013, improving profi tability through the next decade will enable a supply response that is suffi cient to meet growing domestic demand, resulting in a marginal decline in the share of imports in total consumption. Typical price cycles will remain evident, as stronger prices lead to phases of herd rebuilding, followed by periods of greater supply and softer prices. Following severe drought conditions through the past 2 years, prices have recovered in the early part of 2014 with April / May prices trading 20% higher than the same period in 2013. Underpinned by fi rm demand and rising prices in competing industries, beef prices are projected to increase continuously through the next decade, exceeding R50/kg by 2023 (Figure 7.6). Average annual growth of 6.4% will be suffi cient to outpace general infl ation, resulting in a marginal increase in real beef prices by 2023.
Figure 7.5: SA egg production, consumption and egg-maize price ratio
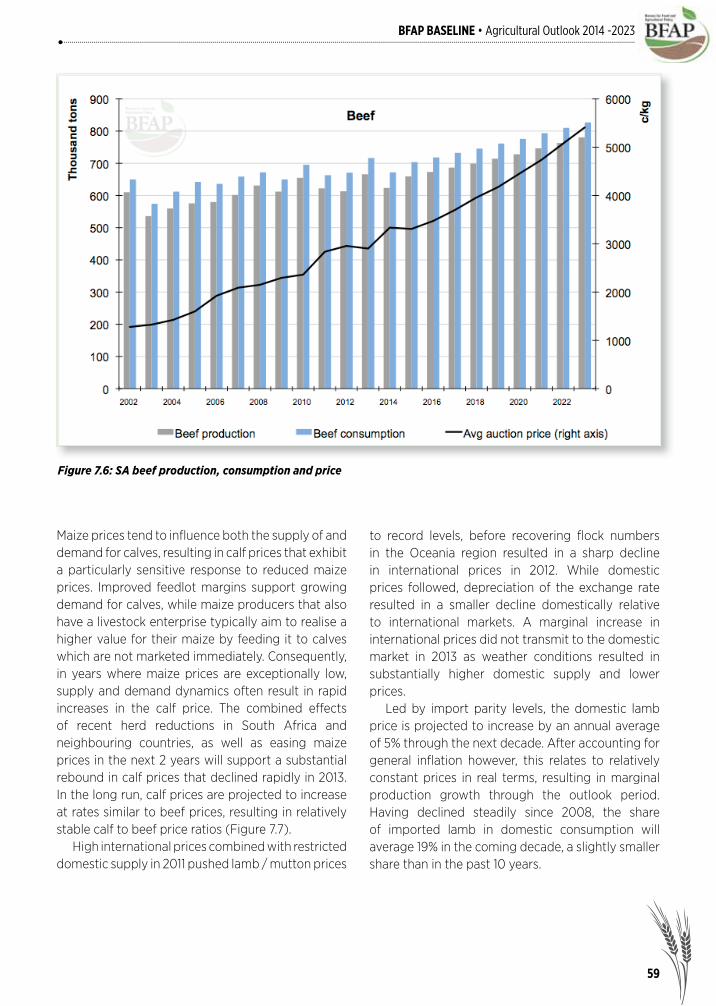
59
BFAP BASELINE • Agricultural Outlook 2014 -2023
Figure 7.6: SA beef production, consumption and price
Maize prices tend to infl uence both the supply of and demand for calves, resulting in calf prices that exhibit a particularly sensitive response to reduced maize prices. Improved feedlot margins support growing demand for calves, while maize producers that also have a livestock enterprise typically aim to realise a higher value for their maize by feeding it to calves which are not marketed immediately. Consequently, in years where maize prices are exceptionally low, supply and demand dynamics often result in rapid increases in the calf price. The combined effects of recent herd reductions in South Africa and neighbouring countries, as well as easing maize prices in the next 2 years will support a substantial rebound in calf prices that declined rapidly in 2013. In the long run, calf prices are projected to increase at rates similar to beef prices, resulting in relatively stable calf to beef price ratios (Figure 7.7). High international prices combined with restricted domestic supply in 2011 pushed lamb / mutton prices
to record levels, before recovering fl ock numbers in the Oceania region resulted in a sharp decline in international prices in 2012. While domestic prices followed, depreciation of the exchange rate resulted in a smaller decline domestically relative to international markets. A marginal increase in international prices did not transmit to the domestic market in 2013 as weather conditions resulted in substantially higher domestic supply and lower prices. Led by import parity levels, the domestic lamb price is projected to increase by an annual average of 5% through the next decade. After accounting for general infl ation however, this relates to relatively constant prices in real terms, resulting in marginal production growth through the outlook period. Having declined steadily since 2008, the share of imported lamb in domestic consumption will average 19% in the coming decade, a slightly smaller share than in the past 10 years.

60
BFAP BASELINE • Agricultural Outlook 2014 -2023
Figure 7.7: SA beef price versus calf price
Figure 7.8: Sheep meat production, consumption and imports

61
BFAP BASELINE • Agricultural Outlook 2014 -2023
Pork accounts for a small share of total meat consumption in South Africa and despite favourable prices compared to beef and lamb at producer level, pork is typically consumed as value added products, by higher income consumers. In addition to prices and income levels, demand is infl uenced by several non-economic factors such as consumer sentiments regarding quality, simplicity, convenience and
health. Given the amount of value added prior to consumption, changes in key cost drivers in the value chain have a signifi cant impact on the cost of pork products at retail level (Box 7.1). In the long run, continued growth in demand will require an effi cient value chain that delivers high quality products in a cost effective manner.
Box 7.1: Cost drivers in the South African pork value chain6
Pork products in South Africa are supplied through 2 distinct supply chains for fresh and processed pork products. The spread between producer prices and retail prices for processed products in particular has increased through the past 5 years; however substantial value is added at different levels of the supply chain before these products reach the end consumer. Following an evaluation of the South African pork value chain conducted by BFAP in 2013, Figure 7.9 illustrates the spread between the producer price of a class BP Baconer carcass, and the average retail price of different bacon cuts, adjusted to a carcass equivalent using a typical block test. Through the various levels of the supply chain which includes abattoir, processor, distribution and retail, the most infl uential cost drivers were identifi ed as labour, distribution costs and overhead costs, of which electricity is a substantial share. The increases in these key cost components for the past fi ve years are summarised in Table 7.1. When the changes in these three key cost components are considered, the cost of value adding has increased at a much greater rate than general infl ation since 2008. While producer prices infl uence expansion decisions at farm level, consumer decisions are based on retail prices and a widening price spread that refl ects increased costs of processing could impact consumption growth negatively in the long run.
Figure 7.9: Producer to Retail price spread for processed pork products
6 Extract from the report “Evaluating the South African Pork Value Chain”, compiled by BFAP for the South African Pork Producers Organisation in 2013

62
BFAP BASELINE • Agricultural Outlook 2014 -2023
Component 2008 2009 2010 2011 2012
Electricity 5.9% 27.5% 31.3% 24.8% 25.8%
Wages7 9.3% 9.8% 8.1% 8.3% 8.2%
Fuel 48% -5.1% 4.1% 5.2% 16.1%
CPI 5.2% 10.3% 6.16% 5.4% 4.5%
Table 7.1: Increases in key cost components in the pork value chain
Source: Quantec database
7 The wage rate increases represents the average of all workers earning an hourly wage in South Africa.
Growing pork production through the past decade has resulted from increased carcass weights and improved effi ciency rather than signifi cant increases in sow numbers. While improving effi ciency is no doubt positive, signifi cant increases in production in the future will be dependent on continued improvements in effi ciency as well as greater investment and expansion of the sow herd. Given the projection of fi rm pork prices and easing feed grain prices, pork producers are expected to respond, expanding production by 43% in order to meet the growing demand for pork products in the next
decade. While the implementation of restrictions on raw pork imports from countries that are not free of the Porcine Reproductive and Respiratory Syndrome (PRRS) virus, combined with a weaker currency resulted in reduced pork imports in 2013, imports have a distinct role in balancing the domestic market by supplying only the cuts in highest demand. As a result, South Africa is expected to remain a net importer of pork products, with imports accounting for 11% of domestic consumption in 2023, down from 13% in 2013 (Figure 7.9).
Figure 7.10: SA pork production, consumption and imports

63
BFAP BASELINE • Agricultural Outlook 2014 -2023
M i l k &dairy products
South African outlook A typically cyclical pattern is common in dairy markets, as producers respond to higher prices before the increased supply forces prices down again; however the steepness of the cycles in recent years is indicative of dramatic shifts in exogenous drivers.
MILK AND DAIRY – GLOBAL
THE EXCEPTIONAL VOLATILITY EVIDENT in the global dairy market since 2007 can be ascribed to a number of factors. Only about 6% of dairy products produced globally are traded in the world market, a small share relative to other commodities. Consequently, as exogenous drivers cause changes in the supply and demand dynamics in specifi c regions, substantial shifts occur in the global market. A typically cyclical pattern is common in dairy markets, as producers respond to higher prices before the increased supply forces prices down again; however the steepness of the cycles in recent years is indicative of dramatic shifts in exogenous drivers, with multiple factors on the supply and demand side often combining to cause substantial price variations. While fl uctuations in demand have been attributed to an unstable economic environment, constantly changing climatic conditions in key production regions have impacted on the supply response.
Having recovered well from the economic crisis towards the end of 2009 and through 2010, prices moved into a downward cycle in the second half of 2011 as excellent pasture conditions in Oceania and parts of South America supported high production levels. Demand remained fi rm however and combined with higher feed prices resulted in prices that bottomed out in mid-2012, at much higher levels than the previous downturn in 2009. Rapid increases in international dairy prices in 2013 refl ected a strong reaction to unfavourable weather conditions in New Zealand that led to the original expectation of record production not being realised. At the same time, the longer than normal winter conditions in the Northern Hemisphere limited production and a decline in Chinese milk production provided further support to higher international prices. Continued limitations in supply pushed the FAO dairy price index to new record levels in February 2014; however production prospects have
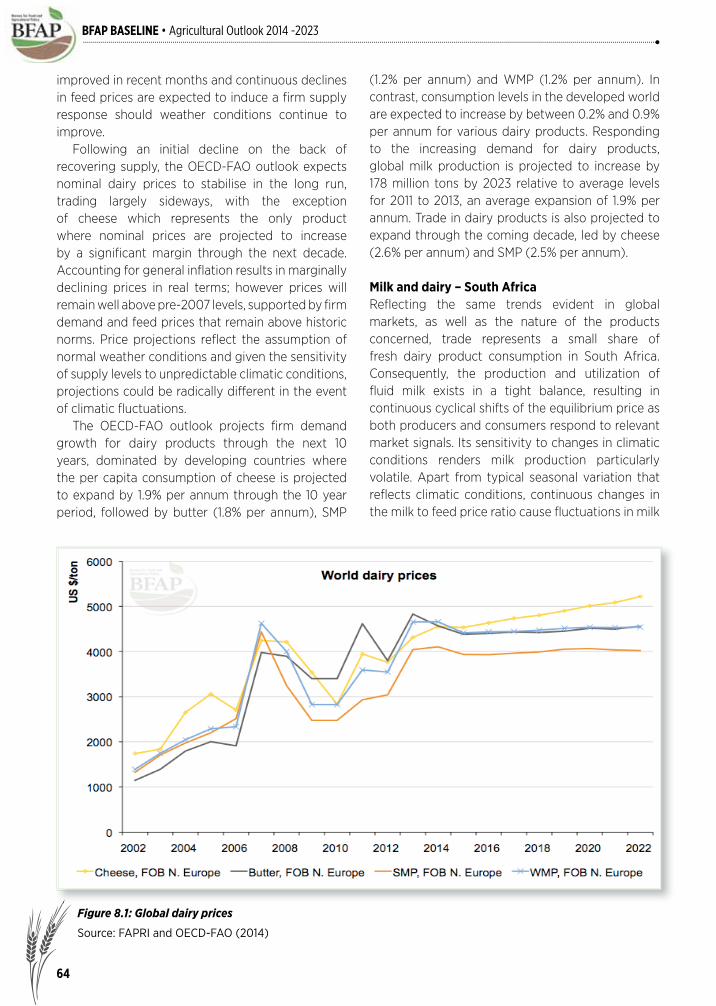
64
BFAP BASELINE • Agricultural Outlook 2014 -2023
improved in recent months and continuous declines in feed prices are expected to induce a fi rm supply response should weather conditions continue to improve. Following an initial decline on the back of recovering supply, the OECD-FAO outlook expects nominal dairy prices to stabilise in the long run, trading largely sideways, with the exception of cheese which represents the only product where nominal prices are projected to increase by a signifi cant margin through the next decade. Accounting for general infl ation results in marginally declining prices in real terms; however prices will remain well above pre-2007 levels, supported by fi rm demand and feed prices that remain above historic norms. Price projections refl ect the assumption of normal weather conditions and given the sensitivity of supply levels to unpredictable climatic conditions, projections could be radically different in the event of climatic fl uctuations. The OECD-FAO outlook projects fi rm demand growth for dairy products through the next 10 years, dominated by developing countries where the per capita consumption of cheese is projected to expand by 1.9% per annum through the 10 year period, followed by butter (1.8% per annum), SMP
(1.2% per annum) and WMP (1.2% per annum). In contrast, consumption levels in the developed world are expected to increase by between 0.2% and 0.9% per annum for various dairy products. Responding to the increasing demand for dairy products, global milk production is projected to increase by 178 million tons by 2023 relative to average levels for 2011 to 2013, an average expansion of 1.9% per annum. Trade in dairy products is also projected to expand through the coming decade, led by cheese (2.6% per annum) and SMP (2.5% per annum).
Milk and dairy – South AfricaRefl ecting the same trends evident in global markets, as well as the nature of the products concerned, trade represents a small share of fresh dairy product consumption in South Africa. Consequently, the production and utilization of fl uid milk exists in a tight balance, resulting in continuous cyclical shifts of the equilibrium price as both producers and consumers respond to relevant market signals. Its sensitivity to changes in climatic conditions renders milk production particularly volatile. Apart from typical seasonal variation that refl ects climatic conditions, continuous changes in the milk to feed price ratio cause fl uctuations in milk
Figure 8.1: Global dairy prices
Source: FAPRI and OECD-FAO (2014)
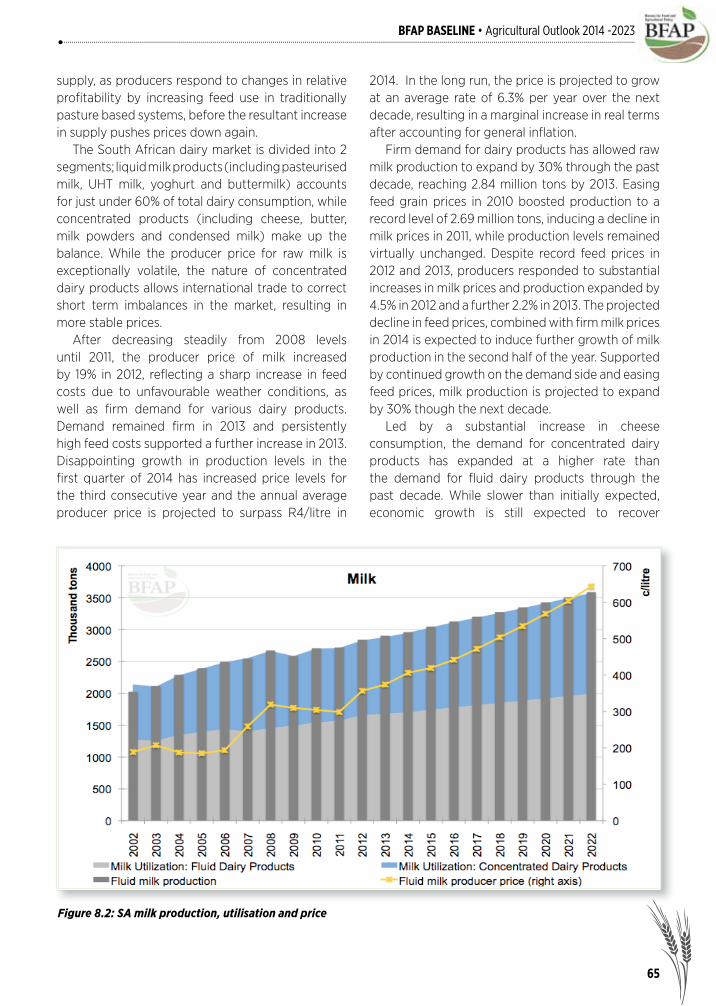
65
BFAP BASELINE • Agricultural Outlook 2014 -2023
Figure 8.2: SA milk production, utilisation and price
supply, as producers respond to changes in relative profi tability by increasing feed use in traditionally pasture based systems, before the resultant increase in supply pushes prices down again. The South African dairy market is divided into 2 segments; liquid milk products (including pasteurised milk, UHT milk, yoghurt and buttermilk) accounts for just under 60% of total dairy consumption, while concentrated products (including cheese, butter, milk powders and condensed milk) make up the balance. While the producer price for raw milk is exceptionally volatile, the nature of concentrated dairy products allows international trade to correct short term imbalances in the market, resulting in more stable prices. After decreasing steadily from 2008 levels until 2011, the producer price of milk increased by 19% in 2012, refl ecting a sharp increase in feed costs due to unfavourable weather conditions, as well as fi rm demand for various dairy products. Demand remained fi rm in 2013 and persistently high feed costs supported a further increase in 2013. Disappointing growth in production levels in the fi rst quarter of 2014 has increased price levels for the third consecutive year and the annual average producer price is projected to surpass R4/litre in
2014. In the long run, the price is projected to grow at an average rate of 6.3% per year over the next decade, resulting in a marginal increase in real terms after accounting for general infl ation. Firm demand for dairy products has allowed raw milk production to expand by 30% through the past decade, reaching 2.84 million tons by 2013. Easing feed grain prices in 2010 boosted production to a record level of 2.69 million tons, inducing a decline in milk prices in 2011, while production levels remained virtually unchanged. Despite record feed prices in 2012 and 2013, producers responded to substantial increases in milk prices and production expanded by 4.5% in 2012 and a further 2.2% in 2013. The projected decline in feed prices, combined with fi rm milk prices in 2014 is expected to induce further growth of milk production in the second half of the year. Supported by continued growth on the demand side and easing feed prices, milk production is projected to expand by 30% though the next decade. Led by a substantial increase in cheese consumption, the demand for concentrated dairy products has expanded at a higher rate than the demand for fl uid dairy products through the past decade. While slower than initially expected, economic growth is still expected to recover
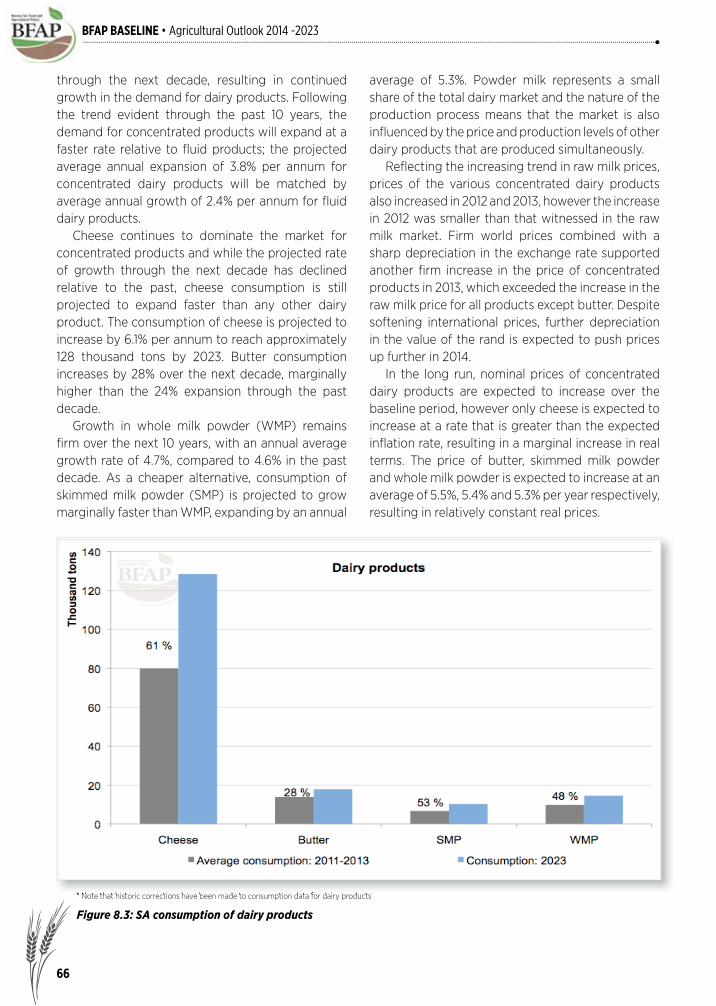
66
BFAP BASELINE • Agricultural Outlook 2014 -2023
through the next decade, resulting in continued growth in the demand for dairy products. Following the trend evident through the past 10 years, the demand for concentrated products will expand at a faster rate relative to fl uid products; the projected average annual expansion of 3.8% per annum for concentrated dairy products will be matched by average annual growth of 2.4% per annum for fl uid dairy products. Cheese continues to dominate the market for concentrated products and while the projected rate of growth through the next decade has declined relative to the past, cheese consumption is still projected to expand faster than any other dairy product. The consumption of cheese is projected to increase by 6.1% per annum to reach approximately 128 thousand tons by 2023. Butter consumption increases by 28% over the next decade, marginally higher than the 24% expansion through the past decade. Growth in whole milk powder (WMP) remains fi rm over the next 10 years, with an annual average growth rate of 4.7%, compared to 4.6% in the past decade. As a cheaper alternative, consumption of skimmed milk powder (SMP) is projected to grow marginally faster than WMP, expanding by an annual
average of 5.3%. Powder milk represents a small share of the total dairy market and the nature of the production process means that the market is also infl uenced by the price and production levels of other dairy products that are produced simultaneously. Refl ecting the increasing trend in raw milk prices, prices of the various concentrated dairy products also increased in 2012 and 2013, however the increase in 2012 was smaller than that witnessed in the raw milk market. Firm world prices combined with a sharp depreciation in the exchange rate supported another fi rm increase in the price of concentrated products in 2013, which exceeded the increase in the raw milk price for all products except butter. Despite softening international prices, further depreciation in the value of the rand is expected to push prices up further in 2014. In the long run, nominal prices of concentrated dairy products are expected to increase over the baseline period, however only cheese is expected to increase at a rate that is greater than the expected infl ation rate, resulting in a marginal increase in real terms. The price of butter, skimmed milk powder and whole milk powder is expected to increase at an average of 5.5%, 5.4% and 5.3% per year respectively, resulting in relatively constant real prices.
Figure 8.3: SA consumption of dairy products
* Note that historic corrections have been made to consumption data for dairy products* Note that historic corrections have been made to consumption data for dairy products

67
BFAP BASELINE • Agricultural Outlook 2014 -2023
Potatoes South African outlook Over the outlook period, yields are projected to
increase by a further 14% (compared to a 38% increase in yields over the past decade), which will not be suffi cient to meet the increase in local demand over the long run if the area were to stay constant.
FOR THREE CONSECUTIVE SEASONS (2010-2012), South African potato farmers have expanded the area under production following the sharp increase in potato prices of 70% in 2009 on the back of a drop in area of 5 thousand hectares. Despite lower prices over the period 2010 to 2012, most potato producers were able to improve yields continuously, resulting in relatively constant margins. New varieties and technology pushed national average yields from around 35t/ha to over 40t/ha over a short period of time. In 2013 farmers responded to three years of stagnant prices and the sharp rise in labour costs contributed to the contraction in total area planted of 3 thousand hectares. For the past two seasons the area under production seems to have consolidated around 50 thousand hectares with 2013 slightly below this level and 2014 projected to reach 50 610ha. Over the outlook period, yields are projected
to increase by a further 14% (compared to a 38% increase in yields over the past decade), which will not be suffi cient to meet the increase in local demand over the long run if the area were to stay constant. As a result, long term prices are expected to increase slightly in real terms and the area under production will gradually expand to 53 thousand hectares by 2023. At a projected national average yield of 48t/ha, approximately 2.6 million tons will be delivered on the market in 2023 and the market price for fresh potatoes will rise to R61 per 10kg. For 2014, prices are expected to trade around R36 per 10kg bag. With production cost infl ation expected to decline from its current level of 12.5% to 6% in 2015 and 2016 under the macro economic assumptions of this baseline, the area under production will remain stable around 51 thousand hectares for the next two seasons.

68
BFAP BASELINE • Agricultural Outlook 2014 -2023
Figure 9.1: Potato area planted and average market prices
Figure 9.2: Potato domestic use

69
BFAP BASELINE • Agricultural Outlook 2014 -2023
The offi cial consumption fi gures for 2013 are not available yet, but the BFAP sector model simulates a marginal decline in total consumption of potatoes of 70 thousand tons. Over the long run, per capita consumption of potatoes is projected to increase by 20% from its current level of 36kg/capita to 42kg/capita per annum by 2023. This represents slower consumption growth relative to the past decade, when per capita consumption increased by 42%. Exports are expected to remain relatively constant with South Africa exporting on average 135 thousand tons per annum mainly to neighbouring countries. Whereas fresh potatoes currently make up the bulk of exports, more processed potatoes like frozen chips could be exported in future as the
market for processed foods is growing rapidly in neighbouring countries. With the announcement of an import tariff on frozen fries in July 2013, imports have plummeted from almost 54 thousand tons (raw equivalent) in 2012 to only 25 thousand tons in 2013. While this has provided a welcome boost to the local demand for potatoes in the processing market, the processing industry was caught by surprise by the sudden announcement and it caused some tension in the supply chain to provide suffi cient supplies. Imports of processed potatoes are expected to remain fairly constant around 50 thousand tons over the outlook period.

70
BFAP BASELINE • Agricultural Outlook 2014 -2023
C i t r u s South African outlook
Oranges remain the single greatest component of global citrus imports, but the share of soft citrus as well as lemons and limes has increased throughout the past decade, indicative of higher growth rates in these markets.
GLOBAL MARKET
A CONSIDERABLE EXPANSION of the global citrus market was evident through the past decade, refl ecting greater volumes traded, as well as higher prices. Oranges remain the single greatest component of global citrus imports, but the share of soft citrus as well as lemons and limes has increased throughout the past decade, indicative of higher growth rates in these markets. While imports to Russia have increased by more than 8% per annum through the past decade, the European Union remains dominant in the global import market, accounting for almost 45% of global citrus imports in 2013. Driven by the expected recovery in global economies, the demand for citrus products should remain fi rm through the next decade, though rapid growth rates projected for
developing economies in the Middle East, Asia and Africa could result in stronger demand growth from these regions. Grapefruit experienced a phenomenal season in terms of production levels in 2013, resulting in lower prices, however limited supply of other citrus products as well as competing summer fruit supported fi rm prices for other citrus products in 2012 and 2013. Improved weather conditions in key production regions has led to substantially higher production volumes in 2014 for all products except lemons and limes, which were negatively affected by frost in Argentina. Consequently, prices in the EU have softened considerably in 2014 and as the EU traditionally leads the global market, other regions are expected to follow.
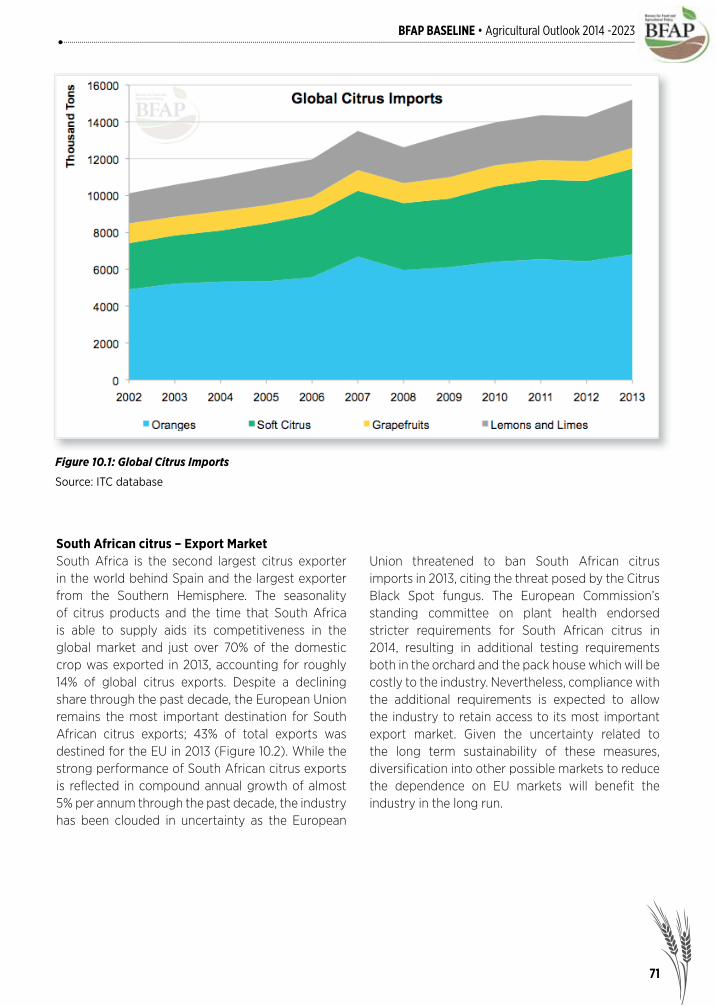
71
BFAP BASELINE • Agricultural Outlook 2014 -2023
South African citrus – Export MarketSouth Africa is the second largest citrus exporter in the world behind Spain and the largest exporter from the Southern Hemisphere. The seasonality of citrus products and the time that South Africa is able to supply aids its competitiveness in the global market and just over 70% of the domestic crop was exported in 2013, accounting for roughly 14% of global citrus exports. Despite a declining share through the past decade, the European Union remains the most important destination for South African citrus exports; 43% of total exports was destined for the EU in 2013 (Figure 10.2). While the strong performance of South African citrus exports is refl ected in compound annual growth of almost 5% per annum through the past decade, the industry has been clouded in uncertainty as the European
Union threatened to ban South African citrus imports in 2013, citing the threat posed by the Citrus Black Spot fungus. The European Commission’s standing committee on plant health endorsed stricter requirements for South African citrus in 2014, resulting in additional testing requirements both in the orchard and the pack house which will be costly to the industry. Nevertheless, compliance with the additional requirements is expected to allow the industry to retain access to its most important export market. Given the uncertainty related to the long term sustainability of these measures, diversifi cation into other possible markets to reduce the dependence on EU markets will benefi t the industry in the long run.
Figure 10.1: Global Citrus Imports
Source: ITC database

72
BFAP BASELINE • Agricultural Outlook 2014 -2023
Figure 10.2: South African Citrus Exports
Source: CGA, PPECB
Despite the uncertainty regarding the EU market, citrus exports reached record levels in 2013 as a substantial depreciation in the exchange rate increased the competitiveness of South African products in the global market. The export price of oranges, soft citrus, lemons and limes (expressed in South African Rand) all increased sharply in 2013, while the price of grapefruits declined substantially as a result of record production levels of high quality fruit, resulting in record export volumes. The demand for grapefruits is inelastic to changes in price levels, resulting in great sensitivity of the price to increased supply levels. Supported by continued depreciation in the value of the Rand, fi rm export prices are projected for the next decade (Figure 10.3). While nominal prices of all citrus products are expected to increase through the outlook, accounting for general infl ation results in relatively constant real prices for oranges, while real gains in the order of 0.5% per annum for soft citrus, 0.6% for lemons and limes
and 1% for grapefruits can be expected through the next decade. Given the dependence of key cost contributors such as shipping costs and packing materials on the weakening exchange rate, costs will also expand substantially through the same period. Responding to fi rm prices in the export market, continued growth in export volumes is projected through the next decade. Oranges continue to dominate the market; growth of 36% in export volumes through the next decade relates to 66% of additional citrus exported by 2023 relative to the base period (2011-2013). Projected growth of 75% in lemon and lime exports through the next 10 years will contribute 20% of additional citrus exports by 2023. Soft citrus (43%) exports are projected to grow faster than grapefruit (26%) due to the higher price received, however grapefruit currently represents a bigger share of the citrus market and the absolute growth in exports for the 2 products through the next decade is similar.

73
BFAP BASELINE • Agricultural Outlook 2014 -2023
Figure 10.3: South African Citrus Export Prices
Figure 10.4: Growth in citrus exports

74
BFAP BASELINE • Agricultural Outlook 2014 -2023
Given South Africa’s dependence on the EU market for exports, the growth illustrated in Figure 10.4 will depend on continued access to the EU market for South African citrus products. Markets have
diversifi ed to some extent through the past decade, however should the EU market close, the outlook would change drastically (Box 10.1).
Box 10.1: Quantifying the impact of EU market closure on the SA Citrus industry8
The European Union accounts for the greatest share of imports in the global citrus market, while South Africa represents the biggest Southern Hemisphere exporter, hence the impact of possible market closure for South African products onto the EU would have signifi cant consequences for the South African industry, as well as the world market. In evaluating the impact of possible market closure on the South African industry, 2 different scenarios were considered; a complete ban where no citrus would be exported to the EU, as well as a partial ban, where citrus produced in citrus black spot (CBS) free regions would still be accepted. In both instances, the scenarios were compared to the baseline in order to isolate the effect of the specifi c scenario.
Scenario 1: Complete banIn the event of a complete ban, the projected decline in the average price of citrus commodities in 2014 ranges from 29% for lemons and 49% for soft citrus. The impact on the average export price for oranges and grapefruit is 37% and 38% respectively. Though the impact declines over time, it remains signifi cant in the long run. While the price effect for oranges is lower than for soft citrus and grapefruits, the sheer dominance of oranges in the citrus market would result in a greater impact for the orange industry than any other. Higher export volumes, as well as the fact that Valencias, which is where the majority of CBS interceptions have occurred in the past, enter the market late, often when a large percentage of other citrus has already been shipped, could increase the impact on the orange industry relative to other citrus products. The simulation resulted in approximately 33% of the products that would ordinarily be exported to Europe being diverted to other destinations, while almost 2% would enter the domestic fresh market, implying an expansion of 8% for the domestic market. Almost 2% would not be produced, as orchard expansion would not occur if returns decreased. The balance of the products would have to enter the processing market, which would have to expand by 80% in order to handle the additional volumes. While South Africa is a price taker in the international market for fruit juice concentrate, implying an insignifi cant effect on prices, the industry does not have the capacity to process 80% more fruit and additional investment to increase capacity is unlikely given the low margins. Returns in the domestic industry, particularly for processing, are much lower than in the export market and the estimated loss to the industry is measured at R4.7 billion in the fi rst year, indicating that 51% of the value of the industry will be lost. Over a fi ve year period the cumulative loss will add to almost R26 billion.
Scenario 2: Partial banThe second scenario considered a partial ban on South African export, where fruit produced in the Western Cape, Northern Cape and the Free State (regions free of CBS) are granted access to the EU. About 17% of area planted to citrus fruit is located in these regions. The impact on average returns in the export market will be less severe under Scenario 2 as price
8 Extract from the report “Quantifying the effect of EU market closure on the South African Citrus Industry”, compiled by BFAP for the Citrus Growers Association in 2013

75
BFAP BASELINE • Agricultural Outlook 2014 -2023
In the event of EU market closure, alternative markets would have to be identifi ed for products and the extent to which products currently destined for the EU can be marketed in other regions differs for various citrus products. Having increased its share in world imports substantially through the past decade, Russia poses the largest opportunity to diversify South African exports. Large population numbers and a growing economy is indicative of fi rm demand growth, however while the supply of oranges and lemons could be expanded, competition from Argentina, Turkey, Egypt and Israel limits the opportunities to expand soft citrus and grapefruit exports into the region. Recent political instability in the region will also concern prospective exporters. Favourable economic prospects in the Middle East and Asia present additional opportunities for
export expansion; South Africa is already the main supplier in the Middle East, however continued instability in the political environment could also hinder further expansion in this region. Entry into Asian markets has been more challenging due to language barriers, logistics and infrastructural challenges. China represents an attractive market but not all citrus varieties, particularly lemons and grapefruits, can handle the cold sterilisation process required in China’s trade protocol. Africa presents an attractive alternative for future expansion, both in terms of spending power and population numbers. Urbanisation is progressing rapidly and the average economic growth in the region is projected to reach well over 5% for the next 5 years. A comprehensive evaluation of possible export markets in Africa is included in Box 10.2.
premiums earned in the EU markets boost average prices. Average prices are projected around break-even levels for oranges and grapefruit, but above break-even levels for soft citrus and lemons. The decline in prices compared to the Baseline is still substantial, ranging between 15% for lemons and 32% for grapefruit. The average decline in the price of soft citrus and orange exports is simulated at 29% and 25% respectively. As with the complete ban, the effect declines over time, but remains signifi cant in the long run. Should the EU close its market only to fruit produced in CBS infected regions, the impact in 2014 is projected to reach R3.2 billion, equalling 34% of the value of the industry. Over a fi ve year period the cumulative effect is estimated at R17.4 billion.
Box 10.2: Identifying attractive African Export Markets through a Market Attractiveness Index (MAI)
In the quest to identify possible high potential export destinations for South African citrus products into Africa, the International Trade Centre’s (ITC) Market Attractiveness Index (MAI) is used. The MAI is an instrument aimed at supporting the selection process of identifying attractive markets from an export perspective (ITC, 2014). According to the OECD (2004), a composite index such as the MAI is formed when individual indicators are compiled into a single index, on the basis of an underlying model of a multi-dimensional concept that is being measured. Thus, in order to identify possible export markets in Africa for select South African agricultural products, a MAI is developed for each product. Figure 1 below shows all the indicators used to construct the MAI in order to generate the fi nal rankings of attractive markets. These indicators are all weighted and standardized to ensure comparability and will contain a value of between 0 and 100 (ITC, 2012). Currently the ITC employs a standard weight for each indicator which is a simple average9.
9 According to the ITC, there is currently no advanced weighting scheme used within the MAI methodology. It should be noted that the same weights for each indicator are used, but improvements to the weights are currently being worked on in order to improve their statistical soundness
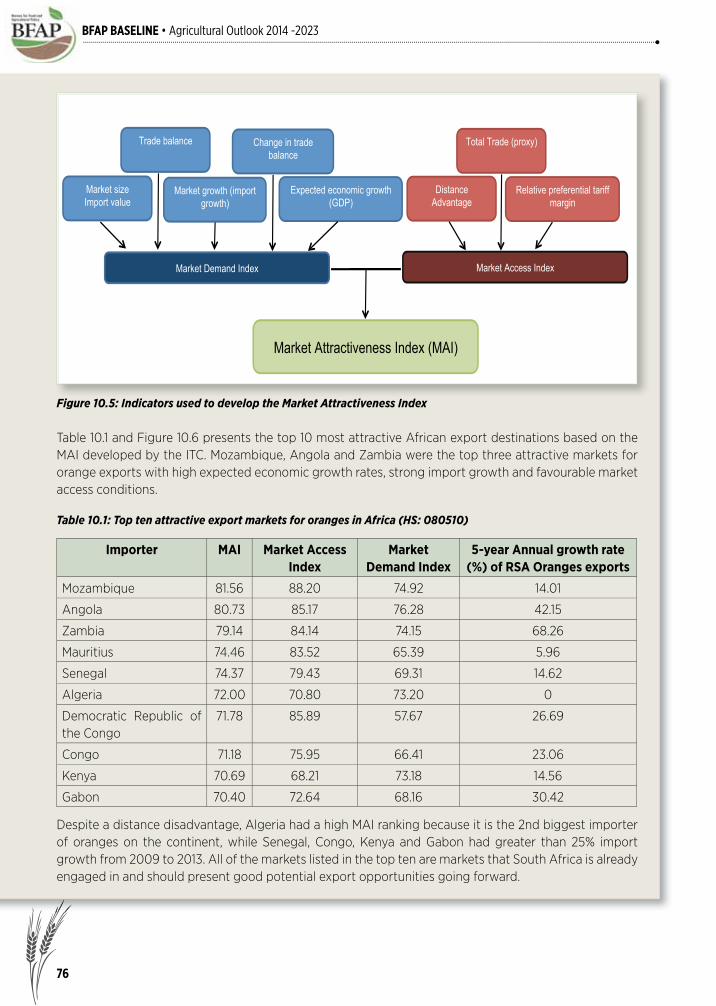
76
BFAP BASELINE • Agricultural Outlook 2014 -2023
Table 10.1 and Figure 10.6 presents the top 10 most attractive African export destinations based on the MAI developed by the ITC. Mozambique, Angola and Zambia were the top three attractive markets for orange exports with high expected economic growth rates, strong import growth and favourable market access conditions.
Market size Import value
Trade balance Change in trade balance
Market growth (import growth)
Expected economic growth (GDP)
Market Demand Index
Total Trade (proxy)
Relative preferential tariff margin
Distance Advantage
Market Access Index
Market Attractiveness Index (MAI)
Figure 10.5: Indicators used to develop the Market Attractiveness Index
Importer MAI Market Access Index
Market Demand Index
5-year Annual growth rate (%) of RSA Oranges exports
Mozambique 81.56 88.20 74.92 14.01
Angola 80.73 85.17 76.28 42.15
Zambia 79.14 84.14 74.15 68.26
Mauritius 74.46 83.52 65.39 5.96
Senegal 74.37 79.43 69.31 14.62
Algeria 72.00 70.80 73.20 0
Democratic Republic of the Congo
71.78 85.89 57.67 26.69
Congo 71.18 75.95 66.41 23.06
Kenya 70.69 68.21 73.18 14.56
Gabon 70.40 72.64 68.16 30.42
Table 10.1: Top ten attractive export markets for oranges in Africa (HS: 080510)
Despite a distance disadvantage, Algeria had a high MAI ranking because it is the 2nd biggest importer of oranges on the continent, while Senegal, Congo, Kenya and Gabon had greater than 25% import growth from 2009 to 2013. All of the markets listed in the top ten are markets that South Africa is already engaged in and should present good potential export opportunities going forward.
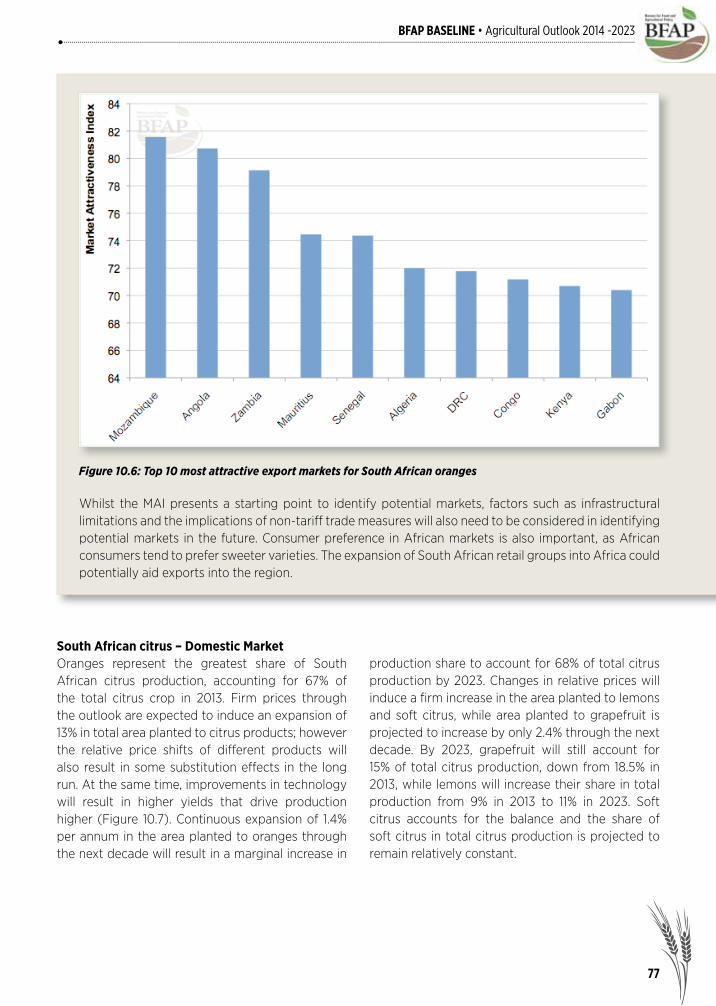
77
BFAP BASELINE • Agricultural Outlook 2014 -2023
Figure 10.6: Top 10 most attractive export markets for South African oranges
Whilst the MAI presents a starting point to identify potential markets, factors such as infrastructural limitations and the implications of non-tariff trade measures will also need to be considered in identifying potential markets in the future. Consumer preference in African markets is also important, as African consumers tend to prefer sweeter varieties. The expansion of South African retail groups into Africa could potentially aid exports into the region.
South African citrus – Domestic MarketOranges represent the greatest share of South African citrus production, accounting for 67% of the total citrus crop in 2013. Firm prices through the outlook are expected to induce an expansion of 13% in total area planted to citrus products; however the relative price shifts of different products will also result in some substitution effects in the long run. At the same time, improvements in technology will result in higher yields that drive production higher (Figure 10.7). Continuous expansion of 1.4% per annum in the area planted to oranges through the next decade will result in a marginal increase in
production share to account for 68% of total citrus production by 2023. Changes in relative prices will induce a fi rm increase in the area planted to lemons and soft citrus, while area planted to grapefruit is projected to increase by only 2.4% through the next decade. By 2023, grapefruit will still account for 15% of total citrus production, down from 18.5% in 2013, while lemons will increase their share in total production from 9% in 2013 to 11% in 2023. Soft citrus accounts for the balance and the share of soft citrus in total citrus production is projected to remain relatively constant.

BFAP BASELINE • Agricultural Outlook 2014 -2023
Figure 10.7: South African citrus production
78
While the demand for South African oranges in the export market has grown rapidly through the past decade, domestic demand for fresh oranges has increased by only 10% through the past 10 years. Continued growth in consumer income levels through the next decade will support growth of 19% in the demand for fresh oranges resulting in more than 155 thousand tons of fresh oranges being consumed by 2023. Despite this increase, domestic fresh orange consumption is still projected to account for only 8% of oranges produced in South Africa. High returns in the export market will restrict domestic supply, supporting price increases inline with infl ation through the next decade, resulting in relatively constant prices in real terms (Figure 10.8). Increased volumes in the processing market results in a smaller increase in prices relative to the fresh market and while the price of oranges destined for the processing market will also increase in nominal terms, accounting for general infl ation results in marginally lower real prices. Supported by substantially higher returns in the export market, the nominal price of soft citrus products is projected to approach R8000/ton by 2023, more than 80% above the 2013 level. Consequently, the domestic demand for soft citrus
is projected to decline marginally through the next decade, as consumers shift towards other, relatively cheaper citrus products. Following exceptional volatility through the past decade, soft citrus volumes distributed into the processing sector are projected to surpass 12 thousand tons by 2023, which remains well below the average levels processed through the past decade (Figure 10.9). The price of processed soft citrus is projected to increase in line with infl ation through the outlook period, resulting in relatively stable prices in real terms. The demand for fresh lemons has expanded by an annual average of 4.3% through the past decade, a trend which is projected to continue in the context of growing income levels and ever expanding population numbers. Fresh domestic consumption is projected to surpass 17 thousand tons by 2023, refl ecting an average annual expansion of 3.5% through the next decade (Figure 10.11). Firm demand will support higher prices; the nominal price for fresh lemons is projected to increase substantially through the next decade, however accounting for general infl ation results in relatively constant prices in real terms. In contrast to fresh consumption domestically and abroad, processing volumes have declined steadily

BFAP BASELINE • Agricultural Outlook 2014 -2023
Figure 10.8: Domestic orange consumption and prices
Figure 10.9: Domestic soft citrus consumption and prices
79

80
BFAP BASELINE • Agricultural Outlook 2014 -2023
Figure 10.10: Domestic soft citrus consumption and prices
Figure 10.11: Domestic lemon and lime consumption and prices
through the past decade. Though the nominal price is expected to increase through the next decade, the average annual increase is projected to be less than infl ation, resulting in a marginal decline in real
terms. Given the fi rm demand for fresh lemons and lower prices in the processing market, processing volumes are expected to continue on a declining trend through the outlook period.

81
BFAP BASELINE • Agricultural Outlook 2014 -2023
Ta b l eG r a p e s
South African outlookYields are historically volatile and following a bumper season in 2011/12, production levels have declined for two consecutive seasons since, despite increased area under production. Production volumes in the 2013/14 production season in particular have been constrained by unfavourable weather conditions, resulting in a decline of 6.2% in production volumes.
RESPONDING TO STRONG DEMAND, particularly in the export market, the area under dry and table grapes in South Africa has expanded continuously through the past decade, reaching 25 872 hectares by 2012. Yields are historically volatile and following a bumper season in 2011/12, production levels have declined for two consecutive seasons since, despite increased area under production. Production volumes in the 2013/14 production season in particular have been constrained by unfavourable weather conditions, resulting in a decline of 6.2% in
production volumes. Baseline projections reveal a consolidation in area planted over the next decade. An average annual expansion of 0.4% per annum results in almost 27 thousand hectares planted to dry and table grapes by 2023. While real returns are projected to increase over the next decade, expansion of the industry remains restricted by the availability of natural resources, particularly water, as well as the projected rise in input costs, which is expected to exceed infl ation over the next 10 years.

82
BFAP BASELINE • Agricultural Outlook 2014 -2023
Table grapes – export marketThe European Union (EU) remains South Africa’s premier export destination for table grapes - more than 80% of South African exports were destined for the EU (including UK) in 2013. Consequently, a sharp depreciation in the value of the Rand against the Euro in 2013 resulted in an increase of 12% in the net export realisation price in 2013. Prices in the EU remain fi rm and while export volumes will be constrained by lower production levels, the combination of higher international prices and a further depreciation in the exchange rate is expected to support high returns in the export market in 2014. While Europe and the UK remains the most important destinations for South African grape exports, the share of total exports destined for the European market has declined from 87% in 2000 to 80% in 2013 (Figure 11.1). Signifi cant expansion has been evident into emerging markets such as Hong Kong, China, Malaysia, Thailand and Russia and exports into destinations other than
Figure 11.1: Export Market for SA fresh grapes
the EU have almost doubled through the past decade. Despite growing import demand in Africa, expansion of South African exports into the African market has been limited, mainly due to limitations in infrastructure required to support the cold chain. South Africa supplied less than 2% of total African imports in 2013. Diversifi cation remains important and given the rapid growth projected for African economies, improved infrastructure could increase the relevance of African markets over the next decade. The International Trade Centre’s market attractiveness index (MAI9) indicates that at present, the most attractive markets for South African grape exports into Africa are Mozambique, Angola and Zambia (Figure 11.2). These markets are characterized by high expected GDP growth rates, favourable tariffs and distance advantages. Angola’s imports of grapes have grown in value from 806 thousand USD in 2009 to 2.95 million USD in 2013.
9 For more information on the Market Attractiveness Index calculated by the International Trade Centre, refer to Box 10.2, where the methodology is detailed

83
BFAP BASELINE • Agricultural Outlook 2014 -2023
Figure 11.2: Market Attractiveness Index for grape exports into Africa
Following substantial growth until the mid-2000’s, production areas in key global markets like Chile have stabilised in recent years and while Peru is still expanding grape exports, supply from Brazil and Argentina has been declining since 2007. In the long term, fi rm demand from rapidly growing emerging economies, combined with stabilizing supply levels is expected to support prices in the global market, despite slower demand growth in traditional markets like the EU. While continued depreciation in the exchange rate is expected to increase the competitiveness of South African grapes in the export market, production remains constrained by limitations in natural resources and high input costs, resulting in a marginal increase in export volumes over the next decade relative to the base period of 2011-2013. Returns in the export market are expected to increase by an annual average of 7.1% over the next decade, which translates into real annual gains of just over 1.5% after accounting for general infl ation.
Table grapes - domestic marketOn the back of fi rm export demand, supply into the
fresh domestic market was limited in 2013, resulting in a price of R9 800 per ton in the domestic market, an increase of more than 20% relative to 2012 levels. With export prices expected to increase further in 2014, the upward trend in domestic prices is expected to continue. Over the next decade, consumer prices for table grapes in South Africa are projected to increase at a rate of 7.8% per annum; a real increase of 2.3% per annum after accounting for general infl ation. This follows an average annual increase of more than 9% through the past decade. While price levels through the past decade were driven mainly by demand conditions, the projected increase through the coming decade will be a result of both growing demand and stabilising supply. Returns in the local market remains signifi cantly lower compared to potential returns in the export market, limiting the amount of fresh grapes delivered domestically. As a result of fi rm prices in all market segments, the share of domestically produced grapes entering the processed market is projected to remain relatively stable through the next 10 years.

84
BFAP BASELINE • Agricultural Outlook 2014 -2023
Figure 11.3: Local market for SA fresh grapes

85
BFAP BASELINE • Agricultural Outlook 2014 -2023
Apples &Pears
South African outlookBaseline projections indicate an upward trend in area planted to bearing apple trees, surpassing 21 thousand hectares by 2023. Area expansion, combined with continuous improvements in productivity levels, results in production levels of more than 950 thousand tons by 2023; an increase of 17.6%.
THE SOUTH AFRICAN APPLE AND PEAR industries experienced a phenomenal season during 2013 in terms of record production volumes, quality and prices. Unfortunately the 2014 season was constrained by a number of factors including fruit quality, the demand for imports in Europe and the production potential of the fruit industries. Untimely hail and rainfall during November 2013 affected the quality in several major producing areas, thereby reducing the volume of export-quality apples and pears produced during the season. Despite the South African Rand depreciating further during 2014, export prices are expected to increase only marginally due to healthy apple and pear stocks in European markets and the lower overall quality of the South African crop. The 2014 production season was a biennial bearing “off” season, a period during which the physiological processes of the apple and
pear trees depress the production of fruit, which limited the potential production of both crops. Baseline projections indicate an upward trend in area planted to bearing apple trees, surpassing 21 thousand hectares by 2023. Area expansion, combined with continuous improvements in productivity levels, results in production levels of more than 950 thousand tons by 2023; an increase of 17.6% relative to the base period of 2011 to 2013 (Figure 12.1). Area planted to bearing pear trees is projected to decline over the next ten years, from 10 735 hectares in 2013 to just under 10 thousand hectares in 2023. While productivity is expected to increase through the next decade, production volumes are still projected to decline marginally, reaching almost 360 thousand tons by 2023; 0.7% down from the base period.
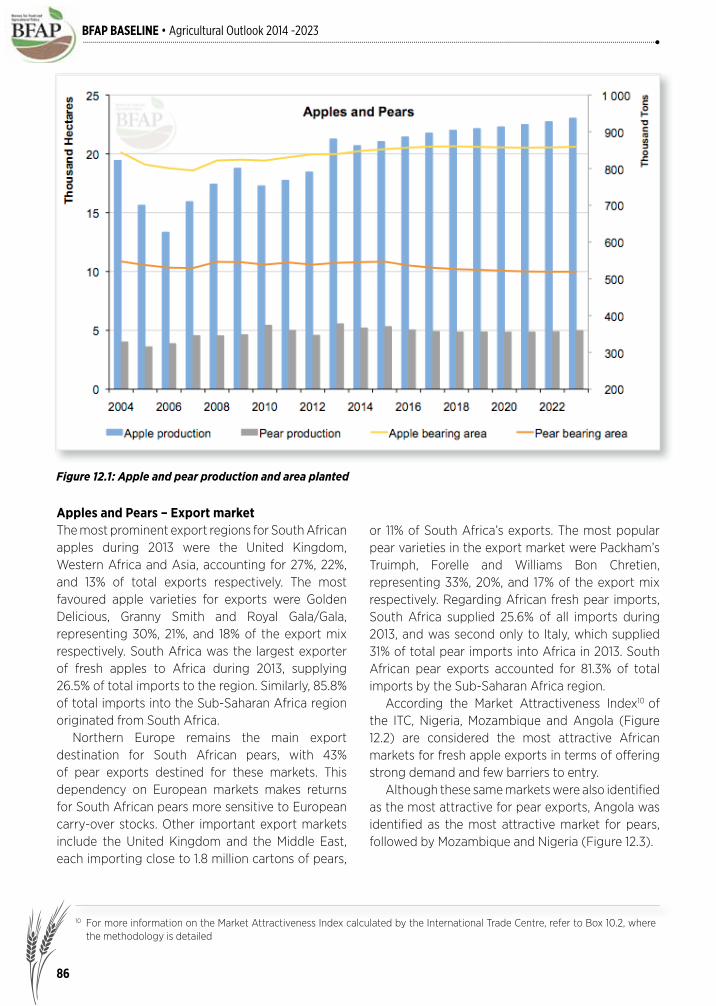
86
BFAP BASELINE • Agricultural Outlook 2014 -2023
Apples and Pears – Export marketThe most prominent export regions for South African apples during 2013 were the United Kingdom, Western Africa and Asia, accounting for 27%, 22%, and 13% of total exports respectively. The most favoured apple varieties for exports were Golden Delicious, Granny Smith and Royal Gala/Gala, representing 30%, 21%, and 18% of the export mix respectively. South Africa was the largest exporter of fresh apples to Africa during 2013, supplying 26.5% of total imports to the region. Similarly, 85.8% of total imports into the Sub-Saharan Africa region originated from South Africa. Northern Europe remains the main export destination for South African pears, with 43% of pear exports destined for these markets. This dependency on European markets makes returns for South African pears more sensitive to European carry-over stocks. Other important export markets include the United Kingdom and the Middle East, each importing close to 1.8 million cartons of pears,
Figure 12.1: Apple and pear production and area planted
or 11% of South Africa’s exports. The most popular pear varieties in the export market were Packham’s Truimph, Forelle and Williams Bon Chretien, representing 33%, 20%, and 17% of the export mix respectively. Regarding African fresh pear imports, South Africa supplied 25.6% of all imports during 2013, and was second only to Italy, which supplied 31% of total pear imports into Africa in 2013. South African pear exports accounted for 81.3% of total imports by the Sub-Saharan Africa region. According the Market Attractiveness Index10 of the ITC, Nigeria, Mozambique and Angola (Figure 12.2) are considered the most attractive African markets for fresh apple exports in terms of offering strong demand and few barriers to entry. Although these same markets were also identifi ed as the most attractive for pear exports, Angola was identifi ed as the most attractive market for pears, followed by Mozambique and Nigeria (Figure 12.3).
10 For more information on the Market Attractiveness Index calculated by the International Trade Centre, refer to Box 10.2, where the methodology is detailed

87
BFAP BASELINE • Agricultural Outlook 2014 -2023
Figure 12.2: Top ten attractive export markets for apples (HS:080810)
Figure 12.3: Top ten attractive export markets for pears (HS:080810)

88
BFAP BASELINE • Agricultural Outlook 2014 -2023
Hortgro crop estimates indicate that apple and pear exports will surpass 366 thousand tons and 173 thousand tons respectively during 2014. Relative to exports recorded during 2013, these represent a decline of 10.7% and 6.4% in apple and pear shipments respectively. The World Apple and Pear Association (WAPA) estimates that Southern Hemisphere exports of apples will grow by 4% during 2014, mainly driven by the 15% and 12% increases in exports from Chile and Brazil. For pears, WAPA estimates that exports from these exporters will decline by 4%, mainly due to reductions in export supply from Argentina and South Africa. Over the next decade, the volume of South African apple exports is expected to grow by 20.75% relative to the base period, while the volume of pears being exported is projected to decline by 0.63% (Figure 12.4). Carry-over stocks of apples in the United States are 5% lower than 2013 stock levels, while the European apple and pear stocks are up by 51% and 111% respectively year-on-year. This implies relatively full markets, exerting downward pressure on export prices. When coupled with the further
depreciation of the Rand in 2014, returns to producers are marginally higher than the previous season. The average price for apple exports during 2014 is projected to increase by around 1.3% from 2013 prices, while the average pear export price is projected to strengthen by 1% year-on-year. Following a marginal decline in 2015 resulting from a stronger Rand, prices are projected to increase on average by 6.1% and 5.7% respectively for both apples and pears (Figure 12.4). Considering that the average infl ation rate is assumed to be 5.6% per year, these price increases translate into annual real price gains in the order of 0.5% for apples and 0.1% for pears. Figure 12.4 illustrates that the price of apples is projected to overtake pear prices by 2021. Given the expansion of South African exports into African and Asian markets, the impact of Northern Hemisphere stocks on apple export prices is expected to weaken over the next decade. Similarly, other Southern Hemisphere apple exporters are expanding into new markets, away from the main South African export destinations.
Figure 12.4: SA exports: volumes and nominal prices

89
BFAP BASELINE • Agricultural Outlook 2014 -2023
Apples and Pears – Domestic marketQuality defects caused by adverse weather through the spring of 2013 are projected to shift fruit originally intended for export markets into the domestic fresh produce and processed markets. The share of domestic apple production allocated to domestic fresh produce markets is expected to increase from 23% in 2013 to 24.6% during 2014. Similar to the expected trend in export prices, domestic prices for fresh apples are projected to increase more slowly during 2014, increasing only 3.4% year-on-year. A greater share of the diverted exports will however move to the processed markets, increasing the share of the 2014 apple crop consumed by these markets to 32.9%, up from the 30.3% consumed during 2013. Over the baseline period prices for fresh apples are projected to increase on average by 6.5% per annum (Figure 12.5). Apple price infl ation is projected to exceed consumer price infl ation by 0.9% per annum, which is driven by projected increases in real consumer incomes. Prices for apples used for processing are projected to increase on average by 6.1% per annum, exceeding consumer price infl ation by 0.5% per annum. Driven by changes in relative
prices in domestic as well as export markets, the volume supplied to the domestic fresh produce market is expected to grow by 7.9% over the next 10 years relative to the base period, while volumes supplied to the processed markets are projected to grow by 21.6% over the same period. For pears, the share of production distributed to domestic fresh produce markets is expected to remain stable at 13% during 2014. The average domestic price for fresh pears is projected to grow by 3.2% year-on-year. As in the case of apples, a greater share of the blemished pears will move into the processing markets, causing the share of the pear crop being processed to increase from 35.1% to 37% between 2013 and 2014. During the next decade prices for fresh pears and pears used for processing are estimated to expand by 6.6% and 6.5% respectively on an annual basis (Figure 12.5). By 2023, pears sold in fresh produce markets are expected to decline by 13%, whereas the volume of pears used for processing is estimated to grow by 12% relative to the base period of 2011 to 2013.
Figure 12.5: Local market for SA apples and pears

90
BFAP BASELINE • Agricultural Outlook 2014 -2023
ConsumerTrends andAnalysis
South African outlookGeneral information on the demographic characteristics of South African consumers, dynamic changes in South Africa from a socio-economic perspective, preference trends affecting the food choices of particularly middle and high income consumers and consumption trends for income groups over time enrich the modelling projections presented in this edition of the BFAP baseline.
INTRODUCTION
THE SOUTH AFRICAN CONSUMER landscape over the last year was characterised by:
• Mounting pressure on the consumers’ Rand, due to fi nancial pressure caused by rising prices of a wide range of commodities, but particularly fuel and food;
• Nutritional dilemmas, e.g. increasing obesity;• Increased levels of consumer debt;• Negative consumer sentiment fuelled by events
such as strikes, crime and electricity load shedding;
• An increasing awareness of consumer protection with a particular focus on the Consumer Protection Act and the new Food Labelling Legislation;
• ‘Food scares’ emerging in the local food sector with a meat scandal related to processed meat
products contaminated by other species not listed on product labels.
This chapter presents a discussion of the dynamic South African consumer landscape in order to enrich the modelling projections presented in this edition of the BFAP baseline. The analysis presented in this chapter includes general information on the demographic characteristics of South African consumers, dynamic changes in South Africa from a socio-economic perspective, preference trends affecting the food choices of particularly middle and high income consumers and consumption trends for income groups over time. The chapter concludes with a special section dealing with the analysis of food security in South African from a trade vulnerability perspective.
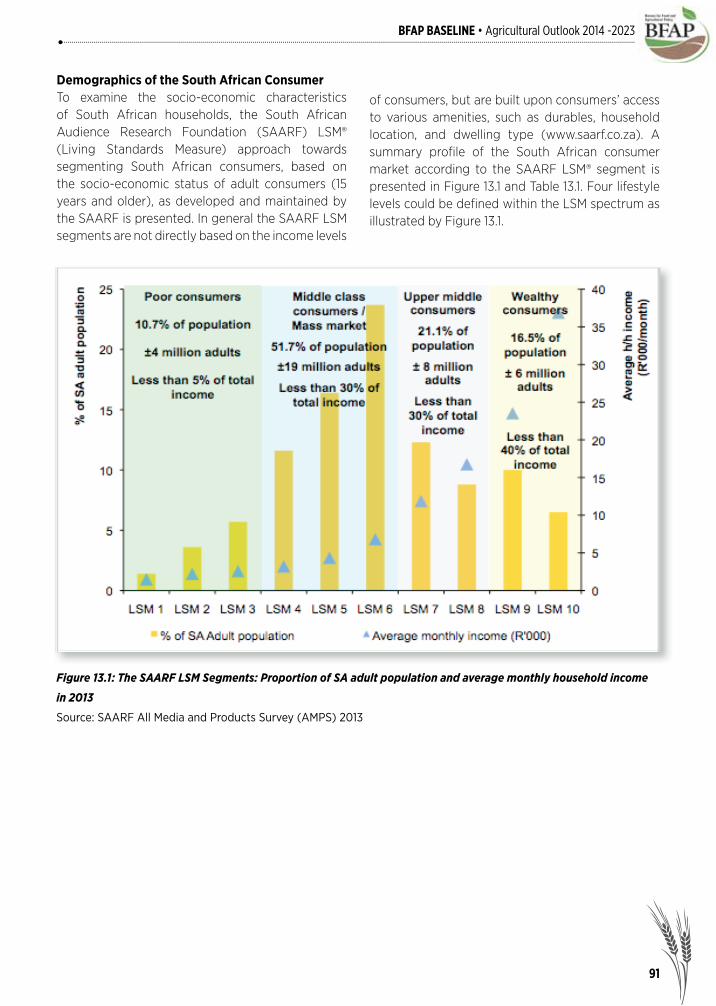
91
BFAP BASELINE • Agricultural Outlook 2014 -2023
Demographics of the South African ConsumerTo examine the socio-economic characteristics of South African households, the South African Audience Research Foundation (SAARF) LSM® (Living Standards Measure) approach towards segmenting South African consumers, based on the socio-economic status of adult consumers (15 years and older), as developed and maintained by the SAARF is presented. In general the SAARF LSM segments are not directly based on the income levels
of consumers, but are built upon consumers’ access to various amenities, such as durables, household location, and dwelling type (www.saarf.co.za). A summary profi le of the South African consumer market according to the SAARF LSM® segment is presented in Figure 13.1 and Table 13.1. Four lifestyle levels could be defi ned within the LSM spectrum as illustrated by Figure 13.1.
Figure 13.1: The SAARF LSM Segments: Proportion of SA adult population and average monthly household income
in 2013
Source: SAARF All Media and Products Survey (AMPS) 2013

92
BFAP BASELINE • Agricultural Outlook 2014 -2023
LSM
®:%
of
SA
adul
ts*:
Ave
rage
ho
useh
old
mon
thly
in-
com
e*:
Dom
inan
t ag
e gr
oups
*:D
omin
ant
educ
atio
n le
vel*
:
Dom
inan
t lo
cati
on (
rura
l/ur
ban)
*:
Dom
inan
t Pr
ovin
cial
lo
cati
on*:
Une
m-
ploy
men
t %
– s
elf
repo
rted
*:
Dom
inan
t dw
ellin
g ty
pe*:
Elec
tric
ity
in h
ome
*:Ta
p w
ater
in
hom
e /
on p
lot*
:
11.4
%R
1 480
50+
(38%
)15
-24
(24%
)U
p to
prim
a-ry
com
plet
ed
(42%
)So
me
high
sc
hool
ing
(36%
)
Mos
tly ru
ral,
som
e ur
ban
E C
ape
(61%
)K
ZN (
28%
)40
.6%
Trad
ition
al h
ut
(80
%)
27%
0%
23.
6%R
2 21
850
+ (3
2%)
15-2
4 (2
6%)
Som
e hi
gh
scho
olin
g (4
2%)
Up
to p
rima-
ry c
ompl
eted
(3
9%)
Mos
tly ru
ral,
som
e ur
ban
E C
ape
(37%
)K
ZN (
33%
)Li
mpo
po
(10
%)
45.5
%Tr
aditi
onal
hut
(4
7%)
Hou
se/c
lust
er
hous
e/ to
wn
hous
e (2
8%)
35%
12
%
35.
7%R
2 58
515
-24
(30
%)
25-3
4 (2
7%)
Som
e hi
gh
scho
olin
g (5
2%)
Up
to p
rima-
ry c
ompl
eted
(2
6%)
Mos
tly ru
ral,
som
e ur
ban
KZN
(32
%)
E C
ape
(25%
)Li
mpo
po
(12%
)
45.4
%Tr
aditi
onal
hut
(3
8%)
Hou
se/c
lust
er
hous
e/to
wn
hous
e (3
5%)
69%
29%
411.
6%R
3 20
515
-24
(30
%)
50+
(29%
)So
me
high
sc
hool
ing
(51%
)U
p to
prim
a-ry
com
plet
ed
(23%
)
Mos
tly ru
ral,
som
e ur
ban
KZN
(26
%)
Lim
popo
(2
3%)
E C
ape
(17%
)
43.0
%H
ouse
/clu
ster
ho
use/
tow
n ho
use
(60
%)
Trad
ition
al h
ut
(17%
)
93%
52%
Tabl
e 13
.1: A
sum
mar
y of
the
Sout
h A
fric
an c
onsu
mer
mar
ket i
n 20
13 b
ased
on
the
SAA
RF
LSM
seg
men
ts
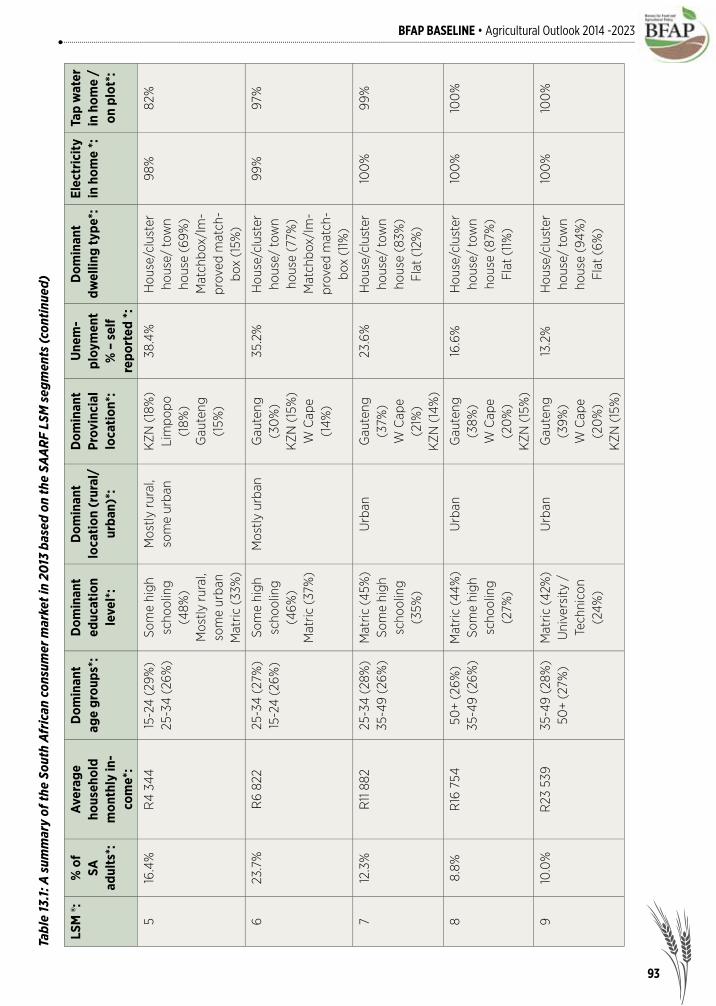
93
BFAP BASELINE • Agricultural Outlook 2014 -2023Ta
ble
13.1
: A s
umm
ary
of th
e So
uth
Afr
ican
con
sum
er m
arke
t in
2013
bas
ed o
n th
e SA
AR
F LS
M s
egm
ents
(con
tinu
ed)
LSM
®:%
of
SA
adul
ts*:
Ave
rage
ho
useh
old
mon
thly
in-
com
e*:
Dom
inan
t ag
e gr
oups
*:D
omin
ant
educ
atio
n le
vel*
:
Dom
inan
t lo
cati
on (
rura
l/ur
ban)
*:
Dom
inan
t Pr
ovin
cial
lo
cati
on*:
Une
m-
ploy
men
t %
– s
elf
repo
rted
*:
Dom
inan
t dw
ellin
g ty
pe*:
Elec
tric
ity
in h
ome
*:Ta
p w
ater
in
hom
e /
on p
lot*
:
516
.4%
R4
344
15-2
4 (2
9%)
25-3
4 (2
6%)
Som
e hi
gh
scho
olin
g (4
8%)
Mos
tly ru
ral,
som
e ur
ban
Mat
ric (
33%
)
Mos
tly ru
ral,
som
e ur
ban
KZN
(18
%)
Lim
popo
(1
8%)
Gau
teng
(1
5%)
38.4
%H
ouse
/clu
ster
ho
use/
tow
n ho
use
(69%
)M
atch
box/
Im-
prov
ed m
atch
-bo
x (1
5%)
98%
82%
623
.7%
R6
822
25-3
4 (2
7%)
15-2
4 (2
6%)
Som
e hi
gh
scho
olin
g (4
6%)
Mat
ric (
37%
)
Mos
tly u
rban
Gau
teng
(3
0%
)K
ZN (
15%
)W
Cap
e (1
4%)
35.2
%H
ouse
/clu
ster
ho
use/
tow
n ho
use
(77%
)M
atch
box/
Im-
prov
ed m
atch
-bo
x (1
1%)
99%
97%
712
.3%
R11
882
25-3
4 (2
8%)
35-4
9 (2
6%)
Mat
ric (4
5%)
Som
e hi
gh
scho
olin
g (3
5%)
Urb
anG
aute
ng
(37%
)W
Cap
e (2
1%)
KZN
(14
%)
23.6
%H
ouse
/clu
ster
ho
use/
tow
n ho
use
(83%
)Fl
at (
12%
)
100
%99
%
88.
8%R
16 7
5450
+ (2
6%)
35-4
9 (2
6%)
Mat
ric (4
4%)
Som
e hi
gh
scho
olin
g (2
7%)
Urb
anG
aute
ng
(38%
)W
Cap
e (2
0%
)K
ZN (
15%
)
16.6
%H
ouse
/clu
ster
ho
use/
tow
n ho
use
(87%
)Fl
at (
11%)
100
%10
0%
910
.0%
R23
539
35-4
9 (2
8%)
50+
(27%
)M
atric
(42%
)U
nive
rsity
/
Tech
nico
n (2
4%)
Urb
anG
aute
ng
(39%
)W
Cap
e (2
0%
)K
ZN (
15%
)
13.2
%H
ouse
/clu
ster
ho
use/
tow
n ho
use
(94%
)Fl
at (
6%)
100
%10
0%

94
BFAP BASELINE • Agricultural Outlook 2014 -2023
Dynamics in the South African consumer environment: RISING INCOME
Average household income: % change over
time2005/06: 2010/11:
R6 215/hh/month
R9 962/hh/month
+60.3% nominal ↑; +32.3% real ↑
Median household income: % change over
time2009: 2013:
R 6 928/hh/month
R10 609/hh/month
+53.1% nominal ↑; +30.9% real ↑
• What can we learn from StatsSA IES data from 2005 to 2010?
• What can we learn from SAARF LSM AMPS data over the last 5 years?
Stats SA indicates that income gains could likely be higher than reported, as consumers could easily
Figure 13.2: LSM class mobility: All adults for the period 2004 to 2013
Source: SAARF All Media and Products Surveys (AMPS) 2004 to 2013
Figure 13.2: LSM class mobility: All adults for the period 2004 to 2013
under report their income due to factors such as forgetfulness or out of misplaced concern that the information they report might be shared with the taxation authority.
CLASS MOBILITY
Class mobility is a reality within the South African consumer market, where consumers move towards higher LSM groups driven by economic growth as well as socio-economic empowerment. From 2004 to 2013 the share of South African adults within SAARF LSM® segments 1-4 declined (-56%), accompanied by an increase in the share of the adult population classifi ed within wealthier segments such as LSM 6 (+69%), LSM 7 (+99%), LSM 8 (+82%), and LSM 9 (+68%) (Figure 13.2). In recent years the class mobility rate has been variable, but generally increasing in most socio-economic sub-groups after slowing down from 2007/2008 up to 2009/2010 due to recession impacts.

95
BFAP BASELINE • Agricultural Outlook 2014 -2023
Figure 13.3: LSM ethnic class mobility: All adults for the periods 2007 vs 2013
Source: SAARF All Media and Products Surveys (AMPS) 2007 & 2013
What about ethnic class mobility in South Africa?The increasingly expanding higher LSM segments (LSM 7 upwards) have a growing black consumer component, as illustrated by Figure 13.3, indicating that from 2007 to 2013 the share of black consumers in LSM 7 and 8 increased by 24%, while the share of black consumers in LSM 9 and 10 increased by 108%.
URBANISATIONAbout two thirds of the South African population is urbanised.
AGE DISTRIBUTION• South Africa has a relatively youthful population
with 49% of the population being younger than 25 years of age and 67% of the population being younger than 35 years of age (Census 2011).
• The population is gradually ageing as evident from the median population age data. Furthermore, from 2001 to 2011 the share of the older population (50 years and older) increased by 16% (Stats SA, 2012b).
Source: Urban share of population: Comments:
Initial value: Recent value:
Stats SA Census 1990: 52% 2011: 62% +19% ↑ over 21 years / +0.9% ↑ per annum
Stats SA IES 2005: 65% 2010: 67% 3% ↑ over 5 years /+0.6% ↑ per annum
SAARF LSM AMPS 2009: 60% 2013: 64% 6% ↑ over 5 years /+1.3% ↑ per annum

96
BFAP BASELINE • Agricultural Outlook 2014 -2023
Median population age:Census 1996 Census 2001 Census 2011
22 years 23 years 25 years
EDUCATION LEVELS• Education levels in South Africa have improved
signifi cantly from 2009 to 2013, with a 51% reduction in the number of adults with no education, and signifi cant increases in the number of adults with some high schooling, matric and post-matric qualifi cations (SAARF AMPS 2009 & 2013).
• Nevertheless, the quality of education still remains a major concern, especially in maths and science where South Africa has been performing poorly in the latest benchmark in educational programs across the continent.
• The most prominent increases in the share of consumers within LSM sub-segments with particular education levels occurred in terms of:
o LSM 1-3: Primary schooling and some high schooling
o LSM 4-6: Some high schooling and matrico LSM 7-8: Matric and post-matric qualifi cationo LSM 9-10: Post-matric qualifi cation
Figure 13.4: Education levels of the South African population: 2009 vs 2013
Source: SAARF All Media and Products Surveys (AMPS) 2009 & 2013

97
BFAP BASELINE • Agricultural Outlook 2014 -2023
UNEMPLOYMENT
Source: Unemployment rate: Comments:
Initial value: Recent value:
Census data 2001: 41.6% 2011: 29.8% Decreasing trend in all provinces
Stats SA Quarterly Labour Force Survey
Q3 2010: 25.4% Q4 2013: 24.1% Decreasing trend from a high point in Q3 2010
• At provincial level the lowest unemployment levels were found in Western Cape (21.6%) and Gauteng (26.3%), while the highest unemployment levels were found in Limpopo (38.0%) and Eastern Cape (37.4%) (Census 2011).
• According to SAARF AMPS data for 2013, the national unemployment rate was 31%, which varied from as high as 46% in the poorest segments to around 5% in the wealthiest segments.
DEBTSouth African consumers have been moving consistently deeper into debt toward the fourth quarter of 2013 with the following changes occurring from early 2009:
• The total Rand value of credit granted increased by 134.2% to R118.7 billion;
• The number of credit applications received increased by 92.5%;
• The credit application rejection rate increased by 29.4% to 57.4%;
• The number of active credit accounts increased by 19.4% to R41.3 million.
• The mounting pressure on consumer expenditure
is also evident from the consumer confi dence index, which has deteriorated over the past three years to an all-time low in the fourth quarter of 2013.
In is interesting to note that in 2013 up to 50% of credit facilities was granted to consumers with less than R5500 income per month, while these credit grants contributed about 23% in value terms (National Credit Regulator statistics, 2013).
NUTRITIONAL STATUSFrom a nutritional perspective South Africa is characterised by a continued double burden of over- and under nutrition. Recent fi ndings (SANHANES-1, 2013a) indicate increasing rates of overweight and obesity (23.6% of girls and 16.2% of boys between the ages of 2 and 14 years) co-existing with persistent vitamin A (43.6%) and iron (9.2%) defi ciencies in children. The majority of South African adults, and especially women, are overweight (24.8%) or obese (39.2%), while many women also suffer from the consequences of micronutrient defi ciencies, i.e. anaemia (22%) and vitamin A defi ciency (13.3%).
IN SHORT, THE DYNAMIC SOUTH AFRICAN CONSUMER LANDSCAPE
OVER THE LAST FEW YEARS HAS BEEN CHARACTERISED BY:
• Growing real household income across most income groups• Class mobility, particularly evident in the growing middle class and growing upper-income
segments (to a lesser extent)• Ethnic mobility, particularly evident in the upward movement of black consumers to LSM
segment 7 to 10• Gradually increasing urbanisation• A relatively youthful, but gradually aging population• Overall improved education levels over time, yet declining education quality • Some decrease in unemployment over time• Increasing consumer debt• A continued double burden of over- and under nutrition

98
BFAP BASELINE • Agricultural Outlook 2014 -2023
Changing food consumption patterns in South Africa: Dominant preference trends in the global & South African food landscapes
International perspective: Current prominent manifestations of mega-trends:
Health• Continued growth in high protein diets and
consumers’ seeking natural protein in convenient products.
• Protein increasingly recognised as a ‘good ingredient’.
• General focus on health maintenance and disease prevention through better food choices. Furthermore nutrition is increasingly recognised as the answer to the healthcare budget crises globally.
• Less ‘bad’ ingredients – less sugar in foods.• ‘Free from’ foods – e.g. gluten free• In the light of numerous recent food scares,
consumers demand higher quality (often more local) ingredients with clear traceability.
• Energy foods remain importanto Energy drink described as recession proof, as
consumers can feel the immediate benefi t of consuming these products.
o Increasing focus on slow-release energy foods.
• New ‘super-foods’ – nature’s functional foods (revisiting fruit, vegetables, grains).
• Food aiding in weight management is becoming mainstream.
Convenience• The ‘snackifi cation of everything’• ‘One-stop convenience’: easy to cook / prepare
but offering consumers the ‘feel-good’ experience of making the end product e.g. cooking mix seasoned oven bag that consumer add raw chicken and vegetables to before cooking.
• More use of technology: e.g. more on-line food purchasing and growth in popularity of smart phone apps to make consumers’ lives more convenient.
Indulgence• Consumers want tasty food, not only healthy and
convenient.• Incorporating ‘foraged, hyper-local’ ingredients
into foods e.g. seaweed, truffl e, wild mushrooms, blackberries expected to begin appearing in familiar products.
• Simplifi cation indulgence: getting more pleasure from simpler foods.
• Internationalism – interest in food from other cultures / countries.
• Affordable luxury items.
Natural • Naturally / intrinsic health benefi ts of foods.• Natural food moving from health shops to
mainstream retailers, e.g. caffeine-free products delivering energy or relaxation with protein, vitamins and benefi cial ingredients.
• Fewer and simpler ingredients, clean labels (free from…).
• Dairy an important healthy whole food.• ‘Unplugging’ from technology from time to time,
getting back to the ‘real world’.
Sustainability• Reduce food loss or waste (food loss during
production and food waste at the retailer and consumer levels).
• Interest in ingredients derived from the waste stream.
• Consumers are increasingly looking to connect with products that do not associate with negative environmental and social impacts.
From a South African perspective…New food products are developed to address consumers’ needs, which are in turn strongly affected by consumer preference trends. Thus in order to investigate the leading food trends in South Africa, this section presents an analysis of preference trends refl ected in new food products launched on the South African market since January 2012 which were entered into the Symrise / Food Review New Product Competition (NPC) in 2013 (Food Review magazine, various articles). Results are also compared with previous years (Tables 13.2 and 13.3). The latest analysis covered the following product categories: non-alcoholic beverages, alcoholic beverages, snack foods, jam, baby food, yoghurt, cheese, ready-to-eat food, canned food, sauces, salt and sweetener. Most of these products are most likely targeting

99
BFAP BASELINE • Agricultural Outlook 2014 -2023
the upper middle and wealthy consumer segments, with the exception of canned fruit salad and braai sauce fl avoured baked beans which might appeal to a wider target market. Among the 2013 new products the most prominent trends (in order of importance) were indulgence, closely followed by health and convenience. Indulgence has been a prominent trend among the new products since 2010.
Main trend: Share of new products in specifi c year
2013 (n=16)
2012(n=20)
2011(n=6)
2010(n=20)
2009(n=6)
2008(n=8)
2007(n=9)
2006(n=10)
Health 75% 55% 83% 50% 83% 38% 33% 60%
Convenience 75% 85% 67% 75% 67% 38% 56% 70%
Indulgence 94% 95% 83% 80% 67% 50% 89% 80%
Local 13% 10% 33% 20% 33% 25% 11% -
Sustainability 6% 15% 17% 20% 17% - - 10%
* Percentages in columns add up to more than 100% due to ‘double-positioning’ in food products.
The prominence of double positioning strategies, where products are based on two or more food trends to better target consumers’ complex needs, should be noted. Among the 2013 new products the most prominent trend combinations included: Indulgence +health +convenience: 44% of products; Indulgence +health: 25%; Indulgence +convenience: 25%.
Table 13.2: Consumer food trends addressed by the NPC products, 2006 – 2013*
Table 13.3: Consumer food trend manifestations among the 2013 NPC products
Main trend: Trend manifestations :
Indulgence Most prominent manifestations:* Extensive and tasty product range options
Other examples observed (in order of importance):* Luxurious products* Indulging in home-prepared sophisticated food* Enjoying food from other cultures* Indulging in fresh / high quality ingredients.
Health / well-being Most prominent manifestation:
* ‘Minus’ claims (less / no ‘bad’ ingredients) (e.g. No preservatives; Less salt; Gluten-free; Soya-free; Less sugar; Aspartame-free; No MSG; Cholesterol-free, Trans-fat-free; Alcohol-free sparkling wine)
Other examples observed (in order of importance):
* Naturalness (e.g. Naturally healthy fruit juice not made from concentrate, unfi ltered and unpasteur-ised; Popcorn with natural ingredients; Naturally healthy yoghurt)* Dieting (e.g. Low fat; Less fat; Less sugar; Low kJ sweetener; High in fi bre)* Organic food (e.g. Organic baby food range)
Convenience Most prominent manifestations:* Convenience associated with a wide product range choice* Ready-to-eat / Ready-to-heat-and-eat foods
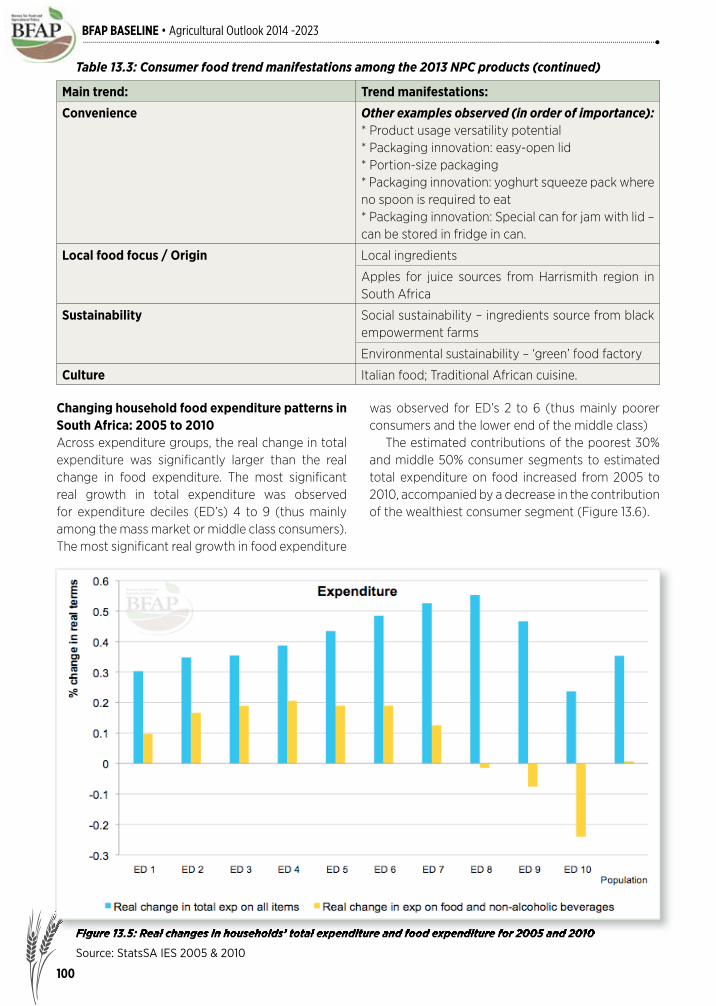
100
BFAP BASELINE • Agricultural Outlook 2014 -2023
Main trend: Trend manifestations:
Convenience Other examples observed (in order of importance):* Product usage versatility potential* Packaging innovation: easy-open lid* Portion-size packaging* Packaging innovation: yoghurt squeeze pack where no spoon is required to eat* Packaging innovation: Special can for jam with lid – can be stored in fridge in can.
Local food focus / Origin Local ingredients
Apples for juice sources from Harrismith region in South Africa
Sustainability Social sustainability – ingredients source from black empowerment farms
Environmental sustainability – ‘green’ food factory
Culture Italian food; Traditional African cuisine.
Changing household food expenditure patterns in South Africa: 2005 to 2010Across expenditure groups, the real change in total expenditure was signifi cantly larger than the real change in food expenditure. The most signifi cant real growth in total expenditure was observed for expenditure deciles (ED’s) 4 to 9 (thus mainly among the mass market or middle class consumers). The most signifi cant real growth in food expenditure
was observed for ED’s 2 to 6 (thus mainly poorer consumers and the lower end of the middle class) The estimated contributions of the poorest 30% and middle 50% consumer segments to estimated total expenditure on food increased from 2005 to 2010, accompanied by a decrease in the contribution of the wealthiest consumer segment (Figure 13.6).
Figure 13.5: Real changes in households’ total expenditure and food expenditure for 2005 and 2010
Source: StatsSA IES 2005 & 2010
Figure 13.5: Real changes in households’ total expenditure and food expenditure for 2005 and 2010
Table 13.3: Consumer food trend manifestations among the 2013 NPC products (continued)
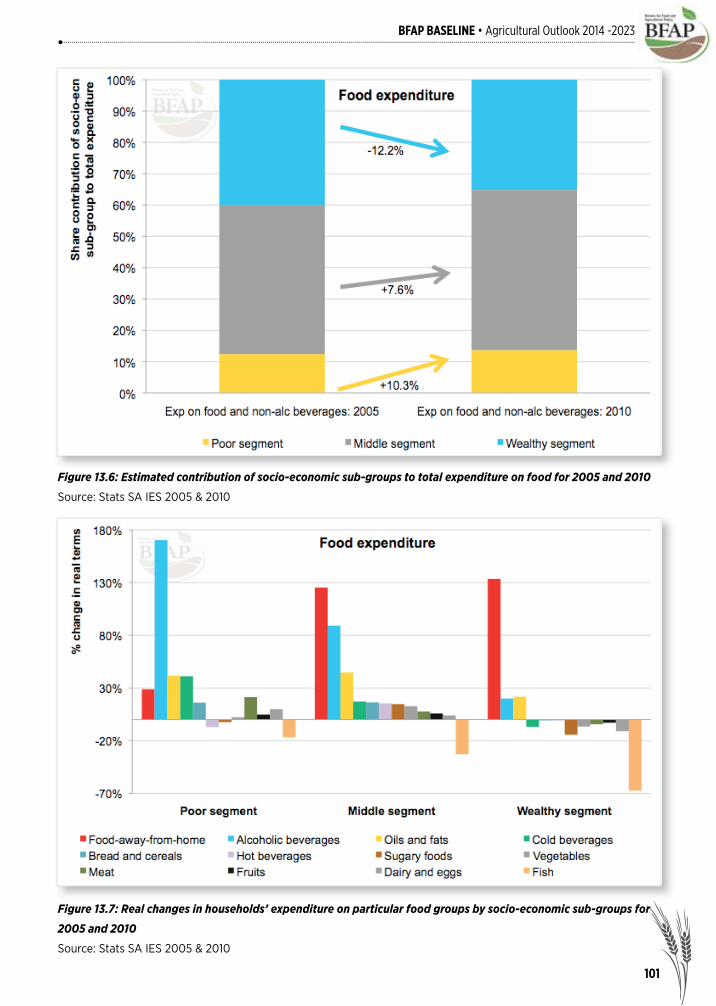
101
BFAP BASELINE • Agricultural Outlook 2014 -2023
Figure 13.6: Estimated contribution of socio-economic sub-groups to total expenditure on food for 2005 and 2010
Source: Stats SA IES 2005 & 2010
Figure 13.7: Real changes in households’ expenditure on particular food groups by socio-economic sub-groups for
2005 and 2010
Source: Stats SA IES 2005 & 2010
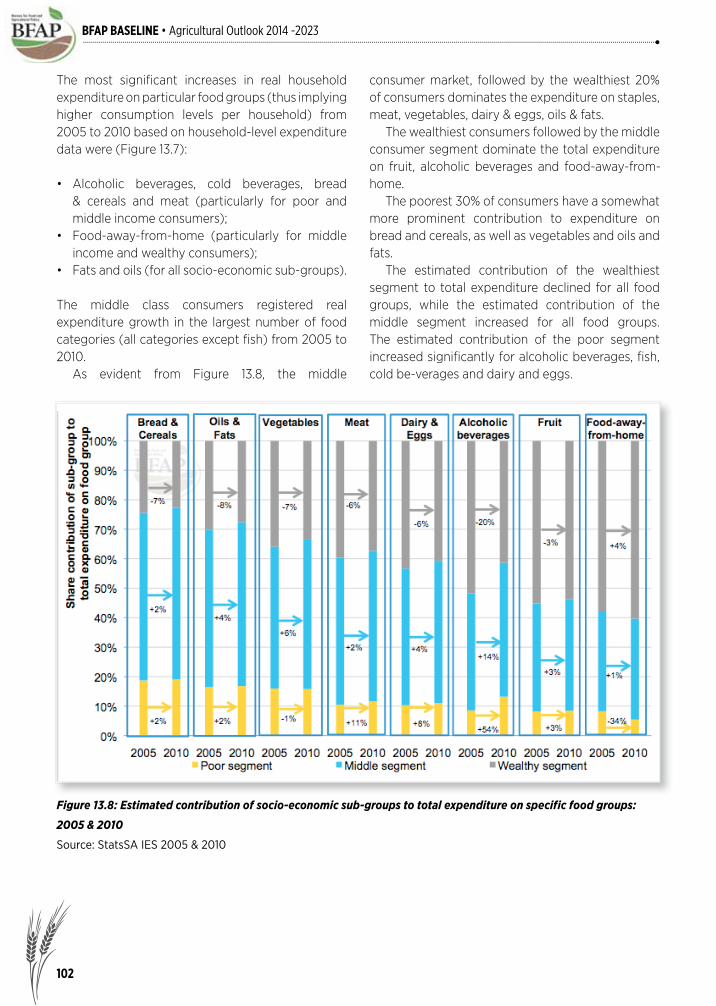
102
BFAP BASELINE • Agricultural Outlook 2014 -2023
The most signifi cant increases in real household expenditure on particular food groups (thus implying higher consumption levels per household) from 2005 to 2010 based on household-level expenditure data were (Figure 13.7):
• Alcoholic beverages, cold beverages, bread & cereals and meat (particularly for poor and middle income consumers);
• Food-away-from-home (particularly for middle income and wealthy consumers);
• Fats and oils (for all socio-economic sub-groups).
The middle class consumers registered real expenditure growth in the largest number of food categories (all categories except fi sh) from 2005 to 2010. As evident from Figure 13.8, the middle
consumer market, followed by the wealthiest 20% of consumers dominates the expenditure on staples, meat, vegetables, dairy & eggs, oils & fats. The wealthiest consumers followed by the middle consumer segment dominate the total expenditure on fruit, alcoholic beverages and food-away-from-home. The poorest 30% of consumers have a somewhat more prominent contribution to expenditure on bread and cereals, as well as vegetables and oils and fats. The estimated contribution of the wealthiest segment to total expenditure declined for all food groups, while the estimated contribution of the middle segment increased for all food groups. The estimated contribution of the poor segment increased signifi cantly for alcoholic beverages, fi sh, cold be-verages and dairy and eggs.
Figure 13.8: Estimated contribution of socio-economic sub-groups to total expenditure on specifi c food groups:
2005 & 2010
Source: StatsSA IES 2005 & 2010
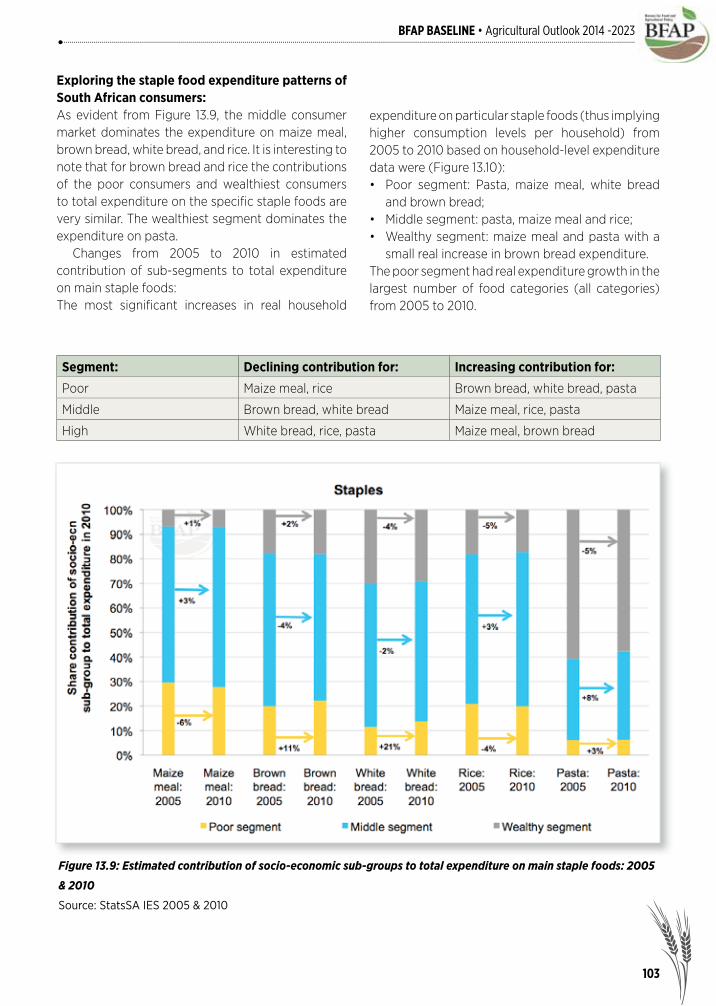
103
BFAP BASELINE • Agricultural Outlook 2014 -2023
Exploring the staple food expenditure patterns of South African consumers:As evident from Figure 13.9, the middle consumer market dominates the expenditure on maize meal, brown bread, white bread, and rice. It is interesting to note that for brown bread and rice the contributions of the poor consumers and wealthiest consumers to total expenditure on the specifi c staple foods are very similar. The wealthiest segment dominates the expenditure on pasta. Changes from 2005 to 2010 in estimated contribution of sub-segments to total expenditure on main staple foods:The most signifi cant increases in real household
expenditure on particular staple foods (thus implying higher consumption levels per household) from 2005 to 2010 based on household-level expenditure data were (Figure 13.10):• Poor segment: Pasta, maize meal, white bread
and brown bread;• Middle segment: pasta, maize meal and rice;• Wealthy segment: maize meal and pasta with a
small real increase in brown bread expenditure.The poor segment had real expenditure growth in the largest number of food categories (all categories) from 2005 to 2010.
Segment: Declining contribution for: Increasing contribution for:
Poor Maize meal, rice Brown bread, white bread, pasta
Middle Brown bread, white bread Maize meal, rice, pasta
High White bread, rice, pasta Maize meal, brown bread
Figure 13.9: Estimated contribution of socio-economic sub-groups to total expenditure on main staple foods: 2005
& 2010
Source: StatsSA IES 2005 & 2010
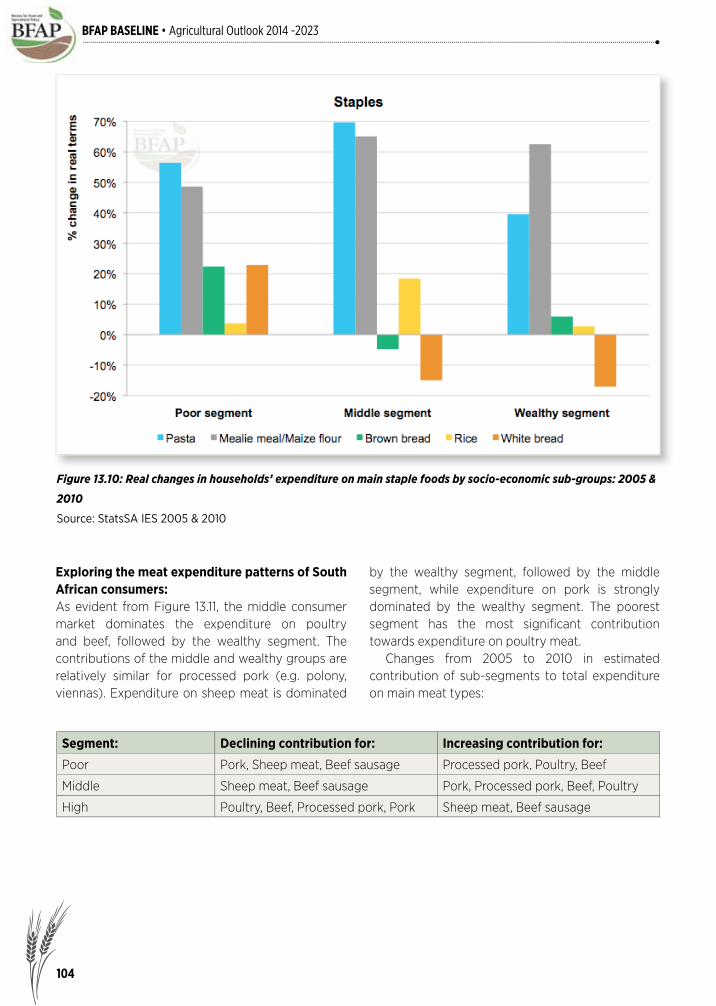
104
BFAP BASELINE • Agricultural Outlook 2014 -2023
Figure 13.10: Real changes in households’ expenditure on main staple foods by socio-economic sub-groups: 2005 &
2010
Source: StatsSA IES 2005 & 2010
Exploring the meat expenditure patterns of South African consumers:As evident from Figure 13.11, the middle consumer market dominates the expenditure on poultry and beef, followed by the wealthy segment. The contributions of the middle and wealthy groups are relatively similar for processed pork (e.g. polony, viennas). Expenditure on sheep meat is dominated
by the wealthy segment, followed by the middle segment, while expenditure on pork is strongly dominated by the wealthy segment. The poorest segment has the most signifi cant contribution towards expenditure on poultry meat. Changes from 2005 to 2010 in estimated contribution of sub-segments to total expenditure on main meat types:
Segment: Declining contribution for: Increasing contribution for:
Poor Pork, Sheep meat, Beef sausage Processed pork, Poultry, Beef
Middle Sheep meat, Beef sausage Pork, Processed pork, Beef, Poultry
High Poultry, Beef, Processed pork, Pork Sheep meat, Beef sausage
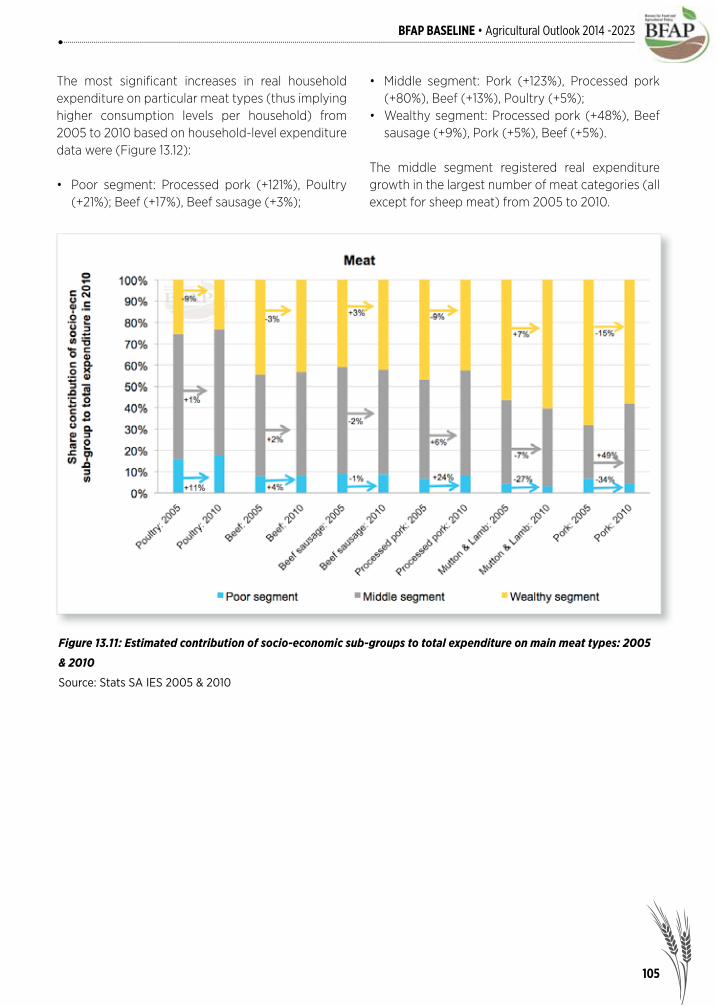
105
BFAP BASELINE • Agricultural Outlook 2014 -2023
The most signifi cant increases in real household expenditure on particular meat types (thus implying higher consumption levels per household) from 2005 to 2010 based on household-level expenditure data were (Figure 13.12):
• Poor segment: Processed pork (+121%), Poultry (+21%); Beef (+17%), Beef sausage (+3%);
• Middle segment: Pork (+123%), Processed pork (+80%), Beef (+13%), Poultry (+5%);
• Wealthy segment: Processed pork (+48%), Beef sausage (+9%), Pork (+5%), Beef (+5%).
The middle segment registered real expenditure growth in the largest number of meat categories (all except for sheep meat) from 2005 to 2010.
Figure 13.11: Estimated contribution of socio-economic sub-groups to total expenditure on main meat types: 2005
& 2010
Source: Stats SA IES 2005 & 2010

106
BFAP BASELINE • Agricultural Outlook 2014 -2023
Figure 13.12: Real changes in households’ expenditure on main meat types by socio-economic sub-groups: 2005 & 2010
Source: Stats SA IES 2005 & 2010
BFAP’s trade vulnerability analysisThis section presents an analysis of food security in South Africa from a trade vulnerability perspective. For the fi rst time a spatial plot is developed to graphically link the most important food items with respect to the share of household food expenditure to the products’ net trade position. Figures 13.13 and 13.14 present a spatial plot of:
• Net trade as a share of consumption (on the y-axis).
• Food expenditure share of national average household food expenditure allocated to particular food items according to the Stats SA IES 2005 and 2010 (on the x axis).
If a food item makes up a large share of the total household food expenditure and this product is imported, then it is classifi ed as a product with high food security trade vulnerability. In other words, the food items plotted towards the top-right of the graph have the highest levels of food security trade vulnerability.
The analysis focuses on the top 15 food items taking up the largest share of South African households’ food budgets (items in order of importance): Poultry, bread, beef, maize meal, milk (liquid and powder), aerated cold drinks, rice, white sugar, edible oils, sheep meat, potatoes, eggs, fruit juice, margarine, tomatoes (fresh). Net trade and consumption data was compiled from a combination of sources, including BFAP’s own database, industry organisations, processors, private research institutions and international trade databases. For a product such as maize meal, trade data for maize and not maize meal is used since the most trade takes place in the form of maize and not maize meal. Similarly, for bread the trade data for wheat is applied. Furthermore, due to data limitations, the ratio between trade and domestic consumption was assumed to be the same between 2005 and 2010 for cold drinks (2013 ratio), margarine (2012 ratio) and fruit juices (2012 ratio). More specifi cally, the following sources were used for each of the top 15 food items:

107
BFAP BASELINE • Agricultural Outlook 2014 -2023
Figure 13.13: South African food security vulnerability analysis from a trade dependency perspective: Dominant 15
foods in consumers’ food expenditure in 2005
Reliance on imported food and a growing population could leave a country exposed and vulnerable to shocks such as uncertainties in the international trade environment, potentially high and volatile international food prices, exchange rate fl uctuations and the impacts of climate change on trading partner countries translating into higher food prices. Furthermore, with climate change shocks countries tend to hold on to the food stocks they have and export less goods. Thus with high demand in the importing country the short supply due to decreased import availability can have a signifi cant impact to push up prices and thus affect food security from both an affordability perspective and well as in terms of the quantities available for consumption. Increasing competition from ‘cheap’, subsidised imports is another potential threat linked to signifi cant import reliance and can
Product: Source/s: Product: Source/s:
Poultry SA Poultry Association Edible oils BFAP, ITC Trademap
Wheat SAGIS Mutton and lamb BFAP
Beef BFAP Potatoes Potato SA
Maize BFAP, SAGIS Eggs SA Poultry Association
Milk BFAP, Milk SA Fruit juices BMI, ITC Trademap
Cold drinks SABMiller, ITC Trademap Margarine BMI, ITC Trademap
Rice ITC Trademap Tomatoes fresh DAFF, ITC Trademap
White sugar SA Cane Growers
affect the local agricultural industry and subsequent job creation. Nutritional considerations also come into play, as consumers often show a growing demand for calorie-rich and nutrient-poor foods. Consumers’ growing demand for more processed foods is evident when comparing Stats SA IES 2005 and 2010 data. Between 2005 and 2010, as average annual incomes rose, South African households moved away from own production towards more refi ned, higher-valued food items. The share of total expenditure devoted to ‘Level 2 and 3’ formally processed foods, such as spaghetti and oven-ready meals increased (Level 2 household expenditure increased by 3%; household expenditure on Level 3 foods increased by 10% in terms of the share of food budgets allocated to these foods).

108
BFAP BASELINE • Agricultural Outlook 2014 -2023
Figure 13.14: South African food security vulnerability analysis from a trade dependency perspective: Dominant 15
foods in consumers’ food expenditure in 2010
The following key observations can be made from this analysis:• The ranking of the top 8 food items has remained
unchanged with respect to expenditure shares over the period 2005 to 2010.
• Although the comparison in the food security trade vulnerability of poultry between 2005 and 2010 has not deteriorated, this position has changed in the past two years with exceptionally high feed prices putting local broiler producers under pressure.
• A larger share of locally consumed wheat has to be imported. From the baseline projections it is evident that this trend will continue over the outlook period.
• Over the period 2005 to 2010, South Africa has lost ground in terms of maize and sugar exports. Fortunately maize exports have increased again
and are basically on par with the levels maintained in 2005. For sugar however, there will only be a marginal improvement as the industry is going through a process of consolidation.
• The relative share in consumption of edible oils is increasing and has gained one position on the ranking of expenditures. With the rapid expansion in local soya bean crushing plants, the production of local soya bean oils is expected to rise sharply.
Following the analyses, the most vulnerable food types in South Africa from a food security and trade dependence perspective are poultry, wheat, beef, rice, edible oils and mutton/lamb. Interesting this list contains two important staple foods (wheat and rice), as well as three animal protein sources (poultry, beef and mutton/lamb).
Food group: Product: General movement in food security trade dependency vulnerability from 2005 to 2010:
Animal protein foods PoultryBeefMutton/lamb
↑ risk over time↓ risk over time↓ risk over time
Staple foods WheatRice
↑ risk over time↑ risk over time
Fats & oils Edible oils ↓ risk over time

109
BFAP BASELINE • Agricultural Outlook 2014 -2023
REFERENCES
BUREAU FOR ECONOMIC RESEARCH. 2014. Consumer Confi dence Index [Onlne] Available at: http://www.ber. ac.za/FNBBERBCI/2025.aspx [Accessed 26 June 2014].FOOD STUFFS SA. 2013. Innova's top food-bev trends for 2014: waste reduction and regaining trust. 13 November 2013. 2013 [Online] Available at: http://www.foodstuffsa.co.za/food-trends-mainmenu-119/ food-trends-2014/3352-innovas-top-food-bev-trends-for-2014-waste-reduction-and-regaining-trust [Accessed 6 June 2014].FOOD STUFFS SA. 2013. 12 Key Trends in Food, Nutrition & Health 2014. [Online] Available at: http://www. foodstuffsa.co.za/food-trends-mainmenu-119/food-trends-2014/3348-12-key-trends-in-food-nutrition-a- health-2014. 09 December 2013 [Accessed 6 June 2014].FOOD STUFFS SA. 2013. RTS: Future trends in food and drink 2014. 7 November 2013 [Online] Available at: http://www.foodstuffsa.co.za/food-trends-mainmenu-119/food-trends-2014/3353-rts-future-trends-in- food-and-drink-2014 [Accessed 6 June 2014].FOOD STUFFS SA. 2014. Health & Wellness goes mainstream: living in a culture of well-being. 14 January 2014 [Online] Available at: http://www.foodstuffsa.co.za/food-trends-mainmenu-119/food-trends-2014/3358- health-a-wellness-goes-mainstream-living-in-a-culture-of-well-being [Accessed 6 May 2014].FOOD STUFFS SA. 2014. Mintel releases American consumer trends for 2014. 15 January 2014 [Online] Available at: http://www.foodstuffsa.co.za/food-trends-mainmenu-119/food-trends-2014/3359-mintel-releases-amer ican-consumer-trends-for-2014 [Accessed 6 May 2014].FOOD STUFFS SA. 2014. Top 10 Global Consumer Trends for 2014. 27 January 2014. [Online] Available at: http:// www.foodstuffsa.co.za/food-trends-mainmenu-119/food-trends-2014/3380-top-10-global-consumer- trends-for-2014 [Accessed 6 May 2014].FOOD STUFFS SA. 2014. Deconstructing what consumers mean by fresh, less-processed foods. 7 February 2014. [Online] Available at: http://www.foodstuffsa.co.za/food-trends-mainmenu-119/food-trends- 2014/3406-deconstructing-what-consumers-mean-by-fresh-less-processed-foods [Accessed 6 May 2014].NATIONAL CREDIT REGULATOR. 2013. Web dataset 2007-Q4 to 2013-Q4. [Online] Available at: http://www. ncr.org.za/index.php?option=com_content&view=article&id=8 [Accessed 16 May 2014].SANHANES-1, 2013a. The South African National Health And Nutrition Examination Survey, Media Release 2. Nutritional status of children. [Online] Available at: http://www.hsrc.ac.za/uploads/pageContent/3895/02%20NUTRITIONAL%20STATUS%20OF%20CHILDREN.pdf [Accessed 6 June 2014].SANHANES-1, 2013b. The South African National Health And Nutrition Examination Survey, Media Release 1. Non-communicable diseases (NCDs). [Online] Available at: http://www.hsrc.ac.za/uploads/pageCon- tent/3895/01%20NON-COMMUNICABLE%20DISEASES.pdf [Accessed 6 June 2014].SOUTH AFRICAN AUDIENCE RESEARCH FOUNDATION (SAARF). 2014. SAARF segmentation CD, Based on AMPS Fieldwork Period July 2012 – June 2013.SOUTH AFRICAN AUDIENCE RESEARCH FOUNDATION (SAARF). 2004 to 2013. SAARF AMPS data for the various years.STATISTICS SOUTH AFRICA. 2008. Income and expenditure of households: 2005/2006. Statistical release P0100. [Online] Available at: www.statssa.gov.za/publications/statsdownload.asp?PPN=P0100&SCH=4108. Pages: 135, 136, 139, 153. [Accessed 6 May 2014].STATISTICS SOUTH AFRICA. 2012a. Income and expenditure of households: 2010/2011. Statistical release P0100. [Online] Available at: www.statssa.gov.za/publications/statsdownload.asp?PPN=P0100&SCH=5371. Pages: 130, 131, 133, 177. [Accessed 6 May 2014].STATISTICS SOUTH AFRICA. 2012b. Census 2011 Census in brief. Report No. 03-01-41 [Online] Available at: https: //www.statssa.gov.za/Census2011/Products/Census_2011_Census_in_brief.pdf [Accessed 16 May 2014].STATISTICS SOUTH AFRICA. 2013. Quarterly Labour Force Survey, Quarter 4, 2013. Statistical release P0211 [Online] Available at: http://www.statssa.gov.za/publications/P0211/P02114thQuarter2013.pdf [Accessed 16 May 2014].
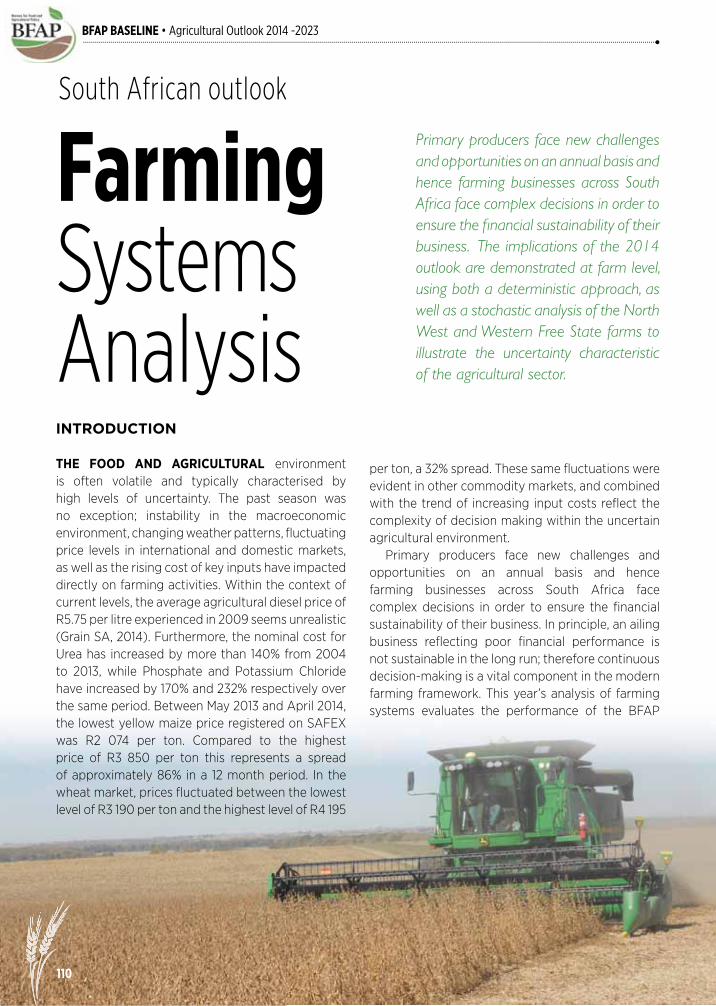
110
BFAP BASELINE • Agricultural Outlook 2014 -2023
FarmingSystems Analysis
South African outlookPrimary producers face new challenges and opportunities on an annual basis and hence farming businesses across South Africa face complex decisions in order to ensure the fi nancial sustainability of their business. The implications of the 2014 outlook are demonstrated at farm level, using both a deterministic approach, as well as a stochastic analysis of the North West and Western Free State farms to illustrate the uncertainty characteristic of the agricultural sector.
INTRODUCTION
THE FOOD AND AGRICULTURAL environment is often volatile and typically characterised by high levels of uncertainty. The past season was no exception; instability in the macroeconomic environment, changing weather patterns, fl uctuating price levels in international and domestic markets, as well as the rising cost of key inputs have impacted directly on farming activities. Within the context of current levels, the average agricultural diesel price of R5.75 per litre experienced in 2009 seems unrealistic (Grain SA, 2014). Furthermore, the nominal cost for Urea has increased by more than 140% from 2004 to 2013, while Phosphate and Potassium Chloride have increased by 170% and 232% respectively over the same period. Between May 2013 and April 2014, the lowest yellow maize price registered on SAFEX was R2 074 per ton. Compared to the highest price of R3 850 per ton this represents a spread of approximately 86% in a 12 month period. In the wheat market, prices fl uctuated between the lowest level of R3 190 per ton and the highest level of R4 195
per ton, a 32% spread. These same fl uctuations were evident in other commodity markets, and combined with the trend of increasing input costs refl ect the complexity of decision making within the uncertain agricultural environment. Primary producers face new challenges and opportunities on an annual basis and hence farming businesses across South Africa face complex decisions in order to ensure the fi nancial sustainability of their business. In principle, an ailing business refl ecting poor fi nancial performance is not sustainable in the long run; therefore continuous decision-making is a vital component in the modern farming framework. This year’s analysis of farming systems evaluates the performance of the BFAP

111
BFAP BASELINE • Agricultural Outlook 2014 -2023
typical farm network through the past production season, focussing on yield levels, production costs and profi tability margins, while also benchmarking these against other global markets through the agri benchmark initiative. The implications of the 2014 outlook are demonstrated at farm level, using both a deterministic approach, as well as a stochastic analysis of the North West and Western Free State farms to illustrate the uncertainty characteristic of the agricultural sector.
The BFAP Farm-level program and methodologyThe farming systems program was established with the main objective of assisting agri- and farm businesses with strategic decision-making under changing and uncertain market conditions. Typical farms across South Africa’s key producing regions are constructed according to a standard operating procedure and linked strategically into the BFAP system of integrated models, allowing quantifi cation of the impact of different policy options, macroeconomic variables, and volatile commodity market conditions on the fi nancial position of farm businesses in key production regions in South Africa. Figures, data and production statistics illustrated in this chapter do not refl ect provincial averages, but rather average values for the specifi c regions where the typical farms are situated. All production statistics within these regions are as representative as possible given the available information and resources. The quantitative tools used in the BFAP farm level program consist of three key components; the farm level fi nancial simulation (FinSim) model, the agri benchmark international network of representative farms and the small-scale farm economics program.
- Farm-level modelling: The BFAP FinSim model is a total budgeting model at farm-level, which captures enterprise and business specifi cs such as asset structure and fi nancing methods. Integrated into the BFAP modelling system, it quantifi es the impact of the projections generated by the BFAP sector model at farm level. The FinSim model has been used successfully to measure the impact of input- and market-related shocks or different policy decisions, as well as whole-farm planning (capital and operational expenditure), fi nancial and economic feasibility at farm-level and risk analysis through stochastic simulation. Output is presented through various performance
indicators, such as farm gross margins, net farm income (NFI), return to family living (as a cash fl ow measure), the cumulative net cash balance (CNCB), the net worth, and the debt to asset ratio.
- agri benchmark: The agri benchmark network is an international network of agricultural research and advisory economists aiming to create a better understanding of global farming and the economics thereof (www.agribenchmark.org). The objective of the agri benchmark initiative is to create a national and international database on farm information through collaboration between the public sector, agribusinesses and producer organisations. The link between the local and international network provides the means to benchmark South African agriculture with global farming systems.
- The economics of small-scale farms: BFAP is currently in the establishment phase of a small-scale farm economics analyses and development initiative. These projects typically include analyses and fi nancial modelling of various small-scale producers towards understanding the economics of small-scale farming in both South Africa and the rest of Sub-Saharan Africa.
The BFAP farm-level network covers a wide range of commodities across different areas and includes the following: • Summer grain and oilseeds (Maize, Soya beans,
Sunfl ower)o Northern, Eastern and Western Free State
(Senwes Limited & Excelsus)o North West Province (NWK Limited)o Northern Cape irrigation region (GWK
Limited) o Mpumalanga (Senwes Limited).
• Winter grain and oilseeds (Wheat, Barley, Canola) o Overberg region (Overberg Agri Limited) o Northern Cape irrigation region (GWK
Limited) • Horticulture (Apples and Pears) – in collaboration
with Hortgroo Ceres region – Western Capeo Elgin, Grabouw, Vyeboom, Villiersdorp region – Western Cape o Langkloof region – Eastern Cape
• Potatoes – in collaboration with Potatoes South Africao Eastern Free State (dryland table potatoes),

112
BFAP BASELINE • Agricultural Outlook 2014 -2023
o Limpopo (table potatoes), o Sandveld (table potatoes) o KwaZulu-Natal (seed potatoes)
• Pork – in collaboration with the South African Pork Producers Organisationo Western Capeo KwaZulu-Natalo Central Regions
The 2012/13 production season: A challenging year for certain areasThe 2012/13 production season was one of mixed fortunes in many respects. While weather conditions in certain areas like the Eastern Free State improved, following drought conditions in 2011 and 2012, unfavourable weather conditions persisted in large parts of the country and at national level, the total maize yield fell below 4 tons/hectare for the fi rst time in 5 years. The effect of adverse weather was more evident in white maize, refl ected in a decline of 20% in yield levels compared to 2012, while yellow maize yields remained relatively stable. In the North West province, arguably the most affected by the unfavourable weather, 2013 maize yields reached only half of the historic 5 year average. Figure 14.1 illustrates the historic maize yields registered by the BFAP typical farm network in recent production seasons, illustrating the regional differences in yield levels.
Sorghum and sunfl ower yields also declined in 2013 to levels well below the historic 5 year average and while the national soya bean yield was 11% higher than in 2012, it remained 10% below the average level registered through the past 5 years. Winter crops experienced more favourable conditions and while yield levels for wheat, barley and canola were all lower in 2013 compared to bumper levels in 2012, national yields for all 3 crops remain well above the historic 5 year average. Figure 14.2 illustrates the historic performance of wheat yields in the Eastern Free State, Overberg and Northern Cape irrigation region.
- Free State (Eastern, Western and Northern regions)
Drought conditions in the Western and Northern parts of the Free State caused a substantial decline in yield levels relative to preceding years. In contrast, improved weather conditions in the Eastern Free State, specifi cally the Bethlehem – Reitz - Petrus Steyn region resulted in much improved performance relative to 2011 and 2012, when dry conditions impacted negatively on production in the area. Despite generally lower yields and rising production costs in 2013, record price levels supported margins and across the Free State, break even yields were well below actual yields recorded (Table 14.1).
Figure 14.1: Maize yield trends
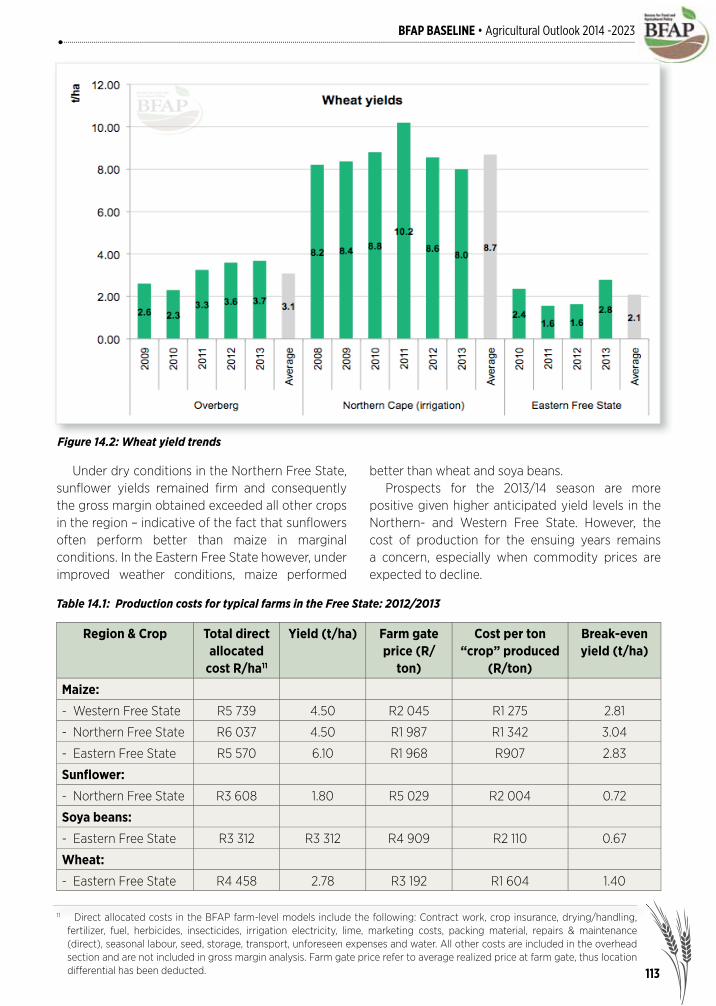
113
BFAP BASELINE • Agricultural Outlook 2014 -2023
Figure 14.2: Wheat yield trends
Under dry conditions in the Northern Free State, sunfl ower yields remained fi rm and consequently the gross margin obtained exceeded all other crops in the region – indicative of the fact that sunfl owers often perform better than maize in marginal conditions. In the Eastern Free State however, under improved weather conditions, maize performed
better than wheat and soya beans. Prospects for the 2013/14 season are more positive given higher anticipated yield levels in the Northern- and Western Free State. However, the cost of production for the ensuing years remains a concern, especially when commodity prices are expected to decline.
Table 14.1: Production costs for typical farms in the Free State: 2012/2013
Region & Crop Total direct allocated
cost R/ha11
Yield (t/ha) Farm gate price (R/
ton)
Cost per ton “crop” produced
(R/ton)
Break-even yield (t/ha)
Maize:
- Western Free State R5 739 4.50 R2 045 R1 275 2.81
- Northern Free State R6 037 4.50 R1 987 R1 342 3.04
- Eastern Free State R5 570 6.10 R1 968 R907 2.83
Sunfl ower:
- Northern Free State R3 608 1.80 R5 029 R2 004 0.72
Soya beans:
- Eastern Free State R3 312 R3 312 R4 909 R2 110 0.67
Wheat:
- Eastern Free State R4 458 2.78 R3 192 R1 604 1.40
11 Direct allocated costs in the BFAP farm-level models include the following: Contract work, crop insurance, drying/handling, fertilizer, fuel, herbicides, insecticides, irrigation electricity, lime, marketing costs, packing material, repairs & maintenance (direct), seasonal labour, seed, storage, transport, unforeseen expenses and water. All other costs are included in the overhead section and are not included in gross margin analysis. Farm gate price refer to average realized price at farm gate, thus location differential has been deducted.

114
BFAP BASELINE • Agricultural Outlook 2014 -2023
Crop Total direct allocated cost
R/ha
Yield (t/ha) Farm gate price (R/ton)
Cost per ton “crop” pro-
duced (R/ton)
Break-even yield (t/ha)
Maize R4 045 2.19 R1 975 R1 847 2.05
Sunfl ower R2 892 1.50 R4 876 R1 928 0.59
Table 14.2: North West production statistics 2012/2013
- Northern CapeThe typical farm in the Northern Cape irrigation region (Prieska) produces maize and wheat on a double cropping rotation system and since 2008, maize yields have never fallen below 12.90 tons per hectare. Maize yields reported in 2013 were marginally lower than the historic 5 year average and despite initial concerns due to frost in the 2013 wheat production period, the crop eventually
performed well, with yields averaging 8 tons per hectare. High yield levels obtained under irrigation also result in substantial production costs, as illustrated by the production statistics presented in Table 14.3. Fertilizer costs accounted for 46% and 41% of direct maize and wheat production costs respectively, followed by irrigation electricity (15%).
Crop Total direct allocated cost R/ha
Yield (t/ha)
Farm gate price (R/ton)
Cost per ton “crop” produced
(R/ton)
Break-even yield (t/ha)
Maize R15 447 12.93 R2 027 R1 195 7.62
Wheat R14 528 8.00 R2 921 R1 816 4.97
- OverbergFavourable weather conditions, combined with good rotational cropping practices and conservation tillage approaches resulted in exceptional performance on the Overberg farm for the third consecutive year in 2013. The Overberg typical farm produces wheat, barley, canola and pasture crops, while livestock
production also forms a signifi cant component of the overall farm structure. All crops performed well in 2013, however higher yields pushed the gross margin obtained per hectare of wheat and barley higher than that of canola (Table 14.4).
Table 14.3: Northern Cape production statistics 2012/2013
- North West provinceSevere drought conditions resulted in a particularly challenging 2012/13 production season in the North West province. The maize yield reported on the typical farm in the Lichtenburg region was only 2.19 tons per hectare, less than half of 2011 levels. Its resilience in dry conditions resulted in better
performance from sunfl owers, where the reported yield of 1.50 tons per hectare compares well to historic norms. Table 14.2 presents the production statistics for the North West typical farm for the 2012/13 production season.
Table 14.4: Overberg production statistics 2012/2013
Crop Total direct allocated cost R/ha
Yield (t/ha) Farm gate price (R/ton)
Cost per ton “crop” produced (R/ton)
Break-even yield (t/ha)
Wheat R4 669 3.68 R2 761 R1 269 1.69
Barley R4 475 3.66 R2 694 R1 223 1.66
Canola R4 177 1.71 R4 596 R2 443 0.91

115
BFAP BASELINE • Agricultural Outlook 2014 -2023
Box 14.1: The reality of mechanisation in the potato industry: A case study in collaboration with Potatoes South Africa
Towards the end of 2012, violent protest by farm workers in the Western Cape resulted in a revision of the sectoral determination that governs minimum wages in the agricultural sector. As a result, the minimum wage required in the agricultural sector was increased to R105 per day in 2013. The revision has signifi cant implications for labour intensive industries such as potatoes. The objective of the pilot case study conducted by BFAP in 2013 was the evaluation of the effect increased wages on producer’s decisions regarding mechanisation options. It further highlights questions pertaining to the real cost of mechanisation, whether the capital investment is justifi able from a fi nancial perspective and where the typical threshold lies given the benefi ts related to economies of scale. Farm size plays a signifi cant role in whether the economies of scale associated with mechanisation can be achieved. As a result, the analysis regarded three different size categories: 50 hectares, 150 hectares and 350 hectares planted to potatoes. The outcome of the study indicated that on average, a producer will pay up to R2300 per hectare more due to the increase in the wage rate. Over a 5 year period which is typically a term for a medium term loan or repayment period, the above costs amount to: 1) An increase of almost R500 thousand on a 50 hectare farm, 2) an increase of more than R1.7 million on a 150 hectare farm and 3) an increase of almost R5 million on a 350 hectare farm. These fi gures do not account for any further increases in the cost of labour or annual general infl ation. The cost of mechanisation, based on a list of implements and machinery with associated cost per hectare and an estimated labour replacement factor, obtained from input suppliers is presented in Table 14.5.
- Potato producing regions Dryland potato production in the eastern Free State reported an exceptionally good year with yield levels exceeding 30 tons per hectare. At the same time, the market price for table potatoes was signifi cantly higher relative to 2012. This combination of strong yields and high prices resulted in remarkable profi tability levels; however certain input variables such as transport, packing material and marketing
also rise when yield levels increase. The result was an increase of 32.49% in the total cost of production. Table potato production in the Limpopo irrigation region also reported strong yields that exceeded 60 tons per hectare, while the Sandveld irrigation region in the Western Cape reported a yield of 45 tons per hectare. In KwaZulu-Natal, the average yield was 39 tons per hectare.
Type of implement or machinery
Cost of mechanization
(including fi nance cost)
Maximum replacement (labourers)
50 ha farm
150 ha farm
350 ha farm
Savings in labour cost (R/ha) after 1 March 2013
De-stoner & Bed former R1 579 582 - - - -
Planter: 2 row without fertilizer buckets
R157 958 20 R 26 R 53 R 61
Harvester: 2 row without bunker R2 187 113 80 R 1 680 R 2 544 R 2 808
Harvester: 1 row with bunker R1 579 583 40 R 1 680 R 2 212 R 1 404
Pack-house adjustments: Option 1 12
R1 895 498 60 R 3 675 R 3 318 R 2 106
Pack-house adjustments: Option 2 12
R789 791 25 R 2 625 R 1 383 R 878
Pack-house mechanization R3 882 203 90 R 3 675 R 4 424 R 3 159
Totally refurbished pack-house R9 225 201 90 R 3 675 R 4 424 R 3 159
Table 14.5: The cost (per ha) of mechanisation and savings in labour cost resulting from mechanisation
12 Pack-house adjustments: Option 1 & 2 refers to different combinations of weighing units and “carousels”. The totally refurbished pack-house refers to an entirely new pack-house. The cost of mechanisation was calculated based on an amortisation approach. Thus, fi nance cost is included in the calculation with an 8.5% interest rate assumption. A deposit of 20% has been assumed.

116
BFAP BASELINE • Agricultural Outlook 2014 -2023
The savings in labour cost results from employment of fewer labourers on the farm due to the specifi ed mechanisation options. For instance, a one row harvester’s maximum replacement is 40 labourers, however, realistically; on a 50 hectare farm only 16 labourers will be replaced, as the farm would not typically employ 40 labourers for harvesting. The savings of this replacement amount to R1 680 per hectare. The results of the net value or difference between the cost of mechanisation and the savings in labour cost for the specifi c implement or pack-house adjustment are represented in Figures 14.3, 14.4 and 14.5. The red bars illustrates that the cost of a certain mechanisation option exceed the savings resulting from replacement of labour. The green bars indicates the viable options available for different categories of producers, thus, the net value of mechanisation is positive.
Figure 14.3: Difference between the cost of mechanisation and savings in labour cost (R/ha) – 50 hectare producer
Figure 14.4: Difference between the cost of mechanisation and savings in labour cost (R/ha) – 150 hectare producer
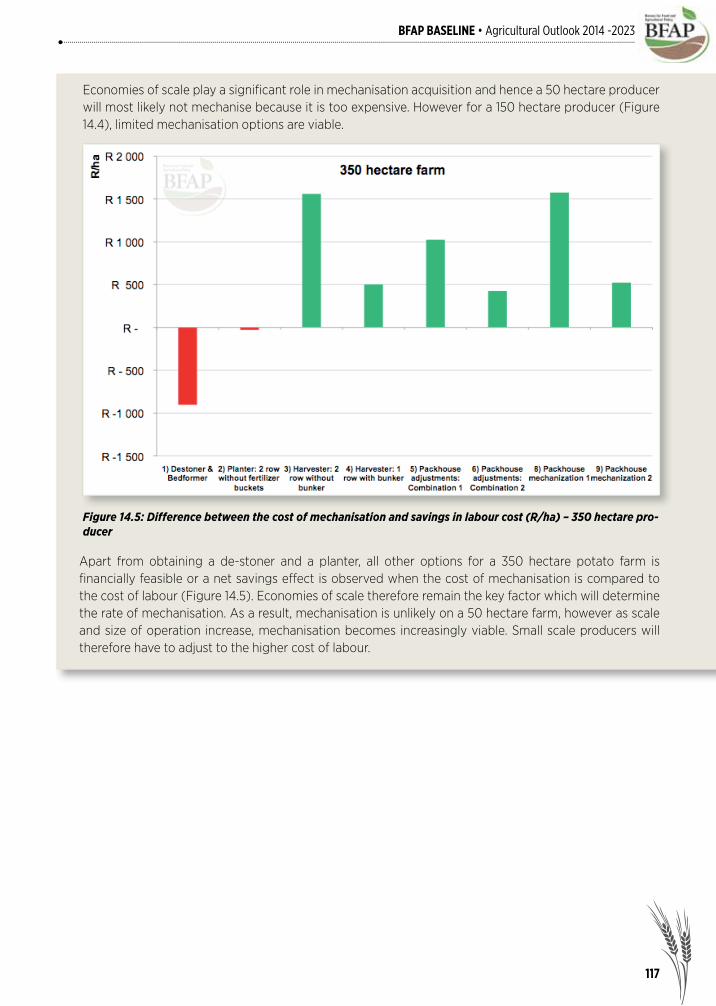
117
BFAP BASELINE • Agricultural Outlook 2014 -2023
Figure 14.5: Difference between the cost of mechanisation and savings in labour cost (R/ha) – 350 hectare pro-ducer
Economies of scale play a signifi cant role in mechanisation acquisition and hence a 50 hectare producer will most likely not mechanise because it is too expensive. However for a 150 hectare producer (Figure 14.4), limited mechanisation options are viable.
Apart from obtaining a de-stoner and a planter, all other options for a 350 hectare potato farm is fi nancially feasible or a net savings effect is observed when the cost of mechanisation is compared to the cost of labour (Figure 14.5). Economies of scale therefore remain the key factor which will determine the rate of mechanisation. As a result, mechanisation is unlikely on a 50 hectare farm, however as scale and size of operation increase, mechanisation becomes increasingly viable. Small scale producers will therefore have to adjust to the higher cost of labour.

118
BFAP BASELINE • Agricultural Outlook 2014 -2023
- Crop profi tability performances across regions: 2012/13 season Yield levels present an indication of technical performance across regions, as well as the extent to which adverse weather conditions affected different regions and while it remains a key driver of profi tability, gross margins present a more complete view of relative profi tability between crops. Figure 14.6 indicates that gross margins for both maize and wheat cultivated under irrigation in the Northern Cape are substantially higher than those registered by dryland production systems in other regions. Exceptionally low yields in the North West also resulted in very small gross margins for
maize production, while the relative performance of North West sunfl owers despite the adverse weather conditions are indicative of the crop’s resilience under poor growing conditions. Gross margins do not account for overhead costs and in the case of maize produced in the North West, inclusion of overhead costs leads to negative margins. The average gross margin for all crops in the sample space was R5 076 per hectare, however removal of irrigated crops results in a substantial decline, to an average gross margin of R4 217 per hectare for dryland crops in 2013.
Figure 14.6: Gross margin per hectare analysis for the 2012/13 production season

119
BFAP BASELINE • Agricultural Outlook 2014 -2023
Figure 14.7: Maize yield levels across the globe (average: 2010-2012)
- Performance in the global context: international benchmarking The agri benchmark initiative (www.agribenchmark.org), in collaboration with the Thünen Institute in Braunschweig, Germany allows a comparison of typical South African farms to other farm enterprises globally. A standardised approach of identifying and updating typical farms across the world allows credible comparisons that refl ect the competitiveness of an enterprise and hence illustrates which regions produce the respective crops in the most cost effective manner, regardless of production conditions and available resources. Figure 14.7 illustrates maize yield levels in Argentina, Brazil, Ukraine, the United States of America (USA) and South Africa for the period 2010-2012. The remainder of the x-axis indicates the specifi c farms in each country where the number and codes refl ects the farm size and region where the farms are situated. For instance, the ZA1200NW farms indicate that the farm is situated in the North
West province and the total farms size is 1200 hectares (including grassland). Excluding the irrigation farm in the Northern Cape, average yield levels in South Africa was much lower than the USA and Argentina, however yields compared well to levels obtained in Brazil through the same period. Exceptional yields obtained in the USA are attributed to organic soil types, a 50:50 rotation with soya beans, an annual rainfall of 880 millimetres and high technology farming operations. Figure 14.8 represents selective direct expenditures in maize production and refl ects the cost of producing a single ton of maize. Thus, in years where yield levels have declined, the cost of producing a ton of maize will increase. Figure 14.8 provides a clear indication of relative cost structures and hence the competitiveness of maize producing countries internationally.

120
BFAP BASELINE • Agricultural Outlook 2014 -2023
From Figure 14.8, the average cost of producing a ton of maize on the South African typical farms was 24% higher than the sample average, while the cost of fertilizer in South Africa was nearly double that reported in countries such as Argentina, Brazil, Ukraine and the USA. A combination of factors infl uenced this high cost of domestic fertilizer but yields, exchange rates, deep sea freight rates and inland transportation costs are the key contributors. The typical farms in the Western Free State and Northern Cape were more cost competitive in the global context, mainly due to higher yield levels. Considering wheat production, historic yields obtained under dryland production in the Overberg region compare well to yield levels in Russia and Kansas (USA); however most recent yields in the Overberg region have exceeded 3.5 tons per
hectare, shifting performance to levels comparable to Argentina (Figure 14.9). The average dryland yield in Germany remains substantially higher, however consideration of cost structures are also important in measuring competitiveness, as illustrated by Figure 14.10. The cost of producing a ton of wheat on the Northern Cape typical farm compares well to the international average, while on the Overberg farm, where dryland yields are considerably lower, the cost of production is approximately 40% higher than the global average. The cost of fertilizer on South African farms remains substantially higher than that associated with the international sample space. Contractor costs represent a substantial share of total production cost in Argentina and Germany.
Figure 14.8: Selected direct expenditures per ton: maize (average: 2010-2012)

121
BFAP BASELINE • Agricultural Outlook 2014 -2023
Figure 14.9: Wheat yield levels across the globe (average: 2010-2012)
Figure 14.10: Selected direct expenditures per ton: wheat (average: 2010-2012)

122
BFAP BASELINE • Agricultural Outlook 2014 -2023
Implications of the 2014 Outlook at farm levelThe effects of rainfall have been well illustrated in previous sections, however climatic conditions remains only one driver that could infl uence a farmer’s profi tability. Global market prices and their respective spill-over effect into domestic markets have a substantial role to play, while macroeconomic factors such as the performance of the South African rand against key monetary units like the United States dollar (US$) further impacts on both the cost of inputs and the price of outputs in the agricultural sector. Integration of the baseline projections into the network of typical farms highlights 2 key factors:
1) The cost of production will increase substantially from 2013 to 2014.
2) Summer grain prices will decline rapidly in 2014, followed by a largely sideways movement in 2015 and 2016.
The combination of these two factors indicates a typical “cost price squeeze” situation where the output price remains under pressure, but the cost of production is increasing. Since farmers are normally price takers and the ability to control the cost of inputs is limited, higher yields together with increasing productivity and effi ciency should remain key focus areas in farming businesses and especially maize farming operations across South Africa. - InputsGrain SA (2011) indicates that South Africa imported less than 20% of the total domestic demand for fertilizer in the early 1990’s; however by 1999, imports had increased to 40% of domestic demand. In 2008 more than 65% of domestic nutritional fertilizer demand was imported. This entails that the global price for selective fertilizers will remain a key indicator of domestic price trends. Figure 14.11 illustrates the international fertilizer price trend and projections for Urea (Eastern Europe, bulk), Phosphate (DAP, USA gulf) and Potassium (MOP, CIS, bulk) over the period from 2000 to 2016. Having declined rapidly since 2011, international fertilizer prices are expected to stabilise before increasing marginally to 2016. Despite the increase, 2014 prices remain approximately 30% below the record levels reached in 2008.
Given the assumption of continued depreciation in the value of the Rand in 2014, domestic fuel and fertilizer prices are projected to show a fi rm increase. Figure 14.12 represents an input cost index for fuel, fertilizer, farming requisites and intermediate goods in South Africa (2000 = 100). The projections are based on a combination of factors, including international prices for fertilizer and Brent crude oil, as well as the projected exchange rate against the US dollar. While all domestic input costs are projected to increase in 2014, the projection of a stronger Rand in 2015 results in marginally softer input cost indices in 2015, before a further depreciation in the value of the Rand and rising international prices combine to drive domestic input costs higher in 2016.
- Profi tabilityUnder the assumption of normal weather conditions, yields are projected to return to trend levels in 2014; yet ever increasing input costs, combined with softer commodity prices results in a deterministic outlook where producer margins come under extreme pressure in the short term. Table 14.6 presents projections for the different regions covered in the BFAP typical farm network for the 2014/15 production season. The combination of increasing input costs and softer prices result in a substantial increase in break-even yield levels relative to the past production season. With declining margins, risks related to unpredictable weather conditions become increasingly relevant. Flowing from the projections in Table 14.6, Figure 14.13 illustrates projected gross margins for the various typical farms contained in the network. The profi tability of maize enterprises in Mpumalanga, the Free State and the Northern Cape, as well as canola production in the Overberg region are projected to come under immense pressure in 2014/15, mainly driven by lower farm gate prices. Wheat and soya beans are projected to be the most profi table crops in 2014/15, thanks to smaller declines in farm gate prices relative to other crops. Given the projections for 2014/15, the average gross margin for all typical farms in the network will decline to R3 796 per hectare; 18.4% below 2011/12 levels and 25.2% below 2012/13 levels.
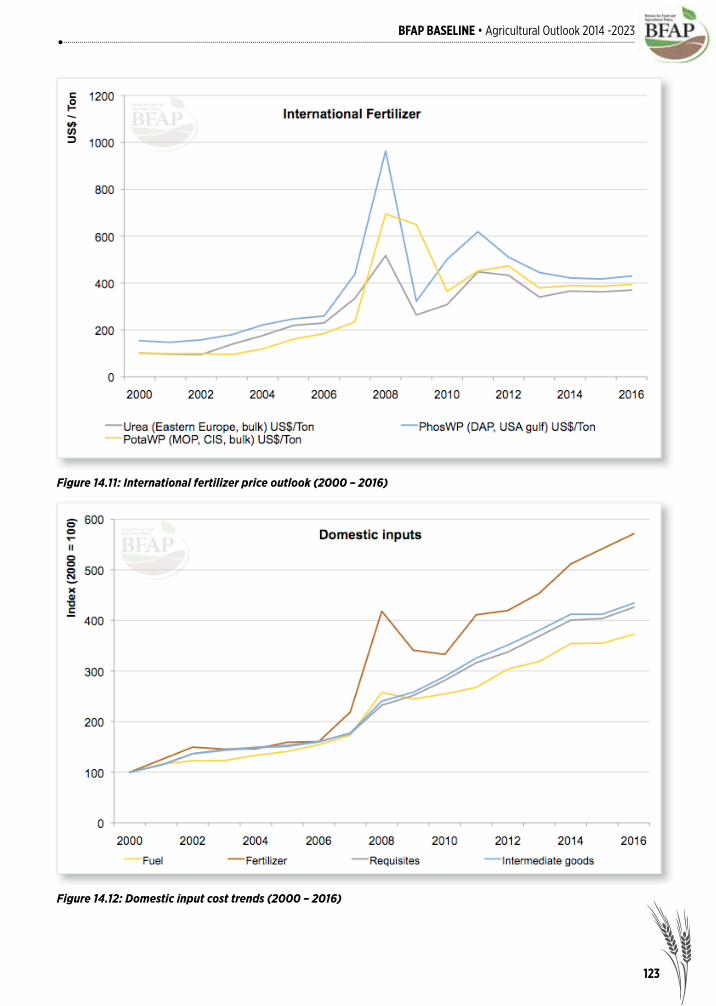
123
BFAP BASELINE • Agricultural Outlook 2014 -2023
Figure 14.11: International fertilizer price outlook (2000 – 2016)
Figure 14.12: Domestic input cost trends (2000 – 2016)
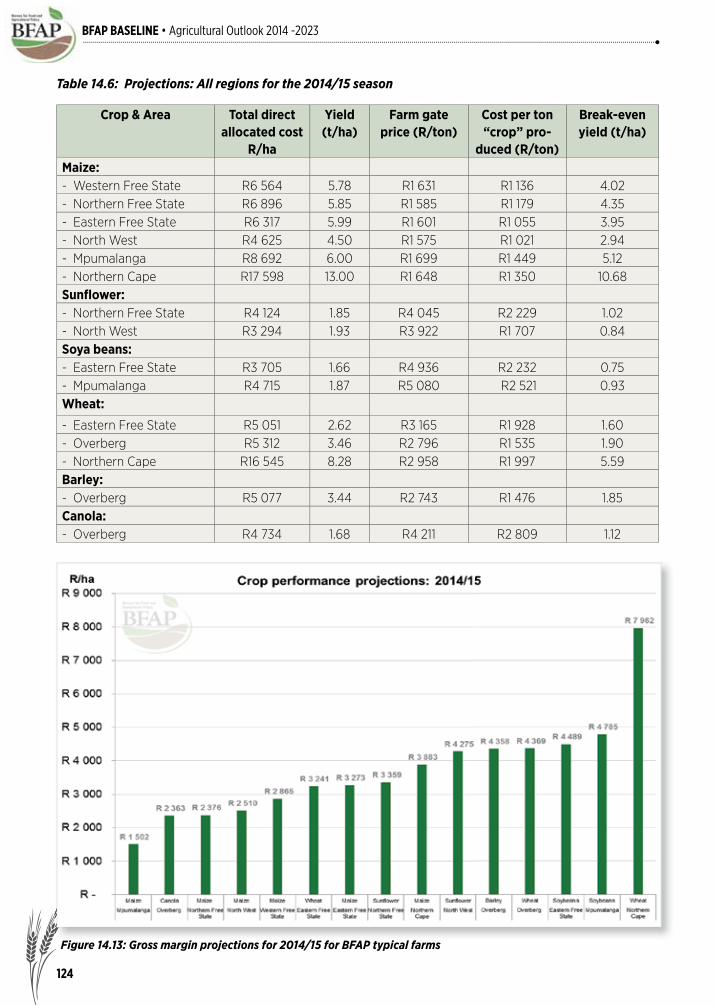
124
BFAP BASELINE • Agricultural Outlook 2014 -2023
Crop & Area Total direct allocated cost
R/ha
Yield (t/ha)
Farm gate price (R/ton)
Cost per ton “crop” pro-
duced (R/ton)
Break-even yield (t/ha)
Maize:- Western Free State R6 564 5.78 R1 631 R1 136 4.02- Northern Free State R6 896 5.85 R1 585 R1 179 4.35- Eastern Free State R6 317 5.99 R1 601 R1 055 3.95- North West R4 625 4.50 R1 575 R1 021 2.94- Mpumalanga R8 692 6.00 R1 699 R1 449 5.12- Northern Cape R17 598 13.00 R1 648 R1 350 10.68Sunfl ower:- Northern Free State R4 124 1.85 R4 045 R2 229 1.02- North West R3 294 1.93 R3 922 R1 707 0.84Soya beans:- Eastern Free State R3 705 1.66 R4 936 R2 232 0.75- Mpumalanga R4 715 1.87 R5 080 R2 521 0.93Wheat:
- Eastern Free State R5 051 2.62 R3 165 R1 928 1.60- Overberg R5 312 3.46 R2 796 R1 535 1.90- Northern Cape R16 545 8.28 R2 958 R1 997 5.59Barley:- Overberg R5 077 3.44 R2 743 R1 476 1.85Canola:- Overberg R4 734 1.68 R4 211 R2 809 1.12
Table 14.6: Projections: All regions for the 2014/15 season
Figure 14.13: Gross margin projections for 2014/15 for BFAP typical farms

125
BFAP BASELINE • Agricultural Outlook 2014 -2023
Producing maize in the North West province and Western Free State: A stochastic approach to measure riskWith increasing pressure on profi tability, the impacts of risk and uncertainty typically associated with agricultural production becomes increasingly relevant. While the preceding sections relied on a deterministic view, this section presents a stochastic view of the relative performance of typical farms in the North West and the Western Free State. A stochastic approach accounts for key uncertainties to incorporate risk into the decision making environment. For this purpose, a set of volatile variables are introduced into the model based on historic variations around the deterministic projections of the outlook. The key output variables identifi ed for this purpose include yields, farm gate prices, fertilizer costs and fuel costs. The model is solved 500 times, with relevant variations in the key output variables to provide a range of possible outcomes for both typical farms.
- Farm backgroundThe North West typical farm is situated in the Lichtenburg region and produces maize and sunfl ower in a dryland system. The region has been affected with severe drought conditions in recent years, forcing yields and income down. Farm sizes, crop areas, yield levels and the cost of production differ across the region and thus this analysis relies on the assumption that 784 hectares of maize and 163 hectares of sunfl ower are planted. The respective yield levels for maize and sunfl ower production are higher than the provincial average. All model inputs are based on actual results obtained for the 2012/13 production season and further follow the projections generated by the BFAP sector model. The typical farm in the Western Free State region (Bultfontein) produces dryland maize and is characterised by water table soils which typically generate above average yield levels. A total of 987 hectares of maize was planted in the 2012/13 production season. The region was also affected by dry conditions which caused maize yields to decline from the levels observed from 2010 to 2012.
- The stochastic outputThe stochastic model generated a set of key uncertain outputs which relates to a range of yield levels, farm gate prices and hence crop- and overall profi tability of the typical farms. The key output variables can be summarised as follow:
o The average (mean) simulated farm gate price for 2015 based on historic fl uctuations and current projections of the 2014 Outlook is R1 601 per ton. A maximum price of R2 119 was simulated for the Western Free State typical farm.
o Based on 500 iterations, the average yield in 2015 for the North West province was estimated at 4.37 tons per hectare. For the Western Free State farm the mean yield was simulated at 5.63 tons per hectare.
o The 2015 average gross margin for maize production in the Western Free State is calculated at R2 553 per hectare. For the North West farm, the average gross margin for the same period is R2 302 per hectare. Gross margin from sunfl ower production in the North West is projected at R3 758 per hectare.
o The model indicates that both the North West and the Western Free State farms are likely to realise negative net farming incomes in 2015 and 2016, based on low maize prices and the simultaneous increase in the cost of production. For the purpose of illustrating the future scenario, it is assumed that the current farm structure, management level, production systems and crop areas remains constant and unchanged over the baseline period (2013 – 2020).
Given the current market fundamentals, sunfl ower production is expected to perform better than maize in the North West and the Western Free State, as refl ected by higher gross margins through the outlook period. The margin between sunfl ower and maize gross margins is higher in the short term, with higher prices in the outlying years increasing the relative competitiveness of maize production once more.

126
BFAP BASELINE • Agricultural Outlook 2014 -2023
Figure 14.14: Gross margin stochastic output (2013-2020)
Figure 14.15: North West maize: Gross margin stochastic range
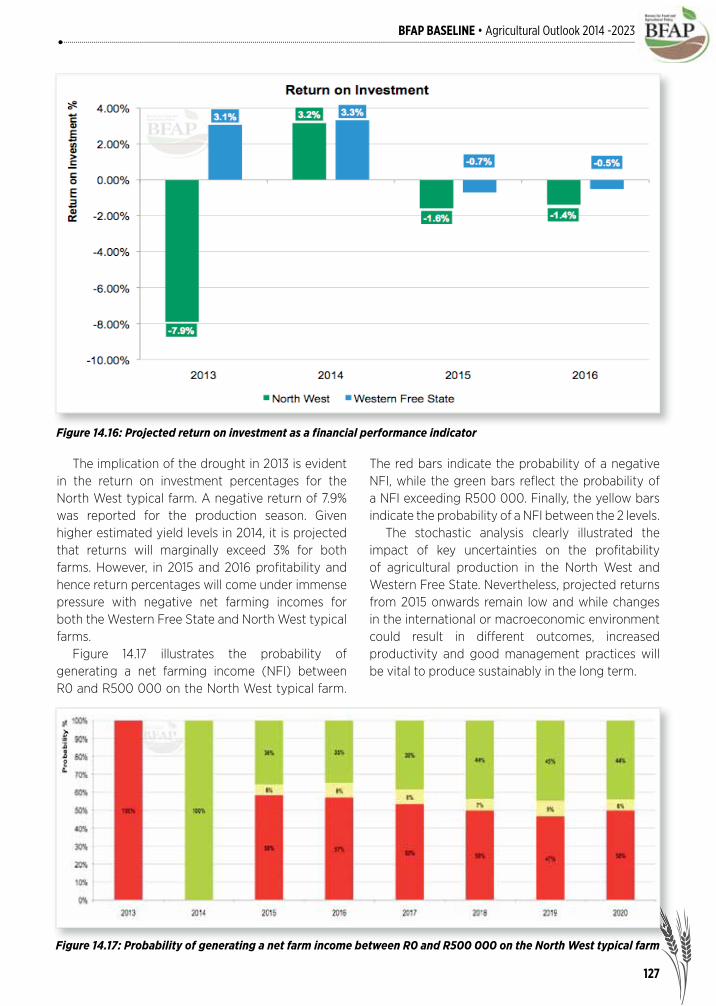
127
BFAP BASELINE • Agricultural Outlook 2014 -2023
Figure 14.16: Projected return on investment as a fi nancial performance indicator
The implication of the drought in 2013 is evident in the return on investment percentages for the North West typical farm. A negative return of 7.9% was reported for the production season. Given higher estimated yield levels in 2014, it is projected that returns will marginally exceed 3% for both farms. However, in 2015 and 2016 profi tability and hence return percentages will come under immense pressure with negative net farming incomes for both the Western Free State and North West typical farms. Figure 14.17 illustrates the probability of generating a net farming income (NFI) between R0 and R500 000 on the North West typical farm.
The red bars indicate the probability of a negative NFI, while the green bars refl ect the probability of a NFI exceeding R500 000. Finally, the yellow bars indicate the probability of a NFI between the 2 levels. The stochastic analysis clearly illustrated the impact of key uncertainties on the profi tability of agricultural production in the North West and Western Free State. Nevertheless, projected returns from 2015 onwards remain low and while changes in the international or macroeconomic environment could result in different outcomes, increased productivity and good management practices will be vital to produce sustainably in the long term.
Figure 14.17: Probability of generating a net farm income between R0 and R500 000 on the North West typical farm

128
BFAP BASELINE • Agricultural Outlook 2014 -2023
Apple and pear production systems (Western Cape) The decision making environment in which the apple and pear farmers operate is particularly uncertain, due in large to the long term nature of deciduous fruit production, technological innovation, exposure to international markets and changing international legislation and regulations. At national level, changing government policies, the macroeconomic environment and climatic conditions further contribute to uncertainty. In contrast to grain and oilseed farms, the 2012/13 production year was a particularly good one for apple and pear producers, characterised by overall good yields and favourable prices, especially for exports due to a weakening exchange rate. At the beginning of the 2013/14 production year however hail storms occurred in specifi c production areas, causing damage to the 2014 crop.
Analyses and projections for a typical apple and pear farm The BFAP FinSim farm level model used in horticultural industries is capable of analysing a given farm business and then projecting future performance for that business. The model is based on specifi c assumptions regarding various controllable parameters such as farm size (for evaluating amongst others the effect of economies of size), enterprise composition, up to 36 orchard blocks for apples and also for pears, each block with a variable replacement cycle, age of fi rst bearing and full bearing, as well as variable annual yields, variable production practices, and variable input and product prices. Various categories or classes of output for apples and pears are provided for in the model to accommodate the different prices in the various market segments. The farm level model is linked to the apple and pear sector model, as well
Cultivar Area Yield (full bearing)
% ha (ton/ha)
Apples:
Granny Smith 20.0 13.4 50
Golden Delicious 25.0 16.7 75
Royal Gala 14.0 9.4 50
Pink Lady / Cripps Pink 7.5 5.0 60
Topred / Starking 15.0 10.1 40
Sundowner 3.0 2.0 70
Fuji 13.0 8.7 55
Braeburn 2.5 1.7 80
Total 100.0 67.0
Pears:
Packham's Triumph 30.0 9.9 60
Forelle 40.0 13.2 45
Bon Chretien 15.0 4.9 45
Beurre Bosc 4.0 1.3 50
Rosemarie / Cheeky 5.0 1.7 35
Abate Fetel 6.0 2.0 50
Total 100.0 33.0
Total cultivated area 100
Table 14.7: Area and yield of apples and pears for a typical farm (2012/13 production year)

129
BFAP BASELINE • Agricultural Outlook 2014 -2023
The total yield per cultivar of apples and pears is divided into various market segments with corre-sponding 2013 prices per market segment, as indi-
cated in Table 14.8. These prices are net farm gate prices and assume a situation where the packaging of the fruit is handled off-farm.
Table 14.8: Grading and farm gate prices of apples and pears on a typical farm in the Western Cape (2012/13 season)
Cultivar Grading (% of yield) Price in R/ton (farm gate price)
Apples: Export Local Hawkers Processing Export Local Hawkers Processing
Granny Smith 45 10 0 45 6 550 2 711 N/A 1225
Golden Delicious 40 20 25 15 5 250 4 214 2 570 1225
Royal Gala 60 15 10 15 6 260 5 300 2 135 1225
Pink Lady / Cripps Pink
35 25 20 20 7 317 6 800 1 690 1225
Topred / Starking 20 60 5 15 7 663 4 563 2 012 1225
Sundowner 65 10 5 20 6 500 5 200 2 000 1225
Fuji 55 20 10 15 6 700 5 000 1 626 1225
Braeburn 65 0 0 35 5 737 N/A N/A 1225
Pears: Export Local Hawkers Processing Export Local Hawkers Processing
Packham's Triumph 50 30 15 5 6 443 5 000 1 591 975
Forelle 70 0 20 10 8 747 N/A 1 675 975
Bon Chretien 60 10 10 20 4 550 4 000 1 670 1 500
Beurre Bosc 70 0 20 10 4 630 N/A 1 090 975
Rosemarie / Cheeky 55 20 10 15 7 360 4 500 1 590 975
Abate Fetel 70 0 0 30 7 214 N/A N/A 975
N/A --- not applicable
Table 14.9: Assumptions regarding apple and pear production practices and costs for a typical farm in the Western
Cape (2012/13 season)
Characteristic Apples Pears
Age of fi rst bearing (year) 4 413
Age of full bearing (year) 8 914
Replacement age (years) 25 30
Establishment cost (R/ha) 209 179 204 956
Directly allocable variablecost (excluding packaging) (R/ha)
90 61415
84 78015
Fixed and other variable cost for the typical farm (including permanent labour) (R)
5 663 96716
Table 14.9 explicitly states some assumptions regarding the production practices and assumed production cost for the typical farm. The specifi ed directly allocable variable costs exclude packaging cost.
13 Packham's Triumph year 614 Forelle year 7 and Packham's Triumph year 1015 full bearing16 excluding interest on capital, land rent and entrepreneurial remuneration

130
BFAP BASELINE • Agricultural Outlook 2014 -2023
Various performance measures were generated for this typical apple and pear farm. The values of the projected performance measures were simulated stochastically and thus allowed for the calculation of amongst others the minimum, mean and maximum
values for each year in the projection period. The mean gross production value (GPV) (“total income”) per hectare for apples and pears are indicated in Figure 14.18 and 14.9 respectively.
Figure 14.18: Variability in the simulated gross production value for apples
Figure 14.19: Variability in the simulated gross production value for pears

131
BFAP BASELINE • Agricultural Outlook 2014 -2023
From Figure 14.18 it is clear that the GPV per hectare for apples displays an upward trend, increasing at a higher rate after 2018. The GPV per hectare for pears, as indicated in Figure 14.19, is likely to increase at a higher rate from 2015 to 2018, before decreasing in 2019 and then increasing again. The differences in the shape, trend and absolute value of the simulated GPV’s are attributed to differences in cultivar composition, age of orchard blocks, the assumed yields of the various cultivars of apples and pears and the market and price structure of the various cultivars for the typical farm. The average GPV for apples are higher in the fi rst three years, but then the average GPV for pears will be higher and more variable. The average gross margin (GM) per hectare for apples and pears is indicated in Figure 14.20. GM is calculated as the difference between the GPV and the directly allocable variable cost (thus non-directly allocable variable cost and fi xed cost items are not deducted). The average GM per hectare for
apples and pears follows the same general pattern as their respective GPV’s. The replacement cycle and thus establishment cost of some orchard blocks over the projection period will have a further effect on the variability in the annual GM, explaining the dip in the mean gross margin for pears in 2019. Net farm income (NFI) is a performance measure that represents the reward to capital, land and the entrepreneurial input. All other cost items are thus deducted from the gross farm income, except for interest paid on borrowed funds, interest earned on own capital, land rent, land lease paid and entrepreneurial remuneration. A negative NFI therefore implies that the three production factors, namely land, capital and entrepreneurial input receive no reward. The probabilities that the annual mean NFI per hectare for a typical apple and pear farm falls within the specifi ed ranges of higher than R80 000 per hectare, between R80 000 and R33 500 per hectare and less than R33 500 per hectare are indicated in Figure 14.21.
Figure 14.20: Simulated mean gross margin for apples and pears (R/ha planted)
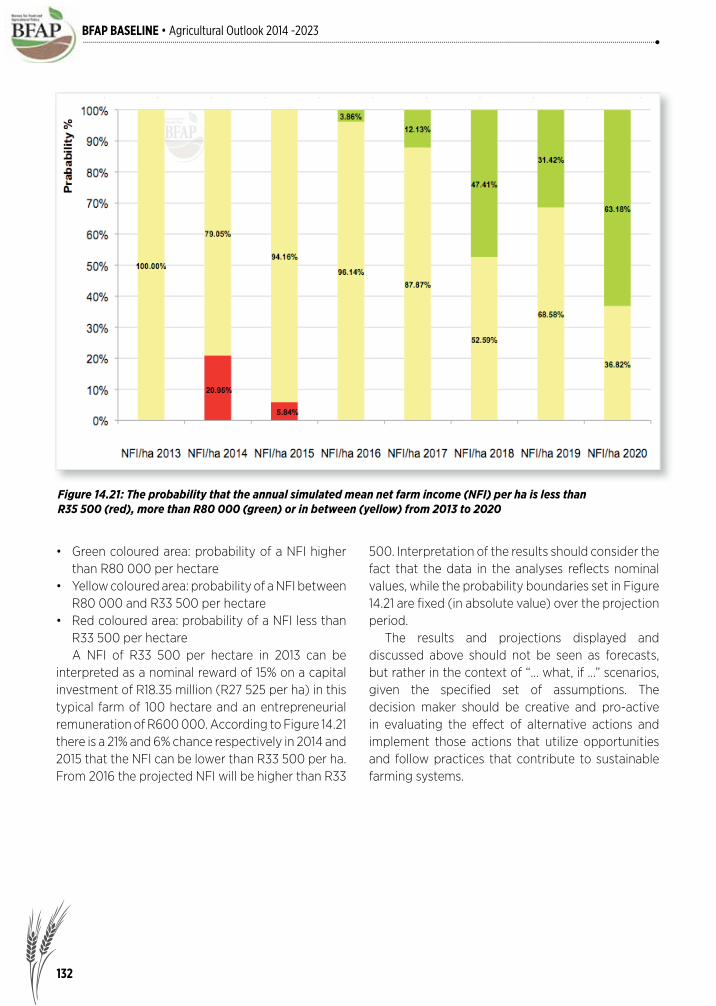
132
BFAP BASELINE • Agricultural Outlook 2014 -2023
Figure 14.21: The probability that the annual simulated mean net farm income (NFI) per ha is less than R35 500 (red), more than R80 000 (green) or in between (yellow) from 2013 to 2020
• Green coloured area: probability of a NFI higher than R80 000 per hectare
• Yellow coloured area: probability of a NFI between R80 000 and R33 500 per hectare
• Red coloured area: probability of a NFI less than R33 500 per hectare
A NFI of R33 500 per hectare in 2013 can be interpreted as a nominal reward of 15% on a capital investment of R18.35 million (R27 525 per ha) in this typical farm of 100 hectare and an entrepreneurial remuneration of R600 000. According to Figure 14.21 there is a 21% and 6% chance respectively in 2014 and 2015 that the NFI can be lower than R33 500 per ha. From 2016 the projected NFI will be higher than R33
500. Interpretation of the results should consider the fact that the data in the analyses refl ects nominal values, while the probability boundaries set in Figure 14.21 are fi xed (in absolute value) over the projection period. The results and projections displayed and discussed above should not be seen as forecasts, but rather in the context of “… what, if …” scenarios, given the specifi ed set of assumptions. The decision maker should be creative and pro-active in evaluating the effect of alternative actions and implement those actions that utilize opportunities and follow practices that contribute to sustainable farming systems.

133
BFAP BASELINE • Agricultural Outlook 2014 -2023
Area (%) Yield (full bearing)
Production region Ceres EGVV Ceres EGVV
Cultivar: % % (ton/ha) (ton/ha)
Granny Smith 13 21 65 53
Golden Delicious 22 25 75 60
Royal Gala 15 14 50 50
Pink Lady / Cripps Pink 15 10 70 60
Topred / Starking 19 10 60 45
Fuji 11 10 80 50
Braeburn 5 5 80 60
Sundowner 0 5 na 60
Total 100 100
EGVV --- Elgin, Grabouw, Vyeboom and Villiersdorp
Table 14.10: Area, cultivar and yield of apples for 2 typical apple and pear farms in South Africa, 2011
Agri benchmark international comparisonsAgri benchmark Horticulture is the latest addition to the global agri benchmark initiative, which also includes cash crops, beef and sheep, pork, dairy and organic systems. The fi rst results for apples have recently been made available. The network has the objective of comparing farming systems on a global scale, thereby creating a better understanding of agriculture worldwide. At the outset, the horticulture network included four countries, namely South Africa, Germany, Italy and Chile. Switzerland joined the group as fi fth member in 2012. Two typical apple farms in South Africa form part of this network, namely in Ceres (100 ha) and in the EGVV (Elgin,
Grabouw, Vyeboom and Villiersdorp) region (80 ha). The cultivar composition and full bearing yields are presented in Table 14.10. The establishment cost of apple orchards in 2011, on typical farms in the various countries are indicated in Figure 14.22. Chile registered the lowest establishment cost, while the establishment cost in South Africa was below that in Germany and Italy. The cost of trees for the typical farms in Germany and Italy was higher than for the typical farms in South Africa and Chile; however subsidies were paid in two cases.

134
BFAP BASELINE • Agricultural Outlook 2014 -2023
Figure 14.22: Establishment cost (€ per ha) for apples (2011) on various typical farms in Germany (DE), Italy (IT), Chile (CL) and South Africa (ZA)
Figure 14.23: Yield (ton/ha) and gross revenue (€ per ha) for apples (2010, 2011, 2012) on various typical farms in Germany (DE), Switzerland (CH), Italy (IT), Chile (CL) and South Africa (ZA)

135
BFAP BASELINE • Agricultural Outlook 2014 -2023
Figure 14.24: Input cost (€ per ha) for apples (2012) on various typical farms in Germany (DE), Switzerland (CH), Italy (IT), Chile (CL) and South Africa (ZA)
The average yield and gross revenue per hectare for the typical farms are indicated in Figure 14.23. The size of the respective typical farms are also listed in the fi gure and differs widely, with only one Chilean and the two South African typical farms that are relatively large and have comparable average yields. The highest average yields were on the smaller typical farm in Chile. The gross revenue on the South African typical farms and the larger Chilean farm were of the lowest, while the higher gross revenues were realised on the typical farms in the European countries.
Some of the input cost items for the typical apple farms are indicated in Figure 14.24. The lowest specifi ed input cost per hectare was on the larger typical apple farm in Chile, while the highest specifi ed cost per hectare was on the typical farm in Switzerland. The cost of insecticides are relatively higher for the two South African typical farms, while the cost for fungicides are lower than on some of the other typical farms.

136
BFAP BASELINE • Agricultural Outlook 2014 -2023
REFERENCES & ACKNOWLEDGEMENTS:
Crop Estimated Committee. 2014. The fourth production forecast for summer crops for 2014.Grain South Africa. 2014. Monitoring of international and domestic input trends.Grain South Africa. 2011. Fertilizer Report. Available online at http: //www. grainsa.co.za/upload/report_fi les/ Kunsmisverslag-Volledig.pdf. Accessed on 15 June 2014Excelsus. 2014. Production statistics: Eastern Free State for the 2012/13 production season. GWK limited. 2014. Production statistics: Northern Cape irrigation region for the 2012/13 production season.Hortgro Services. 2014. Key deciduous fruit statistics 2013.NWK limited. 2014. Production statistics: North West province for the 2012/13 production season.Senwes Limited. 2014. Production statistics: Northern- and western Free State regions for 2012/13 production season.Senwes Limited. 2014. Crop budgets for the Mpumalanga region for the 2014/15 production season. Overberg Agri Limited. 2014. Production statistics: Overberg region for the 2012/13 production season.Potatoes South Africa. 2014. Production statistics: Eastern Free State, Sandveld, KwaZulu-Natal and Limpopo regions for the 2012/13 production season.Thunen Institute. 2014. agri benchmark Horticulture results database. www.agribenchmmark.org.

137
BFAP BASELINE • Agricultural Outlook 2014 -2023
Future scenarios for Southern Africanmaize trade
This chapter is presented in collaboration with the Regional Network of Agricultural Policy Research Institutes (ReNAPRI).
IntroductionBefore the maize market was liberalized, trade in South Africa was relatively simple. Under controlled marketing, maize prices were set by the Maize Board at levels that were in many years signifi cantly higher than export parity levels. Furthermore, maize prices were also far less volatile than under a free market regime. As a consequence the area under maize production expanded rapidly and in years of good rains, farmers produced a surplus of maize, which was then exported by the Maize Board. Maize was often exported at a so called ‘loss’ when the local prices that were offered to farmers where higher than export parity. This loss was cross subsidized by higher prices on the local market. In short, the Maize Board was applying the principles of a surplus removal scheme. With the abolition of the marketing boards a completely new environment of price discovery was introduced with the opening of the futures markets and local supply and demand dynamics driving the relative level of maize prices within an import-export parity price band. Over the past fi ve years structural shifts in regional maize markets have brought along a new set of dynamics. Surplus production out of Zambia and Malawi has started feeding into South Africa’s traditional white maize export markets. In the 2011/12 season, a severe drought led to a shortfall in the Mexican white maize market, allowing South African exporters to ship large surpluses of white maize into
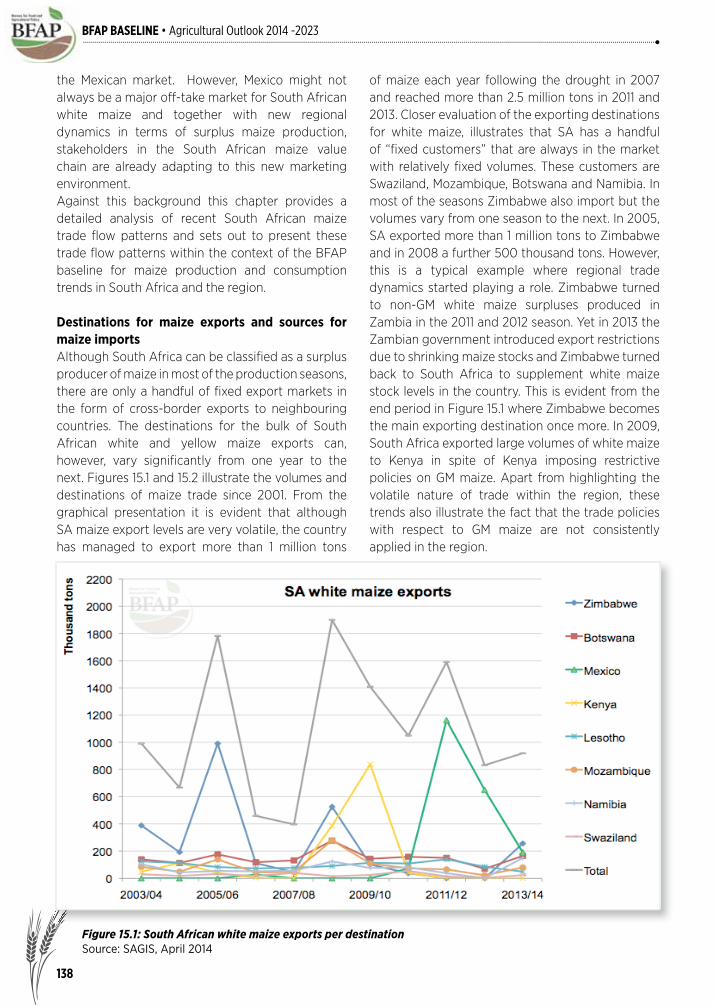
138
BFAP BASELINE • Agricultural Outlook 2014 -2023
the Mexican market. However, Mexico might not always be a major off-take market for South African white maize and together with new regional dynamics in terms of surplus maize production, stakeholders in the South African maize value chain are already adapting to this new marketing environment. Against this background this chapter provides a detailed analysis of recent South African maize trade fl ow patterns and sets out to present these trade fl ow patterns within the context of the BFAP baseline for maize production and consumption trends in South Africa and the region.
Destinations for maize exports and sources for maize importsAlthough South Africa can be classifi ed as a surplus producer of maize in most of the production seasons, there are only a handful of fi xed export markets in the form of cross-border exports to neighbouring countries. The destinations for the bulk of South African white and yellow maize exports can, however, vary signifi cantly from one year to the next. Figures 15.1 and 15.2 illustrate the volumes and destinations of maize trade since 2001. From the graphical presentation it is evident that although SA maize export levels are very volatile, the country has managed to export more than 1 million tons
of maize each year following the drought in 2007 and reached more than 2.5 million tons in 2011 and 2013. Closer evaluation of the exporting destinations for white maize, illustrates that SA has a handful of “fi xed customers” that are always in the market with relatively fi xed volumes. These customers are Swaziland, Mozambique, Botswana and Namibia. In most of the seasons Zimbabwe also import but the volumes vary from one season to the next. In 2005, SA exported more than 1 million tons to Zimbabwe and in 2008 a further 500 thousand tons. However, this is a typical example where regional trade dynamics started playing a role. Zimbabwe turned to non-GM white maize surpluses produced in Zambia in the 2011 and 2012 season. Yet in 2013 the Zambian government introduced export restrictions due to shrinking maize stocks and Zimbabwe turned back to South Africa to supplement white maize stock levels in the country. This is evident from the end period in Figure 15.1 where Zimbabwe becomes the main exporting destination once more. In 2009, South Africa exported large volumes of white maize to Kenya in spite of Kenya imposing restrictive policies on GM maize. Apart from highlighting the volatile nature of trade within the region, these trends also illustrate the fact that the trade policies with respect to GM maize are not consistently applied in the region.
Figure 15.1: South African white maize exports per destinationSource: SAGIS, April 2014

BFAP BASELINE • Agricultural Outlook 2014 -2023
Figure 15.2: South African yellow maize exports per destinationSource: SAGIS, April 2014
Since human consumption of white maize as a staple food is not common, deep sea export destinations are limited for South African white maize. In the 2011/12 season Mexico experienced a drought and SA exported large volumes of white maize for the human consumption market. SA white maize was competitively priced due to large surpluses in the local market. Similar to white maize, yellow maize export levels are also very volatile and apart from a handful of consistent and small clients engaging in cross-border trade, the major export destinations are changing based on relative pricing of SA yellow maize in the world market. Typical markets where SA yellow maize has competed in recent years include Korea, Japan and Taiwan. The sources of white maize for imports into South Africa are extremely limited. Over the past
decade it was only Zambia that was able to export competitively priced white maize into the South African market. Whereas SA imported relatively consistent volumes of yellow maize into the Cape Town harbour in the past, these imports have basically disappeared beyond 2007 and SA has become a net exporter of yellow maize. There is a wide range of competitive sources of yellow maize in the world market that can be imported to South Africa if local prices increase to import parity levels. These sources include Argentina, Brazil and in more recent years Ukraine has become a very competitive exporter of yellow maize. It is important to note that apart from varying production levels, the switch between white and yellow maize in the feed market is an important driver to balance ending stocks in the market.
139

140
BFAP BASELINE • Agricultural Outlook 2014 -2023
Figure 15.3: South African white maize imports by sourceSource: SAGIS, April 2014
Figure 15.4: South African yellow maize imports by sourceSource: SAGIS, April 2014

141
BFAP BASELINE • Agricultural Outlook 2014 -2023
Figure 15.5: Leading Southern African exporting countriesSource: ITC, April 2014
Shifting fundamentals in regional maize marketsIt is worthwhile to consider the structural changes that have already occurred in regional maize markets or the shifts that might occur in these markets under certain assumptions. Since 2008 a handful of countries in Southern and Eastern Africa have started producing surpluses of maize and although poor infrastructure (lack of rail, poor roads, lack of storage) provides a major challenge for exporting large volumes of grain, the fl ow of basic grains across borders has picked up signifi cantly. Figure 15.5 presents the volumes of maize exported by the various countries excluding South Africa. Although South Africa is the leading exporter, signifi cant surpluses have emerged in Zambia, Malawi, Tanzania and Uganda. In fact, Uganda is starting to play a pivotal role in East and to some extent central African food security (mainly South Sudan, Eastern and North-Eastern parts of DRC and Western Kenya when experiencing dry conditions). Although highly volatile, there has been an increasing trend in the level of surpluses produced in the region, and these surpluses are starting to affect the potential exporting destinations for SA white maize, especially because the white maize that is produced in these countries is non-GM maize. There are various factors infl uencing the sharp
rise in production in countries like Zambia and Malawi. In the case of Zambia the area of maize harvested has increased by 64% between 2008 and 2013. Much of this increase can be attributed to farm area expansion resulting from the government’s Food Reserve Agency’s (FRA) buying activities, which offers a maize price to small scale farmers that is signifi cantly higher than market prices and an expansion of the fertilizer and maize seed subsidy. Together these have provided suffi cient incentive for small scale growers to expand the area under maize production. Equally important, in terms of maize area harvested, has been the favourable weather conditions that have prevailed in Zambia over this same period. However, the generally favourable maize cropping conditions that have prevailed since 2008 did witness some deterioration from 2012 to 2013. A widespread mid-season drought in February and March 2013, which affected the maize crop during its maturation phase, coupled with an early season army worm attack in some major maize producing regions, contributed to an aggregate decline in maize production of 10.8%. This decline results from a 9.3% decline in maize yields, compared to 2012, and a 1.5% decline in area harvested.
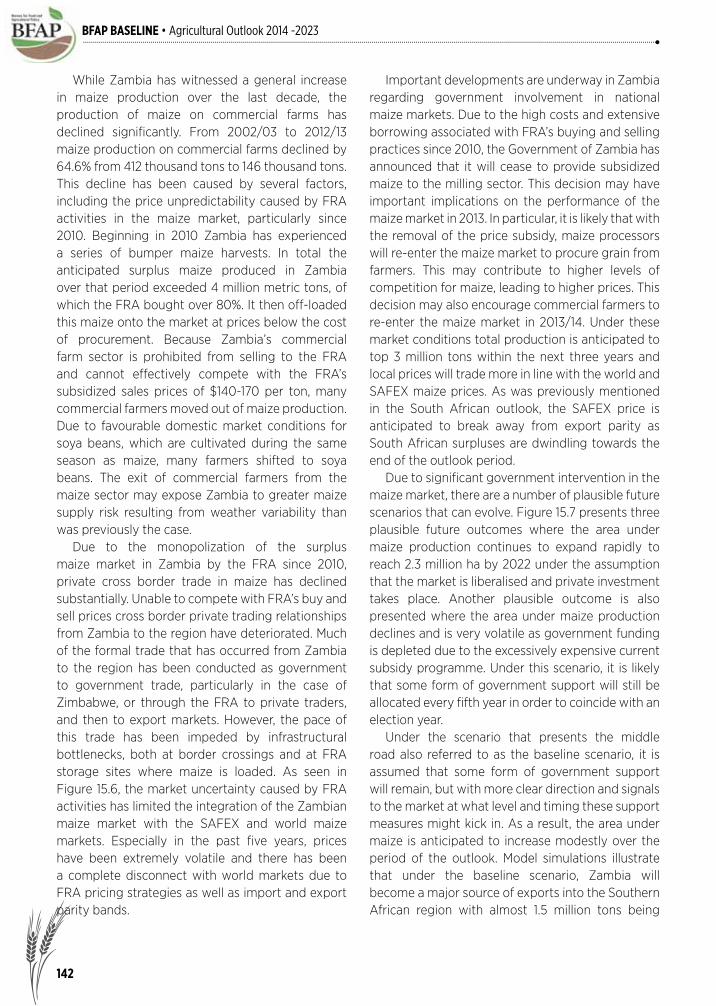
142
BFAP BASELINE • Agricultural Outlook 2014 -2023
While Zambia has witnessed a general increase in maize production over the last decade, the production of maize on commercial farms has declined signifi cantly. From 2002/03 to 2012/13 maize production on commercial farms declined by 64.6% from 412 thousand tons to 146 thousand tons. This decline has been caused by several factors, including the price unpredictability caused by FRA activities in the maize market, particularly since 2010. Beginning in 2010 Zambia has experienced a series of bumper maize harvests. In total the anticipated surplus maize produced in Zambia over that period exceeded 4 million metric tons, of which the FRA bought over 80%. It then off-loaded this maize onto the market at prices below the cost of procurement. Because Zambia’s commercial farm sector is prohibited from selling to the FRA and cannot effectively compete with the FRA’s subsidized sales prices of $140-170 per ton, many commercial farmers moved out of maize production. Due to favourable domestic market conditions for soya beans, which are cultivated during the same season as maize, many farmers shifted to soya beans. The exit of commercial farmers from the maize sector may expose Zambia to greater maize supply risk resulting from weather variability than was previously the case. Due to the monopolization of the surplus maize market in Zambia by the FRA since 2010, private cross border trade in maize has declined substantially. Unable to compete with FRA’s buy and sell prices cross border private trading relationships from Zambia to the region have deteriorated. Much of the formal trade that has occurred from Zambia to the region has been conducted as government to government trade, particularly in the case of Zimbabwe, or through the FRA to private traders, and then to export markets. However, the pace of this trade has been impeded by infrastructural bottlenecks, both at border crossings and at FRA storage sites where maize is loaded. As seen in Figure 15.6, the market uncertainty caused by FRA activities has limited the integration of the Zambian maize market with the SAFEX and world maize markets. Especially in the past fi ve years, prices have been extremely volatile and there has been a complete disconnect with world markets due to FRA pricing strategies as well as import and export parity bands.
Important developments are underway in Zambia regarding government involvement in national maize markets. Due to the high costs and extensive borrowing associated with FRA’s buying and selling practices since 2010, the Government of Zambia has announced that it will cease to provide subsidized maize to the milling sector. This decision may have important implications on the performance of the maize market in 2013. In particular, it is likely that with the removal of the price subsidy, maize processors will re-enter the maize market to procure grain from farmers. This may contribute to higher levels of competition for maize, leading to higher prices. This decision may also encourage commercial farmers to re-enter the maize market in 2013/14. Under these market conditions total production is anticipated to top 3 million tons within the next three years and local prices will trade more in line with the world and SAFEX maize prices. As was previously mentioned in the South African outlook, the SAFEX price is anticipated to break away from export parity as South African surpluses are dwindling towards the end of the outlook period. Due to signifi cant government intervention in the maize market, there are a number of plausible future scenarios that can evolve. Figure 15.7 presents three plausible future outcomes where the area under maize production continues to expand rapidly to reach 2.3 million ha by 2022 under the assumption that the market is liberalised and private investment takes place. Another plausible outcome is also presented where the area under maize production declines and is very volatile as government funding is depleted due to the excessively expensive current subsidy programme. Under this scenario, it is likely that some form of government support will still be allocated every fi fth year in order to coincide with an election year. Under the scenario that presents the middle road also referred to as the baseline scenario, it is assumed that some form of government support will remain, but with more clear direction and signals to the market at what level and timing these support measures might kick in. As a result, the area under maize is anticipated to increase modestly over the period of the outlook. Model simulations illustrate that under the baseline scenario, Zambia will become a major source of exports into the Southern African region with almost 1.5 million tons being
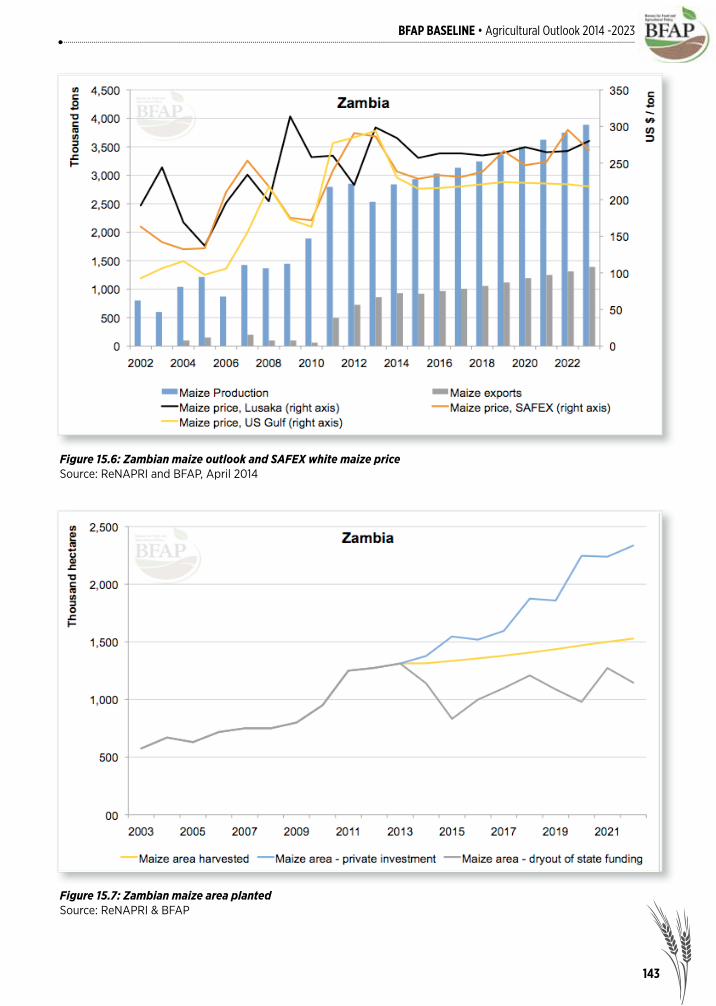
143
BFAP BASELINE • Agricultural Outlook 2014 -2023
Figure 15.6: Zambian maize outlook and SAFEX white maize priceSource: ReNAPRI and BFAP, April 2014
Figure 15.7: Zambian maize area plantedSource: ReNAPRI & BFAP
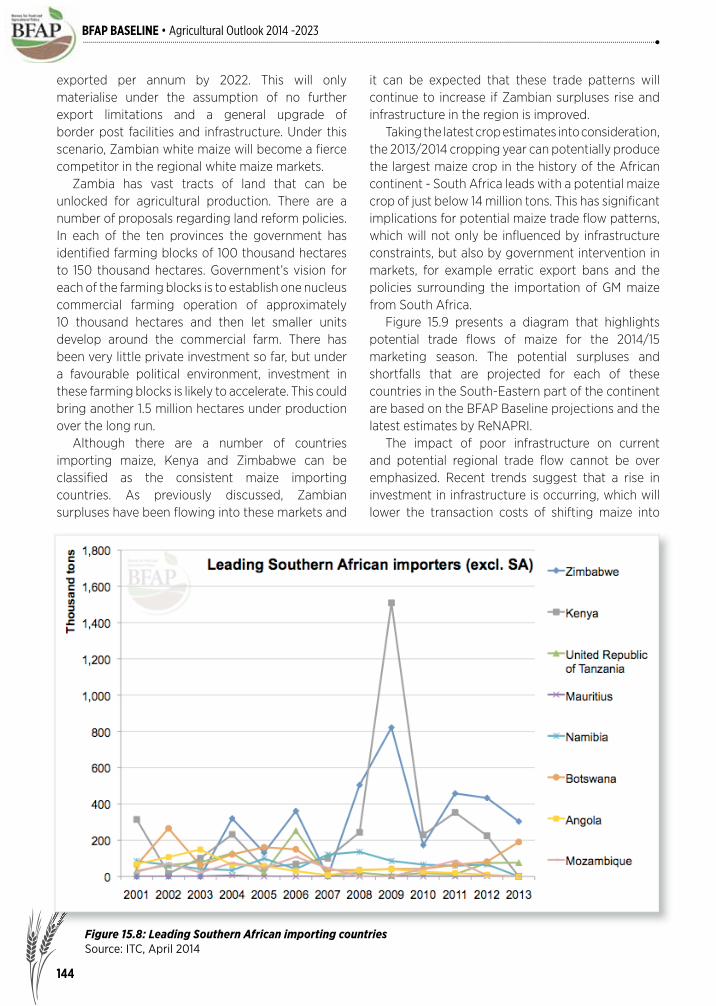
144
BFAP BASELINE • Agricultural Outlook 2014 -2023
exported per annum by 2022. This will only materialise under the assumption of no further export limitations and a general upgrade of border post facilities and infrastructure. Under this scenario, Zambian white maize will become a fi erce competitor in the regional white maize markets. Zambia has vast tracts of land that can be unlocked for agricultural production. There are a number of proposals regarding land reform policies. In each of the ten provinces the government has identifi ed farming blocks of 100 thousand hectares to 150 thousand hectares. Government’s vision for each of the farming blocks is to establish one nucleus commercial farming operation of approximately 10 thousand hectares and then let smaller units develop around the commercial farm. There has been very little private investment so far, but under a favourable political environment, investment in these farming blocks is likely to accelerate. This could bring another 1.5 million hectares under production over the long run. Although there are a number of countries importing maize, Kenya and Zimbabwe can be classifi ed as the consistent maize importing countries. As previously discussed, Zambian surpluses have been fl owing into these markets and
it can be expected that these trade patterns will continue to increase if Zambian surpluses rise and infrastructure in the region is improved. Taking the latest crop estimates into consideration, the 2013/2014 cropping year can potentially produce the largest maize crop in the history of the African continent - South Africa leads with a potential maize crop of just below 14 million tons. This has signifi cant implications for potential maize trade fl ow patterns, which will not only be infl uenced by infrastructure constraints, but also by government intervention in markets, for example erratic export bans and the policies surrounding the importation of GM maize from South Africa. Figure 15.9 presents a diagram that highlights potential trade fl ows of maize for the 2014/15 marketing season. The potential surpluses and shortfalls that are projected for each of these countries in the South-Eastern part of the continent are based on the BFAP Baseline projections and the latest estimates by ReNAPRI. The impact of poor infrastructure on current and potential regional trade fl ow cannot be over emphasized. Recent trends suggest that a rise in investment in infrastructure is occurring, which will lower the transaction costs of shifting maize into
Figure 15.8: Leading Southern African importing countriesSource: ITC, April 2014

145
BFAP BASELINE • Agricultural Outlook 2014 -2023
Figure 15.9: White and yellow maize trade fl ow scenario 2014/15
the future. Figure 15.10 clearly illustrates the major lack of railway lines in Africa to move large volumes of grain at lower prices. Currently most of the grain is moved by trucks. Table 15.1 shows the Union of
African Railways’ master plan for the development and improvement of railway lines for 10 corridors in Africa.

146
BFAP BASELINE • Agricultural Outlook 2014 -2023
Figure 15.10: Rail map of AfricaSource: AICD database
Corridor Countries linked
1 North-Centre -South Libya-Niger-Chad-Central African republic (CAR)CAR-Republic of Congo –DRC-Angola-Namibia
2 West- Centre Senegal-Mali-Burkina Faso – Niger- Nigeria – ChadCote d’Ivoire-Ghana-Togo-Benin-Nigeria-Cameroon
3 North-East Sudan-Ethiopia-Kenya-Tanzania-Uganda
4 North-East-West Sudan-Chad-Nigeria
5 East-South Tanzania-Rwanda-DRC-UgandaDar es Salaam-Kigoma-Burundi
6 East-Centre Sudan-CAR-CameronKenya-Uganda-DRC
7 North Morocco-Algeria-Tunisia-Libya-Egypt-Mauritania
8 East-South Tanzania-Zambia-Zimbabwe-Mozambique-South Africa
9 Centre-South Cameroon-Gabon-Republic of Congo-DRC-Angola-Namibia
10 North-West Senegal-Mauritania-Morocco
Source: Union of African Railways, 2006
Table 15.1: Union of African Railways 10-corridor master plan

147
BFAP BASELINE • Agricultural Outlook 2014 -2023
The future ofAfrican agriculture:Examining the trends shaping the African food system
This chapter briefl y discusses mega-trends related to population demographics, income growth and natural resource distribution and assesses their effect on the pattern of private sector investment within the African food system.

148
BFAP BASELINE • Agricultural Outlook 2014 -2023
THE ERADICATION OF EXTREME POVERTY and hunger by 2015 is one of the eight Millennium Development Goals (MDG’s) established by the United Nation member states in 2000 (UN, 2014a). By July 2003, the Comprehensive Africa Agriculture Development Programme (CAADP) was outlined by the African Union. The overall goal of the program is to reduce poverty and ensure food security for African countries through an agriculture-led development strategy. To achieve the goal, the objective of realizing, a 6% annual agricultural growth rate by 2015 was established (NEPAD, 2014). To further assist the progress towards achieving the MDG’s, in June 2005, the G8 fi nance ministers approved the release of funds to the World Bank, International Monetary Fund (IMF) and the African Development Bank (AfDB) for debt relief of Heavily Indebted Poor Countries (HIPC) (IMF, 2014). The cumulative effect of these commitments and investments is that today half of the world’s ten fastest growing economies can be found in Sub-Saharan Africa (Kearney, 2014). The rapid transformation occurring within Africa has spawned efforts to identify the “mega-trends” driving the region’s economic growth. These trends shaping the economic, political and social landscapes in the region can be classifi ed into three distinct categories. These include; population demographics, income growth and natural resource distribution. In general the direction of these mega-trends is taken as given and the anticipated futures are often based on tenuous assumptions about the degree to which these trends are inevitable exogenous forces (Jayne, et. al., 2014b). However, most of these trends are neither irreversible nor inevitable. Just as current trends and transformations being observed in African food systems are the outcomes of prior decades’ policies and public investment patterns, the future will be shaped and transformed by today’s policy actions – either those taken proactively or those taken passively as a result of no action (Seidman, 1973). In this light, the objective of this chapter is to contribute to a greater societal awareness of the potential to shape future outcomes through engagement in the political process. Rather than adopting analytical frameworks that reinforce perceptions of predetermined outcomes being
driven by exogenous mega-trends, we argue that a major role of the state is to engage the public in
determining what a “good society” would look like and then implement the policies and investments that will direct private capital toward achieving this vision, anticipating the impacts of trends that cannot or should not be altered, and planning accordingly. Toward this end, Scenario Planning is the framework used to analyze the given mega-trends and their complex interactions and in so doing develop plausible future outcomes for the African food system. Based on this analysis, we derive four plausible scenarios of future African food systems and discuss the pattern of private sector investment and how policy choices will infl uence which of these four scenarios manifest in the next several decades (Jayne, et. al., 2014b).
Mega-trends Shaping Africa’s Food System
DemographicsAfrica has a unique age demographic relative to Europe and North America. Currently, 43% of the total Sub-Saharan African population is below the age of 14 (Figure 16.1). As a result, between now and 2025, over 330 million young Africans will enter the labour force (Fine, et. al., 2012). Yet, even under the most favourable scenario, the non-farm sector will be able to absorb at most 200 million of the youth into gainful employment (Jayne, et. al., 2014b). Therefore, incentives and the ability of young people to engage in primary agriculture, as well as the development of agri-business ventures that are labour-intensive and competitive, will be critical in order to mitigate the social and political impact of a disenfranchised youth.
Income growth and distributionRising urbanization and growing per capita incomes are expected to dramatically change food consumption patterns on the continent, resulting in African households moving away from staple commodities towards high-valued products (Minde, et. al., 2011). However, this transformation is largely dependent on the type of urbanization and the distributional pattern of income growth. While the rate of urbanization is taken as given (Figure 16.2), only two-thirds of urban population growth is based on fertility rates among urban families. Fully one-third of urban population growth is due to rural-urban migration, largely driven by

149
BFAP BASELINE • Agricultural Outlook 2014 -2023
Figure 16.1: Population by age groups, 2012Source: United Nations Population Division’s World Population Prospects, 2014b
rural land scarcity and low profi tability of smallholder agriculture (Jayne et. al., 2014a). Massive urban growth without broad-based income growth will not result in the emergence of consumption cities as is currently anticipated. Initial
evidence indicates a skewed distribution in income growth. Figure 16.3 illustrates the total income share held by the top 20% of the population in the fastest growing African economies between 2000 and 2011.
Figure 16.2: Total Urban Population Projections (millions)Source: United Nations Population Division’s World Population Prospects, 2014b

150
BFAP BASELINE • Agricultural Outlook 2014 -2023
Figure 16.3: Income share held by the highest 20% in Select African Economies (2000 – 2011)Source: World Bank, Development Research Group, 2014
Figure 16.3 indicates that the concentration of wealth into the hands of a few is rising within the growing economies of Sub-Saharan Africa. Rising income for this class of consumers will result in changing consumption patterns; however, this change in demand is largely met by rising imports from foreign markets. Between 2001 and 2012 a growing proportion of Sub-Saharan African (SSA) import demand for high-value products was met by non-SSA countries (Figure 16.4). Figure 16.4 demonstrates that while urban demand for convenience foods (many of which are considered basic food staples) is rising rapidly in Africa, food import demand is mainly being met by world markets. This has implications on the development of African-based agro-processing sector.
Natural Resource Distribution: LandSince the sustained jump in global food prices starting in 2007 and the subsequent interest in agricultural land, large-scale land acquisitions in SSA have been on the rise. Between 2005 and 2012, 22.7
million hectares of land across SSA was acquired through land deals of greater than 2,000 hectares (Schoneveld, 2012). This is equivalent to anywhere between 11 and 35 percent of total potentially available cropland (Jayne et. al., 2014a). Of the total land transferred, 19.2 million hectares were recorded as having foreign fi rms as the sole or majority shareholders. However, rising incomes among the urban elite is driving revolutionary changes in farm structures on the continent. Recent studies conducted by Jayne, et. al. (2014a) indicate that the pace of land acquisitions by medium-scale African investors overshadows large-scale foreign investors and refl ects a fundamental change in farm structure as wealthy urban-based individuals increase their investment in agricultural land. In Zambia, for example, land under medium-scale holdings (5 to 100 hectares) rose from 42 percent to 52 percent of total farmland between 2009 and 2012. However, despite the rise in investment, less than 50% of this land came under cultivation (Table 16.1).

151
BFAP BASELINE • Agricultural Outlook 2014 -2023
Figure 16.4: Non-Sub-Saharan Countries’ share of high-value food 17 imports by Sub-Saharan Africa.Source: ITC Trade Map, 2014
17 The food products included in this fi gure follow Womach (2005) and are divided into three groups: (1) semi-processed products, such as fresh and frozen meats, staple grain meals and fl our, vegetable oils, roasted coffee, tea, and sugar; (2) highly processed products that are ready for the consumer, such as milk, cheese, wine, breakfast cereals; and (3) high-value unprocessed products that are also often consumer-ready, such as fresh and dried fruits and vegetables, eggs, and nuts.
Landholding size Category
Number of farms % change % of total farmland
Share of landholding
cultivated (2012)2001* 2009 2012 (2001-2012)
2009 2012
0-2 ha 638118 916787 748771 17.3% 24.1% 16.2% 91.2%
2-5 ha 159039 366628 418544 163.2% 33.8% 31.7% 66.4%
5-10 ha 20832 110436 165129 692.6% 20.3% 25.0% 49.5%
10-20 ha 2352 35898 53454 2272.7% 12.3% 15.0% 36.7%
20 - 100 ha -- 9030 13839 53.3% 9.5% 12.0% 10.9%
Total 820341 1438779 1399737 70.6% 100.0% 100.0%
Source: Jayne et. al., 2014a
Table 16.1: Changes in farm structure among small- and medium-scale farmers in Zambia (2009 – 2012)

152
BFAP BASELINE • Agricultural Outlook 2014 -2023
Implications for Private Sector Investments The current trends and transformations being observed in the African food system are neither irreversible nor inevitable; the future can be shaped and transformed to serve social policy goals. To demonstrate this fact, scenario planning is the framework used to analyze the given mega-trends and their complex interactions and in so doing develop plausible future outcomes for the African food system (Jayne et. al., 2014b). The resulting scenarios can be regarded as a possible view of the world rather than a prediction of the future (Glen, 2006). The aim is to identify key drivers of change and their possible implications for private sector investments within the African food system. In order to generate the scenarios, two key uncertainties were identifi ed; namely, (1) global food prices; and (2) the distribution of urban income growth. The selection was determined by the high-impact potential and the internal and
external consistency exhibited by these trends relative to alternative mega-trends affecting Africa’s food system. In particular, these drivers describe uncertainties that could generate plausible scenarios that are relevant to all the key stakeholders. The extremes of the selected drivers are defi ned as follows;• World food prices rise over the next 10 years
vs. world food prices stay constant with a slight decline
• Broad-based urban income growth vs. rapid income growth among the top 30% of urban households
Given the key drivers, four plausible scenarios emerge, as illustrated in Figure 16.5. The impact on the incentive and/or disincentive structures for the private sector; the resulting change in behavior; and the ultimate performance of the African food system
Figure 16.5: Scenario Matrix for the African Food SystemSource: Jayne, et. al., 2014b
Scenario 2: Africa RisesScenario 3: Slow & steady
Scenario 4: Small and Ineffi cient
Scenario 1: Large and ineffi cient
Broad-based urban income growth
Constant ordeclining
global foodprices
Rise in globalfood prices
Skewed urban income growth
153
BFAP BASELINE • Agricultural Outlook 2014 -2023
Scenario 1: Large and Ineffi cient farming systemsUnder this scenario global food prices continue to rise over the next 10 years and a skewed distribution in urban income growth has the top 30% of urban households realizing a rapid rise in income while the remaining households experience little to no growth. Rising income among the urban elite will result in changing consumption patterns as this class of consumer moves away from staple commodities towards high-valued products. Although proportionally small, the sheer size of Africa’s urban elites will be suffi cient to attract major foreign investment in food retailing and upper- and middle-class consumer goods. However, while urban demand for convenience foods is expected to rise rapidly in Africa, currently food import demand is mainly being met by world markets as illustrated in Figure 16.4. Private fi rms in the region repeatedly warn that while urban populations and hence demand are growing rapidly, there are major concerns over whether adequate supplies can be sourced through local production to meet this demand. Only around 20 percent of Africa’s farmers are earning cash incomes over the poverty line from the sale of agricultural products in domestic markets. Private sector fi rms often acknowledge that Africa may be exporting food commodities but that most of the processing and value added is carried out internationally. The pattern of trade shown in Figure 16.4 results in employment being lost to overseas suppliers that could otherwise have accrued to local producers and downstream processing and marketing stages of the food system if urban demand were more effectively met by local production (Jayne et al., 2010). The data in Figure 16.4 caution us from assuming that urbanization and urban income growth will necessarily ensure modernization and rapid growth of Africa’s food systems. The increase in disposable income and subsequent rise in savings combined with rising global food prices will stimulate increasing investments in land as an alternative form of savings among the urban elite. Such circumstances will accelerate pressures on the state to convert large tracts of land from
traditional tenure structures to statutory tenure systems where land can be privately owned through title deeds acquired through land markets. These developments would accelerate already profound shifts in farm structure, featuring rising inequality in land distribution. Over the next 10 years, we anticipate rising concentration of land into the hands of the few, with over 65% of total agricultural land being held by medium-scale farmers (Jayne, et. al., 2014b). Under this scenario we expect the measures of landholding inequality to rise between 7 to 11 percent18, moving the African farming structure from an egalitarian system towards the Latifundia structures of Latin America. The impact on farm productivity is unclear. Increased access to credit and subsidy programs may result in rising technology adoption and therefore yields for medium to large-scale farmers. Evidence to date shows an inverse relationship between farm-size and effi ciency over a range of one to ten hectares. However there is very little evidence on effi ciency differences between medium- and large-scale farms (Jayne et. al., 2014a) As in the case of the sustained jump in global food prices starting in 2007 and the subsequent interest in agricultural land, should global food prices continue to experience a strong growth over the next 10 years, we expect large-scale land acquisitions in Sub-Saharan Africa will continue to rise resulting in 10 to 35 percent of the remaining potentially arable cropland being acquired and/or leased through cooperative production schemes with urban elite farmers by large-scale foreign investors. Under these arrangements, there will be rapid growth in export crops. The continued foreign investment in primary agriculture will, over the long run, boost infrastructure development focusing primarily on roads, rails and ports in order facilitate the export of surplus agricultural produce. In terms of investments in the down-stream stages of the food value chain, we expect there to be little to no investment at the processing level by domestic fi rms as FDI will be focused on land and/or primary agriculture for the purpose of extracting
18 The Gini coeffi cients of landholdings have increased in Zambia from 0.42 in 2001 to 0.49 in 2012. In Kenya, the landholding Ginis increased from 0.51 in 1994 to 0.55 in 2006 (Jayne et. al., 2014a).

154
BFAP BASELINE • Agricultural Outlook 2014 -2023
Table 16.2: Evolving Agri-food Supply Chains for the top 5 Agribusiness fi rms in Southern Africa: (2001 – 2013)
Farm Production
Agro-processing
Distribution Proprietor Brokering
Zambeef 2001 X X X X
2008 X X X X X X X
2013 X X X X X X X X X X X X X X X
Emvest 2001 X
2008 X X X X
2013 X X X X X X X X X X X X X X X
Chayton 2001 X X X X X
2008 X X X X X X X X X X
2013 X X X X X X X X X X X X X X X
NWK 2001 X X
2008 X X X X X X X
2013 X X X X X X X X X X X X X X X
SABMiller 2001 X X
2008 X X X X X X X X X
2013 X X X X X X X X X X X X X X X
KPL 2001 X X X X X
2008 X X X X X X X X X
2013 X X X X X X X X X X X X X X X
Source: Kapuya, et. al., 2014
Type
of A
sset
s
Fina
ncia
l
Phys
ical
Inta
ngib
le
Fina
ncia
l
Phys
ical
Inta
ngib
le
Fina
ncia
l
Phys
ical
Inta
ngib
le
Fina
ncia
l
Phys
ical
Inta
ngib
le
Fina
ncia
l
Phys
ical
Inta
ngib
lethe raw material for off-continent processing. In order to meet the quality and safety requirements of the export market, foreign fi rms will move towards tighter vertical coordination through production contracting and/or full ownership integration. Table 16.2 summarizes the evolution of investments along the value-chain for the top fi ve Agribusiness fi rms in Southern Africa. As the table illustrates, across all fi ve fi rms, the movement has been towards tighter vertical coordination as a means of securing market access and ensuring consistency in the quality and quantity of their raw material requirements.
Scenario 2: Africa RisesUnder the second scenario urban income growth will be broad-based, i.e. no skewed distribution of
income, and global food prices continue to rise over the next 10 years. As with Scenario 1, the increase in disposable income combined with rising global food prices will stimulate investments in land as an alternative form of savings among the urban elite. However, the proportion of urban-based farmers in the medium-scale category will be lower than under the Large and Ineffi cient Scenario as rural-based farmers break through the barriers of subsistence agriculture into more commercialized medium-scale stature; through broad-based State support. As a result the distribution of land will be more equitable resulting in a more egalitarian farming system, relative to scenario 1. Among the urban poor, rising income will result

155
BFAP BASELINE • Agricultural Outlook 2014 -2023
in a growing need for food at reasonable prices. This growing urban demand will stimulate supply responses in both the formal and informal domestic agribusinesses. The attending growth in the agribusiness sector will result in rising employment as the non-farm sector absorbs approximately 2/3rd of the youth over the next 10 years. Furthermore, under this scenario smallholder farmers will be well positioned to meet the growing urban demand for food through informal markets. As result, over the next 10 years, these farmers will be productive and reinvest their surplus as they move away from subsistence farming towards commercialization through increasing technological adoption and land expansion. Over time there will be a consolidation of farming units and the median farm size will rise. Given the broad-based nature of this agricultural growth the resulting employment effects and growth multipliers are likely to contribute signifi cantly towards economic growth and po-verty reduction. In terms of FDI, the interest of foreign investors will remain high, driven by strong profi t margins in global food systems. The investment patterns will, however, likely shift from being exclusively focused on primary agriculture to include the down-stream stages of the food value chain. Due to broad-based income growth and its associated multiplier effect, investment in infrastructure will rise at a rapid pace as the demand for all categories of food boosts local volumes, supporting local business investments along the food value chain. Infrastructure development and local processing of food will dampen the rise in food prices and lower transaction costs along the value-chain, resulting in closer vertical coordination relative to scenario 1.
Scenario 3: Slow & SteadyUnder the third scenario urban income growth is broad-based yet, unlike scenario 2 global food prices remain relatively constant and experience little to no growth over the next 10 years. Despite stagnant growth in global food prices, we anticipate urban incomes to rise, albeit at a slower rate than under Scenario (1) and (2). Given the broad-based nature of the income growth; food demand will change as urban consumers become more reliant on the formal food system. Food demand remains
strong, with high-income household demand being met by imported food, while low-income household demand will be met by local small-scale production and informal value-chains. As a result, local informal/formal agribusinesses will be well positioned to expand production to meet local demand. In terms of FDI, the appetite for investment will decline as returns on investments fall. However, Africa will remain an attractive alternative relative to the rest of the world, where we anticipate constant returns on investments. With respect to productive resources, smallholder farmers’ access to land will not be as constrained as under scenarios (1) and (2) due to less competition from urban and foreign investors.
Scenario 4: Small and Ineffi cientAs with scenario 1 we assume a skewed distribution in urban income growth while global food prices remain relatively constant and experience little to no growth over the next 10 years. Under this scenario, the non-agricultural industries, such as mining, will drive the largest share of income growth. Due to the skewed distribution of income, wealth will be concentrated into the hands of a few, who will, through this increase in wealth, capture the political process. As a result, we anticipate a rise in cronyism and nepotism, as public policy will increasingly refl ect and/or protect the interest of the wealthy elite. Unlike scenarios (1) and (2) the savings of the urban elite will be directed towards off-shore banking and/or acquiring interests in non-agricultural growth sectors, such as mining, etc. As in scenario (1) continued rural population growth and land sub-division will intensify land constraints in the more densely populated smallholder areas with median farm sizes decreasing over the next 10 years. Despite positive returns on investment, we anticipate little to no FDI under this scenario, due to high-levels of corruption and the attending risks. What FDI that does occur will have little incentive for infrastructure development within the agricultural sector and therefore investment along the value chain will be limited.

156
BFAP BASELINE • Agricultural Outlook 2014 -2023
REFERENCESFine, D.; van Wamelen, A.; Lund, S.; Cabral, A.; Taoufi ki, M.; Dorr, N; Leke, A.; Roxburgh, C.; Schubert, J. and P. Cook (2012). “Africa at Work: Job Creation and Inclusive Growth”. McKinsey Global Institute. Glen, J.C. (2006). Global Scenarios and Implications for Constructing Future Livestock Scenarios. A Report to the International Livestock Research Institute and the Food and Agricultural Organization.International Monetary Fund (2014). Fact Sheet: Debt Relief under the Heavily Indebted Poor Countries (HIPC) Initiative. Available online: http://www.imf.org/external/np/exr/facts/hipc.htm. Accessed on: 04-2014.International Trade Centre (2014). Trade Map. Available Online at: http://www.trademap.org Accessed on 06-2014.Jayne, T.S., Chapoto, A.; Sitko, N.; Nkonde, C.; Muyanga, M.; and J. Chamberlin (forthcoming 2014a). “Is the Scramble for Land in Africa Foreclosing a Smallholder Agricultural Expansion Strategy?” Journal of Inter national Affairs.Jayne, T.S., Ndibongo-Traub, L.N.; and F. Meyer (forthcoming 2014b). “Drivers of Dynamism in African Food Systems: Distinguishing between what is inevitable, what is malleable, and the role of social policy.” Development Policy Review.Kapuya T, Anseeuw W, Kirsten JF, and Meyer FH (forthcoming). “Renewed agribusiness models and agri-food chain restructuring and in Southern Africa”. Unpublished.Kearney, A.T. 2013. “Seizing Africa’s Retail Opportunities: The 2014 Retail African Development Index.” A.T. Kearney, Inc., http://www.atkearney.com/consumer-products-retail/african-retail-development-index, last accessed, June 3, 2014.Minde, I., R. Mkandawire, N. Ojijo, T. Mwangi, A.Yaye, M. Osiru, B. Bashaasha, J. Kabasa, J. Mugisha, A. Mugisha, F. Ejobi, J. Kirsten, S. Hendriks, C. Madakadze, F. Meyer, L. Traub, J. Kaneene, D. Tschirley, S. Haggblade, D. Boughton.(2011). “Food System Dynamics in Africa: Anticipating and Adapting to Change.” Report, Michigan State University, East Lansing.New Partnership for Africa’s Development (2014). About CAADP. Available online: http://www.nepad-caadp.net/about-caadp.php. Accessed on: 04-2014.Schoneveld, G. (forthcoming 2014). “The geographic and sectoral patterns of large- scale farmland investments in sub-Saharan Africa”. Food Policy 47 and Land Matrix Partnership: (http://www.landmatrix. org/en/).Seidman, R. (1973). "Contract Law, the Free Market, and State Intervention: A Jurisprudential Perspective," Journal of Economic Issues, 7, 553-575.United Nations (2014a). Millennium Development Goals: Background. Available online: http://www.un.org/millenniumgoals/bkgd.shtml. Accessed on: 04-2014.United Nations (2014b) Population Division’s World Population Prospects: 2012. Available online at: http://esa. un.org/wpp/. Accessed 06-2014. World Bank (2014) Development Research Group. Available Online at: http://databank.worldbank.org/data/ home.aspx. Accessed 06-2014.
CONCLUSIONSCurrent trends and transformations being observed in African food systems are the outcomes of prior decades’ policies and public investment patterns. The role of social policy is to reach reasonable consensus among the local polity as to the outcomes that are deemed socially desirable and then put the incentives in place, through policies, institutions and/or public investments that will achieve these outcomes (Jayne et. al., 2014). As this chapter demonstrates, the current transformation of the African food system is neither irreversible nor inevitable; the future can be shaped and transformed to serve social policy goals. The critical question is how can governments harmonize their natural resource polices and allocation decisions with their rural development and livelihood strategy in order to achieve outcomes that are deemed socially desirable? In short, policy matters and it is important that African governments do not abdicate their role in shaping Africa’s future.

157
BFAP BASELINE • Agricultural Outlook 2014 -2023
NOTES

158
BFAP BASELINE • Agricultural Outlook 2014 -2023
NOTES


160
BFAP BASELINE • Agricultural Outlook 2014 -2023
www.bfap.co.za