CIMA F2 Refresher - Qunber Raza
91
1 1 Financial Management Paper F2 Sir Qunber Raza Rizvi https://www.facebook.com/Qunbe rRaza
Transcript of CIMA F2 Refresher - Qunber Raza

1 1
Financial Management
Paper F2Sir Qunber Raza Rizvihttps://www.facebook.com/QunberRaza

2 2
Introduction to the Paper

3 3
Syllabus
• Prepare consolidated accounts, employing accounting standards 35%
• Evaluate financial statements and analyse performance 35%
• Profit measurement 20%
• Developments in external reporting 10%
4 4
1Session Accounting for Subsidiaries
5 5
What is a Group?
P
S
Control Group
6 6
W1 Group Structure
Parent
%
Subsidiary
7 7
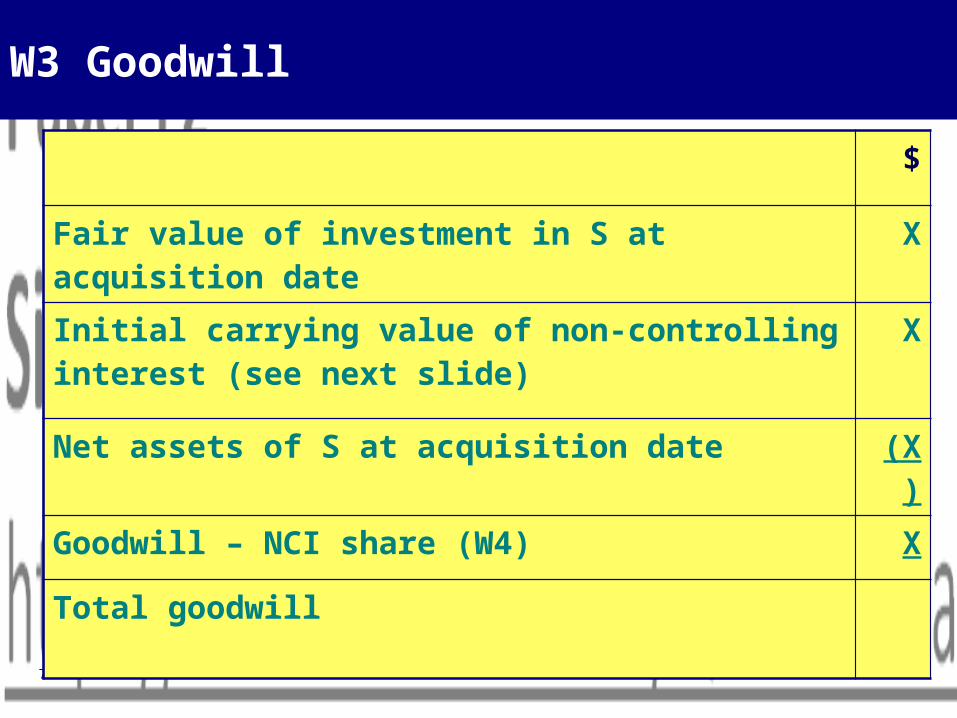
W3 Goodwill
$
Fair value of investment in S at acquisition date X
Initial carrying value of non-controlling interest (see next slide)
X
Net assets of S at acquisition date (X)
Goodwill – NCI share (W4) X
Total goodwill

8 8
Initial carrying value of NCI?
EITHER1. Fair value of S at date of acquisition;
OR2. NCI share of net identifiable assets of S at
date of acquisition.
• Choice made on an acquisition by acquisition basis
9 9
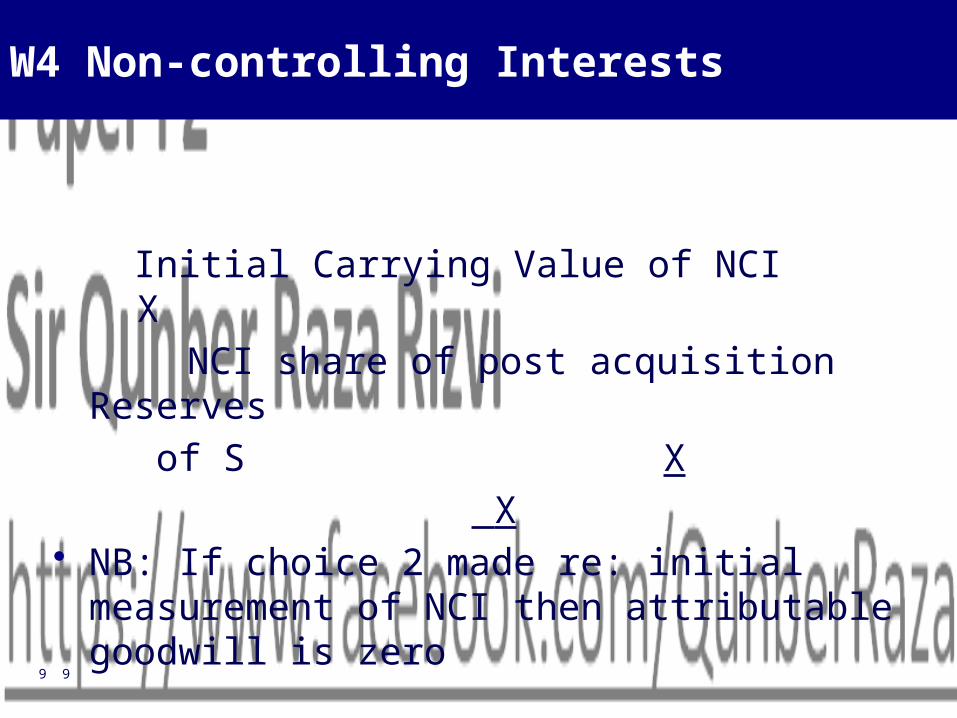
W4 Non-controlling Interests
Initial Carrying Value of NCI X NCI share of post acquisition Reserves
of S X X
• NB: If choice 2 made re: initial measurement of NCI then attributable goodwill is zero
10 10
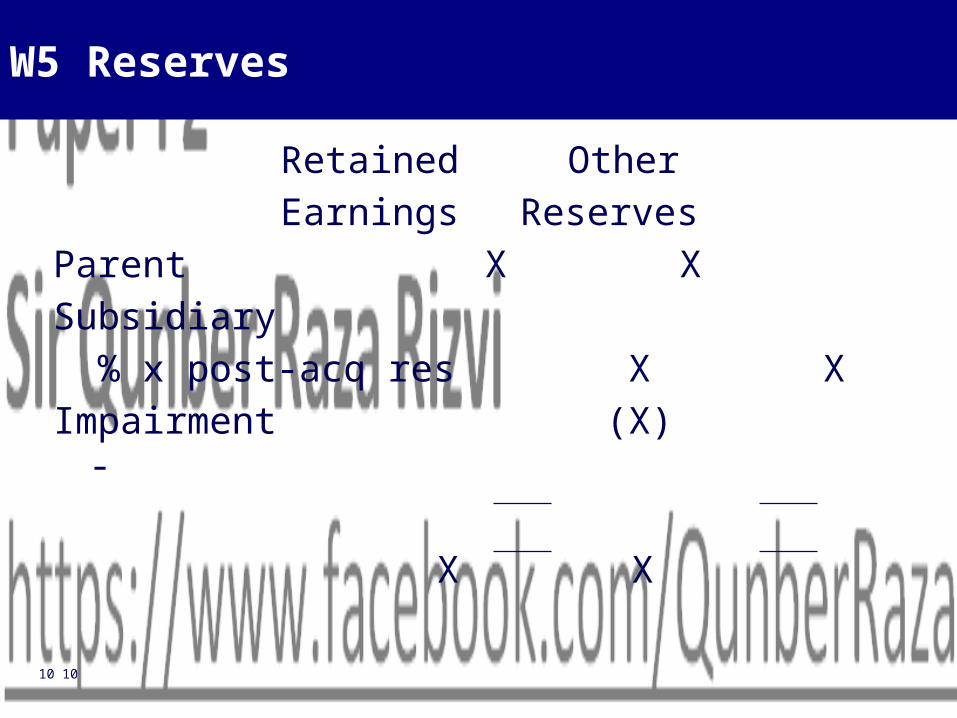
W5 Reserves
Retained OtherEarnings
ReservesParent X XSubsidiary % x post-acq res X XImpairment (X) -
X X
11 11
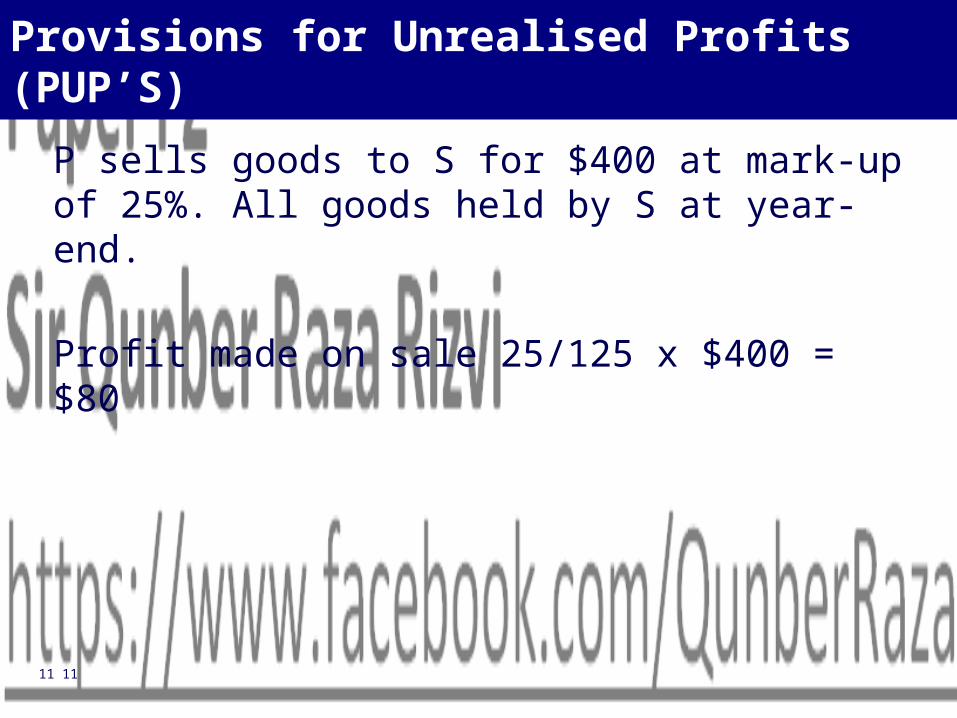
Provisions for Unrealised Profits (PUP’S)
P sells goods to S for $400 at mark-up of 25%. All goods held by S at year-end.
Profit made on sale 25/125 x $400 = $80
12 12
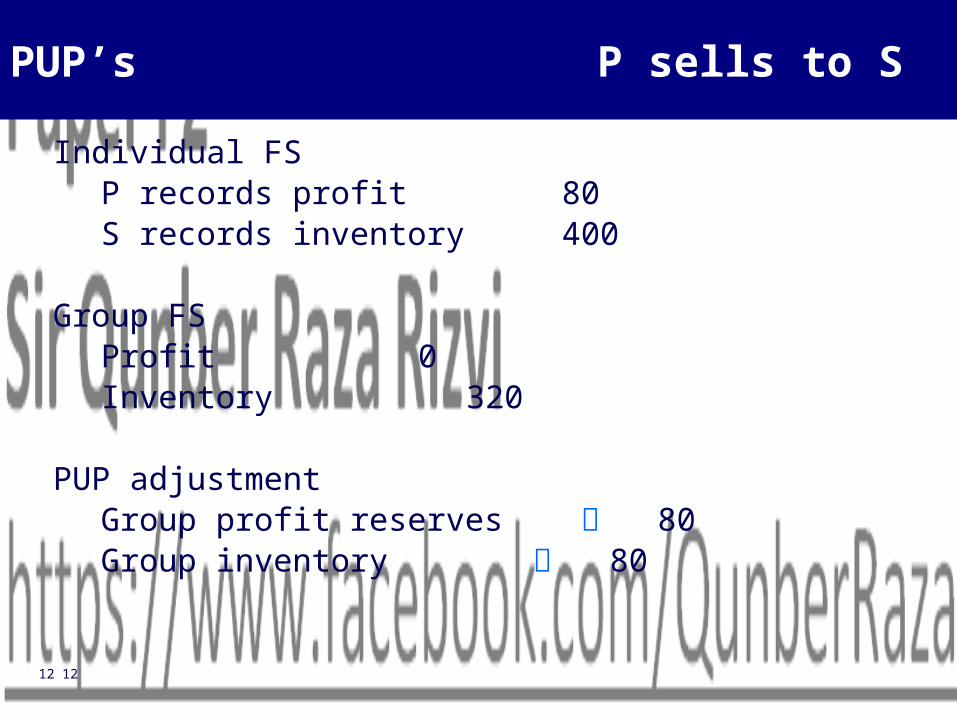
PUP’s P sells to S
Individual FSP records profit 80S records inventory 400
Group FSProfit 0Inventory 320
PUP adjustmentGroup profit reserves 80Group inventory 80
13 13
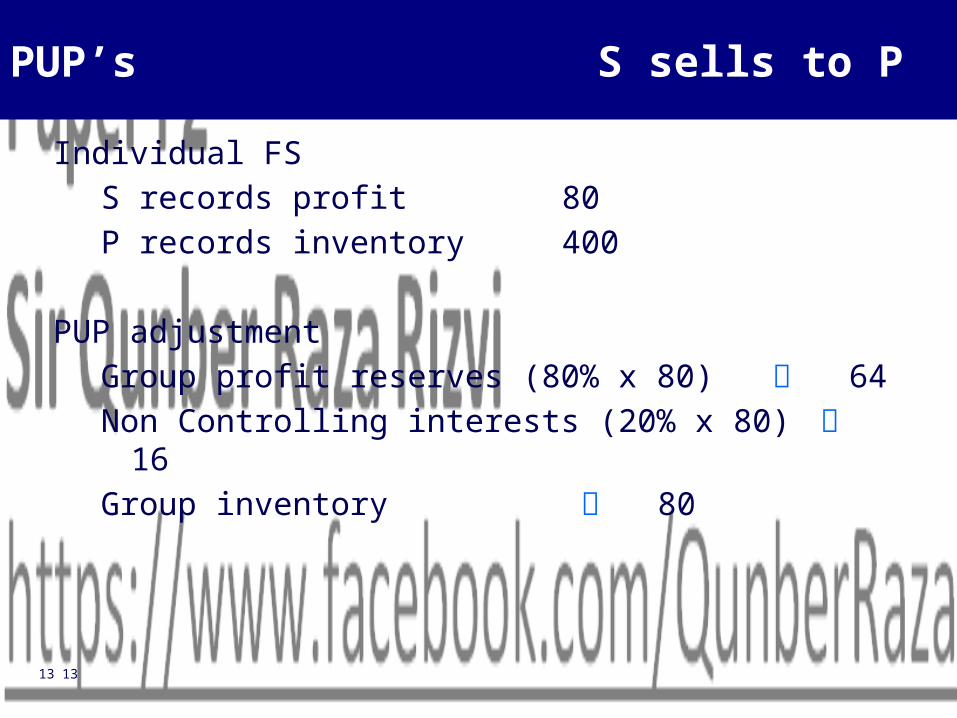
PUP’s S sells to P
Individual FSS records profit 80P records inventory 400
PUP adjustmentGroup profit reserves (80% x 80) 64Non Controlling interests (20% x 80) 16Group inventory 80

14 14
PUP Summary
P Sells to S
Group inventoryGroup reserves
S Sells to P
Group inventoryGroup reserves P%Non controlling
interests NCI%

15 15
2Session Fair Value Adjustments

16 16
Fair Value Adjustments
Fair value of consideration givenCash XShares issued @ FV XDeferred consideration (PV of future CF)XContingent consideration (fair value) XDirectly attributable costs – not included Nil
XP’s share of FV of NA’s of S at DOA (W2) (X)Goodwill – P’s share X
17 17
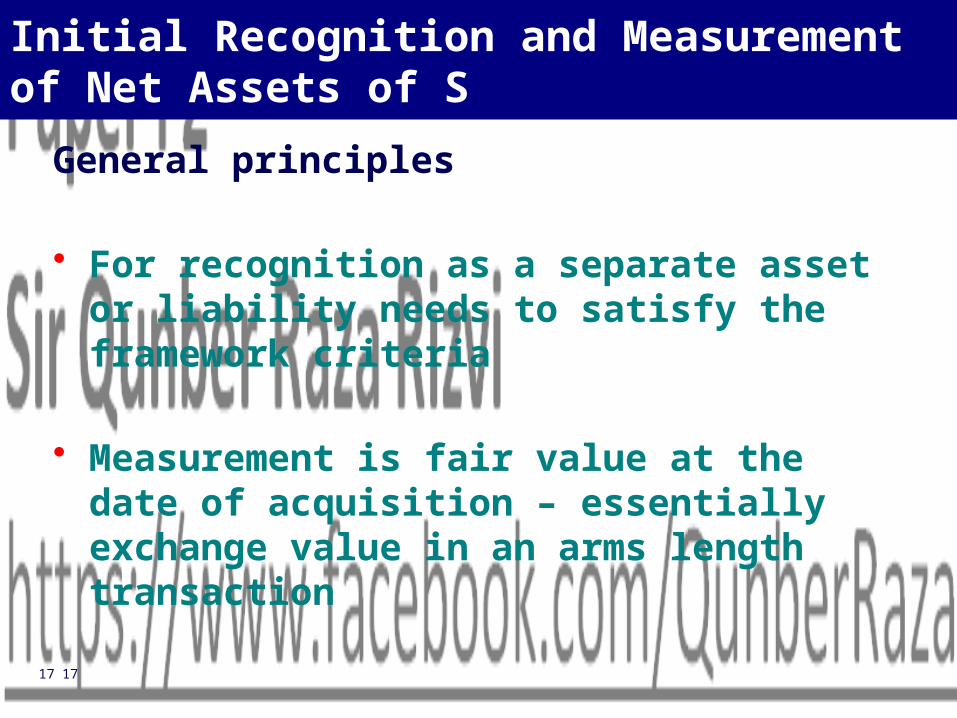
Initial Recognition and Measurement of Net Assets of S
General principles
• For recognition as a separate asset or liability needs to satisfy the framework criteria
• Measurement is fair value at the date of acquisition – essentially exchange value in an arms length transaction
18 18
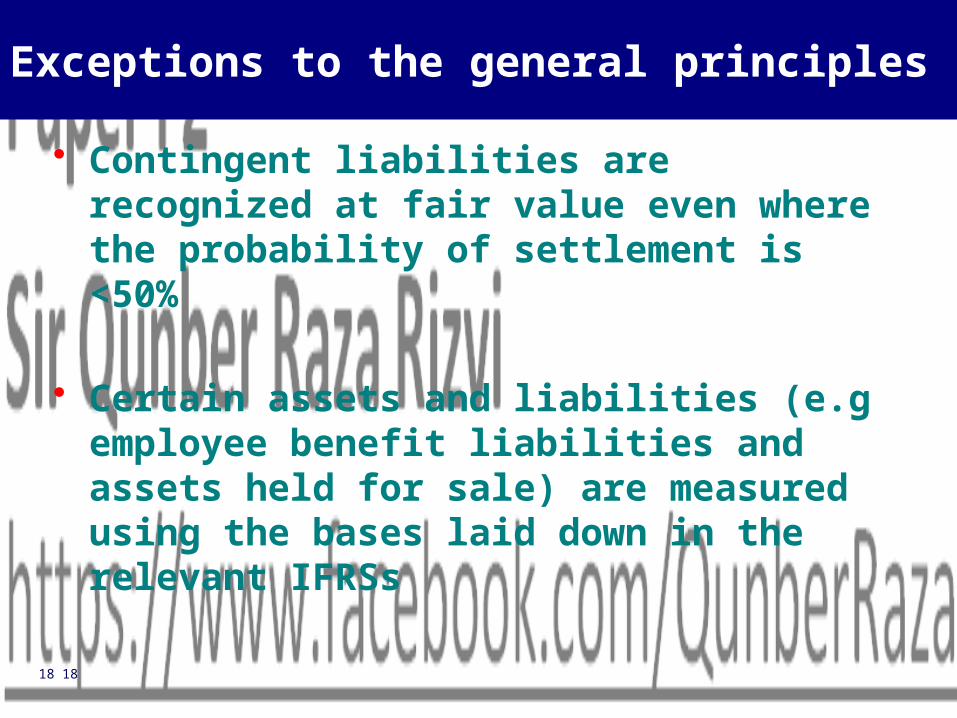
Exceptions to the general principles
• Contingent liabilities are recognized at fair value even where the probability of settlement is <50%
• Certain assets and liabilities (e.g employee benefit liabilities and assets held for sale) are measured using the bases laid down in the relevant IFRSs
19 19
3Session Consolidated Income Statement/Statement of Comprehensive Income

20 20
Consolidated Income Statement
Income Statements
Mid-year acquisitions
Intra Group Transactions
Non-controlling Interest
Fair Value Adjustments
Impairments PUP’s

21 21
4Session Associates and Joint Ventures

22 22
Associates and Joint Ventures
Parent
Subsidiary
ControlSignificant Influence
20-50% Voting Rights
IAS 28 Equity Accounting
Associate

23 23
Equity Accounting
Consolidated Statement of Financial Position
Non-current assets Investment in associate Cost of investment X
P’s share of post-acquisition change X in net assets of A Impairment of investment (if any) (X)
X
24 24
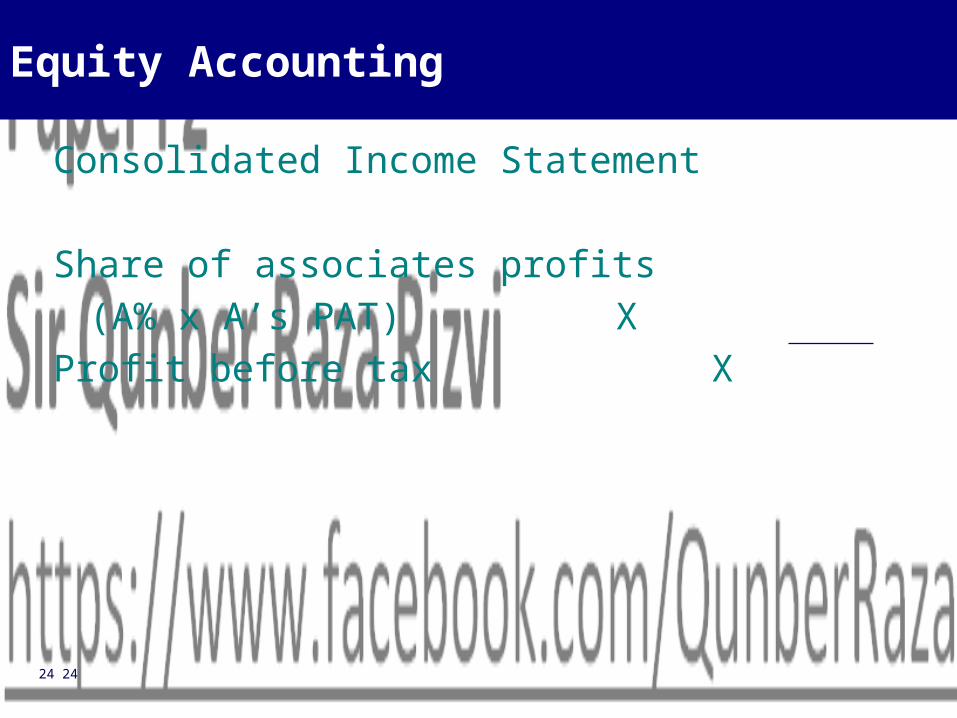
Equity Accounting
Consolidated Income Statement
Share of associates profits (A% x A’s PAT) X
Profit before tax X
25 25
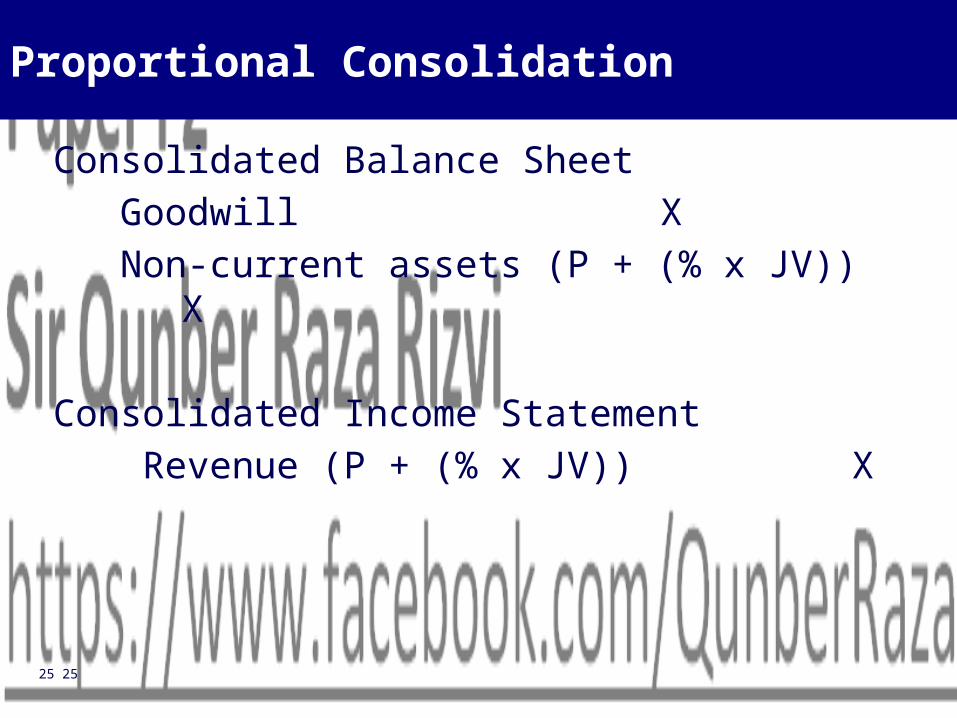
Proportional Consolidation
Consolidated Balance Sheet Goodwill X Non-current assets (P + (% x JV)) X
Consolidated Income Statement Revenue (P + (% x JV)) X
26 26
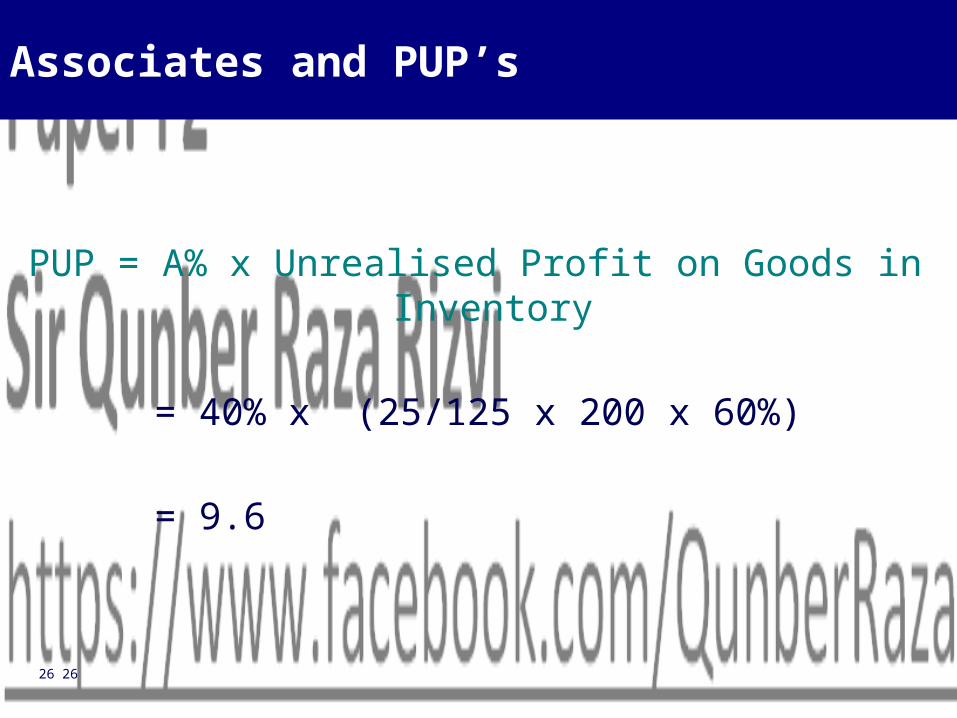
Associates and PUP’s
PUP = A% x Unrealised Profit on Goods in Inventory
= 40% x (25/125 x 200 x 60%)
= 9.6
27 27
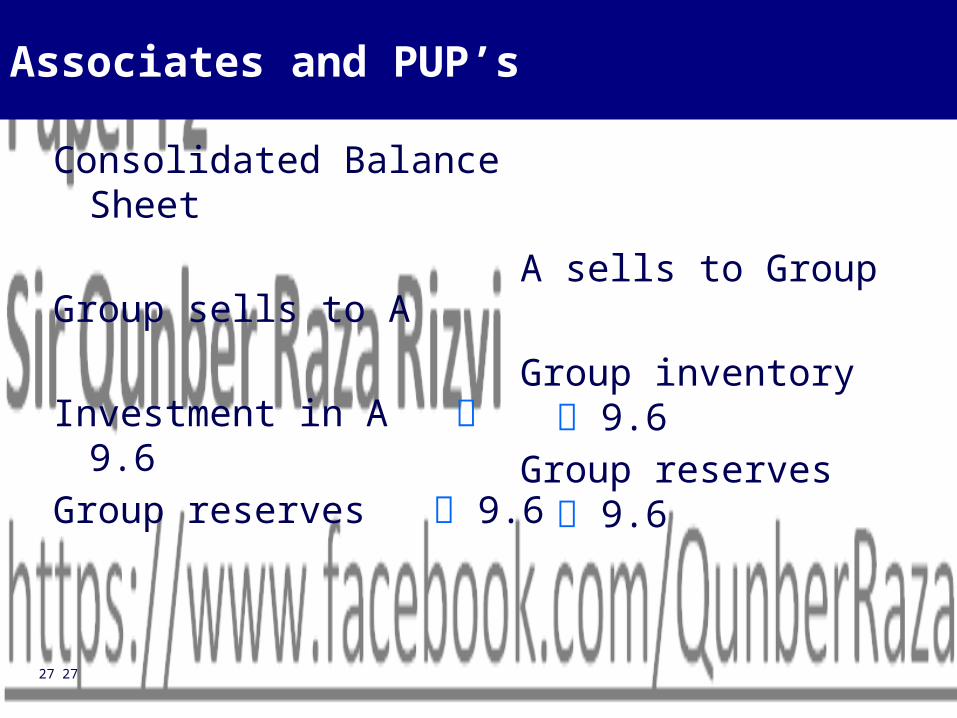
Associates and PUP’s
Consolidated Balance Sheet
Group sells to A
Investment in A 9.6 Group reserves 9.6
A sells to Group
Group inventory 9.6Group reserves 9.6
28 28
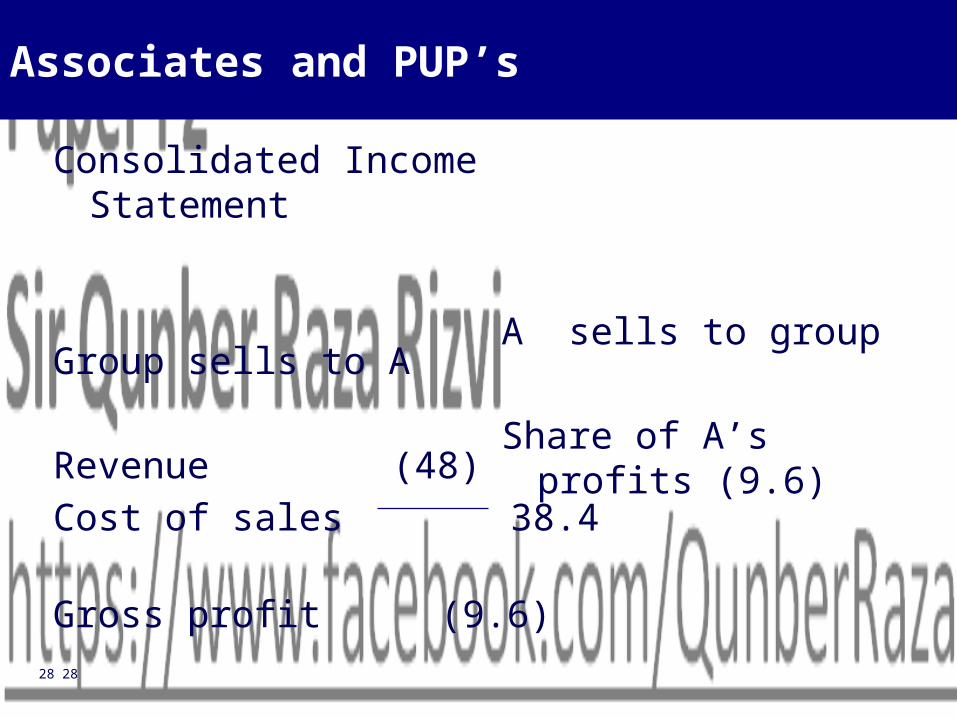
Associates and PUP’s
Consolidated Income Statement
Group sells to A
Revenue (48) Cost of sales 38.4Gross profit (9.6)
A sells to group
Share of A’s profits (9.6)

29 29
5Session Changes in Group Structure

30 30
Changes in Group Structure
Step-by-step (Piecemeal) Acquisition
Simple Investment
Associate
Subsidiary

31 31
Step by step acquisition – the detail
• Date of acquisition = date control gained
• Re-measure any prior interest in S to FV at DOA – gain or loss to profit and loss
• Include FV of any prior interest as part of ‘cost of investment in S’ for goodwill purposes
32 32
Step by step acquisition – further purchases after control gained
• No not re-compute goodwill
• Net assets of S already being consolidated so only change is to NCI %age
• Difference between additional cost of investment and change in NCI taken to equity

33 33
Changes in Group Structure
Disposal of Subsidiary – Loss of control
Proceeds XFV of retained interest (if any) XNA of S at disposal (X)Goodwill of S at disposal (X)NCI in S no longer recognized XGain/Loss for group X

34 34
Changes in Group Structure
• Disposal of Subsidiary – no loss of control
• No change to goodwill recognized
• NA of S still consolidated
• NCI in S increases
• Difference between disposal proceeds and increase in NCI taken to equity

35 35
6Session Complex Groups

36 36
Complex Groups
Vertical Group
Parent
Subsidiary
Sub-Subsidiary
Controls
Controls
37 37
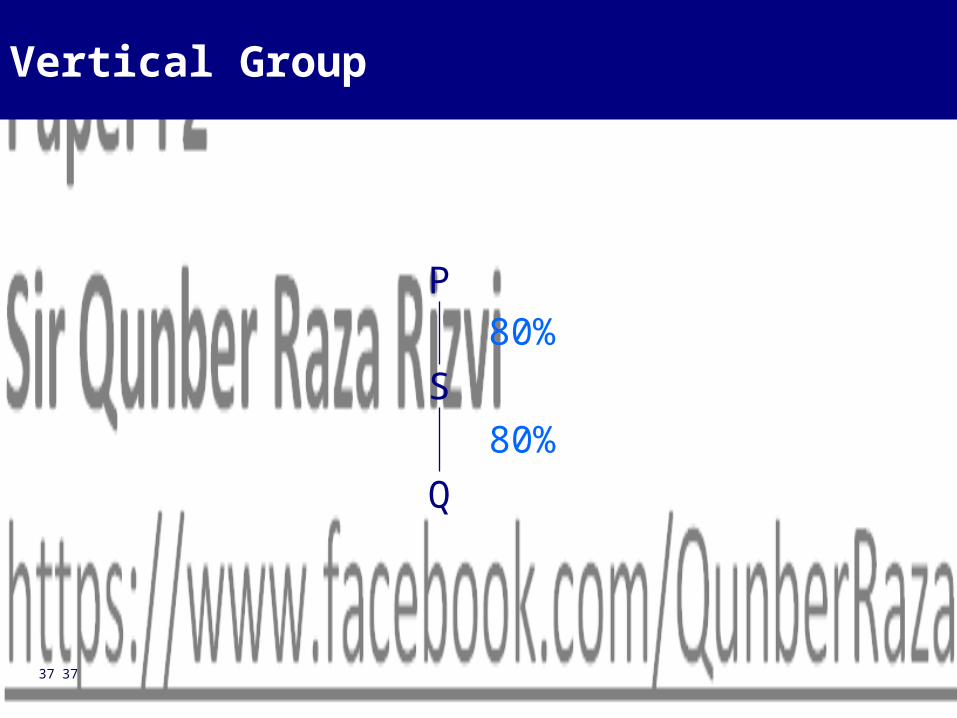
Vertical Group
P
S80%
80%Q

38 38
Vertical Group
P
S60%
60%Q
39 39
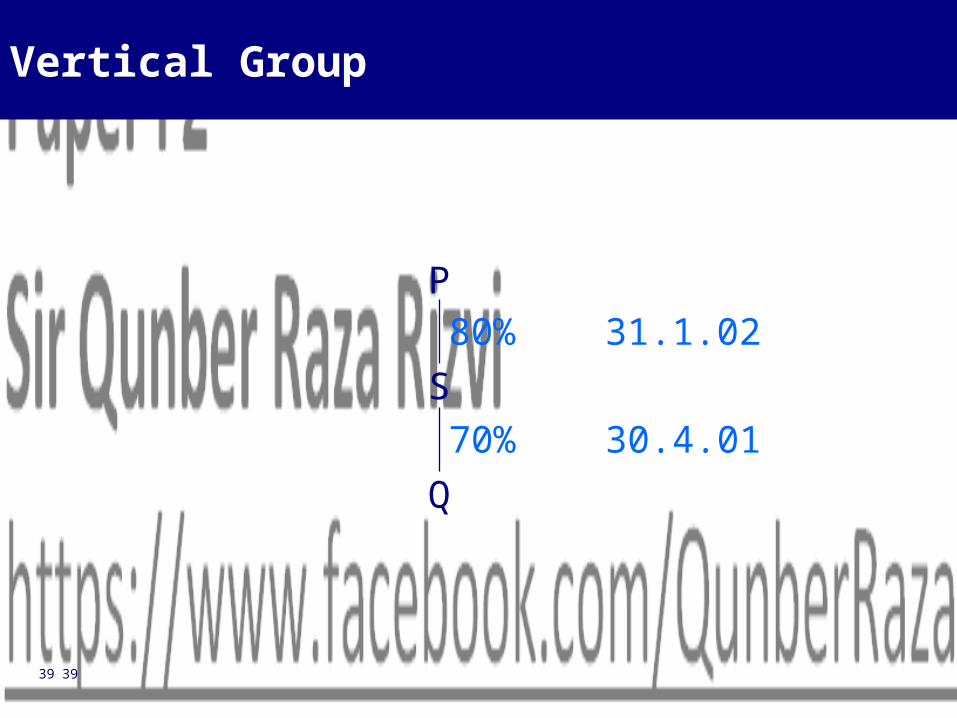
Vertical Group
P
S80% 31.1.02
70% 30.4.01Q
40 40
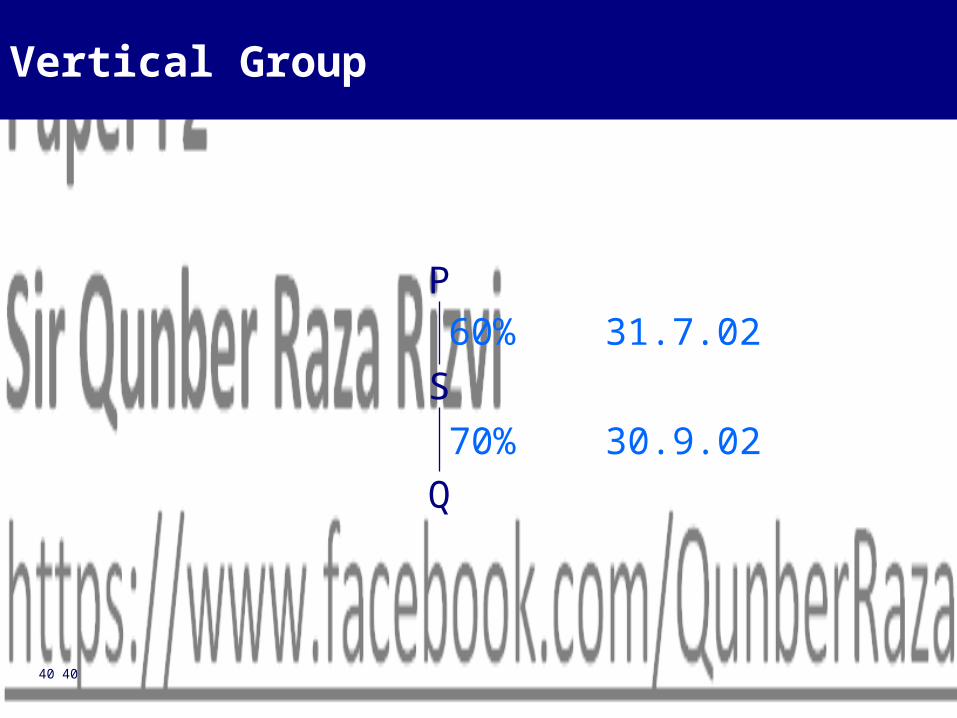
Vertical Group
P
S60% 31.7.02
70% 30.9.02Q

41 41
7Session Foreign Currency Translation
42 42
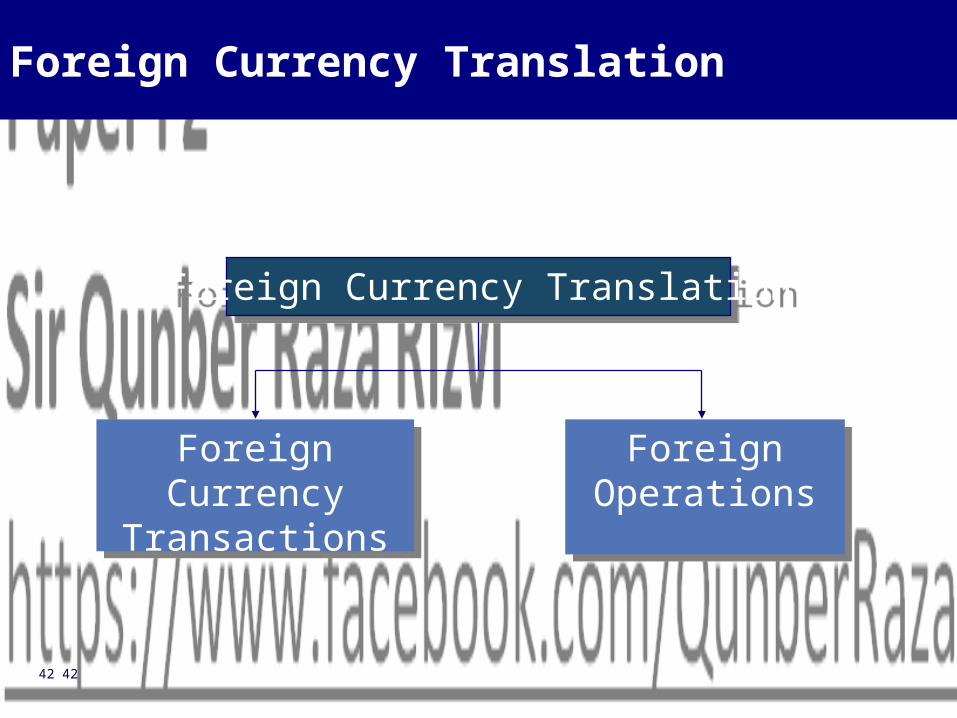
Foreign Currency Translation
Foreign Currency Translation
Foreign Currency Transactions
Foreign Operations
43 43
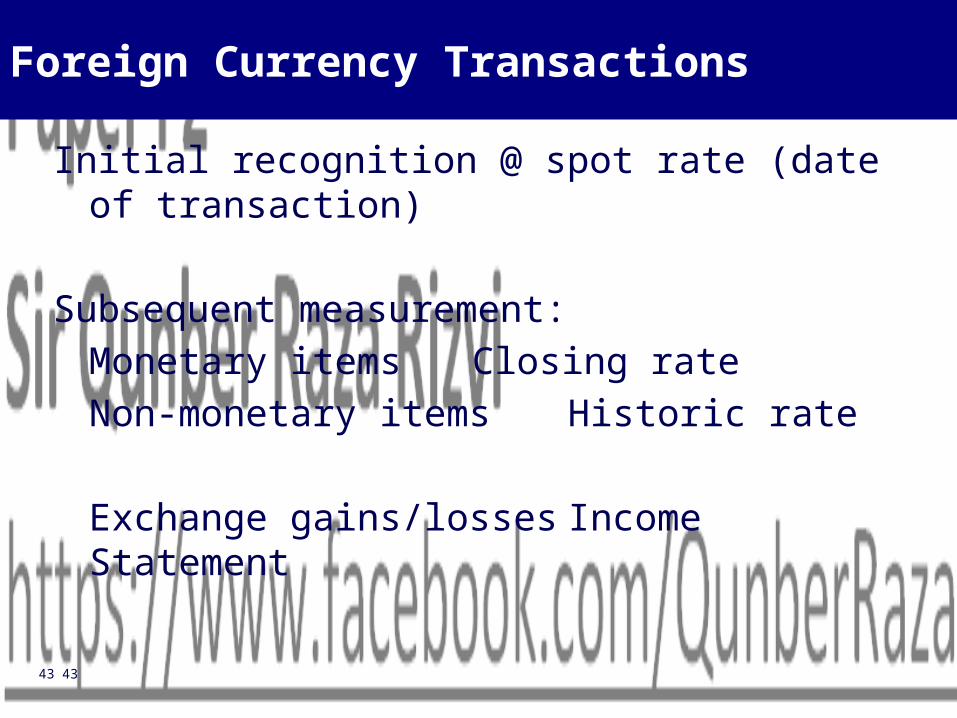
Foreign Currency Transactions
Initial recognition @ spot rate (date of transaction)
Subsequent measurement:Monetary items Closing rateNon-monetary items Historic rate
Exchange gains/lossesIncome Statement

44 44
Closing Rate Method
Translation of foreign operation:
Balance Sheet Closing Rate
Income Statement Average Rate
Exchange gains/losses Other comprehensive income

45 45
Breakdown of exchange gains/losses
Since acquisition:
Sub’s NA’s @ acq’n acq’n rate v. cl rate
Post-acq profits av. rate v. cl. rate
Goodwill acq’n rate v. cl. rate

46 46
Breakdown of exchange gains/losses
For year:
Sub’s NA’s @ Op. Op. rate v. cl rate
Profit for yr av. rate v. cl. rate
Goodwill Op. rate v. cl. rate

47 47
8Session Group Statements of Cash Flow
48 48
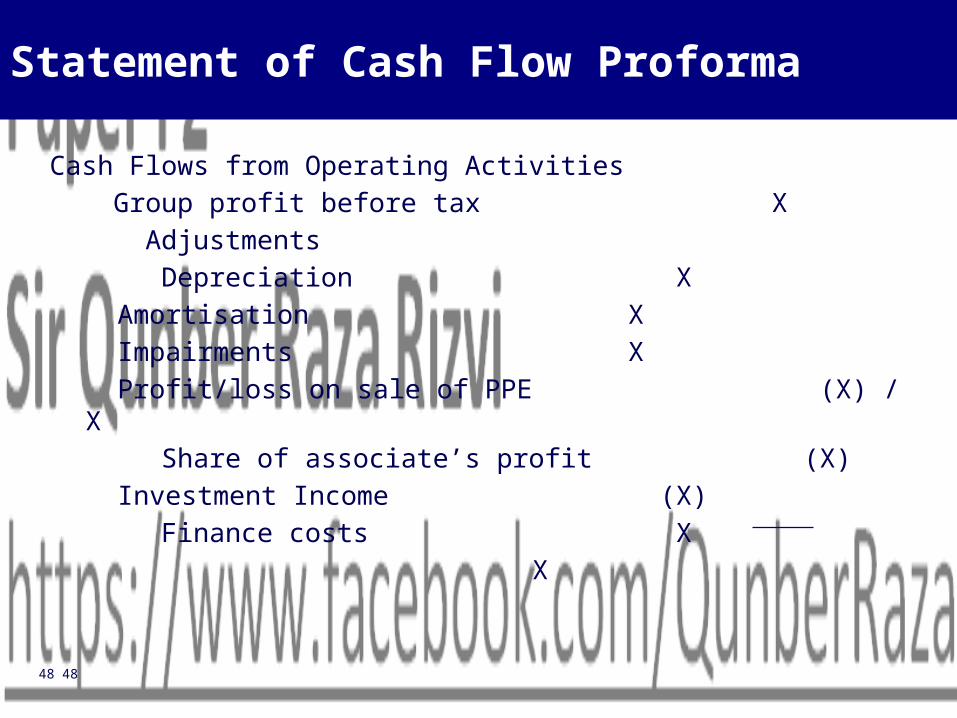
Statement of Cash Flow Proforma
Cash Flows from Operating Activities Group profit before tax X Adjustments Depreciation X
Amortisation X Impairments X Profit/loss on sale of PPE (X) / X
Share of associate’s profit (X) Investment Income (X) Finance costs X
X

49 49
Statement of Cash Flow Proforma
XChange in inventory (X)/XChange in receivables (X)/XChange in payables X/(X)Cash generated from operations XInterest paid (X)Tax paid (X)Net cash from operating activities X

50 50
Statement of Cash Flow Proforma
Cash Flows from Investing ActivitiesSale proceeds from disposal of PPE XPurchases of PPE (X)Interest received XDividends received from Associate XAcq’n/Sale of Sub, net of cash balances (X) / X
X
51 51
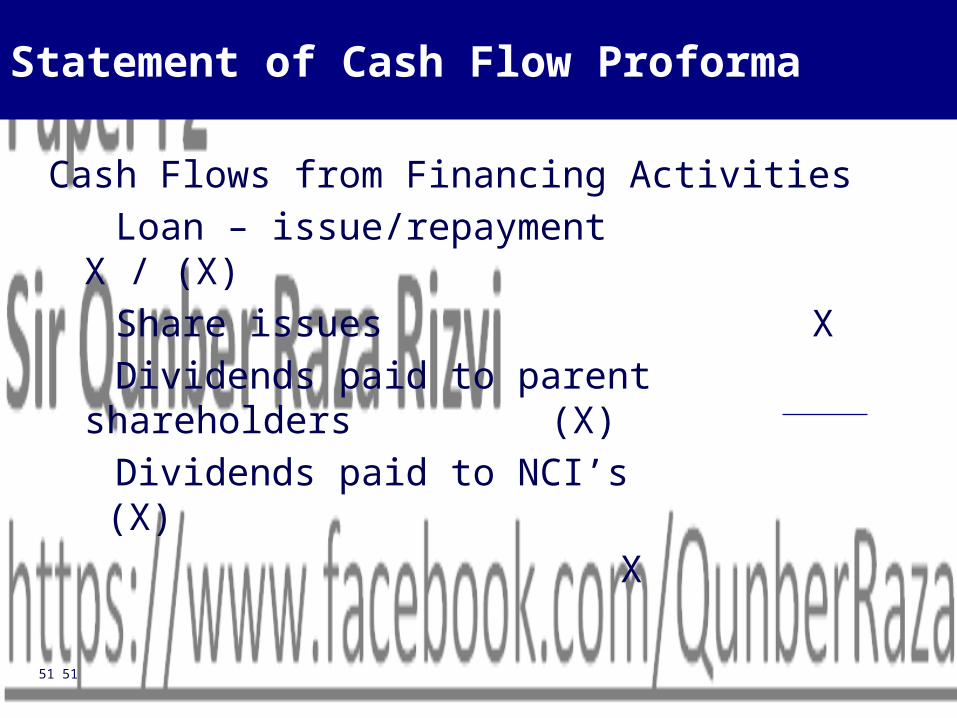
Statement of Cash Flow Proforma
Cash Flows from Financing Activities Loan – issue/repayment X /
(X) Share issues X Dividends paid to parent shareholders (X) Dividends paid to NCI’s (X)
X
52 52
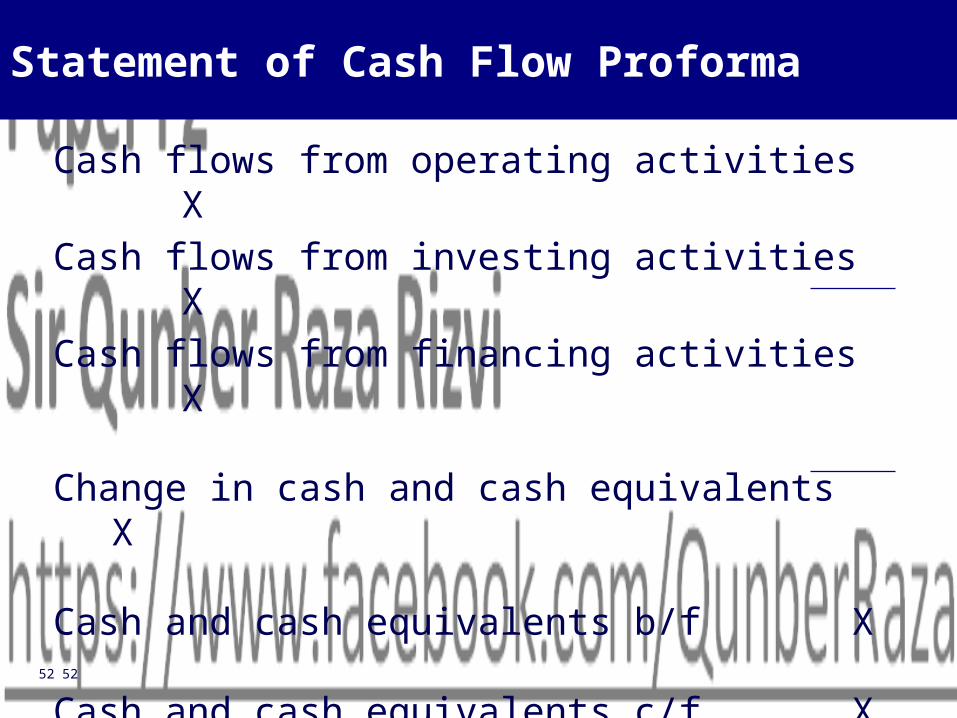
Statement of Cash Flow Proforma
Cash flows from operating activities XCash flows from investing activities XCash flows from financing activities X
Change in cash and cash equivalents X
Cash and cash equivalents b/f X
Cash and cash equivalents c/f X

53 53
9Session Accounting for Employee Benefits

54 54
Retirement Benefits
Statement of Financial Position Present value of obligation X Fair value of plan assets
(X)
XUnrecognised actuarial gains/(losses) XNet (asset)/liability X

55 55
Retirement Benefits
Income StatementCurrent service costs XInterest cost XCurtailment costs XExpected return on plan assets (X)Net actuarial (gain)/loss (X)/XExpense X
56 56
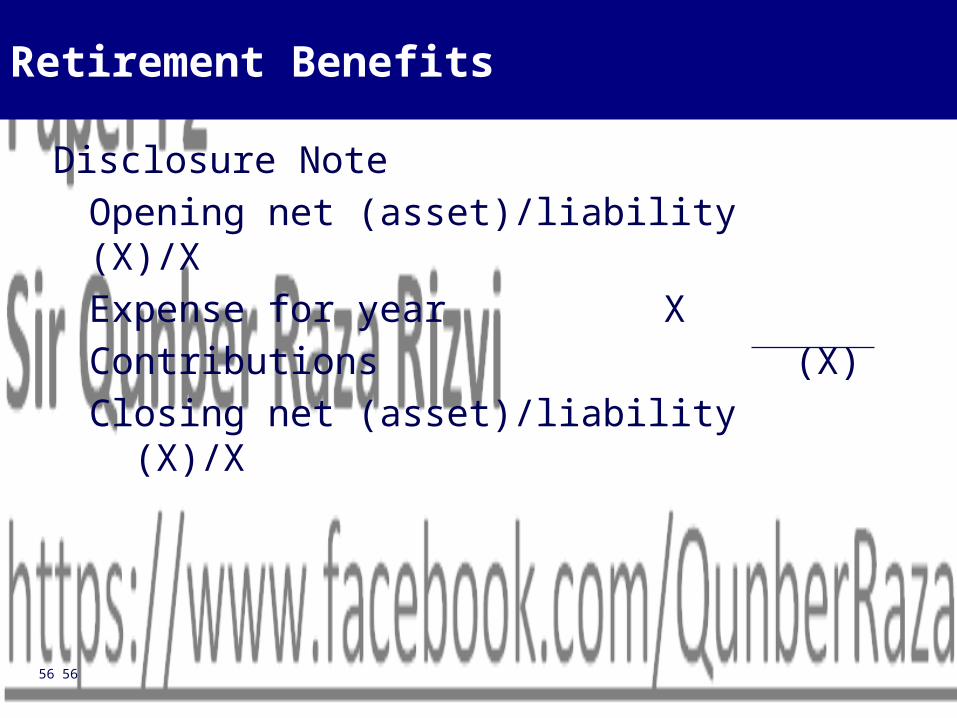
Retirement Benefits
Disclosure NoteOpening net (asset)/liability (X)/XExpense for year XContributions (X)Closing net (asset)/liability (X)/X
57 57
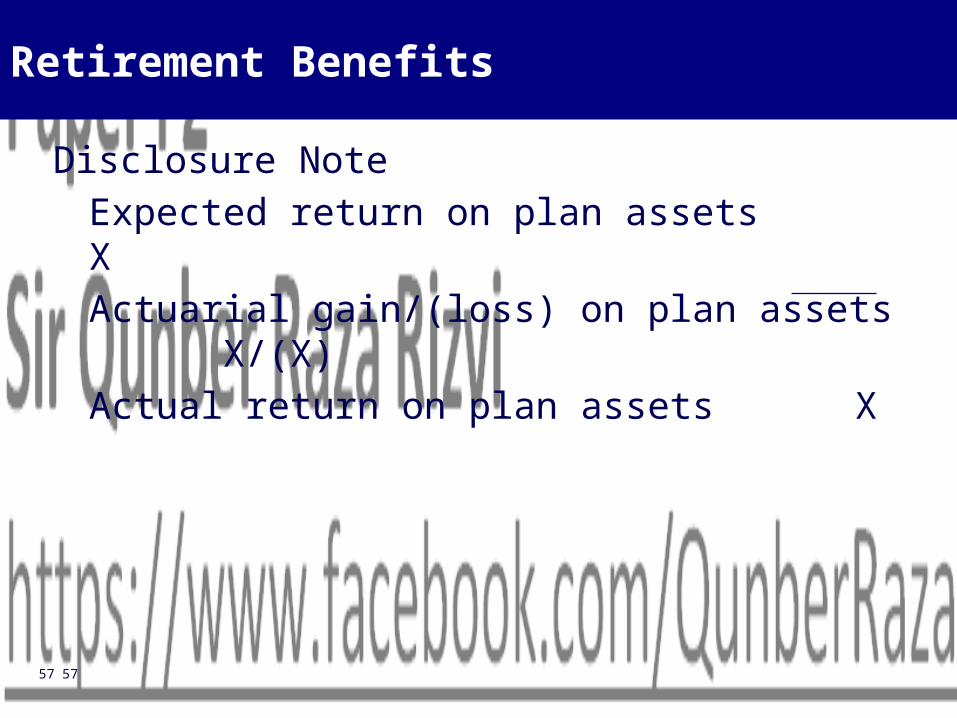
Retirement Benefits
Disclosure NoteExpected return on plan assets XActuarial gain/(loss) on plan assets X/(X)Actual return on plan assets X

58 58
10Session Substance Over Form

59 59
Factored Receivables
Transfer of Risks and Benefits
None Some
ReceivablesRemain
ReceivablesRemain
ReceivablesRemoved
Cash Inflow = Loan
Cash Inflow = Loan
Cash Inflow = Proceeds
Liability Liability Gain (Loss) in Income Statement
All
60 60
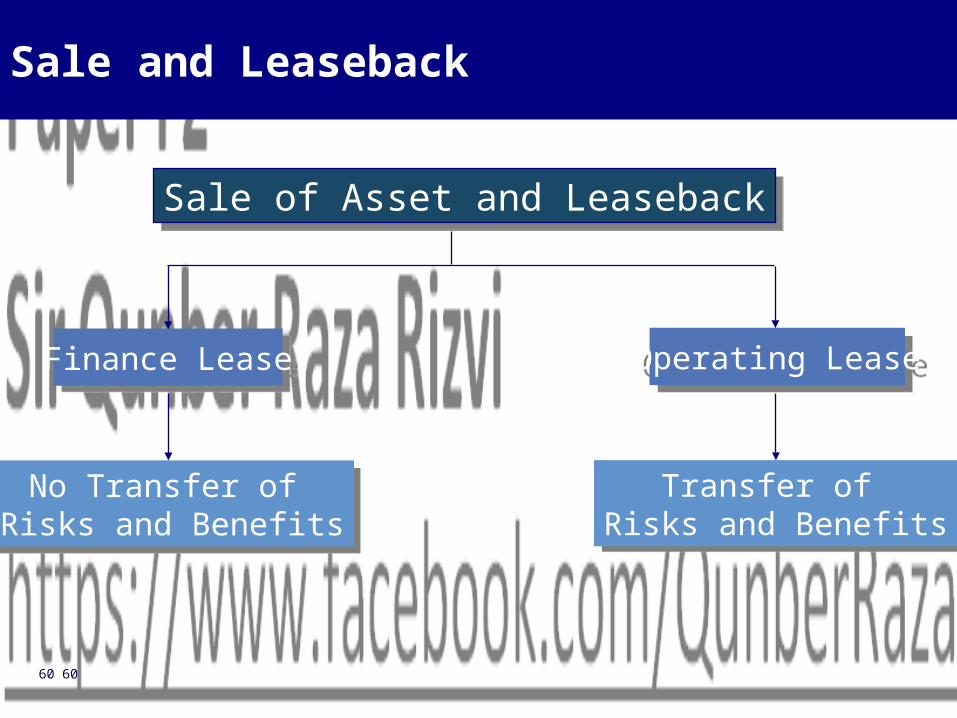
Sale and Leaseback
Sale of Asset and Leaseback
Finance Lease
No Transfer of Risks and Benefits
Transfer of Risks and Benefits
Operating Lease

61 61
11Session Financial Instruments

62 62
Financial Instruments
Definition – IAS 32
Any contract that gives rise to both a financial assets of one entity and a financial liability or equity instrument of another entity.

63 63
Financial Asset
• Cash• Right to receive cash• Equity

64 64
Financial Liability
• Contractual obligation to deliver cash

65 65
Equity Instrument
• Evidence of ownership

66 66
Classification of Financial Instruments
Equity or Liability?• Substance• Responsibility to deliver cash = liability• Mandatory redemption = liability• No responsibility to deliver cash = equity

67 67
12Session Analysis and Interpretation of Financial Accounts

68 68
Performance
Profitability x Efficiency =Returns
GP%
OP% x Asset utilisation =ROCE
NP%
69 69
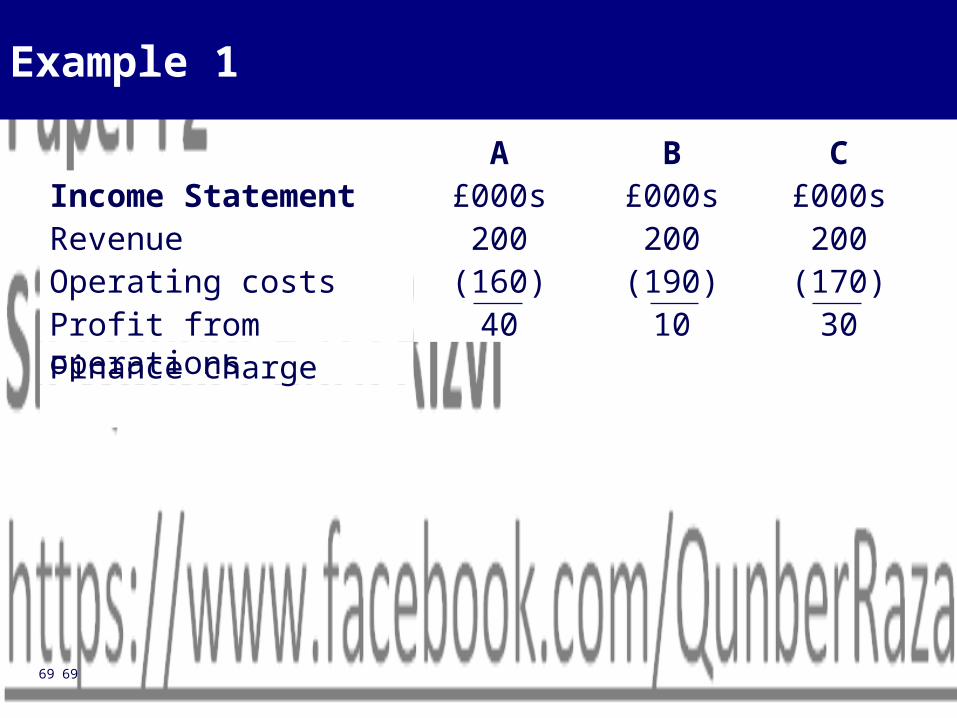
Example 1
Finance charge301040Profit from operations
(170)(190)(160)Operating costs200200200Revenue
£000s£000s£000sIncome StatementCBA

70 70
Example 1
100320140Capital employedFinance lease payable
210Revaluation reserve506090Retained earnings505050Share capital
Statement of Financial Position
CBA

71 71
30%3.1%28.6%Return on capital employed
20.631.43Asset utilisation
15%5%20%Operating profit margin
CBA
Example 1

72 72
Liquidity
Payables Days
Buy Goods
Sell Goods
Cash In Cash Out
InventoryDays
ReceivableDays

73 73
Capital Structure
Equity
Debt
High Gearing Low Interest Cover
74 74
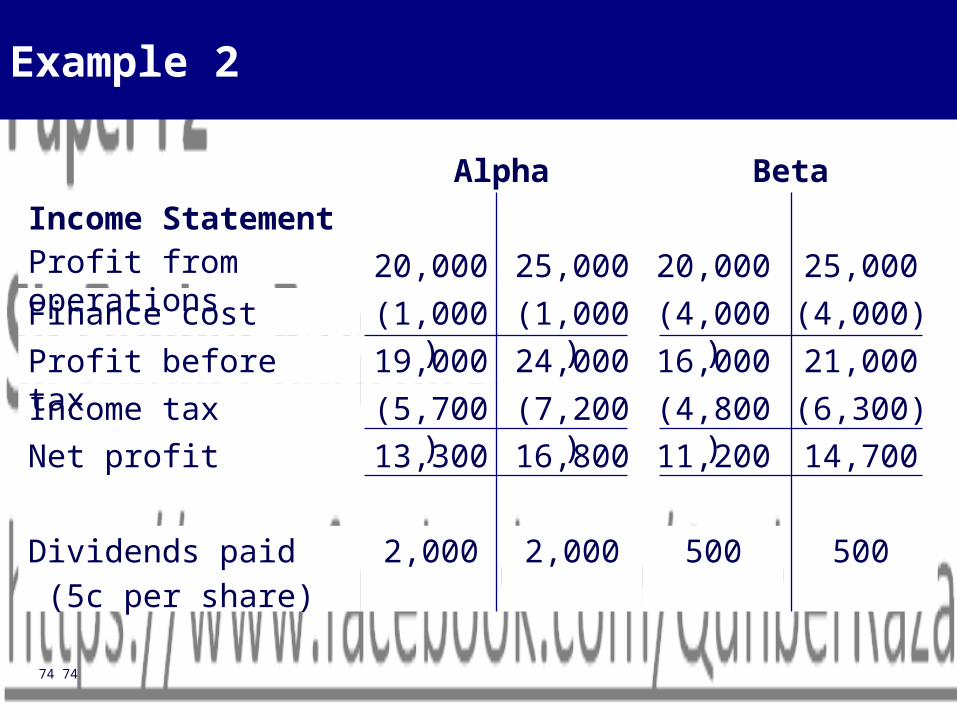
Example 2
500
14,700(6,300)21,000(4,000)25,000
5002,0002,000Dividends paid (5c per share)
11,20016,80013,300Net profit(4,800)(7,200)(5,700)Income tax16,00024,00019,000Profit before tax(4,000)(1,000)(1,000)Finance cost 20,00025,00020,000Profit from operations
Income StatementBetaAlpha

75 75
Example 2
103,50053,500
10,00040,000
100,000103,500100,000Capital employed50,00053,50050,000Reserves
10,00040,00040,000Share capital £1 ordinary shares
40,00010,00010,00010% loan notesStatements of FP
BetaAlpha

76 76
Example 2
Alpha is more highly geared then Beta, but both companies have the same amount of capital employed in total and generate the same returns overall:
Gearing 10% 40%ROCE 20% 20%
BetaAlpha

77 77
Example 2
If there is a 25% increase in the profits of both companies however, the shareholders of Beta benefit more than the shareholder of Alpha:
Return on equity 14.7% 18.0% 18.6% 23.1%+22.4%
+24.2%
EPS 33.25c 42c 112c147c
+26.3%+31.25%
BetaAlpha

78 78
Preparing a Report
To
From
Date
Subject

79 79
Preparing a Report
Introduction
Discussion
Conclusion

80 80
Limitations of Ratio Analysis
• Financial statements• Comparisons of different entities• Ratios• Creative accounting

81 81
Segmental Analysis
• IFRS 8 requires for listed companies only
• Analysis based on internal information provided to senior management
• Separately analysed segments are those parts of the business whose results are material and whose risk characteristics are distinctive

82 82
Segmental Analysis - Illustration
101(29)3991Total revenue
(29)1217Inter-segment sales
2774External sales
Revenue
ConsolidatedEliminationsOffice products
Paper products
83 83
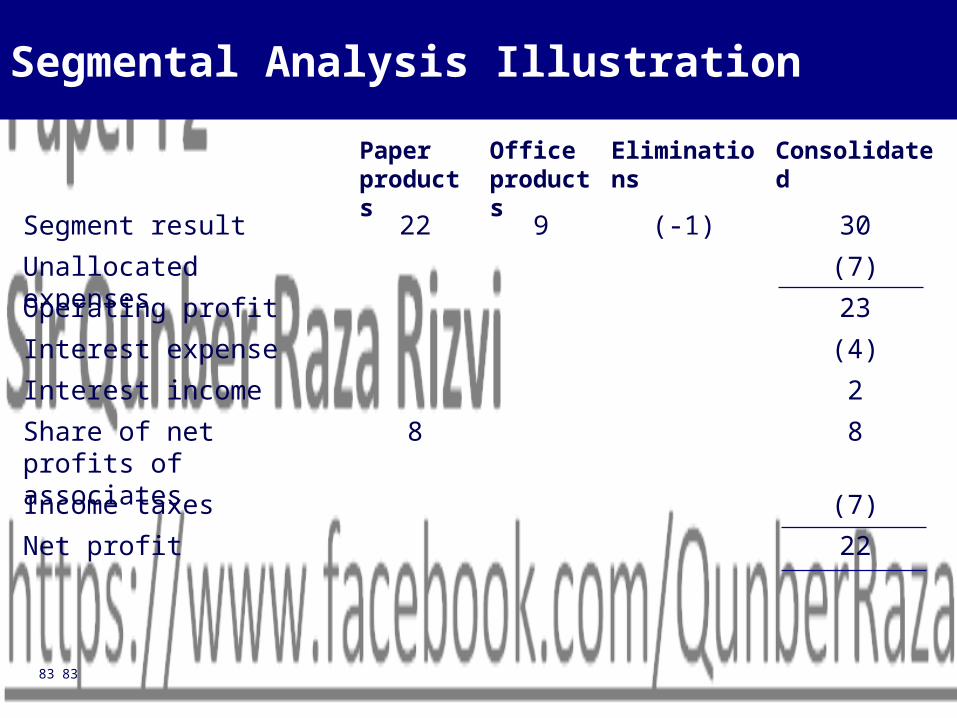
Segmental Analysis Illustration
30(-1)922Segment result(7)Unallocated expenses23Operating profit(4)Interest expense2Interest income88Share of net profits of
associates(7)Income taxes22Net profit
ConsolidatedEliminationsOffice products
Paper products

84 84
Segmental Analysis Illustration
1084464Segment assets3232Investments in associates 35Un-allocated assets175Total assets
42933 Segment liabilities 40 Un-allocated liabilities82 Total liabilities
ConsolidatedEliminationsOffice products
Paper products
85 85
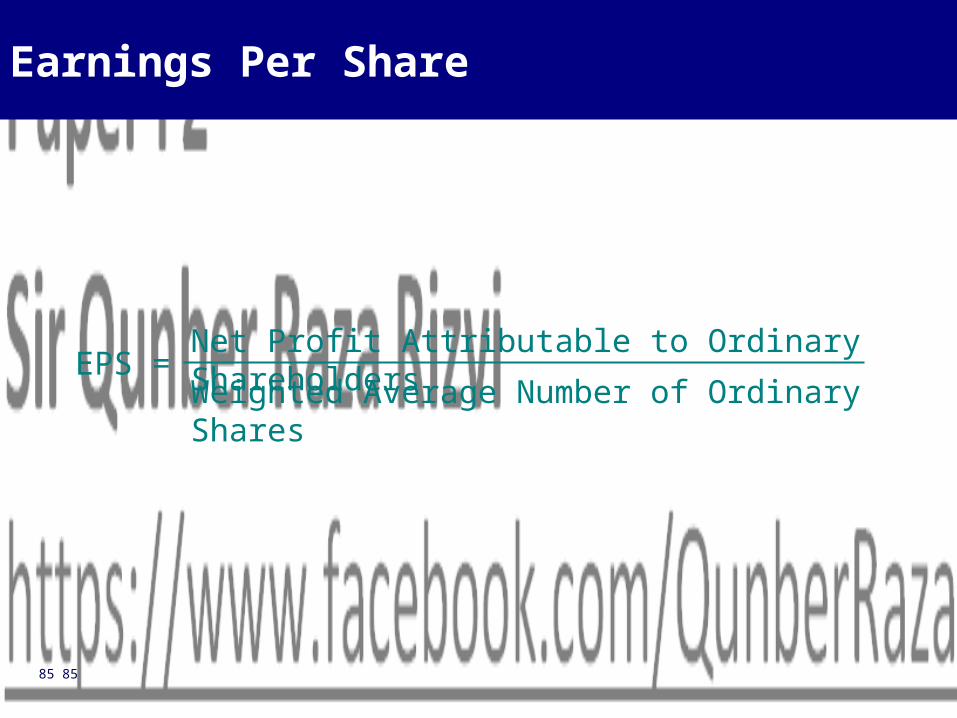
Earnings Per Share
EPS =Net Profit Attributable to Ordinary ShareholdersWeighted Average Number of Ordinary Shares

86 86
Issue of Shares at Market Value
EPS = Earnings(No. Shares Before x ?/12) + (No. Shares After x ?/12)
87 87
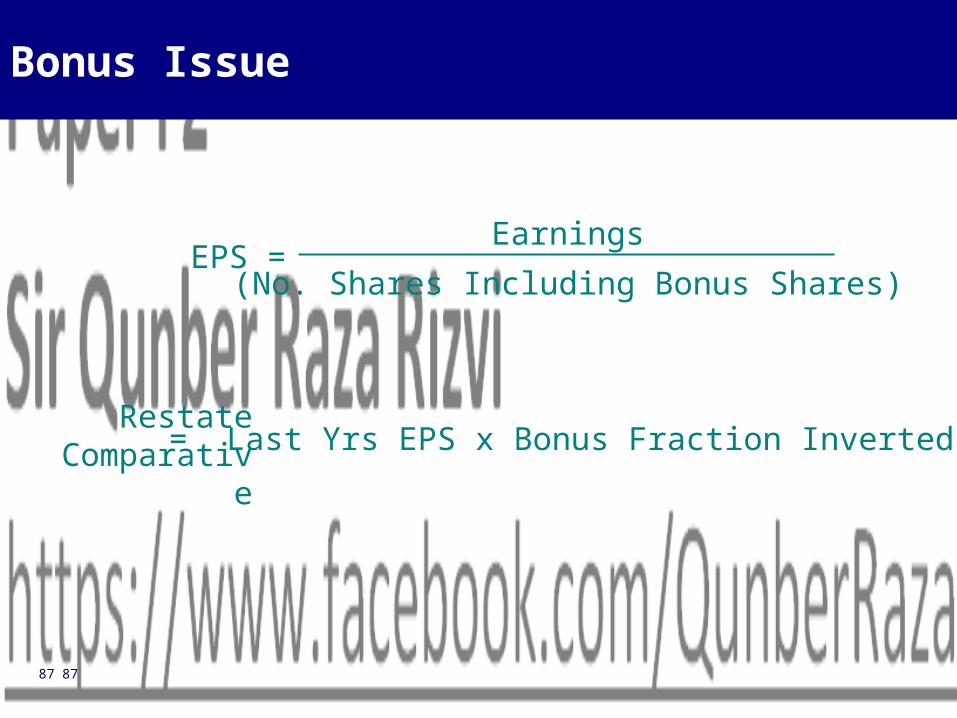
Bonus Issue
EPS =
Restate Comparative = Last Yrs EPS x Bonus Fraction Inverted
Earnings(No. Shares Including Bonus Shares)
88 88
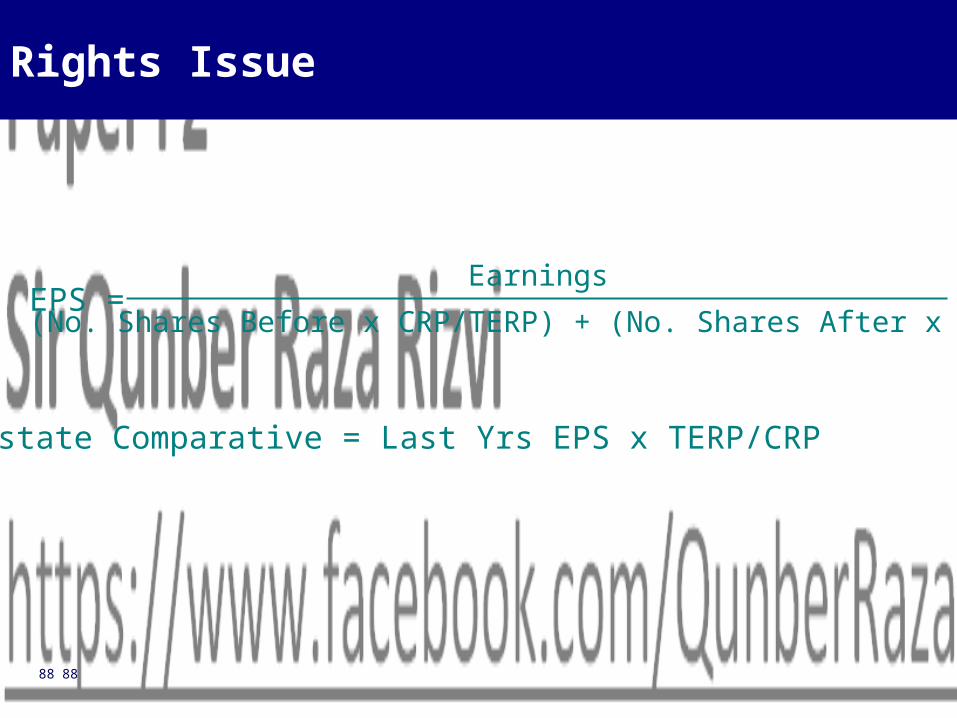
Rights Issue
Restate Comparative = Last Yrs EPS x TERP/CRP
EPS =Earnings
(No. Shares Before x CRP/TERP) + (No. Shares After x ?/12)
89 89
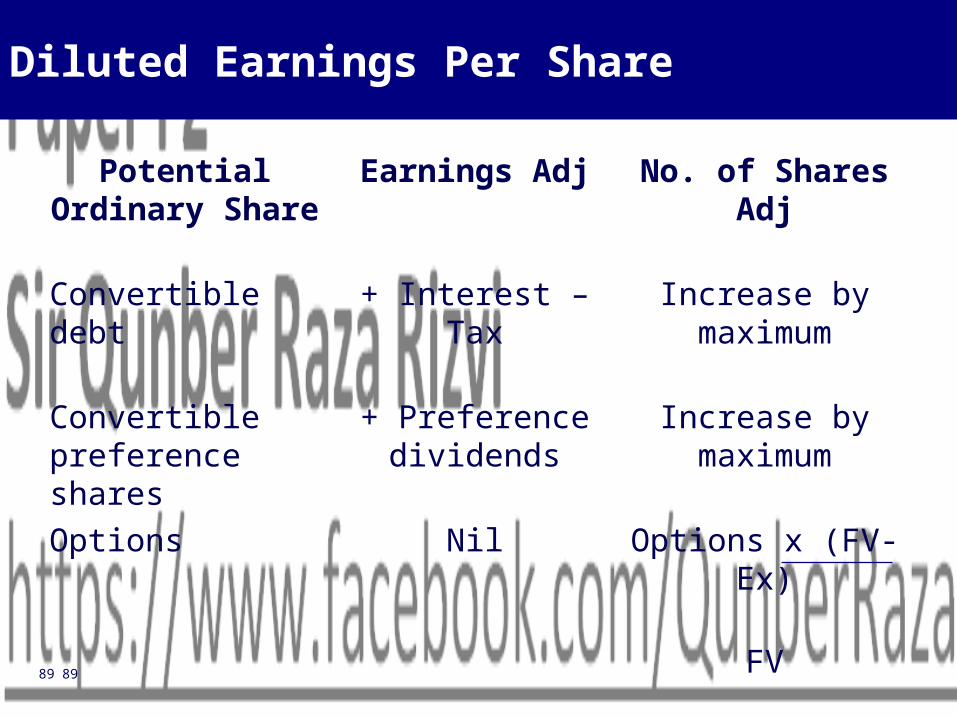
Diluted Earnings Per Share
Options x (FV-Ex) FV
NilOptions
Increase by maximum
+ Preference dividends
Convertible preference shares
Increase by maximum
+ Interest – TaxConvertible debt
No. of Shares AdjEarnings AdjPotential Ordinary Share

90 90
13Session Developments in External Reporting

91 91
Syllabus Content Diagram
Developments in External
Reporting
Non-Financial Environmental and Social Reporting
International Financial Reporting