Cláudia de Matos João Pádua Santos Mestrado Integrado em ...
72
Universidade de Lisboa Faculdade de Farmácia The Influence of Preservative Systems in Cosmetic Gel Formulations prepared from Natural Rheological Modifiers Cláudia de Matos João Pádua Santos Mestrado Integrado em Ciências Farmacêuticas 2017
Transcript of Cláudia de Matos João Pádua Santos Mestrado Integrado em ...
0
Universidade de Lisboa
Faculdade de Farmácia
The Influence of Preservative Systems in
Cosmetic Gel Formulations prepared from
Natural Rheological Modifiers
Cláudia de Matos João Pádua Santos
Mestrado Integrado em Ciências Farmacêuticas
2017
1
Universidade de Lisboa
Faculdade de Farmácia
The Influence of Preservative Systems in
Cosmetic Gel Formulations prepared from
Natural Rheological Modifiers
Cláudia de Matos João Pádua Santos
Monografia de Mestrado Integrado em Ciências Farmacêuticas apresentada à
Universidade de Lisboa através da Faculdade de Farmácia
Orientadora: Doutora Paola Perugini, Professora Associada
Co-Orientadora: Doutora Aida Duarte, Professora Associada com Agregação
2017
2
Università di Pavia
Dipartimento di Scienze del Farmaco
The Influence of Preservative Systems in
Cosmetic Gel Formulations prepared from
Natural Rheological Modifiers
Cláudia de Matos João Pádua Santos
Monografia de Mestrado Integrado em Ciências Farmacêuticas apresentada à
Universidade de Lisboa através da Faculdade de Farmácia
Esta monografia foi realizada no âmbito do programa Erasmus+
Orientadora: Doutora Paola Perugini, Professora Associada
Co-Orientadora: Doutora Aida Duarte, Professora Associada com Agregação
2017
3
Resumo
Os geles são preparações semissólidas para uso farmacêutico com efeito protetor,
terapêutico ou profilático. Os geles são sistemas semirrígidos de dois componentes, nos quais
a fase contínua líquida é imobilizada por uma rede tridimensional reticulada constituída por
partículas ou macromoléculas solvatadas na fase dispersa. As propriedades de coesão dos
sólidos e as propriedades de difusão dos líquidos estão combinadas nos geles.
Os modificadores reológicos são adicionados às formulações com o objetivo principal de
aumentar a viscosidade ou conferir um determinado perfil reológico. Também podem ter
outras funções, como por exemplo, agentes gelificantes e emulsionantes.
Os conservantes são químicos naturais ou sintéticos que são adicionados às formulações
para prevenir a contaminação microbiológica ou alterações químicas indesejáveis e também
para aumentar o tempo de estabilidade do produto. Os sistemas de conservantes consistem
na associação de dois ou mais conservantes para obter ao mesmo tempo uma atividade
antibacteriana e antifúngica, originando, portanto, um espectro de ação mais alargado.
A estabilidade é referida como a ausência de separação da dispersão ao longo de um
período de tempo. Na estabilidade de um produto cosmético, as propriedades dos produtos
devem ser mantidas de forma a que o conjunto de características físico-químicas,
organoléticas, microbiológicas e funcionais sejam adequadas ao fim a que se destinam. A
estabilidade torna-se, portanto, um requisito essencial porque depende de outras condições
essenciais que definem a qualidade do produto cosmético: segurança, conveniência,
conformidade e eficácia para uso num sentido amplo.
Multiple light scattering é uma técnica utilizada para determinar o fluxo de luz transmitido e
a retrodifusão de uma amostra. O valor obtido fornece informações sobre a homogeneidade
da amostra. Além disso, este método permite detetar, compreender e prever fenómenos de
instabilidade que ocorrem durante o envelhecimento ou tempo de prateleira.
O presente trabalho dedica-se ao estudo da influência dos sistemas de conservantes na
estabilidade das formulações de geles para uso cosmético preparadas a partir de
modificadores reológicos naturais. O objetivo é prever pelo método multiple light scattering se
as formulações são estáveis no tempo. Se não forem estáveis, a finalidade é determinar o
fenómeno de instabilidade.
Assim, foram preparados geles com diferentes concentrações de modificadores reológicos,
conservantes e tensioativos. Os modificadores reológicos utilizados foram Cellulose Gum
(CMC), Sodium Carboxymethyl Betaglucan (Beta-glucan) (Beta), Carrageenan (Car), Acacia
Senegal Gum & Xanthan Gum (SolagumTM AX) (SAX), Caesalpina Spinosa Gum (SolagumTM
Tara) (ST), Microcrystalline Cellulose & Cellulose Gum & Xanthan Gum (Sucrathix VX) (SVX)
4
e Xanthan Gum (XG), nas concentrações de 0,5%, 1% e 2%. Utilizou-se Phenoxyethanol &
Caprylyl Glycol (Verstatil® PC) (PC), Triethyl Citrate & Glyceryl Caprylate & Benzoic Acid
(Verstatil® TBG) (TBG) e p-Anisic Acid (dermosoft® 688 eco) (688) como conservantes e
Decyl Glucoside (DG) e Polysorbate 60 (PS) como tensioativos. Após a preparação, todos os
geles eram homogéneos. Alguns eram claros e outros opalescentes devido aos componentes
utilizados. Geralmente, a presença de Verstatil® TBG, decil glucosídeo, SolagumTM AX,
SolagumTM Tara e Sucrathix VX tornam o gel opalescente.
Parâmetros como o pH e a viscosidade foram analisados. O pH foi medido no tempo zero
(logo após a preparação) e após um mês, de forma a verificar se não houve alteração do valor
de pH. O pH da maioria das amostras não alterou significativamente (variação de pH inferior
ou igual a 0,5). A alteração de pH pode influenciar a eficácia dos conservantes que dependem
do pH e a estabilidade do gel. A viscosidade foi medida por um viscosímetro rotacional com a
agulha número 3 a 20°C. O valor de viscosidade foi obtido multiplicando o valor de leitura pelo
fator e a curva de viscosidade traçada através do aumento da velocidade de 0,5 para 100
rpm. O perfil tixotrópico dos geles foi representado. As amostras com goma de celulose
(CMC), SolagumTM AX (SAX), Sucrathix VX (SVX) e goma xantana (XG) têm um fluxo
pseudoplástico, pois a viscosidade diminui quando a taxa de cisalhamento aumenta. Por outro
lado, as amostras com beta-glucano (Beta), carragenina (Car) e SolagumTM Tara (ST),
apresentam um fluxo dilatante, porque a viscosidade aumenta quando a taxa de cisalhamento
aumenta.
A estabilidade dos geles foi monitorizada por avaliação organolética e pelo método multiple
light scattering através do equipamento Turbiscan Tower. O Turbiscan é um inovador
analisador ótico automatizado, trabalhando na região do infravermelho próximo com um modo
de deteção dupla: transmissão e retrodifusão. Os geles foram transferidos para tubos de vidro
cilíndricos e submetidos à análise de estabilidade pelo Turbiscan Tower. Para uma avaliação
ótima, é importante que não existam bolhas de ar dentro da amostra e a amostra esteja
homogeneamente distribuída. Para cada amostra foi realizado um ciclo a 20°C durante 6
horas, um ciclo a 4°C durante 6 horas e finalmente um terceiro ciclo a 20°C durante 6 horas.
Para amostras transparentes, os valores de transmissão foram medidos; e para amostras
opalescentes, o perfil de retrodifusão foi avaliado. De acordo com os resultados obtidos, a
sedimentação, a separação de fases com clarificação e floculação são os fenómenos de
instabilidade mais comuns nas amostras. As amostras tornam-se mais instáveis na presença
de tensioativo e dermosoft® 688 eco. Além disso, amostras com menor concentração de
tensioativo são mais estáveis. A maioria das amostras com Verstatil® TBG torna-se instável
na presença de tensioativo. Amostras com beta-glucano e polisorbato 60, carragenina e decil
glicosídeo, SolagumTM AX e decil glucosídeo, SolagumTM Tara e decil glucosídeo e goma
5
xantana e decil glucosídeo são instáveis. Todas as amostras com goma de celulose e
tensioativo são instáveis. Por outro lado, as amostras com Sucrathix VX são as mais estáveis.
O controlo microbiológico foi realizado um mês após a data de preparação das amostras
com a finalidade de avaliar se durante um mês, após a preparação da formulação, não houve
desenvolvimento microbiano. Ao fim deste tempo, o conservante foi neutralizado com a adição
de 9 ml de Eugon LT100 a 1 ml de amostra, retirou-se 1 ml e adicionou-se ao meio de
crescimento para bactérias e outro 1 ml ao meio de crescimento para fungos. As culturas
foram a incubar 48 horas a 37°C para bactérias e a 20°C por 3-5 dias para os fungos. Em
todas as amostras não se verificou crescimento para os fungos, no entanto as amostras com
o conservante dermosoft® 688 eco apresentaram crescimento bacteriano, um resultado
esperado dado que, este conservante não é recomendado como eficiente para bactérias
Gram+ e Gram-.
A análise fatorial é uma técnica estatística multivariada de dados exploratórios. O objetivo
deste método é descobrir e analisar a estrutura de um conjunto de variáveis inter-relacionadas
para construir uma escala de medição para fatores que de alguma forma controlam as
variáveis originais. Variáveis com o valor do módulo maior que 0,15 têm significância na
estabilidade do gel. Um valor de correlação negativa mostra que a variável contribui para a
estabilidade do gel e um valor de correlação positivo causa a instabilidade do gel. A presença
de goma de celulose, dermosoft® 688 eco, decil glucosídeo, polisorbato 60, combinação de
Verstatil® TBG e decil glucosídeo, a combinação de Verstatil® TBG e polisorbato 60 e a
variação do pH contribuem para a instabilidade do gel. No entanto, a presença de Sucrathix
VX e Verstatil® PC contribui para a estabilidade do gel. Os resultados da análise fatorial são
consistentes com os resultados observados.
O presente trabalho permitiu concluir que os sistemas de conservantes, utilizados nas
formulações em estudo, têm influência na estabilidade dos geles, sendo que a presença de
tensioativo foi o fator que mais contribuiu para a instabilidade do gel.
Palavras-chave: geles, modificadores reológicos naturais, conservantes, estabilidade,
multiple light scattering
6
Abstract
Gels are two-component semi-rigid systems in which the liquid continuous phase is
immobilized by a cross linked three-dimensional network consisting of particles or solvated
macromolecules in the disperse phase. Gel have protective, therapeutic, or prophylactic effect.
Rheological modifiers are additives which are primarily used to increase the viscosity or
impart a desired rheological profile to a formulation. They can sometimes be multifunctional
and perform secondary roles such as gelling agents, emulsifiers, conditioners or film formers.
Preservatives are natural or synthetic chemicals which are added to several products as
pharmaceuticals, cosmetics and food to prevent microbial contamination or undesirable
chemical changes. Another purpose of the preservative addition is to prolong shelf life of the
products. Preservative systems consist in an association of two or more preservatives to give
a broader spectrum of activity.
Stability is referred as the absence of separation of the dispersion over a period of time.
The stability of a cosmetic product is defined as the properties of the product to maintain the
set of physico-chemical characteristics, organoleptic, microbiological and functional that made
it responsive to its purpose of use. Stability becomes therefore an essential requirement
because it depends on other key requirements that define the quality of the cosmetic product:
security, agreeableness, compliance and effectiveness for use in a broad sense.
Multiple light scattering is a technique used to determine light flux transmitted through and
backscattering from a product. The value obtained with this measurement gives information
on the homogeneity of the sample and is characteristic of the dispersion. It enables to detect,
to deep understand and to predict destabilization phenomena which take place during ageing
or shelf-life tests.
The aim of the work is to evaluate the influence of preservative systems in cosmetic gel
formulations prepared from natural rheological modifiers. In order to study this influence, it was
prepared gels in different combinations of rheological modifier, preservative and surfactant.
Then, organoleptic aspect, pH, rheology, stability and microbiological control were analysed.
The gels were prepared with different concentrations of rheological modifiers, preservatives
and surfactants. After preparation, all gels were homogenous. Some were clear and other
opalescent because of the components used. Generally, the presence of Verstatil® TBG, decyl
glucoside, SolagumTM AX, SolagumTM Tara and Sucrathix VX becomes the gel opalescent.
Parameters as pH and viscosity were analysed. pH was measured at time zero and after 1
month. The pH of most of the samples did not change significantly (pH variation less than
±0,5). The pH change can influence the efficacy of the preservatives which are pH-depended
and the gel stability. Viscosity was measured by rotational viscometer. For all viscosity
7
measurements, spindle number 3 was used. The viscosity values were obtained by multiplying
the dial reading for factor. By increasing speed from 0,5 to 100 rpm., it is possible to trace a
viscosity curve and thus obtain a rheological profile. All measurements were performed at
20°C. Samples with cellulose gum (CMC), SolagumTM AX (SAX), Sucrathix VX (SVX) and
xanthan gum (XG) show a pseudo-plastic behaviour. Samples with beta-glucan (Beta),
carrageenan (Car) and SolagumTM Tara (ST) show a dilatant flow.
The stability of the gels was monitored by organoleptic evaluation and by multiple light
scattering by Turbiscan Tower. Turbiscan is an innovative automatized optical analyser,
working in the near-infrared region with a double detection mode: transmission and
backscattering. Gels for multiple scattering measurement were transferred into cylindrical
glass tubes and submitted to Turbiscan Tower stability analysis. For each sample was
performed one cycle at 20°C for 6 hours, one cycle at 4°C for 6 hours and finally a third cycle
at 20°C for 6 hours. For clear samples transmission values were measured; for opalescent
samples backscattering profile was evaluated. According with the results, sedimentation,
phase separation with clarification and flocculation are the most common instability
phenomena in the samples. The samples become more instable in the presence of surfactant
and dermosoft® 688 eco.
Microbiological assay aims to evaluate if there is no microbial growth inside the sample and
consequently if the preservative system has not been inactivated. Eugon LT100 broth (9 ml)
was added to 1 ml of sample (9:1 broth:sample) in order to neutralize the preservative system.
1 ml of the previous mixture were transferred into culture medium: Tryptic Soy Agar for
bacterial and Sabouraud Chloramphenicol Agar for fungi. Samples for bacteria were incubated
at 37ºC for 48 hours and for fungi at 20°C for 3-5 days. For all samples tested, there were no
fungal growth. On the other hand, samples with the dermosoft® 688 eco preservative showed
bacterial growth because this preservative is fair for Gram+ and Gram- bacteria.
The factorial analysis is multivariate statistic technique of data exploratory. The purpose of
this method is to discover and analyse the structure of a set of interrelated variables to
construct a measurement scale for factors which somehow control the original variables. The
factorial analysis calculates the correlation between the variables. Thus, variables with the
modulus value greater than 0,15 have significance in the gel stability. A negative correlation
value show that the variable contributes for the gel stability and a positive correlation value
causes the gel instability. According to the results, the factors which the most influence the
gels stability are the presence of cellulose gum, Sucrathix VX, Verstatil® PC, dermosoft 688®
eco, decyl glucoside, polysorbate 60, the combination of Verstatil® TBG and decyl glucoside,
the combination of Verstatil® TBG and polysorbate 60 and the pH variation.
Keywords: gels; natural rheological modifiers; preservatives; stability; multiple light scattering
8
Acknowledgments
During the monograph, I counted on with the trustworthy and help of diverse people and
institutions. Without them, the research would not be possible.
To Faculdade de Farmácia da Universidade de Lisboa, I want to thank all the teachers,
researchers and staff for the knowledge and availability. To my mates, for all the help,
camaraderie and sharing the good and bad moments during these five years.
To Professora Doutora Aida Duarte, I am very grateful for the orientation shown, the help
and availability. Here I show my gratitude.
To Università di Pavia, I want to thank the opportunity to take part in Erasmus+ programme.
To Dr. Paola Perugini from Univeristà di Pavia, I want to thank the availability to develop a
research work, write my monograph about this and the integration in a city and country that I
did not know.
To Dr. Priscilla Capra from Università di Pavia, I am very grateful for all knowledge about
the work, help in the research, orientation, incentive, support and integration in Pavia and
university.
To other researchers and mates of Università di Pavia, I want to thank for the integration,
help and the availability. For 3 months, Pavia was my home, a city that left a lot of milestones
that I will never forget and will not regret.
To my family, I am very grateful their support and help when I needed the most, patience
and comprehension.
To my friends and boyfriend, I want to thank for all the support, comprehension and
camaraderie in the good and bad moments.
Thank you very much, muito obrigada and grazie mille!
9
Index
1. Introduction ......................................................................................................................13
1.1. Gels ...........................................................................................................................13
1.1.1. Definition .............................................................................................................13
1.1.2. Physico-Chemical Characterization .....................................................................13
1.1.3. Classification .......................................................................................................15
1.1.4. Preparation of the Gel .........................................................................................17
1.1.5. Application ...........................................................................................................19
1.1.6. Advantages and Disadvantages ..........................................................................19
1.2. Rheological Modifiers .................................................................................................20
1.2.1. Definition .............................................................................................................20
1.2.2. Classification .......................................................................................................22
1.3. Preservatives .............................................................................................................22
1.3.1. Definition .............................................................................................................22
1.3.2. Chemico-physical Characterization .....................................................................23
1.3.3. Classification .......................................................................................................24
1.3.4. Mechanism of Action ...........................................................................................25
1.3.5. Microbiological Control ........................................................................................25
1.4. Stability ......................................................................................................................27
1.5. Rheology ...................................................................................................................31
1.6. Multiple Light Scattering .............................................................................................33
2. Aim of the Work ................................................................................................................34
3. Materials ...........................................................................................................................35
3.1. Rheological Modifiers .................................................................................................35
3.1.1. Cellulose Gum (CMC) .........................................................................................35
3.1.2. Sodium Carboxymethyl Betaglucan (Beta-glucan) (Beta) ....................................35
3.1.3. Carrageenan (Car) ..............................................................................................35
3.1.4. Acacia Senegal Gum & Xanthan Gum (SolagumTM AX) (SAX) ............................36
3.1.5. Caesalpina Spinosa Gum (SolagumTM Tara) (ST) ...............................................36
3.1.6. Microcrystalline Cellulose & Cellulose Gum & Xanthan Gum (Sucrathix VX) (SVX)
......................................................................................................................................37
3.1.7. Xanthan Gum (XG) ..............................................................................................37
3.2. Preservatives .............................................................................................................38
3.2.1. Phenoxyethanol & Caprylyl Glycol (Verstatil® PC) (PC) ......................................38
3.2.2. Triethyl Citrate & Glyceryl Caprylate & Benzoic Acid (Verstatil® TBG) (TBG) ......38
3.2.3. p-Anisic Acid (dermosoft® 688 eco) (688) ...........................................................38
10
3.3. Surfactants .................................................................................................................38
3.3.1. Decyl Glucoside (DG) ..........................................................................................38
3.3.2. Polysorbate 60 (PS) ............................................................................................38
4. Methods ...........................................................................................................................39
4.1. Formulation of Gels ....................................................................................................39
4.2. Measure of pH ...........................................................................................................39
4.3. Rheology Measurements ...........................................................................................39
4.4. Multiple Light Scattering .............................................................................................40
4.5. Microbiological Tests .................................................................................................41
4.6. Factorial Analysis .......................................................................................................41
5. Results and Discussions ..................................................................................................43
5.1. Formulation of Gels ....................................................................................................43
5.2. Measure of pH ...........................................................................................................44
5.3. Rheology Measurements ...........................................................................................47
5.4. Multiple Light Scattering .............................................................................................48
5.5. Microbiological Tests .................................................................................................53
5.6. Factorial Analysis .......................................................................................................54
6. Conclusions ......................................................................................................................56
References ...........................................................................................................................57
Annex ...................................................................................................................................62
Index of Figures
Figure 1: Gels structure (2) ...................................................................................................14
Figure 2: Newtonian and non-Newtonian flows (15) .............................................................21
Figure 3: Types of Flow Behaviour (16) ................................................................................22
Figure 4: Variation in energy of the interaction between two particles as a function of distance
(26).......................................................................................................................................29
Figure 5: Simple Newtonian shear model (14) ......................................................................32
Figure 6: "Apparent" and "Differential" Viscosity (16) ............................................................32
Figure 7: pH initial and pH final of samples with cellulose gum .............................................44
Figure 8: pH initial and pH final of samples with beta-glucan ................................................45
Figure 9: pH initial and pH final of samples with carrageenan...............................................45
Figure 10: pH initial and pH final of samples with SolagumTM AX .........................................45
Figure 11: pH initial and pH final of samples with SolagumTM Tara .......................................46
11
Figure 12: pH initial and pH final of samples with Sucrathix VX ............................................46
Figure 13: pH initial and pH final of samples with xanthan gum ............................................46
Figure 14: Beta_A / PC_0,8 vial sample: gel formulation was homogenous .........................50
Figure 15: ΔBS and ΔT profiles of Beta_A / PC_0,8 ............................................................50
Figure 16: Beta_A / PS_10 / PC_0,8 with sedimentation ......................................................50
Figure 17: ΔBS and ΔT profiles of Beta_A / PS_10 / PC_0,8: sedimentation/flocculation
phenomena was observed ...................................................................................................51
Figure 18: CMC_A / PS_10 / PC_0,8 with sedimentation and flocculation ............................51
Figure 19: ΔBS and ΔT profiles of CMC_A / PS_10 / PC_0,8: a sedimentation and flocculation
phenomena was reported .....................................................................................................51
Figure 20: CMC_A / TBG_1 / DG_10 with phase separation ................................................52
Figure 21: ΔBS and ΔT profiles of CMC_A / TBG_1 / DG:10: phase separation was observed
.............................................................................................................................................52
Figure 22: Car_A / DG_10 / TBG_1 with phase separation with clarification .........................52
Figure 23: ΔBS and ΔT profiles of Car_A / DG_10 / TBG_1: phase separation with clarification
was observed .......................................................................................................................53
Figure 24: Microbiological test of XG_A / 688_0,1 ................................................................54
Figure 25: Correlation between rheological modifiers and results of multiple light scattering 54
Figure 26: Correlation between preservatives, surfactants and combinations of preservative
and surfactant and results of multiple light scattering ...........................................................55
Figure 27: Correlation between pH variation, viscosities and rheology and results of multiple
light scattering ......................................................................................................................55
Index of Tables
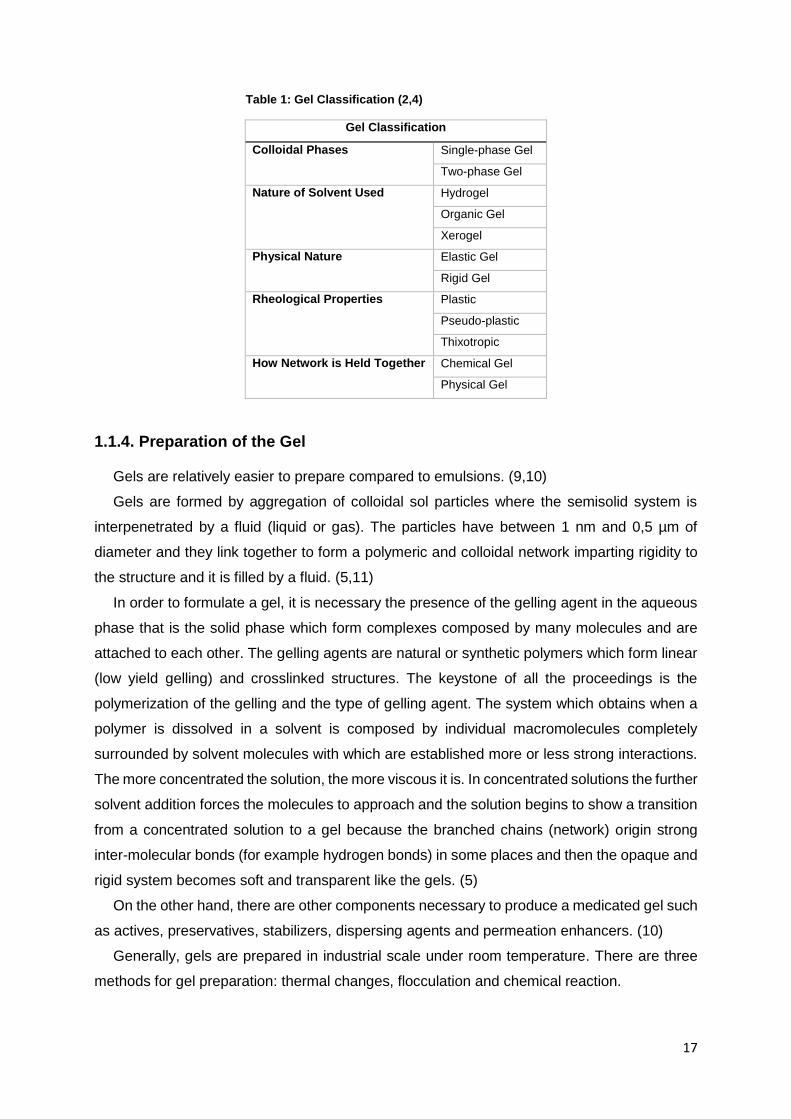
Table 1: Gel Classification (2,4) ............................................................................................17
Table 2: Advantages and disadvantages of a topical gel (2,13) ............................................20
Table 3: Properties of Ideal preservative or preservative system (19) ...................................23
Table 4: Composition of a neutralizing solution ....................................................................26
Table 5: Stability parameters and methods for the gels (29) .................................................31
Table 6: Recommendation relatively to the factorial analysis based on the KMO values (60,62)
.............................................................................................................................................42
12
Table 7: Organoleptic Aspect of samples .............................................................................43
Table 8: Viscosity values of gels ...........................................................................................47
Table 9: Instability phenomena of samples predicted by multiple light scattering ..................49
Table 10: Results of microbiological tests .............................................................................54
Table 11: Aspect of Samples with Cellulose Gum ................................................................62
Table 12: Results of Multiple Light Scattering for Samples with Cellulose Gum ....................62
Table 13: Aspect of Samples with Beta-glucan .....................................................................64
Table 14: Results of Multiple Light Scattering for Samples with Beta-glucan ........................65
Table 15: Aspect of Samples with Carrageenan ...................................................................66
Table 16: Results of Multiple Light Scattering for Samples with Carrageenan ......................67
Table 17: Aspect of Samples with SolagumTM AX .................................................................67
Table 18: Results of Multiple Light Scattering for Samples with SolagumTM AX ....................68
Table 19: Aspect of Samples with SolagumTM Tara ..............................................................68
Table 20: Results of Multiple Light Scattering for Samples with SolagumTM Tara .................69
Table 21: Aspect of Samples with Sucrathix VX ...................................................................69
Table 22: Results of Multiple Light Scattering for Samples with Sucrathix VX ......................69
Table 23: Aspect of Samples with Xanthan Gum ..................................................................70
Table 24: Results of Multiple Light Scattering for Samples with Xanthan Gum .....................70
13
1. Introduction
1.1. Gels
1.1.1. Definition
The word ‘‘gel’’, introduced in the late 1800, is derived from ‘‘gelatin’’. (1,2)
According to the United States Pharmacopeia (USP), gels are defined as “semisolid
systems consisting of either suspensions made up of small inorganic particles or large organic
molecules interpenetrated by a liquid”. (1–3)
Gels are also defined as two-component semi-rigid systems in which the liquid continuous
phase is immobilized by a cross linked three-dimensional network consisting of particles or
solvated macromolecules in the disperse phase. (3,4) This disperse phase can be constituted
by inorganic particles or organic macromolecules, primarily polymers. The inorganic particles
are not dissolved but merely dispersed into the continuous phase; large organic particles are
dissolved in the continuous phase, randomly coiled in the flexible chains. (4) The cross linking
of the disperse phase in the gels can be established by via physical or chemical interactions.
(3,4)
1.1.2. Physico-Chemical Characterization
Gels are systems with a crosslinked three-dimensional network of polymers dispersed in
the liquid. After topical application, the liquid evaporates thereby leaving the drug in a thin gel
film: forming matrix. (2) The presence of the crosslinked three-dimensional network gives the
rigidity of gels. The structure of the network and the properties of the gels result from the nature
of the particles and the type of the forces which are responsible for the linkages. (2,4) Spherical
or isometric aggregates of small molecules or even single macromolecules constitute the
individual particles of hydrophilic colloid. In linear macromolecules, the system is characterized
from entangled macromolecules. The purpose of contact between which may either be
generally small or consist of several particles aligned in a crystalline order. The force of
attraction responsible for the linkage between gelling agent particles may range from strong
primary valences to weaker hydrogen bonds and Van der Waals forces. A slight increment in
temperature show the weak nature of the hydrogen bonds and Van der Waals forces because
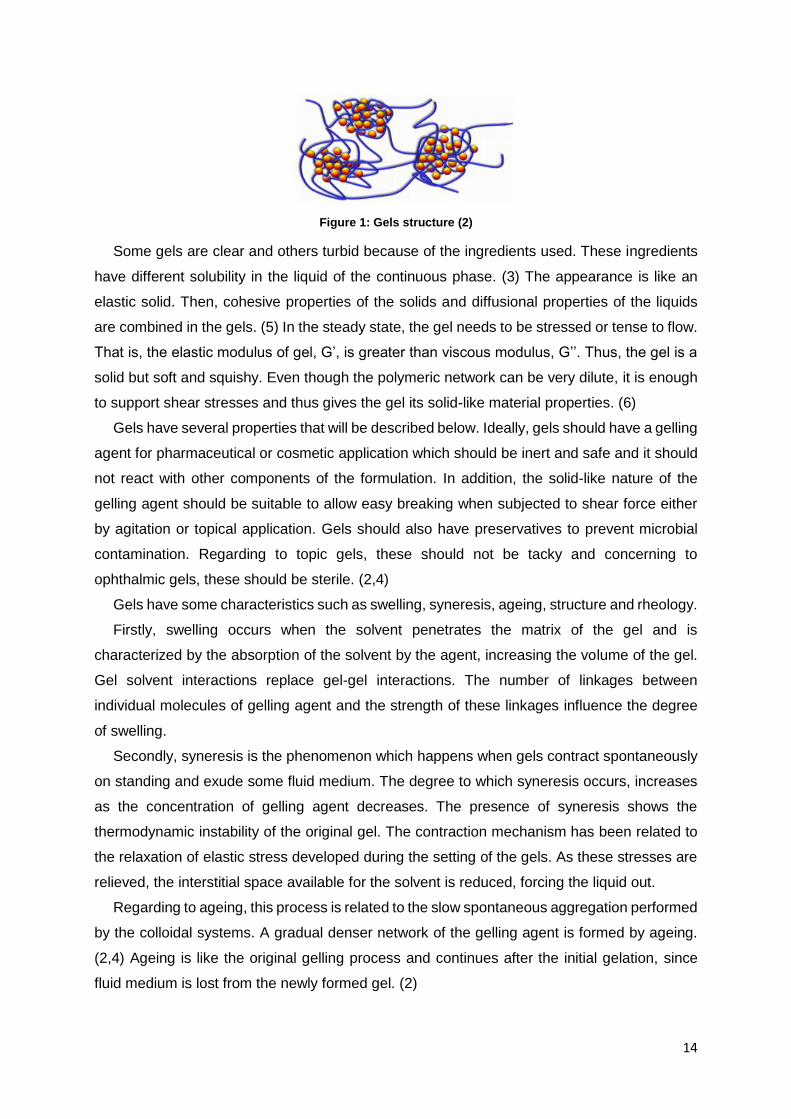
frequently causes liquefaction of gel. (4) Figure 1 represents the gels structure.
14
Figure 1: Gels structure (2)
Some gels are clear and others turbid because of the ingredients used. These ingredients
have different solubility in the liquid of the continuous phase. (3) The appearance is like an
elastic solid. Then, cohesive properties of the solids and diffusional properties of the liquids
are combined in the gels. (5) In the steady state, the gel needs to be stressed or tense to flow.
That is, the elastic modulus of gel, G’, is greater than viscous modulus, G’’. Thus, the gel is a
solid but soft and squishy. Even though the polymeric network can be very dilute, it is enough
to support shear stresses and thus gives the gel its solid-like material properties. (6)
Gels have several properties that will be described below. Ideally, gels should have a gelling
agent for pharmaceutical or cosmetic application which should be inert and safe and it should
not react with other components of the formulation. In addition, the solid-like nature of the
gelling agent should be suitable to allow easy breaking when subjected to shear force either
by agitation or topical application. Gels should also have preservatives to prevent microbial
contamination. Regarding to topic gels, these should not be tacky and concerning to
ophthalmic gels, these should be sterile. (2,4)
Gels have some characteristics such as swelling, syneresis, ageing, structure and rheology.
Firstly, swelling occurs when the solvent penetrates the matrix of the gel and is
characterized by the absorption of the solvent by the agent, increasing the volume of the gel.
Gel solvent interactions replace gel-gel interactions. The number of linkages between
individual molecules of gelling agent and the strength of these linkages influence the degree
of swelling.
Secondly, syneresis is the phenomenon which happens when gels contract spontaneously
on standing and exude some fluid medium. The degree to which syneresis occurs, increases
as the concentration of gelling agent decreases. The presence of syneresis shows the
thermodynamic instability of the original gel. The contraction mechanism has been related to
the relaxation of elastic stress developed during the setting of the gels. As these stresses are
relieved, the interstitial space available for the solvent is reduced, forcing the liquid out.
Regarding to ageing, this process is related to the slow spontaneous aggregation performed
by the colloidal systems. A gradual denser network of the gelling agent is formed by ageing.
(2,4) Ageing is like the original gelling process and continues after the initial gelation, since
fluid medium is lost from the newly formed gel. (2)
15
As regards the structure, as already mentioned, the cross-linking of the particles of the
gelling agent forms a network that gives the rigidity to the gel.
Lastly, gels show rheological characteristics. Solutions of the gelling agents and dispersion
of flocculated solid are pseudo-plastic because the viscosity decreases as shear rate
increases, exhibiting a Non-Newtonian flow behaviour. By applying a shear force, the tenuous
structure of the inorganic particles dispersed in the water is suppressed due to the breakage
of the interparticulate association, exhibiting a greater tendency to flow. In the same way, if a
shear force is applied in the macromolecules, the molecules align in the direction of the organic
(single-phase system). (2,4)
1.1.3. Classification
The gels can be classified based on five parameters: colloidal phases, nature of solvent,
physical nature, rheological properties and network configuration. (4,6) Table 1 summarize the
gel classification.
According to the colloidal phases, there are single-phase gels and two-phase gels. Single-
phase gels are characterized by organic macromolecules such as proteins, polysaccharides,
and synthetic macromolecules, uniformly distributed on the continuous phase in such a way
which no clear limits exist between the dispersed macromolecules and the liquid. (1,7) These
type of gels is composed by natural gums or synthetic macromolecules, mentioned as gel
formers. (7,4) They entangle randomly or bound by Van der Waals forces. (4) Mucilages are
latter preparations. Although the continuous phase of the gels is usually water, oil and alcohol
can also constitute this phase. For example, mineral oil can be combined with a polyethylene
resin to form an oleaginous ointment base. Two-phase gels are characterized by a network of
small discrete particles. The gel mass is mentioned as magma when the particle size of
dispersed phase is relatively large. Two-phase gels may be thixotropic, forming semisolids on
standing and becoming liquid on agitation. If gels and magmas have particles of colloidal
dimension, they can be considered as colloidal dispersions. The accepted size range for
colloidal particles is between 1 nm and 0,5 µm. The larger particle size of the dispersed phase
in colloidal system is one difference between colloidal dispersions and true solutions. Other
difference is in optical properties. True solutions look clear because do not scatter light and
colloidal dispersions contain discrete particles scatter light. (7)
Concerning to the nature of solvent it is possible to classify gels as hydrogels, organic gels
or xerogels. Hydrogels are composed by water on the continuous phase and a three-
dimensional network of polymers or colloids as discontinuous phase. (4,6,8) Examples of these
type of gels are bentonite magma, gelatin, cellulose derivatives, carbomer, and poloxamer gel.
Organic gels contain a non-aqueous solvent, generally oil. Examples of organic gels are
16
plastibase (low molecular weight polyethylene dissolved in mineral oil & short Cooled), Olag
(aerosol) gel and dispersion of metallic stearate in oils. Xerogels are solid gels with low solvent
concentration. They are produced by evaporation of solvent or freeze drying, leaving the gel
framework behind on contact with fresh fluid. They swell and can be reconstituted. Examples
of these types of gels are tragacanth ribbons, acacia tear β-cyclodextrin, dry cellulose and
polystyrene.
Related to the physical nature, the gels can be classified into elastic or rigid gels. Elastic
gels show an elastic behaviour. The bonds which linked the fibrous molecules at the point of
junction are relatively weak. Examples of these weak bonds are hydrogens bonds and dipole
attraction. If the molecule possesses free –COOH group, then additional bonding takes place
by salt bridge of type –COO-X-COO between two adjacent strand networks. Examples of
elastic gels are alginate, Carbopol, pectin, agar and Guar gum. On the other hand, rigid gels
can be composed by macromolecules in which the system linked by primary covalent bonds.
Example of these type of gels is silica where silica acid molecules are held by Si-O-Si-O bond
to give a polymer structure with a porous network.
According to the rheological properties, the gels generally exhibit a non-Newtonian flow and
can be classified into plastic, pseudo-plastic and thixotropic gels. The rheogram of plastic gels
is characterized from a yield value above which the elastic gel distorts and begins to flow.
Bingham bodies and flocculated suspensions of Aluminium hydroxide are classified as plastic
formulations. Pseudo-plastic gels show a pseudo-plastic profile. Viscosity decreases with
increasing of shear rate, since long chain molecules of the polymers begin to align their long
axis in the direction of flow with release of solvent from gel matrix. Dispersion of tragacanth,
sodium alginate and Na-CMC are examples of pseudo-plastic gels. Thixotropic gels are
characterized by weak bonds between particles which can be broken simply down by shaking.
The resulting solution will revert back to gel due to the particles colliding and linking together
again. Kaolin, bentonite and agar are examples of rheological modifiers with thixotropic
behaviour. (4,8)
Gels can be characterized by chemical or physical interactions. Chemical gels are linked
by permanent covalent inter-molecular bonds between cross-linked polymeric molecules. (5,6)
Chemical gels are not affected by the time and/or temperature but it is affected by the
electrolytes. (5) On the other hand, physical gels are connected by entanglements, ionic,
hydrogen bonds, electrostatic interactions, dipole-dipole interactions, Van der Waals forces
and hydrophobic interactions which are reversible secondary intermolecular forces relatively
weak. (4,6). Some environment, as heating, can destroy gel structure, breaking inter-molecular
interactions between polymeric chains. An example of physical gels is jellies. (5)
17
Table 1: Gel Classification (2,4)
Gel Classification
Colloidal Phases Single-phase Gel
Two-phase Gel
Nature of Solvent Used Hydrogel
Organic Gel
Xerogel
Physical Nature Elastic Gel
Rigid Gel
Rheological Properties Plastic
Pseudo-plastic
Thixotropic
How Network is Held Together Chemical Gel
Physical Gel
1.1.4. Preparation of the Gel
Gels are relatively easier to prepare compared to emulsions. (9,10)
Gels are formed by aggregation of colloidal sol particles where the semisolid system is
interpenetrated by a fluid (liquid or gas). The particles have between 1 nm and 0,5 µm of
diameter and they link together to form a polymeric and colloidal network imparting rigidity to
the structure and it is filled by a fluid. (5,11)
In order to formulate a gel, it is necessary the presence of the gelling agent in the aqueous
phase that is the solid phase which form complexes composed by many molecules and are
attached to each other. The gelling agents are natural or synthetic polymers which form linear
(low yield gelling) and crosslinked structures. The keystone of all the proceedings is the
polymerization of the gelling and the type of gelling agent. The system which obtains when a
polymer is dissolved in a solvent is composed by individual macromolecules completely
surrounded by solvent molecules with which are established more or less strong interactions.
The more concentrated the solution, the more viscous it is. In concentrated solutions the further
solvent addition forces the molecules to approach and the solution begins to show a transition
from a concentrated solution to a gel because the branched chains (network) origin strong
inter-molecular bonds (for example hydrogen bonds) in some places and then the opaque and
rigid system becomes soft and transparent like the gels. (5)
On the other hand, there are other components necessary to produce a medicated gel such
as actives, preservatives, stabilizers, dispersing agents and permeation enhancers. (10)
Generally, gels are prepared in industrial scale under room temperature. There are three
methods for gel preparation: thermal changes, flocculation and chemical reaction.
18
Some gels are produced by thermal changes depending on the solubility of gelling agents.
A gelling agent more soluble in hot water than in cold water when subjected to a decrease in
temperature, undergoes a decrease in its degree of hydration, thus forming the gel. Examples
of gels obtained by this procedure are gelatin gel, agar sodium oleate, guar gum and cellulose
derivatives. On the other hand, the more soluble gelling agents in cold water than in hot water
have hydrogen bonds with the water and when increasing the temperature, some hydrogen
bonds may be broken which will cause the formation of the gel. This method cannot be used
in all cases; therefore, it cannot be a general method.
Moreover, gels can be obtained by flocculation. In this method, the amount of salt added
should be such as to cause precipitation leading to a state of age to form the gel and not an
amount causing a complete precipitation. A rapid mixing must occur to avoid high local
concentration of precipitant. The gels formed by flocculation have thixotropic profile. An
example is ethyl cellulose: polystyrene in benzene is gelled by rapid mixing with suitable
amounts of a non-solvent such as petroleum ether. However, adding salts to hydrophobic
solutions don’t form gels because coagulation occurs. Examples of these cases are gelatin,
proteins and acacia gum which are not affected by the high concentration of electrolytes
because of the salt out effect.
On the other hand, other gels are obtained by chemical interaction between solute and
solvent. Examples are aluminium hydroxide gel, PVA, cyanoacrylates with glycidol ether
(Glycidol), toluene diisocyanates (TDI), methane diphenyl isocyanine (MDI) that cross-links the
polymeric chain. The aluminium hydroxide gel is obtained by interaction in aqueous solution
of an aluminium salt and sodium carbonate: an increased concentration of reactants produces
a gel structure. (4,8)
Generally gels are formulated by natural vegetable polymers such as gum arabic (from
Acacia senegal exudate), Karaja gum (from Sterculia urens exudate), locust bean gum
(extracted from seeds of Ceratonia siliqua), guar gum (extracted from seeds of Cyamopsis
tetragonolobus), carrageenan (extracted from red algae Chondrus crispus), alginates
(extracted from the family of Laminarie algae), xanthan gum (obtained from the fermentation
of corn starch by the bacterium Xanthomonas campestris) and gellana gum (obtained from the
fermentation of cultures of microorganisms of Pseudomonas elodea). These gelling agents are
now much used in the food and more and more in small quantities in the cosmetic sector.
However, cosmetic gel obtained with these natural polymers are not very pleasing to the
customer due the sensory profile that it is not suitable for cosmetics. Furthermore, polymers
have some disadvantages as gelling power and sensibility to the pH and electrolytes.
On the other hand, gels obtained by modified natural gelling agents (derivatives of cellulose
modified as cellulose gum, hydroxyethylcellulose, hydroxypropylcellulose, hydroxypropyl
methylcellulose), but also modified derivatives from guar gum (guar hydroxipropyl) show
19
particular lubricant properties. For this reason, this type of products is used in products for man
(beard shaving products). In this group, there is also modified castor oil (hydrogenated castor
oil) used for lipid gel.
Furthermore, the gelling agents include also synthetic acrylic derivatives (carbomer with
different molecular weights 940-941-934), hydrocarbon derivatives
(ethylene/propylene/styrene copolymer), and inorganic (smectite, clays, silicas). These gelling
agents can be as liquid phase or solid powder. These gelling agents are technically better, with
a compact and transparent structure, ease of preparation and good ability to deliver functional
ingredients. (5)
1.1.5. Application
Gel represents a semisolid physical form for medical or pharmaceutical use, especially in
the areas of cosmetics and food. (5) Gels are applied to the skin or mucosa with protective,
therapeutic, or prophylactic effect. (12)
Gels are considered delivery systems which allow to administer drugs orally, topically or
into body cavities and intramuscularly. (2,7,4) Gels can be used as long acting forms of drug
injected intramuscularly.
Moreover, gelling agents are useful binders in tablet granulation, protective colloids in
suspensions, thickeners in oral liquids, and suppository bases.
Cosmetically gels have been employed in wide variety of products, including shampoos,
fragrance products, dentifrices, skin and hair care preparations. (2,4)
The gel containing anti-inflammatory steroids is used to treat scalp inflammations because
the creams and ointments are too greasy for this location.
Gels have better potential as a vehicle to administer drug topically in comparison to
ointment, because they are non-sticky, requires low energy during formulation, are stable and
have aesthetic value. (2)
In according to gelling agent, it is possible to obtain different type of gels, such as
soft/sliding, solid and siliceous-glyceric-gel (characteristics of toothpastes). The gels are
contained in tubes or bottles.
In cosmetics field, gels as emulgel, hydrogel, hydroglicerin pastes and sticks have seen
significant expansion for several applications, such as for the skin (face and body), for the
tooth, for the hair and, nowadays, for the reconstruction of the nails. (5)
1.1.6. Advantages and Disadvantages
In Table 2 is resumed advantages and disadvantages of a topical gels.
20
Table 2: Advantages and disadvantages of a topical gel (2,13)
Advantages of a topical gel Disadvantages of a topical gel
No gastrointestinal drug absorption and consequently no
subjected to enzymatic activity and no drug interactions with
food, drink, and drugs
Poor permeability of some drugs through the
skin
No first-pass effect, possibly avoiding the deactivation by
digestive and liver enzymes
Can be used only for drugs which require very
small plasma concentration for action
A substitute for other routes of administration in cases as
vomiting, swallowing problems, resistant children and diarrhoea
Larger particle size drugs not easy to absorb
through the skin
Patient acceptability since is non-invasive and avoids the
inconvenience of parenteral therapy
Vulnerable to microbial contamination and for
this requires preservative addition
Reduction of doses as compare to oral dosage forms Short duration of action due to rapid
absorption
Ability to dissolve a wide range of medications with different
chemical properties, making combination therapy with one
transdermal cream possible
Possibility of allergenic reactions
Cooling effect due to evaporation Enzyme in epidermis may denature the drugs
Can be used on macerated skin Less stable, can crack
Drug therapy may be terminated rapidly by removal of the
application from the skin surface
Localized effect with the minimum side effects
Gels have less additives
Less greasy in nature and can be easily removed from the skin
Cost effective
1.2. Rheological Modifiers
1.2.1. Definition
Rheological modifiers are additives which are primarily used to increase the viscosity or
impart a desired rheological profile to a formulation. (14) Furthermore, rheological modifiers
are also commonly known as thickeners and they are added in limited proportion to another
substance or mixture of substances in order to modify the rheological behaviour. (5,14) On the
other hand, they can sometimes be multifunctional and perform secondary roles such as
gelling agents, emulsifiers, conditioners or film formers. (14) Rheological modifiers are used to
increase viscosity of suspensions and avoid particle sedimentation, and to increase the
dispersion of insoluble substances and physical stability of emulsions and tensiolites. For
example, a polymer can be used to stabilize a shower gel with exfoliate effect: polymer
increases the viscosity of the system slowing down the surfacing or sedimentation of the
exfoliating particles In particular polymer modifies rheological behaviour by nearly Newtonian
21
to pseudo-plastic profile with sliding threshold, in order to prevent the movements of the
particles. (5)
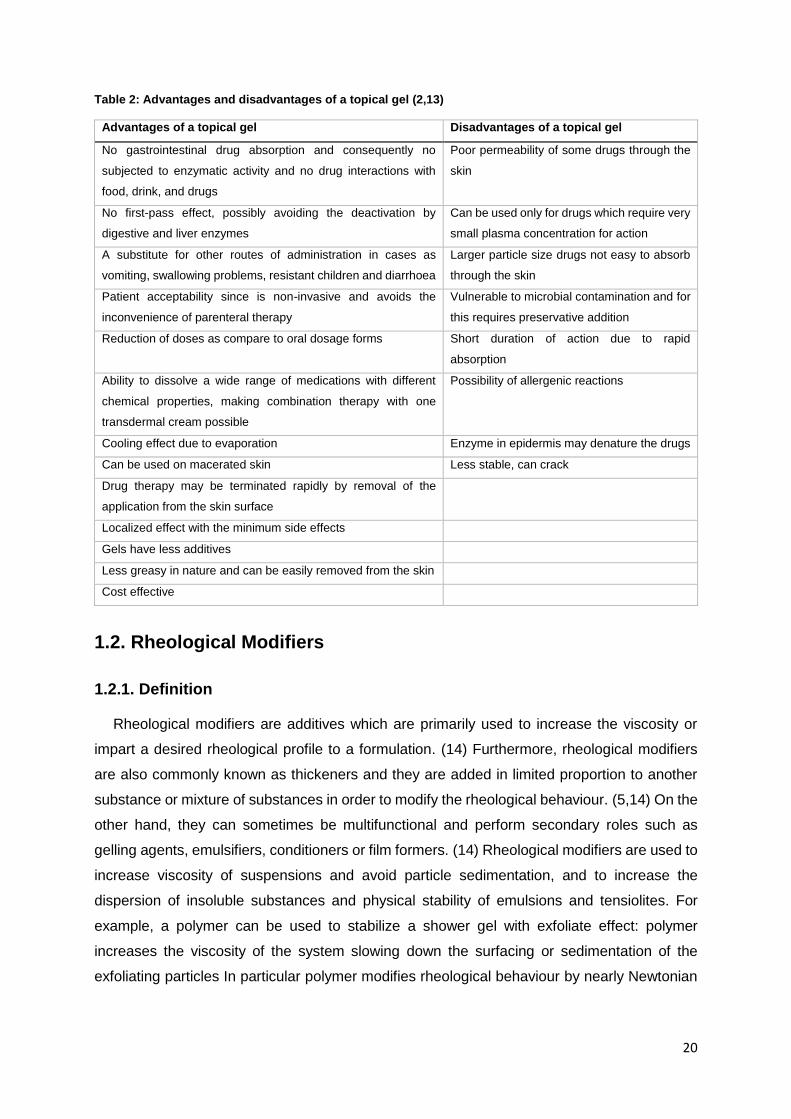
A rheological profile can be classified as Newtonian or non-Newtonian. These last ones can
be divided, according to shear, in pseudo-plastic, plastic and dilatant flow. (14) Figure 2
represents Newtonian and non-Newtonian flows.
Figure 2: Newtonian and non-Newtonian flows (15)
A Newtonian flow has a constant viscosity independently from shear rate an ideal
behaviour. (14) If graphically represented, with shear rate vs shear stress, it obtains a straight
line through the origin of the Cartesian axes. The value of the coefficient represents the rate
of viscosity. Since the viscosity is constant and independent of shear rate, is enough one
measurement to completely characterize the system. (15) This type of flow is characteristics
of water, glycerol, olive oil, and others solvents and mineral oils. (14,15)
Non-Newtonian flow is represented by the majority of the fluids. Plotting shear stress vs
shear rate it obtains a curve. So, the coefficient of viscosity is different at each point on the
shear stress versus shear rate curve. In this case it is possible to speak about “apparent”
viscosity, determined at each point of the curve, using the tangent of the angle ɸ. The
evaluation of apparent viscosity can be particularly important when the “thickening” behaviour
of two high molecular weight water-soluble polymers are compared. One polymer may have a
higher apparent viscosity than the other one at a low shear rate, but a lower apparent viscosity
at higher rate. For this reason, the measurement of a single apparent viscosity has little
significance for non-Newtonian fluid. It is not only necessary to measure the viscosity at more
than one shear rate, but the values must be in the range which is important for the particular
application. (16)
A pseudo-plastic flow behaviour is characteristic of many cosmetic products where viscosity
decreases with increasing of shear rate. However, when the shear force is removed, the fluid
immediately reverts back to its original viscosity. If the fluid returns to original structure with
dilated time, it speaks about thixotropic behaviour time dependent.
Dilatant or shear thickening polymers show an increasing viscosity with increasing shear
rates. Dilatant flow can be verify in dispersions with high solids content or high polymer
concentrations. (14)
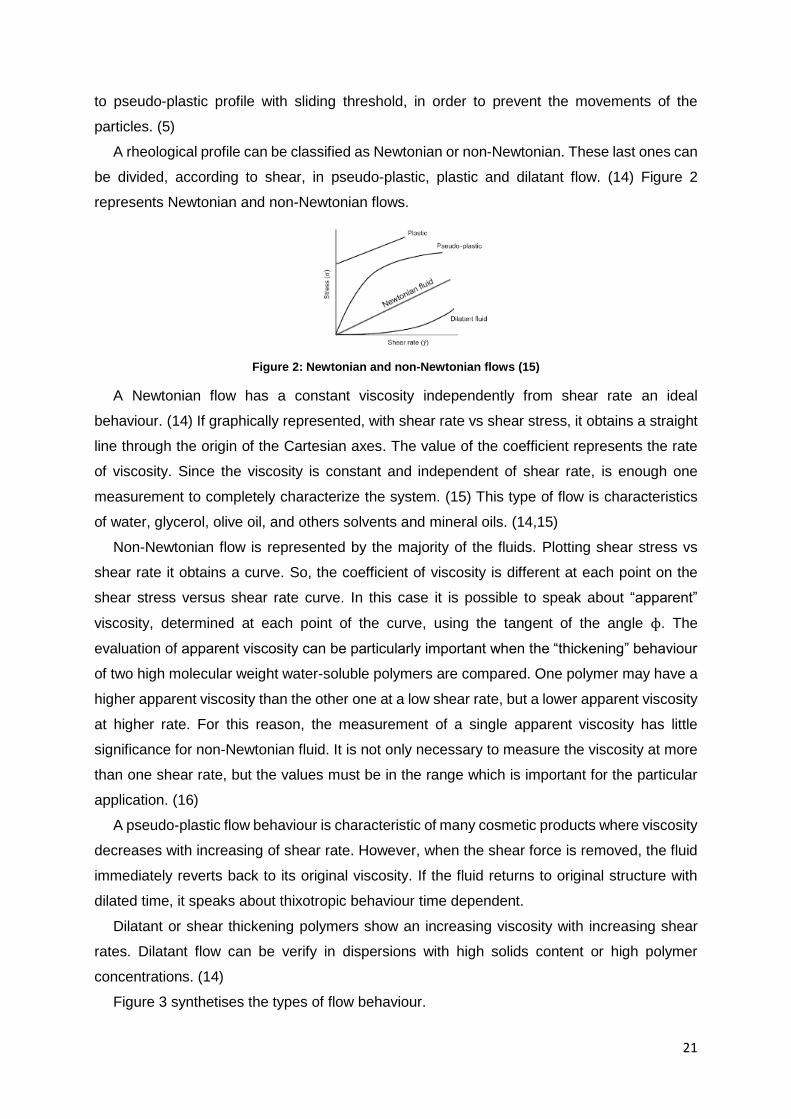
Figure 3 synthetises the types of flow behaviour.
22
Figure 3: Types of Flow Behaviour (16)
1.2.2. Classification
The classification of the rheological modifiers can be based on a variety of schemes,
including their ionic charge (anionic, cationic, non-ionic or amphoteric), their application in
aqueous or solvent-based formulations, and their thickening mechanisms. Traditionally, these
components are classified by their chemical nature and origin. Concerning to chemical nature,
rheological modifiers can be organic or inorganic and related to the origin they can be natural,
semisynthetic and synthetic.
Natural polymers are originated from plants, animals or microorganisms; they have larger
chemical structures based on proteins or polysaccharides. (14) There are two types of
problems related to the use of natural rheological modifiers: reproducibility, microbiological
contamination and environmental contaminants. (5)
Semisynthetic rheological modifiers include modified celluloses such as carboxymethyl
cellulose, methyl cellulose, hydroxyethyl cellulose, and hydroxypropyl cellulose. (15)
Synthetic rheological modifiers include more and more products, different for structure such
as polyelectrolytic acrylic polymers and maleic anhydride copolymers. (5,15) It is possible to
classify in acrylic derivatives, hydrocarbon derivatives, and amorphous silicas and silicates. (5)
1.3. Preservatives
1.3.1. Definition
Preservatives are natural or synthetic chemicals which are added to several products as
pharmaceuticals, cosmetics and food in order to prevent microbial contamination or
undesirable chemical changes. (17) The Regulation nº 1223/2009 defines preservatives as
“are substances exclusively or mainly intended to inhibit the development of microorganisms
Flow Behaviour
Time Independent
Shear Independent
Newtonian
Shear Dependent
Shear Thinning
(peseudo-plastic)
Shear Tickening (dilatant)
Time Dependent
Shear Independent
Shear Dependent
Shear Thinning
(thixotropic)
Shear Tickening (rheoxepy)
23
in the cosmetic product”. (18) Another purpose of the preservative addition is to prolong shelf
life of the products. It is essential to add preservatives to several products, specially to those
that have higher water content, because this addition avoids the alteration and the degradation
by microorganisms during storage. (17)
Preservative systems consist in an association of two or more preservatives in order to
obtain at the same time an antifungal and antibacterial activity to give a broader spectrum of
activity.
Some preservatives, due to their limited solubility in water, are difficult to add to
formulations. For this reason it is better to pre-dissolve the preservative in an opportune solvent
or use liquid preservative. (19)
1.3.2. Chemico-physical Characterization
Preservatives should have ideal properties. These type of formulation components should
not be irritant or toxic. They should be physical and chemical stable and compatible with other
ingredients used in formulation. Preservatives should be act as good antimicrobial agent and
should exert wide spectrum of activity. They should be potent in order to use small
concentration. Preservatives should maintain activity throughout product manufacturing, shelf
life and usage. (17)
In addition, in order to be an ideal cosmetic preservative, it should have lack of irritation and
lack of sensitization, should be stable at a wide range of temperatures, pH and dilated time,
should be compatible with numerous ingredients and packaging materials, should be effective
against numerous microorganisms and should not have odour or colour. (20)
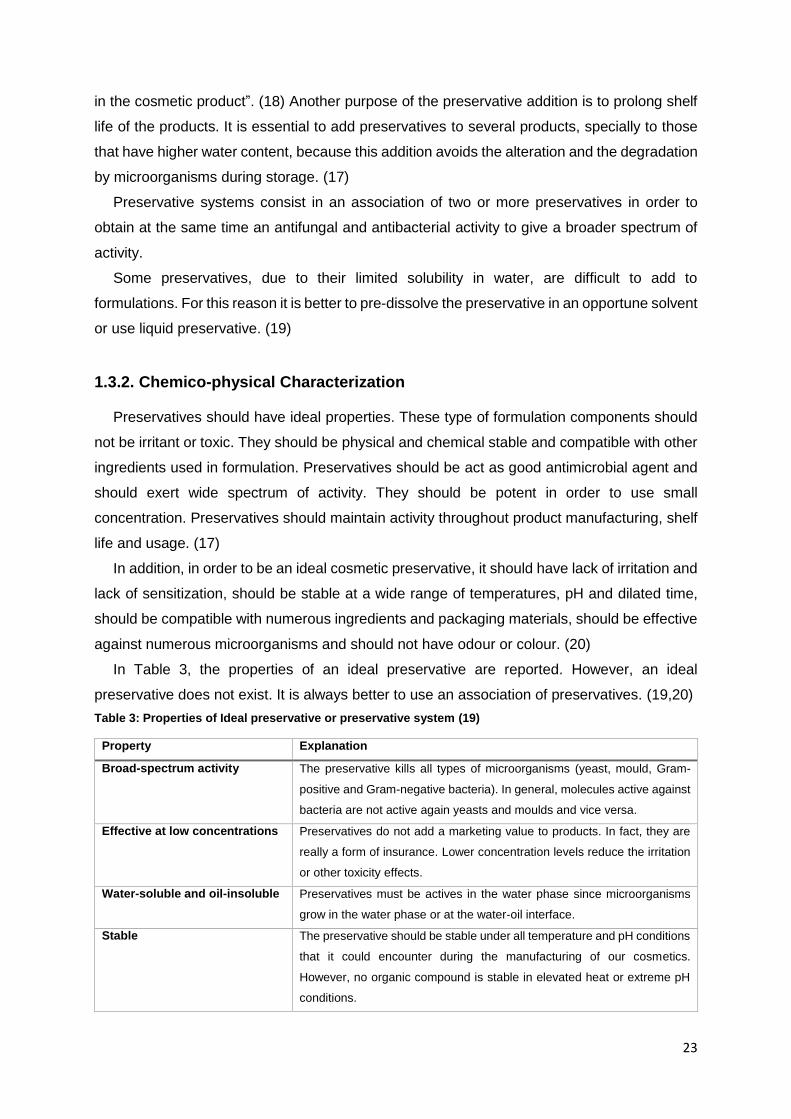
In Table 3, the properties of an ideal preservative are reported. However, an ideal
preservative does not exist. It is always better to use an association of preservatives. (19,20)
Table 3: Properties of Ideal preservative or preservative system (19)
Property Explanation
Broad-spectrum activity The preservative kills all types of microorganisms (yeast, mould, Gram-
positive and Gram-negative bacteria). In general, molecules active against
bacteria are not active again yeasts and moulds and vice versa.
Effective at low concentrations Preservatives do not add a marketing value to products. In fact, they are
really a form of insurance. Lower concentration levels reduce the irritation
or other toxicity effects.
Water-soluble and oil-insoluble Preservatives must be actives in the water phase since microorganisms
grow in the water phase or at the water-oil interface.
Stable The preservative should be stable under all temperature and pH conditions
that it could encounter during the manufacturing of our cosmetics.
However, no organic compound is stable in elevated heat or extreme pH
conditions.
24
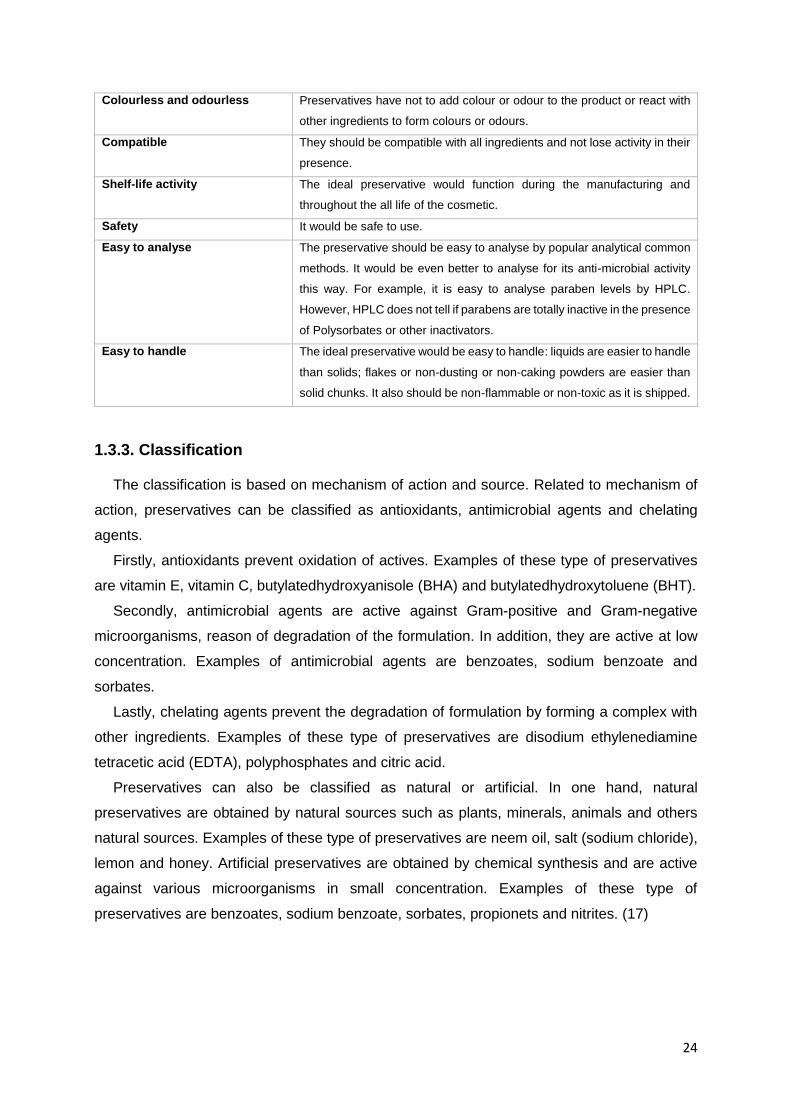
Colourless and odourless Preservatives have not to add colour or odour to the product or react with
other ingredients to form colours or odours.
Compatible They should be compatible with all ingredients and not lose activity in their
presence.
Shelf-life activity The ideal preservative would function during the manufacturing and
throughout the all life of the cosmetic.
Safety It would be safe to use.
Easy to analyse The preservative should be easy to analyse by popular analytical common
methods. It would be even better to analyse for its anti-microbial activity
this way. For example, it is easy to analyse paraben levels by HPLC.
However, HPLC does not tell if parabens are totally inactive in the presence
of Polysorbates or other inactivators.
Easy to handle The ideal preservative would be easy to handle: liquids are easier to handle
than solids; flakes or non-dusting or non-caking powders are easier than
solid chunks. It also should be non-flammable or non-toxic as it is shipped.
1.3.3. Classification
The classification is based on mechanism of action and source. Related to mechanism of
action, preservatives can be classified as antioxidants, antimicrobial agents and chelating
agents.
Firstly, antioxidants prevent oxidation of actives. Examples of these type of preservatives
are vitamin E, vitamin C, butylatedhydroxyanisole (BHA) and butylatedhydroxytoluene (BHT).
Secondly, antimicrobial agents are active against Gram-positive and Gram-negative
microorganisms, reason of degradation of the formulation. In addition, they are active at low
concentration. Examples of antimicrobial agents are benzoates, sodium benzoate and
sorbates.
Lastly, chelating agents prevent the degradation of formulation by forming a complex with
other ingredients. Examples of these type of preservatives are disodium ethylenediamine
tetracetic acid (EDTA), polyphosphates and citric acid.
Preservatives can also be classified as natural or artificial. In one hand, natural
preservatives are obtained by natural sources such as plants, minerals, animals and others
natural sources. Examples of these type of preservatives are neem oil, salt (sodium chloride),
lemon and honey. Artificial preservatives are obtained by chemical synthesis and are active
against various microorganisms in small concentration. Examples of these type of
preservatives are benzoates, sodium benzoate, sorbates, propionets and nitrites. (17)
25
1.3.4. Mechanism of Action
The mechanism of action of a preservative is multiple and it is not always clearly identified.
The bacteriostatic or bactericidal action could be affected by: destruction of the cell wall,
modification of the cell membrane permeability or its destruction, denaturation of cytoplasmic
or membrane proteins or enzymatic inactivation. (5)
The ethylenediaminetetra-acetic acid (EDTA) is a chelating agent which modifies the cell
membrane permeability. This preservative acts in synergy with other chemical preservatives
and this synergy interruptes the outer lipid layer of the cell membrane of Gram-negative
bacteria. Then, the stability dependent of calcium and magnesium ions is altered, allowing
more penetration of other antimicrobial agent into the bacteria cell.
A “self-preserved” formula is another method to preserve a product by using raw materials
which not support the microbiological growing and optimize their relative content. Humectants
like glycerin and sorbitol at specific levels decreses the water activity, increasing the formula
resistance. Other ingredients have inherently antibacterial properties, contribuiting for a self-
preservation of the product. Examples of these ingredients are alcohols, cationic detergents,
fragance components, lipophilic acids (lauric and myristic acids), essential oils like tea tree oil
or geraniol or eucalyptol. These ingredients are frequently used in cosmetic formulations. The
physical factors which contribute to build a self-preserved product are pH and water activity.
For example, the most of the microorganism living at pH around 5 to 8 and if the pH of the
product is out of this range it is more difficult for bacteria to live. On the other hand, since water
is essential for bacterial growth the decrease of water activity avoids bacterial contamination
of the product. (21)
1.3.5. Microbiological Control
The microbiological control is described in Portuguese Pharmacopeia. There are five
methods: microbiological examination of non-sterile products: microbial enumeration tests,
microbiological examination of non-sterile products: test for specified microorganisms, efficacy
of antimicrobial preservation, efficacy test of antimicrobial preservatives and microbiological
quality of non-sterile pharmaceutical preparations and substances for pharmaceutical use.
In microbiological examination of non-sterile products: microbial enumeration tests, the
determination of the total viable aerobic germs is performed by the membrane filtration method
or by plaque determination. However, there are samples which cannot be analyzed by the
membrane filtration method or by plaque determination samples. In these cases, the 'most
likely number' method is used. The choice of the method depends on several factors, such as
product nature and the expected number of microorganisms. All these methods are
conventionally validated. These tests allow the determination of mesophilic bacteria and fungi
26
and yeasts that grown in aerobiosis. If the sample has antimicrobial activity, it is conveniently
neutralized. If antimicrobial inactivators are used for this purpose, their efficacy and toxicity to
the microorganisms in question is demonstrated.
For microbiological examination of non-sterile products: test for specified microorganisms,
the selective media are used to specified search microorganisms. The microorganisms that
have undergone subtheal lesions are not detected in any selective media. When using
selective media, the procedures encompass a revival stage, since these microorganisms have
an impact on the quality of the product. If the sample has antimicrobial activity, it is conveniently
neutralized. The selective media for Enterobacteria and other Gram-negative bacteria,
Escherichia coli, Salmonella, Pseudomonas aeruginosa and Staphylococcus aureus. The
neutralizing agents may be added to the product in order to neutralize any antimicrobial activity.
These agents may be added to the buffered peptone solution with sodium chloride, pH 7,0,
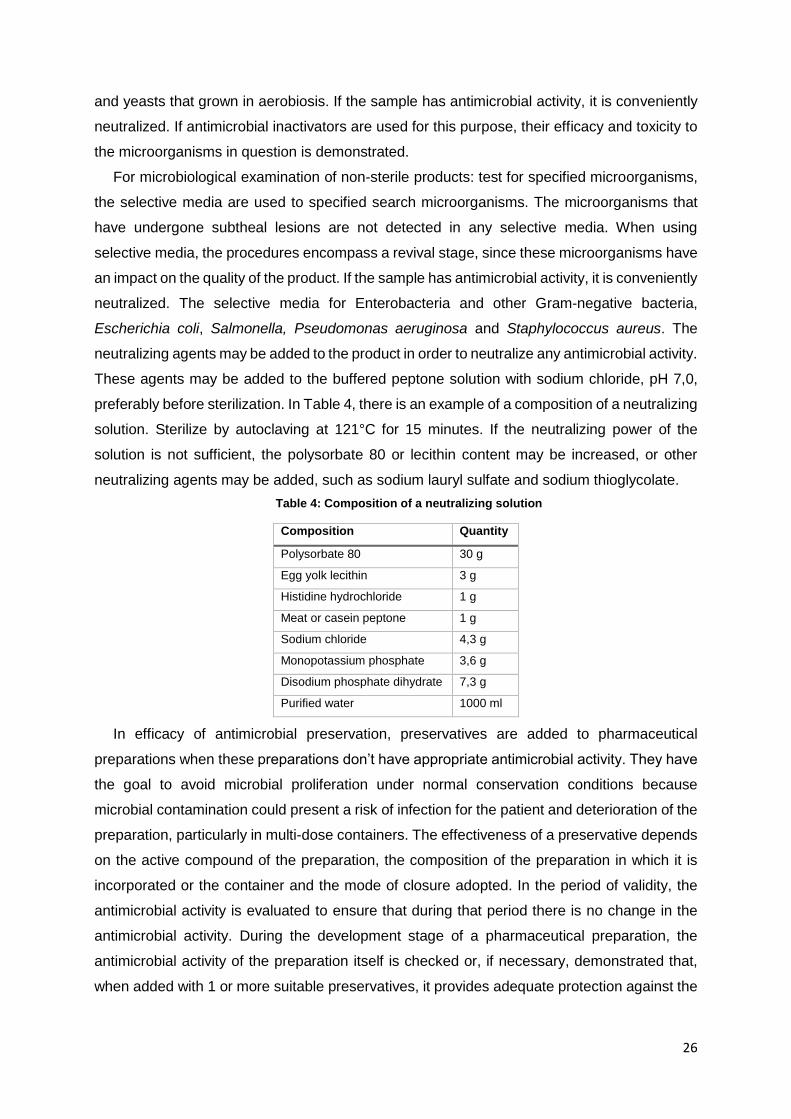
preferably before sterilization. In Table 4, there is an example of a composition of a neutralizing
solution. Sterilize by autoclaving at 121°C for 15 minutes. If the neutralizing power of the
solution is not sufficient, the polysorbate 80 or lecithin content may be increased, or other
neutralizing agents may be added, such as sodium lauryl sulfate and sodium thioglycolate.
Table 4: Composition of a neutralizing solution
Composition Quantity
Polysorbate 80 30 g
Egg yolk lecithin 3 g
Histidine hydrochloride 1 g
Meat or casein peptone 1 g
Sodium chloride 4,3 g
Monopotassium phosphate 3,6 g
Disodium phosphate dihydrate 7,3 g
Purified water 1000 ml
In efficacy of antimicrobial preservation, preservatives are added to pharmaceutical
preparations when these preparations don’t have appropriate antimicrobial activity. They have
the goal to avoid microbial proliferation under normal conservation conditions because
microbial contamination could present a risk of infection for the patient and deterioration of the
preparation, particularly in multi-dose containers. The effectiveness of a preservative depends
on the active compound of the preparation, the composition of the preparation in which it is
incorporated or the container and the mode of closure adopted. In the period of validity, the
antimicrobial activity is evaluated to ensure that during that period there is no change in the
antimicrobial activity. During the development stage of a pharmaceutical preparation, the
antimicrobial activity of the preparation itself is checked or, if necessary, demonstrated that,
when added with 1 or more suitable preservatives, it provides adequate protection against the
27
harmful effects which may result from microbial contamination or proliferation during the shelf-
life and use of the preparation.
The efficacy test of antimicrobial preservatives consists of the artificial contamination of the
preparation, if possible in the final recipient, by the inoculation of appropriate microorganisms,
keeping the seeded preparation at a suitable temperature, collecting samples from the
recipient at certain time intervals and carrying out a count of the microorganisms. Preservative
properties are considered appropriate when, under the test conditions and after prescribed
intervals of time and temperatures, there is a significant decrease or absence of an increase
in the number of microorganisms in the inoculated preparation. As regards the reduction in the
number of microorganisms as a function of time, the acceptance criteria vary for the various
categories of preparations according to the desired degree of protection. The tests are carried
out with 1 strain at a time. The specified microorganisms are supplemented with strains or
species which constitute potential contaminants of the preparation.
In microbiological quality of non-sterile pharmaceutical preparations and substances for
pharmaceutical use, the manufacture, packaging, storage and distribution of pharmaceutical
preparations shall be conducted in such a way as to ensure a satisfactory microbiological
quality. Gels as they are local application belong to category 2. The acceptance criteria for
category 2 are: a maximum of 102 viable aerobic germs (bacteria, fungi and yeasts) per gram
or milliliter; a maximum of 10 Enterobacteria or other Gram-negative bacteria per gram or
milliliter; absence of Pseudomonas aeruginosa in 1,0 g or 1 ml; and absence of
Staphylococcus aureus in 1,0 g or 1 ml. (22)
1.4. Stability
Stability is referred as the absence of separation of the dispersion over a period of time. It
is necessary to distinguish between colloidal stability from physical/mechanical instability. In
colloidal stability, particles do not aggregate over the time and in physical/mechanical
instability, the particles or droplets tend to sediment or cream under gravity over a period of
storage. In this case, the particles or droplets may show no aggregation and the gravity force
exceeds the Brownian motion. (23)
There are several theories which explain the stability of formulations. Firstly, it is necessary
to define Stern layer. In the Stern layer, ions with opposite charge stay together around the
charged surface. However, since the charge on the surface is not completely balanced, a
second region, called the diffuse layer, balances the surface charge. (24)
In the 1940’s, some scientists developed a theory about the stability of a colloidal system.
This theory was called DLVO based on the attractive and repulsive forces present in a
dispersion. (11,25,26) The total force between colloidal particles is obtained by adding together
28
the Van der Waals and electrical double layer forces. (25) The DLVO theory supposes that the
dispersion as a diluted sample and that only two forces affect the dispersed particles: attractive
and repulsive electrostatic forces. The electric charge and other properties are uniformly
distributed over the solid surface and electrostatic forces, Brownian motion and entropy
considerations determine the distribution of charged domains. Therefore, the DLVO theory
explains the interaction between two particles as they approach each other.
Moreover, colloidal stability is then influenced by the energy of the attractive interaction due
to Van der Waals forces and the energy of the repulsive electrostatic interaction. The particle
energy can be expressed in according to Equation 1:
𝑉𝑇 = 𝑉𝐴 + 𝑉𝑅 (1)
where 𝑉𝐴 represents the attractive forces, 𝑉𝑅 the repulsive electrostatic interaction and 𝑉𝑇 the
particle energy. (11,26)
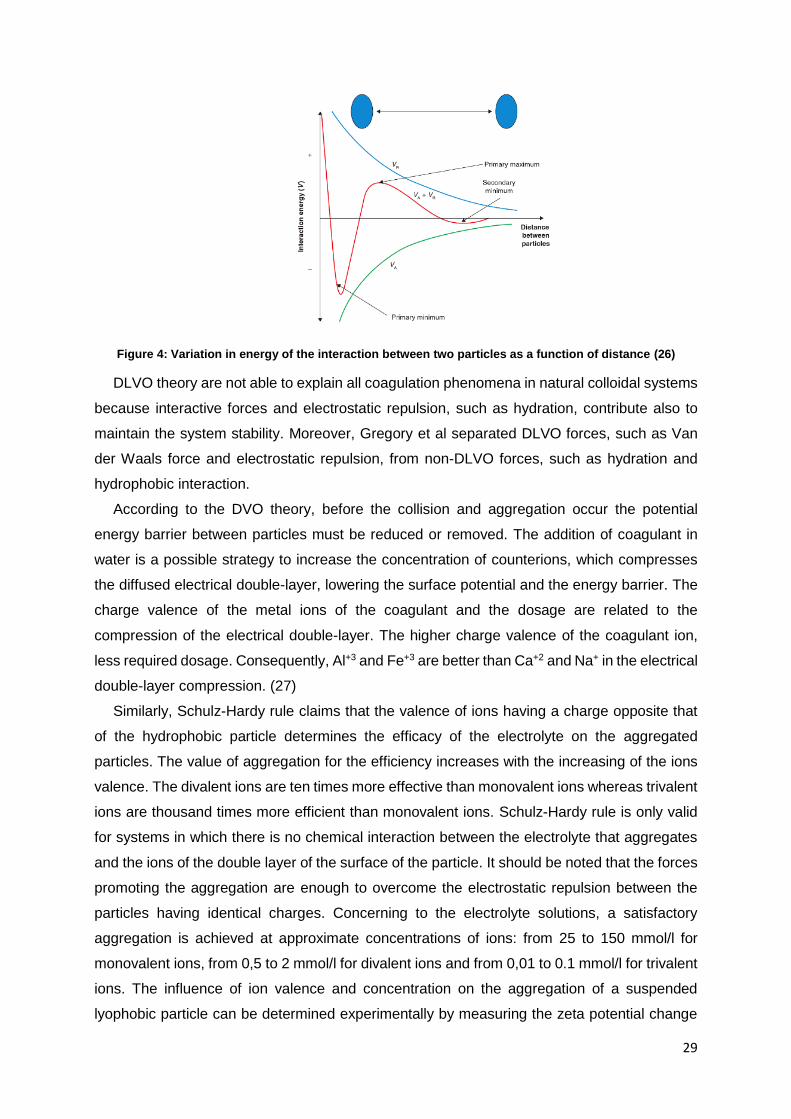
For spherical particles, the Van der Walls attractive energy is inversely related to the
distance between the particles, while the electrostatic repulsive energy declines exponentially
with distance. Usually, when the particles are at long distances from each other, a permanent
phenomenon of coalescence/aggregation of the droplets/particles does not occur because the
particles experience a minimal attraction. When the particles undergo an attraction at defined
distances from 10 to 20 nm, form aggregates (secondary minimum in Figure 4) known as flocs,
occurring then flocculation, reversible phenomenon.
The particles begin to experience some repulsion as they approach each other (primary
maximum in Figure 4). The intensity of the force in the maximum primary determines whether
the system will stay flocculated as it is. If the interaction energy at the primary maximum is
high, the colloidal particles are stable and show no tendency to flocculate. If the energy of the
interaction at the primary maximum is low, the particles can be forced together. This barrier
may be overcome if the kinetic energy of the dispersion resulting from the normal thermal
motion is sufficient for such. The particles will coalesce/aggregate permanently if the
interaction energy reaches the primary minimum due to the separation of the particles sufficient
for such (Figure 4). (24,26)
Summering, the balance of attractive and repulsive forces between the dispersed particles
will determine whether flocculation/aggregation will occur. Repulsive interactions (which may
be of electrostatic origin) between dispersed particles, which can be electrostatic origin, should
be introduced in order to form a stable colloid. (26)
29
Figure 4: Variation in energy of the interaction between two particles as a function of distance (26)
DLVO theory are not able to explain all coagulation phenomena in natural colloidal systems
because interactive forces and electrostatic repulsion, such as hydration, contribute also to
maintain the system stability. Moreover, Gregory et al separated DLVO forces, such as Van
der Waals force and electrostatic repulsion, from non-DLVO forces, such as hydration and
hydrophobic interaction.
According to the DVO theory, before the collision and aggregation occur the potential
energy barrier between particles must be reduced or removed. The addition of coagulant in
water is a possible strategy to increase the concentration of counterions, which compresses
the diffused electrical double-layer, lowering the surface potential and the energy barrier. The
charge valence of the metal ions of the coagulant and the dosage are related to the
compression of the electrical double-layer. The higher charge valence of the coagulant ion,
less required dosage. Consequently, Al+3 and Fe+3 are better than Ca+2 and Na+ in the electrical
double-layer compression. (27)
Similarly, Schulz-Hardy rule claims that the valence of ions having a charge opposite that
of the hydrophobic particle determines the efficacy of the electrolyte on the aggregated
particles. The value of aggregation for the efficiency increases with the increasing of the ions
valence. The divalent ions are ten times more effective than monovalent ions whereas trivalent
ions are thousand times more efficient than monovalent ions. Schulz-Hardy rule is only valid
for systems in which there is no chemical interaction between the electrolyte that aggregates
and the ions of the double layer of the surface of the particle. It should be noted that the forces
promoting the aggregation are enough to overcome the electrostatic repulsion between the
particles having identical charges. Concerning to the electrolyte solutions, a satisfactory
aggregation is achieved at approximate concentrations of ions: from 25 to 150 mmol/l for
monovalent ions, from 0,5 to 2 mmol/l for divalent ions and from 0,01 to 0.1 mmol/l for trivalent
ions. The influence of ion valence and concentration on the aggregation of a suspended
lyophobic particle can be determined experimentally by measuring the zeta potential change
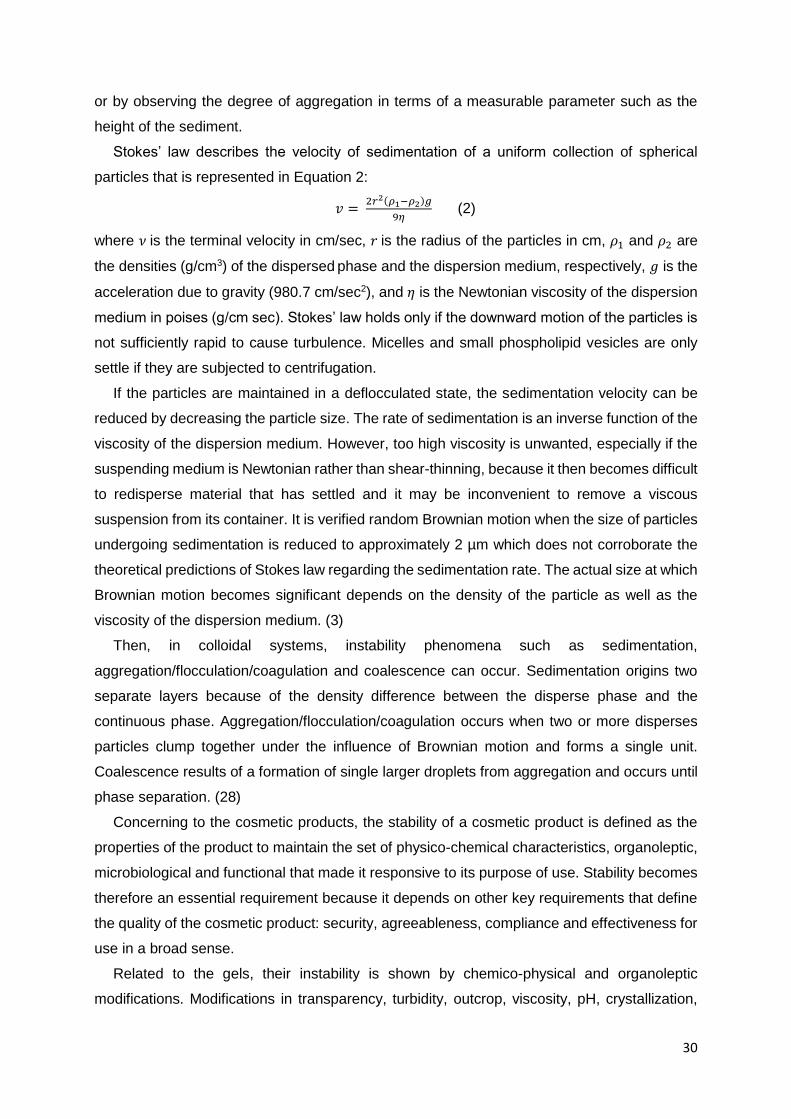
30
or by observing the degree of aggregation in terms of a measurable parameter such as the
height of the sediment.
Stokes’ law describes the velocity of sedimentation of a uniform collection of spherical
particles that is represented in Equation 2:
𝑣 = 2𝑟2(𝜌1−𝜌2)𝑔
9𝜂 (2)
where 𝜈 is the terminal velocity in cm/sec, 𝑟 is the radius of the particles in cm, 𝜌1 and 𝜌2 are
the densities (g/cm3) of the dispersed phase and the dispersion medium, respectively, 𝑔 is the
acceleration due to gravity (980.7 cm/sec2), and 𝜂 is the Newtonian viscosity of the dispersion
medium in poises (g/cm sec). Stokes’ law holds only if the downward motion of the particles is
not sufficiently rapid to cause turbulence. Micelles and small phospholipid vesicles are only
settle if they are subjected to centrifugation.
If the particles are maintained in a deflocculated state, the sedimentation velocity can be
reduced by decreasing the particle size. The rate of sedimentation is an inverse function of the
viscosity of the dispersion medium. However, too high viscosity is unwanted, especially if the
suspending medium is Newtonian rather than shear-thinning, because it then becomes difficult
to redisperse material that has settled and it may be inconvenient to remove a viscous
suspension from its container. It is verified random Brownian motion when the size of particles
undergoing sedimentation is reduced to approximately 2 µm which does not corroborate the
theoretical predictions of Stokes law regarding the sedimentation rate. The actual size at which
Brownian motion becomes significant depends on the density of the particle as well as the
viscosity of the dispersion medium. (3)
Then, in colloidal systems, instability phenomena such as sedimentation,
aggregation/flocculation/coagulation and coalescence can occur. Sedimentation origins two
separate layers because of the density difference between the disperse phase and the
continuous phase. Aggregation/flocculation/coagulation occurs when two or more disperses
particles clump together under the influence of Brownian motion and forms a single unit.
Coalescence results of a formation of single larger droplets from aggregation and occurs until
phase separation. (28)
Concerning to the cosmetic products, the stability of a cosmetic product is defined as the
properties of the product to maintain the set of physico-chemical characteristics, organoleptic,
microbiological and functional that made it responsive to its purpose of use. Stability becomes
therefore an essential requirement because it depends on other key requirements that define
the quality of the cosmetic product: security, agreeableness, compliance and effectiveness for
use in a broad sense.
Related to the gels, their instability is shown by chemico-physical and organoleptic
modifications. Modifications in transparency, turbidity, outcrop, viscosity, pH, crystallization,
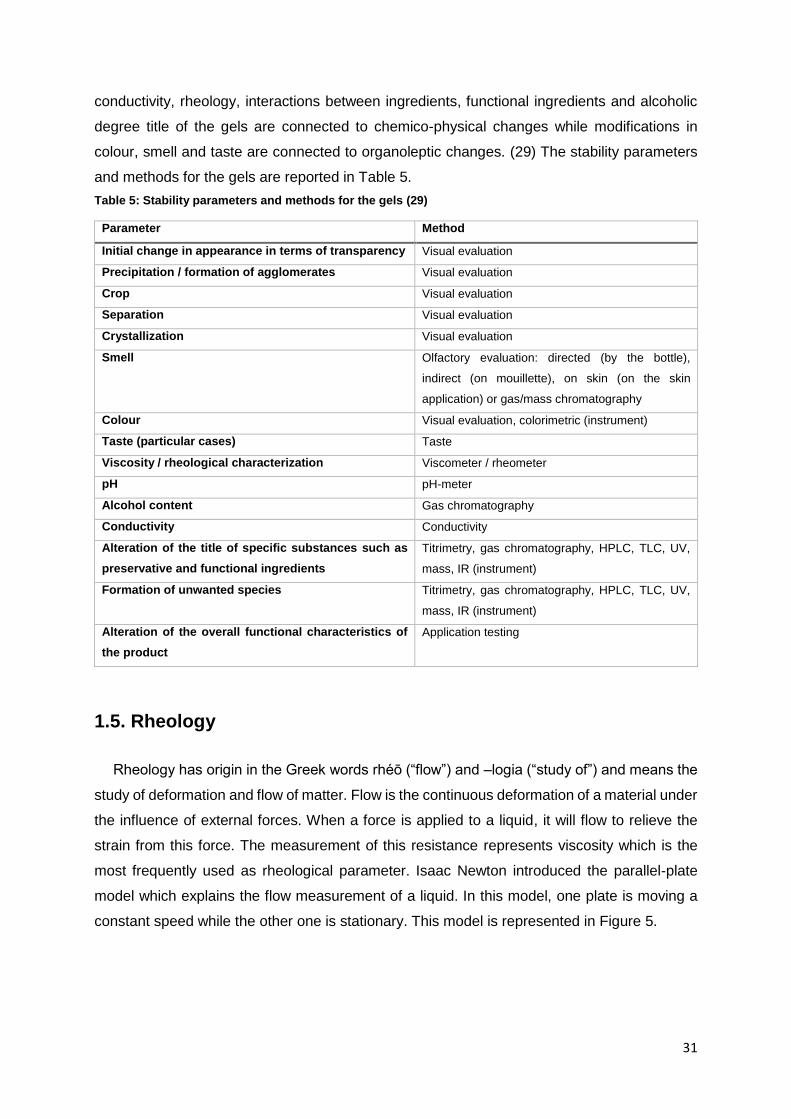
31
conductivity, rheology, interactions between ingredients, functional ingredients and alcoholic
degree title of the gels are connected to chemico-physical changes while modifications in
colour, smell and taste are connected to organoleptic changes. (29) The stability parameters
and methods for the gels are reported in Table 5.
Table 5: Stability parameters and methods for the gels (29)
Parameter Method
Initial change in appearance in terms of transparency Visual evaluation
Precipitation / formation of agglomerates Visual evaluation
Crop Visual evaluation
Separation Visual evaluation
Crystallization Visual evaluation
Smell Olfactory evaluation: directed (by the bottle),
indirect (on mouillette), on skin (on the skin
application) or gas/mass chromatography
Colour Visual evaluation, colorimetric (instrument)
Taste (particular cases) Taste
Viscosity / rheological characterization Viscometer / rheometer
pH pH-meter
Alcohol content Gas chromatography
Conductivity Conductivity
Alteration of the title of specific substances such as
preservative and functional ingredients
Titrimetry, gas chromatography, HPLC, TLC, UV,
mass, IR (instrument)
Formation of unwanted species Titrimetry, gas chromatography, HPLC, TLC, UV,
mass, IR (instrument)
Alteration of the overall functional characteristics of
the product
Application testing
1.5. Rheology
Rheology has origin in the Greek words rhéō (“flow”) and –logia (“study of”) and means the
study of deformation and flow of matter. Flow is the continuous deformation of a material under
the influence of external forces. When a force is applied to a liquid, it will flow to relieve the
strain from this force. The measurement of this resistance represents viscosity which is the
most frequently used as rheological parameter. Isaac Newton introduced the parallel-plate
model which explains the flow measurement of a liquid. In this model, one plate is moving a
constant speed while the other one is stationary. This model is represented in Figure 5.
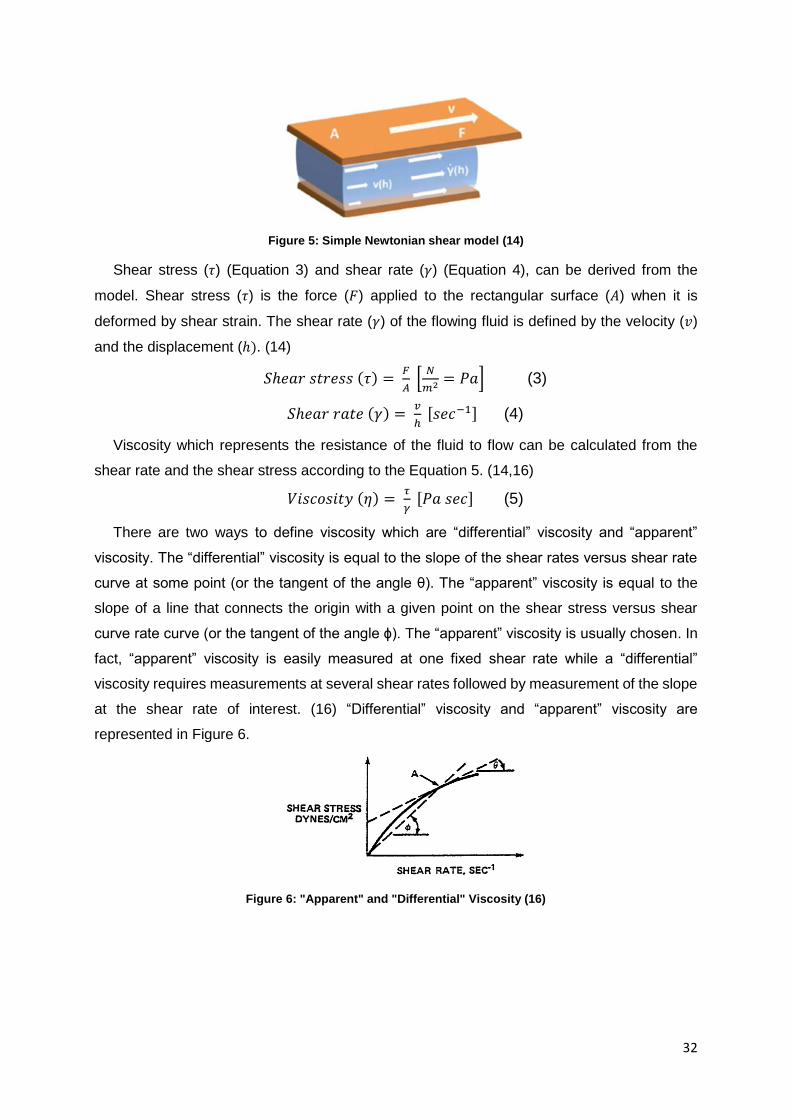
32
Figure 5: Simple Newtonian shear model (14)
Shear stress (𝜏) (Equation 3) and shear rate (𝛾) (Equation 4), can be derived from the
model. Shear stress (𝜏) is the force (𝐹) applied to the rectangular surface (𝐴) when it is
deformed by shear strain. The shear rate (𝛾) of the flowing fluid is defined by the velocity (𝑣)
and the displacement (ℎ). (14)
𝑆ℎ𝑒𝑎𝑟 𝑠𝑡𝑟𝑒𝑠𝑠 (𝜏) = 𝐹
𝐴 [
𝑁
𝑚2 = 𝑃𝑎] (3)
𝑆ℎ𝑒𝑎𝑟 𝑟𝑎𝑡𝑒 (𝛾) = 𝑣
ℎ [𝑠𝑒𝑐−1] (4)
Viscosity which represents the resistance of the fluid to flow can be calculated from the
shear rate and the shear stress according to the Equation 5. (14,16)
𝑉𝑖𝑠𝑐𝑜𝑠𝑖𝑡𝑦 (𝜂) = 𝜏
𝛾 [𝑃𝑎 𝑠𝑒𝑐] (5)
There are two ways to define viscosity which are “differential” viscosity and “apparent”
viscosity. The “differential” viscosity is equal to the slope of the shear rates versus shear rate
curve at some point (or the tangent of the angle θ). The “apparent” viscosity is equal to the
slope of a line that connects the origin with a given point on the shear stress versus shear
curve rate curve (or the tangent of the angle ɸ). The “apparent” viscosity is usually chosen. In
fact, “apparent” viscosity is easily measured at one fixed shear rate while a “differential”
viscosity requires measurements at several shear rates followed by measurement of the slope
at the shear rate of interest. (16) “Differential” viscosity and “apparent” viscosity are
represented in Figure 6.
Figure 6: "Apparent" and "Differential" Viscosity (16)
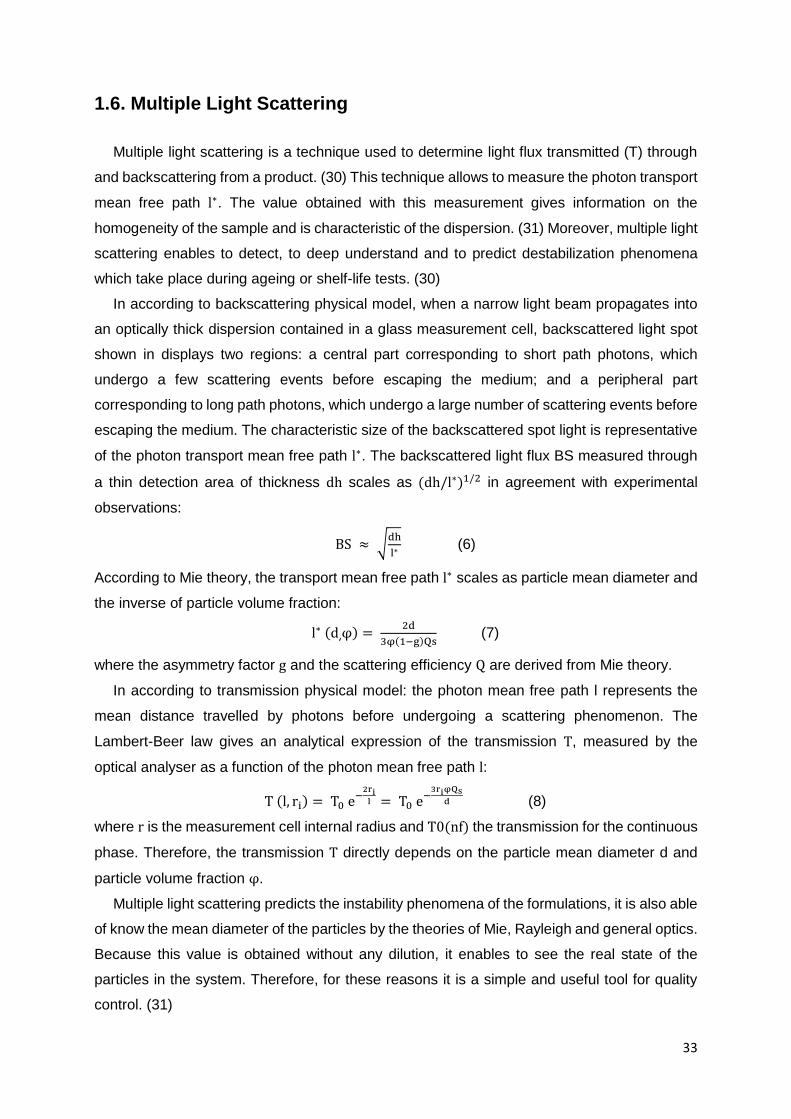
33
1.6. Multiple Light Scattering
Multiple light scattering is a technique used to determine light flux transmitted (T) through
and backscattering from a product. (30) This technique allows to measure the photon transport
mean free path l∗. The value obtained with this measurement gives information on the
homogeneity of the sample and is characteristic of the dispersion. (31) Moreover, multiple light
scattering enables to detect, to deep understand and to predict destabilization phenomena
which take place during ageing or shelf-life tests. (30)
In according to backscattering physical model, when a narrow light beam propagates into
an optically thick dispersion contained in a glass measurement cell, backscattered light spot
shown in displays two regions: a central part corresponding to short path photons, which
undergo a few scattering events before escaping the medium; and a peripheral part
corresponding to long path photons, which undergo a large number of scattering events before
escaping the medium. The characteristic size of the backscattered spot light is representative
of the photon transport mean free path l∗. The backscattered light flux BS measured through
a thin detection area of thickness dh scales as (dh/l∗)1/2 in agreement with experimental
observations:
BS ≈ √dh
l∗ (6)
According to Mie theory, the transport mean free path l∗ scales as particle mean diameter and
the inverse of particle volume fraction:
l∗ (d͵φ) = 2d
3φ(1−g)Qs (7)
where the asymmetry factor g and the scattering efficiency Q are derived from Mie theory.
In according to transmission physical model: the photon mean free path l represents the
mean distance travelled by photons before undergoing a scattering phenomenon. The
Lambert-Beer law gives an analytical expression of the transmission T, measured by the
optical analyser as a function of the photon mean free path l:
T (l, ri) = T0 e−2ri
l = T0 e−3riφQs
d (8)
where r is the measurement cell internal radius and T0(nf) the transmission for the continuous
phase. Therefore, the transmission Τ directly depends on the particle mean diameter d and
particle volume fraction φ.
Multiple light scattering predicts the instability phenomena of the formulations, it is also able
of know the mean diameter of the particles by the theories of Mie, Rayleigh and general optics.
Because this value is obtained without any dilution, it enables to see the real state of the
particles in the system. Therefore, for these reasons it is a simple and useful tool for quality
control. (31)
34
2. Aim of the Work
The present work has the goal to determine the influence of different types of preservative
systems in the stability of gel formulations prepared from natural rheological modifiers. In
particular, different types of preservatives are considered: traditional and not traditional
preservatives. In according to Regulation 1223/2009 it is possible to use preservatives listed
in Annex V of the Regulation. However, the legislation and scientific research is always in
evolution and some preservatives normally used, today they can be used only in determined
condition (limited concentrations). For this reason, cosmetic company today prefer to use
innovative molecules, or better natural molecules.
Rheological modifiers and preservatives represent two classes of ingredients that can be
influenced from several parameters as pH.
In order to find this influence, gels were prepared and pH and viscosity were measured.
After these measurements, samples were analysed by multiple light scattering technique. This
technique can determine the stability of the formulations.
To sum up, the aim of to work is predict by multiple light scattering if the formulations are
stable in time. If they are not stable, the purpose is to determine the instability phenomena and
when it occurs.
35
3. Materials
3.1. Rheological Modifiers
3.1.1. Cellulose Gum (CMC)
Cellulose gum (CEKOL® Cellulose Gum, batch RV49683) was supplied by CPKelco. CMC
is water-soluble polymer derived from cellulose by introducing carboxymethyl groups on the
cellulose backbone. The formed anionic cellulose molecule hydrates and dissolves readily in
water. CMC can impart viscosity to aqueous solutions. CMC is pseudo-plastic by nature and
can show thixotropic and essentially non-thixotropic rheology. Besides controlling the rheology,
CMC is known for its excellent water retaining capacity. (32)
CMC is soluble in hot and cold water. It is insoluble in organic solvents but it is miscible in
ethanol and acetone. CMC viscosity does not increase with temperature. Viscosity ranges of
the most CMC solutions at 1-2% are from 50–8000 mPa.s. Complete hydration is achieved
faster by finer mesh grades but care in dispersion is required. Thixotropic behavior is seen with
medium and high grades of CMC (DS of 0,4–0,7) but grades with “smooth-flow” characteristics
are commercially available. (33)
CMC is incompatible with proteins and sodium caseinate. (34,35)
3.1.2. Sodium Carboxymethyl Betaglucan (Beta-glucan) (Beta)
Sodium Carboxymethyl Betaglucan (CM-Glucan granulate SD=0,85, batch 0713-039) was
obtained by Mibelle Biochemistry. Beta-glucan is a derivate of ß-(1,3) and ß-(1,6) glucan, a
natural yeast polysaccharide featuring immune-stimulating properties and other properties.
Beta-glucan is insoluble in water and therefore not suitable for topical use. Consequently, CM-
Glucan Granulate is a biologically active beta-glucan derivative that maintains the same
biological activity as beta-glucan, is highly purified and also water-soluble. (36)
It has been demonstrated and confirmed a potential thermodynamic incompatibility between
casein and beta-glucan. Other incompatibilities have been demonstrated with milk proteins
and thermodynamics between polysaccharides and proteins. (37,38)
3.1.3. Carrageenan (Car)
Carrageenan (GENUVISCO® carrageenan CG-131, batch SK01396) was purchased from
CPKelco. Carrageenan is a cell wall hydrocolloid found in certain species of seaweeds
belonging to red algae (Rhodophyceae). Carrageenan is extracted with water under neutral or
alkaline conditions at elevated temperature. There are three types of carrageenan: kappa, iota
36
and lambda. Kappa carrageenan forms firm gels in the presence of potassium ions while iota
carrageenan forms elastic gels and thixotropic fluids in the presence of calcium ions. Finally,
lambda carrageenan forms viscous, non-gelling solutions. Carrageenan is used as thickening,
stabilizing, gelling and texturizing agent. (39)
Functional properties can be manipulated by cations addition: potassium and calcium
increase the gel strength of kappa and iota carrageenan. However, the addition of sodium to
carrageenan solution is not observed. Lower and higher pH values (under pH 4 and over pH
10), carrageenan gel loses its structure. Carrageenans generally require heat to become
solubilized. Kappa and iota carrageenan, depending upon salt addition, solubilize at about
75°C. Gel takes place between 65°–45°C, dependently salt addition. Generally, the greater
the addition of potassium or calcium, the higher the gel-set temperature. Kappa and iota
carrageenan gels are thermo-reversible. Thermo-reversibility usually occurs at 10–15°C above
gel-set temperature. The carrageenans associated with sodium salts are soluble in cold as
well as hot water; but they are generally insoluble in alcohol and oils, (good solvents for
carrageenan dispersions). It is observed that a high concentration of sugar prevents solubility
below gel temperature. Instead, high amounts of alcohol might precipitate carrageenans out
of solution. (40)
Carrageenan is incompatible with acid gelatin, amylose, amylopectine, casein and proteins.
(41–45)
3.1.4. Acacia Senegal Gum & Xanthan Gum (SolagumTM AX) (SAX)
Acacia Senegal Gum & Xanthan Gum (SolagumTM AX, batch T91250) was supplied by
SEPPIC. SolagumTM AX is a mixture of acacia senegal gum and xanthan gum; it is a natural
thickening-stabilizing-texturizing polymer in the form of a non-dusty powder. SolagumTM AX
has some properties: it dissolves quickly in hot or cold water and in wide pH range (between
3–12); it forms clear aqueous gels, it is resistant to electrolytes; it has good resuspension
properties; it is a film forming agent. Finally, it is compatible with solvents, surfactants, AHAs,
H2O2, sun filters and sunscreens, pigments. It is multifunctional gum: thickening, stabilizing
and texturizing agent. (46)
3.1.5. Caesalpina Spinosa Gum (SolagumTM Tara) (ST)
Caesalpinia Spinosa Gum (SolagumTM Tara, batch 38553F, T23440) was obtained from
SEPPIC. SolagumTM powder is a 100% natural gum. This non-ionic polysaccharide hydrates
instantly in hot or cold water. SolagumTM Tara is ideal for medium or thick consistency
formulations due to its high resistance to electrolytes. It acts as a texturizing agent by providing
a structuring effect and a very soft feel. SolagumTM Tara has some properties: it dissolves
37
quickly in hot or cold water, cold or hot process, at wide pH range (between 3–12), it forms
clear aqueous gels; it has an excellent resistance to electrolytes; it allows to obtain textures
with medium or thick consistency; it has synergistic behaviour with Polyacrylate Crosspolymer-
6 and Hydroxyethyl Acrylate/Sodium Acryloyldimethyl Taurate Copolymer. Finally, it is
compatible with many solvents, anionic and cationic ingredients, surfactants, AHAs, sun filters
and sunscreens, pigments. (47)
3.1.6. Microcrystalline Cellulose & Cellulose Gum & Xanthan Gum (Sucrathix VX)
(SVX)
Microcrystalline Cellulose & Cellulose Gum & Xanthan Gum (Sucrathix VX, batch
39505140718) was purchased from ALFACOS. Sucrathix VX forms creamy, soft gels that
enhance the skin feel of a finished product and increases stability of a formulation. This
component has some properties: it is stable to electrolytes, non-sticky and it is stable between
pH 4,5-10 and with electrolytes up to 2%. (48)
3.1.7. Xanthan Gum (XG)
Xanthan gum (XANTURAL® Xanthan Gum, batch FO48624) was obtained from CPKelco.
Xanthan gum is characterized by very high viscosity at low concentrations. Because of its
pseudo-plastic nature, it imparts excellent stability to oil-in-water emulsions by preventing the
coalescence of oil droplets. (49)
Xanthan gum is readily soluble both in hot and cold water. Solubility is achieved in wide
range of pH values and salt concentrations. During xanthan gum addition, it is recommended
that all dry ingredients be blended together and added to the liquid using high-speed agitation.
The powder mixture should be added to homonogenaizer without entrapping air bubbles.
Dispersibility can be improved by hydrating gum with a non-solvent such as alcohols or some
oils. Hydration will also be slowed when introduced to a brine solution. Xanthan gum is stable
in applications with a wide range of pH values (2–12). It has a tolerance to enzymes, salt, and
heat. For instance, xanthan gum in a 1.1% citric acid/citrate solution at a pH 3,4 at 90°C for 24
hours showed excellent thermal stability. Xanthan gum also exhibits excellent freeze-thaw
stability. Viscosity values are generally not affected by changes in pH, addition of salt and
thermal changes for extended periods of time; whereas, other hydrocolloids break down under
the same conditions. Xanthan gum also exhibits excellent synergy with galactomannans such
as guar gum and locust bean Gum. Xanthan gum is a heteropolysaccarids of a high molecular
weight (Mw-2.5, 106). D-glucose, D-mannose and D-glucuronic acid are monomeric units
obtained by hydrolysis. The main chain of xanthan gum contains b-D-glucose units linked
through the 1- and 4 positions. The side chain is a tri-saccharide occurring in every alternate
38
glucose residue. It consists of a D-mannose, b-D-glucuronic acid and a terminal b-D-mannose
unit. (50)
3.2. Preservatives
3.2.1. Phenoxyethanol & Caprylyl Glycol (Verstatil® PC) (PC)
Phenoxyethanol & Caprylyl Glycol (Verstatil® PC, batch 480236) was supplied by Dr
Straetmans. This preservative is used in a concentration between 0,8 and 1% and it is pH
independent. Moreover, Verstatil® PC is water miscible, chemically stable with low impact on
the stability of the product, pH independent, as said before, and broad antimicrobial
performance. (51)
3.2.2. Triethyl Citrate & Glyceryl Caprylate & Benzoic Acid (Verstatil® TBG) (TBG)
Triethyl Citrate & Glyceryl Caprylate & Benzoic Acid (Verstatil® TBG, batch 475891) was
obtained from Dr Straetmans. This product is derived from palm oil derivates. The effective pH
and concentration are 4–6 and 1,0–1,5%, respectively. (52)
3.2.3. p-Anisic Acid (dermosoft® 688 eco) (688)
p-Anisic Acid (dermosoft® 688 eco, batch 110MAK0021) was purchased from Dr
Straetmans. It is a naturally derived organic acid with fungicidal activity. The effective pH and
concentration are 4–6 and 0,05–0,5%, respectively. (53)
3.3. Surfactants
3.3.1. Decyl Glucoside (DG)
Decyl glucoside (ORAMIX™ NS 10, batch 38957V T34859) was supplied by SEPPIC. It is
a non-ionic surfactant derived from sugar, with good performance, innocuity and naturality.
Decyl glucoside has some properties, like high foaming performances and cleansing agent
and no skin aggressive. (54)
3.3.2. Polysorbate 60 (PS)
Polysorbate 60 (or Tween 60-LQ-(MV), batch 0000766724) was obtained by CRODA.
Tween 60 is an ethoxylated (20) sorbitan ester based on a natural fatty acid (stearic acid). This
ethoxylate is highly effective at forming O/W emulsions, particularly when used in combination
with its non-ethoxylated derivative, Span 60. Its HBL is 14,9. (55)
39
4. Methods
4.1. Formulation of Gels
A series of basic gels was prepared from different rheological modifiers, glycerine and
water.
Three different concentration of the rheological modifiers were considered: 0,5, 1 and 2%,
C, A and B, respectively. The powder was transferred in a becker and, successfully, glicerin
and water were added and mixed by magnetic stirring until complete dissolution of the
rheological modifiers. If necessary, the gel was heated in order to enhance powder dissolution.
At the end, preservative was added.
A series of gels was set up by adding surfactant in order to evaluate the possible
interference onto preservative systems and gel. In this case, the gels were prepared according
to same procedure of the previous set up viscous solutions, with the only exception that
surfactant was added before of preservative system.
All formulations were stored at room temperature before to characterization.
4.2. Measure of pH
For the measure of pH, JENWAY 3510 pH Meter was used. Firstly, the instrument was
calibrated by two different buffer solutions, pH 7 and pH 4. At the end of the calibration, the
instrument was ready to measure pH formulations. The pH was controlled at zero time (t0) and
1 month. At t0, as Verstatil® TBG and dermosoft® 688 eco are pH-dependent, it was necessary
to correct the pH to a value for which the preservative has activity. To increase the pH,
hydroxide sodium was used and to decreased pH, lactic acid was used.
4.3. Rheology Measurements
Rotational viscometer, model BROOKFILED VISCOMETER RVT, was used in order to
evaluate the viscosity profile of the preliminary set up viscous solutions.
The Viscometer can measure over a number of ranges since, for a given spring deflection,
the actual viscosity is proportional to the spindle speed and is related to the spindle's size and
shape. For a material of given viscosity, the resistance will be greater as the spindle size and/or
rotational speed increase. The minimum viscosity range is obtained by using the largest
spindle at the highest speed; the maximum range by using the smallest spindle at the slowest
speed. (56)
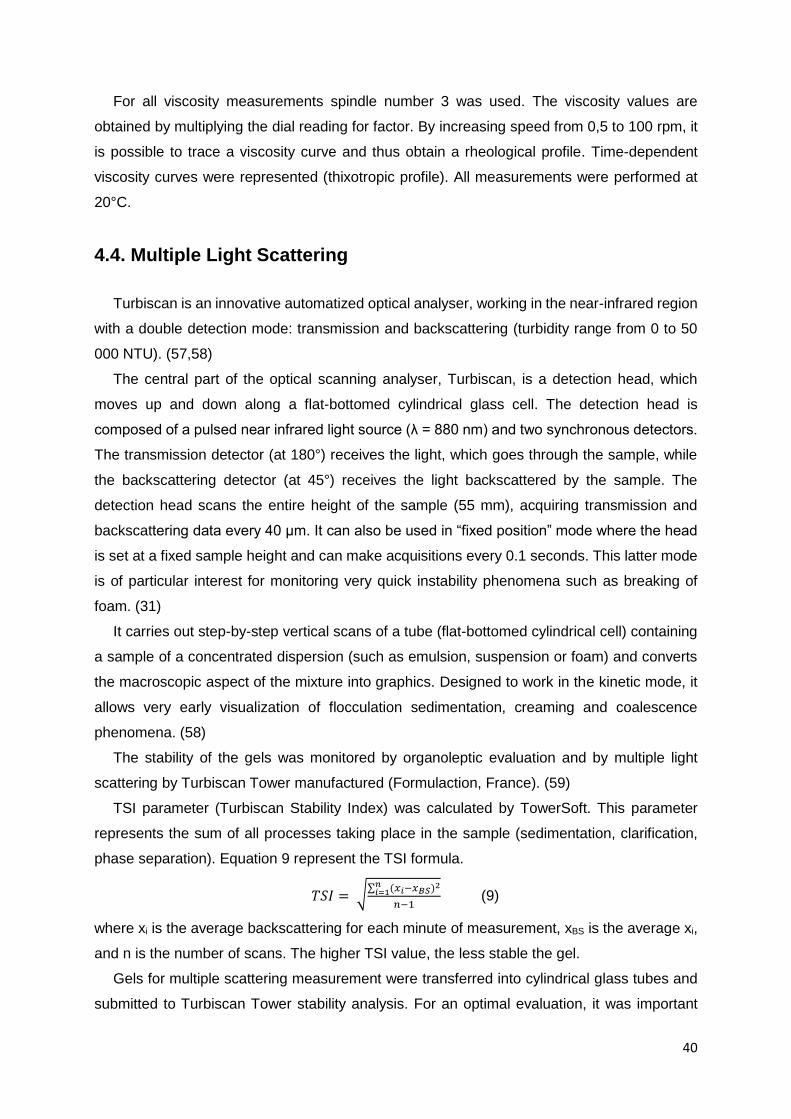
40
For all viscosity measurements spindle number 3 was used. The viscosity values are
obtained by multiplying the dial reading for factor. By increasing speed from 0,5 to 100 rpm, it
is possible to trace a viscosity curve and thus obtain a rheological profile. Time-dependent
viscosity curves were represented (thixotropic profile). All measurements were performed at
20°C.
4.4. Multiple Light Scattering
Turbiscan is an innovative automatized optical analyser, working in the near-infrared region
with a double detection mode: transmission and backscattering (turbidity range from 0 to 50
000 NTU). (57,58)
The central part of the optical scanning analyser, Turbiscan, is a detection head, which
moves up and down along a flat-bottomed cylindrical glass cell. The detection head is
composed of a pulsed near infrared light source (λ = 880 nm) and two synchronous detectors.
The transmission detector (at 180°) receives the light, which goes through the sample, while
the backscattering detector (at 45°) receives the light backscattered by the sample. The
detection head scans the entire height of the sample (55 mm), acquiring transmission and
backscattering data every 40 µm. It can also be used in “fixed position” mode where the head
is set at a fixed sample height and can make acquisitions every 0.1 seconds. This latter mode
is of particular interest for monitoring very quick instability phenomena such as breaking of
foam. (31)
It carries out step-by-step vertical scans of a tube (flat-bottomed cylindrical cell) containing
a sample of a concentrated dispersion (such as emulsion, suspension or foam) and converts
the macroscopic aspect of the mixture into graphics. Designed to work in the kinetic mode, it
allows very early visualization of flocculation sedimentation, creaming and coalescence
phenomena. (58)
The stability of the gels was monitored by organoleptic evaluation and by multiple light
scattering by Turbiscan Tower manufactured (Formulaction, France). (59)
TSI parameter (Turbiscan Stability Index) was calculated by TowerSoft. This parameter
represents the sum of all processes taking place in the sample (sedimentation, clarification,
phase separation). Equation 9 represent the TSI formula.
𝑇𝑆𝐼 = √∑ (𝑥𝑖−𝑥𝐵𝑆)2𝑛
𝑖=1
𝑛−1 (9)
where xi is the average backscattering for each minute of measurement, xBS is the average xi,
and n is the number of scans. The higher TSI value, the less stable the gel.
Gels for multiple scattering measurement were transferred into cylindrical glass tubes and
submitted to Turbiscan Tower stability analysis. For an optimal evaluation, it was important
41
that there were not air bubbles inside the sample and the sample was homogenously
distributed. For each sample was performed one cycle at 20°C for 6 hours, one cycle at 4°C
for 6 hours and finally a third cycle at 20°C for 6 hours.
For clear samples transmission values were measured; for opalescent samples
backscattering profile was evaluated.
4.5. Microbiological Tests
Microbiological assay aims to evaluate if there is no microbial growth inside the sample and
consequently if the preservative system has not been inactivated.
Instruments as glass, balance, mixer (vortex), spatulas and pipettings. were previously
sterilized by ethanol 70%. Medium, agar and broth solution for microbiological assay were
sterilized by autoclave at 121°C for 15-20 minutes.
The sample for microbiological evaluation was set up as follows. Eugon LT100 broth (9 ml)
was added to 1 ml of sample (9:1 broth:sample) in order to neutralize the preservative system.
The mixture was stirred for few seconds by vortex; 15 minutes were expected before to add
broth solution into Petri dishes.
Finally, Agar medium, maintained at 55°C, and 1 ml of the previous mixture were
contemporary transferred into Petri dishes. Tryptic Soy Agar for bacterial and Sabouraud
Chloramphenicol Agar for fungi were used. Samples for bacteria evaluation were maintained
48 hours at 37°C; samples for fungi evaluation at 20°C for 3-5 days.
4.6. Factorial Analysis
The factorial analysis is multivariate exploratory statistic technique of the data. The purpose
of this method is to discover and analyse the structure of a set of interrelated variables in order
to construct a measurement scale for factors which somehow control the original variables.
Thus, the common factor and the structural relationships that link factors to variables are
estimated from the observed relationship between the original variables. (60) Summering, the
aim of this statistical test is to simply complex sets of data. (61)
The generic formula of the model of factorial analysis is represented in Equation 10:
𝑧𝑖 = 𝜆𝑖1 𝑓1 + 𝜆𝑖2 𝑓2 + ⋯ + 𝜆𝑖𝑚 𝑓𝑚 + 𝑛𝑖 (𝑖 = 1, … , 𝑝) (10)
where 𝑧𝑖 = (𝑥𝑖− 𝜇𝑖)
𝜎𝑖, 𝑓𝑚 represents the common factors (𝑚 < 𝑝), 𝑛𝑝 represents the specific
factors and 𝜆𝑖𝑗 represents the weight of the variable 𝑖 in the factor 𝑗 (factor loadings) that means
each 𝜆𝑖𝑗 measures the contribution of the common factor 𝑗 in the variable 𝑖. In this model, it is
necessary to assume that: the common factors are independents (orthogonal) and equally
42
distributed with mean 0 and variance 1, the specific factors are independents and equally
distributed with mean 0 and variance 𝛹𝑗; and the common factors and the specific factors are
independent. (60)
The factorial analysis gives the matrix of correlation. A correlation is a numerical measure
of the degree of agreement between two sets of scores. It runs from +1 to -1: +1 indicates full
agreement, 0 no relationship and -1 complete disagreement. (61)
The Kaiser-Meyer-Olkin Measurement of Sampling Adequacy (KMO) is a measure of
adequacy of the data obtained by the ratio of the sum of the squares of the correlations of all
variables divided by that same sum added by the sum of the quadrats of the partial correlations
of all the variables. (62) The critical values are in the Table 6.
Table 6: Recommendation relatively to the factorial analysis based on the KMO values (60,62)
KMO value Recommendation relatively to factorial analysis
1 Perfect
] 0,9 – 1 [ Excellent
] 0,8 – 0,9 ] Good
] 0,7 – 0,8 ] Reasonable
] 0,6 – 0,7 ] Mediocre
] 0,5 – 0,6 ] Bad but still acceptable
≤ 0,5 Inacceptable
Factorial analysis was performed by IBM® SPSS® Statistics version 24.
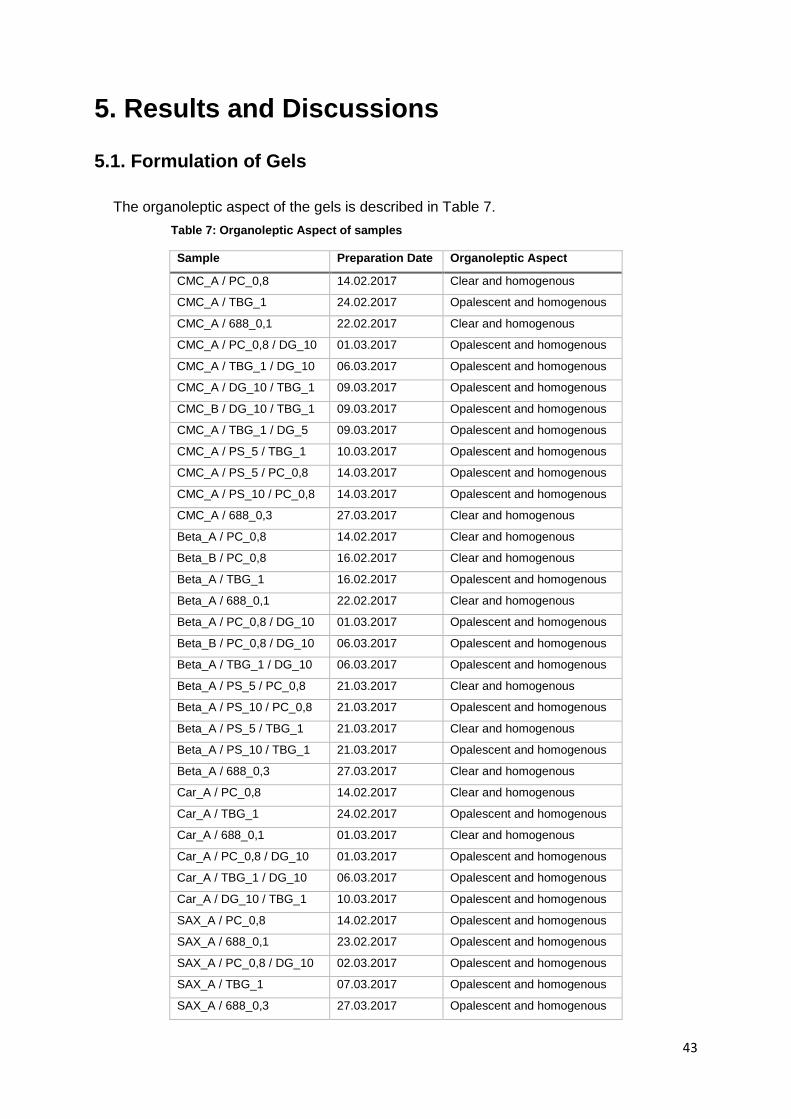
43
5. Results and Discussions
5.1. Formulation of Gels
The organoleptic aspect of the gels is described in Table 7.
Table 7: Organoleptic Aspect of samples
Sample Preparation Date Organoleptic Aspect
CMC_A / PC_0,8 14.02.2017 Clear and homogenous
CMC_A / TBG_1 24.02.2017 Opalescent and homogenous
CMC_A / 688_0,1 22.02.2017 Clear and homogenous
CMC_A / PC_0,8 / DG_10 01.03.2017 Opalescent and homogenous
CMC_A / TBG_1 / DG_10 06.03.2017 Opalescent and homogenous
CMC_A / DG_10 / TBG_1 09.03.2017 Opalescent and homogenous
CMC_B / DG_10 / TBG_1 09.03.2017 Opalescent and homogenous
CMC_A / TBG_1 / DG_5 09.03.2017 Opalescent and homogenous
CMC_A / PS_5 / TBG_1 10.03.2017 Opalescent and homogenous
CMC_A / PS_5 / PC_0,8 14.03.2017 Opalescent and homogenous
CMC_A / PS_10 / PC_0,8 14.03.2017 Opalescent and homogenous
CMC_A / 688_0,3 27.03.2017 Clear and homogenous
Beta_A / PC_0,8 14.02.2017 Clear and homogenous
Beta_B / PC_0,8 16.02.2017 Clear and homogenous
Beta_A / TBG_1 16.02.2017 Opalescent and homogenous
Beta_A / 688_0,1 22.02.2017 Clear and homogenous
Beta_A / PC_0,8 / DG_10 01.03.2017 Opalescent and homogenous
Beta_B / PC_0,8 / DG_10 06.03.2017 Opalescent and homogenous
Beta_A / TBG_1 / DG_10 06.03.2017 Opalescent and homogenous
Beta_A / PS_5 / PC_0,8 21.03.2017 Clear and homogenous
Beta_A / PS_10 / PC_0,8 21.03.2017 Opalescent and homogenous
Beta_A / PS_5 / TBG_1 21.03.2017 Clear and homogenous
Beta_A / PS_10 / TBG_1 21.03.2017 Opalescent and homogenous
Beta_A / 688_0,3 27.03.2017 Clear and homogenous
Car_A / PC_0,8 14.02.2017 Clear and homogenous
Car_A / TBG_1 24.02.2017 Opalescent and homogenous
Car_A / 688_0,1 01.03.2017 Clear and homogenous
Car_A / PC_0,8 / DG_10 01.03.2017 Opalescent and homogenous
Car_A / TBG_1 / DG_10 06.03.2017 Opalescent and homogenous
Car_A / DG_10 / TBG_1 10.03.2017 Opalescent and homogenous
SAX_A / PC_0,8 14.02.2017 Opalescent and homogenous
SAX_A / 688_0,1 23.02.2017 Opalescent and homogenous
SAX_A / PC_0,8 / DG_10 02.03.2017 Opalescent and homogenous
SAX_A / TBG_1 07.03.2017 Opalescent and homogenous
SAX_A / 688_0,3 27.03.2017 Opalescent and homogenous
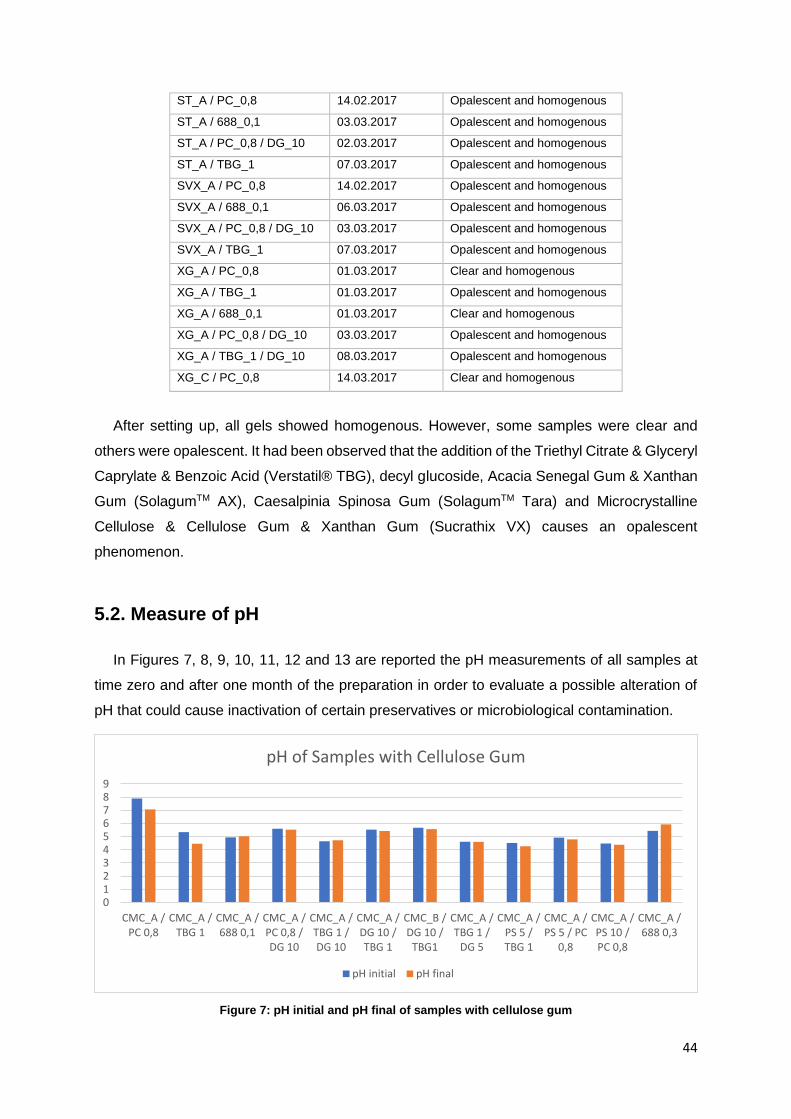
44
ST_A / PC_0,8 14.02.2017 Opalescent and homogenous
ST_A / 688_0,1 03.03.2017 Opalescent and homogenous
ST_A / PC_0,8 / DG_10 02.03.2017 Opalescent and homogenous
ST_A / TBG_1 07.03.2017 Opalescent and homogenous
SVX_A / PC_0,8 14.02.2017 Opalescent and homogenous
SVX_A / 688_0,1 06.03.2017 Opalescent and homogenous
SVX_A / PC_0,8 / DG_10 03.03.2017 Opalescent and homogenous
SVX_A / TBG_1 07.03.2017 Opalescent and homogenous
XG_A / PC_0,8 01.03.2017 Clear and homogenous
XG_A / TBG_1 01.03.2017 Opalescent and homogenous
XG_A / 688_0,1 01.03.2017 Clear and homogenous
XG_A / PC_0,8 / DG_10 03.03.2017 Opalescent and homogenous
XG_A / TBG_1 / DG_10 08.03.2017 Opalescent and homogenous
XG_C / PC_0,8 14.03.2017 Clear and homogenous
After setting up, all gels showed homogenous. However, some samples were clear and
others were opalescent. It had been observed that the addition of the Triethyl Citrate & Glyceryl
Caprylate & Benzoic Acid (Verstatil® TBG), decyl glucoside, Acacia Senegal Gum & Xanthan
Gum (SolagumTM AX), Caesalpinia Spinosa Gum (SolagumTM Tara) and Microcrystalline
Cellulose & Cellulose Gum & Xanthan Gum (Sucrathix VX) causes an opalescent
phenomenon.
5.2. Measure of pH
In Figures 7, 8, 9, 10, 11, 12 and 13 are reported the pH measurements of all samples at
time zero and after one month of the preparation in order to evaluate a possible alteration of
pH that could cause inactivation of certain preservatives or microbiological contamination.
Figure 7: pH initial and pH final of samples with cellulose gum
0123456789
CMC_A /PC 0,8
CMC_A /TBG 1
CMC_A /688 0,1
CMC_A /PC 0,8 /DG 10
CMC_A /TBG 1 /DG 10
CMC_A /DG 10 /TBG 1
CMC_B /DG 10 /
TBG1
CMC_A /TBG 1 /
DG 5
CMC_A /PS 5 /TBG 1
CMC_A /PS 5 / PC
0,8
CMC_A /PS 10 /PC 0,8
CMC_A /688 0,3
pH of Samples with Cellulose Gum
pH initial pH final
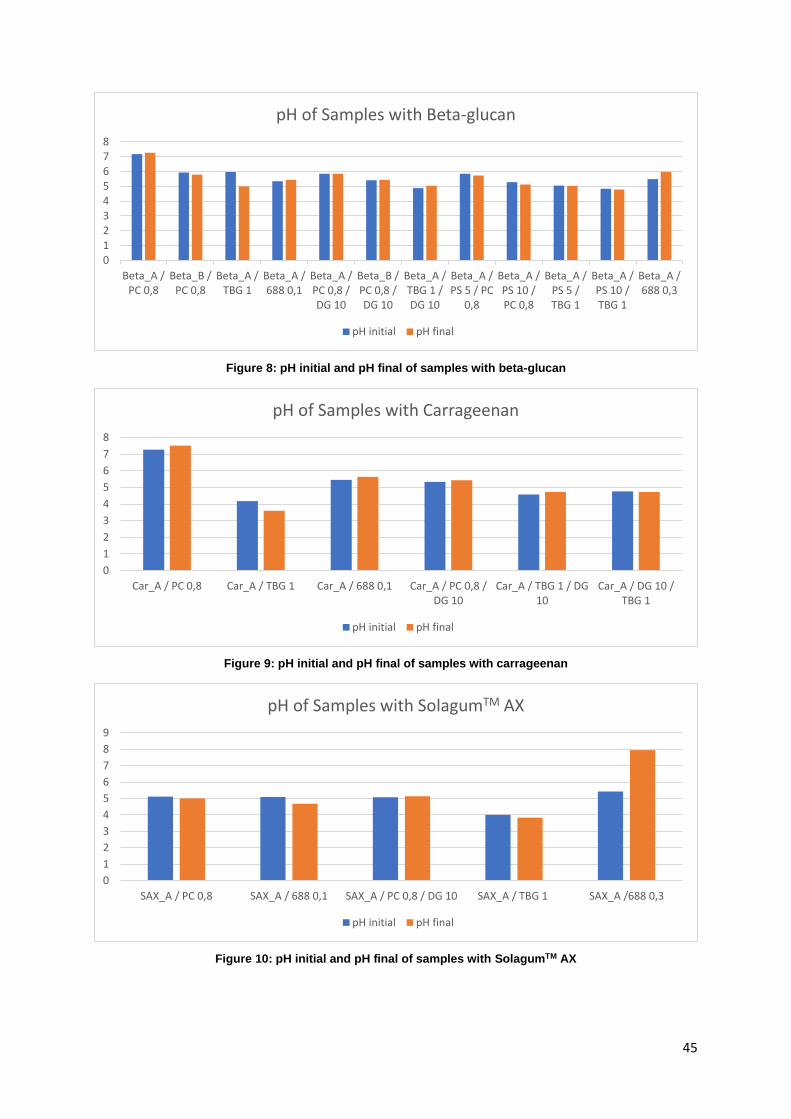
45
Figure 8: pH initial and pH final of samples with beta-glucan
Figure 9: pH initial and pH final of samples with carrageenan
Figure 10: pH initial and pH final of samples with SolagumTM AX
012345678
Beta_A /PC 0,8
Beta_B /PC 0,8
Beta_A /TBG 1
Beta_A /688 0,1
Beta_A /PC 0,8 /DG 10
Beta_B /PC 0,8 /DG 10
Beta_A /TBG 1 /DG 10
Beta_A /PS 5 / PC
0,8
Beta_A /PS 10 /PC 0,8
Beta_A /PS 5 /TBG 1
Beta_A /PS 10 /TBG 1
Beta_A /688 0,3
pH of Samples with Beta-glucan
pH initial pH final
0
1
2
3
4
5
6
7
8
Car_A / PC 0,8 Car_A / TBG 1 Car_A / 688 0,1 Car_A / PC 0,8 /DG 10
Car_A / TBG 1 / DG10
Car_A / DG 10 /TBG 1
pH of Samples with Carrageenan
pH initial pH final
0
1
2
3
4
5
6
7
8
9
SAX_A / PC 0,8 SAX_A / 688 0,1 SAX_A / PC 0,8 / DG 10 SAX_A / TBG 1 SAX_A /688 0,3
pH of Samples with SolagumTM AX
pH initial pH final
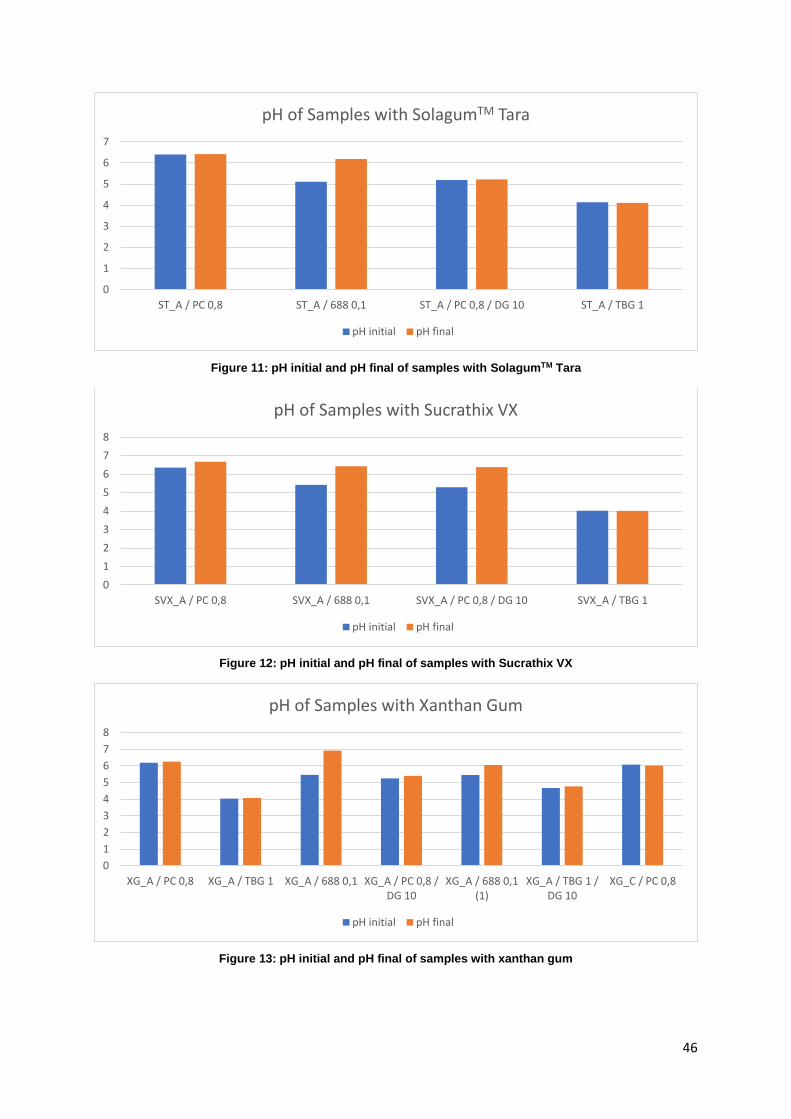
46
Figure 11: pH initial and pH final of samples with SolagumTM Tara
Figure 12: pH initial and pH final of samples with Sucrathix VX
Figure 13: pH initial and pH final of samples with xanthan gum
0
1
2
3
4
5
6
7
ST_A / PC 0,8 ST_A / 688 0,1 ST_A / PC 0,8 / DG 10 ST_A / TBG 1
pH of Samples with SolagumTM Tara
pH initial pH final
0
1
2
3
4
5
6
7
8
SVX_A / PC 0,8 SVX_A / 688 0,1 SVX_A / PC 0,8 / DG 10 SVX_A / TBG 1
pH of Samples with Sucrathix VX
pH initial pH final
0
1
2
3
4
5
6
7
8
XG_A / PC 0,8 XG_A / TBG 1 XG_A / 688 0,1 XG_A / PC 0,8 /DG 10
XG_A / 688 0,1(1)
XG_A / TBG 1 /DG 10
XG_C / PC 0,8
pH of Samples with Xanthan Gum
pH initial pH final
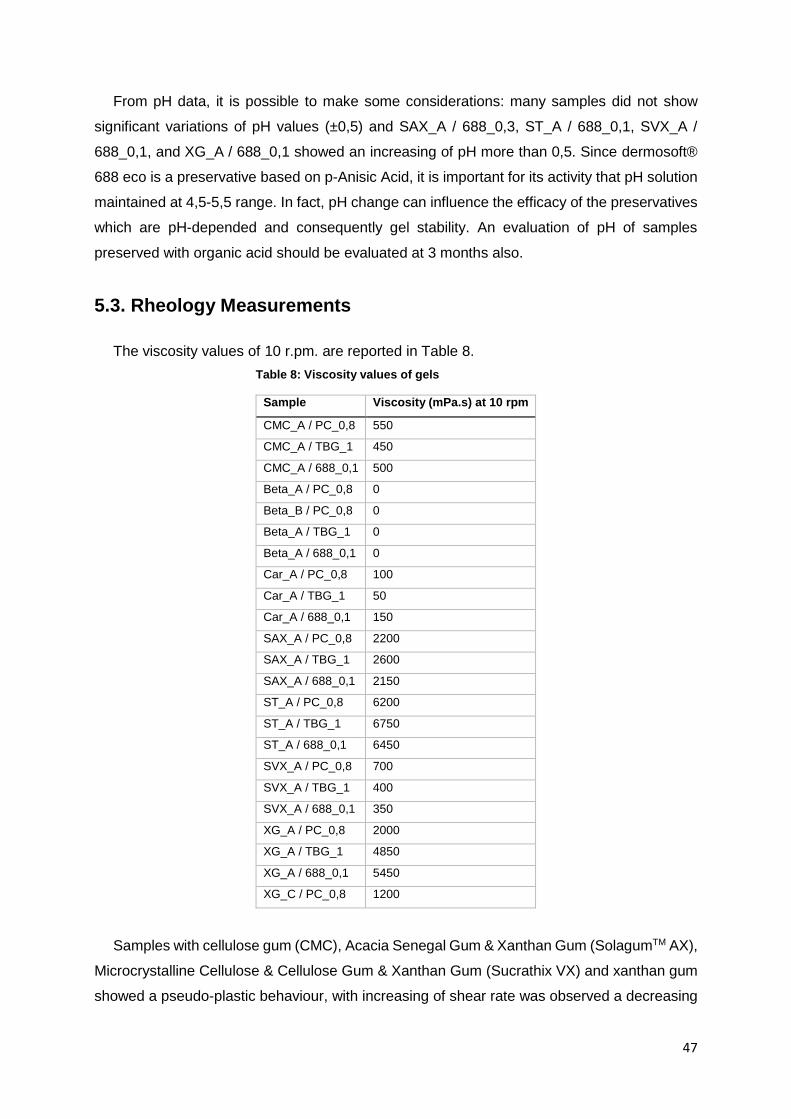
47
From pH data, it is possible to make some considerations: many samples did not show
significant variations of pH values (±0,5) and SAX_A / 688_0,3, ST_A / 688_0,1, SVX_A /
688_0,1, and XG_A / 688_0,1 showed an increasing of pH more than 0,5. Since dermosoft®
688 eco is a preservative based on p-Anisic Acid, it is important for its activity that pH solution
maintained at 4,5-5,5 range. In fact, pH change can influence the efficacy of the preservatives
which are pH-depended and consequently gel stability. An evaluation of pH of samples
preserved with organic acid should be evaluated at 3 months also.
5.3. Rheology Measurements
The viscosity values of 10 r.pm. are reported in Table 8.
Table 8: Viscosity values of gels
Sample Viscosity (mPa.s) at 10 rpm
CMC_A / PC_0,8 550
CMC_A / TBG_1 450
CMC_A / 688_0,1 500
Beta_A / PC_0,8 0
Beta_B / PC_0,8 0
Beta_A / TBG_1 0
Beta_A / 688_0,1 0
Car_A / PC_0,8 100
Car_A / TBG_1 50
Car_A / 688_0,1 150
SAX_A / PC_0,8 2200
SAX_A / TBG_1 2600
SAX_A / 688_0,1 2150
ST_A / PC_0,8 6200
ST_A / TBG_1 6750
ST_A / 688_0,1 6450
SVX_A / PC_0,8 700
SVX_A / TBG_1 400
SVX_A / 688_0,1 350
XG_A / PC_0,8 2000
XG_A / TBG_1 4850
XG_A / 688_0,1 5450
XG_C / PC_0,8 1200
Samples with cellulose gum (CMC), Acacia Senegal Gum & Xanthan Gum (SolagumTM AX),
Microcrystalline Cellulose & Cellulose Gum & Xanthan Gum (Sucrathix VX) and xanthan gum
showed a pseudo-plastic behaviour, with increasing of shear rate was observed a decreasing
48
of viscosity. In samples with Sodium Carboxymethyl Betaglucan (beta-glucan), carrageenan
and Caesalpina Spinosa Gum (SolagumTM Tara), the viscosity increased when the shear rate
increases, showing a dilatant flow.
For samples with Sodium Carboxymethyl Betaglucan (beta-glucan) was measured the
lowest viscosity and for samples with Caesalpina Spinosa Gum (SolagumTM Tara) the higher
viscosity. Moreover, for some samples as Carrageenan, Microcrystalline Cellulose & Cellulose
Gum & Xanthan Gum (Sucrathix VX) and Xanthan Gum, the preservative type seems to
influence on viscosity. In particular, the addition of Phenoxyethanol & Caprylyl Glycol
(Verstatil® PC) to Xanthan Gum gels determined a decreasing of viscosity (~2000 mPa.s vs
~5000 mPa.s).
5.4. Multiple Light Scattering
Multiple light scattering predicts the stability of the samples. So, it can detect instability
phenomena such as flocculation, sedimentation, phase separation and phase separation with
clarification. In Table 9 is reported the instability phenomena of samples. Detailed results of
multiple light scattering analysis is in annex.
In Figures 14 and 15 transmission and backscattering profiles are reported. Profiles of the
curves did not show significant variability over time confirming stability of the sample.
On the contrary in Figures 16 and 17 it is possible to observe a flocculation phenomenon in
transmission profile and a sedimentation phenomenon in backscattering profile. In fact, the
higher clarification (higher transmission percentage) determined in the middle of the sample
corresponded to a sedimentation (and so higher backscattering percentage) on the bottom.
Flocculation is a phenomenon in which the particles form flakes, increasing in size. In these
cases, there are differences in the scattering of light. As it is possible to observe in the Figure
17 the flocculation phenomenon is represented from a series of horizontal parallel curves in
the central part of the vial. The different colour of the curves represents a time scale.
Sedimentation phenomena indeed is characterized from the migration of the particles to the
bottom of the vial. Many times, sedimentation is a consequence of flocculation, as in this case.
In Figures 18 and 19 it is possible to see an association of two phenomena. In particular,
Figure 19 shows a decrease in transmission in the bottom and/or an increase in backscattering
in the bottom. Also in this case the overlapping coloured curves represent a particle migration.
In Figures 18 and 19, it is possible to see an association of two phenomena. In particular,
Figure 19 shows a decrease in transmission in the bottom and/or an increase in backscattering
in the bottom. Also in this case the overlapping coloured curves represent a particle migration.
Phase separation is the conversion of a single-phase system to a multi-phase system.
Generally, one phase is clearer than the other one. In according to multiple light scattering,
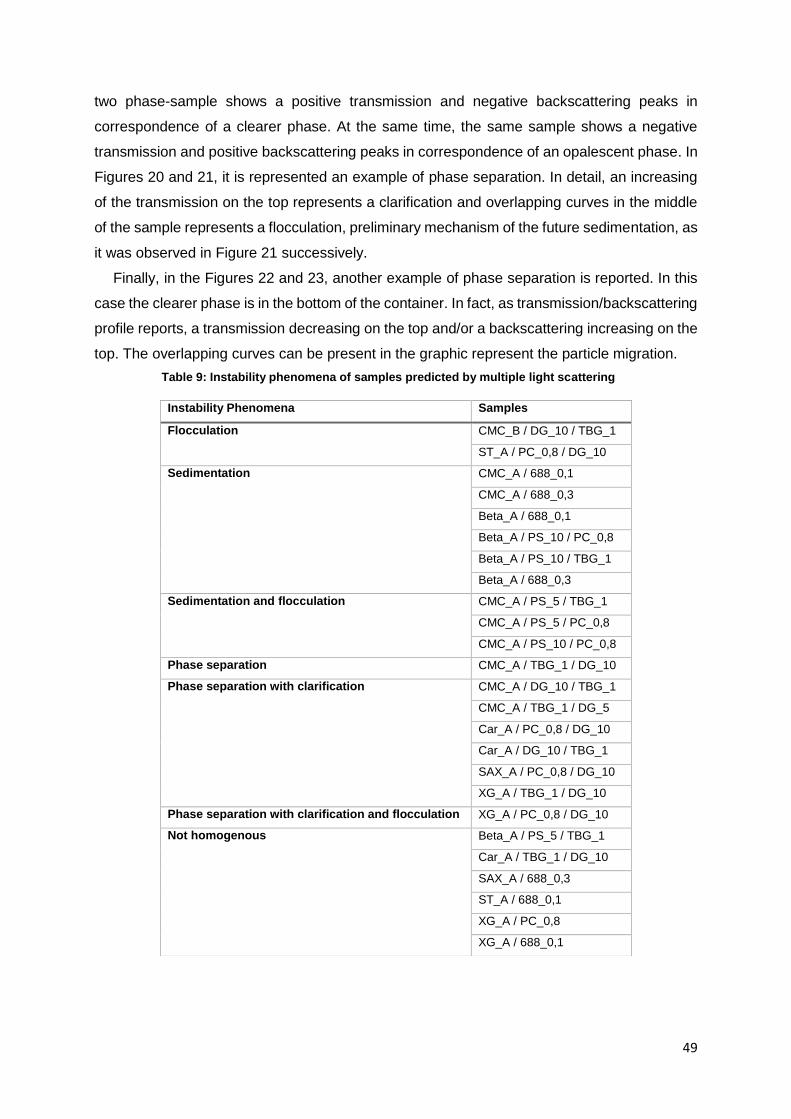
49
two phase-sample shows a positive transmission and negative backscattering peaks in
correspondence of a clearer phase. At the same time, the same sample shows a negative
transmission and positive backscattering peaks in correspondence of an opalescent phase. In
Figures 20 and 21, it is represented an example of phase separation. In detail, an increasing
of the transmission on the top represents a clarification and overlapping curves in the middle
of the sample represents a flocculation, preliminary mechanism of the future sedimentation, as
it was observed in Figure 21 successively.
Finally, in the Figures 22 and 23, another example of phase separation is reported. In this
case the clearer phase is in the bottom of the container. In fact, as transmission/backscattering
profile reports, a transmission decreasing on the top and/or a backscattering increasing on the
top. The overlapping curves can be present in the graphic represent the particle migration.
Table 9: Instability phenomena of samples predicted by multiple light scattering
Instability Phenomena Samples
Flocculation CMC_B / DG_10 / TBG_1
ST_A / PC_0,8 / DG_10
Sedimentation CMC_A / 688_0,1
CMC_A / 688_0,3
Beta_A / 688_0,1
Beta_A / PS_10 / PC_0,8
Beta_A / PS_10 / TBG_1
Beta_A / 688_0,3
Sedimentation and flocculation CMC_A / PS_5 / TBG_1
CMC_A / PS_5 / PC_0,8
CMC_A / PS_10 / PC_0,8
Phase separation CMC_A / TBG_1 / DG_10
Phase separation with clarification CMC_A / DG_10 / TBG_1
CMC_A / TBG_1 / DG_5
Car_A / PC_0,8 / DG_10
Car_A / DG_10 / TBG_1
SAX_A / PC_0,8 / DG_10
XG_A / TBG_1 / DG_10
Phase separation with clarification and flocculation XG_A / PC_0,8 / DG_10
Not homogenous Beta_A / PS_5 / TBG_1
Car_A / TBG_1 / DG_10
SAX_A / 688_0,3
ST_A / 688_0,1
XG_A / PC_0,8
XG_A / 688_0,1
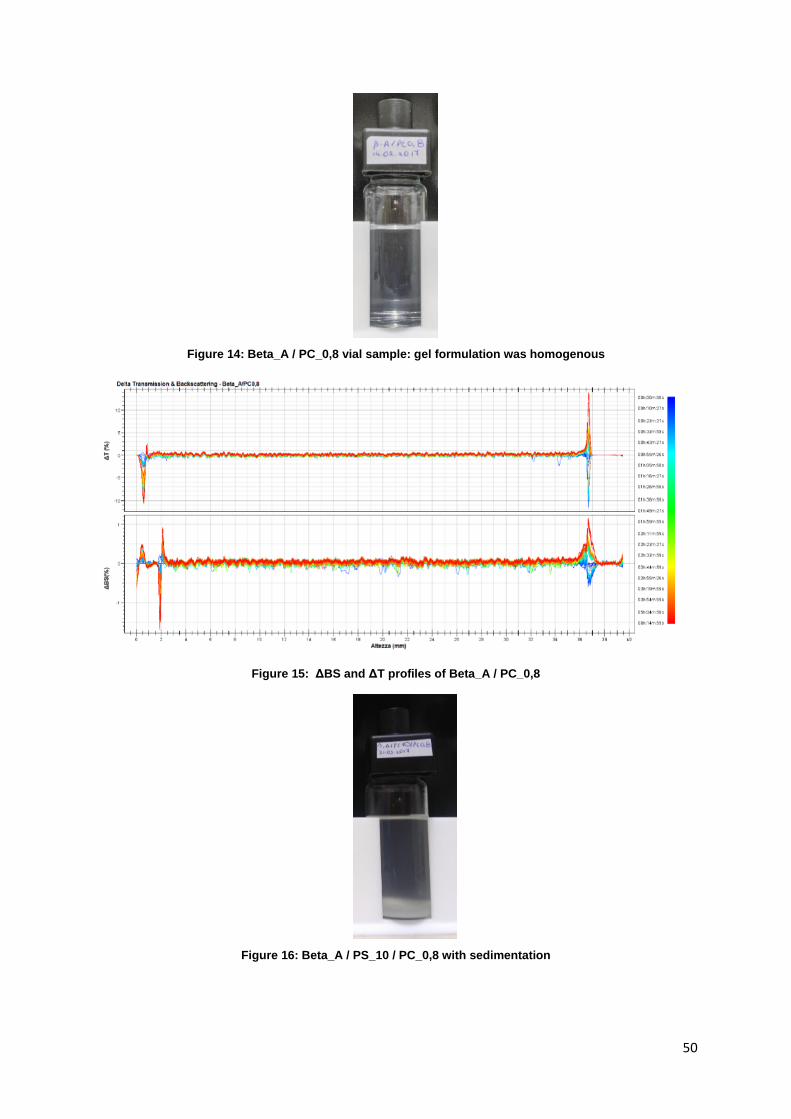
50
Figure 14: Beta_A / PC_0,8 vial sample: gel formulation was homogenous
Figure 15: ΔBS and ΔT profiles of Beta_A / PC_0,8
Figure 16: Beta_A / PS_10 / PC_0,8 with sedimentation
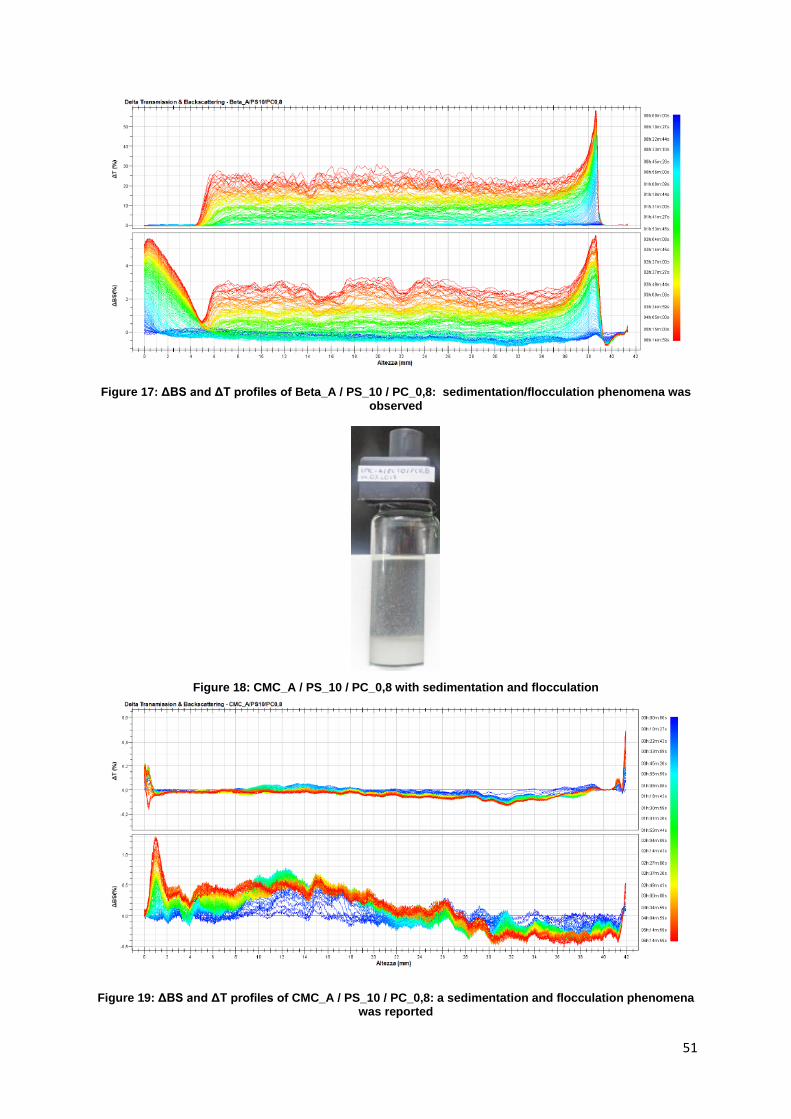
51
Figure 17: ΔBS and ΔT profiles of Beta_A / PS_10 / PC_0,8: sedimentation/flocculation phenomena was observed
Figure 18: CMC_A / PS_10 / PC_0,8 with sedimentation and flocculation
Figure 19: ΔBS and ΔT profiles of CMC_A / PS_10 / PC_0,8: a sedimentation and flocculation phenomena was reported
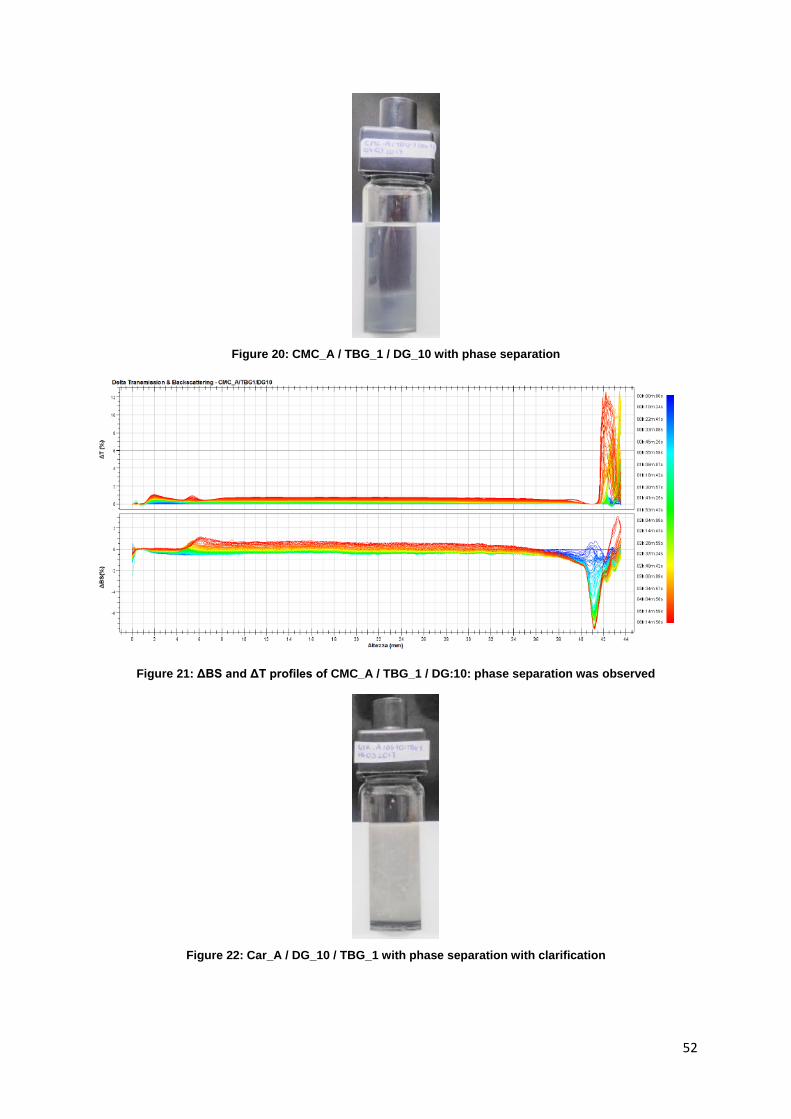
52
Figure 20: CMC_A / TBG_1 / DG_10 with phase separation
Figure 21: ΔBS and ΔT profiles of CMC_A / TBG_1 / DG:10: phase separation was observed
Figure 22: Car_A / DG_10 / TBG_1 with phase separation with clarification
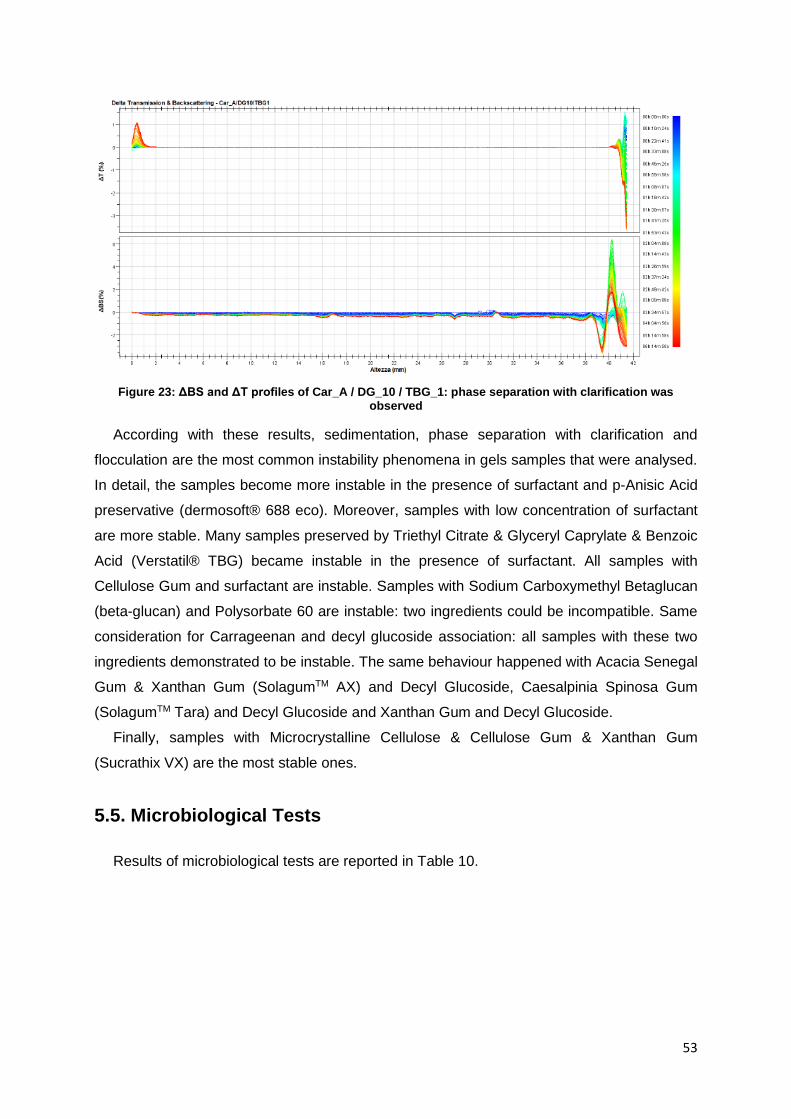
53
Figure 23: ΔBS and ΔT profiles of Car_A / DG_10 / TBG_1: phase separation with clarification was observed
According with these results, sedimentation, phase separation with clarification and
flocculation are the most common instability phenomena in gels samples that were analysed.
In detail, the samples become more instable in the presence of surfactant and p-Anisic Acid
preservative (dermosoft® 688 eco). Moreover, samples with low concentration of surfactant
are more stable. Many samples preserved by Triethyl Citrate & Glyceryl Caprylate & Benzoic
Acid (Verstatil® TBG) became instable in the presence of surfactant. All samples with
Cellulose Gum and surfactant are instable. Samples with Sodium Carboxymethyl Betaglucan
(beta-glucan) and Polysorbate 60 are instable: two ingredients could be incompatible. Same
consideration for Carrageenan and decyl glucoside association: all samples with these two
ingredients demonstrated to be instable. The same behaviour happened with Acacia Senegal
Gum & Xanthan Gum (SolagumTM AX) and Decyl Glucoside, Caesalpinia Spinosa Gum
(SolagumTM Tara) and Decyl Glucoside and Xanthan Gum and Decyl Glucoside.
Finally, samples with Microcrystalline Cellulose & Cellulose Gum & Xanthan Gum
(Sucrathix VX) are the most stable ones.
5.5. Microbiological Tests
Results of microbiological tests are reported in Table 10.
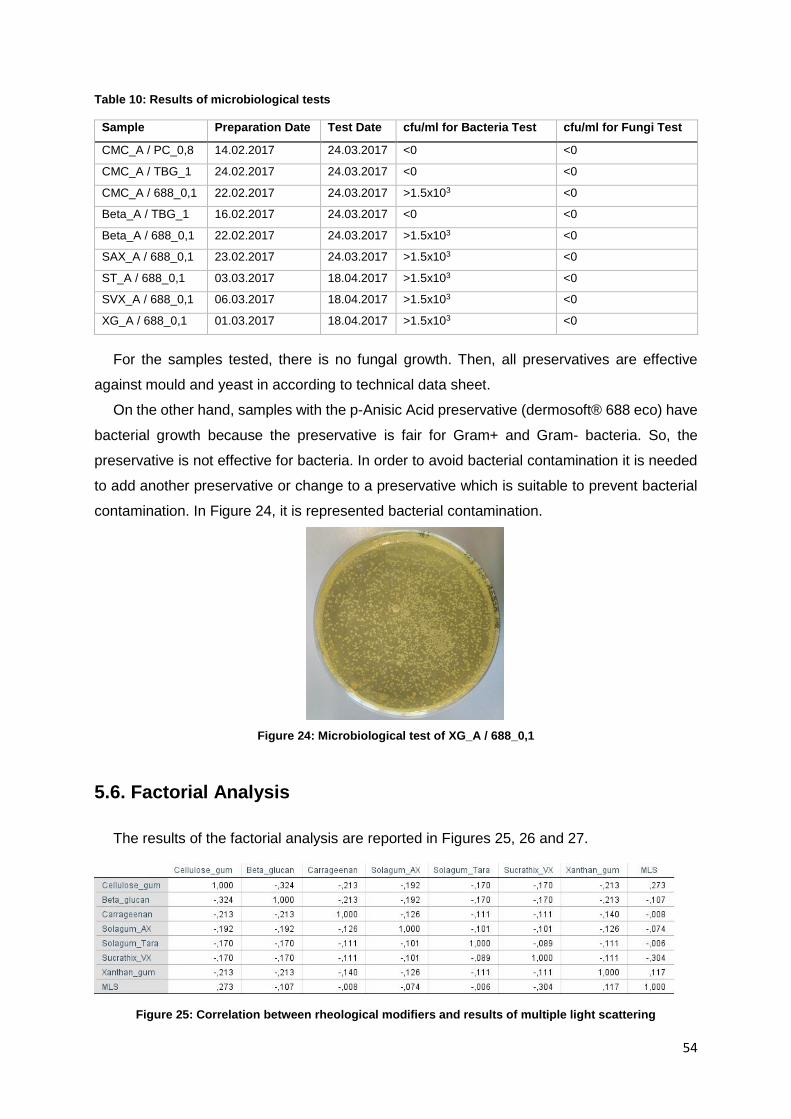
54
Table 10: Results of microbiological tests
Sample Preparation Date Test Date cfu/ml for Bacteria Test cfu/ml for Fungi Test
CMC_A / PC_0,8 14.02.2017 24.03.2017 <0 <0
CMC_A / TBG_1 24.02.2017 24.03.2017 <0 <0
CMC_A / 688_0,1 22.02.2017 24.03.2017 >1.5x10³ <0
Beta_A / TBG_1 16.02.2017 24.03.2017 <0 <0
Beta_A / 688_0,1 22.02.2017 24.03.2017 >1.5x10³ <0
SAX_A / 688_0,1 23.02.2017 24.03.2017 >1.5x10³ <0
ST_A / 688_0,1 03.03.2017 18.04.2017 >1.5x10³ <0
SVX_A / 688_0,1 06.03.2017 18.04.2017 >1.5x10³ <0
XG_A / 688_0,1 01.03.2017 18.04.2017 >1.5x10³ <0
For the samples tested, there is no fungal growth. Then, all preservatives are effective
against mould and yeast in according to technical data sheet.
On the other hand, samples with the p-Anisic Acid preservative (dermosoft® 688 eco) have
bacterial growth because the preservative is fair for Gram+ and Gram- bacteria. So, the
preservative is not effective for bacteria. In order to avoid bacterial contamination it is needed
to add another preservative or change to a preservative which is suitable to prevent bacterial
contamination. In Figure 24, it is represented bacterial contamination.
Figure 24: Microbiological test of XG_A / 688_0,1
5.6. Factorial Analysis
The results of the factorial analysis are reported in Figures 25, 26 and 27.
Figure 25: Correlation between rheological modifiers and results of multiple light scattering
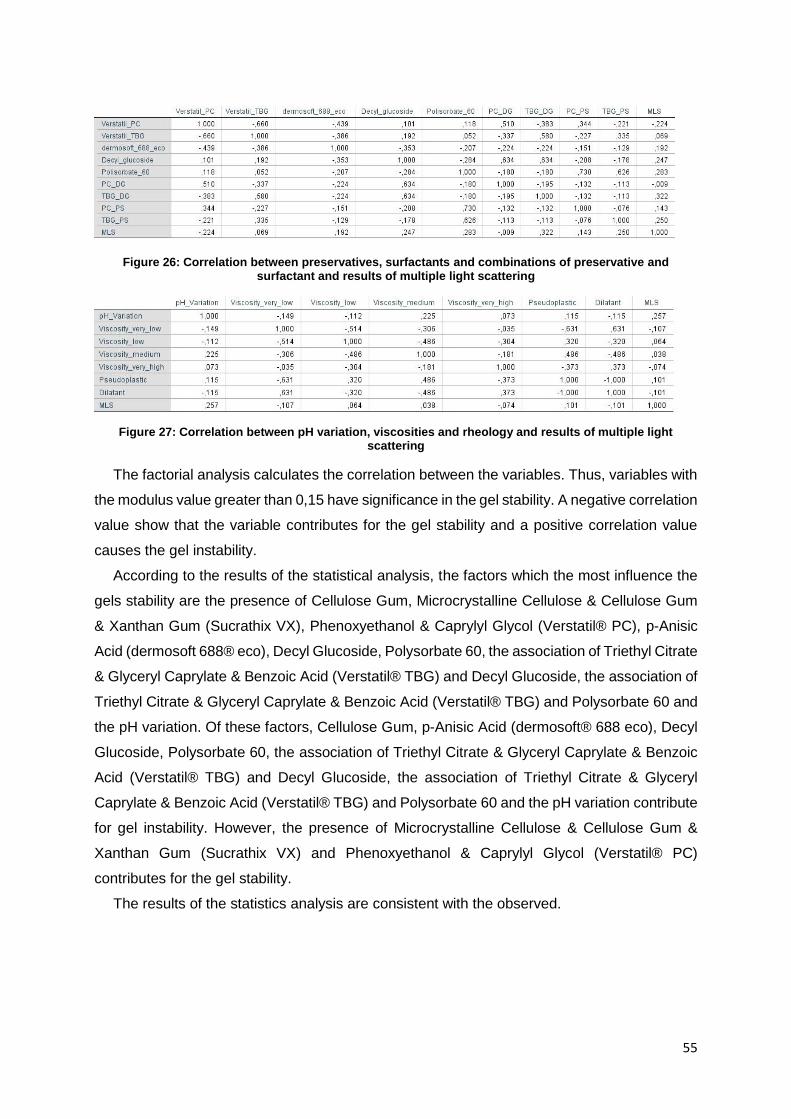
55
Figure 26: Correlation between preservatives, surfactants and combinations of preservative and surfactant and results of multiple light scattering
Figure 27: Correlation between pH variation, viscosities and rheology and results of multiple light scattering
The factorial analysis calculates the correlation between the variables. Thus, variables with
the modulus value greater than 0,15 have significance in the gel stability. A negative correlation
value show that the variable contributes for the gel stability and a positive correlation value
causes the gel instability.
According to the results of the statistical analysis, the factors which the most influence the
gels stability are the presence of Cellulose Gum, Microcrystalline Cellulose & Cellulose Gum
& Xanthan Gum (Sucrathix VX), Phenoxyethanol & Caprylyl Glycol (Verstatil® PC), p-Anisic
Acid (dermosoft 688® eco), Decyl Glucoside, Polysorbate 60, the association of Triethyl Citrate
& Glyceryl Caprylate & Benzoic Acid (Verstatil® TBG) and Decyl Glucoside, the association of
Triethyl Citrate & Glyceryl Caprylate & Benzoic Acid (Verstatil® TBG) and Polysorbate 60 and
the pH variation. Of these factors, Cellulose Gum, p-Anisic Acid (dermosoft® 688 eco), Decyl
Glucoside, Polysorbate 60, the association of Triethyl Citrate & Glyceryl Caprylate & Benzoic
Acid (Verstatil® TBG) and Decyl Glucoside, the association of Triethyl Citrate & Glyceryl
Caprylate & Benzoic Acid (Verstatil® TBG) and Polysorbate 60 and the pH variation contribute
for gel instability. However, the presence of Microcrystalline Cellulose & Cellulose Gum &
Xanthan Gum (Sucrathix VX) and Phenoxyethanol & Caprylyl Glycol (Verstatil® PC)
contributes for the gel stability.
The results of the statistics analysis are consistent with the observed.
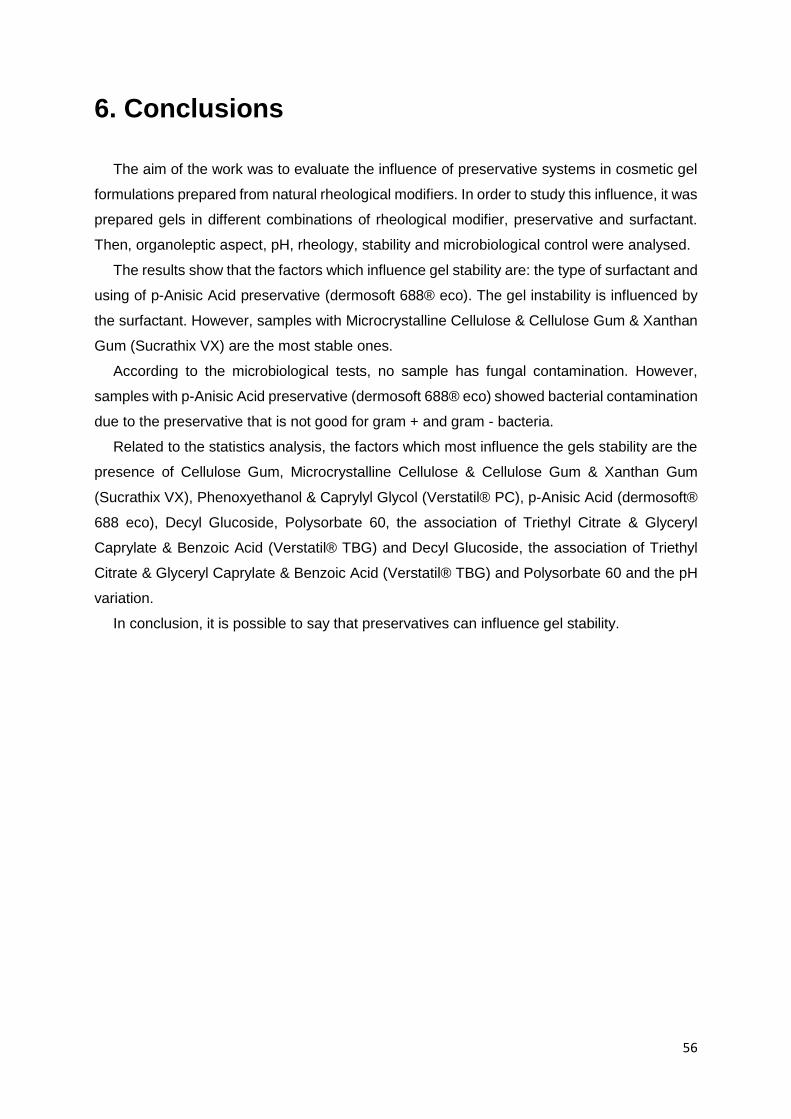
56
6. Conclusions
The aim of the work was to evaluate the influence of preservative systems in cosmetic gel
formulations prepared from natural rheological modifiers. In order to study this influence, it was
prepared gels in different combinations of rheological modifier, preservative and surfactant.
Then, organoleptic aspect, pH, rheology, stability and microbiological control were analysed.
The results show that the factors which influence gel stability are: the type of surfactant and
using of p-Anisic Acid preservative (dermosoft 688® eco). The gel instability is influenced by
the surfactant. However, samples with Microcrystalline Cellulose & Cellulose Gum & Xanthan
Gum (Sucrathix VX) are the most stable ones.
According to the microbiological tests, no sample has fungal contamination. However,
samples with p-Anisic Acid preservative (dermosoft 688® eco) showed bacterial contamination
due to the preservative that is not good for gram + and gram - bacteria.
Related to the statistics analysis, the factors which most influence the gels stability are the
presence of Cellulose Gum, Microcrystalline Cellulose & Cellulose Gum & Xanthan Gum
(Sucrathix VX), Phenoxyethanol & Caprylyl Glycol (Verstatil® PC), p-Anisic Acid (dermosoft®
688 eco), Decyl Glucoside, Polysorbate 60, the association of Triethyl Citrate & Glyceryl
Caprylate & Benzoic Acid (Verstatil® TBG) and Decyl Glucoside, the association of Triethyl
Citrate & Glyceryl Caprylate & Benzoic Acid (Verstatil® TBG) and Polysorbate 60 and the pH
variation.
In conclusion, it is possible to say that preservatives can influence gel stability.
57
References
1. Swarbrick J, editor. Encyclopedia of PHARMACEUTICAL TECHNOLOGY. 3rd ed. New
York: Informa Healthcare USA, Inc.; 2007. 1875 p.
2. Verma A, Singh S, Kaur R, Jain UK. Topical Gels as Drug Delivery Systems: A Review.
Int J Pharm Sci Rev Res [Internet]. 2013;23(2):374–82. Available from:
http://www.globalresearchonline.net/journalcontents/v23-2/60.pdf
3. Troy DB, editor. Remington: The Science and Practice of Pharmacy. 21st ed.
Philapdelphia: Lippincott Williams & Wilkins; 2006. 321, 770, 771 p.
4. Kaur LP, Guleri TK. Topical Gel: A Recent Approach for Novel Drug Delivery. Asian J
Biomed Pharm Sci [Internet]. 2013;3(17):1–5. Available from:
http://www.jbiopharm.com/index.php/ajbps/article/view/183
5. D’Agostinis G, Mignini E. Manuale del Cosmetologo. 2nd ed. Milano: Tecniche Nuove;
2014. 51-53, 152-154 p.
6. Wen Q, Dong Y. GELS Handbook: Fundamentals, Properties and Applications. 1st ed.
Singapore: World Scientific Publishing Co. Pte. Ltd.; 2016. 1-2 p.
7. Felton LA, editor. Remington: Essentials of Pharmaceutics. 1st ed. London:
Pharmaceutical Press; 2013.
8. Basha BN, Prakasam K, Goli D. Formulation and evaluation of Gel containing
Fluconazole-Antifungal Agent. Int J Drug Dev Res [Internet]. 2011;3(4):109–28.
Available from: http://www.ijddr.in/drug-development/formulation-and-evaluation-of-gel-
containing-fluconazoleantifungal-agent.php?aid=5677
9. Chang R-K, Raw A, Lionberger R, Yu LX. Generic development of topical dermatologic
products: formulation development, process development, and testing of topical
dermatologic products. AAPS J [Internet]. 2013;15(1):41–52. Available from:
http://www.springerlink.com/index/10.1208/s12248-012-9411-
0%5Cnpapers3://publication/doi/10.1208/s12248-012-9411-0
10. Gad SC, editor. Pharmaceutical Manufacturing Handbook: Production and Processes.
1st ed. New Jersey: John Wiley & Sons, Inc.; 2008. 301 p.
11. Aulton ME, Taylor KMG. Aulton’s Pharmaceutics - The Design and Manufacture of
Medicines. 4th ed. London: Elvesier Ltd.; 2013. 71-72, 76 p.
12. The International Pharmacopoeia. 4th ed. Geneva: World Health Organization; 2006.
972 p.
58
13. Shelke SJ, Shinkar DM, Saudagar RB. Topical Gel: A Novel Approach For Development
Of Topical Drug Delivery System. Int J Pharmacy&Technology [Internet].
2013;5(3):2739–63. Available from: http://www.ijptonline.com/wp-
content/uploads/2013/12/2739-2763.pdf
14. Zheng YJ, Loh XJ. Natural rheological modifiers for personal care. Polym Adv Technol
[Internet]. 2016;27:1664–79. Available from:
http://onlinelibrary.wiley.com/doi/10.1002/pat.3822/full
15. Sakamoto K, Lochhead R, Maibach H, Yamashita Y. Cosmetic Science and
Technology: Theoretical Principles and Applications. 1st ed. Amsterdam: Elvesier Inc.;
2017. 171, 642-643 p.
16. Braun DD, Rosen MR. Rheology Modifiers Handbook: Practical Use and Application.
1st ed. New York: William Andrew Publishing; 2013. 14-17 p.
17. Shaikh SM, Doijad RC, Shete AS, Sankpal PS. A Review on: Preservatives used in
Pharmaceuticals and impacts on Health. PharmaTutor. 2016;4(5):25–34.
18. REGULATION (EC) No 1223/2009 OF THE EUROPEAN PARLIAMENT AND OF THE
COUNCIL of 30 November 2009 on cosmetic products. Off J Eur Union. 2009;L 342:59–
209.
19. Steinberg D. Preservatives for Cosmetics. 2nd ed. Carol Stream: Allured Publishing
Corporation; 2006.
20. Draelos ZD. Cosmetics and Dermatologic Problems and Solutions: A Problem Based
Approach. 3rd ed. Florida: Taylor & Francis Group, LLC; 2011. 103-104 p.
21. Barel AO, Paye M, Maibach HI, editors. Handbook of Cosmetic Science and
Technology. 2nd ed. Florida: Taylor & Francis Group, LLC; 2006. 228-229 p.
22. Farmacopeia Portuguesa. 9th ed. Lisboa: Infarmed; 2008. 182-200, 652-655 p.
23. Tadros TF. Interfacial Phenomena and Colloid Stability: Basic Principles. 1st ed. Berlin:
Walter de Gruyter GmbH; 2015. 97 p.
24. Lachman L, Lieberman HA, Kanig JL. Teoria e Prática na Indústria Farmacêutica. 1st
ed. Fundação Calouste Gulbenkian. Lisboa: Fundação Caloust Gulbenkian; 2001. 190-
195 p.
25. Cosgrove T, editor. Colloid Science: Principles, Methods and Applications. 2nd ed.
Werst Sussex: John Wiley & Sons Ltd.; 2010. 345 p.
26. Denton P, Rostron C, editors. Pharmaceutics: The Science of Medicine Design. 1st ed.
Oxford: Oxford University Press; 2013. 187-189 p.
59
27. Hubbard AT, editor. Encyclopedia of Surface and Colloid Science. 1st ed. New York:
Marcel Dekker, Inc.; 2002. 1050 p.
28. Mark HF. Encyclopedia of Polymer Science and Technology, Concise. 3rd ed. New
Jersey: John Wiley & Sons, Inc.; 2007. 234 p.
29. Quaderni: La verifica della Stabilità del prodotto cosmetico. Milano: UNIPRO; 2003.
30. Beck R, Guterres S, Pohlmann A, editors. Nanocosmetics and Nanomedicines: New
Approaches for Skin Care. 1st ed. Chennai: Springe-Verlag Berlin Heidelberg; 2011.
111 p.
31. Bru P, Brunel L, Buron H, Cayré I, Ducarre X, Fraux A. Particle Size and Rapid Stability
Analyses of Concentrated Dispersions: Use of Multiple Light Scattering Technique. In:
Provder T, Texter J, editors. Particle Sizing and Characterization [Internet]. Washington:
American Chemical Society; 2004. p. 45–60. Available from:
http://dx.doi.org/10.1021/bk-2004-0881.ch003
32. CP Kelco Cellulose Gum/ Carboxymethyl Cellulose [Internet]. [cited 2017 Apr 12].
Available from: https://www.cpkelco.com/products/cellulose-gum/
33. Colony Gums: CMC [Internet]. [cited 2017 May 22]. Available from:
https://colonygums.com/cmc/
34. Antonov YA, Dmitrochenko AP, Leontiev AL. Interactions and compatibility of 11 S
globulin from Vicia Faba seeds and sodium salt of carboxymethylcellulose in an
aqueous medium. Int J Biol Macromol [Internet]. 2006;38(1):18–24. Available from:
http://www.sciencedirect.com/science/article/pii/S0141813005002709
35. Syrbe A, Bauer WJ, Klostermeyer H. Polymer science concepts in dairy systems - An
overview of milk protein and food hydrocolloid interaction. Int Dairy J. 1998;8(3):179–
93.
36. CM-Glucan Granulate: The repair and defense molecule [Internet]. [cited 2017 Apr 12].
Available from: https://mibellebiochemistry.com/products/cm-glucan-granulate/
37. Brennan CS, Tudorica CM. Carbohydrate-based fat replacers in the modification of the
rheological, textural and sensory quality of yoghurt: Comparative study of the utilisation
of barley beta-glucan, guar gum and inulin. Int J Food Sci Technol [Internet].
2008;43(5):824–33. Available from: http://onlinelibrary.wiley.com/doi/10.1111/j.1365-
2621.2007.01522.x/epdf
38. Lazaridou A, Serafeimidou A, Biliaderis CG, Moschakis T, Tzanetakis N. Structure
development and acidification kinetics in fermented milk containing oat β-glucan, a
60
yogurt culture and a probiotic strain. Food Hydrocoll [Internet]. Elsevier Ltd;
2014;39:204–14. Available from: http://dx.doi.org/10.1016/j.foodhyd.2014.01.015
39. CP Kelco Carrageenan [Internet]. [cited 2017 Apr 12]. Available from:
https://www.cpkelco.com/products/carrageenan/
40. Colony Gums: Carrageenans [Internet]. [cited 2017 May 24]. Available from:
https://colonygums.com/carrageenans/
41. Michon C, Cuvelier G, Launay B, Parker A, Takerkart G. Study of the
compatibility/incompatibility of gelatin/iota-carrageenan/water mixtures. Carbohydr
Polym. 1995;28(4):333–6.
42. Blecker C, Habib-Jiwan JM, Karoui R. Effect of heat treatment of rennet skim milk
induced coagulation on the rheological properties and molecular structure determined
by synchronous fluorescence spectroscopy and turbiscan. Food Chem [Internet].
Elsevier Ltd; 2012;135(3):1809–17. Available from:
http://dx.doi.org/10.1016/j.foodchem.2012.06.035
43. Chaudemanche C, Budtova T. Mixtures of pregelatinised maize starch and κ-
carrageenan: Compatibility, rheology and gelation. Carbohydr Polym [Internet].
2008;72(4):579–89. Available from:
http://www.sciencedirect.com/science/article/pii/S0144861707005048
44. Spagnuolo PA, Dalgleish DG, Goff HD, Morris ER. Kappa-carrageenan interactions in
systems containing casein micelles and polysaccharide stabilizers. Food Hydrocoll.
2005;19(3):371–7.
45. Zhu JH, Yang XQ, Ahmad I, Li L, Wang XY, Liu C. Rheological properties of κ-
carrageenan and soybean glycinin mixed gels. Food Res Int [Internet]. 2008;41(3):219–
28. Available from:
http://www.sciencedirect.com/science/article/pii/S0963996907001998
46. SOLAGUMTM AX: Sustainable Combination of Polymers from Natural Origin [Internet].
[cited 2017 Apr 12]. Available from: https://www.seppic.com/solagum-ax
47. SOLAGUMTM TARA: Natural Gum as Elegance Booster [Internet]. [cited 2017 Apr 12].
Available from: https://www.seppic.com/solagum-tara
48. PERSONAL CARE [Internet]. [cited 2017 Apr 12]. Available from: http://www.alfa-
chemicals.co.uk/uploads/products/ALFACOS_Brochure_2016.pdf
49. CP Kelco Xanthan Gum [Internet]. [cited 2017 Apr 12]. Available from:
https://www.cpkelco.com/products/xanthan-gum/
61
50. Colony Gums: Xanthan Gum [Internet]. [cited 2017 May 28]. Available from:
htpps://colonygums.com/xanthan_gum/
51. Verstatil® PC [Internet]. [cited 2017 Apr 12]. Available from: https://www.dr-
straetmans.de/en/products/verstatil-pc/
52. Verstatil® TBG [Internet]. [cited 2017 Apr 12]. Available from: https://www.dr-
straetmans.de/en/products/verstatil-tbg/
53. dermosoft® 688 eco [Internet]. [cited 2017 Apr 12]. Available from: https://www.dr-
straetmans.de/en/products/dermosoft-688-eco/
54. ORAMIXTM NS 10: 100% bio-based high foaming power [Internet]. [cited 2017 Apr 12].
Available from: https://www.seppic.com/oramix-ns-10
55. Product summary: TweenTM 60 [Internet]. [cited 2017 Apr 12]. Available from:
http://www.crodahomecare.com/home.aspx?view=dtl&d=content&s=151&r=317&p=21
38&productname=Tween&chemicalname=&casnumber=&productgroup=&application=
&function=&prodID=888
56. LABORATORIES BE. BROOKFIELD DIAL VISCOMETER [Internet]. [cited 2017 Apr
20]. Available from: http://www.brookfieldengineering.com/-
/media/ametekbrookfield/manuals/obsolete manuals/dial m85-150-p700.pdf?la=en
57. Celia C, Trapasso E, Cosco D, Paolino D, Fresta M. Turbiscan Lab® Expert analysis of
the stability of ethosomes® and ultradeformable liposomes containing a bilayer
fluidizing agent. Colloids Surfaces B Biointerfaces. 2009;72(1):155–60.
58. Abismail B, Canselier JP, Wilhelm AM, Delmas H, Gourdon C. Emulsification by
ultrasound: drop size distribution and stability. Ultrason Sonochem. 1999;6:75–83.
59. Kang W, Xu B, Wang Y, Li Y, Shan X, An F, et al. Stability mechanism of W/O crude oil
emulsion stabilized by polymer and surfactant. Colloids Surfaces A Physicochem Eng
Asp [Internet]. Elsevier B.V.; 2011;384(1–3):555–60. Available from:
http://dx.doi.org/10.1016/j.colsurfa.2011.05.017
60. Maroco J. Análise Estatística: Com utilização do SPSS. 3rd ed. Lisboa: Edições Sílabo;
2007. 361, 363, 368 p.
61. Kline P. An Easy Guide to Factor Analysis. New York: Routledge; 2014.
62. Pereira JC. Análise de Dados Qualitativos: Estratégias Metodológicas para as Ciências
da Saúde Humanas e Sociais. 3rd ed. São Paulo: EdUSP - Editora da Universidade de
São Paulo; 2004. 124 p.
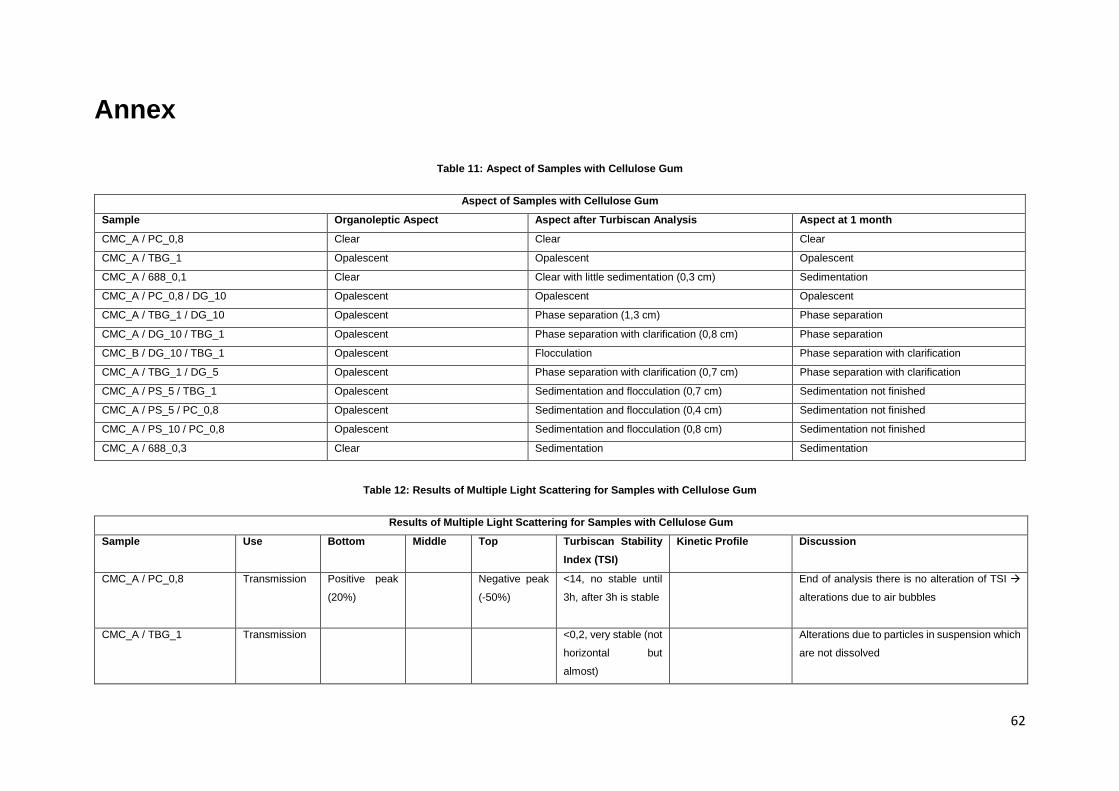
62
Annex
Table 11: Aspect of Samples with Cellulose Gum
Aspect of Samples with Cellulose Gum
Sample Organoleptic Aspect Aspect after Turbiscan Analysis Aspect at 1 month
CMC_A / PC_0,8 Clear Clear Clear
CMC_A / TBG_1 Opalescent Opalescent Opalescent
CMC_A / 688_0,1 Clear Clear with little sedimentation (0,3 cm) Sedimentation
CMC_A / PC_0,8 / DG_10 Opalescent Opalescent Opalescent
CMC_A / TBG_1 / DG_10 Opalescent Phase separation (1,3 cm) Phase separation
CMC_A / DG_10 / TBG_1 Opalescent Phase separation with clarification (0,8 cm) Phase separation
CMC_B / DG_10 / TBG_1 Opalescent Flocculation Phase separation with clarification
CMC_A / TBG_1 / DG_5 Opalescent Phase separation with clarification (0,7 cm) Phase separation with clarification
CMC_A / PS_5 / TBG_1 Opalescent Sedimentation and flocculation (0,7 cm) Sedimentation not finished
CMC_A / PS_5 / PC_0,8 Opalescent Sedimentation and flocculation (0,4 cm) Sedimentation not finished
CMC_A / PS_10 / PC_0,8 Opalescent Sedimentation and flocculation (0,8 cm) Sedimentation not finished
CMC_A / 688_0,3 Clear Sedimentation Sedimentation
Table 12: Results of Multiple Light Scattering for Samples with Cellulose Gum
Results of Multiple Light Scattering for Samples with Cellulose Gum
Sample Use Bottom Middle Top Turbiscan Stability
Index (TSI)
Kinetic Profile Discussion
CMC_A / PC_0,8 Transmission Positive peak
(20%)
Negative peak
(-50%)
<14, no stable until
3h, after 3h is stable
End of analysis there is no alteration of TSI
alterations due to air bubbles
CMC_A / TBG_1 Transmission <0,2, very stable (not
horizontal but
almost)
Alterations due to particles in suspension which
are not dissolved
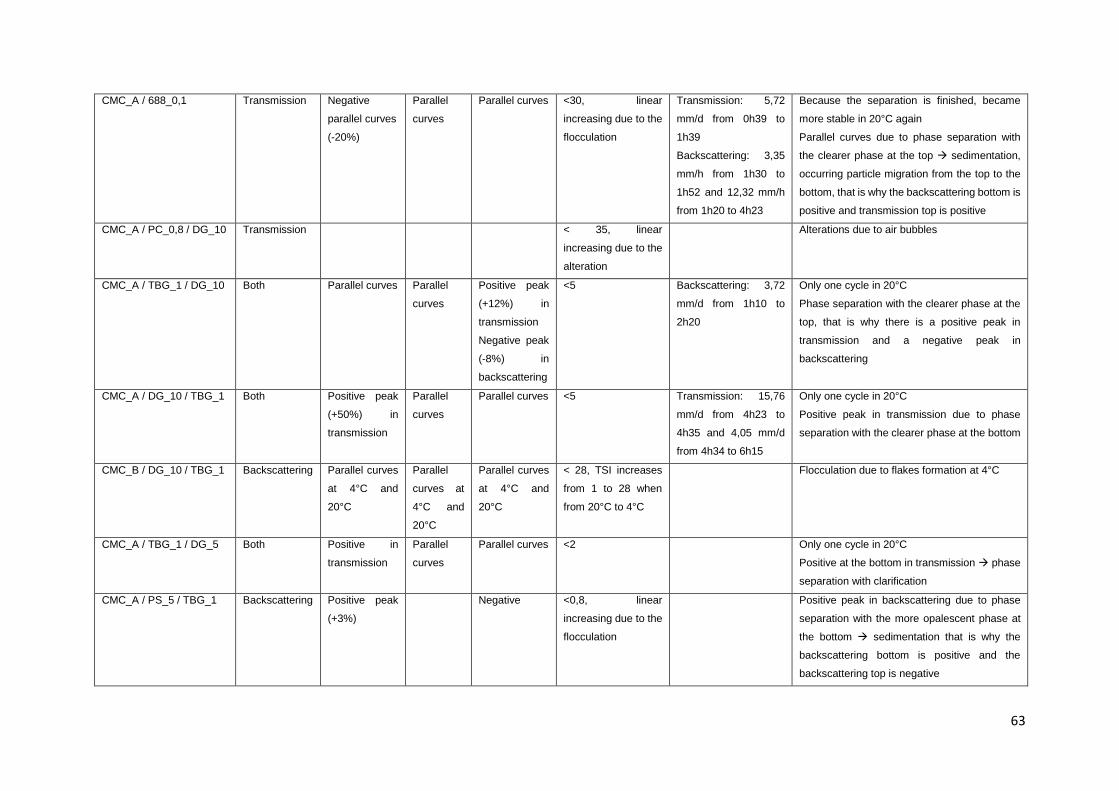
63
CMC_A / 688_0,1 Transmission Negative
parallel curves
(-20%)
Parallel
curves
Parallel curves <30, linear
increasing due to the
flocculation
Transmission: 5,72
mm/d from 0h39 to
1h39
Backscattering: 3,35
mm/h from 1h30 to
1h52 and 12,32 mm/h
from 1h20 to 4h23
Because the separation is finished, became
more stable in 20°C again
Parallel curves due to phase separation with
the clearer phase at the top sedimentation,
occurring particle migration from the top to the
bottom, that is why the backscattering bottom is
positive and transmission top is positive
CMC_A / PC_0,8 / DG_10 Transmission < 35, linear
increasing due to the
alteration
Alterations due to air bubbles
CMC_A / TBG_1 / DG_10 Both Parallel curves Parallel
curves
Positive peak
(+12%) in
transmission
Negative peak
(-8%) in
backscattering
<5 Backscattering: 3,72
mm/d from 1h10 to
2h20
Only one cycle in 20°C
Phase separation with the clearer phase at the
top, that is why there is a positive peak in
transmission and a negative peak in
backscattering
CMC_A / DG_10 / TBG_1 Both Positive peak
(+50%) in
transmission
Parallel
curves
Parallel curves <5 Transmission: 15,76
mm/d from 4h23 to
4h35 and 4,05 mm/d
from 4h34 to 6h15
Only one cycle in 20°C
Positive peak in transmission due to phase
separation with the clearer phase at the bottom
CMC_B / DG_10 / TBG_1 Backscattering Parallel curves
at 4°C and
20°C
Parallel
curves at
4°C and
20°C
Parallel curves
at 4°C and
20°C
< 28, TSI increases
from 1 to 28 when
from 20°C to 4°C
Flocculation due to flakes formation at 4°C
CMC_A / TBG_1 / DG_5 Both Positive in
transmission
Parallel
curves
Parallel curves <2 Only one cycle in 20°C
Positive at the bottom in transmission phase
separation with clarification
CMC_A / PS_5 / TBG_1 Backscattering Positive peak
(+3%)
Negative <0,8, linear
increasing due to the
flocculation
Positive peak in backscattering due to phase
separation with the more opalescent phase at
the bottom sedimentation that is why the
backscattering bottom is positive and the
backscattering top is negative
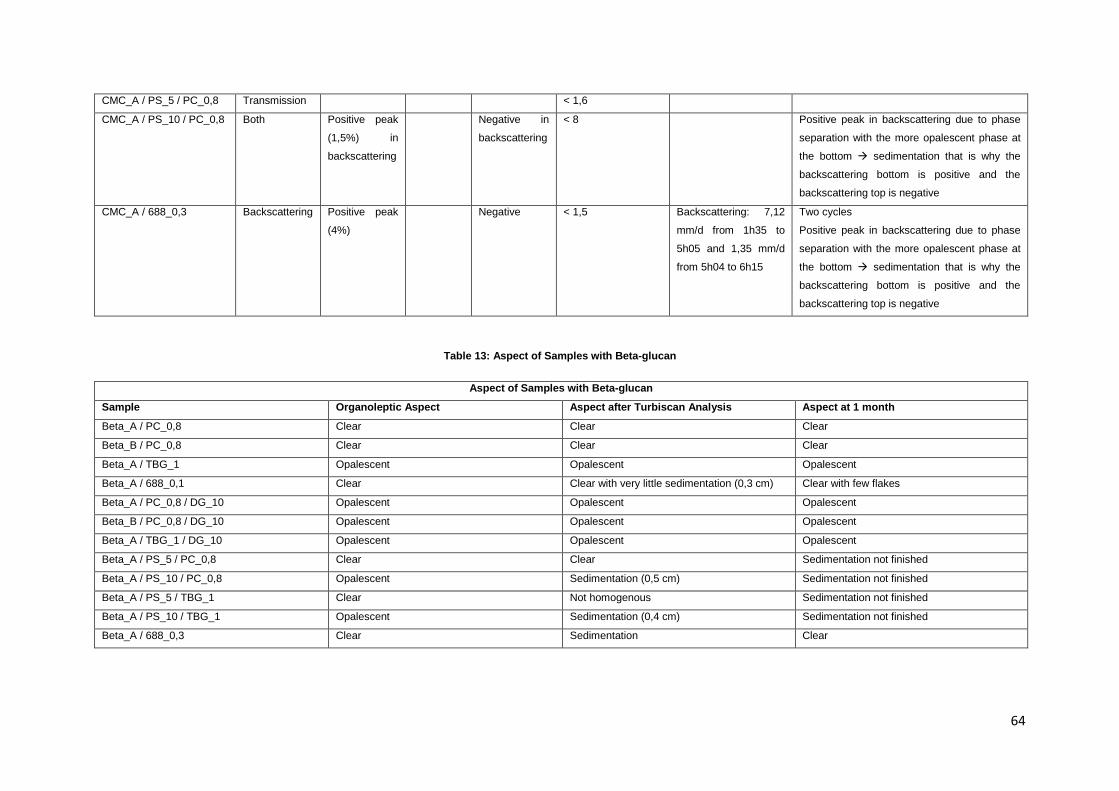
64
CMC_A / PS_5 / PC_0,8 Transmission < 1,6
CMC_A / PS_10 / PC_0,8 Both Positive peak
(1,5%) in
backscattering
Negative in
backscattering
< 8 Positive peak in backscattering due to phase
separation with the more opalescent phase at
the bottom sedimentation that is why the
backscattering bottom is positive and the
backscattering top is negative
CMC_A / 688_0,3 Backscattering Positive peak
(4%)
Negative < 1,5 Backscattering: 7,12
mm/d from 1h35 to
5h05 and 1,35 mm/d
from 5h04 to 6h15
Two cycles
Positive peak in backscattering due to phase
separation with the more opalescent phase at
the bottom sedimentation that is why the
backscattering bottom is positive and the
backscattering top is negative
Table 13: Aspect of Samples with Beta-glucan
Aspect of Samples with Beta-glucan
Sample Organoleptic Aspect Aspect after Turbiscan Analysis Aspect at 1 month
Beta_A / PC_0,8 Clear Clear Clear
Beta_B / PC_0,8 Clear Clear Clear
Beta_A / TBG_1 Opalescent Opalescent Opalescent
Beta_A / 688_0,1 Clear Clear with very little sedimentation (0,3 cm) Clear with few flakes
Beta_A / PC_0,8 / DG_10 Opalescent Opalescent Opalescent
Beta_B / PC_0,8 / DG_10 Opalescent Opalescent Opalescent
Beta_A / TBG_1 / DG_10 Opalescent Opalescent Opalescent
Beta_A / PS_5 / PC_0,8 Clear Clear Sedimentation not finished
Beta_A / PS_10 / PC_0,8 Opalescent Sedimentation (0,5 cm) Sedimentation not finished
Beta_A / PS_5 / TBG_1 Clear Not homogenous Sedimentation not finished
Beta_A / PS_10 / TBG_1 Opalescent Sedimentation (0,4 cm) Sedimentation not finished
Beta_A / 688_0,3 Clear Sedimentation Clear
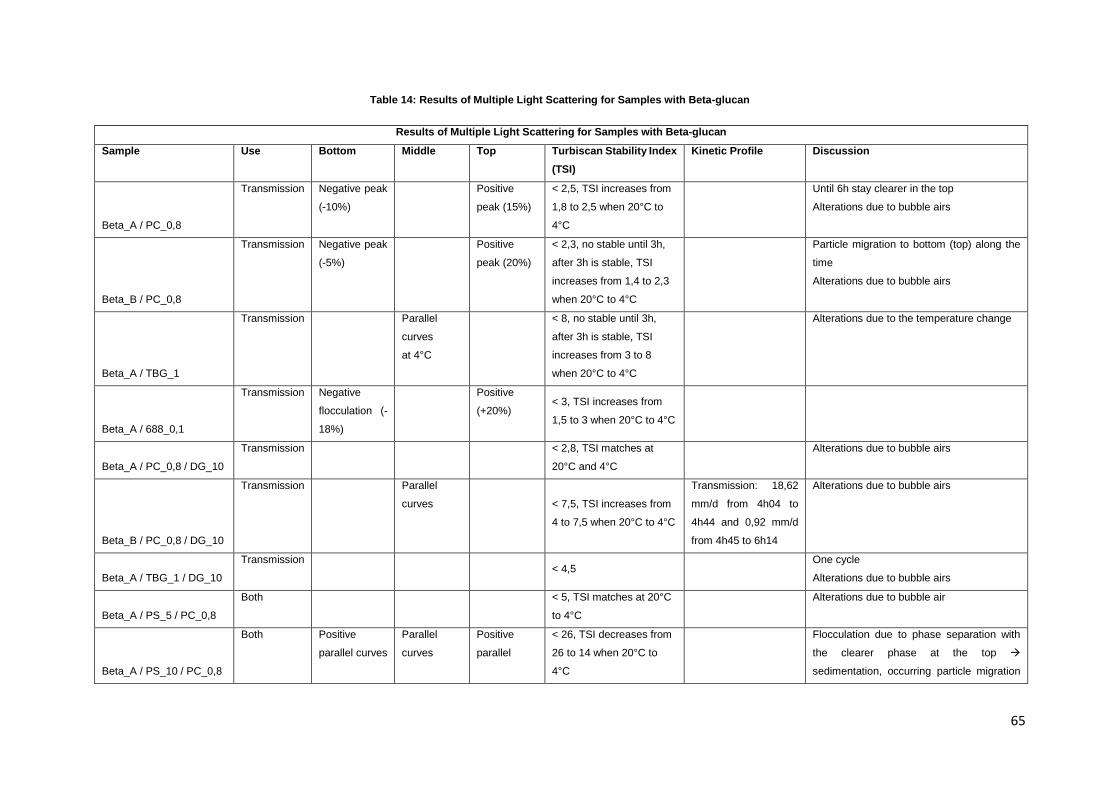
65
Table 14: Results of Multiple Light Scattering for Samples with Beta-glucan
Results of Multiple Light Scattering for Samples with Beta-glucan
Sample Use Bottom Middle Top Turbiscan Stability Index
(TSI)
Kinetic Profile Discussion
Beta_A / PC_0,8
Transmission Negative peak
(-10%)
Positive
peak (15%)
< 2,5, TSI increases from
1,8 to 2,5 when 20°C to
4°C
Until 6h stay clearer in the top
Alterations due to bubble airs
Beta_B / PC_0,8
Transmission Negative peak
(-5%)
Positive
peak (20%)
< 2,3, no stable until 3h,
after 3h is stable, TSI
increases from 1,4 to 2,3
when 20°C to 4°C
Particle migration to bottom (top) along the
time
Alterations due to bubble airs
Beta_A / TBG_1
Transmission Parallel
curves
at 4°C
< 8, no stable until 3h,
after 3h is stable, TSI
increases from 3 to 8
when 20°C to 4°C
Alterations due to the temperature change
Beta_A / 688_0,1
Transmission Negative
flocculation (-
18%)
Positive
(+20%) < 3, TSI increases from
1,5 to 3 when 20°C to 4°C
Beta_A / PC_0,8 / DG_10
Transmission < 2,8, TSI matches at
20°C and 4°C
Alterations due to bubble airs
Beta_B / PC_0,8 / DG_10
Transmission Parallel
curves
< 7,5, TSI increases from
4 to 7,5 when 20°C to 4°C
Transmission: 18,62
mm/d from 4h04 to
4h44 and 0,92 mm/d
from 4h45 to 6h14
Alterations due to bubble airs
Beta_A / TBG_1 / DG_10
Transmission < 4,5
One cycle
Alterations due to bubble airs
Beta_A / PS_5 / PC_0,8
Both < 5, TSI matches at 20°C
to 4°C
Alterations due to bubble air
Beta_A / PS_10 / PC_0,8
Both Positive
parallel curves
Parallel
curves
Positive
parallel
< 26, TSI decreases from
26 to 14 when 20°C to
4°C
Flocculation due to phase separation with
the clearer phase at the top
sedimentation, occurring particle migration
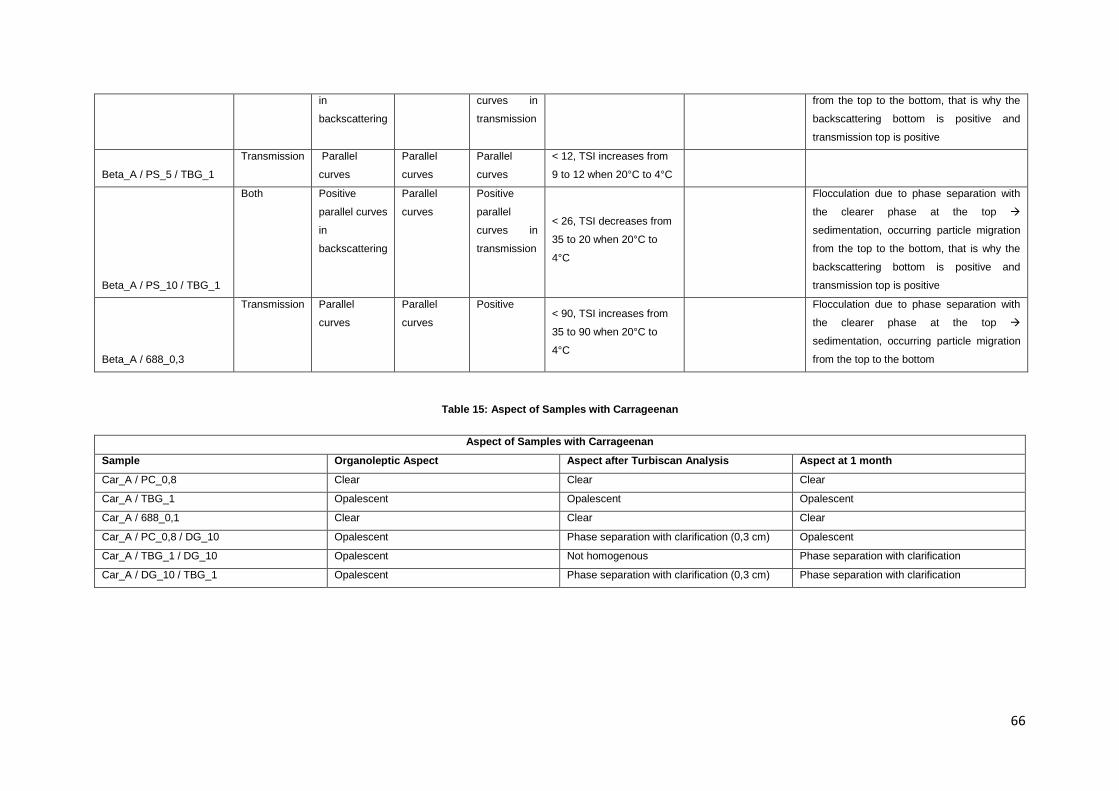
66
in
backscattering
curves in
transmission
from the top to the bottom, that is why the
backscattering bottom is positive and
transmission top is positive
Beta_A / PS_5 / TBG_1
Transmission Parallel
curves
Parallel
curves
Parallel
curves
< 12, TSI increases from
9 to 12 when 20°C to 4°C
Beta_A / PS_10 / TBG_1
Both Positive
parallel curves
in
backscattering
Parallel
curves
Positive
parallel
curves in
transmission
< 26, TSI decreases from
35 to 20 when 20°C to
4°C
Flocculation due to phase separation with
the clearer phase at the top
sedimentation, occurring particle migration
from the top to the bottom, that is why the
backscattering bottom is positive and
transmission top is positive
Beta_A / 688_0,3
Transmission Parallel
curves
Parallel
curves
Positive < 90, TSI increases from
35 to 90 when 20°C to
4°C
Flocculation due to phase separation with
the clearer phase at the top
sedimentation, occurring particle migration
from the top to the bottom
Table 15: Aspect of Samples with Carrageenan
Aspect of Samples with Carrageenan
Sample Organoleptic Aspect Aspect after Turbiscan Analysis Aspect at 1 month
Car_A / PC_0,8 Clear Clear Clear
Car_A / TBG_1 Opalescent Opalescent Opalescent
Car_A / 688_0,1 Clear Clear Clear
Car_A / PC_0,8 / DG_10 Opalescent Phase separation with clarification (0,3 cm) Opalescent
Car_A / TBG_1 / DG_10 Opalescent Not homogenous Phase separation with clarification
Car_A / DG_10 / TBG_1 Opalescent Phase separation with clarification (0,3 cm) Phase separation with clarification
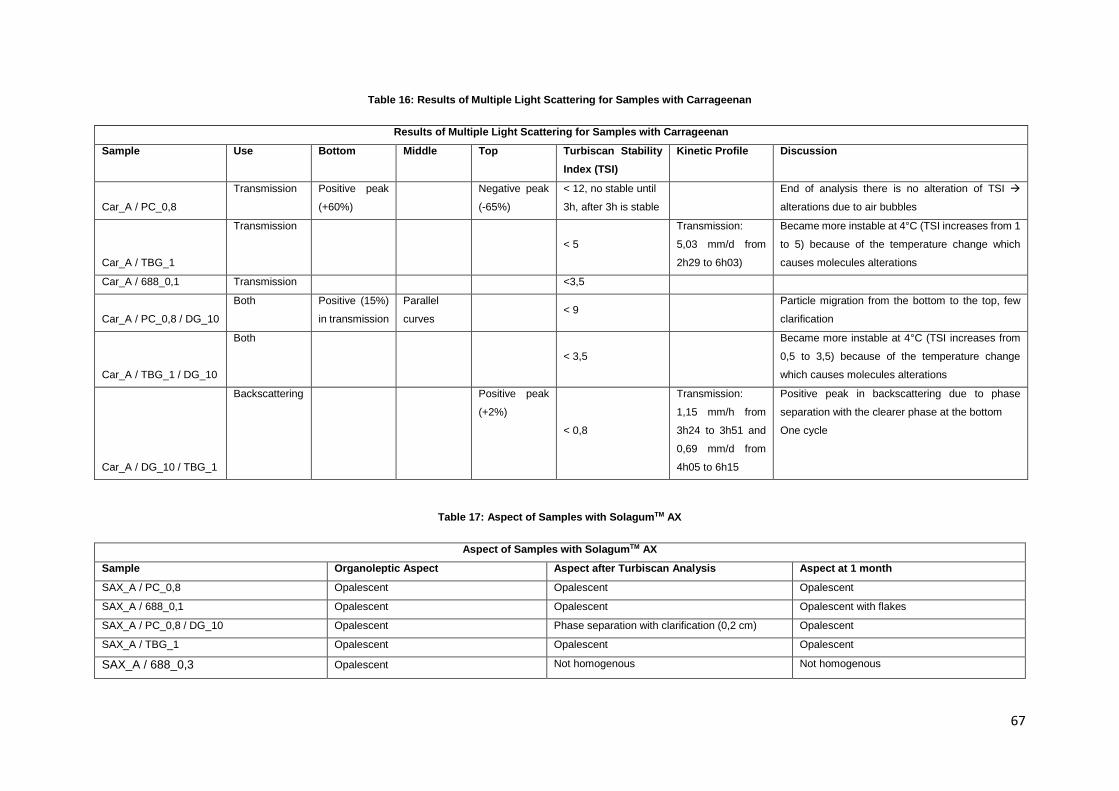
67
Table 16: Results of Multiple Light Scattering for Samples with Carrageenan
Results of Multiple Light Scattering for Samples with Carrageenan
Sample Use Bottom Middle Top Turbiscan Stability
Index (TSI)
Kinetic Profile Discussion
Car_A / PC_0,8
Transmission Positive peak
(+60%)
Negative peak
(-65%)
< 12, no stable until
3h, after 3h is stable
End of analysis there is no alteration of TSI
alterations due to air bubbles
Car_A / TBG_1
Transmission
< 5
Transmission:
5,03 mm/d from
2h29 to 6h03)
Became more instable at 4°C (TSI increases from 1
to 5) because of the temperature change which
causes molecules alterations
Car_A / 688_0,1 Transmission <3,5
Car_A / PC_0,8 / DG_10
Both Positive (15%)
in transmission
Parallel
curves
< 9
Particle migration from the bottom to the top, few
clarification
Car_A / TBG_1 / DG_10
Both
< 3,5
Became more instable at 4°C (TSI increases from
0,5 to 3,5) because of the temperature change
which causes molecules alterations
Car_A / DG_10 / TBG_1
Backscattering Positive peak
(+2%)
< 0,8
Transmission:
1,15 mm/h from
3h24 to 3h51 and
0,69 mm/d from
4h05 to 6h15
Positive peak in backscattering due to phase
separation with the clearer phase at the bottom
One cycle
Table 17: Aspect of Samples with SolagumTM AX
Aspect of Samples with SolagumTM AX
Sample Organoleptic Aspect Aspect after Turbiscan Analysis Aspect at 1 month
SAX_A / PC_0,8 Opalescent Opalescent Opalescent
SAX_A / 688_0,1 Opalescent Opalescent Opalescent with flakes
SAX_A / PC_0,8 / DG_10 Opalescent Phase separation with clarification (0,2 cm) Opalescent
SAX_A / TBG_1 Opalescent Opalescent Opalescent
SAX_A / 688_0,3 Opalescent Not homogenous Not homogenous
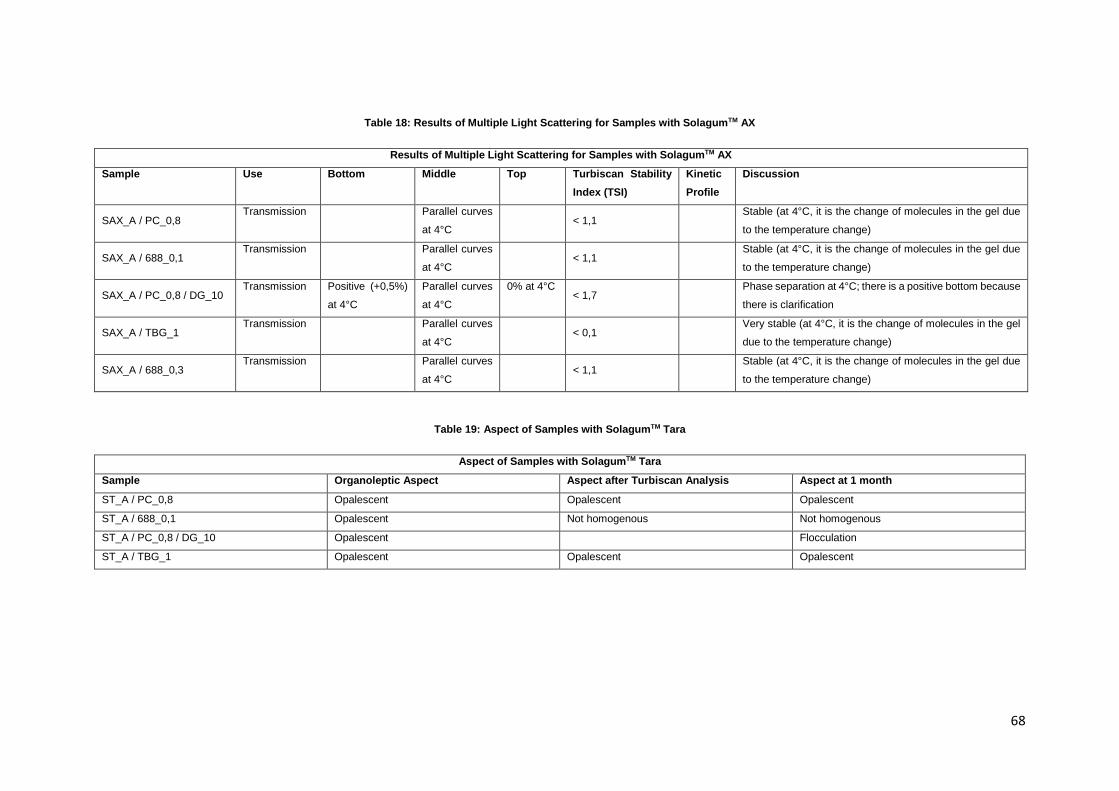
68
Table 18: Results of Multiple Light Scattering for Samples with SolagumTM AX
Results of Multiple Light Scattering for Samples with SolagumTM AX
Sample Use Bottom Middle Top Turbiscan Stability
Index (TSI)
Kinetic
Profile
Discussion
SAX_A / PC_0,8 Transmission Parallel curves
at 4°C
< 1,1
Stable (at 4°C, it is the change of molecules in the gel due
to the temperature change)
SAX_A / 688_0,1 Transmission Parallel curves
at 4°C
< 1,1
Stable (at 4°C, it is the change of molecules in the gel due
to the temperature change)
SAX_A / PC_0,8 / DG_10 Transmission Positive (+0,5%)
at 4°C
Parallel curves
at 4°C
0% at 4°C < 1,7
Phase separation at 4°C; there is a positive bottom because
there is clarification
SAX_A / TBG_1 Transmission Parallel curves
at 4°C
< 0,1
Very stable (at 4°C, it is the change of molecules in the gel
due to the temperature change)
SAX_A / 688_0,3 Transmission Parallel curves
at 4°C
< 1,1
Stable (at 4°C, it is the change of molecules in the gel due
to the temperature change)
Table 19: Aspect of Samples with SolagumTM Tara
Aspect of Samples with SolagumTM Tara
Sample Organoleptic Aspect Aspect after Turbiscan Analysis Aspect at 1 month
ST_A / PC_0,8 Opalescent Opalescent Opalescent
ST_A / 688_0,1 Opalescent Not homogenous Not homogenous
ST_A / PC_0,8 / DG_10 Opalescent Flocculation
ST_A / TBG_1 Opalescent Opalescent Opalescent
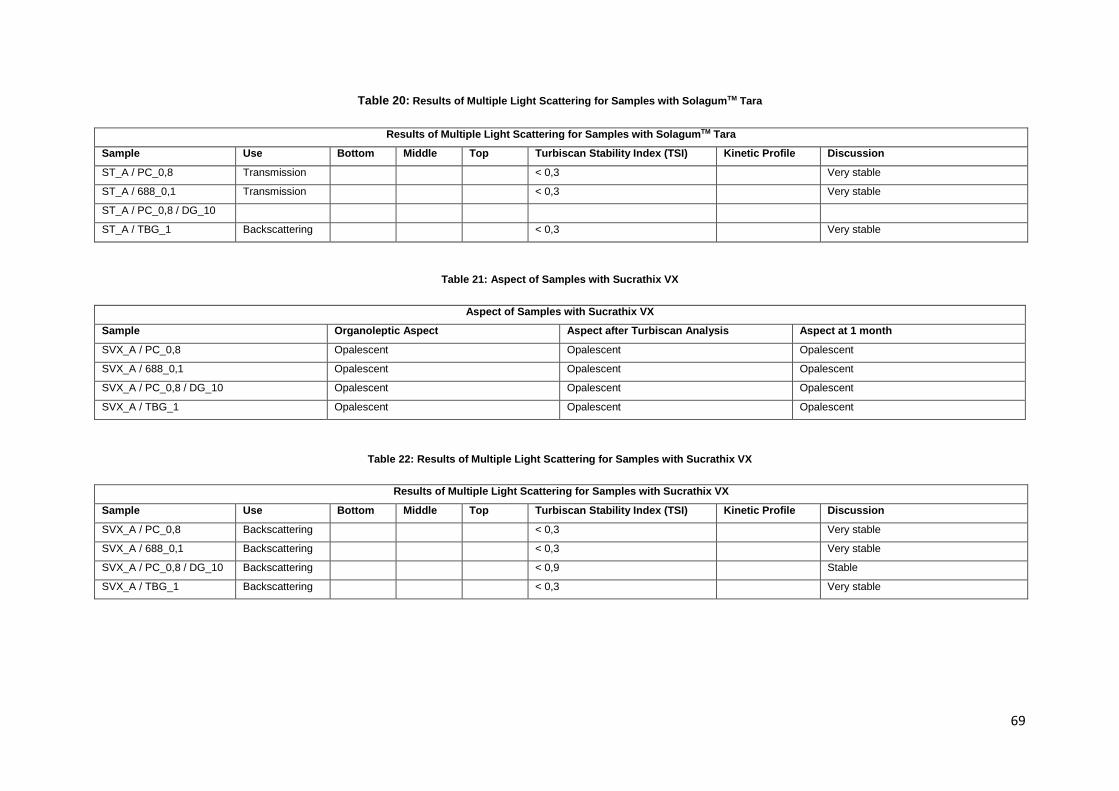
69
Table 20: Results of Multiple Light Scattering for Samples with SolagumTM Tara
Results of Multiple Light Scattering for Samples with SolagumTM Tara
Sample Use Bottom Middle Top Turbiscan Stability Index (TSI) Kinetic Profile Discussion
ST_A / PC_0,8 Transmission < 0,3 Very stable
ST_A / 688_0,1 Transmission < 0,3 Very stable
ST_A / PC_0,8 / DG_10
ST_A / TBG_1 Backscattering < 0,3 Very stable
Table 21: Aspect of Samples with Sucrathix VX
Aspect of Samples with Sucrathix VX
Sample Organoleptic Aspect Aspect after Turbiscan Analysis Aspect at 1 month
SVX_A / PC_0,8 Opalescent Opalescent Opalescent
SVX_A / 688_0,1 Opalescent Opalescent Opalescent
SVX_A / PC_0,8 / DG_10 Opalescent Opalescent Opalescent
SVX_A / TBG_1 Opalescent Opalescent Opalescent
Table 22: Results of Multiple Light Scattering for Samples with Sucrathix VX
Results of Multiple Light Scattering for Samples with Sucrathix VX
Sample Use Bottom Middle Top Turbiscan Stability Index (TSI) Kinetic Profile Discussion
SVX_A / PC_0,8 Backscattering < 0,3 Very stable
SVX_A / 688_0,1 Backscattering < 0,3 Very stable
SVX_A / PC_0,8 / DG_10 Backscattering < 0,9 Stable
SVX_A / TBG_1 Backscattering < 0,3 Very stable
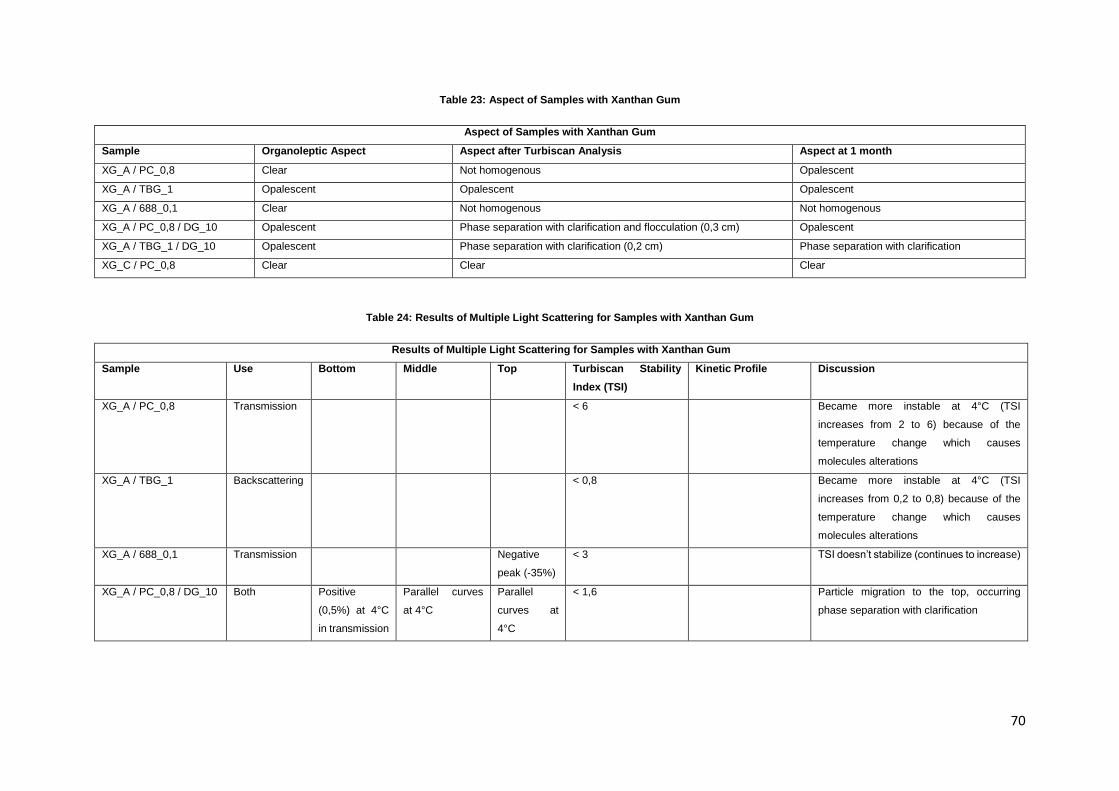
70
Table 23: Aspect of Samples with Xanthan Gum
Aspect of Samples with Xanthan Gum
Sample Organoleptic Aspect Aspect after Turbiscan Analysis Aspect at 1 month
XG_A / PC_0,8 Clear Not homogenous Opalescent
XG_A / TBG_1 Opalescent Opalescent Opalescent
XG_A / 688_0,1 Clear Not homogenous Not homogenous
XG_A / PC_0,8 / DG_10 Opalescent Phase separation with clarification and flocculation (0,3 cm) Opalescent
XG_A / TBG_1 / DG_10 Opalescent Phase separation with clarification (0,2 cm) Phase separation with clarification
XG_C / PC_0,8 Clear Clear Clear
Table 24: Results of Multiple Light Scattering for Samples with Xanthan Gum
Results of Multiple Light Scattering for Samples with Xanthan Gum
Sample Use Bottom Middle Top Turbiscan Stability
Index (TSI)
Kinetic Profile Discussion
XG_A / PC_0,8 Transmission < 6 Became more instable at 4°C (TSI
increases from 2 to 6) because of the
temperature change which causes
molecules alterations
XG_A / TBG_1 Backscattering < 0,8 Became more instable at 4°C (TSI
increases from 0,2 to 0,8) because of the
temperature change which causes
molecules alterations
XG_A / 688_0,1 Transmission Negative
peak (-35%)
< 3 TSI doesn’t stabilize (continues to increase)
XG_A / PC_0,8 / DG_10 Both Positive
(0,5%) at 4°C
in transmission
Parallel curves
at 4°C
Parallel
curves at
4°C
< 1,6 Particle migration to the top, occurring
phase separation with clarification
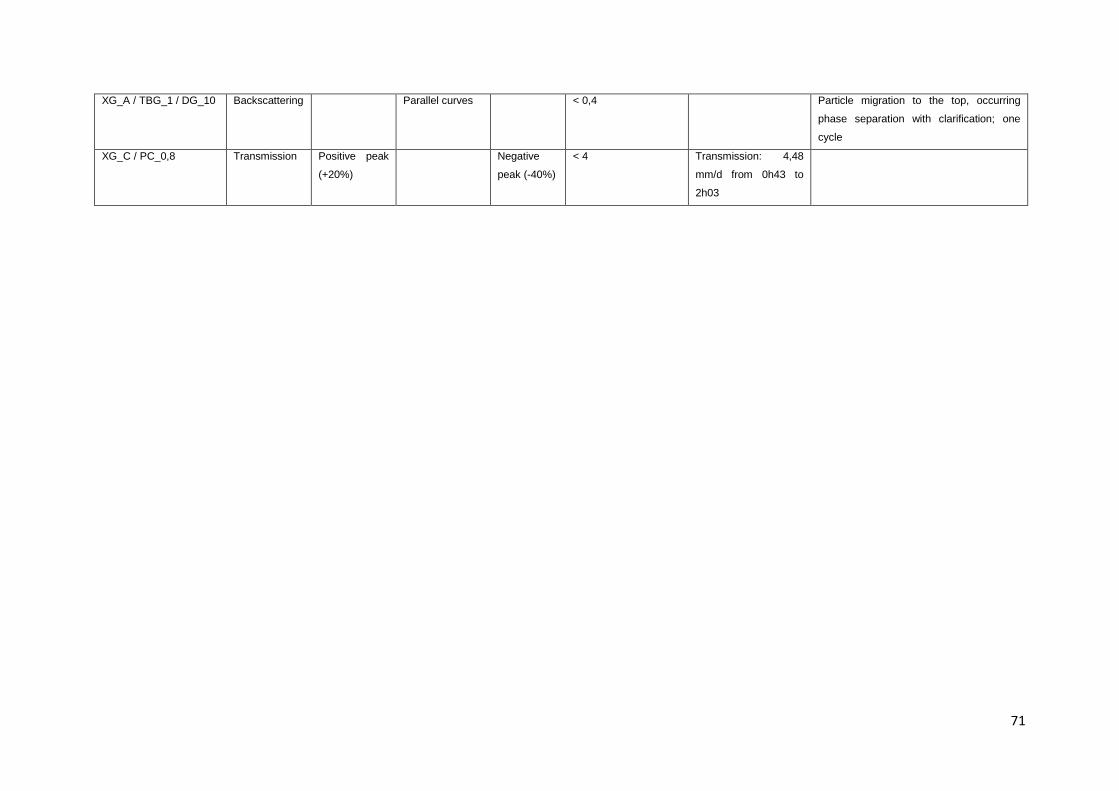
71
XG_A / TBG_1 / DG_10 Backscattering Parallel curves < 0,4 Particle migration to the top, occurring
phase separation with clarification; one
cycle
XG_C / PC_0,8 Transmission Positive peak
(+20%)
Negative
peak (-40%)
< 4 Transmission: 4,48
mm/d from 0h43 to
2h03