Síndrome metabólica, componentes e fatores associados em ...
Upload
karol-lala-lalaCategory
view
216download
0
7/30/2019 Fatores Associados a Qualidade de Vida e IDOSOS
http://slidepdf.com/reader/full/fatores-associados-a-qualidade-de-vida-e-idosos 1/9
Rev Saúde Pública 2009;43(4):613-21
Tiago da Silva AlexandreI
Renata Cereda CordeiroII
Luiz Roberto RamosII
I Departamento de Fisioterapia. Universidadede Taubaté. Taubaté, SP, Brasil
II Departamento de Medicina Preventiva.Universidade Federal de São Paulo. SãoPaulo, SP, Brasil
Correspondence:Tiago da Silva AlexandreR. José Gonçalves, 73
Conj. 31 de Março – Pq Industrial12237-710 São José dos Campos, SP, BrasilE-mail: [email protected]
Received: 03/10/2008Revised: 10/15/2008Approved: 12/04/2009
Factors associated to quality of life in active elderly
Fatores associados à qualidade devida em idosos ativos
ABSTRACT
OBJECTIVE: To analyze whether quality of life in active, healthy elderly
individuals is influenced by functional status and sociodemographic
characteristics, as well as psychological parameters.
METHODS: Study conducted in a sample of 120 active elderly subjects
recruited from two open universities of the third age in the cities of São Paulo
and São José dos Campos (Southeastern Brazil) between May 2005 and April
2006. Quality of life was measured using the abbreviated Brazilian version of
the World Health Organization Quality of Live (WHOQOL-bref) questionnaire.
Sociodemographic, clinical and functional variables were measured through
crossculturally validated assessments by the Mini Mental State Examination,
Geriatric Depression Scale, Functional Reach, One-Leg Balance Test,
Timed Up and Go Test, Six-Minute Walk Test, Human Activity Profile anda complementary questionnaire. Simple descriptive analyses, Pearson’s
correlation coef ficient, Student’s t-test for non-related samples, analyses
of variance, linear regression analyses and variance inflation factor were
performed. The significance level for all statistical tests was set at 0.05.
RESULTS: Linear regression analysis showed an independent correlation
without colinearity between depressive symptoms measured by the Geriatric
Depression Scale and four domains of the WHOQOL-bref. Not having a
conjugal life implied greater perception in the social domain; developing
leisure activities and having an income over five minimum wages implied
greater perception in the environment domain.
CONCLUSIONS: Functional status had no influence on the Quality of Lifevariable in the analysis models in active elderly. In contrast, psychological
factors, as assessed by the Geriatric Depression Scale, and sociodemographic
characteristics, such as marital status, income and leisure activities, had an
impact on quality of life.
DESCRIPTORS: Aged. Quality of Life. Life Style. Health Status.
Socioeconomic Factors.

7/30/2019 Fatores Associados a Qualidade de Vida e IDOSOS
http://slidepdf.com/reader/full/fatores-associados-a-qualidade-de-vida-e-idosos 2/9
614 Quality of life in active elderly Alexandre TS et al
The proportion of people over 60 years of age has been
growing more than any other age group since the 1970s.
This is especially true in developing countries where
the elderly is expected to reach 67% of the population
by 2020.23 According to the United Nations projections
for Latin America, with a projected population of 191
million by 2009, comprising 18 million elderly people,
Brazil will have the fifth largest elderly population
among 192 countries.a
Health promotion policies for encouraging the elderly
to remain active and independent and that effectively
have a positive effect on their quality of life is a concern
for countries going through this demographic transition.
According to the World Health Organization (WHO),
remaining active means maintaining one’s physical,social, and mental potential throughout the entire life
cycle, allowing the involvement of the elderly in social,
RESUMO
OBJETIVO: Analisar se a qualidade de vida de idosos ativos e saudáveis pode
ser influenciada por estado funcional, características sociodemográficas e por
parâmetros psicológicos.
MÉTODOS: Estudo com amostra de 120 idosos ativos participantes de duas
universidades abertas à terceira idade, nas cidades de São Paulo e São José dos
Campos (SP), entre 2005 e 2006. A qualidade de vida foi mensurada utilizando
a versão brasileira e reduzida do World Health Organization Quality Of Life
(WHOQOL-bref). As variáveis sociodemográficas, clínicas e funcionais foram
medidas por meio do Mini Mental State Examination, Geriatric Depression
Scale, Functional Reach, One Leg Balance Test, Timed Up and Go Test, Six-
Minute Walking Test, Human Activity Pro file e questionário complementar. Foi
realizada a análise descritiva simples, o coeficiente de correlação de Pearson,
o teste T para amostras não relacionadas, a análise de variância, a análise
de regressão linear e o cálculo do fator de inflação da variância. O nível de
signifi
cância para todos os testes foifi
xado em 0,05.RESULTADOS: A análise de regressão linear mostrou relação independente
e sem colinearidade entre os quatro domínios do WHOQOL-bref e sintomas
depressivos avaliados pela Geriatric Depression Scale. Não possuir vida
conjugal implicou melhor percepção no domínio social; desenvolver atividades
de lazer e possuir renda superior a cinco salários mínimos implicou melhor
percepção no domínio meio ambiente.
CONCLUSÕES: O estado funcional não foi capaz de influenciar o
comportamento da variável qualidade de vida nos modelos de análise em
idosos ativos, ao contrário dos fatores psicológicos avaliados pela Geriatric
Depression Scale e das características sociodemográficas como estado civil,
renda e prática de atividades de lazer.
DESCRITORES: Idoso. Qualidade de Vida. Estilo de Vida. Nível de
Saúde. Fatores Socioeconômicos.
INTRODUCTION
a Instituto Brasileiro de Geografia e Estatística. Resultado Censo 2000 [Internet]. Rio de Janeiro, 2000 [cited 2005 May 14]. Available from:http://www.ibge.gov.br/series_estatisticas/exibedados.php?idnivel=BR&idserie=POP300
economic, cultural, spiritual, and civic activities.23
Actively aging is related to a satisfactory perception
individuals have regarding their position in life within
a cultural background and value system in which theylive as well as to their goals, expectations and social
standards. Quality of life represents an individual’s
responses to physical (objective) and mental (subjec-
tive) factors that contribute toward a “normal” life,
permeated with personal satisfaction, self-esteem,
comparisons to others, previous experiences, financial
situation, general health status and emotional state.9
Determinants in active aging involve complex systems
of health promotion and disease prevention, as well
as behavioral (e.g., physical activity), psychological
(cognitive impairment and depression), environmental(architectonic barriers and access to transportation),
and economic factors (income, employment and access

7/30/2019 Fatores Associados a Qualidade de Vida e IDOSOS
http://slidepdf.com/reader/full/fatores-associados-a-qualidade-de-vida-e-idosos 3/9
615Rev Saúde Pública 2009;43(4):613-21
to medications). Other determinants include the ability
to perform basic and instrumental activities of daily
living and the number of comorbidities.23 Among this
set of factors, those of economic order are fundamental
to the promotion of physical health and education
throughout life. Education also promotes a better quality of life as it provides intellectual development
and social adaptation. It is assumed that educational
programs offered by universities open to senior
citizens favor a social support network with family
members and friends; motivate the search for informa-
tion and social interaction; and facilitate intellectual
development and a large part of the prerequisites for
active aging.14 Such programs are therefore attended
by autonomous and independent elderly individuals
who differ from the general elderly population in the
community in that they represent the concept of active
aging as proposed by the WHO.
The aim of the present study was to investigate whether
quality of life in active, healthy elderly individuals is
influenced by functional status and sociodemographic
characteristics, as well as psychological parameters.
METHODS
An analytical cross-sectional study was carried out in
a sample of 120 subjects over 60 years of age, both
males and females, attending two open universities of
the third age in the cities of São Paulo and São José
dos Campos, Southeastern Brazil.
Individuals with independent mobility regardless gait-
assistance devices were included in the study. The
following were the exclusion criteria: locomotion by
exclusive means of a wheelchair; inability to answer
the assessment questionnaires due to serious hearing
problems or severe communication disorders; unstable
angina or acute myocardial infarction within one month
prior to the tests, and verbal or written refusal to partici-
pate in the study after clarification and reading of the
consent form. No one met the exclusion criteria at the
two universities studied.
Data were collected by means of questionnaires and
performance tests at a rehabilitation center in São
Paulo, af filiated to the local university, and at the
campus of the open university of the third age in São
José dos Campos, from May 2005 to April 2006. A
structured questionnaire was applied to collect socio-
demographic and clinical data, such as age, gender,
marital status, family arrangement, schooling, social
security status, occupation, housing condition, personal
income, reason for seeking the university, leisure
activities, self-reported comorbidities, subjective
perception of vision and hearing abilities, falls in the
previous year, use of medications, body mass index
(BMI) and engagement in physical activity. The cut-off
values used for BMI followed the recommendation
by Lipschitz13 for the elderly population: low weight
BMI<22 kg/m2; normal weight 22≤BMI<27 kg/m2,
and overweight ≥27 kg/m2.
The Mini Mental State Examination (MMSE) was
used in the assessment of cognitive state. The Brazilianversion of the 30-item Geriatric Depression Scale
(GDS) was used, with a cut-off value of 11 or more
symptoms of depression, based on the recommenda-
tion by Yesavage, who found 84% sensitivity and 95%
specificity.25
The Visual Analogue Scale (VAS) was employed for
pain assessment. Functional exercise capacity was
assessed using the Six-Minute Walk Test.2 Mobility
was assessed by the Timed Up and Go Test (TUGT),15
with the following normal ranges for healthy elderly
individuals in different age groups: 7.1 to 9.0 secondsfor those between 60 and 69 years, 8.2 to 10.2 seconds
for those between 70 and 79 years; and 10.0 to 12.7
for those between 80 and 99 years.3 Balance was
assessed using the Functional Reach8 and One-Leg
Balance Test.22 Functional capacity was assessed by
the Brazilian version of the Human Activity Profile
(HAP), which has items that are dif ficult enough
to determine high levels of capacity or functional
performance, thereby minimizing the ceiling effect
commonly seen in other functional assessment scales
by assessing the individual’s functional level as wellas the level of physical activity.20
The World Health Organization Quality Of Life –
bref (WHOQOL),11 an abbreviated version of the
WHOQOL-100, was used for the assessment of quality
of life domains. The WHOQOL-bref consists of 26
items – two on overall quality of life and 24 representing
four domains: physical, psychological, social relation-
ships, and environment.
The power of the sample to detect errors was of up to
8.9% when the proportions estimated 0.5 for signifi-cance level and 95% for confidence intervals. Simple
descriptive analysis was used. Pearson’s correlation
coef ficient (r ≥0.3) was used to identify the degree
of association between quantitative variables. The
Student’s t-test for non-related samples was used to
determine the degree of association between depen-
dent variables (quantitative) and qualitative variables.
Analysis of variance (ANOVA) was employed for
qualitative variables with three or more categories.
Multiple linear regression was used to identify inde-
pendent associations after the preliminary analysis. The
significance level for all statistical tests was set at 0.05.
The variance inflation factor was also estimated.
The study was approved by Research Ethics Committee
at the Universidade Federal de São Paulo.
7/30/2019 Fatores Associados a Qualidade de Vida e IDOSOS
http://slidepdf.com/reader/full/fatores-associados-a-qualidade-de-vida-e-idosos 4/9
616 Quality of life in active elderly Alexandre TS et al
RESULTS
The sample was characterized by a female majority
(85.8%) with mean age of 69 years (standard deviation
[SD]=5), ranging between 60 and 89 years old. Most
elderly had a conjugal life (39.2%); among those who
did not have a conjugal life, 38.3% were widowed.
Subjects had an average of 9.94 years of schooling
(SD=4.93); 24.2% of them had university education.
There were no illiterate subjects in the sample, as literacy
is a prerequisite for enrolment at the open university. In
regard to the family structure, 69.3% resided with family
members. The average monthly income was US$ 687.76
(SD=601.66), 55.8% of the elderly subjects interviewed
had health insurance and 80.8% were homeowners.
The study subjects reported having sought the university
for reasons of occupying their free time and socialization
(55.8%), intellectual improvement (28.3%), or to addressa health or family-related problem (15.8%). When asked
about leisure, 92.5% engaged in leisure activities and
66.7% in trips and social activities. There was a prefer-
ence for group (48.3%) and outdoor activities (56.7%).
The average number of reported comorbidities was 5.62
illnesses (SD=2.96). Dyslipidemia was the most preva-
lent condition (49.2%), followed by systemic arterial
hypertension (46.7%), peripheral venous insuf ficiency
(45.8%), and osteoarthritis (39.2%). Seventy-five per
cent had osteoarticular pain, showing an average of
2.47 centimeters on the pain visual analogue scale.Only one elderly subject was a smoker (0.8% of the
sample). Only 11.7% of the elderly studied reported
having been hospitalized in the previous six months
and 85.8% made use of medications.
Vision and hearing abilities were self-reported as
“good” or “excellent” by 70.8% and 65% of the elderly,
respectively. Twenty-eight per cent of the subjects
had suffered falls in the previous six months, 49.2%
reported fear of falling and 1.7% made use of gait
assistive devices.
Mean BMI of the elderly studied was 27.06 kg/m 2
(SD=4.86). Forty-four per cent were classified as
overweight and 13.3% were low weight.
Of all, 67.5% engaged in physical activity, 41.7%
engaged in physical activities from one to four times
per week, with duration of thirty minutes to one hour
per session.
The average MMSE score was 28.92 points (SD=1.33);
89.2% scored higher than 24 points. The average GDS
score was 6.88 points (SD=5.32); 80.8% scored lower
than 11 points.
On the Functional Reach scale, subjects showed an
average of 27.27 centimeters (SD=4.97). Seventy-one
per cent of them managed to perform the One-Leg
Balance Test.
In the TUGT mobility assessment, subjects performed
the task in an average of 8.10 seconds (SD=1.62) and
99.2% performed it within 13.5 seconds.
On the Six-Minute Walk Test for assessing functional
exercise capacity, the average distance covered was
477.68 meters (SD=65.05).
According to the HAP, 88.3% of the elderly subjects
were classified as “above average”. With respect to
physical activity, 81.7% were classified as “moder-
ately active” and 7.5% as “active”. The HAP score
indicated that 70% of the elderly were “better than the
chronological age”.
The preliminary analysis showed a negative correla-
tion between the physical (–0.499), psychological
(–0.632), social relations (–0.551) and environment
(–0.582) domains of the WHOQOL-bref questionnaire
and the GDS.
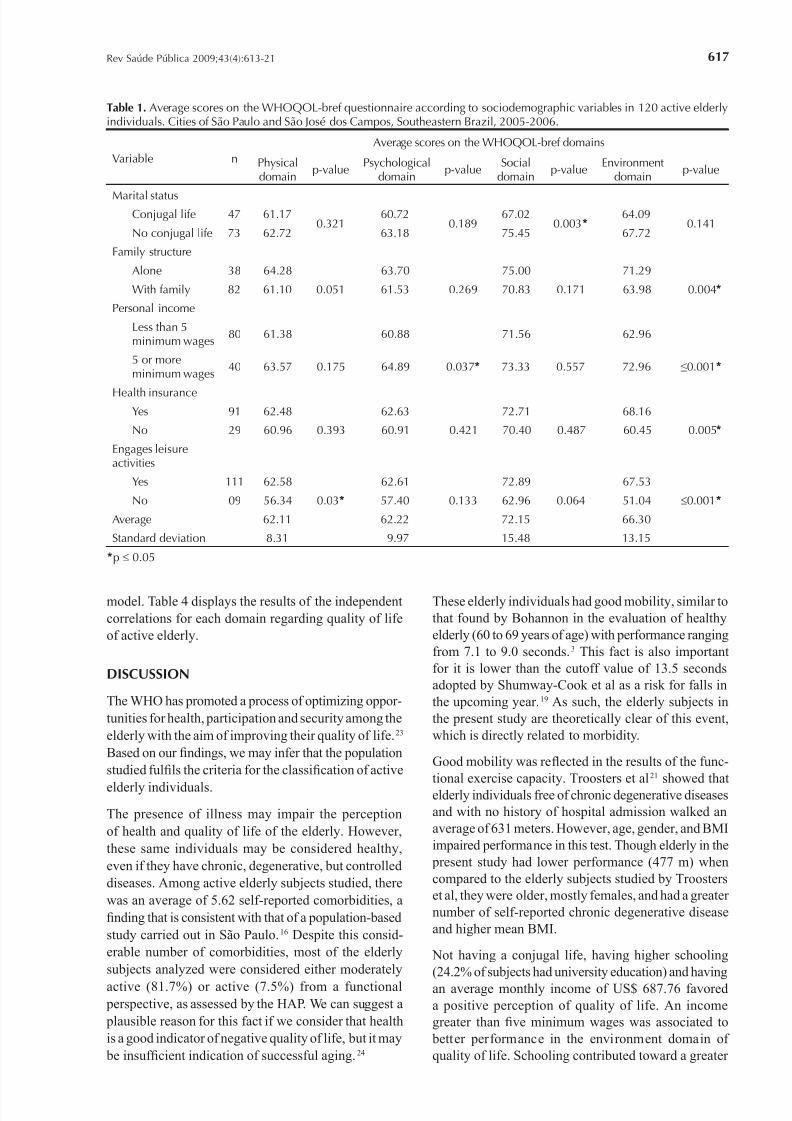
Not having a conjugal life was associated to better
performance in the social relationships domain of the
WHOQOL-bref questionnaire. Living alone, having a
personal income of more than five monthly minimum
wages, having health insurance and engaging in leisure
activities were associated to better performance in the
environment domain of the WHOQOL-bref question-
naire as show in Table 1.
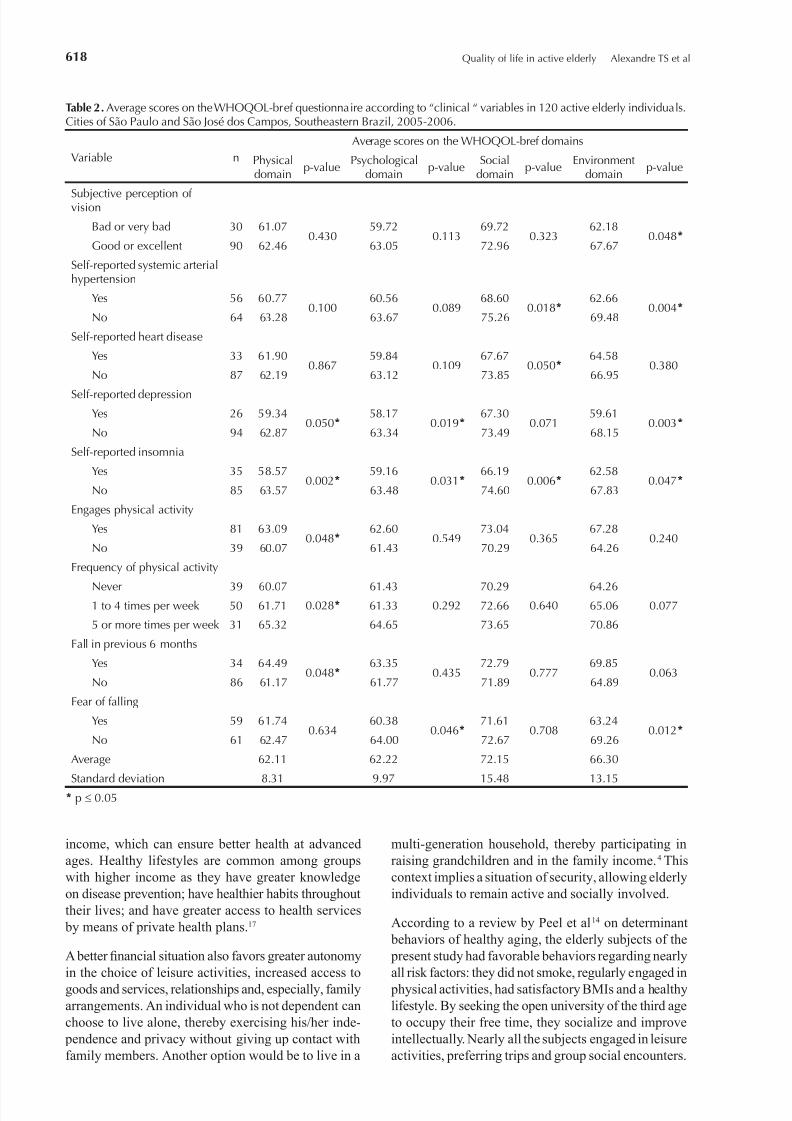
Self-reported vision and hearing classified as “good” or
“excellent” was associated to better performance in theenvironment domain of the WHOQOL-bref question-
naire. Engaging in physical activities was associated to
the physical domain of the WHOQOL-bref; subjects
who engaged in physical activities five or more times
per week scored higher in this domain. Having reported
suffering a fall in the previous six months was associ-
ated to worse performance in the physical domain of
the WHOQOL-bref. Those who reported having fear of
falling scored lower in the psychological and environ-
ment domains as shown in Table 2.
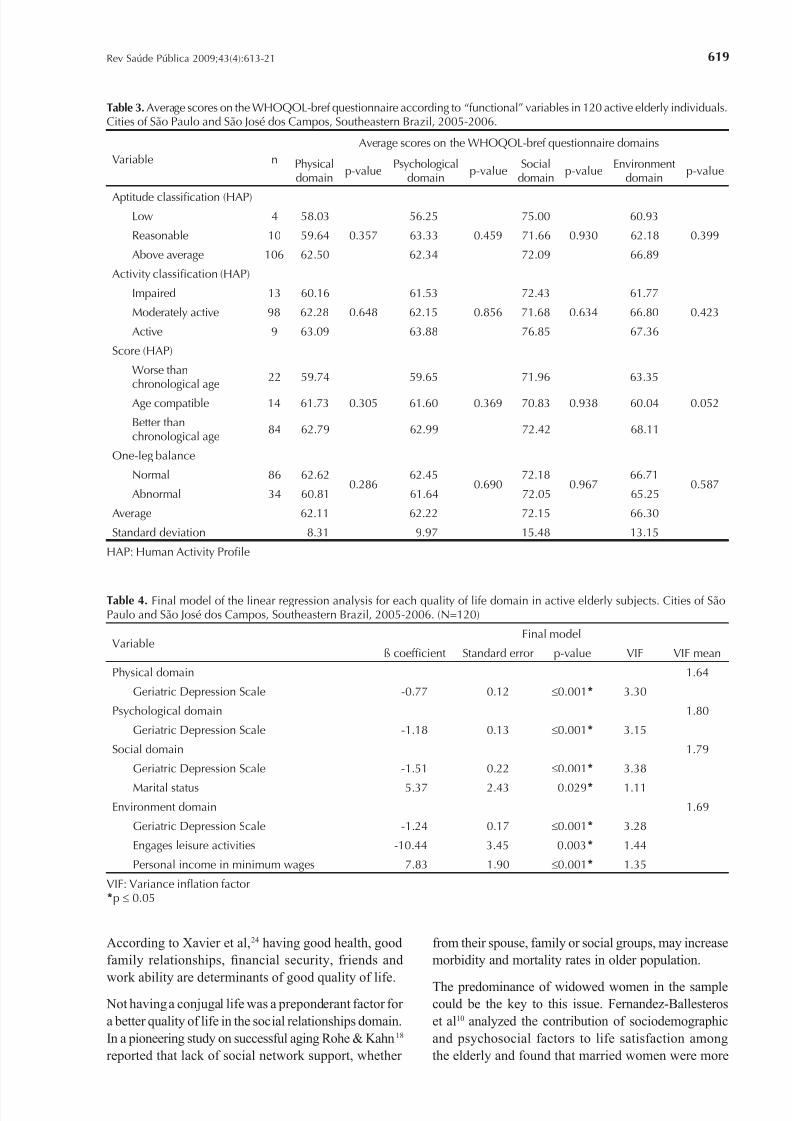
The elderly who were classified as “above average”
showed better performance in the physical andenvironment domains of the WHOQOL-bref. The
subjects showing the best performance in the physical,
psychological, social, and environment domains of the
WHOQOL-bref were those classified as “better than
chronological age” based on HAP (Table 3). In addition,
Table 3 shows the average scores on the WHOQOL-bref
questionnaire according to functional variables.
For the multiple linear regression analysis the clinical
variable “frequency of physical activity” was recat-
egorized before grouping the remaining variables in
the statistical procedure.
The variance inflation factor was estimated to exclude
the possibility of overlapping of highly-correlated inde-
pendent variables. Values between 0.19 and 5.30 denote
no colinearity between the variables in the regression
7/30/2019 Fatores Associados a Qualidade de Vida e IDOSOS
http://slidepdf.com/reader/full/fatores-associados-a-qualidade-de-vida-e-idosos 5/9
617Rev Saúde Pública 2009;43(4):613-21
model. Table 4 displays the results of the independent
correlations for each domain regarding quality of life
of active elderly.
DISCUSSION
The WHO has promoted a process of optimizing oppor-
tunities for health, participation and security among the
elderly with the aim of improving their quality of life.23
Based on our findings, we may infer that the population
studied fulfils the criteria for the classification of active
elderly individuals.
The presence of illness may impair the perception
of health and quality of life of the elderly. However,
these same individuals may be considered healthy,
even if they have chronic, degenerative, but controlled
diseases. Among active elderly subjects studied, there
was an average of 5.62 self-reported comorbidities, a
finding that is consistent with that of a population-based
study carried out in São Paulo.16 Despite this consid-
erable number of comorbidities, most of the elderly
subjects analyzed were considered either moderately
active (81.7%) or active (7.5%) from a functional perspective, as assessed by the HAP. We can suggest a
plausible reason for this fact if we consider that health
is a good indicator of negative quality of life, but it may
be insuf ficient indication of successful aging.24
These elderly individuals had good mobility, similar to
that found by Bohannon in the evaluation of healthy
elderly (60 to 69 years of age) with performance ranging
from 7.1 to 9.0 seconds.3 This fact is also important
for it is lower than the cutoff value of 13.5 seconds
adopted by Shumway-Cook et al as a risk for falls in
the upcoming year.19 As such, the elderly subjects in
the present study are theoretically clear of this event,
which is directly related to morbidity.
Good mobility was reflected in the results of the func-
tional exercise capacity. Troosters et al21 showed that
elderly individuals free of chronic degenerative diseases
and with no history of hospital admission walked an
average of 631 meters. However, age, gender, and BMI
impaired performance in this test. Though elderly in the
present study had lower performance (477 m) when
compared to the elderly subjects studied by Troosters
et al, they were older, mostly females, and had a greater
number of self-reported chronic degenerative disease
and higher mean BMI.
Not having a conjugal life, having higher schooling
(24.2% of subjects had university education) and having
an average monthly income of US$ 687.76 favored
a positive perception of quality of life. An income
greater than five minimum wages was associated to
better performance in the environment domain of
quality of life. Schooling contributed toward a greater
Table 1. Average scores on the WHOQOL-bref questionnaire according to sociodemographic variables in 120 active elderlyindividuals. Cities of São Paulo and São José dos Campos, Southeastern Brazil, 2005-2006.
Variable n
Average scores on the WHOQOL-bref domains
Physicaldomain
p-valuePsychological
domainp-value
Socialdomain
p-valueEnvironment
domainp-value
Marital statusConjugal life 47 61.17
0.32160.72
0.18967.02
0.003*64.09
0.141No conjugal life 73 62.72 63.18 75.45 67.72
Family structure
Alone 38 64.28 63.70 75.00 71.29
With family 82 61.10 0.051 61.53 0.269 70.83 0.171 63.98 0.004*
Personal income
Less than 5minimum wages
80 61.38 60.88 71.56 62.96
5 or moreminimum wages
40 63.57 0.175 64.89 0.037* 73.33 0.557 72.96 ≤0.001*
Health insuranceYes 91 62.48 62.63 72.71 68.16
No 29 60.96 0.393 60.91 0.421 70.40 0.487 60.45 0.005*
Engages leisureactivities
Yes 111 62.58 62.61 72.89 67.53
No 09 56.34 0.03* 57.40 0.133 62.96 0.064 51.04 ≤0.001*
Average 62.11 62.22 72.15 66.30
Standard deviation 8.31 9.97 15.48 13.15
*p ≤ 0.05
7/30/2019 Fatores Associados a Qualidade de Vida e IDOSOS
http://slidepdf.com/reader/full/fatores-associados-a-qualidade-de-vida-e-idosos 6/9
618 Quality of life in active elderly Alexandre TS et al
income, which can ensure better health at advanced
ages. Healthy lifestyles are common among groups
with higher income as they have greater knowledge
on disease prevention; have healthier habits throughout
their lives; and have greater access to health services
by means of private health plans.17
A better financial situation also favors greater autonomy
in the choice of leisure activities, increased access to
goods and services, relationships and, especially, family
arrangements. An individual who is not dependent can
choose to live alone, thereby exercising his/her inde-
pendence and privacy without giving up contact with
family members. Another option would be to live in a
multi-generation household, thereby participating in
raising grandchildren and in the family income.4 This
context implies a situation of security, allowing elderly
individuals to remain active and socially involved.
According to a review by Peel et al14 on determinant
behaviors of healthy aging, the elderly subjects of the
present study had favorable behaviors regarding nearly
all risk factors: they did not smoke, regularly engaged in
physical activities, had satisfactory BMIs and a healthy
lifestyle. By seeking the open university of the third age
to occupy their free time, they socialize and improve
intellectually. Nearly all the subjects engaged in leisure
activities, preferring trips and group social encounters.
Table 2. Average scores on the WHOQOL-bref questionnaire according to “clinical “ variables in 120 active elderly individuals.Cities of São Paulo and São José dos Campos, Southeastern Brazil, 2005-2006.
Variable n
Average scores on the WHOQOL-bref domains
Physicaldomain
p-valuePsychological
domainp-value
Socialdomain
p-valueEnvironment
domainp-value
Subjective perception of vision
Bad or very bad 30 61.070.430
59.720.113
69.720.323
62.180.048*
Good or excellent 90 62.46 63.05 72.96 67.67
Self-reported systemic arterialhypertension
Yes 56 60.770.100
60.560.089
68.600.018*
62.660.004*
No 64 63.28 63.67 75.26 69.48
Self-reported heart disease
Yes 33 61.900.867
59.840.109
67.670.050*
64.580.380
No 87 62.19 63.12 73.85 66.95
Self-reported depression
Yes 26 59.340.050*
58.170.019*
67.300.071
59.610.003*
No 94 62.87 63.34 73.49 68.15
Self-reported insomnia
Yes 35 58.570.002*
59.160.031*
66.190.006*
62.580.047*
No 85 63.57 63.48 74.60 67.83
Engages physical activity
Yes 81 63.090.048*
62.600.549
73.040.365
67.280.240
No 39 60.07 61.43 70.29 64.26
Frequency of physical activity
Never 39 60.070.028*
61.430.292
70.290.640
64.260.0771 to 4 times per week 50 61.71 61.33 72.66 65.06
5 or more times per week 31 65.32 64.65 73.65 70.86
Fall in previous 6 months
Yes 34 64.490.048*
63.350.435
72.790.777
69.850.063
No 86 61.17 61.77 71.89 64.89
Fear of falling
Yes 59 61.740.634
60.380.046*
71.610.708
63.240.012*
No 61 62.47 64.00 72.67 69.26
Average 62.11 62.22 72.15 66.30
Standard deviation 8.31 9.97 15.48 13.15
* p ≤ 0.05
7/30/2019 Fatores Associados a Qualidade de Vida e IDOSOS
http://slidepdf.com/reader/full/fatores-associados-a-qualidade-de-vida-e-idosos 7/9
619Rev Saúde Pública 2009;43(4):613-21
According to Xavier et al,24 having good health, good
family relationships, financial security, friends and
work ability are determinants of good quality of life. Not having a conjugal life was a preponderant factor for
a better quality of life in the social relationships domain.
In a pioneering study on successful aging Rohe & Kahn18
reported that lack of social network support, whether
from their spouse, family or social groups, may increase
morbidity and mortality rates in older population.
The predominance of widowed women in the samplecould be the key to this issue. Fernandez-Ballesteros
et al10 analyzed the contribution of sociodemographic
and psychosocial factors to life satisfaction among
the elderly and found that married women were more
Table 3. Average scores on the WHOQOL-bref questionnaire according to “functional” variables in 120 active elderly individuals.Cities of São Paulo and São José dos Campos, Southeastern Brazil, 2005-2006.
Variable n
Average scores on the WHOQOL-bref questionnaire domains
Physicaldomain
p-valuePsychological
domainp-value
Socialdomain
p-valueEnvironment
domainp-value
Aptitude classification (HAP)Low 4 58.03
0.357
56.25
0.459
75.00
0.930
60.93
0.399Reasonable 10 59.64 63.33 71.66 62.18
Above average 106 62.50 62.34 72.09 66.89
Activity classification (HAP)
Impaired 13 60.16
0.648
61.53
0.856
72.43
0.634
61.77
0.423Moderately active 98 62.28 62.15 71.68 66.80
Active 9 63.09 63.88 76.85 67.36
Score (HAP)
Worse thanchronological age
22 59.74
0.305
59.65
0.369
71.96
0.938
63.35
0.052Age compatible 14 61.73 61.60 70.83 60.04
Better thanchronological age
84 62.79 62.99 72.42 68.11
One-leg balance
Normal 86 62.620.286
62.450.690
72.180.967
66.710.587
Abnormal 34 60.81 61.64 72.05 65.25
Average 62.11 62.22 72.15 66.30
Standard deviation 8.31 9.97 15.48 13.15
HAP: Human Activity Profile
Table 4. Final model of the linear regression analysis for each quality of life domain in active elderly subjects. Cities of SãoPaulo and São José dos Campos, Southeastern Brazil, 2005-2006. (N=120)
VariableFinal model
ß coefficient Standard error p-value VIF VIF mean
Physical domain 1.64
Geriatric Depression Scale -0.77 0.12 ≤0.001* 3.30
Psychological domain 1.80
Geriatric Depression Scale -1.18 0.13 ≤0.001* 3.15
Social domain 1.79
Geriatric Depression Scale -1.51 0.22 ≤0.001* 3.38
Marital status 5.37 2.43 0.029* 1.11
Environment domain 1.69
Geriatric Depression Scale -1.24 0.17 ≤0.001* 3.28
Engages leisure activities -10.44 3.45 0.003* 1.44
Personal income in minimum wages 7.83 1.90 ≤0.001* 1.35
VIF: Variance inflation factor*p ≤ 0.05

7/30/2019 Fatores Associados a Qualidade de Vida e IDOSOS
http://slidepdf.com/reader/full/fatores-associados-a-qualidade-de-vida-e-idosos 8/9
620 Quality of life in active elderly Alexandre TS et al
satisfied than widowed, single or divorced women.
Also, the level of satisfaction among married women
was associated to higher income and schooling, physical
and leisure activities, and having a better social life and
health. The present study showed similar factors asso-
ciated to a better perception of health in active elderlywomen but it contrasted with regard to marital status.
In Brazil, however, there are anthropological and social
factors that can explain the differences between the data
found in our study and those from other studies. If we
consider that most elderly Brazilian women did not
have paid jobs during their entire lives, were not self-
suf ficient during their youth and adult life and depended
on their spouses, widowhood can means autonomy
and independence from both the financial and social
standpoints. One additional contributing factor is the
widowhood pension they receive, which is proportional
to the last benefits due to their spouse, that combined
with their retirement pension generates a higher income
for these elderly women.7 The average monthly income
of the sample studied was higher among elderly with no
conjugal life (US$ 822.46) than those with a conjugal
life (US$ 473.38). In a closer analysis, we can clearly
see that married subjects had the lowest income (US$
473.38), followed by divorced (US$ 638.60), widowed
(US$ 859.15), and single elderly (US$ 983.19). The
association of all quality of life domains with GDS
scores should be carefully interpreted: despite the
low rate of potential depression cases (19.2%), higher scores on GDS corresponded to lower scores on the
WHOQOL-bref. It is a controversial issue as it is not
yet clear the extent to which subjective measures of
quality of life may be negatively affected by psycho-
pathological symptoms, especially by depression
symptoms, and which quality of life measures can be
considered valid in the presence of these symptoms.
There is measure overlapping in quality of life and
depression constructs. Some of the items of WHOQOL-
bref questionnaire and GDS are similar, such as ques-
tions about the interviewee’s perception of meaning of
life, concentration ability, negative feelings, anxiety,depression, restlessness, mood swings, vitality for daily
living activities and those related to self-confidence. It
shows that quality of life measures are associated to
the severity of depression symptoms.1
Quality of life and depression measures have distinct
evaluative capabilities; GDS assesses the presence or not
of a particular factor indicative a depression symptom,
whereas the WHOQOL-bref assesses the intensity of
an effect or level of satisfaction in a particular situa-
tion and the impact on quality of life. Therefore, the
WHOQOL-bref should be used in combination withan assessment of depression symptoms to determine
whether a quality of life measure is biased by such
symptoms before prematurely coming to any conclu-
sions regarding the quality of life of any individual.1
In the present study, the scores indicative of potential
depression cases were low and the variance inflation
factor revealed that there was no colinearity betweenthe WHOQOL-bref and GDS. This indicates the need
to apply the GDS to active elderly individuals as the
presence of depression may have a significant negative
effect on their quality of life.
Although the WHOQOL-bref has adequate psycho-
metric properties for the elderly population, as
Chachamovich et al5 showed, the instrument does not
address some important aspects the elderly individuals
reported as having an influence on their quality of life
such as relationships with family members, motor or
sensory losses that limit their daily activities, spiritu-ality and social participation. The first two aspects are
assessed in the WHOQOL- bref, but only indirectly
by addressing the relationship with friends, relatives,
acquaintances and locomotion, whereas the third and
fourth aspects are not addressed at all. The WHOQOL
group recognizes the limitations of their instrument
in the assessment of quality of life of the elderly and
has therefore developed the WHOQOL-OLD. It is a
complementary instrument to either the WHOQOL-
bref or the WHOQOL-100, with 24 Likert scale items
addressing the following six components: sensory func-
tioning; autonomy; past, present and future activities;social participation; death and dying; and intimacy.6,12
The WHOQOL-OLD was not used in the present study
for it was not available when the field work began.
As the elderly attending the open university were found
to be functionally and cognitively well, financially
stable, actively participating in the program and seeking
to improve their knowledge, they can be considered
representative of active aging. Depression symptoms,
however, can disrupt this harmonious cycle. Early diag-
nosis and treatment of depression is therefore of vital
importance, as well as evaluations of a multidisciplinaryteam, in order to keep them on the path of functionality
and good quality of life.
It is thus important to investigate other groups of elderly
that belong to senior citizen centers, sports centers for the
elderly and active elderly in the community in an attempt
to assess similarities and differences in the influence of
objective factors such as functional status, as well as
sociodemographic characteristics and psychological
factors on the quality of life of these populations. Further
studies can provide more input to the planning of public
policies that can help improve the quality of life of amuch larger proportion of elderly population.
7/30/2019 Fatores Associados a Qualidade de Vida e IDOSOS
http://slidepdf.com/reader/full/fatores-associados-a-qualidade-de-vida-e-idosos 9/9
621Rev Saúde Pública 2009;43(4):613-21
1. Aigner M, Förster-Streffleur S, Prause W, Freidl M,Weiss M, Bach M. What does the WHOQOL-bref measure? Measurement overlap between qualityof life and depressive symptomatology in chronic
somatoform pain disorder. Soc Psychiatry Psychiatr Epidemiol . 2006;41(1):81-6.
2. ATS Committee on Proficiency Standards for ClinicalPulmonary Function Laboratories. ATS statement:guidelines for the six-minute walk test. Am J Crit CareMed. 2002;166(1):111-7.
3. Bohannon RW. Reference values for the timed up andgo test: a descriptive meta-analysis. J Geriatric PhysTher . 2006;29(2):64-8.
4. Camargos MCS, Machado CJ, Rodrigues RN. A relaçãoentre renda e morar sozinho para idosos paulistanos –2000. R Bras Estud Poulp. 2007;24(1):37-51.
5. Chachamovic E, Trentini C, Fleck MP. Assessment of the psychometric performance of the WHOQOL-BREFinstrument in a sample of Brazilian older adults. Int Psychogeriatr . 2007;19(4):635-46. DOI: 10.1017/ S1041610206003619
6. Chachamovich E, Fleck MP, Trentini C, PowerM. Brazilian WHOQOL-OLD Module version: aRasch analysis of a new instrument. Rev SaudePublica. 2008;42(2):308-16. DOI: 10.1590/S0034-89102008000200017
7. Debert GG. A reinvenção da velhice: socialização eprocessos de reprivatização do envelhecimento. SãoPaulo: Edusp; 1999.
8. Duncan PW, Weiner DK, Chandler J, Studenski S.Functional Reach: a new clinical measure of balance. J Geront . 1990;45(6):M192-7.
9. Farquhar M. Definitions of quality of life; a taxonomy. J Adv Nurs. 1995;22(3):502-8. DOI: 10.1046/j.1365-2648.1995.22030502.x
10. Fernández-Ballesteros R, Zamarrón MD, Ruiz MA. Thecontribution of socio-demographic and psychosocialfactors to life satisfaction. Aging Soc. 2001;21(1):25-43.
11. Fleck MP, Louzada S, Xavier M, Chachamovich E,Vieira G, Santos L, et al. Aplicação da versão emportuguês do instrumento abreviado de avaliação
da qualidade de vida “WHOQOL-bref”. Rev SaudePublica. 2000;34(2):178-83. DOI: 10.1590/S0034-89102000000200012.
12. Fleck MP, Chachamovich E, Trentini C. Developmentand validation of the Portuguese version of theWHOQOL-OLD module. Rev Saude Publica.2006;40(5):785-91. DOI: 10.1590/S0034-89102006000600007
13. Lipschitz DA. Screening for nutritional status in theelderly. Primary Care. 1994;21(1):55-67.
14. Peel NM, McClure RJ, Bartlett HP. Behavioraldeterminants of healthy aging. Am J Prev Med . 2005;28(3):298-304. DOI: 10.1016/j.amepre.2004.12.002
15. Podsiadlo D, Richardson S. The timed “Up & Go”:a test of basic functional mobility for frail elderlypersons. J Am Geriatr Soc. 1991;39(2):142-8.
16. Ramos LR. Fatores determinantes do envelhecimentosaudável em idosos residentes em centrourbano: Projeto Epidoso, São Paulo. Cad SaudePublica. 2003;19(3):793-8. DOI: 10.1590/S0102-311X2003000300011
17. Ramos MP. Apoio social e saúde entre idosos.Sociologias. 2002;(7):56-175. DOI: 10.1590/S1517-45222002000100007
18. Rowe JW, Kahn RL. Human aging: usual and succesful.
Science. 1987;237(4811):143-9. DOI: 10.1126/ science.3299702
19. Shumway-Cook A, Brauer S, Woollacott M. Predictingthe probability for falls in community-dwelling olderadults using the Timed Up and Go Test. Phys Ther .2000;80(9):896-903.
20. Souza CS, Magalhães LC, Teixeira-Salmela LF.Adaptação transcultural e análise das propriedadespsicométricas da versão brasileira do Perfilde Atividade Humana. Cad Saude Publica.2006;22(12):2623-36. DOI: 10.1590/S0102-311X2006001200012
21. Troosters T, Gosselink R, Decramer M. Six minutewalking distance en health elderly subjects. Eur Resp J . 1999;14(2):270-4. DOI: 10.1034/j.1399-3003.1999.14b06.x
22. Vellas BJ, Wayne SJ, Romero L, Baumgartner RN,Rubenstein LZ, Garry PJ. One-leg balance is animportant predictor of injurious falls in older persons. J
Am Geriatr Soc. 1997;45(6):735-8.
23. World Health Organization. NoncommunicableDiseases and Mental Health Cluster.Noncommunicable Disease Prevention and HealthPromotion Department. Aging and Life Course. Activeaging: a policy framework. Geneva; 2002. (WHO/
NMH/NPH/02.8)
24. Xavier FMF, Ferraz MPT, Marc N, Escosteguy NU,Moriguchi EH. Elderly people’s definition of quality of life. Rev Bras Psiquiat . 2003;25(1):31-9. DOI: 10.1590/ S1516-44462003000100007
25. Yesavage JA, Brink TL, Rose TL, Lum O, Huang V,Adey MB, Leirer VO. Development and validation of a geriatric depression screening scale: a preliminaryreport. J Psychiatric Res. 1983;17(1):37-49. DOI:10.1016/0022-3956(82)90033-4
REFERENCES
Article based on Alexandre TS’s Master’s dissertation, presented to Universidade Federal de São Paulo in 2007.Alexandre TS was supported by Fundação de Amparo à Pesquisa do Estado de São Paulo (FAPESP, Process N. 05/57266-6;Master’s scholarship).