
Growing momentum of the omnichannel Brasil ... - Carrefour RI
26
Growing momentum of the omnichannel ecosystem in Q1 Noël Prioux, Grupo Carrefour Brasil CEO 1 Grupo Carrefour Brasil Q3 and 9M 2019 Results November 07, 2019 1
Transcript of Growing momentum of the omnichannel Brasil ... - Carrefour RI

Growing momentum of the omnichannel
ecosystem in Q1
Noël Prioux, Grupo Carrefour Brasil CEO
1
Grupo Carrefour Brasil
Q3 and 9M 2019 Results
November 07, 2019
1

Significant advances in our ecosystem
Noël Prioux – Grupo Carrefour Brasil CEO
2

New advances in our ecosystem in Q3
F O O D
T R A N S I T I O N
ORGANIC NET SALES
+ 22.2%VS. Q3 18
PRIVATE LABEL NET SALES
+ 30.0%VS. Q3 18
* Without purchase in previous 12 months at Carrefour
F I N A N C I A L
S E R V I C E S
TOTAL
BILLINGS
+ 30.6%VS. Q3 18
NEW VALUE
PROPOSITION FOR CRF CARD
STORES
9M
E X P A N S I O N
+2
+3
+12
ECOMM
SIDE STORES
+5
+17
NEW CLIENTS VIA RAPPI*
FOOD GMV INCL. RAPPI VS. Q3 18
O M N I C H A N N E L
CARINA AI14 CHANNELS
TRANSFORMED INTO
1 CUSTOMER SERVICE
106(6 in Q3 19)
28(11 in Q3 19)
+40%
+562%
A C Q U I S I T I O N S
49%stake
100%stake
Last Mile delivery
P A R T N E R S H I P S
Autonomous store
Data analysis
Supermarket
management in BH
3
+0
+2
+3
Q3 19+5
9M Q3 19

Q3 and 9M Financial Highlights
Sebastien Durchon, CFO
4

Q3 and 9M 2019: Solid and sustainable growth, driven by the strength of our ecosystem
5
1 – Pre IFRS 16
GROSS SALESINC. PETROL
ADJUSTED
EBITDA¹ADJ. NET INCOME¹
GROUP SHARE
NET DEBT AND
LEVERAGE1
R$15.1bn
+8.4%
R$1.1bn
+7.2%
7.7% EBITDA margin
R$448mn
+14.7%
3.3% MarginQ3
20
19
R$2.2 billion excluding discounted receivables and
lease debt
0.5x Net Debt/LTM
Adj. EBITDA
R$ 4.4 billionincluding discounted receivables, but
excluding lease debt
9M
19 R$44.6 bn
+10.0%
R$ 3.1bn
+11.9%
7.6% EBITDA margin
R$ 1.3 bn
+13.9%
3.2% Margin

Consumption environment remained challenging in Q3
6
-3.9% -3.8%-4.3% -4.7%
-3.8%
0.1% 0.3%
1.5% 2.2%
3.3%4.4% 4.5%
4.4%
6.3%
8.7% 9.1%
7.8%
4.1%4.7% 4.5%
3.8%
Jan Feb Mar Apr May Jun Jul Aug Sep Oct Nov Dec
2018 2019
-4.0% -2.8%1.3%
4.1%
6.5%7.0%
IPCA FOOD AT HOME (IBGE)
•IPCA Food at Home inflation index decelerated to +4.3% in Q3 vs. +7.0% in Q2
• On a monthly basis, September showed deflation of -0.04%, suggesting moremoderate food inflation for the rest of the year
4.3%Value
+2. 7%
Volume
-2. 1%
Units
-4,. 5%
-
0. 7%
-
3. 9%
4. 2%
5. 1%
Volume b y visit
Frequency
A verag e ticket
A verag e price
•Unemployment is falling but remains high, and household revenue is increasingslower than inflation, directly impacting consumption, notably for lower-incomeconsumers.
• Household consumption decreased both in frequency and in volume by visit.
% UNEMPLOYMENT RATE (IBGE)
13.1%
12.4%
11.9% 11.6%
12.7%
12.0%
11.8%
Q1 18 Q2 18 Q3 18 Q4 18 Q1 19 Q2 19 Q3 19
LASTEST KANTAR DATA
Source: IBGE and Kantar

0.4%
3.4%5.1%
6.2% 6.6% 7.7%
3.8% 3.0%
6.0%3.7%
4.0%
4.1%
4.6%4.7%
5.0%
5.0%
3.8%
4.9%
6.0%
5.4%
8.3%
10.9%9.9%
13.5%
8.9%
6.6%
10.8%
Q1 18 Q2 18 Q3 18 Q4 18 Q1 19 Q2 19 Q3 19 9M 18 9M 19
LFL Expansion
64.3% 66.8% 67.8% 67.6% 67.1% 67.9% 68.1%
66.3%67.7%
35.7% 33.2% 32.2%32.4% 32.9% 32.1% 31.9%
32.7%
32.3%
13.0 13.5 14.015.8
14.2 15.3 15.1
40.5
44.6
Q1 18 Q2 18 Q3 18 Q4 18 Q1 19 Q2 19 Q3 19 9M 18 9M 19
Atacadão Retail
1 Includes calendar effect
Solid sales performance driven by Retail and expansion in Cash & Carry
+R$1.1 bn
GROSS SALES (R$ bn)
(including petrol)
SALES GROWTH1
(excluding petrol)
7
+R$4.1 bn

SOLID GROWTH IN NET SALES:
Strong quarterly performance. Net sales up 8.1% in Q3 19 and 9.8% in9M19.
DOUBLE DIGIT INCREASE IN GROSS PROFIT:
+10.4% in Q3 2019 and +11.7% in 9M 2019, reflecting better margins atCarrefour Retail and Banco Carrefour. Gross margin was 44bps higher inQ3 and 39bps higher in 9M. Gross margin at Carrefour Retail was +84 bpsin Q3, Atacadão’s margin was -36bps.
SG&A EXPENSES BRADLY STABLE AS % OF NET SALES:
SG&A expenses remained almost unchanged as a percentage of salesboth in Q3 and 9M, reflecting our ability to improve efficiency in order tocompensate all the investments in Cash & Carry store openings andomnichannel initiatives.
FINANCIAL RESULTS:
Net financial result increased to 109 million on higher interests onprovisions related to basic products provision booked in Q2.
STRONG RISE IN ADJUSTED NET INCOME:
Group share +14.7% to R$448 million in Q3 19. +13.9% to R$1,280million in 9M 19.
Q3 19 Q3 18 ∆% 9M 19 9M 18 ∆%
NET SALES 13,776 12,738 8.1% 40,505 36,901 9.8%
GROSS PROFIT 3,059 2,772 10.4% 8,929 7,991 11.7%
GROSS MARGIN 22.2% 21.8% +44 bps 22.0% 21.7% +39 bps
SG&A EXPENSES (2,003) (1,788) 12.0% (5,850) (5,243) 11.6%
SG&A AS % OF NET SALES
14.5% 14.0% +50 bps 14.4% 14.2% +23 bps
ADJUSTED EBITDA 1,062 991 7.2% 3,097 2,768 11.9%
ADJ. EBITDA MARGIN 7.7% 7.8% -7 bps 7.6% 7.5% +14 bps
NET FINANCIAL RESULT (109) (77) 41.6% (299) (258) 15.9%
ADJ. NET INCOME, GROUP SHARE
448 391 14.7% 1,280 1,124 13.9%
ADJ. NET MARGIN 3.3% 3.1% +19 bps 3.2% 3.0% +12 bps
Q3 and 9M financial highlights demonstrate the strength of our business model
(in R$ million)
8
Pre IFRS 16

Business units update
Roberto Mussnich – Atacadão CEOLuis Moreno – Carrefour Retail CEOPaula Cardoso - Carrefour eBusinner Brasil (CeBB) CEOCarlos Mauad – Banco Carrefour CEO
9

• +9.0% total growth in Q3 and +12.3% in 9M, demonstrating the strength of our brand, our positioning and the decision to accelerate expansionsignificantly
• Gross margin pre-IFRS 16 at 15.1% reflecting: (i) a tough comparable base due to a positive exceptional impact in July 2018 from the May truckers’strike, (ii) market contraction; and (iii) continuous attention to market competiveness, with a strategic decision to maintain our price leadership
• Adjusted EBITDA margin pre-IFRS 16 at 6.7% in Q3 (-76bps) reflecting the same trends that impacted gross margin
4.9% 4.3%
7.4%5.4% 5.1%
7.3%5.5% 6.0% 6.9%
6.3%
0.5%
6.8%
4.9% 4.5%
7.6%
1.6%
6.2%1.8%
9.9%
5.7%
13.6%
9.7%8.4%
14.8%
5.6%
11.2%
9.0%
Q1 17 Q1 18 Q1 19 Q2 17 Q2 18 Q2 19 Q3 17 Q3 18 Q3 19
Expansion LFL ex-petrol
SALES PERFORMANCE
1,335 1,420
3,716 4,224
15.5% 15.1% 15.2%15.4%
Q3 18 Q3 19 9M 18 9M 19
-36 bps
GROSS PROFIT*(R$Mn and % of Net Sales)
+6.4%
Atacadão: Expansion strategy supports sales growth
1 0
+18 bps
+13.7%
* Pre-IFRS 16

• +12 new stores in 9M 19
• +3 in October, 15 year-to-date
• Openings well distributed in 9 different states
• Capacity to adapt the format to new markets
• First Atacadão store in Curitiba (Paraná State) with new swallow-shaped architectural model
Atacadão: Expansion on track to meet the full-year target of 20 new stores
1 1
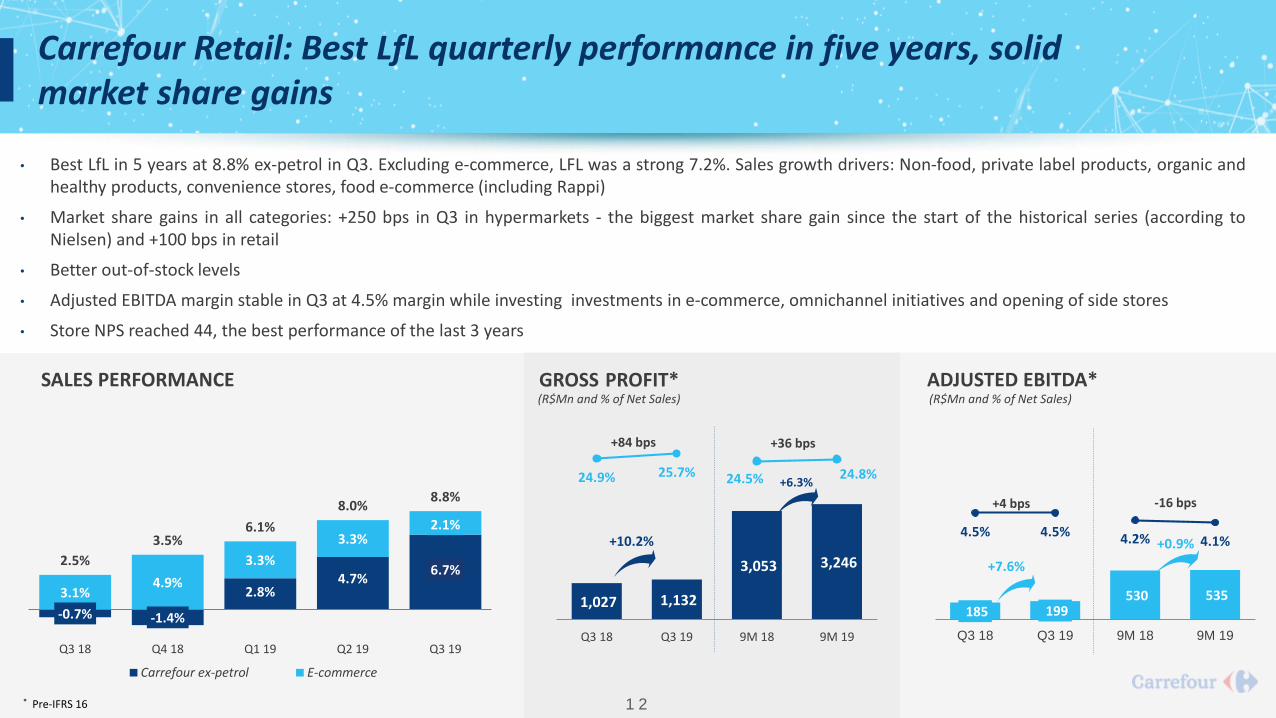
• Best LfL in 5 years at 8.8% ex-petrol in Q3. Excluding e-commerce, LFL was a strong 7.2%. Sales growth drivers: Non-food, private label products, organic andhealthy products, convenience stores, food e-commerce (including Rappi)
• Market share gains in all categories: +250 bps in Q3 in hypermarkets - the biggest market share gain since the start of the historical series (according toNielsen) and +100 bps in retail
• Better out-of-stock levels
• Adjusted EBITDA margin stable in Q3 at 4.5% margin while investing investments in e-commerce, omnichannel initiatives and opening of side stores
• Store NPS reached 44, the best performance of the last 3 years
SALES PERFORMANCE
Carrefour Retail: Best LfL quarterly performance in five years, solid market share gains
1 2
ADJUSTED EBITDA*
185 199 530 535
4.5% 4.5% 4.2% 4.1%
0.0%
1.0%
2.0%
3.0%
4.0%
5.0%
6.0%
7.0%
8.0%
9.0%
Q3 18 Q3 19 9M 18 9M 19
+7.6%
+0.9%
(R$Mn and % of Net Sales)
+4 bps -16 bps
* Pre-IFRS 16
1,027 1,132
3,053 3,246
24.9% 25.7% 24.5% 24.8%
Q3 18 Q3 19 9M 18 9M 19
(R$Mn and % of Net Sales)
+84 bps
GROSS PROFIT*
+36 bps
-0.7% -1.4%
2.8%4.7%
6.7%
3.1%4.9%
3.3%
3.3%2.1%
2.5%
3.5%6.1%
8.0%8.8%
Q3 18 Q4 18 Q1 19 Q2 19 Q3 19
Carrefour ex-petrol E-commerce
+10.2%
+6.3%
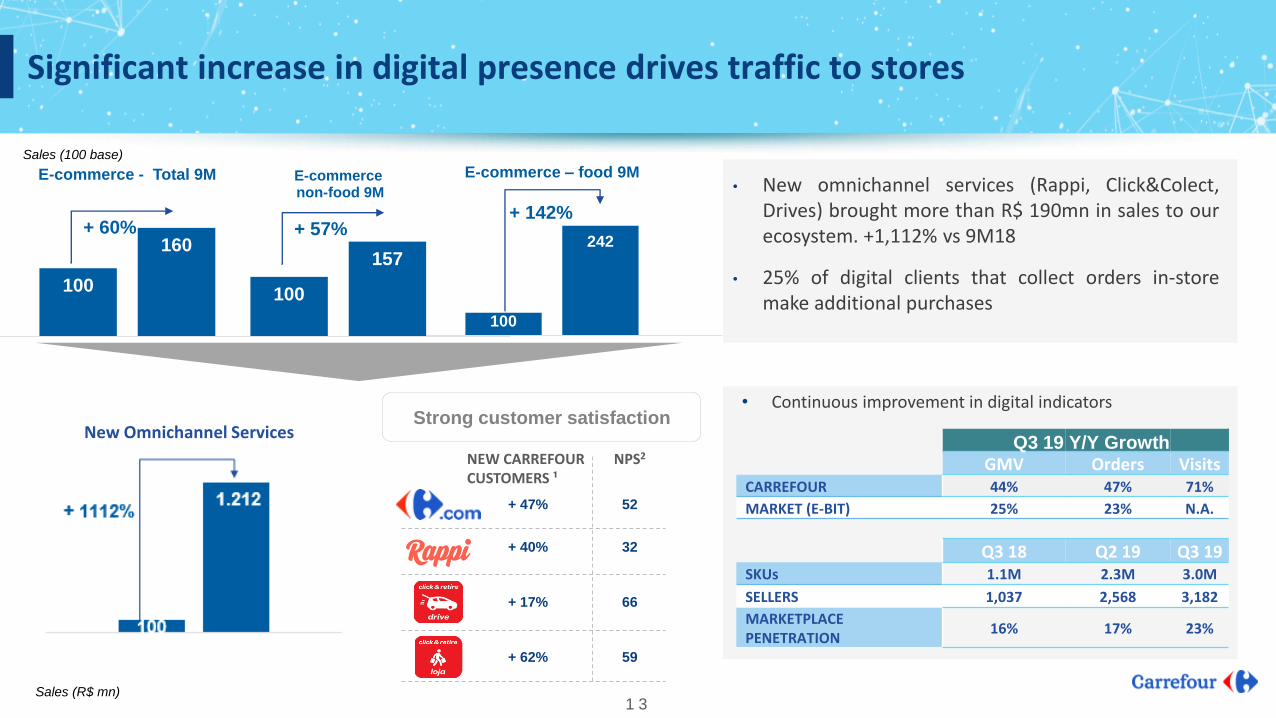
Significant increase in digital presence drives traffic to stores
1 3
Sales (100 base)
Sales (R$ mn)
• Continuous improvement in digital indicatorsStrong customer satisfaction
NEW CARREFOUR CUSTOMERS ¹
NPS2
+ 40% 32
+ 47% 52
+ 17% 66
+ 62% 59
GMV Orders VisitsCARREFOUR 44% 47% 71%
MARKET (E-BIT) 25% 23% N.A.
Q3 18 Q2 19 Q3 19SKUs 1.1M 2.3M 3.0M
SELLERS 1,037 2,568 3,182
MARKETPLACE PENETRATION
16% 17% 23%
Q3 19 Y/Y Growth
100
242
1
E-commerce – food 9M
+ 142%
100
157
1
E-commerce non-food 9M
+ 57%
100
160
1
E-commerce - Total 9M
+ 60%
New Omnichannel Services
• New omnichannel services (Rappi, Click&Colect,Drives) brought more than R$ 190mn in sales to ourecosystem. +1,112% vs 9M18
• 25% of digital clients that collect orders in-storemake additional purchases
1 4
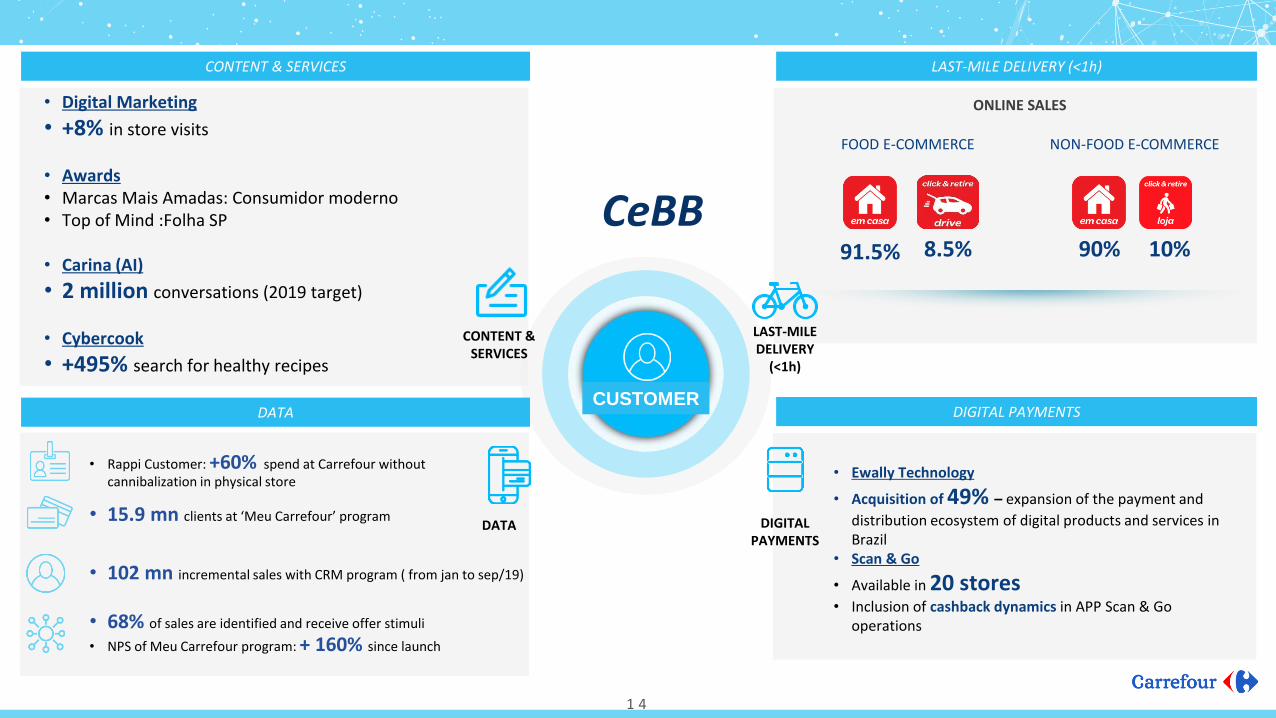
DIGITAL PAYMENTSDATA
• Rappi Customer: +60% spend at Carrefour without cannibalization in physical store
• 15.9 mn clients at ‘Meu Carrefour’ program
• 102 mn incremental sales with CRM program ( from jan to sep/19)
• 68% of sales are identified and receive offer stimuli
• NPS of Meu Carrefour program: + 160% since launch
LAST-MILE DELIVERY (<1h)
ONLINE SALES
FOOD E-COMMERCE NON-FOOD E-COMMERCE
91.5% 8.5% 90% 10%
CONTENT & SERVICES
CUSTOMER
CONTENT & SERVICES
DATA DIGITAL PAYMENTS
LAST-MILE DELIVERY
(<1h)
CeBB
• Ewally Technology
• Acquisition of 49% – expansion of the payment and
distribution ecosystem of digital products and services in Brazil
• Scan & Go
• Available in 20 stores• Inclusion of cashback dynamics in APP Scan & Go
operations
• Digital Marketing
• +8% in store visits
• Awards• Marcas Mais Amadas: Consumidor moderno• Top of Mind :Folha SP
• Carina (AI)
• 2 million conversations (2019 target)
• Cybercook
• +495% search for healthy recipes

6,433 6,625 6,887 7,690 7,947 8,430 9,002
200 380 533 692 889
1,099 1,285
6,633 7,005
7,420 8,382 8,836
9,529 10,287
Q1 18 Q2 18 Q3 18 Q4 18 Q1 19 Q2 19 Q3 19
Bacen Methodology IFRS 9 Adjustment
4,846 5,936
14,026 16,771
1,496 2,349
4,013
6,244
93 119
269
360
6,434 8,404
18,309
23,375
Q3 18 Q3 19 9M 18 9M 19
Carrefour Credit Card Billings Atacadão Credit Card Billings Other Products
+30.6%
ACTIVITY (Carrefour and Atacadão Credit Card Billings)
(R$ Million)
ADJUSTED EBITDA(R$ Million)
211 252 192 268
622 765
Q2 18 Q2 19 Q3 18 Q3 19 9M 18 9M 19
+23.0%
• Record growth rate of 22.5% in Q3 for Carrefour credit card billings reflects previous investments inour operation, especially in our products, channels and teams
• Credit portfolio continues its solid performance
• Adjusted EBITDA +39.6% to R$268 million in Q3 2019
• Atacadão credit card billings accounted for 28% of total in September
• Acquisiton of 49% of fintech E-wally: First step towards launch of digital account
Coverage Ratio
12.6% 12.1% 13.0% 11.7%
CREDIT PORTFOLIO (R$ Million)
Banco Carrefour: Consistent high growth in billings and credit portfolio
11.2%
1 5
+27.7%
+19.4%
+39%
12.2%12.6%
+39.6%
11.5%

Banco Carrefour: Focusing on technology, experience and convenience for the customer
New checkout experiences in Carrefour Storesincluding QR Code, Virtual Card in App and atCarrefour e-commerce, Carrefour Pay NFC andpresence on Google and Samsung Pay
Focus on digital acquisition and digitalawareness, increasing four-fold the volume ofnew accounts and delivering a completely newonboarding process using PWA
At Atacadão, rollout of the new Benefits Programand new driver of card sales
New core for the payment ecosystem based ondigital wallet (e-banking), with features like:
■ Consumer e-banking■ Payroll transfers■ Utility bill collection■ Small business e-banking■ Prepaid credit card issuer■ E-banking white label platform
1 6

Closing Remarks
Noel Prioux, Grupo Carrefour Brasil CEO
17

THE MULTIPLIER EFFECT IN OUR ECOSYSTEM
CUSTOMERS STORES SERVICES
MORE CONECTIONS, MORE SALES, MORE PROFITABILITY
+17 new stores
679 total
+ Financial Products
+ Partnerships
+ Healthy and Organic
Products
+ Private Label Products
+ Fast Delivery
Carrefour.com: + 47%
Rappi: + 40%
Click & Collect Drive: +17%
Click & Collect Store: +62%
1 8

Appendix
19

Operating highlights Q3 and 9M 2019 results Pre-IFRS 16
2 0
In R$ millionQ3 19
pre-IFRS 16
Q3 18reported
∆% Q3 19
pre-IFRS 16
Q 18reported
∆% Q3 19
pre-IFRS 16
Q3 18reported
∆% Q3 19
pre-IFRS 16
Q3 18reported
∆% Q3 19
pre-IFRS 16
Q3 18reported
∆%
Gross sales 15,143 13,968 8.4% 10,316 9,467 9.0% 4,827 4,501 7.2%
Gross sales ex petrol 14,442 13,256 8.9% 10,316 9,467 9.0% 4,126 3,789 8.9%
Net sales 13,776 12,738 8.1% 9,378 8,614 8.9% 4,398 4,124 6.6%
Other revenues 907 747 21.4% 33 33 0.0% 115 95 21.1% 759 619 22.6%
Total Revenues 14,683 13,485 8.9% 9,411 8,647 8.8% 4,513 4,219 7.0% 759 619 22.6%
Gross profit 3,059 2,772 10.4% 1,420 1,335 6.4% 1,132 1,027 10.2% 507 410 23.7%
Gross Margin 22.2% 21.8% 44 bps 15.1% 15.5% -36 bps 25.7% 24.9% +84 bps
SG&A Expenses (2,003) (1,788) 12.0% (790) (691) 14.3% (937) (847) 10.6% (240) (218) 10.1% (36) (32) 12.5%
SG&A of Net Sales 14.5% 14.0% 50 bps 8.4% 8.0% +40 bps 21.3% 20.5% +77 bps
Adj. EBITDA 1,062 991 7.2% 632 646 -2.2% 199 185 7.6% 267 192 39.1% (36) (32) 12.5%
Adj. EBITDA Margin 7.7% 7.8% -7 bps 6.7% 7.5% -76 bps 4.5% 4.5% +4 bps
Adj. Net Income, Group share 448 391 14.7%
Adj. Net Income Margin 3.3% 3.1% 19 bps
CONSOLIDATED ATACADÃO CARREFOUR RETAIL BANCO CARREFOUR GLOBAL FUNCTIONS
In R$ million
9M 19pre-IFRS 16
9M 18reported
∆% 9M 19pre-IFRS 16
9M 18reported
∆% 9M 19pre-IFRS 16
9M 18reported
∆% 9M 19pre-IFRS 16
9M 18reported
∆% 9M 19pre-IFRS 16
9M 18reported
∆%
Gross sales 44,582 40,523 10.0% 30,200 26,882 12.3% 14,382 13,641 5.4%
Gross sales ex petrol 42,534 38,394 10.8% 30,200 26,882 12.3% 12,334 11,512 7.1%
Net sales 40,505 36,901 9.8% 27,430 24,424 12.3% 13,075 12,477 4.8%
Other revenues 2,548 2,188 16.5% 100 101 -1.0% 330 280 17.9% 2,118 1,807 17.2%
Total Revenues 43,053 39,089 10.1% 27,530 24,525 12.3% 13,405 12,757 5.1% 2,118 1,807 17.2%
Gross profit 8,929 7,991 11.7% 4,224 3,716 13.7% 3,246 3,053 6.3% 1,459 1,222 19.4%
Gross Margin 22.0% 21.7% +39 bps 15.4% 15.2% +18 bps 24.8% 24.5% +36 bps
SG&A Expenses (5,850) (5,243) 11.6% (2,322) (2,016) 15.2% (2,723) (2,537) 7.3% (696) (600) 16.0% (109) (90) 21.1%
SG&A of Net Sales 14.4% 14.2% +23 bps 8.5% 8.3% +21 bps 20.8% 20.3% +49 bps
Adj. EBITDA 3,097 2,768 11.9% 1,908 1,706 11.8% 535 530 0.9% 763 622 22.7% (109) (90) 21.1%
Adj. EBITDA Margin 7.6% 7.5% +14 bps 7.0% 7.0% -3 bps 4.1% 4.2% -16 bps
Adj. Net Income, Group share 1,280 1,124 13.9%
Adj. Net Income Margin 3.2% 3.0% 12 bps
CONSOLIDATED ATACADÃO CARREFOUR RETAIL BANCO CARREFOUR GLOBAL FUNCTIONS
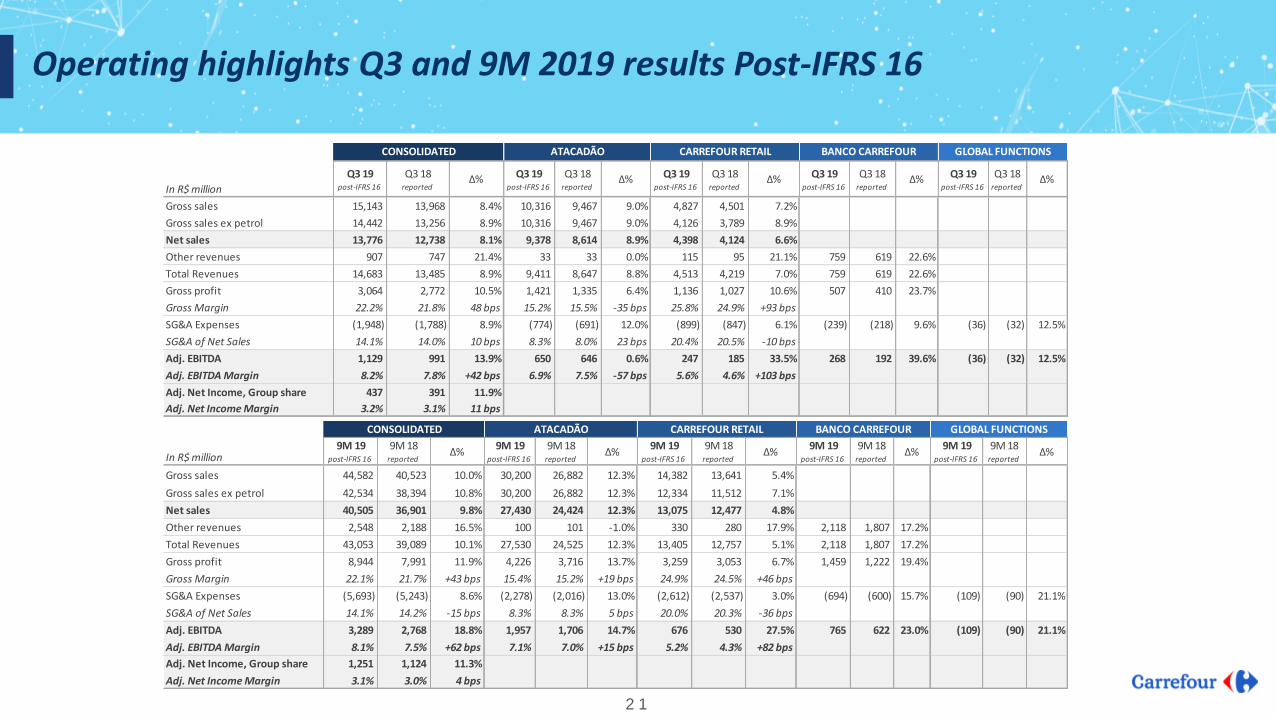
Operating highlights Q3 and 9M 2019 results Post-IFRS 16
2 1
In R$ million
Q3 19post-IFRS 16
Q3 18reported
∆% Q3 19post-IFRS 16
Q3 18reported
∆% Q3 19post-IFRS 16
Q3 18reported
∆% Q3 19post-IFRS 16
Q3 18reported
∆% Q3 19post-IFRS 16
Q3 18reported
∆%
Gross sales 15,143 13,968 8.4% 10,316 9,467 9.0% 4,827 4,501 7.2%
Gross sales ex petrol 14,442 13,256 8.9% 10,316 9,467 9.0% 4,126 3,789 8.9%
Net sales 13,776 12,738 8.1% 9,378 8,614 8.9% 4,398 4,124 6.6%
Other revenues 907 747 21.4% 33 33 0.0% 115 95 21.1% 759 619 22.6%
Total Revenues 14,683 13,485 8.9% 9,411 8,647 8.8% 4,513 4,219 7.0% 759 619 22.6%
Gross profit 3,064 2,772 10.5% 1,421 1,335 6.4% 1,136 1,027 10.6% 507 410 23.7%
Gross Margin 22.2% 21.8% 48 bps 15.2% 15.5% -35 bps 25.8% 24.9% +93 bps
SG&A Expenses (1,948) (1,788) 8.9% (774) (691) 12.0% (899) (847) 6.1% (239) (218) 9.6% (36) (32) 12.5%
SG&A of Net Sales 14.1% 14.0% 10 bps 8.3% 8.0% 23 bps 20.4% 20.5% -10 bps
Adj. EBITDA 1,129 991 13.9% 650 646 0.6% 247 185 33.5% 268 192 39.6% (36) (32) 12.5%
Adj. EBITDA Margin 8.2% 7.8% +42 bps 6.9% 7.5% -57 bps 5.6% 4.6% +103 bps
Adj. Net Income, Group share 437 391 11.9%
Adj. Net Income Margin 3.2% 3.1% 11 bps
CONSOLIDATED ATACADÃO CARREFOUR RETAIL BANCO CARREFOUR GLOBAL FUNCTIONS
In R$ million9M 19
post-IFRS 16
9M 18reported
∆% 9M 19
post-IFRS 16
9M 18reported
∆% 9M 19
post-IFRS 16
9M 18reported
∆% 9M 19
post-IFRS 16
9M 18reported
∆% 9M 19
post-IFRS 16
9M 18reported
∆%
Gross sales 44,582 40,523 10.0% 30,200 26,882 12.3% 14,382 13,641 5.4%
Gross sales ex petrol 42,534 38,394 10.8% 30,200 26,882 12.3% 12,334 11,512 7.1%
Net sales 40,505 36,901 9.8% 27,430 24,424 12.3% 13,075 12,477 4.8%
Other revenues 2,548 2,188 16.5% 100 101 -1.0% 330 280 17.9% 2,118 1,807 17.2%
Total Revenues 43,053 39,089 10.1% 27,530 24,525 12.3% 13,405 12,757 5.1% 2,118 1,807 17.2%
Gross profit 8,944 7,991 11.9% 4,226 3,716 13.7% 3,259 3,053 6.7% 1,459 1,222 19.4%
Gross Margin 22.1% 21.7% +43 bps 15.4% 15.2% +19 bps 24.9% 24.5% +46 bps
SG&A Expenses (5,693) (5,243) 8.6% (2,278) (2,016) 13.0% (2,612) (2,537) 3.0% (694) (600) 15.7% (109) (90) 21.1%
SG&A of Net Sales 14.1% 14.2% -15 bps 8.3% 8.3% 5 bps 20.0% 20.3% -36 bps
Adj. EBITDA 3,289 2,768 18.8% 1,957 1,706 14.7% 676 530 27.5% 765 622 23.0% (109) (90) 21.1%
Adj. EBITDA Margin 8.1% 7.5% +62 bps 7.1% 7.0% +15 bps 5.2% 4.3% +82 bps
Adj. Net Income, Group share 1,251 1,124 11.3%
Adj. Net Income Margin 3.1% 3.0% 4 bps
CONSOLIDATED ATACADÃO CARREFOUR RETAIL BANCO CARREFOUR GLOBAL FUNCTIONS

Summary of IFRS 16 effect by segment
2 2
In R$ millionQ3 19IFRS 16
Q3 18 ∆% Q3 19IFRS 16
Q3 18 ∆% Q3 19IFRS 16
Q3 18 ∆% Q3 19IFRS 16
Q3 18 ∆% Q3 19IFRS 16
Q3 18 ∆%
Gross sales
Gross sales ex petrol
Net sales
Other revenues
Total Revenues
Gross profit 5 1 4 0
Gross Margin
SG&A Expenses 55 16 38 1
SG&A of Net Sales
Adj. EBITDA 67 18 48 1
Adj. EBITDA Margin
D&A included in Gross Margin (7) (1) (6)
D&A not included in SG&A Exp. (44) (11) (32) (1)
Financial result (26)
Adj. Net Income, Group share (11)
Adj. Net Income Margin
CONSOLIDATED ATACADÃO CARREFOUR RETAIL BANCO CARREFOUR GLOBAL FUNCTIONS
In R$ million9M 19IFRS 16
9M 18∆% 9M 19
IFRS 169M 18 ∆% 9M 19
IFRS 169M 18 ∆% 9M 19
IFRS 169M 18 ∆% 9M 19
IFRS 169M 18 ∆%
Gross sales
Gross sales ex petrol
Net sales
Other revenues
Total Revenues
Gross profit 15 2 13
Gross Margin
SG&A Expenses 157 44 111 2
SG&A of Net Sales
Adj. EBITDA 192 49 141 2
Adj. EBITDA Margin
D&A included in Gross Margin (20) (3) (17)
D&A not included in SG&A Exp. (123) (30) (91) (2)
Financial result (78)
Adj. Net Income, Group share (29)
Adj. Net Income Margin
CONSOLIDATED ATACADÃO CARREFOUR RETAIL BANCO CARREFOUR GLOBAL FUNCTIONS

Reconciliation of adjusted EBITDA Post-IFRS 16
2 3
* Impacts related to forex gains or losses and derivatives instruments were accounted for as cost of goods sold starting in
September 2018. Therefore, in Q3 2018 and 9M 2018 this effect was accounted in financial results as a non-recurring effect.
In R$ million Q3 19 Q3 18 ∆ 9M 19 9M 18 ∆
Net income 505 392 28.8% 583 1,164 -49.9%
(+) Income tax and social contribution 224 225 -0.3% 702 620 13.3%
(+) Net financial results 135 120 12.7% 377 258 46.2%
(+) Depreciation and amortization 257 188 36.9% 743 552 34.7%
(+) Supply chain depreciation and amortization 13 7 76.4% 39 20 91.4%
(=) EBITDA 1,134 932 21.7% 2,444 2,614 -6.5%
(+/-) Other (income) expenses (5) 59 -108.5% 845 154 448.7%
(=) Adjusted EBITDA 1,129 991 13.9% 3,289 2,768 18.8%

Other income and expenses includes tax gains and provisions for depreciation and expenses related to the gains. Adj. Net income is the Net Income adjusted for other operating income and expenses
and their respective income tax impacts.
The adjusted net income aims at providing a better view of the recurring net income performance. It iscalculated as Net Income less Other income and expenses and the corresponding financial and income taxeffect.
Net adjusted income, group share, reconciliation
2 4
* Impacts related to forex gains or losses and derivatives instruments were accounted for as cost of goods sold starting in September 2018. Therefore, in Q3 2018 and 9M 2018 this effect was accounted in financial results as a non-recurring effect.
In R$ million Q3 19 Q3 18 ∆ 9M 19 9M 18 ∆
Net income, Group share 430 355 21.1% 377 1,024 -63.2%
(+/-) Other income (expenses) (5) 59 -108.5% 845 154 448.7%
(+/-) Financial results (non recurring) 0 (7) -100.0% 0 (7) -100.0%
(+/-) Tax income on other income (expenses) items 12 (16) -175.0% 29 (47) -161.7%
Net income, Group share, adjusted 437 391 11.9% 1,251 1,124 11.3%
Net margin 3.2% 3.1% 10 bps 3.1% 3.0% 4 bps

Evolution of credit portfolio Bacen and IFRS 9
2 5
CREDIT PORTFOLIO (R$ Million)
On time payments 84.8% 84.3% 84.8% 86.0% 85.2% 84.8% 84.8%
Over 30 days 13.1% 13.5% 13.4% 12.5% 13.1% 13% 13.3%
Over 90 days 9.4% 9.8% 10.5% 9.7% 9.5% 9.4% 10.0%
Provisions for loan losses 12.1% 12.6% 13.0% 12.2% 11.7% 11.2% 11.5%
On time payments 81.5% 79.0% 78.1% 78.3% 76.0% 74% 73.5%
Over 30 15.9% 18.4% 19.8% 19.9% 22.0% 23.3% 24.4%
Over 90 11.4% 14.2% 16.4% 16.7% 18.1% 19.4% 20.9%
Provisions for loan losses 20.6% 22.5% 24.2% 23.0% 23.9% 24.5% 25.2%
BA
CEN
IFR
S9
6,433 6,625 6,887 7,690 7,947 8,430 9,002
200 380 533 692 889
1,099 1,285
6,633 7,005
7,420 8,382 8,836
9,529 10,287
Q1 18 Q2 18 Q3 18 Q4 18 Q1 19 Q2 19 Q3 19
Bacen Methodology IFRS 9 Adjustment

This document contains both historical and forward-looking statements on expectations and projections about operational and financial results of the Company. These forward-lookingstatements are based on Carrefour management's current views and assumptions. Such statements are not guarantees of future performance. Actual results or performances may differmaterially from those in such forward-looking statements as a result of a number of risks and uncertainties, including but not limited to the risks described in the documents filed with theCVM (Brazilian Securities Commission) in particular the Reference Form. The Company does not assume any obligation to update or revise any of these forward-looking statements in thefuture.
IR ContactSébastien Durchon Natália Lacava Ludimila AieloCFO and Director of Investor Relations Investor Relations Director IR Coordinator Telephone: +55 11 [email protected]
About Grupo Carrefour BrasilGrupo Carrefour Brasil has been present in Brazil for over 40 years and is the market leader in food distribution and retail. Operating a multiformat and omnichannel platform, itcombines retail and cash & carry operations, as well as financial solutions for its clients through Banco Carrefour. We also manage our real estate and portfolio of shopping galleriesand malls through our real estate division - Carrefour Property.The Group is present in every state of Brazil, which allows us to meet the different needs of its millions of customers across the country. In 2018, we developed even more ouromnichannel strategy with the set up of 10 Drives and click and collect in all hypermarket stores. In traditional retail, our strategy is multiformat: Carrefour (hypermarkets), CarrefourBairro and Carrefour Market (supermarkets), Carrefour Express (convenience stores) and Atacadão (cash & carry and delivery wholesale) as well as Supeco (compact wholesalecash&carry). Additionally, we offer complementary services to our food distribution business with gas stations and drugstores services branded Carrefour and Atacadão.We are the largest retailer in Brazil and operate more than 670 points of sale. With sales of R$ 56.3 billion in 2018 and more than 84,000 employees, the company is one of thelargest private employers in the country and one of the 20 largest listed companies on the Brazilian stock exchange (B3).
Disclaimer
2 6


![[Momentum] A vantagem competitiva está nas pessoas](https://static.fdocumentos.com/doc/165x107/55b2eeccbb61eb86438b457a/momentum-a-vantagem-competitiva-esta-nas-pessoas.jpg)


![[Momentum] Como se manter inovador com estruturas organizacionais não apropriadas](https://static.fdocumentos.com/doc/165x107/55b2eed0bb61eb86438b457c/momentum-como-se-manter-inovador-com-estruturas-organizacionais-nao-apropriadas.jpg)
