ICT IN EDUCATION - nic.br · Pesquisa sobre o uso das tecnologias de informação e comunicação...
404
TIC EDUCAÇÃO Pesquisa Sobre o Uso das Tecnologias de Informação e Comunicação nas Escolas Brasileiras — 2016 — ICT IN EDUCATION Survey on the Use of Information and Communication Technologies in Brazilian Schools
Transcript of ICT IN EDUCATION - nic.br · Pesquisa sobre o uso das tecnologias de informação e comunicação...

TIC EDUCAÇÃOPesquisa Sobre o Uso das Tecnologias
de Informação e Comunicação nas Escolas Brasileiras
—
2016—
ICT IN EDUCATION Survey on the Use of Information and Communication Technologies
in Brazilian Schools
Atribuição Não Comercial 4.0 Internacional Attribution NonCommercial 4.0 International
Você tem o direito de:You are free to:
Compartilhar: copiar e redistribuir o material em qualquer suporte ou formato.Share: copy and redistribute the material in any medium or format.
Adaptar: remixar, transformar e criar a partir do material.Adapt: remix, transform, and build upon the material.
O licenciante não pode revogar estes direitos desde que você respeite os termos da licença.The licensor cannot revoke these freedoms as long as you follow the license terms.
De acordo com os seguintes termos: Under the following terms:
Atribuição: Você deve atribuir o devido crédito, fornecer um link para a licença, e indicar se foram feitas alterações. Você pode fazê-lo de qualquer forma razoável, mas não de uma forma que sugira que o licenciante o apoia ou aprova o seu uso.Attribution: You must give appropriate credit, provide a link to the license, and indicate if changes were made. You may do so in any reasonable manner, but not in any way that suggests the licensor endorses you or your use.
Não comercial: Você não pode usar o material para fins comerciais.Noncommercial: You may not use this work for commercial purposes.
Sem restrições adicionais: Você não pode aplicar termos jurídicos ou medidas de caráter tecnológico que restrinjam legalmente outros de fazerem algo que a licença permita.No additional restrictions: You may not apply legal terms or technological measures that legally restrict others from doing anything the license permits.
http://creativecommons.org/licenses/by-nc/4.0/

Núcleo de Informação e Coordenação do Ponto BRBrazilian Network Information Center
Comitê Gestor da Internet no BrasilBrazilian Internet Steering Committee
www.cgi.br
São Paulo2017
TIC EDUCAÇÃOPesquisa Sobre o Uso das Tecnologias
de Informação e Comunicação nas Escolas Brasileiras
—
2016—
ICT IN EDUCATION Survey on the Use of Information and Communication Technologies
in Brazilian Schools
Dados Internacionais de Catalogação na Publicação (CIP)(Câmara Brasileira do Livro, SP, Brasil)
Pesquisa sobre o uso das tecnologias de informação e comunicação nas escolas brasileiras [livro eletrônico] : TIC educação 2016 = Survey on the use of information and communication technologies in brazilian schools : ICT in education 2016 / Núcleo de Informação e Coordenação do Ponto BR, [editor]. -- São Paulo : Comitê Gestor da Internet no Brasil, 2017.
3.700 Kb ; PDF
Vários tradutores. Edição bilíngue: português/inglês. ISBN 978-85-5559-049-8
1. Internet (Rede de computadores) - Brasil 2. Tecnologia da informação e da comunicação - Brasil - Pesquisa I. Núcleo de Informação e Coordenação do Ponto BR. II. Título: Survey on the use of information and communication technologies in brazilian schools : ICT in education 2016.
17-09725 CDD – 004.6072081
Índices para catálogo sistemático:
1. Brasil : Tecnologias da informação e da comunicação : Uso : Pesquisa 004.60720812. Pesquisa : Tecnologia da informação e comunicação : Uso : Brasil 004.6072081
Núcleo de Informação e Coordenação do Ponto BRBrazilian Network Information Center
Diretor Presidente / CEO : Demi Getschko
Diretor Administrativo / CFO : Ricardo Narchi
Diretor de Serviços e Tecnologia / CTO : Frederico Neves
Diretor de Projetos Especiais e de Desenvolvimento / Director of Special Projects and DevelopmentMilton Kaoru Kashiwakura
Diretor de Assessoria às Atividades do CGI.br / Chief Advisory Officer to CGI.br : Hartmut Richard Glaser
Centro Regional de Estudos para o Desenvolvimento da Sociedade da Informação – Cetic.br Regional Center for Studies on the Development of the Information Society – Cetic.br
Coordenação Executiva e Editorial / Executive and Editorial Coordination : Alexandre F. Barbosa
Coordenação Científica / Scientific Coordination : Leila Rentroia Iannone
Coordenação Técnica / Technical Coordination : Fabio Senne, Marcelo Pitta e Tatiana Jereissati
Equipe Técnica / Technical TeamAlessandra Almeida, Ana Laura Martínez, Daniela Costa, Isabela Coelho, Javiera Macaya, João Victor Dias, José Márcio Martins Júnior, Juliana Doretto, Leonardo Lins, Luana Thamiris de Oliveira, Luciana Lima, Luiza Mesquita, Manuella Ribeiro, Maria Eugenia Sozio, Rafael Soares, Stefania Cantoni e Winston Oyadomari
Gestão da Pesquisa em Campo / Fieldwork ManagementCoordenação / Coordination: IBOPE Inteligência Pesquisa e Consultoria Ltda., Helio Gastaldi, Rosi Rosendo, Ana Cardoso; Ligia Rubega, Rachel Baptista e Regiane Sousa
Edição / EditionComunicação NIC.br : Caroline D’Avo, Everton Teles Rodrigues e Fabiana Araujo da Silva
Apoio Editorial / Editorial SupportPreparação de Texto, Arquitetura de Informação e Revisão em Português / Proof Reading, Information Architecture and Revision in Portuguese : Magma Editorial Ltda., Aloisio Milani e Alexandre PavanTradução para o inglês / Translation into English : Prioridade Consultoria Ltda., Luísa Caliri, Luana Guedes, Grant Borowik e Lorna SimonsProjeto Gráfico e Editoração / Graphic Design and Publishing : DB Comunicação Ltda.Capa / Cover : Pilar Velloso
Esta publicação está disponível também em formato digital em www.cetic.brThis publication is also available in digital format at www.cetic.br

TIC Educação 2016Pesquisa sobre o Uso das Tecnologias de Informação
e Comunicação nas Escolas Brasileiras
ICT in Education 2016Survey on the Use of Information and Communication
Technologies in Brazilian Schools
COMITÊ GESTOR DA INTERNET NO BRASIL – CGI.brBRAZILIAN INTERNET STEERING COMMITTEE (CGI.br)
( Em Outubro de 2017 / In October, 2017 )
Coordenador / Coordinator
Maximiliano Salvadori Martinhão
Conselheiros / Counselors
Carlos Roberto FortnerDemi Getschko
Eduardo Fumes ParajoEduardo Levy Cardoso Moreira
Flávia Lefèvre GuimarãesFrancilene Procópio Garcia
Franselmo Araújo CostaHenrique Faulhaber
Igor Vilas Boas de FreitasJosé Luiz Ribeiro Filho
Luiz Carlos de AzevedoLuiz Fernando Martins Castro
Marcelo Daniel PagottiMarcos Dantas Loureiro
Marcos Vinícius de SouzaNivaldo Cleto
Percival Henriques de Souza NetoSergio Amadeu da Silveira
Tanara LauschnerThiago Tavares Nunes de Oliveira
Secretário executivo / Executive Secretary
Hartmut Richard Glaser


5
AGRADECIMENTOS
A pesquisa TIC Educação 2016 contou com o apoio de um importante grupo de especialistas, renomados pelo conhecimento em educação e tecnologia. A contribuição se deu por meio da validação dos indicadores, da metodologia e, também, da definição das diretrizes para a análise de dados. A colaboração desse grupo é fundamental para a identificação de novas áreas de investigação, para o aperfeiçoamento dos procedimentos metodológicos e para alcançar a produção de dados confiáveis. Cabe destacar que a importância em compreender os desafios acerca da integração das TIC ao âmbito educacional serviu como motivação para que o grupo acompanhasse voluntariamente a pesquisa, em meio a um esforço coletivo.
Na sétima edição da pesquisa TIC Educação, o Centro Regional de Estudos para o Desenvolvimento da Sociedade da Informação (Cetic.br) agradece aos seguintes especialistas:
Assessoria às atividades do CGI.brJamila VenturiniCentro de Inovação para a Educação Brasileira (Cieb)Lúcia Dellagnelo, Caique Bernardes Leite Cesar e Mairum AndradeConhecimento Social – Estratégia e GestãoAna Lucia LimaConselho Nacional de Secretários de Educação (Consed)Cyntia Fonseca, Marcos Barros e Francisco José CarbonariConsultora em Educação e Mídias DigitaisMaria Inês BastosCriamundiMárcia PadilhaEducaDigitalPriscila Gonsales e Débora SebriamEscola do Futuro (USP)Drica GuzziEscola Nacional de Ciências Estatísticas (ENCE/IBGE)Pedro Nascimento SilvaFundação LemannLucas Rocha e Tiago MalutaFundação Roberto MarinhoRosalina SoaresFundação TelefônicaMilada Tonarelli GonçalvesFundo das Nações Unidas para a Infância (Unicef)Ítalo DutraInstituto de Pesquisa Econômica Aplicada (Ipea)Luis Claudio KubotaLondon School of Economics (LSE)Ellen HelsperMinistério da Educação (SEB/SECADI/INEP)Renilda Peres de Lima, Alexsander Moreira, Márcio da Costa Arruda, Estevon Nagumo e Fábio Pereira BravinMinistério da Educação (Roquette Pinto /TV Escola)Alexandre Mathias Pedro e Regina Alcântara de AssisOrganização das Nações Unidas para a Educação, a Ciência e a Cultura (Unesco) – Representação da Unesco no BrasilAdauto Cândido Soares, Karla Skeff e Maria Rebeca Otero Gomes
Organização das Nações Unidas para a Educação, a Ciência e a Cultura (Unesco) - Oficina Regional de Ciência de la Unesco para América Latina y el CaribeGuilherme Canela GodoiPontifícia Universidade Católica do Rio de Janeiro (PUC-Rio)Rosália Duarte e Rita MiglioraPontifícia Universidade Católica de São Paulo (PUC-SP)Fernando José de Almeida, Maria da Graça Moreira e Maria Elizabeth Bianconcini de AlmeidaPontifícia Universidade Católica do Paraná (PUC-PR)Dilmeire VosgerauSafernetRodrigo Nejm e Juliana Andrade CunhaUnesco Institute for Statistics (UIS)Juan Cruz PerusiaUnião dos Dirigentes Municipais de Educação SP (Undime)Aléssio Costa Lima, Janice Paulino Cesar e José Carlos BrancatelliUniversidade de São Paulo (USP)Claudemir Viana, Gilson Schwartz, Ismar de Oliveira Soares e Ocimar Munhoz AlavarseUniversidade Estadual de Campinas (Unicamp)José Armando Valente e Tel AmielUniversidade Estadual de Londrina (UEL)Maria Renata da Cruz DuranUniversidade Federal da Bahia (UFBA)Nelson PrettoUniversidade Federal de Minas Gerais (UFMG)Marisa DuarteUniversidade Federal de Santa Catarina (UFSC)Maria Luiza BelloniUniversidade Federal do Ceará (UFC)Inês Vitorino SampaioUniversidade Federal do Rio Grande do Sul (UFRGS)Léa Fagundes, Liane Tarouco, Marta Bez e Rosa VicariUniversidade Nova de LisboaCristina PonteUniversidade Presbiteriana MackenzieUbirajara Carnevale de MoraesUniversidade Tecnológica Federal do Paraná (UTFPR)Henrique Oliveira da Silva

6
ACKNOWLEDGEMENTS
The ICT in Education 2016 survey relied on the support of an important group of experts, renowned for their competence, without which it would not be possible to refine the results henceforward presented in such a precise manner. Their contribution was made by validating indicators, methodology and the definition of guidelines for data analysis. This group’s collaboration was fundamental for identifying new areas of investigation, improving methodological procedures and obtaining reliable data. It is worth emphasizing that the importance of understanding the challenges concerning ICT use in schools were motivators for the group to voluntarily follow the survey amid a collective effort.
For the 7th edition of the ICT in Education survey, the Regional Center for Studies on the Development of the Information Society (Cetic.br) would like to thank the following experts:
CGI.br Advisory TeamJamila VenturiniConhecimento Social – Estratégia e GestãoAna Lucia LimaCriamundiMárcia PadilhaEducadigitalPriscila Gonsales and Débora SebriamEducation and Digital Media AdvisersMaria Inês BastosEscola do Futuro (USP)Drica GuzziFederal University of Bahia (UFBA)Nelson PrettoFederal University of Ceará (UFC)Inês Vitorino SampaioFederal Technology University of Paraná (UTFPR)Henrique Oliveira da SilvaFederal University of Minas Gerais (UFMG)Marisa DuarteFederal University of Rio Grande do Sul (UFRGS)Léa Fagundes, Liane Tarouco, Marta Bez and Rosa VicariFederal University of Santa Catarina (UFSC)Maria Luiza BelloniInstitute for Applied Economic Research (Ipea)Luis Claudio KubotaLemann FoundationLucas Rocha and Tiago MalutaLondon School of Economics (LSE)Ellen HelsperMackenzie Presbyterian UniversityUbirajara Carnevale de MoraesMinistry of Education (SEB/SECADI/INEP)Renilda Peres de Lima, Alexsander Moreira, Márcio da Costa Arruda, Estevon Nagumo and Fábio Pereira BravinMinistry of Education (Roquette Pinto /TV Escola)Alexandre Mathias Pedro and Regina Alcântara de AssisNational School of Statistical Sciences (ENCE)Pedro Nascimento SilvaNew University of LisbonCristina Ponte
Paulo Montenegro InstituteAna Lucia LimaPontifical Catholic University of Paraná (PUC-PR)Dilmeire VosgerauPontifical Catholic University of Rio de Janeiro (PUC-RJ)Rosália Duarte and Rita MiglioraPontifical Catholic University of São Paulo (PUC-SP)Fernando José de Almeida, Maria da Graça Moreira and Maria Elizabeth Bianconcini de AlmeidaRoberto Marinho FoundationRosalina SoaresSaferNetRodrigo Nejm and Juliana Andrade CunhaTelefônica FoundationMilada Tonarelli GonçalvesThe Innovation Center for Brazilian Education (CIEB)Lúcia Dellagnelo, Caique Bernardes Leite Cesar and Mairum AndradeNational Council of Secretaries of Education (Consed)Cyntia Fonseca, Marcos Barros and Francisco José CarbonariNational Union of Municipal Education Leaders (Undime)Aléssio Costa Lima, Janice Paulino Cesar and José Carlos BrancatelliUnesco Institute for Statistics (UIS)Juan Cruz PerusiaUnited Nations Children's Fund (Unicef)Ítalo DutraUnited Nations Educational, Scientific and Cultural Organization (Unesco) – Oficina Regional de Ciencia de la Unesco para América Latina y el CaribeGuilherme Canela GodoiUnited Nations Educational, Scientific and Cultural Organization (Unesco) – Unesco Representation in BrazilAdauto Cândido Soares, Karla Skeff and Maria Rebeca Otero GomesUniversity of Campinas (Unicamp)José Armando Valente and Tel AmielUniversity of Londrina (UEL)Maria Renata da Cruz DuranUniversity of São Paulo (USP)Claudemir Viana, Gilson Schwartz, Ismar de Oliveira Soares and Ocimar Munhoz Alavarse

2016 PESQUISA TIC EDUCAÇÃOSUMÁRIO 7
PO
RTU
GU
ÊS E
NG
LISH
SUMÁRIO / CONTENTS
5 AGRADECIMENTOS / ACKNOWLEDGEMENTS, 6
23 PREFÁCIO / FOREWORD, 125
25 APRESENTAÇÃO / PRESENTATION, 127
27 INTRODUÇÃO / INTRODUCTION, 129
PARTE 1: ARTIGOS / PART 1: ARTICLES
33 INOVAÇÃO E TECNOLOGIA NA EDUCAÇÃO: GUIA EDUTEC – FERRAMENTA DE DIAGNÓSTICO E PLANEJAMENTO DE POLÍTICAS DE TECNOLOGIA EDUCACIONAL
INNOVATION AND TECHNOLOGY IN EDUCATION: THE EDUTEC GUIDE – A DIAGNOSTIC AND PLANNING TOOL FOR EDUCATIONAL TECHNOLOGY POLICIES, 135LUCIA DELLAGNELO
41 PROJETO CONECTADOS: VIABILIZANDO A CONSTRUÇÃO DA CULTURA DIGITAL NAS ESCOLAS PÚBLICAS PARANAENSES
THE CONNECTED PROJECT: ENABLING THE CONSTRUCTION OF DIGITAL CULTURE IN PUBLIC SCHOOLS IN PARANÁ, 143MARY ÂNGELA TEIXEIRA BRANDALISE
51 APROPRIAÇÕES SOCIAIS E FORMATIVAS DAS TECNOLOGIAS DIGITAIS POR ADOLESCENTES E SUAS RELAÇÕES COM A EDUCAÇÃO ESCOLAR
SOCIAL AND FORMATIVE APPROPRIATIONS OF DIGITAL TECHNOLOGIES BY ADOLESCENTS AND THEIR RELATIONSHIP WITH SCHOOL EDUCATION , 153ANALIGIA MIRANDA DA SILVA E CLAUDIA MARIA DE LIMA
59 A BASE NACIONAL COMUM CURRICULAR (BNCC) E A UTILIZAÇÃO DAS TIC NA EDUCAÇÃOTHE NATIONAL COMMON CURRICULUM AND THE USE OF ICT IN EDUCATION, 161DEISE DE LACERDA PAIVA
PARTE 2: TIC EDUCAÇÃO 2016 / PART 2: ICT IN EDUCATION 2016
69 RELATÓRIO METODOLÓGICO – TIC EDUCAÇÃO 2016 METHODOLOGICAL REPORT – ICT IN EDUCATION 2016, 171
87 RELATÓRIO DE COLETA DE DADOS – TIC EDUCAÇÃO 2016 DATA COLLECTION REPORT – ICT IN EDUCATION 2016, 189
93 ANÁLISE DOS RESULTADOS – TIC EDUCAÇÃO 2016ANALYSIS OF RESULTS – ICT IN EDUCATION 2016, 195
8 P
OR
TUG
UÊS
ICT IN EDUCATION SURVEY 2016CONTENTS
EN
GLI
SH
PARTE 3: TABELAS DE RESULTADOS / PART 3: TABLES OF RESULTS
225 TABELAS DE RESULTADOS – TIC EDUCAÇÃO 2016 TABLES OF RESULTS – ICT IN EDUCATION 2016
PARTE 4: APÊNDICES / PART 4: APPENDICES
385 GLOSSÁRIO GLOSSARY, 393
391 LISTA DE ABREVIATURAS LIST OF ABBREVIATIONS, 399

2016 PESQUISA TIC EDUCAÇÃOSUMÁRIO 9
PO
RTU
GU
ÊS E
NG
LISH
LISTA DE GRÁFICOS / CHART LIST
ARTIGOS / ARTICLES
36 RESULTADOS DO GUIA EDUTEC, POR DIMENSÃORESULTS OF THE EDUTEC GUIDE, BY ELEMENT, 138
38 DESEQUILÍBRIO INTERNO ENTRE AS DIMENSÕES, A PARTIR DO EXEMPLO DE CINCO ESTADOS NO GUIA EDUTEC
INTERNAL IMBALANCE AMONG ELEMENTS, AS SHOWN IN THE EXAMPLE OF FIVE STATES IN THE EDUTEC GUIDE, 140
ANÁLISE DOS RESULTADOS / ANALYSIS OF RESULTS
99 ESCOLAS, POR LOCAL DE ACESSO À INTERNET (2015 – 2016)SCHOOLS BY LOCATION OF INTERNET ACCESS (2015 – 2016), 201
101 ALUNOS, POR PERCEPÇÃO SOBRE POSSÍVEIS IMPACTOS DAS TIC (2016)STUDENTS, BY PERCEPTIONS OF IMPACTS OF ICT (2016), 203
105 ALUNOS, POR PRINCIPAL EQUIPAMENTO UTILIZADO PARA ACESSAR A INTERNET (2015 – 2016)STUDENTS, BY MAIN TYPE OF DEVICE USED TO ACCESS THE INTERNET (2015 – 2016), 207
106 ALUNOS, POR EQUIPAMENTOS UTILIZADOS PARA ACESSAR A INTERNET (2015 – 2016)STUDENTS, BY DEVICES USED TO ACCESS THE INTERNET (2015 – 2016), 208
107 ESCOLAS, POR RESTRIÇÕES PARA O USO DA CONEXÃO SEM FIO (2015 – 2016)SCHOOLS, BY RESTRICTIONS ON USE OF WIRELESS CONNECTIONS (2015 – 2016), 209
108 PROFESSORES QUE ACESSARAM A INTERNET PELO TELEFONE CELULAR EM ATIVIDADES COM OS ALUNOS (2015 – 2016)
TEACHERS WHO ACCESSED THE INTERNET VIA MOBILE PHONES IN ACTIVITIES WITH STUDENTS (2015 – 2016), 210
112 ALUNOS, POR USO DA INTERNET EM ATIVIDADES ESCOLARES (2016) STUDENTS, BY INTERNET USE IN SCHOOL ACTIVITIES (2016), 214
112 PROFESSORES, POR ATIVIDADES REALIZADAS COM OS ALUNOS (2016)TEACHERS, BY ACTIVITIES CARRIED OUT WITH STUDENTS (2016), 214


2016 PESQUISA TIC EDUCAÇÃOSUMÁRIO 11
PO
RTU
GU
ÊS E
NG
LISH
LISTA DE TABELAS / TABLE LIST
ARTIGOS / ARTICLES
47 AVALIAÇÃO DOS RESULTADOS/EFEITOS DO PROJETO CONECTADOS (2017)ASSESSMENT OF THE RESULTS/EFFECTS OF THE CONNECTED PROJECT (2017), 149
RELATÓRIO METODOLÓGICO / METHOGOLOGICAL REPORT
73 NÚMERO DE LOCALIDADES, SEGUNDO REGIÃONUMBER OF LOCATIONS BY MACRO-REGION, 175
74 ALOCAÇÃO DA AMOSTRA DE LOCALIDADES, SEGUNDO ESTRATOSSAMPLE ALLOCATION OF LOCATIONS, BY STRATA, 176
75 TAMANHO DA AMOSTRA DE LOCALIDADES, SEGUNDO UNIDADE DA FEDERAÇÃOLOCATION SAMPLE SIZE BY FEDERATIVE UNIT, 177
RELATÓRIO DE COLETA DE DADOS / DATA COLLECTION REPORT
87 DISTRIBUIÇÃO DA AMOSTRA DE ESCOLAS, SEGUNDO REGIÃO E DEPENDÊNCIA ADMINISTRATIVASCHOOL SAMPLE DISTRIBUTION, BY REGION AND ADMINISTRATIVE JURISDICTION, 189
91 TAXA DE RESPOSTA DE ESCOLAS, SEGUNDO REGIÃO E DEPENDÊNCIA ADMINISTRATIVASCHOOL RESPONSE RATE, BY REGION AND ADMINISTRATIVE JURISDICTION, 193
ANÁLISE DOS RESULTADOS / ANALYSIS OF RESULTS
100 ESCOLAS, POR PRINCIPAL VELOCIDADE DE CONEXÃO À INTERNET (2015 – 2016)SCHOOLS, BY MAIN INTERNET CONNECTION SPEED (2015 – 2016), 202
102 DIRETORES, COORDENADORES E PROFESSORES, POR PERCEPÇÃO SOBRE POSSÍVEIS IMPACTOS DAS TIC EM PRÁTICAS PEDAGÓGICAS (2016)
PRINCIPALS, DIRECTORS OF STUDIES, AND TEACHERS, BY PERCEPTIONS OF POSSIBLE IMPACTS OF ICT ON PEDAGOGICAL PRACTICES (2016), 204
103 DIRETORES, COORDENADORES PEDAGÓGICOS E PROFESSORES, POR PERCEPÇÃO SOBRE BARREIRAS PARA O USO DAS TIC NAS ESCOLAS (2016)
PRINCIPALS, DIRECTORS OF STUDIES, AND TEACHERS, BY PERCEPTIONS OF BARRIERS TO ICT USE IN SCHOOLS (2016), 205
103 DIRETORES E COORDENADORES PEDAGÓGICOS, POR AÇÕES PRIORITÁRIAS PARA INTEGRAÇÃO DO COMPUTADOR E DA INTERNET EM PRÁTICAS PEDAGÓGICAS (2016)
PRINCIPALS AND DIRECTORS OF STUDIES BY PRIORITY ACTIONS TO INTEGRATE COMPUTER AND INTERNET USE INTO PEDAGOGICAL PRACTICES (2016), 205

12 P
OR
TUG
UÊS
ICT IN EDUCATION SURVEY 2016CONTENTS
EN
GLI
SH
110 PROFESSORES, POR USO DE RECURSOS OBTIDOS NA INTERNET PARA A PREPARAÇÃO DE AULAS OU ATIVIDADES COM ALUNOS, FORMA DE UTILIZAÇÃO E PUBLICAÇÃO DE RECURSOS PRODUZIDOS ATRAVÉS DAS TIC
TEACHERS, BY WAYS OF USING RESOURCES OBTAINED ON THE INTERNET TO PREPARE CLASSES OR ACTIVITIES WITH STUDENTS AND PUBLISHING RESOURCES PRODUCED VIA ICT, 212
116 RESPONSÁVEIS PELA ESCOLA, POR PERCEPÇÃO SOBRE BARREIRAS PARA O USO DAS TIC NAS ESCOLAS (2016)
PERSON RESPONSIBLE FOR SCHOOL, BY PERCEPTION OF BARRIERS TO ICT USE IN SCHOOLS (2016), 218
117 ESCOLAS DO CAMPO, POR NÚMERO DE COMPUTADORES EM FUNCIONAMENTO, COM ACESSO À INTERNET E DISPONÍVEIS PARA USO DOS ALUNOS EM ATIVIDADES PEDAGÓGICAS (2016)
RURAL SCHOOLS, BY NUMBER OF FUNCTIONING COMPUTERS, THOSE WITH INTERNET ACCESS, AND THOSE AVAILABLE FOR STUDENT USE IN PEDAGOGICAL ACTIVITIES (2016), 219
118 ESCOLAS DO CAMPO, POR VELOCIDADE DA PRINCIPAL CONEXÃO À INTERNET (2016)RURAL SCHOOLS, BY MAIN INTERNET CONNECTION SPEED (2016), 220
118 ESCOLAS DO CAMPO, POR MOTIVOS PARA NÃO UTILIZAR A INTERNET NA ESCOLA (2016)RURAL SCHOOLS, BY REASONS FOR NOT USING THE INTERNET (2016), 220
119 ESCOLAS DO CAMPO, POR LOCAL DE INSTALAÇÃO DOS COMPUTADORES DE MESA E DE ACESSO À INTERNET (2016)
RURAL SCHOOLS, BY LOCATION OF DESKTOP COMPUTERS INSTALLED AND INTERNET ACCESS (2016), 221

2016 PESQUISA TIC EDUCAÇÃOSUMÁRIO 13
PO
RTU
GU
ÊS E
NG
LISH
LISTA DE FIGURAS / FIGURE LIST
ARTIGOS / ARTICLES
34 EVOLUÇÃO DA POLÍTICA DE INOVAÇÃO E TECNOLOGIA NA EDUCAÇÃOEVOLUTION OF EDUCATIONAL INNOVATION AND TECHNOLOGY POLICIES, 136


2016 PESQUISA TIC EDUCAÇÃOSUMÁRIO 15
PO
RTU
GU
ÊS E
NG
LISH
LISTA DE TABELAS DE RESULTADOS TABLES OF RESULTS LIST
INDICADORES SELECIONADOS PARA PROFESSORESSELECTED INDICATORS FOR TEACHERS
227 PROFESSORES, POR GRAU DE ESCOLARIDADETEACHERS BY LEVEL OF EDUCATION
229 PROFESSORES, POR TEMPO DE EXPERIÊNCIA PROFISSIONALTEACHERS BY YEARS OF PROFESSIONAL EXPERIENCE
230 PROFESSORES, POR HORAS SEMANAIS DEDICADAS ÀS AULASTEACHERS BY WEEKLY TEACHING WORKLOAD
231 PROFESSORES, POR HORAS SEMANAIS DEDICADAS ÀS ATIVIDADES ADMINISTRATIVAS E DE PLANEJAMENTO
TEACHERS BY WEEKLY ADMINISTRATIVE AND PLANNING WORK HOURS
232 PROFESSORES, POR REDES DE ENSINO EM QUE ATUATEACHERS BY EDUCATIONAL SECTORS IN WHICH THEY WORK
233 PROFESSORES, POR NÚMERO DE ESCOLAS EM QUE ATUATEACHERS BY NUMBER OF SCHOOLS WHERE THEY WORK
234 PROFESSORES, POR VÍNCULO EMPREGATÍCIOTEACHERS BY EMPLOYMENT STATUS
235 PROFESSORES QUE JÁ ACESSARAM A INTERNET, POR ÚLTIMO ACESSOTEACHERS WHO HAVE ACCESSED THE INTERNET, BY LAST ACCESS
236 PROFESSORES QUE JÁ ACESSARAM A INTERNETTEACHERS WHO HAVE ACCESSED THE INTERNET
237 PROFESSORES, POR TIPO DE COMPUTADOR EXISTENTE NO DOMICÍLIOTEACHERS BY TYPES OF COMPUTERS IN THE HOUSEHOLD
238 PROFESSORES, POR FORMA DE AQUISIÇÃO DO COMPUTADOR EXISTENTE NO DOMICÍLIOTEACHERS BY TYPE OF ACQUISITION OF HOUSEHOLD COMPUTERS
241 PROFESSORES, POR DESLOCAMENTO DO COMPUTADOR À ESCOLATEACHERS WHO HAVE TAKEN PORTABLE COMPUTERS TO SCHOOL
243 PROFESSORES COM ACESSO À INTERNET NO DOMICÍLIOTEACHERS WITH INTERNET ACCESS IN THE HOUSEHOLD

16 P
OR
TUG
UÊS
ICT IN EDUCATION SURVEY 2016CONTENTS
EN
GLI
SH
244 PROFESSORES, POR LOCAL DE ACESSO À INTERNETTEACHERS BY LOCATIONS OF INTERNET ACCESS
247 PROFESSORES, POR PRINCIPAL LOCAL DE ACESSO À INTERNETTEACHERS BY MAIN LOCATION OF INTERNET ACCESS
250 PROFESSORES QUE USARAM A INTERNET POR MEIO DO TELEFONE CELULAR NOS ÚLTIMOS TRÊS MESES
TEACHERS WHO USED THE INTERNET VIA MOBILE PHONES IN THE LAST THREE MONTHS
251 PROFESSORES, POR ATIVIDADES REALIZADAS NA INTERNETTEACHERS BY ACTIVITIES CARRIED OUT ON THE INTERNET
254 PROFESSORES, POR FORMA DE APRENDIZADO E ATUALIZAÇÃO NO USO DO COMPUTADOR E DA INTERNET
TEACHERS BY HOW THEY LEARN ABOUT AND UPDATE THEMSELVES ON COMPUTER AND INTERNET USE
258 PROFESSORES, POR MODO DE ACESSO AO CURSO DE CAPACITAÇÃOTEACHERS BY HOW THEY GAINED ACCESS TO TRAINING
260 PROFESSORES QUE CURSARAM DISCIPLINA ESPECÍFICA SOBRE COMO USAR COMPUTADOR E INTERNET EM ATIVIDADES COM ALUNOS NA GRADUAÇÃO
TEACHERS WHOSE TERTIARY EDUCATION INCLUDED A SPECIFIC SUBJECT ON HOW TO USE COMPUTERS AND THE INTERNET IN ACTIVITIES WITH STUDENTS
261 PROFESSORES QUE FIZERAM CURSO DE FORMAÇÃO CONTINUADA SOBRE O USO DE COMPUTADOR E INTERNET EM ATIVIDADES DE ENSINO
TEACHERS WHO TOOK A CONTINUING EDUCATION COURSE ABOUT COMPUTER AND INTERNET USE IN TEACHING ACTIVIITES
262 PROFESSORES, POR PERCEPÇÃO SOBRE CURSO DE FORMAÇÃO CONTINUADA SOBRE O USO DE COMPUTADOR E INTERNET EM ATIVIDADES DE ENSINO
TEACHERS BY PERCEPTIONS OF CONTINUING EDUCATION COURSES ABOUT COMPUTER AND INTERNET USE IN TEACHING ACTIVITIES
263 PROFESSORES, POR ATIVIDADES REALIZADAS COM OS ALUNOSTEACHERS BY ACTIVITIES CARRIED OUT WITH STUDENTS
266 PROFESSORES, POR USO DO COMPUTADOR E DA INTERNET PARA REALIZAR ATIVIDADES COM OS ALUNOS
TEACHERS BY COMPUTER AND INTERNET USE IN ACTIVITIES WITH STUDENTS
272 PROFESSORES, POR LOCAL DE USO DO COMPUTADOR EM ATIVIDADES COM OS ALUNOSTEACHERS BY LOCATION OF COMPUTER USE IN ACTIVITIES WITH STUDENTS
275 PROFESSORES, POR LOCAL DE USO DA INTERNET EM ATIVIDADES COM OS ALUNOSTEACHERS BY LOCATION OF INTERNET USE IN ACTIVITIES WITH STUDENTS
282 PROFESSORES, POR FREQUÊNCIA DE USO DO LABORATÓRIO DE INFORMÁTICA COM OS ALUNOS
TEACHERS BY FREQUENCY OF COMPUTER LAB USE WITH STUDENTS
284 PROFESSORES, POR USO DO COMPUTADOR E DA INTERNET NAS ATIVIDADES GERAISTEACHERS BY COMPUTER AND INTERNET USE IN GENERAL ACTIVITIES
285 PROFESSORES, POR USO DO COMPUTADOR E DA INTERNET NAS ATIVIDADES GERAISTEACHERS BY COMPUTER AND INTERNET USE IN GENERAL ACTIVITIES
286 PROFESSORES, POR TIPO DE COMPUTADOR MAIS UTILIZADO NAS ATIVIDADES GERAISTEACHERS BY TYPES OF COMPUTERS MOST USED IN GENERAL ACTIVITIES

2016 PESQUISA TIC EDUCAÇÃOSUMÁRIO 17
PO
RTU
GU
ÊS E
NG
LISH
294 PROFESSORES, POR FREQUÊNCIA DE ACESSO À INTERNET EM ATIVIDADES COM OS ALUNOS, COMPUTADOR PRÓPRIO OU DA ESCOLA
TEACHERS BY FREQUENCY OF INTERNET ACCESS IN ACTIVITIES WITH STUDENTS VIA THEIR OWN OR SCHOOL COMPUTERS
296 PROFESSORES QUE ACESSARAM A INTERNET PELO TELEFONE CELULAR EM ATIVIDADES COM OS ALUNOS
TEACHERS WHO ACCESSED THE INTERNET VIA MOBILE PHONES DURING ACTIVITIES WITH STUDENTS
297 PROFESSORES, POR FREQUÊNCIA DE ACESSO À INTERNET PELO TELEFONE CELULAR EM ATIVIDADES COM OS ALUNOS
TEACHERS BY FREQUENCY OF INTERNET ACCESS VIA MOBILE PHONES WITH STUDENTS
299 PROFESSORES, POR PERCEPÇÃO SOBRE BARREIRAS PARA O USO DAS TIC NA ESCOLATEACHERS BY PERCEPTIONS OF BARRIERS TO ICT USE IN SCHOOLS
308 PROFESSORES, POR PERCEPÇÃO SOBRE POSSÍVEIS IMPACTOS DAS TIC EM PRÁTICAS PEDAGÓGICASTEACHERS BY PERCEPTIONS OF POSSIBLE IMPACTS OF ICT ON PEDAGOGICAL PRACTICES
312 PROFESSORES, POR PERCEPÇÃO SOBRE O USO DAS TIC NA ESCOLATEACHERS BY PERCEPTIONS OF ICT USE IN SCHOOL
318 PROFESSORES, POR USO DE RECURSOS OBTIDOS NA INTERNET PARA A PREPARAÇÃO DE AULAS OU ATIVIDADES COM ALUNOS
TEACHERS BY USE OF RESOURCES OBTAINED ON THE INTERNET FOR PREPARING CLASSES OR ACTIVITIES WITH STUDENTS
319 PROFESSORES, POR TIPO DE RECURSOS OBTIDOS NA INTERNET PARA A PREPARAÇÃO DE AULAS OU ATIVIDADES COM ALUNOS
TEACHERS BY TYPE OF RESOURCES OBTAINED ON THE INTERNET FOR PREPARING CLASSES OR ACTIVITIES WITH STUDENTS
323 PROFESSORES, POR FREQUÊNCIA DE ACESSO A RECURSOS DA INTERNET PARA A PREPARAÇÃO DE AULAS
TEACHERS BY FREQUENCY OF ACCESS TO INTERNET RESOURCES FOR PREPARING CLASSES
325 PROFESSORES, POR PLATAFORMAS ACESSADAS PARA A PREPARAÇÃO DE AULASTEACHERS BY PLATFORMS ACCESSED TO PREPARE CLASSES
327 PROFESSORES, POR TIPO DE MOTIVAÇÃO PARA O USO DE RECURSOS OBTIDOS NA INTERNETTEACHERS BY REASONS FOR USING RESOURCES OBTAINED ON THE INTERNET
329 PROFESSORES, POR FORMA DE UTILIZAÇÃO DE RECURSOS OBTIDOS NA INTERNETTEACHERS BY HOW THEY USED RESOURCES OBTAINED ON THE INTERNET
330 PROFESSORES, POR PUBLICAÇÃO DE RECURSOS PRODUZIDOS ATRAVÉS DAS TICTEACHERS BY PUBLICATION OF RESOURCES PRODUCED VIA ICT
331 PROFESSORES, POR PERCEPÇÃO SOBRE BARREIRAS PARA A PUBLICAÇÃO DE RECURSOS NA INTERNET
TEACHERS BY PERCEPTIONS OF BARRIERS TO PUBLISHING RESOURCES ON THE INTERNET
342 PROFESSORES, POR VERIFICAÇÃO DAS PERMISSÕES DE USO DE RECURSOS OBTIDOS NA INTERNET
TEACHERS BY VERIFICATION OF PERMISSION TO USE RESOURCES OBTAINED ON THE INTERNET
343 PROFESSORES, POR PERCEPÇÃO SOBRE A VERIFICAÇÃO DAS PERMISSÕES DE USO DE RECURSOS OBTIDOS NA INTERNET
TEACHERS BY PERCEPTIONS OF THE VERIFICATION OF PERMISSION TO USE RESOURCES OBTAINED ON THE INTERNET

18 P
OR
TUG
UÊS
ICT IN EDUCATION SURVEY 2016CONTENTS
EN
GLI
SH
INDICADORES SELECIONADOS PARA ALUNOSSELECTED INDICATORS FOR STUDENTS
347 ALUNOS QUE JÁ ACESSARAM A INTERNET, POR ÚLTIMO ACESSOSTUDENTS WHO HAVE ACCESSED THE INTERNET, BY LAST ACCESS
348 ALUNOS, POR FREQUÊNCIA DE ACESSO À INTERNETSTUDENTS BY FREQUENCY OF INTERNET ACCESS
349 ALUNOS, POR LOCAL DE ACESSO À INTERNETSTUDENTS BY LOCATIONS OF INTERNET ACCESS
351 ALUNOS, POR EQUIPAMENTOS UTILIZADOS PARA ACESSAR A INTERNETSTUDENTS BY DEVICES USED TO ACCESS THE INTERNET
353 ALUNOS, POR USO DA INTERNET EM ATIVIDADES ESCOLARESSTUDENTS BY INTERNET USE IN SCHOOL ACTIVITIES

2016 PESQUISA TIC EDUCAÇÃOSUMÁRIO 19
PO
RTU
GU
ÊS E
NG
LISH
INDICADORES SELECIONADOS PARA COORDENADORES PEDAGÓGICOSSELECTED INDICATORS FOR DIRECTORS OF STUDIES
356 COORDENADORES PEDAGÓGICOS, POR AÇÕES PRIORITÁRIAS PARA A INTEGRAÇÃO DO COMPUTADOR E DA INTERNET EM PRÁTICAS PEDAGÓGICAS
DIRECTORS OF STUDIES BY PRIORITY ACTIONS TO INTEGRATE COMPUTERS AND THE INTERNET INTO PEDAGOGICAL ACTIVITIES
359 COORDENADORES PEDAGÓGICOS, POR INICIATIVAS REALIZADAS NO ÚLTIMO ANO EM DECORRÊNCIA DA INTRODUÇÃO DAS TIC NA ESCOLA
DIRECTORS OF STUDIES BY INITIATIVES CARRIED OUT IN THE LAST YEAR AS A RESULT OF THE INTRODUCTION OF ICT IN SCHOOL
361 COORDENADORES PEDAGÓGICOS, POR PERCEPÇÃO SOBRE O PROJETO POLÍTICO PEDAGÓGICO DA ESCOLA
DIRECTORS OF STUDIES BY PERCEPTIONS OF THE SCHOOL’S POLITICO-PEDAGOGICAL PROJECT

20 P
OR
TUG
UÊS
ICT IN EDUCATION SURVEY 2016CONTENTS
EN
GLI
SH
INDICADORES SELECIONADOS PARA DIRETORESSELECTED INDICATORS FOR PRINCIPALS
362 DIRETORES, POR AÇÕES PRIORITÁRIAS PARA A INTEGRAÇÃO DO COMPUTADOR E DA INTERNET EM PRÁTICAS PEDAGÓGICAS
PRINCIPALS BY PRIORITY ACTIONS IN RELATION TO COMPUTER AND INTERNET INTEGRATION INTO PEDAGOGICAL ACTIVITIES
365 DIRETORES, POR PERCEPÇÃO SOBRE BARREIRAS PARA O USO DAS TIC NA ESCOLAPRINCIPALS BY PERCEPTIONS OF BARRIERS TO ICT USE IN SCHOOLS

2016 PESQUISA TIC EDUCAÇÃOSUMÁRIO 21
PO
RTU
GU
ÊS E
NG
LISH
INDICADORES SELECIONADOS PARA ESCOLASSELECTED INDICATORS FOR SCHOOLS
373 ESCOLAS, POR LOCAL DE INSTALAÇÃO DOS COMPUTADORES DE MESASCHOOLS BY LOCATION OF INSTALLED DESKTOP COMPUTERS
378 ESCOLAS, POR PRINCIPAL TIPO DE CONEXÃO À INTERNETSCHOOLS BY MAIN TYPE OF INTERNET CONNECTION
380 ESCOLAS, POR VELOCIDADE DA PRINCIPAL CONEXÃO À INTERNETSCHOOLS BY MAIN INTERNET CONNECTION SPEED


2016 PESQUISA TIC EDUCAÇÃOPREFÁCIO 23
PO
RTU
GU
ÊS
PREFÁCIO
Desde a chegada da Internet no Brasil, no fim da década de 1980, o país vem ocupando um papel preponderante na operação da rede e se consolidou como um importante ator nos fóruns de debate sobre modelo de governança. A partir de 1995, com a criação do Comitê Gestor da Internet no Brasil (CGI.br), o modelo brasileiro de governança da Internet passou a ser referência para vários países. Entre os aspectos mais emblemáticos do caso brasileiro, encontram-se o modelo de gestão e o uso dos recursos provenientes da atividade de registro de nomes de domínio sob o .br, realizada pelo Registro.br. Estes recursos são devolvidos à sociedade por meio de um conjunto de atividades voltadas à expansão e melhoria contínua da qualidade da Internet, desenvolvidas pelo Núcleo de Informação e Coordenação do Ponto BR (NIC.br), entidade formalizada em 2005.
Uma das atividades regulares do NIC.br é gerar estatísticas confiáveis e internacionalmente comparáveis sobre o acesso e uso das tecnologias de informação e comunicação (TIC), assim como a realização de estudos sobre as implicações da Internet na sociedade brasileira. Com a criação do Centro Regional de Estudos para o Desenvolvimento da Sociedade da Informação (Cetic.br), que já possui uma trajetória de 12 anos, temos produzido sistematicamente indicadores para o uso do governo, das empresas, da academia e da sociedade como um todo. Assim, as pesquisas do Cetic.br têm dado uma contribuição efetiva para a implementação de políticas públicas baseadas em evidências, beneficiando vários setores do governo e também facilitando o acompanhamento de qualquer cidadão sobre temas de interesse comum ligados à Internet.
Cada vez mais, os dados produzidos pelo Cetic.br passaram a representar o Brasil em relatórios de organismos internacionais como a Comissão Econômica para a América Latina e o Caribe das Nações Unidas (Cepal), a União Internacional de Telecomunicações (UIT), a Organização das Nações Unidas para a Educação, a Ciência e a Cultura (Unesco) e a Organização para a Cooperação e Desenvolvimento Econômico (OCDE). Os resultados vêm a calhar, uma vez que, especialmente na área das TIC, o Brasil não estava adequadamente posicionado em vários dos parâmetros avaliados internacionalmente, e isso acontecia porque o país não tinha coletado e analisado dados consistentes que pudessem ser difundidos.
O reconhecimento internacional do trabalho realizado pelo Cetic.br ampliou-se em 2012, quando se tornou Centro Regional de Categoria II da Unesco e passou a apoiar atividades de medição em países da América Latina e em nações africanas de língua portuguesa. Desde então, a entidade promove inúmeros eventos de capacitação na área de metodologia de pesquisas, com o objetivo de qualificar ainda mais as estatísticas produzidas nesses países, bem como de fortalecer a produção de dados comparáveis sobre o acesso e o uso da Internet.

PESQUISA TIC EDUCAÇÃO 2016PREFÁCIO24
PO
RTU
GU
ÊS
Embora as estatísticas revelem os inúmeros desafios a serem vencidos em prol da universalização da Internet e da implementação de políticas que promovam seus benefícios para todos os brasileiros, podemos nos orgulhar de um modelo que vem gerando contribuições efetivas para governo e sociedade. A presente publicação é mais um capítulo dessa trajetória.
Boa leitura!
Demi GetschkoNúcleo de Informação e Coordenação do Ponto BR – NIC.br
2016 PESQUISA TIC EDUCAÇÃOAPRESENTAÇÃO 25
PO
RTU
GU
ÊS
APRESENTAÇÃO
A despeito dos inúmeros avanços obtidos pelo Brasil no plano da conectividade à Internet e da expansão das redes fixas e móveis de banda larga, ainda temos importantes desafios para aumentar nossa competitividade e produtividade a partir da adoção da Internet como parte de processos fundamentais no novo paradigma da economia digital. Sabemos que o processo de digitalização que vivenciamos é irreversível e que produz impactos profundos nos mais diversos setores da economia e da sociedade, incluindo a indústria, o comércio, a agricultura e os setores estratégicos como finanças, logística, infraestrutura e os serviços públicos em geral. Cabe às políticas públicas, por sua vez, desenvolver um ambiente habilitador para que a transformação digital ocorra de forma efetiva em nosso país e para que os benefícios do processo de digitalização sejam aproveitados e potencializados para toda a sociedade.
Para tanto, o Ministério da Ciência, Tecnologia, Inovações e Comunicações (MCTIC) tem liderado a formulação de uma Estratégia Brasileira para a Transformação Digital, em articulação com outros setores do governo federal, da sociedade civil, da comunidade científica e do setor produtivo. O plano está ancorado em eixos temáticos habilitadores e eixos temáticos de transformação digital. Os cinco eixos temáticos habilitadores são: 1) infraestrutura e acesso às TIC; 2) pesquisa, desenvolvimento e inovação; 3) confiança no ambiente digital; 4) educação e capacitação profissional; e 5) dimensão internacional. Já os eixos temáticos de transformação digital focalizam, de um lado, o governo e, de outro, a economia. Por meio da consulta a especialistas e da realização de reuniões setoriais com diferentes segmentos da sociedade e do setor produtivo, tem-se buscado estabelecer um canal de diálogo aberto para a definição de prioridades e metas para os próximos cinco anos.
Mas não basta estabelecer prioridades e metas claras. É fundamental contar com planos de monitoramento e avaliação da implementação das políticas públicas e estratégias governamentais em questão. Na área de medição e produção de estatísticas TIC, o Comitê Gestor da Internet no Brasil (CGI.br) vem desempenhando um papel de destaque. As pesquisas realizadas pelo Núcleo de Informação e Coordenação do Ponto BR (NIC.br), por meio do Centro Regional de Estudos para o Desenvolvimento da Sociedade da Informação (Cetic.br), são instrumentos fundamentais para o acompanhamento de tais políticas. A geração de informações robustas e atualizadas sobre o acesso, o uso e a apropriação das TIC em diversos setores, bem como a análise dos resultados publicados pelo Cetic.br, permitem monitorar a demanda de TIC em domicílios e empresas. Além disso, os estudos também possibilitam verificar a oferta de serviços públicos por parte de órgãos de governo e a penetração das tecnologias em políticas sociais em áreas como saúde, educação e cultura. Por meio dos dados gerados pelas pesquisas do CGI.br, podemos balizar a formulação de políticas públicas no país e, com isso, reforçar o seguimento das metas e acordos internacionais assumidos pelo Brasil.

PESQUISA TIC EDUCAÇÃO 2016APRESENTAÇÃO26
PO
RTU
GU
ÊS
Adicionalmente, com o objetivo de aproximar ainda mais os formuladores de políticas públicas e os produtores de dados, o MCTIC e o Cetic.br vêm promovendo o encontro interministerial Diálogos sobre Políticas Públicas e Indicadores de TIC no Brasil. A terceira edição do evento, realizada em junho de 2017, debateu os impactos e benefícios do processo de digitalização para o desenvolvimento social e econômico, com a presença de renomados especialistas nacionais e internacionais, em especial de países da América Latina. Trata-se, portanto, de mais um elemento que comprova o compromisso do governo e do CGI.br com os debates sobre a economia digital nos mais diversos âmbitos da sociedade.
Maximiliano Salvadori MartinhãoComitê Gestor da Internet no Brasil – CGI.br
2016 PESQUISA TIC EDUCAÇÃOINTRODUÇÃO 27
PO
RTU
GU
ÊS
INTRODUÇÃO
Realizar pesquisas especializadas visando à produção regular de estatísticas sobre o acesso às tecnologias de informação e comunicação (TIC) e seus usos nos mais diversos segmentos sociais é a principal missão do Centro Regional de Estudos para o Desenvolvimento da Sociedade da Informação (Cetic.br), traduzindo um dos compromissos do Comitê Gestor da Internet no Brasil (CGI.br) e do Núcleo de Informação e Coordenação do Ponto BR (NIC.br) com a sociedade brasileira. Os dados produzidos pelas pesquisas TIC são importantes insumos para a elaboração de políticas públicas setoriais e para o monitoramento de metas internacionais de agendas das quais o Brasil é signatário.
As pesquisas regulares conduzidas pelo Cetic.br mostram que as tecnologias digitais ganham cada vez mais espaço e estão muito próximas de grande parte da população, embora ainda sejam encontradas disparidades no acesso e no uso da rede, sobretudo quando verificamos os dados sobre a conexão em banda larga nos domicílios de baixa renda.
As TIC são reconhecidas pelas organizações internacionais como um elemento vital para o alcance dos 17 Objetivos do Desenvolvimento Sustentável (ODS) da Agenda 2030 das Nações Unidas. Nesse contexto, quando se trata de alcançar a meta de promover educação de qualidade e inclusiva para toda a população, o acesso e uso das tecnologias no ambiente escolar não foge à regra. Garantir a educação inclusiva, equitativa e de qualidade, bem como promover oportunidades de aprendizagem para todos ao longo da vida – como destaca o ODS 4 –, são ações importantes na disseminação da cultura digital nos ambientes educacionais e formativos.
Nesse sentido, os resultados da sétima edição da pesquisa TIC Educação permitem uma compreensão do cenário atual e das tendências de uso pedagógico das novas tecnologias digitais, e em particular da Internet, nas escolas urbanas brasileiras, sobretudo no que se refere ao papel dos professores enquanto agentes centrais para a disseminação e a mediação do uso das TIC nos estabelecimentos de ensino.
Por outro lado, após 20 anos de implementação do Programa Nacional de Tecnologia Educacional (ProInfo) – a mais longeva política pública de fomento ao uso das TIC na educação no âmbito nacional –, é fundamental fazer um balanço dos avanços alcançados e dos desafios que ainda permeiam a plena incorporação dessas tecnologias nos processos de ensino e aprendizagem nas escolas brasileiras de Ensino Fundamental e Médio.
Pela primeira vez, em 2016, o Cetic.br conduziu também um projeto piloto de medição da incorporação das TIC em escolas localizadas em áreas rurais, que é apresentado como complemento da análise de resultados da presente publicação. A partir desse esforço, será possível incorporar, nas próximas edições estatísticas a serem produzidas, as dinâmicas observadas também no perfil das escolas rurais, garantindo um olhar completo sobre o setor.
PESQUISA TIC EDUCAÇÃO 2016INTRODUÇÃO28
PO
RTU
GU
ÊS
O uso dos dados produzidos pelo Cetic.br pelos gestores públicos, organizações internacionais, sociedade civil, setor privado e instituições acadêmicas tem se intensificado a cada ano, o que demonstra a sua relevância para a tomada de decisão. Para gestores públicos, essas informações são um importante insumo para a elaboração e monitoramento de políticas de inclusão digital, e em particular, do uso que os atores escolares estão fazendo das tecnologias nas escolas brasileiras. No âmbito dos pesquisadores acadêmicos, as estatísticas têm sido cada vez mais relevantes nas investigações que tratam dos impactos socioeconômicos das TIC na sociedade brasileira e para a construção de conhecimento científico sobre o tema. Já no âmbito da sociedade civil e do setor privado, os dados são recursos necessários para a avaliação de tendências.
A pesquisa TIC Educação conta com o apoio institucional do Ministério da Educação (MEC), do Conselho Nacional de Secretários de Educação (Consed), da União Nacional dos Dirigentes Municipais de Educação (Undime) e da Representação da Organização das Nações Unidas para a Educação, a Ciência e a Cultura (Unesco) no Brasil, além de ter o suporte técnico e metodológico de um grupo de pesquisadores acadêmicos, representantes de organizações da sociedade civil e do governo, especialistas na intersecção entre a educação e as tecnologias digitais. O referencial metodológico para a criação dos indicadores e dos instrumentos de coleta de dados baseou-se no trabalho da International Association for the Evaluation of Educational Achievement (IEA), divulgado em duas publicações: Sites 2006 (Technical Report – Second Information Technology in Education Study) e Sites 2006 (User Guide for the International Database). Utilizou-se também como referência o guia para medição das TIC na educação (Guide to Measuring Information and Communication Technologies in Education) do Instituto de Estatística da Unesco (Unesco Institute for Statistics – UIS).
Em consonância com a evolução da inserção das tecnologias na sociedade e as discussões em torno de sua participação na educação, em 2016, o Cetic.br trabalhou em parceria com a UIS para revisar e aprimorar o referencial metodológico e a definição dos indicadores-chave da pesquisa para a medição do uso das tecnologias no âmbito educacional. O referencial revisado enfatiza especialmente os processos de apropriação da tecnologia como meio de promover as oportunidades de aprendizagem. Tais aprimoramentos são apresentados no documento Marco Referencial Metodológico para a Medição do Acesso e Uso das Tecnologias de Informação e Comunicação (TIC) na Educação1, cujos pressupostos baseiam-se na relação entre a cultura digital na escola e da escola na cultura digital.
O Marco Referencial Metodológico prevê três dimensões de análise: acesso, uso e apropriação. O acesso refere-se à disponibilidade de equipamentos e redes para o desenvolvimento de atividades administrativas e pedagógicas, especialmente no âmbito da sala de aula, mas abarcando também a utilização de tais recursos fora da escola, como no caso do uso de dispositivos móveis. A dimensão uso abarca os indicadores sobre as estratégias utilizadas pelos atores para extrair das TIC os conhecimentos de que necessitam para o desenvolvimento do processo de ensino e aprendizagem. E a dimensão apropriação mantém maior relação com a inserção das tecnologias ao currículo e ao desenvolvimento de habilidades e competências digitais, tanto por parte de alunos quanto de educadores.
1 Disponível em: http://cetic.br/media/docs/publicacoes/8/marco-referencial-metodologico-para-a-medicao-do-acesso-e-uso-das-tecnologias-de-informacao-e-comunicacao-na-educacao.pdf

2016 PESQUISA TIC EDUCAÇÃOINTRODUÇÃO 29
PO
RTU
GU
ÊS
TIC EDUCAÇÃO: A ESCOLA E A CULTURA DIGITAL
Em 2016, a pesquisa TIC Educação confirma tendências importantes já verificadas ao longo da série histórica, e também inclui novos indicadores que passaram a ser monitorados. Pela primeira vez, a utilização de celulares em atividades escolares foi investigada entre os alunos. O uso desse tipo de dispositivo foi citado por 52% dos alunos de escolas com turmas de 5o ano e 9o ano do Ensino Fundamental e/ou 2o ano do Ensino Médio, localizadas em áreas urbanas.
Fica também evidente que, após 20 anos de implementação do ProInfo, ainda há desafios a serem vencidos quanto ao acesso a equipamentos TIC e à conexão à Internet que estão disponíveis para uso pedagógico. A presença de pelo menos um tipo de computador (de mesa, portátil ou tablet) encontra-se universalizada entre as escolas públicas localizadas em áreas urbanas, sendo que 95% delas possuem ao menos um desses computadores conectados à Internet. Entretanto, 45% das escolas públicas ainda não ultrapassaram 4 Mbps de velocidade de conexão à Internet, enquanto 33% delas possuem velocidades de até 2 Mbps.
Já os laboratórios de informática estão presentes em 81% das escolas públicas, sendo que em apenas 59% esse espaço encontrava-se em uso em 2016, segundo os diretores. Além disso, somente 31% dos professores de escolas públicas afirmaram utilizar computadores no laboratório para desenvolvimento de atividades com os alunos.
Apesar do avanço no uso do celular enquanto ferramenta pedagógica, apenas 31% dos estudantes afirmaram utilizar a Internet por esse tipo de equipamento na escola, sendo 30% entre os alunos de escolas públicas e 36% nas instituições privadas. As restrições ao acesso de estudantes à rede WiFi da escola estão entre os aspectos que explicam a baixa utilização desse dispositivo no ambiente escolar: enquanto 92% das escolas possuíam rede WiFi, 61% dos diretores afirmaram que o uso dessa conexão não é permitido aos alunos.
Segundo a pesquisa, 40% dos docentes de escolas públicas usuários de Internet afirmaram utilizar o computador em sala de aula para atividades com os alunos, sendo que somente 26% disseram que se conectam à Internet quando realizam essas atividades. Em escolas particulares, esses percentuais são de 58% e 54%, respectivamente.
A pesquisa TIC Educação 2016 também traz indicadores sobre a percepção de professores, coordenadores pedagógicos e diretores sobre o uso das tecnologias nas práticas pedagógicas. Para 94% dos professores, o uso das TIC permitiu acesso a materiais didáticos mais diversificados e de melhor qualidade. Além disso, grande parte dos docentes concordaram que a adoção de novos métodos de ensino (85%) e o cumprimento de tarefas administrativas com maior facilidade (82%) é um resultado do uso das TIC.
Segundo diretores (36%) e coordenadores pedagógicos (35%) de escolas particulares, o desenvolvimento de novas práticas de ensino baseadas no uso de computador e Internet foi considerada a ação prioritária para a integração das TIC na escola. Nas escolas públicas, o desenvolvimento de novas práticas pedagógicas também é relevante, mas aparecem com maior destaque as ações na área de infraestrutura. Para 32% dos diretores e 22% dos coordenadores pedagógicos, o aumento do número de computadores por aluno foi considerada a ação prioritária.

PESQUISA TIC EDUCAÇÃO 2016INTRODUÇÃO30
PO
RTU
GU
ÊS
Os resultados da pesquisa TIC Educação 2016 – apresentados em detalhes nas diversas tabelas agregadas, bem como no relatório analítico dos dados que fazem parte desta publicação – possibilitam delinear um cenário do acesso e do uso das TIC por professores e alunos de escolas públicas e privadas dos Ensinos Fundamental e Médio no Brasil.
Esta publicação está estruturada da seguinte forma:
Parte 1 – Artigos: apresenta contribuições de especialistas acadêmicos, representantes do governo e de organizações internacionais que discutem aspectos centrais para compreender as políticas de adoção das TIC no setor, como é o caso da discussão sobre as TIC na proposta da Base Nacional Curricular Comum (BNCC) do Brasil; os indicadores para medir os níveis de inovação e tecnologia na educação; a implementação de políticas públicas no âmbito estadual a partir de um estudo de caso do Paraná; e os aspectos cognitivos da apropriação das TIC por adolescentes no ambiente escolar;
Parte 2 – TIC Educação 2016: apresenta o relatório metodológico, que inclui a descrição dos aspectos metodológicos que orientam a pesquisa; o relatório de coleta de dados, que registra os aprimoramentos metodológicos aplicados em 2016 ao processo de realização do campo; e a análise dos principais resultados, que identifica as tendências mais relevantes observadas em relação ao acesso e ao uso das TIC pelos atores do sistema escolar;
Partes 3 – Tabelas de resultados: apresenta as tabelas de resultados, contendo os indicadores para professores, respondentes centrais da pesquisa TIC Educação, e alguns indicadores selecionados para alunos, coordenadores pedagógicos, diretores e escolas, permitindo a leitura por variáveis de cruzamento;
Parte 4 – Apêndices: glossário dos termos destinados a auxiliar o leitor na compreensão de termos e conceitos comumente usados.
Todo o esforço empregado para a produção das pesquisas TIC do CGI.br tem como principal objetivo produzir indicadores confiáveis, atualizados e relevantes para os nossos leitores. Esperamos que os dados e análises desta edição constituam-se em um importante insumo para gestores públicos, pesquisadores acadêmicos, empresas do setor privado e organizações da sociedade civil em suas iniciativas voltadas à construção da sociedade da informação e do conhecimento.
Boa leitura!
Alexandre F. BarbosaCentro Regional de Estudos para o Desenvolvimento
da Sociedade da Informação – Cetic.br

PARTE 1—
ARTIGOS


2016 PESQUISA TIC EDUCAÇÃOARTIGOS 33
PO
RTU
GU
ÊS
INOVAÇÃO E TECNOLOGIA NA EDUCAÇÃO: GUIA EDUTEC – FERRAMENTA DE DIAGNÓSTICO E PLANEJAMENTO DE POLÍTICAS DE TECNOLOGIA EDUCACIONAL
Lucia Dellagnelo 1
Inovação e tecnologia podem ser importantes alavancas para a melhoria de qualidade e equidade na educação pública. A experiência internacional mostra que países que conseguiram utilizar de modo eficaz essas alavancas, como Cingapura, Coreia do Sul e Estônia, adotaram algumas medidas em comum.
A primeira medida refere-se ao processo de elaboração das políticas nacionais de inovação e tecnologia a partir de uma visão compartilhada e convergente com as políticas de desenvolvimento econômico e social do país. As políticas de tecnologia educacional elaboradas por esses países são de longo prazo, com revisões periódicas de suas metas e de seus resultados, e com orçamentos plurianuais alocados para sua execução.
A segunda medida diz respeito à coordenação da participação de diferentes atores e instituições na implementação da política. Uma política de inovação e tecnologia educacional exige a articulação de ações de naturezas distintas, portanto, requer uma coordenação multissetorial firme e efetiva. Muitos países criaram Centros de Inovação Educacional para coordenar a implementação de suas políticas e monitorar continuamente os resultados.
Uma terceira medida adotada pelos países onde a inovação e a tecnologia têm produzido bons resultados para a educação é o planejamento multidimensional. Para gerar impacto positivo nesse setor, uma política nacional deve contemplar simultaneamente fatores humanos (visão e competências de gestores e professores) e de infraestrutura (recursos pedagógicos, equipamentos e conexão à Internet).
A partir da identificação da multidimensionalidade como fator-chave para o sucesso de políticas de inovação e tecnologia na educação, pesquisadores do Kennisnet, Centro de Inovação Educacional da Holanda, criaram a Teoria das Quatro Dimensões (em inglês, Four in Balance), que defende o planejamento e a implementação de ações integradas em quatro dimensões: visão, competências, conteúdos e recursos educacionais (Kennisnet, 2007).
1 Doutora em Educação pela Universidade de Harvard e diretora-presidente do Centro de Inovação para Educação Brasileira (Cieb).

PESQUISA TIC EDUCAÇÃO 2016ARTIGOS34
PO
RTU
GU
ÊS
Quando estas dimensões estão em diferentes níveis, corre-se o risco de comprometimento dos resultados das ações de tecnologia educacional e de obtenção de pouco retorno sobre os investimentos feitos (Tondeur, Coenders, Braak, Brummelhuis, & Wanderlinde, 2009).
O Centro de Inovação para Educação Brasileira (Cieb) tem adotado a Teoria das Quatro Dimensões como marco conceitual de seu trabalho na análise e proposição de políticas públicas capazes de fazer com que inovação e tecnologia sejam alavancas para transformações sistêmicas na educação pública no Brasil.
POLÍTICAS DE INOVAÇÃO E TECNOLOGIA EDUCACIONAL NO BRASIL
A análise do histórico das políticas de inovação e tecnologia educacional no Brasil mostra algumas contradições. Apesar de o Brasil ter participado da vanguarda de projetos de uso de tecnologia na educação desde o início dos anos 1980, a política ainda vigente é o Programa Nacional de Tecnologia Educacional (ProInfo), criado pela Portaria nº 522/MEC, de 9 de abril de 1997, para promover o uso pedagógico das tecnologias de informação e comunicação (TIC) na rede pública dos Ensinos Fundamental e Médio.
FIGURA 1EVOLUÇÃO DA POLÍTICA DE INOVAÇÃO E TECNOLOGIA NA EDUCAÇÃO
Primeiras experiências com uso de computador na educação
Primeiras iniciativas governamentais de tecnologia na educação resultam no Projeto Educom, coordenado pelo MEC
Programa conceitualmente muito avançado, mas nenhuma ação foi realizada. Substituído pelo ProInfo em 1997
Programa de Ação Imediata em Informática na Educação de 1o e 2o Graus
Foco em preparação de nova política, avaliação de Educom, formação e fomento à produção de software
Principal política nacional de tecnologia educacional do Brasil, vigente até hoje 20 anos desde a criação
da última política de tecnologia educacional
Criado para integrar distintas ações
– PBLE: Programa de Banda Larga na Escola
– UCA: Projeto Um Computador por Aluno
– Distribuição de tablets
Década de 1970 1986
1985 1992 2007 2017
1997ProInfo
ProInfoIntegrado
PRONINFEProjeto Educom
⎧⎪ ⎪⎪⎪⎪⎪⎪⎪⎪⎪⎪⎪⎪ ⎪ ⎪⎨⎪⎪⎪⎪⎪⎪⎪⎪⎪⎪⎪⎪⎪⎪⎪⎪⎪⎩
O Brasil tem um histórico em inovação e tecnologia educacional, mas a política vigente é o ProInfo, elaborada em 1997.
Fonte: Cieb, 2017.
Além da necessidade de atualização, considerando todos os avanços tecnológicos da última década, o ProInfo caracterizou-se nos últimos anos como um conjunto de ações que contemplaram dimensões isoladas de uma política de inovação e tecnologia educacional (Almeida & Valente, 2016).

2016 PESQUISA TIC EDUCAÇÃOARTIGOS 35
PO
RTU
GU
ÊS
A principal ação do ProInfo em relação aos estados e municípios estava relacionada à montagem de laboratórios de informática nas escolas e à promoção de cursos de formação sobre tecnologia educacional direcionados aos núcleos de tecnologia educacional (NTE) ligados às secretarias de educação.
Como resultado de investimentos episódicos, tanto provenientes do governo federal como próprios, estados e municípios possuem hoje níveis distintos de adoção de tecnologia em suas redes de ensino.
Identificar o nível de uso de tecnologia nas escolas é fundamental para que gestores educacionais possam planejar investimentos e otimizar a infraestrutura que possuem. Mas esta não é uma tarefa simples. Geralmente, os dados disponíveis identificam a infraestrutura existente, mas não conseguem captar como gestores e professores utilizam conteúdos e recursos digitais para promover a aprendizagem e melhorar a gestão das redes escolares. Um estudo publicado pela Organização para a Cooperação e Desenvolvimento Econômico (OCDE) em 2015 ilustra bem as dificuldades metodológicas para estabelecer correlações diretas entre o uso pedagógico de tecnologia e a aprendizagem dos estudantes (Organização para a Cooperação e Desenvolvimento Econômico [OCDE], 2015).
GUIA EDUTEC: UMA FERRAMENTA PARA GESTORES
Com o objetivo de apoiar os gestores educacionais a conhecerem o grau de adoção de tecnologia em suas escolas e a elegerem prioridades para suas ações, o Centro de Inovação para Educação Brasileira (Cieb) desenvolveu e implementou em 2016 uma ferramenta de diagnóstico do grau de adoção de tecnologia, chamada Guia Edutec.
O Guia Edutec foi desenvolvido tendo por base conceitual a Teoria das Quatro Dimensões, já mencionada, assim como referências em outras ferramentas – como StarChart, dos Estados Unidos (Kathleen, 2000; Texas Education Agency, 2006), e o SkoleMentor, da Noruega (Senter For IKT I Utdanningen, n.d.) –, para garantir que os resultados não ficassem restritos ao diagnóstico, mas que pudessem ser utilizados para planejamento e gestão de ações de tecnologia educacional nas redes de ensino.
METODOLOGIA
A implementação do Guia Edutec foi realizada entre setembro e dezembro de 2016, por meio de parceria com o Conselho Nacional de Secretários de Educação (Consed). Nos termos da parceria foi prevista a divulgação pública de dados agregados, preservando a identificação dos dados individuais dos estados participantes.
Participaram da aplicação do Guia Edutec 14 estados de todas as regiões do Brasil, mais o Distrito Federal. Um total de 12.898 escolas responderam ao questionário.
A amostra foi constituída a partir de sorteio da lista de escolas das redes estaduais de ensino, em número mínimo calculado para representar estatisticamente a realidade das escolas da rede. A margem de erro da pesquisa é de dez pontos percentuais, para mais ou para menos, dentro de um intervalo de confiança de 95%.

PESQUISA TIC EDUCAÇÃO 2016ARTIGOS36
PO
RTU
GU
ÊS
A coleta de dados foi realizada em parceria com as secretarias estaduais de ensino por meio de um questionário on-line respondido por diretores e professores das escolas selecionadas na amostra para cada estado. O diretor deveria estar acompanhado de pelo menos dois professores para responder o questionário, que continha 22 perguntas divididas nas quatro dimensões – e para cada pergunta havia cinco opções de resposta, representando diferentes níveis no grau de adoção de tecnologia educacional (1 = exploratório; 2 = básico; 3 = intermediário; 4 = avançado; 5 = muito avançado).
Cada escola, ao completar o questionário, recebeu uma devolutiva sobre o grau de adoção de tecnologia de acordo com as respostas fornecidas. Após o recebimento das respostas de todas as escolas da amostra aleatória da rede estadual de ensino, o Cieb elaborou um relatório para os secretários de educação e suas equipes.
É importante salientar que o Guia Edutec foi desenhado para constituir-se em ferramenta de diagnóstico e planejamento, e não como instrumento de pesquisa acadêmica. A metodologia utilizada foi adaptada à necessidade de coleta de dados simplificada e oferta de devolutiva ágil aos atores envolvidos.
DIFERENÇAS DO GRAU DE ADOÇÃO DE TECNOLOGIA ENTRE OS ESTADOS
Conforme ilustrado no Gráfico 1, os resultados do Guia Edutec mostram grande diversidade entre os estados brasileiros em todas as dimensões analisadas. Apesar de nenhuma rede estadual de ensino encontrar-se acima do nível intermediário no grau de adoção de tecnologia na educação, existem diferenças significativas entre as redes estaduais de ensino.
GRÁFICO 1RESULTADOS DO GUIA EDUTEC, POR DIMENSÃOPontuação mínima, média e máxima obtida dentre os estados
VISÃO COMPETÊNCIAS CONTEÚDOS E RECURSOS DIGITAIS
INFRAESTRUTURA
Muito avançado (5,0)
Avançado (4,0)
Intermediário (3,0)
Básico (2,0)
Exploratório (1,0)
2,72,4
2,6
2,0
3,4 3,53,7
3,33,0 2,8
3,12,7
Fonte: Guia Edutec 2016 (Cieb, 2017)
A análise dos dados agregados em cada uma das dimensões fornece informações interessantes. Na dimensão visão, por exemplo, que busca captar se diretores e professores acreditam que a tecnologia possa contribuir para a melhoria da educação e se planejam ações para implementá-la, os dados mostram que nove entre dez escolas mencionaram em seus projetos político pedagógicos (PPP) o uso de tecnologia como importante para atingirem seus objetivos. No entanto, em menos de 27% das escolas houve definição de estratégias de ação,

2016 PESQUISA TIC EDUCAÇÃOARTIGOS 37
PO
RTU
GU
ÊS
e apenas 9% estabeleceram objetivos e metas claras para o uso de tecnologia. Apenas 33% das escolas responderam que a maioria de seus professores utiliza algum tipo de tecnologia para ensinar. Com relação ao uso de tecnologia para comunicação interna e com a comunidade, 95% responderam que a tecnologia é utilizada para comunicação entre a equipe da escola, mas apenas 9% disseram utilizá-la para comunicação com pais e alunos.
A respeito da dimensão competência, que busca captar o quanto gestores e professores conhecem e sentem-se confortáveis com o uso de tecnologia para fins pedagógicos, é interessante notar que 99% das escolas relataram que pelo menos alguns professores utilizam tais recursos, mas quase 26% dos educadores os aproveitam apenas para preparar as aulas e realizar apresentações expositivas para os alunos. Em relação a capacitações profissionais, 77% das escolas responderam que poucos professores participaram de cursos sobre o uso de tecnologia e, quando o fizeram, foi apenas com o objetivo de aprender ferramentas básicas. Entre os professores e diretores que fizeram formação para uso de tecnologia, apenas 27% ficaram satisfeitos com as formações realizadas. Somente 3,4% das escolas reportaram que seus professores têm as competências necessárias para criar conteúdos e recursos digitais e adotar novas práticas pedagógicas com o uso de tecnologia.
A dimensão conteúdos e recursos digitais busca captar o tipo e a frequência com que estes recursos são utilizados na escola. Apesar de 95% delas terem respondido que utilizam conteúdos e recursos digitais, apenas 37% afirmaram que tais recursos são alinhados a critérios e objetivos definidos pelos seus projetos políticos pedagógicos. Com relação à fonte desses recursos, aproximadamente 65% reportaram acessar repositórios de conteúdos e recursos educacionais digitais (nacionais ou locais), mas 35% das escolas disseram acessar conteúdos somente por meio de buscadores de Internet. Apenas 5% das escolas reportaram que seus professores produzem os conteúdos e recursos digitais que utilizam.
Sobre a dimensão infraestrutura, as escolas relataram dificuldades no número e na qualidade dos equipamentos disponíveis, mencionando também problemas recorrentes na sua manutenção. Nas escolas participantes, a relação do número de alunos por equipamento (desktop, notebook e tablet) em funcionamento disponível para uso pedagógico varia de dez a 64 alunos para cada equipamento. Apenas 31% reportaram possuir até 15 alunos por equipamento na escola. Além disso, em 75% das escolas, os equipamentos estão localizados nos laboratórios de informática, com acesso limitado e esporádico. Em 21%, os computadores são utilizados apenas para fins administrativos. Apenas 3,2% das escolas contam com computadores para uso pedagógico dentro de salas de aula.
Com relação à conexão com a Internet, quase 16% reportaram que ela está disponível somente para uso administrativo. Em 65%, só há conexão a partir dos computadores fixos, e a Internet não é suficiente para acessar simultaneamente recursos educacionais mais complexos, que envolvem, por exemplo, vídeos ou jogos. Apenas 1,6% das escolas disse possuir acesso à Internet sem fio com capacidade de permitir múltiplos acessos a qualquer tipo de recurso educacional digital.
PESQUISA TIC EDUCAÇÃO 2016ARTIGOS38
PO
RTU
GU
ÊS
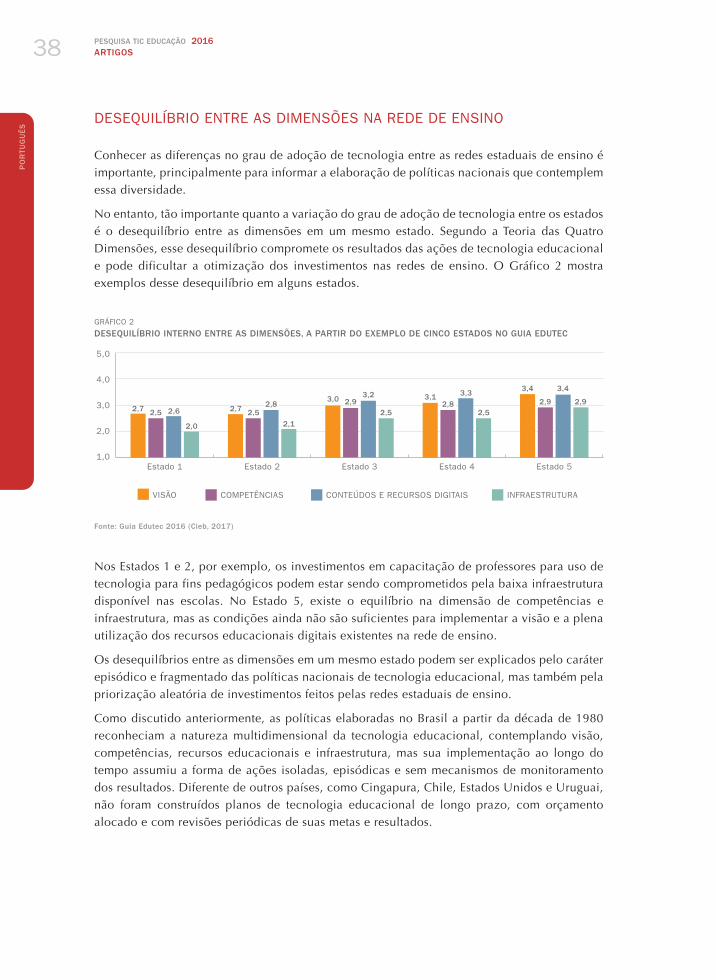
DESEQUILÍBRIO ENTRE AS DIMENSÕES NA REDE DE ENSINO
Conhecer as diferenças no grau de adoção de tecnologia entre as redes estaduais de ensino é importante, principalmente para informar a elaboração de políticas nacionais que contemplem essa diversidade.
No entanto, tão importante quanto a variação do grau de adoção de tecnologia entre os estados é o desequilíbrio entre as dimensões em um mesmo estado. Segundo a Teoria das Quatro Dimensões, esse desequilíbrio compromete os resultados das ações de tecnologia educacional e pode dificultar a otimização dos investimentos nas redes de ensino. O Gráfico 2 mostra exemplos desse desequilíbrio em alguns estados.
GRÁFICO 2DESEQUILÍBRIO INTERNO ENTRE AS DIMENSÕES, A PARTIR DO EXEMPLO DE CINCO ESTADOS NO GUIA EDUTEC
Estado 1 Estado 3Estado 2 Estado 4 Estado 5
5,0
4,0
3,0
2,0
1,0
VISÃO COMPETÊNCIAS CONTEÚDOS E RECURSOS DIGITAIS INFRAESTRUTURA
2,7 2,5 2,6
2,0
2,73,0 3,1
3,4
2,52,9 2,8 2,9
2,12,5 2,5
2,92,83,2 3,3 3,4
Fonte: Guia Edutec 2016 (Cieb, 2017)
Nos Estados 1 e 2, por exemplo, os investimentos em capacitação de professores para uso de tecnologia para fins pedagógicos podem estar sendo comprometidos pela baixa infraestrutura disponível nas escolas. No Estado 5, existe o equilíbrio na dimensão de competências e infraestrutura, mas as condições ainda não são suficientes para implementar a visão e a plena utilização dos recursos educacionais digitais existentes na rede de ensino.
Os desequilíbrios entre as dimensões em um mesmo estado podem ser explicados pelo caráter episódico e fragmentado das políticas nacionais de tecnologia educacional, mas também pela priorização aleatória de investimentos feitos pelas redes estaduais de ensino.
Como discutido anteriormente, as políticas elaboradas no Brasil a partir da década de 1980 reconheciam a natureza multidimensional da tecnologia educacional, contemplando visão, competências, recursos educacionais e infraestrutura, mas sua implementação ao longo do tempo assumiu a forma de ações isoladas, episódicas e sem mecanismos de monitoramento dos resultados. Diferente de outros países, como Cingapura, Chile, Estados Unidos e Uruguai, não foram construídos planos de tecnologia educacional de longo prazo, com orçamento alocado e com revisões periódicas de suas metas e resultados.
2016 PESQUISA TIC EDUCAÇÃOARTIGOS 39
PO
RTU
GU
ÊS
O objetivo do Guia Edutec é ajudar os gestores a identificar em quais dimensões sua rede de ensino necessita mais investimento, a fim de otimizar as ações de tecnologia educacional. O Guia Edutec é uma ferramenta em constante evolução e pretende oferecer, numa etapa posterior, orientações e subsídios técnicos para o planejamento e implementação de um plano de inovação e tecnologia que contemple todas as dimensões e identifique ações prioritárias para o equilíbrio entre elas.
O Cieb acredita que inovação e uso de tecnologia nas escolas são imprescindíveis para que o Brasil enfrente os desafios da educação pública. A experiência de países como a Estônia, terceiro lugar no Programa Internacional de Avaliação de Estudantes da OECD (do inglês, Programme for International Student Assessment – Pisa) em 2015, mostra que investimentos em inovação e tecnologia, quando bem planejados e implementados, podem promover avanços exponenciais na qualidade e equidade da educação.
REFERÊNCIAS
Almeida, M. E., & Valente, J. A. (2016). Políticas de tecnologia na educação brasileira: histórico, lições aprendidas e recomendações. CIEB Estudos 4, pp. 63-66. Recuperado em 20 junho, 2017, de http://www.cieb.net.br/wp-content/uploads/2016/12/CIEB-Estudos-4-Politicas-de-Tecnologia-na-Educacao-Brasileira.pdf
Centro de Inovação para a Educação Brasileira - Cieb. (2017). Resultados do Guia EduTec 2016: Adoação de tecnologia nas redes estaduais de ensino. Recuperado em 20 junho, 2017, de http://www.cieb.net.br/guia-edutec/
Kathleen, F. (2000). Teacher preparation STaR Chart: A self-assessment tool for colleges of education. Preparing a new generation of teachers. Washington: CEO Forum on Education and Technology. Recuperado em 20 junho, 2017, de https://eric.ed.gov/?id=ED437382
Kennisnet. (2007). Four in balance monitor 2007: ICT in education in the Netherlands. Zoetermeer: Kennisnet. Recuperado em 20 junho, 2017, de http://downloads.kennisnet.nl/onderzoek/fourinbalancemonitor2007.pdf
Organização para a Cooperação e Desenvolvimento Econômico - OCDE. (2015). Students, Computers and Learning: Making the Connection. Recuperado em 20 junho, 2017, de http://dx.doi.org/10.1787/9789264239555-en
Senter For IKT I Utdanningen. (n.d.). Skolementor. Recuperado em 10 março, 2017, de http://www.skolementor.no
Texas Education Agency. (2006). Texas STaR Chart. School technology and readiness: A teacher tool for planning and self-assessing aligned with the long-range plan for technology, 2006-2020. Austin: TEA. Recuperado em 20 junho, 2017, de https://www.txstarchart.org/
Tondeur, J., Coenders, A., Braak, J. V., Brummelhuis, A. T., & Wanderlinde, R. (2009). Using online tools to support technology integration in education. In: L. T. Hin, & R. Subramaniam (Eds.), Handbook of research on new media literacy at the K-12 level: Issues and challenges (pp. 389-402). Recuperado em 20 junho, 2017, de http://www.igi-global.com/chapter/using-online-tools-support-technology/35927

2016 PESQUISA TIC EDUCAÇÃOARTIGOS 41
PO
RTU
GU
ÊS
PROJETO CONECTADOS: VIABILIZANDO A CONSTRUÇÃO DA CULTURA DIGITAL NAS ESCOLAS PÚBLICAS PARANAENSES
Mary Ângela Teixeira Brandalise 1
INTRODUÇÃO
O objetivo central da pesquisa que originou este texto foi a análise do projeto CONECTADOS, que integra a política educacional paranaense, desenvolvido em 70 escolas públicas estaduais no ano de 2016, a partir da avaliação dos gestores escolares – diretores e equipes pedagógicas. O instrumento de coleta de dados foi um questionário on-line, contendo questões abertas e fechadas, enviado para o e-mail das escolas solicitando aos gestores que avaliassem o projeto, considerando as seguintes dimensões: a infraestrutura das tecnologias de informação e comunicação (TIC) na escola; a participação da equipe gestora, dos professores e alunos; a integração das TIC nas práticas pedagógicas e os resultados/efeitos alcançados. Além desta introdução e das considerações finais, o texto está organizado em três partes: na primeira, faz-se uma breve abordagem sobre a teoria da atuação política de Ball, Maguire e Braun (2016); na segunda, discute-se a importância da cultura digital no contexto escolar e apresenta-se a proposta do projeto CONECTADOS; e, na terceira, faz-se a análise da atuação da política a partir dos dados coletados.
A TEORIA DA POLÍTICA EM AÇÃO OU DA ATUAÇÃO POLÍTICA: PRESSUPOSTOS PARA ANÁLISE DE POLÍTICAS EDUCACIONAIS
A análise crítica da trajetória de políticas educacionais, seus programas e projetos pode se valer de diferentes referenciais analíticos, dentre eles a abordagem do ciclo de políticas de Stephen Ball e seus colaboradores. Recentemente, Ball, Maguire e Braun propuseram a teoria da política em ação (do inglês, theory of policy enactment) ou da atuação política, publicada no livro How schools do policy: policy enactments in secondary schools
1 Professora do Programa de Pós-graduação em Educação da Universidade Estadual de Ponta Grossa (UEPG), é doutora em Educação: Currículo pela Pontifícia Universidade Católica de São Paulo (PUC-SP) e coordenadora do Grupo de Estudos e Pesquisas em Política Educacional e Avaliação (Geppea).

PESQUISA TIC EDUCAÇÃO 2016ARTIGOS42
PO
RTU
GU
ÊS
(segundo versão em português, Como as escolas fazem as políticas: atuação em escolas secundárias), na Inglaterra, em 2012.2
O termo policy enactment é de difícil tradução. Na língua portuguesa pode ser entendido como as políticas são colocadas em ação em determinado contexto. A teoria da política em ação “rejeita a noção de que as políticas são implementadas. Elas estão sujeitas a processos de tradução e de interpretação no contexto da prática” (Ball, Maguire, & Braun, 2016, p. 12).
Na perspectiva defendida pelos autores, as políticas são traduzidas, interpretadas e materializadas de várias maneiras pelos sujeitos nela envolvidos. A interpretação consiste em uma leitura inicial da política com o objetivo de aproximar-se de seu sentido, questionando qual o significado do texto político para os envolvidos e como colocá-lo em ação. A interpretação é um processo político institucional, é uma vinculação com as linguagens da política, enquanto a tradução está mais próxima da linguagem da prática.
A tradução consiste de um processo interativo de criação de textos institucionais e de colocação desses textos em ação e, para isso, pode-se utilizar táticas que incluem a realização de palestras, reuniões, encontros, planos, eventos, bem como produzir artefatos e emprestar ideias e práticas de outros contextos, adquirir materiais, consultar websites oficiais e receber suporte oferecido por membros das autoridades locais. “A interpretação é sobre a estratégia e a tradução é sobre táticas, mas elas também são, por vezes, intimamente entrelaçadas e sobrepostas. Elas trabalham juntas para registrar ou abordar assuntos e inscrever o discurso nas práticas” (Ball et al., 2016, p. 72).
Os autores afirmam que colocar as políticas em prática é um processo complexo, não linear, sofisticado e criativo, porque elas entram em ação em condições materiais diferenciadas, com recursos variados, em relação às tarefas específicas. A teoria da atuação política atribui ao contexto um papel fundamental. As dimensões materiais, estruturais e relacionais precisam ser incorporadas na análise de políticas, a fim de que se possa compreender melhor a sua atuação em âmbito institucional. Tais condições são denominadas dimensões contextuais da atuação da política. São elas:
– Contextos situados (por exemplo: histórias da escola, cenário local, matrículas);
– Culturas profissionais (por exemplo: valores, compromissos e experiências dos professores
e gestão nas escolas);
– Contextos materiais (por exemplo: recursos humanos, financeiros, de infraestrutura,
de tecnologia);
– Contextos externos (por exemplo: nível e qualidade de apoio da autoridade local,
pressões e expectativas do contexto político mais amplo, como classificações, índices
e taxas a serem atingidas, rankings, exigências e responsabilidades legais). (Ball et al.,
2016, p. 38).
A relevância da definição das dimensões contextuais, segundo os autores, consiste em primeiro lugar no fato de que as políticas são colocadas em ação em ambientes, tais como
2 O livro foi traduzido e publicado pela Editora UEPG, em 2016, com o título: Como as escolas fazem as políticas: atuação em escolas secundárias.

2016 PESQUISA TIC EDUCAÇÃOARTIGOS 43
PO
RTU
GU
ÊS
as escolas, que se diferem muito nas questões de recursos humanos, materiais e financeiros, na infraestrutura, no histórico das instituições, no perfil socioeconômico dos alunos, entre outros aspectos. Em segundo lugar, consiste em alterar a visão da escola enquanto uma organização homogênea, sem o devido reconhecimento das diferentes culturas, histórias, tradições, valores e compromissos que nela coexistem. Por fim, os autores explicitam que as pressões externas sobre o desempenho da escola, para atender determinadas metas, é sempre determinante nas ações que ela realiza.
Uma política, um programa ou um projeto educacional sofre inúmeras influências nos contextos onde é colocado em ação, ou seja, o contexto é único para cada escola, é uma força atuante e não apenas um pano de fundo nelas operado. “O contexto inicia e ativa processos de políticas e escolhas que são continuadamente construídos e desenvolvidos, tanto de dentro quanto de fora, em relação aos imperativos e às expectativas de política” (Ball et al., 2016, p. 42). Sendo assim, ele é um fator mediador no trabalho de atuação das políticas realizado nas escolas.
Considerando o breve diálogo estabelecido com os autores sobre a teoria da atuação política e as dimensões contextuais, pode-se apontar a importância de pesquisas voltadas à análise de políticas educacionais, quando colocadas em ação em contextos variados, ou seja, como elas são recontextualizadas, interpretadas e traduzidas nos espaços formativos e nas instituições escolares. A pesquisa realizada sobre o projeto CONECTADOS, desenvolvido em escolas paranaenses, considerou tais pressupostos teóricos. Parte de seus resultados são apresentados e discutidos neste artigo.
CULTURA DIGITAL NAS ESCOLAS: A PROPOSIÇÃO DO PROJETO CONECTADOS
A problematização da cultura digital nas escolas é considerada um dos eixos centrais das edições da Pesquisa sobre o Uso das Tecnologias de Informação e Comunicação nas Escolas Brasileiras – TIC Educação, do Centro Regional de Estudos para o Desenvolvimento da Sociedade da Informação (Cetic.br), dada a importância e necessidade de inclusão da escola e de toda a comunidade escolar – gestores, professores, alunos, pais – na cultura digital da sociedade.
A complexidade de conceituar cultura digital é discutida por Iannone, Almeida e Valente (2016, p. 57), quando evidenciam que “não é a tecnologia que determina ou contribui para a evolução da cultura digital (...) o que se identifica como cultura digital deve ser reconhecido a partir do recente desenvolvimento tecnológico e de outros conhecimentos que foram construídos”. Atualmente há um forte movimento para a disseminação da cultura digital na sociedade e, por consequência, na educação, fazendo com que se reflita sobre as práticas pedagógicas e sobre o processo de ensino e de aprendizagem realizado nos contextos escolares. Os autores explicam que:
A escola que participa da cultura digital e dialoga com ela assume papel central na formação
de estudantes com autonomia para tomar decisões, argumentar em defesa de suas ideias,
trabalharem em grupo, atuar de forma ativa e questionadora diante dos acontecimentos,
dificuldades e desafios, e participar do movimento de transformação social. Nesta
escola, o potencial das TIC é incorporado às suas práticas por meio da exploração da
PESQUISA TIC EDUCAÇÃO 2016ARTIGOS44
PO
RTU
GU
ÊS
mobilidade, da conexão e da multimodalidade, para permitir a autoria do estudante, que
busca informações em distintas fontes; estabelece novas relações entre as informações,
os conhecimentos sistematizados e aqueles que emergem das conexões nas redes ou são
gerados nas experiências de vida; (reconstrói) conhecimentos representados por meio de
múltiplas linguagens e de estruturas não lineares; interage e trabalha em colaboração com
pares e especialistas situados em distintos lugares. (Iannone et al., 2016, p. 62)
Foi nessa perspectiva que, em 2015, a Diretoria de Políticas e Tecnologias Educacionais da Secretaria de Estado da Educação do Paraná (Seed–PR) concebeu o Projeto CONECTADOS3 para as escolas públicas paranaenses, em consonância com os objetivos do Programa Minha Escola Tem Ação (Meta), que tem como propósito o fortalecimento da gestão escolar visando à melhoria da qualidade de ensino da educação básica paranaense, à redução das taxas de abandono, de reprovação e de aprovação por conselho de classe, e à diminuição da distorção idade/ano nas escolas.
O projeto CONETADOS visou atender à Ação 6 do Programa Meta, definida como: tecnologia educacional – práticas pedagógicas e gestão escolar. A proposição do projeto no âmbito das políticas educacionais paranaenses considerou principalmente os avanços e desafios que se referem à conexão com a Internet e a Intranet nas escolas públicas estaduais, à distribuição de tablets educacionais para os professores do quadro próprio do magistério paranaense e à tendência e às vantagens no uso de dispositivos móveis em espaços escolares.
O projeto foi implantado e desenvolvido em setenta escolas do estado do Paraná, em 2016, e previa a implantação e manutenção de recursos tecnológicos, a fim de ampliar o acesso às tecnologias de informação e comunicação em diferentes ambientes do espaço escolar para além dos laboratórios de informática, considerando o desenvolvimento de sistemas e a formação de profissionais para uso pedagógico de tais recursos.
O objetivo central do projeto foi estimular a diversificação das práticas pedagógicas, com a distribuição de tablets educacionais – ampliando o acesso por parte das escolas, dos professores e dos alunos aos recursos tecnológicos –, e contribuir para a melhoria do processo de ensino e de aprendizagem, e da organização e gestão escolares. Em função do objetivo definido, além de atender à Ação 6 do Programa Meta, ele perpassa também as demais ações definidas, como se pode constatar nos objetivos específicos traçados:
– Ofertar aos profissionais da educação envolvidos neste processo, atuantes nas escolas
indicadas, formação para a administração e uso dos equipamentos distribuídos;
– Fomentar o acesso a objetos digitais de aprendizagem consolidando o uso do repositório
digital de conteúdos da Seed-PR;
– Estimular o uso de aplicativos disponíveis (on-line e off-line) por meio de propostas
metodológicas diferenciadas;
– Incentivar a prática de produção de objetos educacionais a partir do acesso às ferramentas
e aplicativos disponíveis na Internet;
3 Mais informações sobre o projeto CONECTADOS no website da Secretaria de Educação do Paraná. Recuperado em 10 maio, 2017, de http://www.gestaoescolar.diaadia.pr.gov.br/modules/conteudo/conteudo.php?conteudo=1544

2016 PESQUISA TIC EDUCAÇÃOARTIGOS 45
PO
RTU
GU
ÊS
– Promover o intercâmbio de práticas e diferentes abordagens de ensino com o uso de
tablets educacionais entre professores;
– Avaliar os efeitos do uso de tablets educacionais na prática pedagógica e na organização
escolar. (Secretaria de Estado da Educação do Paraná [Seed-PR], 2016, p.4, grifo nosso)
Para a concretização desses objetivos foram traçadas ações que envolveram a infraestrutura de conexão à Internet das escolas, a distribuição de kits com equipamentos de informática, a formação continuada de professores e o suporte técnico dos recursos para a utilização de tecnologias educacionais pela rede pública estadual de ensino, além da pesquisa e do acompanhamento das ações desenvolvidas durante a execução do projeto.
O PROJETO CONECTADOS NO CONTEXTO DA ESCOLA
Nesta seção vamos analisar como os sujeitos que participaram do projeto CONECTADOS colocaram essa política em ação (enactment), em um processo de interpretação e tradução (Ball et al., 2016), a partir da avaliação dos gestores das escolas que aderiram ao projeto.
Os dados empíricos coletados junto ao grupo de participantes foram extraídos dos 59 questionários devolvidos pelas escolas. Cada um deles recebeu um código formado pela letra E (escola) seguida de uma numeração, sendo as escolas identificadas assim: E1, E2, E3... até E59. A análise dos dados seguiu uma perspectiva quali-quantitativa, e os depoimentos foram organizados conforme a metodologia do Discurso do Sujeito Coletivo – DSC (Lefèvre & Lefèvre, 2005). Essa abordagem reúne as ideias centrais dos depoimentos individuais sobre determinado assunto num único texto para expressar o pensamento coletivo, gerando assim o discurso do sujeito coletivo. Neste texto estão apresentados os DSC de três categorias: i) infraestrutura de TIC na escola; ii) participação da equipe gestora, dos professores e alunos; e iii) integração das TIC nas práticas pedagógicas e os resultados observados.
I – SOBRE A INFRAESTRUTURA DE TIC NA ESCOLA
As escolas que aderiram ao projeto CONECTADOS pertencem a variados Núcleos Regionais de Educação (NRE) do Estado do Paraná, portanto, são oriundas de regiões e municípios diversos, de distintos contextos sociais e econômicos, e com diferentes estruturas organizacionais e físicas. Foram quase unânimes nos depoimentos dos respondentes tanto as fragilidades da estrutura física para a alocação de equipamentos tecnológicos dessas escolas quanto a baixa qualidade das redes de Internet e wireless, devido à baixa velocidade e à pouca capacidade para atendimento dos grupos de alunos participantes. Aliada a essas deficiências, somou-se a qualidade dos tablets enviados às escolas, pois o funcionamento deles era demasiadamente lento, não possibilitando muitas vezes a utilização de aplicativos nas atividades planejadas pelos docentes. A utilização dos dispositivos foi considerada regular por 43% dos investigados, boa por 38% e muito boa por 19% deles, revelando que as dificuldades estruturais prejudicaram em parte o trabalho dos professores, como se pode constatar nos depoimentos:

PESQUISA TIC EDUCAÇÃO 2016ARTIGOS46
PO
RTU
GU
ÊS
DSC1: O projeto foi um marco na história de nosso colégio e, apesar de muitos entraves,
foi um grande sucesso (E8). O projeto Conectados é muito bom, estimula a aprendizagem
e torna as aulas mais atrativas. Entretanto, os tablets não funcionaram, foi necessário usar
os laboratórios de informática e os celulares dos alunos, quando estes os possuíam. Além
disso, a rede de conexão com a Internet é insuficiente, inviabilizando o trabalho com os
tablets nas salas de aula. Aguardamos a liberação do recurso para ampliação da rede que
estava previsto no momento da adesão ao projeto CONECTADOS (E13). Somos favoráveis
à inovação e utilização das mídias no processo de ensino e aprendizagem, porém jamais
será eficiente e atingirá os resultados pretendidos se a mantenedora não proporcionar
condições adequadas de instalação e potência da Internet nas escolas (E4). A utilização dos
tablets nas salas de aula se deu de forma regular devido à baixa qualidade dos dispositivos
móveis, sendo assim, os alunos preferiram usar seus próprios smartphones (E37). Para que
possamos ser CONECTADOS, é preciso investir em Internet de alta qualidade e tablets
modernos. A maioria dos tablets está obsoleta. Sem isso, CONECTADOS é utopia (E1).
Os depoimentos revelam como a política foi interpretada, traduzida e modificada no contexto da prática, face às fragilidades na infraestrutura das escolas quanto à qualidade das redes de Internet, ou seja, devido aos contextos materiais das escolas para utilização de novas tecnologias – como referem Ball et al. (2016) –, decorrente do não cumprimento da liberação de recursos financeiros pelo Estado, conforme definido na proposição inicial do projeto. Ao se depararem com a qualidade insuficiente dos tablets para rodar determinados aplicativos nas atividades, os professores buscaram alternativas com outros dispositivos móveis como, por exemplo, os celulares dos alunos, o que revela que a política em ação foi recontextualizada e modificada, conforme as condições materiais disponíveis nas salas de aula e nas escolas.
II – SOBRE A PARTICIPAÇÃO DA EQUIPE GESTORA, DOS PROFESSORES E ALUNOS
A participação das equipes pedagógicas das escolas nos encontros de formação continuada foi considerada muito boa por 61% e boa por 39%. Já a participação dos professores foi avaliada como muito boa por 41%, boa por 51% e regular por 8% dos gestores. Quanto à participação dos professores nos grupos de estudo, 41% dos gestores a consideraram muito boa, 54% boa e 5% regular. Quanto ao planejamento das atividades pelos professores, 49% consideraram-no muito bom, 42% bom e 8% regular.
As respostas ao questionamento sobre a participação nos encontros de formação colocaram em destaque a formação referente à utilização da tecnologia nas práticas pedagógicas:
DSC3: O tempo para a formação foi muito valioso, acarretando troca de experiências
e planejamento interdisciplinar (E11). Os professores receberam mais informações
sobre informática, sentiram-se mais preparados para trabalhar com novas tecnologias e
metodologias com os alunos, implementando assim suas aulas e tornando-as mais atrativas
(E17). Importante também foi a busca do conhecimento dos docentes para utilizar novas
ferramentas; a disponibilidade e prontidão do professor-tutor em sanar sempre dúvidas (E8), a
presença e acompanhamento do funcionário do NRE para dar o suporte necessário para que
o projeto acontecesse (E41) e, por fim, a troca de experiências e interesse dos professores,
que mesmo estando sobrecarregados permaneceram no curso até o final da formação (E33).

2016 PESQUISA TIC EDUCAÇÃOARTIGOS 47
PO
RTU
GU
ÊS
Quanto à participação do coletivo da escola no desenvolvimento do projeto, os depoentes declararam que:
DSC4: O que vale ser ressaltado é o envolvimento, tanto da equipe pedagógica quanto
dos professores e alunos, na realização das atividades. O grupo foi além das expectativas,
abraçando as propostas de trabalho numa abordagem ampla e objetiva, e a comunidade
escolar foi mobilizada no que tange à inclusão digital no contexto educacional (E10).
Nas aulas em que são utilizados os recursos tecnológicos, os alunos participam mais
ativamente e apresentam menos problemas de disciplina (E31). Houve maior integração
entre os alunos, maior aceitação ao uso das novas tecnologias (E9). Os alunos que
participaram se sentiram importantes e melhoraram seu desempenho (E5).
A participação dos envolvidos no projeto CONECTADOS, em todos os momentos de seu desenvolvimento, revelou o compromisso da grande maioria dos sujeitos que o integrou, o que favoreceu o uso de novas tecnologias no contexto da escola e da sala de aula, qualificando o processo de ensino e de aprendizagem e gerando um movimento institucional disseminador de uma nova cultura, a cultura digital, como defendem Iannone et al. (2016).
III – SOBRE A INTEGRAÇÃO DAS TIC NAS PRÁTICAS PEDAGÓGICAS E OS RESULTADOS ALCANÇADOS
A utilização dos tablets e outros dispositivos móveis, bem como seus resultados e efeitos nas práticas pedagógicas, na aprendizagem dos alunos e na organização da escola, foi avaliada pelos participantes conforme dados apresentados na Tabela 1.
TABELA 1AVALIAÇÃO DOS RESULTADOS/EFEITOS DO PROJETO CONECTADOS (2017)
Resultados /efeitos Muito bom Bom Regular
Os resultados /efeitos do uso dos tablets e /ou outros dispositivos móveis nas práticas pedagógicas dos professores 29% 44% 27%
Os resultados /efeitos do uso dos tablets e /ou outros dispositivos móveis na aprendizagem dos alunos 22% 49% 29%
Os resultados /efeitos do desenvolvimento do projeto na organização da escola 32% 54% 14%
Fonte: Questionários da pesquisa.
A investigação dos resultados/efeitos do projeto CONECTADOS nas práticas pedagógicas, na aprendizagem dos alunos e na própria organização da escola revela que eles foram considerados bons, uma vez que os maiores valores percentuais se concentraram no item “Bom” da escala de avaliação. A diversidade de opiniões fica evidenciada no DSC6, quando os depoentes explicam os resultados/efeitos observados:
DSC6: Os resultados foram satisfatórios, sendo que, com a adesão ao projeto, os professores
passaram a incluir os dispositivos móveis como o tablet e o celular na prática pedagógica,
e também o laboratório de informática passou a ser mais utilizado no decorrer do projeto.

PESQUISA TIC EDUCAÇÃO 2016ARTIGOS48
PO
RTU
GU
ÊS
As tecnologias estão ao alcance da maioria das pessoas e inserir as mesmas no processo
de ensino aprendizagem faz com que haja a ampliação do conhecimento e a melhoria
da qualidade do ensino (E26). O projeto oportunizou a utilização pedagógica de diversas
mídias educacionais. Sabemos da importância da aprendizagem móvel e a utilização desses
equipamentos. A prática docente pode apresentar mudanças na qualidade do trabalho
desenvolvido no ambiente escolar. Foi possível perceber a necessidade de adequação a esse
estilo de aprendizagem, pois os alunos têm maior interesse de aprender dessa forma (E7).
A diversificação metodológica a partir do trabalho com as novas mídias melhorou a
qualidade do processo de ensino e aprendizagem (E1). As aulas ficaram mais atrativas e
dinâmicas e também houve uma mudança significativa na forma de avaliar os alunos (E18).
Constatamos que os tablets fornecidos estão sendo utilizados por muitos professores em
sala de aula, como instrumentos de fonte de pesquisas em vários sites, dos mais variados
assuntos. Isto é muito importante para a aprendizagem dos alunos (E22). É necessário que
haja o fomento das novas tecnologias no contexto educacional, que os professores sejam
capacitados e tenham as condições para promover a inclusão digital e melhorar o ensino
aprendizagem tendo os recursos como instrumentos de mediação do processo de ensino
aprendizagem. Por maiores que sejam os desafios, é preciso enfrentá-los, e o CONECTADOS
é meio de promover este processo e até mesmo reivindicar melhores condições no que
concerne à aquisição de novas tecnologias e à capacitação para tal (E52).
Considerando que o objetivo do projeto CONECTADOS foi estimular a diversificação das práticas pedagógicas por meio da distribuição de tablets educacionais e da ampliação do acesso aos recursos tecnológicos por parte das escolas, dos professores e dos alunos, e ainda contribuir para a melhoria do processo de ensino e de aprendizagem, e da organização e gestão da escola, pode-se inferir que, embora a política tenha sido recontextualizada na prática, devido às condições das escolas e da mantenedora, a criatividade dos professores e das equipes pedagógicas foi fundamental, ao transformar os textos políticos (interpretação e tradução) em situações viáveis dentro da complexidade do ambiente de sala de aula em que eles se materializaram. Como afirmam Ball et al. (2016, p. 198), “as políticas serão abertas a mudanças situadas; elas podem integrar-se em formas mais antigas de trabalho – a história de discursos anteriores – e tornar-se invisíveis ou afirmadas dentro de novas tecnologias e novas formas de fazer a escola”.
CONSIDERAÇÕES FINAIS
A análise dos resultados da pesquisa, a partir da teoria de atuação da política, evidenciou como as escolas lidaram realmente com as demandas que se apresentavam, ou melhor, como ela foi realizada no contexto da prática. Os diferentes modos como as participantes criativamente trabalharam para desenvolver as práticas fora dos textos da política do projeto CONECTADOS, em função de suas realidades situadas, foram contextualmente mediados e institucionalmente concebidos, gerando um processo de recontextualização que produziu práticas heterogêneas, dependendo dos atores da política e de como ela foi teorizada em cada escola. Enquanto uma política educacional paranaense desenvolvida com o propósito de fomentar a cultura digital nas práticas pedagógicas das escolas estaduais, pode-se afirmar que o projeto CONECTADOS possibilitou para as escolas envolvidas dar os primeiros passos para a construção da cultura

2016 PESQUISA TIC EDUCAÇÃOARTIGOS 49
PO
RTU
GU
ÊS
digital na escola, e que ela pode e deve estar em sala de aula e na escola. No entanto, acredita-se que ainda é necessário o aprimoramento e a continuidade das ações, bem como a ampliação do projeto CONECTADOS, a fim de viabilizar a construção da cultural digital nas escolas públicas paranaenses.
REFERÊNCIAS
Ball, S. J., Maguire, M., & Braun, A. (2016). Como as escolas fazem as políticas: atuação em escolas secundárias. Ponta Grossa: Editora UEPG.
Iannone, L. R., Almeida, M. E., & Valente, J. A. (2016). Pesquisa TIC Educação: Da inclusão para a cultura digital. In: Comitê Gestor da Internet no Brasil - CGI.br, Pesquisa sobre o uso das tecnologias de informação e comunicação nas escolas brasileiras: TIC Educação 2015. São Paulo: CGI.br.
Lefèvre, F., & Lefèvre, A. M. (2005). Depoimentos e discursos: uma proposta de análise em pesquisa social. (Série Pesquisa , 12). Brasília: Liber Livro.
Secretaria da Educação do Paraná. (2016). Projeto Conectados. Recuperado em 10 outubro, 2016, de http://www.gestaoescolar.diaadia.pr.gov.br/modules/conteudo/conteudo.php?conteudo=1544


2016 PESQUISA TIC EDUCAÇÃOARTIGOS 51
PO
RTU
GU
ÊS
APROPRIAÇÕES SOCIAIS E FORMATIVAS DAS TECNOLOGIAS DIGITAIS POR ADOLESCENTES E SUAS RELAÇÕES COM A EDUCAÇÃO ESCOLAR 1
Analigia Miranda da Silva 2 e Claudia Maria de Lima 3
INTRODUÇÃO
Pensar a educação na contemporaneidade demanda compreender práticas educativas em inter-relação com o contexto sociocultural atual. Há mudanças em curso nas formas de se relacionar, comunicar e conhecer, propiciadas pelo avanço e pela diversificação das tecnologias digitais e que promovem práticas socioculturais que transcendem tempo e espaço, refletindo diretamente na maneira como o conhecimento é produzido, dissipado e adquirido (Pretto, 2010). É nesse contexto que nos deparamos com a iminência da revisão de currículos e práticas educacionais, decorrente do surgimento de novas necessidades formativas.
Diante dessa perspectiva, o desenvolvimento da nossa pesquisa partiu, essencialmente, de questionamentos acerca de quais práticas pedagógicas podem ir ao encontro dos modos de apropriação e estratégias de aprendizagem mobilizadas por alunos em contextos de uso pedagógico das tecnologias digitais de informação e comunicação. Esses questionamentos culminaram nos seguintes objetivos de pesquisa: identificar e analisar os modos de apropriação e as estratégias de aprendizagem mobilizadas por adolescentes dos anos finais dos Ensinos Fundamental e Médio, em contextos de uso das tecnologias digitais; e identificar e analisar representações dos professores sobre as suas práticas desses usos, com vistas a pensar/repensar a formação docente sobre as tecnologias digitais nos processos de ensino e aprendizagem.
1 Pesquisa financiada pela Fundação de Amparo à Pesquisa do Estado de São Paulo (Fapesp).2 Doutora e mestre em Educação pela Universidade Estadual Paulista (Unesp), de Presidente Prudente, possui
graduação em Pedagogia pela Unesp de São José do Rio Preto. É participante do grupo de pesquisa As Tecnologias de Informação e Comunicação, Práticas Pedagógicas e a Docência, também da Unesp.
3 Professora doutora do Programa de Pós-Graduação em Educação da Unesp de Presidente Prudente e do Departamento de Educação da Unesp de São José do Rio Preto. Participa do Centro Internacional de Estudos em Representações Sociais e Subjetividade – Educação (CIERS-ed) da Fundação Carlos Chagas (FCC).

PESQUISA TIC EDUCAÇÃO 2016ARTIGOS52
PO
RTU
GU
ÊS
No estudo, tomamos como referencial teórico a abordagem da cognição distribuída (Hutchins, 2000; Salomon, 2001), que tem suas bases conceituais nas ideias de Vigotski (1998) sobre a relação das funções mentais superiores com instrumentos e signos.
O entrelaçamento entre o uso das tecnologias digitais e a cognição é uma discussão importante quando pensamos em processos escolares. Compreendemos que o processo de ensino-aprendizagem, sob a perspectiva vigotskiana, pressupõe as tecnologias digitais enquanto instrumentos psicológicos, com capacidade mediadora na promoção de processos inter e intramentais promotores de desenvolvimento cognitivo.
A natureza social e participativa das tecnologias digitais reflete potencialidades na promoção de novos espaços de construção do conhecimento advindos da ação partilhada entre os sujeitos, o que está de acordo com a abordagem da cognição distribuída (Salomon, 2001).
Cabe situar o conceito de cognição distribuída de forma específica em seu campo de conhecimento. O aporte teórico do conceito de cognição distribuída parte da ciência cognitiva, campo de estudo recente, que procura responder questões relacionadas à mente e às organizações do sistema cognitivo (Matlin, 2004). No entanto, alguns autores esclarecem que a abordagem tradicional dos estudos cognitivos considera os processos mentais circunscritos ao indivíduo, fazendo distinção entre cultura e cognição, enquanto a abordagem da cognição distribuída relaciona os processos mentais entre uma série de elementos, humanos ou tecnológicos, na execução de uma atividade mental (Hollan, Hutchins, & Kirsh, 2000; Hutchins, 2000; Rogers, 1997).
A abordagem da cognição distribuída tem origem nos estudos do antropólogo cognitivo Edwin Hutchins (1995) sobre processos de navegação em alto-mar. O pesquisador deu visibilidade ao fenômeno quando demonstrou que os sistemas de navegação dos navios partem de complexas relações entre humanos e máquinas. Ele conclui que a cognição emerge de uma rede complexa de instrumentos, distribuídos no tempo e no espaço, e da interação entre humanos, ou seja, a cognição resulta de um processo partilhado entre o indivíduo, os grupos sociais e os artefatos técnicos vinculados ao período sócio-histórico vivido.
Hollan, Hutchins e Kirsh (2000) no artigo Distributed Cognition: Toward a New Foundation for Human-Computer Interaction Research (em português, Cognição distribuída: no caminho de novas referências para pesquisas sobre a interação humano-computador) nos dizem que a abordagem da cognição distribuída, como qualquer outra teoria cognitiva, procura compreender como os sistemas cognitivos se organizam, mas vai além das teorias tradicionais quando estende o seu campo de visão para além do indivíduo e considera o grupo, as interações e o material como parte fundante dos processos cognitivos.
A abordagem da cognição distribuída parte, então, de dois princípios: 1) considera o desenvolvimento cognitivo onde quer que ele possa ocorrer, em especial, nas relações estabelecidas entre sujeito e meio ou ferramenta; 2) considera os processos cognitivos para além de aspectos biológicos, em que o mundo material também oferece oportunidades para reorganizar o sistema cognitivo que se torna distribuído por meio de trocas inter e intramentais. De forma radical, cognição distribuída parte do pressuposto de que os processos cognitivos são indissociáveis da interação do sujeito com o mundo e com os artefatos técnicos nele presentes.

2016 PESQUISA TIC EDUCAÇÃOARTIGOS 53
PO
RTU
GU
ÊS
Salomon (2001), sobre o caráter distribuído da cognição, se propõe a compreender onde ela ocorre. Para responder essa questão, o teórico parte de uma perspectiva que considera, de forma conjunta, os processos mentais dos indivíduos e os artefatos/ferramentas que estão a sua disposição. O caráter de distribuição parte do princípio de se considerar a existência de variadas fontes de distribuição, mas que estas fontes operem simultaneamente. Como resultado, novos saberes são construídos.
A interação entre os diferentes elementos – sujeitos e artefatos – resulta em saberes que não podem ser atribuídos a um elemento específico, mas sim à interação entre eles. Dessa forma, a inteligência se torna coletiva, ou seja, produto de estruturas mentais individuais e coletivas. A cognição individual se inter-relaciona com a cognição social, que é distribuída pelos recursos digitais, e ambas se desenvolvem em um processo aberto e indefinido, como numa espiral: o aprendiz age sobre o ambiente com sua estrutura cognitiva existente (que compreende aspectos biológicos, conhecimentos prévios, representações, questões afetivas, dentre outros elementos que compõem a cognição humana) e o transforma estruturalmente, com ações mais complexas. Esse saber modificado passa a integrar a estrutura cognitiva do indivíduo e do ambiente, ou seja, passa a ser um saber social que é distribuído via agentes humanos e não humanos. É nesse sentido que a cognição distribuída compreende contextos sociais, culturais e físicos.
As interações entre as partes de um sistema distribuído de cognição (que compreende a cognição do sujeito, os saberes que circulam e as diversas representações simbólicas ou mediadores) alteram os sistemas em contínuo. É nesse sentido que toda cognição é socialmente distribuída, ou seja, há uma dimensão inerentemente social, pois mesmo a subjetividade não se sustenta na ausência das relações sociais.
A rede cibernética, com suas características simbólicas, sociais, comunicativas e, consequentemente, representacionais, bem como sua capacidade de expansão, adaptação e readaptação, torna-se um meio profícuo para o fenômeno da cognição distribuída. A rede só existe porque há um pensamento individual/coletivo que a alimenta continuamente, em um processo dinâmico e descentralizado. O processo é individual e coletivo. Individual pois a aprendizagem é do sujeito, parte dele e de suas representações iniciais; e coletivo porque pressupõe onde ele pode chegar com a ajuda do outro. É o que Vigotski (1998) chama de Zona de Desenvolvimento Proximal, isto é, a distância entre o desenvolvimento atual do indivíduo, que é determinado pela sua capacidade de resolver um problema sem ajuda, e o nível de desenvolvimento potencial, determinado por meio da resolução de problemas com a ajuda do outro.
No caso da cognição distribuída, as denominadas zonas de construção, ou seja, o espaço existente entre o que o indivíduo faz sozinho e o que ele tem potencialidade para fazer com a intervenção do outro, ocorrem quando os sujeitos, ao usarem os artefatos técnicos, mudam a si mesmos e as próprias ferramentas em um contínuo. Cabe refletir sobre as apropriações dos alunos frente a estas ferramentas e pensar em possibilidades formativas nas práticas escolares com o uso desse recurso.

PESQUISA TIC EDUCAÇÃO 2016ARTIGOS54
PO
RTU
GU
ÊS
A PESQUISA
O delineamento de uma pesquisa é, de acordo com Gil (2008), o amplo planejamento de meios para alcançar os objetivos a serem alcançados na investigação do estudo, com a previsão de instrumentos e procedimentos. Nesta seção apresentamos a metodologia e os respectivos procedimentos adotados na pesquisa, composta por três etapas que se inter-relacionam para responder aos objetivos do estudo.
A pesquisa assumiu a abordagem qualitativa (Lüdke & André, 1986) de delineamento descritivo-explicativo, com três fases de coleta de dados: a) entrevista, do tipo semidirigida (Szymanski, 2004), com 11 professores que atuam nos anos finais dos Ensinos Fundamental e Médio de uma escola pública de uma cidade do interior de São Paulo; b) aplicação de questionário, do tipo semiestruturado, junto a 112 alunos dos anos finais do Ensino Fundamental; c) entrevista com princípios do método clínico (Piaget, 2007) com nove adolescentes entre 13 e 17 anos de idade.
Para cada instrumento de coleta elaboramos quadros norteadores organizados a partir dos objetivos gerais e respectivos objetivos específicos propostos para cada fase do estudo.
Para a seleção das escolas participantes da pesquisa, foram mapeadas, por meio de um levantamento no site da Secretaria de Ensino do município pesquisado, todas as escolas dos anos finais do Ensino Fundamental que possuíam laboratórios de informática. Após esse processo, selecionamos a escola de maior porte para que pudéssemos ter um campo significativo de pesquisa e expressividade no número de sujeitos participantes. A escola selecionada para a pesquisa é a maior do município e atende uma média de 365 alunos no Ensino Fundamental e 467 no Ensino Médio.
A análise dos dados se deu mediante triangulação das três etapas do estudo, por meio da técnica da análise de conteúdo (Bardin, 1997) e por eixos de análise determinados pelo método clínico.
RESULTADOS E DISCUSSÃO
O desenvolvimento da pesquisa partiu, essencialmente, de questionamentos acerca de possíveis diferentes marcos culturais, sociais e cognitivos entre alunos e professores, sobre como práticas pedagógicas podem ir ao encontro dos modos como os alunos aprendem no atual contexto histórico-cultural e quais práticas pedagógicas vão ao encontro dos modos de apropriação e das estratégias de aprendizagem mobilizadas por alunos em contextos de uso pedagógico das tecnologias digitais de informação e comunicação. Assim, foram traçados os objetivos de analisar os modos de apropriação e as estratégias de aprendizagem mobilizadas por adolescentes de uma escola pública, além das representações dos professores acerca de suas práticas sob a perspectiva da formação docente no âmbito das tecnologias digitais.
Nossa análise se inicia pelo objetivo de identificar e analisar representações dos professores sobre as suas práticas no uso das tecnologias digitais no processo educativo.
Em síntese, os resultados apontam que os professores não consideram a nova cultura da aprendizagem da qual os alunos participam ativamente por meio da distribuição social do

2016 PESQUISA TIC EDUCAÇÃOARTIGOS 55
PO
RTU
GU
ÊS
conhecimento via tecnologias digitais, além de terem representações sociais relacionadas ao uso das tecnologias pelos alunos voltadas ao entretenimento, excluindo a dimensão da aprendizagem. Esse é um importante ponto levantado, uma vez que se o professor não considera as tecnologias em suas potencialidades pedagógicas, dificilmente utilizará em suas práticas. Martins e Moser (2012) apontam que os alunos de hoje não conseguem se concentrar em aulas tradicionais (centradas no professor e na transmissão de informações) e não aprendem dessa forma. A escola tem esperado do aluno aprendizagem por meio de práticas que exigem linearidade, concentração e disciplinaridade e caminham, assim, opostamente às novas aprendizagens. Sancovschi e Kastrup (2013, p. 201) reforçam essa ideia quando relatam que a “[...] atenção saltitante e sem ritmo parece relacionar-se ao modo como as novas tecnologias, e em especial o computador-internet, capturam a atenção” e enfatizam a importância de se compreender as novas relações entre o aprender e as tecnologias digitais.
Apesar de haver uma percepção, ainda incipiente, de que a contextualização histórico-cultural dos alunos é elemento fundamental para se pensar em práticas pedagógicas, a ausência de formação docente acerca de como o aluno aprende com as tecnologias digitais, bem como a ausência de reflexão sobre o novo contexto sociocultural em que conceitos como fronteiras, socialização, comunicação e construção de saberes são redefinidos, impedem a revisão de currículos e práticas educacionais que correspondam às necessidades formativas dos alunos.
O segundo objetivo do estudo consistiu em identificar e analisar os modos de apropriação e estratégias de aprendizagem mobilizadas por adolescentes dos anos finais dos Ensinos Fundamental e Médio em contextos de uso dos recursos tecnológicos. Para responder a esse objetivo contamos com duas fases de coleta e análise de dados, que aqui serão sintetizadas de forma articulada.
Acerca dos usos formativos das tecnologias digitais pelos adolescentes, dentro ou fora da escola, encontramos dados apontando que os jovens utilizam os recursos tecnológicos tanto para fins de socialização quanto para atividades escolares e acesso à informação. Contudo, a forma como acessam informações por meio dos recursos tecnológicos não corresponde à representação que os professores desses adolescentes participantes da pesquisa têm sobre apropriação informacional.
Os adolescentes não vão à busca dos saberes de forma habitual como, por exemplo, acessar sites de notícias e realizar buscas, dentre outras estratégias, mas esperam as informações chegarem até eles. Para os professores participantes, essa postura é de passividade em relação ao objeto do conhecimento. Contudo, os dados da pesquisa apontam não uma passividade ou ausência de ação, como creem os professores pesquisados, mas uma forma diferente de agir sobre a informação circulante. Os adolescentes, imersos num contexto sociocultural no qual as tecnologias alteram dinâmicas comunicacionais e de produção de saberes, percebem que o conhecimento é produzido, compartilhado e distribuído socialmente. A ação sobre essas informações acontece quando os adolescentes acessam constantemente a rede, conscientes de que os saberes lá estão em circulação, e agem sobre eles no sentido de modificá-los e transmiti-los novamente.
A ação dos adolescentes sobre o conhecimento se relaciona com os pressupostos da cognição distribuída (Salomon, 2001). Os saberes que circulam se transformam por meio de ações colaborativas entre os indivíduos, os quais por sua vez alteram o saber inicial em coordenação com as tecnologias digitais. Considerando que os processos cognitivos ocorrem na mente

PESQUISA TIC EDUCAÇÃO 2016ARTIGOS56
PO
RTU
GU
ÊS
do indivíduo em um processo inter-relacional entre meio social e meio físico, as práticas comunicativas e culturais dadas por meio das tecnologias digitais agem sobre os processos de aprender dos adolescentes.
Em contrapartida, quando o objeto do conhecimento está vinculado à escola, os adolescentes pautam os seus processos de aprendizagem por modelos pedagógicos tradicionais, centrados na verticalização dos saberes, na lógica comunicacional emissor-receptor e na linearidade. Por não terem consciência acerca dos seus processos cognitivos, os adolescentes orientam sua aprendizagem de acordo com representações que vão ao encontro do ensino tradicional e da organização estabelecida pela escola. Porém, na prática cotidiana, experienciam novas aprendizagens sem se darem conta dessa situação.
A partir das discussões estabelecidas, entendemos que, fora da escola, o aprender dos adolescentes ocorre por meio de práticas socioculturais viabilizadas pelas tecnologias digitais, as quais alteram suas competências cognitivas quando propiciam aos jovens novas formas de socializar, construir e distribuir conhecimentos. Os adolescentes vivenciam a inteligência coletiva e têm a percepção de que o conhecimento é fruto da colaboração entre indivíduos, sendo distribuído via tecnologias digitais. No entanto, a aprendizagem mobilizada cotidianamente pelos adolescentes não corresponde ao que eles representam como aprendizagem de conteúdos escolares. Quando o conteúdo a ser aprendido é vinculado à escola, os adolescentes pautam os seus processos de aprender por modelos pedagógicos tradicionais que priorizam a linearidade e a centralização dos saberes. Por outro lado, eles percebem que a escola não corresponde ao contexto sociocultural e se desinteressam pela educação tradicional.
Nessa transição cotidiana, os adolescentes se perdem em seus processos de aprender, uma vez que, se fora da escola podem controlar a maneira como aprendem, dentro dela têm a sua aprendizagem controlada. Nesse processo são retirados do adolescente sua autonomia, sua consciência e seu controle sobre os processos cognitivos.
Propiciar aos alunos controle e gestão dos seus processos de cognição é fundamental para que mobilizem suas próprias estratégias de aprendizagem. Essa autonomia lhes permitirá ir ao encontro daquilo que já sabem e do que ainda desconhecem acerca do conteúdo de ensino, possibilitando que tenham uma postura ativa e construtiva sobre o seu próprio conhecimento.
CONSIDERAÇÕES FINAIS
O conhecimento construído nesta investigação nos permitiu inferir que o uso das tecnologias digitais pelos adolescentes promove práticas socioculturais que incidem diretamente nos processos de aprender e na sua cognição. Os recursos digitais são mediadores culturais (Vigotski, 1998), instrumentos cognitivos que inter-relacionam a cognição individual dos adolescentes com o conhecimento que circula nas redes. Na relação com as tecnologias digitais, os adolescentes têm alterado a forma como as suas atividades e os seus processos cognitivos são requeridos e/ou mobilizados, e isso promove seu desenvolvimento intelectual.
É preciso que as mudanças socioculturais que permeiam a sociedade adentrem a escola. Esta, por sua vez, deve ser descentralizada como fonte primária de acesso ao conhecimento, mas ainda mais legitimada enquanto um espaço de reflexão que garanta aos alunos a compreensão

2016 PESQUISA TIC EDUCAÇÃOARTIGOS 57
PO
RTU
GU
ÊS
de seus processos de aprendizagem, propiciando autonomia e competência para participar, agir e aprender de forma crítica sobre essa nova realidade.
Propomos que os cursos de formação inicial e continuada de professores pautem-se em propostas pedagógicas que abordem os processos metacognitivos do aluno, levando-o a aprender a pensar e a refletir sobre o seu próprio pensamento. As práticas pedagógicas devem se voltar para a implementação de situações e condições que se aproveitem daqueles modos de aprender já estabelecidos pelos alunos fora do ambiente escolar, mas que ainda são desconsiderados nos processos educativos tradicionais.
Os estudantes assumem protagonismo no seu processo de aprender quando controlam suas estratégias de aprendizagem e conseguem gerir o conteúdo de ensino de acordo com as suas necessidades subjetivas e com o seu ritmo de apropriação das informações que recebem. Na cultura participativa, viabilizada pelas tecnologias digitais, os adolescentes já controlam o conteúdo a ser aprendido, se pronunciam e agem sobre ele, defrontando o seu desenvolvimento real e indo em direção ao seu desenvolvimento proximal (Vigotski, 1998). Resta à escola incorporar essa forma de construir conhecimentos em seus processos de formação e, assim como acontece na cultura digital, romper com suas limitações de espaços e tempos para o aprender.
REFERÊNCIAS
Bardin, L. (1997). Análise de conteúdo. Lisboa: Edições 70.
Gil, A. C. (2008). Como elaborar projetos de pesquisa. São Paulo: Atlas.
Hollan, J., Hutchins, E., & Kirsh, D. (2000). Distributed Cognition: Toward a New Foundation for Human-Computer Interaction Research. ACM Transactions on Computer-Human Interaction , 7 (2), pp. 174-196. Recuperado em 10 janeiro, 2017, de https://www.lri.fr/~mbl/Stanford/CS477/papers/DistributedCognition-TOCHI.pdf
Hutchins, E. (1995). Cognition in the wild. Cambridge: MIT Press.
Hutchins, E. (2000). Distributed Cognition. Recuperado em 10 fevereiro, 2017, de http://files.meetup.com/410989/DistributedCognition.pdf
Lüdke, M., & André, M. E. (1986). Pesquisa em educação: abordagens qualitativas. São Paulo: EPU.
Martins, O. B., & Moser, A. (2012). Conceito de mediação em Vygotsky, Leontiev e Wertsch. Revista Intersaberes , 7 (13), pp. 8-28.
Matlin, M. (2004). Psicologia cognitiva (5ª ed.). Rio de Janeiro: LTC.
Piaget, J. (2007). Epsitemologia Genética (3ª ed.). (Á. Cabral, Trad.). São Paulo: Matins Fontes.
Pretto, N. (2010). Redes colaborativas, ética hacker e educação. Educação em Revista , 26 (3), pp. 305-316. Recuperado em 20 março, 2017, de http://www.scielo.br/pdf/edur/v26n3/v26n3a15
Rogers, Y. (1997). A Brief Introduction to Distributed Cognition. Recuperado em 01 fevereiro, 2017, de http://www.csuchico.edu/~nschwartz/dcog-brief-intro.pdf
PESQUISA TIC EDUCAÇÃO 2016ARTIGOS58
PO
RTU
GU
ÊS
Salomon, G. (2001). No distribution without individuals cognition: A dynamic interactional view. In: G. Salomon, Distributed Cognitions: Psychological and educational considerations. Cambrigde: Cambrigde University Press.
Sancovschi, B., & Kastrup, V. (2013). Práticas de estudo contemporâneas e a aprendizagem da atenção. Psicologia & Sociedade , 25 (1), pp. 193-202.
Szymanski, H. (2004). Entrevista reflexiva: Um olhar psicológico sobre a entrevista em pesquisa. In: H. Szymanski, L. R. Almeida, & R. C. Brandini (Org.), A entrevista na pesquisa em educação: A prática reflexiva (pp. 9-61). Brasília: Líber.
Vigotski, L. S. (1998). A formação social da mente: O desenvolvimento dos processos psicológicos superiores. São Paulo: Martins Fontes.

2016 PESQUISA TIC EDUCAÇÃOARTIGOS 59
PO
RTU
GU
ÊS
A BASE NACIONAL COMUM CURRICULAR (BNCC) E A UTILIZAÇÃO DAS TIC NA EDUCAÇÃO
Deise de Lacerda Paiva1
No Brasil, as mudanças no currículo escolar estão em alta na pauta das discussões da área. Seguindo a tendência de países como a Austrália, a Coreia, a Finlândia, entre outros, o país passa, a partir de 2017, por uma reformulação curricular. Embora a educação nessas nações já fosse considerada de alta qualidade, inclusive com excelentes resultados no Programa Internacional de Avaliação de Estudantes (do inglês, Programme for International Student Assessment – Pisa)2, ainda havia aspectos a serem melhorados. Por isso, esses países decidiram realizar diversas modificações no que diz respeito ao currículo escolar.
No caso específico do Brasil, a implementação das mudanças curriculares traz um desafio bem maior. Resultados divulgados recentemente mostram que o país ocupa uma das últimas posições no Pisa (Carta Educação, 2016a). Além disso, dados do Ministério da Educação (MEC) revelam que apenas 54,3% dos jovens de 19 anos possuem o Ensino Médio (Todos pela Educação, 2014) e 41,5%, não terminam o curso (Porvir, 2017). A estrutura escolar do país é considerada engessada e distante da realidade da maioria dos jovens. O país ainda preserva o mesmo modelo educacional do século passado: o ensino conteudista, a partir de um currículo com as mesmas 13 disciplinas, que não respeita o ritmo individual nem considera as dificuldades de aprendizagem dos alunos. A escola, que deveria favorecer a ascensão social, em vez de oferecer igualdade de oportunidades para todos, sem distinção, acaba por perpetuar as diferenças sociais: “Com efeito, para que sejam favorecidos os mais favorecidos e desfavorecidos os mais desfavorecidos, é necessário e suficiente que a escola ignore [...] as desigualdades culturais entre as crianças de diferentes classes.” (Bourdieu, 2015)
1 Mestre em Estudos da Linguagem pela Pontifícia Universidade Católica do Rio de Janeiro (PUC-RJ), com graduação em Letras (Português/Literaturas) pela Universidade do Estado do Rio de Janeiro (UERJ), atualmente participa do grupo de pesquisa da Coordenação Central de Educação a Distância (CCEAD) da PUC-RJ.
2 Pisa é o mais importante exame educacional do mundo, elaborado a cada três anos pela Organização para a Cooperação e Desenvolvimento Econômico (OCDE) com intuito de aferir a qualidade, equidade e eficiência dos sistemas escolares.

PESQUISA TIC EDUCAÇÃO 2016ARTIGOS60
PO
RTU
GU
ÊS
A realidade é que a maioria de nossas escolas ainda funciona na visão “bancária” da educação, em que o professor é o detentor do “saber” e os alunos, “vasilhas” a serem “enchidas” (Freire, 2005, p. 66). Aliado a isso, o tradicional modelo já não atende às exigências do século 21. Para compensar de alguma forma essas discrepâncias, várias “inovações” vêm sendo adotadas. Quando se pensa em inovação, acredita-se que a simples utilização do computador (ou de outros dispositivos digitais) na escola possa contribuir para melhorar esse cenário. No entanto, como aponta Valente (1993):
[...] é assustador pensar que necessitamos de algo como o computador para tornar a escola
mais motivadora e interessante. A escola deveria ser interessante não pelo fato de possuir
um artefato mas pelo que acontece na escola em termos de aprendizado e desenvolvimento
intelectual, afetivo, cultural e social. (p. 3)
Não basta apenas “decorar conteúdos” ou utilizar computadores em sala de aula. A complexidade do mundo atual exige que o aluno desenvolva novas competências, já que a interação com as novas tecnologias “tornam antiquadas nossas habilidades, ampliando ainda mais nossa necessidade de mudar a fim de permanecer em sintonia com o ritmo acelerado de seu desenvolvimento” (Bauman & May, 2010, p. 238).
Espera-se, então, que as mudanças trazidas pela Base Nacional Comum Curricular (BNCC) despertem o interesse dos jovens na escola, estimulando de alguma forma a inovação em sala de aula, com a adoção de novas abordagens pedagógicas, como a aprendizagem por projetos, que integra diferentes disciplinas e um maior uso das TIC no processo de ensino e aprendizagem, entre outros aspectos. Porém, a integração das TIC à aprendizagem no país esbarra em diversos entraves, que vão desde o restrito acesso à Internet nas escolas (principalmente, nas públicas) até à falta de formação dos professores para utilização das TIC, considerados os principais agentes de mudanças nesse contexto.
A pesquisa TIC Educação 2015, do Centro Regional de Estudos para o Desenvolvimento da Sociedade da Informação (Cetic.br), mostrou que a utilização da Internet em sala de aula é realizada em 43% das escolas públicas e em 72% das privadas de áreas urbanas. Dentre as escolas públicas, 45% declararam ter velocidade de até 2 Mbps. Além disso, o acesso à rede está mais presente na sala dos diretores e dos professores – 93% das escolas públicas possuem acesso à Internet na sala dos diretores e coordenadores e 77%, na sala dos professores – do que nos espaços de uso por estudantes na escola (Comitê Gestor da Internet no Brasil [CGI.br], 2016). A maioria dos professores, por sua vez, não está preparada para a utilização das novas tecnologias em sala de aula. Poucos têm formação específica na área, portanto, não possuem recursos para utilizar a tecnologia digital como ferramenta em sua prática pedagógica.
O objetivo deste artigo é apresentar as discussões recentes acerca das experiências de mudanças curriculares associadas à utilização das TIC na educação. Um número bem significativo de pesquisas parece enfatizar o contraste antes-depois da introdução da tecnologia ou se restringe à descrição do uso dessas tecnologias pela escola, faltam estudos que analisem ou avaliem a sua utilização em contextos educacionais (Rosado, Martins, & Carvalho, 2017, p. 209). Pesquisas assim poderiam contribuir para o aprimoramento do uso das novas tecnologias já existentes e para a formação de professores.

2016 PESQUISA TIC EDUCAÇÃOARTIGOS 61
PO
RTU
GU
ÊS
MODELOS
AUSTRÁLIA
Por se tratar de uma federação, os estados e os territórios da Austrália têm autonomia na criação de políticas públicas, inclusive na área da educação. A construção de um currículo único teve como objetivo erradicar principalmente desigualdades educacionais cujas discrepâncias geravam diferentes desempenhos entre alunos dos centros urbanos e do campo. Na ocasião de elaboração, optou-se por unir as práticas mais bem-sucedidas de cada território a referências internacionais (Centro de Referência em Educação Integral, 2014). Como resultado final, foi acordado que 80% do currículo a ser utilizado deveria seguir a base curricular única, e os demais 20% poderiam contemplar conteúdos locais e atividades (Agência Senado, 2016). Aliado a isso, foram estabelecidos três eixos principais que deveriam orientar o currículo: oito áreas de aprendizagem (as mais tradicionais e aquelas consideradas importantes em outros contextos além do escolar), três temas transversais prioritários (o engajamento da Austrália com a Ásia; a história e a cultura dos aborígenes; e sustentabilidade) e sete habilidades gerais (Porvir, 2014a).
A princípio, a tecnologia foi tratada como um tema transversal. Poucos anos depois, em 2012, ela acabou ganhando a relevância das demais e passou a ser desenvolvida como uma habilidade à parte, subdividida em: tecnologia digital, com foco no desenvolvimento do pensamento computacional para resolução de problemas, e design thinking, quando o aprendizado ocorre por meio de projetos (Almeida & Valente, 2016).
Em paralelo, houve um esforço conjunto do país na capacitação dos professores. Em 2011 e 2012, foi realizado um projeto para desenvolvimento de competências de ensino com as TIC (The Teaching Teachers for the Future – TTF), que corroborou para a criação de uma rede colaborativa com a participação de todas as instituições de nível superior responsáveis pela formação de professores (Almeida & Valente, 2016).
No ano de 2011, foi instituída uma comissão que reuniu representantes de todos os territórios e níveis de ensino para tratar especificamente de assuntos relacionados às TIC. Foram estabelecidas ações conjuntas com o objetivo de contribuir para “a mudança sustentável e significativa do ensino e da aprendizagem nas escolas australianas que prepararão os estudantes para a educação e a formação, a vida e o trabalho em um mundo digital” (Almeida & Valente, 2016, p. 11). As ações resultaram na criação de um repositório de materiais on-line (Rede Nacional de Recursos Digitais de Aprendizagem), investimentos no letramento digital dos professores e da liderança escolar, sistema de acreditação nacional, entre outros desdobramentos.
COREIA DO SUL
O governo coreano é mundialmente conhecido pelo pesado investimento financeiro na área da educação. Segundo estudos, na Coreia, 97% dos estudantes completam o ensino e o país ocupa uma das primeiras posições em qualidade de educação no mundo segundo o Pisa – patamar alcançado a partir da promulgação de uma lei que tornou o Ensino Básico prioridade de Estado. Os professores são altamente valorizados pela Coreia, passam por avaliações recorrentes, dividindo inclusive com os alunos a responsabilidade da avaliação de aprendizagem.
PESQUISA TIC EDUCAÇÃO 2016ARTIGOS62
PO
RTU
GU
ÊS
No país, as decisões na área da educação são centralizadas. O currículo é definido pelo governo, sendo revisado a cada cinco a dez anos em média. As recentes mudanças curriculares tiveram por finalidade “apontar os eixos do desenvolvimento dos aprendizados para o século 21”, priorizando o desenvolvimento da criatividade e o aprimoramento do caráter, de forma que os estudantes possam se desenvolver individualmente de forma livre e criativa (National Center on Education and the Economy – NCEE, 2014).
Para estimular o acesso ao conhecimento, o governo aposta na infraestrutura das escolas e na utilização das TIC na educação. Além disso, o país pretende migrar todo o conteúdo impresso para o meio digital (IstoÉ, 2016).
FINLÂNDIA
Assim como a Coreia, a Finlândia também figura como um dos países mais bem avaliados na área de educação no Pisa. As escolas contam com uma ótima infraestrutura, inclusive nas salas de aula, e os professores são altamente valorizados no país, passando por atualizações constantes.
As mudanças curriculares na Finlândia resultaram em ainda mais autonomia local. Professores e diretores já podiam complementar a base curricular desenvolvida pelo Conselho Nacional3 – inclusive com os professores tendo autonomia para decidir materiais, métodos, tipos de avaliação a serem utilizados em sala –, mas o país decidiu mudar o currículo com o objetivo de abolir a divisão estanque do conteúdo, inserindo o ensino transdisciplinar. A chamada aprendizagem baseada em fenômenos (do inglês, phenomenon-based learning, em tradução livre) pressupõe explorar um fenômeno com a perspectiva de diferentes disciplinas no intuito de desenvolver novas habilidades e promover o trabalho em conjunto entre os professores (Carta Educação, 2016c). Esse tipo de abordagem tornou-se um item compulsório no currículo, desfazendo assim as barreiras entre as disciplinas.
A tecnologia, no caso finlandês, é considerada mais um instrumento que auxilia o professor em sala de aula. Por isso, todos os recursos tecnológicos possíveis são bem-vindos no ambiente escolar. O maior uso de ferramentas digitais, como jogos, por exemplo, visa melhorar o processo de aprendizado em sala. Além disso, há um grande foco no desenvolvimento de habilidades individuais aliadas a outras, como colaboração, inovação, iniciativa, etc.
3 O Ministério da Educação é responsável pela legislação, pelas diretrizes políticas e pelo orçamento educacional; o Conselho Nacional, pela base curricular nacional; os municípios, pela Educação Infantil e secundária; as escolas, por propostas para complementação da base de acordo com a realidade local.

2016 PESQUISA TIC EDUCAÇÃOARTIGOS 63
PO
RTU
GU
ÊS
BRASIL: BASE NACIONAL COMUM CURRICULAR
Apesar das controvérsias em relação às mudanças na área, parece haver um consenso de que a educação do país precisa de reformas urgentes. O Brasil ficou na 63ª posição em ciências, na 59ª em leitura e 66ª em matemática dentre os 70 países avaliados no Pisa no ano de 2015 (Carta Educação, 2016a). E não só os números denunciam que a educação no Brasil precisa de melhorias. Ao observarmos a estrutura escolar no país, concluímos que ela estacionou no século 19: o currículo fechado, com 13 disciplinas engessadas, a mesma disposição de carteiras enfileiradas na sala de aula, turmas grandes, etc. Para resolver o problema de falência do atual modelo, o governo decidiu implementar uma série de medidas, como a criação de uma base curricular comum nacional e a flexibilização do currículo, entre outras.
Segundo a proposta, a base, que já está em fase de finalização, traria uma indicação clara das competências, inclusive digitais, que os estudantes precisam desenvolver para enfrentar os desafios do mundo contemporâneo (Ministério da Educação [MEC], s.d.). Seguindo o exemplo da Austrália, a implementação de uma base curricular única seria uma tentativa de promover melhorias na educação brasileira como um todo, com a garantia de equidade entre as escolas, já que todas teriam uma referência comum obrigatória para elaborararem os currículos escolares (MEC, 2017). A terceira versão, divulgada pelo governo em abril de 2017, traz a relação das competências gerais a serem desenvolvidas de forma integrada aos componentes curriculares (MEC, 2017). Dentre elas, destaca-se a quinta competência: "Utilizar tecnologias digitais de comunicação e informação de forma crítica, significativa, reflexiva e ética nas diversas práticas do cotidiano (incluindo as escolares) ao se comunicar, acessar e disseminar informações, produzir conhecimentos e resolver problemas." (p. 18), indicando que o Brasil entende que essa deve ser uma competência a ser desenvolvida à parte, assim como no modelo australiano. Apesar disso, a BNCC não apresenta como desdobramento nenhuma ação ligada à melhoria de infraestrutura ou, ao menos, qualquer articulação com políticas já existentes, tais como o Programa Nacional de Tecnologia Educacional (ProInfo)4. Cabe destacar também que a base não contemplou programação, robótica, criação de tecnologia, etc., indo de encontro à tendência dos demais países, segundo especialista em tecnologia aplicada à educação, Paulo Blikstein (Folha de S.Paulo, 2017).
A flexibilização do Ensino Médio (Novo Ensino Médio), por sua vez, é vista como um desdobramento da BNCC. Ela prevê que o aluno curse as disciplinas da base comum no primeiro ano e meio do Ensino Médio e, no ano e meio seguinte, tenha acesso a trilhas formativas em diferentes áreas (linguagens, matemática, ciências naturais, ciências humanas e formação técnica e profissional). Na prática, 60% do currículo seria composto por uma base comum, com o restante flexível. Assim, o aluno poderia realizar a parte “flexibilizada” de acordo com suas habilidades e seus interesses (MEC, s.d.). As trilhas formativas tendem a permitir a interdisciplinaridade entre diferentes áreas, prática já adotada pelo modelo finlandês, com aprendizagem baseada em fenômenos.
4 O ProInfo teve desdobramentos e interseções com outros programas e iniciativas governamentais até se transformar em ProInfo Integrado, que inclui a iniciativa Banda Larga nas Escolas e o projeto Um Computador por Aluno – UCA, entre outros. O ProInfo Integrado teve como intuito unir suas ações às atividades escolares, principalmente em sala de aula (Almeida & Valente, 2016). Com o passar do tempo, fatores como a desarticulação entre as propostas do poder central e as demais instâncias federativas levaram o programa a se restringir a ações isoladas e esporádicas (Almeida & Valente, 2016).

PESQUISA TIC EDUCAÇÃO 2016ARTIGOS64
PO
RTU
GU
ÊS
A BNCC orientará também outras ações, como políticas para formação de professores para trabalharem com a nova base e a produção de material didático. Atualmente, há um grande número de profissionais que não possuem formação para utilização das TIC. Ainda que algumas pesquisas demonstrem que a maioria utilize as novas mídias para o preparo das aulas (CGI.br, 2016)5, não existem avaliações para mensurar se o uso é efetivo e contribui para a aprendizagem dos alunos.
Apesar das restrições em infraestrutura, atualmente algumas escolas possuem em sua matriz curricular aulas de Informática na Educação. No entanto, essas aulas têm foco, principalmente, no ensino de noções de pacote Office, segurança na rede, etc., ou seja, privilegiam a funcionalidade, sem desenvolver exatamente as competências digitais (Paula, Valente, & Burn, 2014, p. 54). Vale ressaltar que não existe nenhuma ação prevista de melhoria de infraestrutura como desdobramento da BNCC – uma das principais preocupações do atual modelo coreano.
CONCLUSÃO
A experiência das outras nações mostrou que todas elas, de alguma forma, implementaram ações relacionadas às TIC. Essas mudanças, no entanto, procuraram estabelecer, principalmente, as competências e as habilidades necessárias para o século 21. No entanto, parece não existir ainda um consenso quanto aos benefícios. Há quem veja a reorganização do currículo por competências de forma positiva:
[...] a organização da escola é, e continuará a ser, marcadamente disciplinar: os professores
são, e continuarão a ser, professores de disciplinas, não havendo qualquer sentido na
caracterização de um professor de “competências”. No entanto, urge uma reorganização do
trabalho escolar que reconfigure seus espaços e seus tempos, que revitalize os significados
dos currículos como mapas do conhecimento que se busca, da formação pessoal como a
constituição de um amplo espectro de competências e, sobretudo, do papel dos professores
em um cenário onde as ideias de conhecimento e de valor encontram-se definitivamente
imbricadas. (Machado, 2002, p. 139).
No entanto, parece não existir ainda um consenso quanto aos benefícios que essa reorganização curricular pode trazer. No Brasil, por exemplo, existem críticas, especialmente, ao processo de elaboração: “a (base) extrapola a condição expressa no seu título, já que não trata de uma base para resguardar uma unidade nas propostas de ensino, mas da uniformização através de listagens de conteúdos/competências” (Barreto, 2017, p. 138). Mesmo assim, há de se convir que a mudança contribui, principalmente, para trazer o foco à aprendizagem, e não ao ensino, fazendo do aluno o centro do processo educacional.
5 Na atualidade, há diversas pesquisas no Brasil sobre as TIC. A maior parte centrada no acesso a dispositivos digitais e à Internet. Já existem estudos que apontam para a necessidade de se deslocar as pesquisas sobre acesso às TIC para seu uso e habilidades, com a finalidade de se constituir um indicador de letramento digital (Rosa; Dias, 2012).
2016 PESQUISA TIC EDUCAÇÃOARTIGOS 65
PO
RTU
GU
ÊS
A mudança curricular tem pontos de contato com alguns dos casos apresentados: a diminuição das disparidades regionais entre os diversos currículos atuais, no caso da Austrália; o foco na interdisciplinaridade, como a Finlândia; uma etapa prevista para produção de material, entre outros. Em contraste com aquelas nações, o Brasil ainda não conseguiu implementar uma política de valorização do professor. Some-se a isso as duras críticas desses profissionais em relação à elaboração da BNCC, que não teve o professor como protagonista no processo (Carta Educação, 2016b).
Apesar de já estar em processo de finalização, a construção de uma base nacional curricular comum, bem como a flexibilização do currículo, ainda divide opiniões. Embora se entenda que a divisão por áreas de conhecimento se constitua um avanço, as mudanças ainda não atacam um dos problemas da questão: o ensino conteudista que prevalece em nossas escolas. Isso demonstra que não só a flexibilização do currículo é necessária, mas há mudanças urgentes a serem implementadas na prática pedagógica (dentro e fora da sala de aula).
Há um longo caminho a ser percorrido para que mudanças tragam melhorias efetivas à educação brasileira. De qualquer forma, mesmo que o novo currículo ainda não tenha sido adotado, já é possível concluir que, com base nas experiências de outros países e pela análise dos resultados da utilização das TIC, faz-se necessário considerar a realidade brasileira para integração das TIC ao currículo. Como também é importante estabelecer políticas públicas para a melhoria da infraestrutura em nossas escolas, bem como para a formação de docentes, os quais deverão auxiliar no desenvolvimento dos jovens para o mundo do trabalho e para a sociedade do futuro.
REFERÊNCIAS
Agência Senado. (2016). Comissão de Educação ouvirá especialista australiano sobre currículo nacional. Recuperado em 20 junho, 2017, de http://www12.senado.leg.br/noticias/materias/2016/03/29/comissao-de-educacao-ouvira-especialista-australiano-sobre-curriculo-nacional
Almeida, E., & Valente, J. A. (2016). Políticas de tecnologia na educação brasileira: Histórico, lições aprendidas e recomendações. Recuperado em 6 abril, 2017, de http://www.cieb.net.br/cieb-estudos-politicas-de-tecnologia-na-educacao-brasileira-historico-licoes-aprendidas-e-recomendacoes/
Barreto, R. G. (2017). Objetos como sujeitos: O deslocamento radical. In: G. Ferreira, A. Rosado, & J. S. Carvalho, Educação e Tecnologia: Abordagens críticas (pp. 124-140). Rio de Janeiro: Editora Universidade Estácio de Sá.
Bauman, Z., & May, T. (2010). Aprendendo a pensar com a sociologia. Rio de Janeiro: Zahar.
Bourdieu, P. (2015). Escritos de educação. Petrópolis: Vozes.
Carta Educação. (2016a). Brasil mantém últimas colocações no Pisa. Recuperado em 25 julho, 2017, de http://www.cartaeducacao.com.br/reportagens/brasil-mantem-ultimas-colocacoes-no-pisa
Carta Educação. (2016b). Expectativa e críticas aguardam Base Nacional Comum Curricular nas escolas. Recuperado em 26 julho, 2017, de http://www.cartaeducacao.com.br/reportagens/expectativa-e-criticas-aguardam-base-nacional-comum-curricular-nas-escolas/
Carta Educação. (2016c). O que é que a Finlândia tem? Recuperado em 25 julho, 2017, de http://www.cartaeducacao.com.br/entrevistas/o-que-e-que-a-finlandia-tem/

PESQUISA TIC EDUCAÇÃO 2016ARTIGOS66
PO
RTU
GU
ÊS
Centro de Referência em Educação Integral. (2014). Currículo nacional australiano busca reduzir desigualdades e prioriza aprendizagem. Recuperado em 26 março, 2016, de http://educacaointegral.org.br/experiencias/curriculo-nacional-australiano-prioriza-educacao-igualitaria-equanime
Comitê Gestor da Internet no Brasil - CGI.br. (2016). Pesquisa sobre o Uso das Tecnologias de Informação e Comunicação nas Escolas Brasileiras: TIC Educação 2015. São Paulo: CGI.br.
Folha de S.Paulo. (2017). Em ciências, a base curricular é trágica, avalia especialista de Stanford. Recuperado em 6 abril, 2017, de http://www1.folha.uol.com.br/educacao/2017/04/1873204-em-ciencias-base-curricular-e-tragica-avalia-especialista-de-stanford.shtml
Freire, P. (2005). Pedagogia do Oprimido. Rio de Janeiro: Paz e Terra.
IstoÉ. (2016). Escola sem papel. Recuperado em 26 julho, 2017, de http://istoe.com.br/ 150285_ESCOLA+SEM+PAPEL/
Machado, N. J. (2002). Sobre a idéia de competência. In: P. Perrenoud, & M. G. Thurler. As competências para ensinar no século XXI. Porto Alegre: Artmed Editora.
Ministério da Educação. (s.d.). Acesso em 6 de abril de 2017, disponível em http://basenacionalcomum.mec.gov.br/perguntas-frequentes.
Ministério da Educação. (2017). Base Nacional Comum Curricular. Proposta preliminar. Terceira versão.Recuperado em 28 agosto, 2017, de http://basenacionalcomum.mec.gov.br/images/BNCCpublicacao.pdf
National Center on Education and the Economy - NCEE. (2014). Ensino sul-coreano: Como funciona o sistema educacional da Coreia do Sul? Recuperado em 26 julho, 2017, de http://sarangingayo.com.br/noticias-gerais/ensino-sul-coreano-como-funciona-o-sistema-educacional-da-coreia-do-sul/
Paula, B., Valente, J. A., & Burn, A. (2014). O uso de jogos digitais para desenvolvimento do currículo na Inglaterra. Currículo Sem Fronteiras , 14 (3), pp. 46-71.
Porvir. (2014a). Para combater desigualdades educacionais, Austrália criou base curricular objetiva, concisa e incluindo material com exemplos reais. Recuperado em 25 julho, 2017, de http://porvir.org/curriculo-australiano-preve-de-ciencias-criatividade
Porvir. (2014b). Pesquisas apontam caminhos para o currículo no Brasil. Recuperado em 6 abril, 2017, de http://porvir.org/pesquisas-apontam-caminhos-para-curriculo-brasil/
Porvir. (2017). Pesquisa revela que 41,5% dos jovens de 19 anos não concluíram ensino médio. Recuperado em 25 julho, 2017, de http://porvir.org/pesquisa-revela-415-dos-jovens-de-19-anos-nao-concluiram-ensino-medio
Rosa, F.R., & Dias, M.C.N. (2012). Por um um indicador de letramento digital: uma abordagem sobre competências e habilidades. Dissertação de mestrado profissional em Gestão das Políticas Públicas – EAESP-FGV. Recuperado em 30 outubro, 2017, de http://bibliotecadigital.fgv.br/dspace/handle/10438/10143
Rosado, L. A., Martins, G., & Carvalho, J. (2017). Educação e tecnologia na literatura online em português. In: G. M. Ferreira, L. A. Rosado, & J. Carvalho, Educação e tecnologia: Abordagens críticas. Rio de Janeiro: Sociedade de Ensino Superior Estácio de Sá.
Senado Notícias. (2016). Relator mantém arte e educação física como disciplinas obrigatórias. Recuperado em 9 abril, 2017, de http://www12.senado.leg.br/noticias/materias/2016/11/29/relator-mantem-arte-e-educacao-fisica-como-disciplinas-obrigatorias
Todos pela Educação. (2014). Apenas 54,3% dos jovens concluem o Ensino Médio até os 19 anos. Recuperado em 25 julho, 2017, de http://www.todospelaeducacao.org.br/reportagens-tpe/32163/apenas-543-dos-jovens-concluem-o-ensino-medio-ate-os-19-anos
Valente, J. A. (1993). Por quê o computador na educação? Recuperado em 25 julho, 2017, de http://www.ich.pucminas.br/pged/db/wq/wq1_LE/local/txtie9doc.pdf

PARTE 2—
TIC EDUCAÇÃO 2016

2016 PESQUISA TIC EDUCAÇÃORELATÓRIO METODOLÓGICO 69
PO
RTU
GU
ÊS
RELATÓRIO METODOLÓGICO TIC EDUCAÇÃO 2016
INTRODUÇÃO
O Comitê Gestor da Internet no Brasil (CGI.br), por meio do Centro Regional de Estudos para o Desenvolvimento da Sociedade da Informação (Cetic.br), do Núcleo de Informação e Coordenação do Ponto BR (NIC.br), apresenta a metodologia da Pesquisa sobre o Uso das Tecnologias de Informação e Comunicação nas Escolas Brasileiras – TIC Educação.
A pesquisa foi desenhada tendo como referencial metodológico o trabalho realizado pela International Association for the Evaluation of Educational Achievement – IEA (2009), divulgado em duas publicações: Sites 2006 (Technical Report – Second Information Technology in Education Study) e Sites 2006 (User Guide for the International Database). Ao longo da trajetória da pesquisa, alguns aspectos pertinentes à metodologia e ao questionário foram adaptados a fim de atender às especificidades do universo escolar do Brasil e às necessidades dos diferentes setores da sociedade, como governo, academia, organizações da sociedade civil e setor privado.
OBJETIVOS DA PESQUISA
O objetivo da pesquisa TIC Educação é identificar o acesso, o uso e a apropriação das TIC em escolas brasileiras, tanto no que diz respeito à prática pedagógica quanto à gestão escolar.
CONCEITOS E DEFINIÇÕES
POPULAÇÃO-ALVO
A população-alvo do estudo é composta pelas escolas públicas (estaduais e municipais) e particulares em atividade, localizadas em áreas urbanas do Brasil e que oferecem ensino na modalidade regular em pelo menos um dos níveis de ensino e séries. Três séries são investigadas nesta pesquisa, a saber: 4a série / 5o ano do Ensino Fundamental I, 8a série / 9o ano do Ensino Fundamental II e 2o ano do Ensino Médio.
PESQUISA TIC EDUCAÇÃO 2016RELATÓRIO METODOLÓGICO70
PO
RTU
GU
ÊS
Também fazem parte da população-alvo todos os diretores das escolas, bem como os alunos matriculados e os profissionais que exercem as funções de coordenação pedagógica (coordenadores pedagógicos) e de docência (professores) relacionados com as turmas das séries e dos níveis de ensino considerados na pesquisa.
UNIDADE DE ANÁLISE E REFERÊNCIA
Para atingir o objetivo da pesquisa, são investigadas várias dimensões relacionadas às unidades de referência e análise. São elas:
• Escolas: perfil em termos de infraestrutura e práticas envolvendo TIC;
• Diretores: perfil de uso do computador e da Internet; uso das TIC nas atividades administrativas e de gestão; interação com a comunidade e percepção sobre as limitações para a integração das TIC à educação;
• Coordenadores pedagógicos (pessoas em funções de coordenação pedagógica): perfil de uso do computador e da Internet; uso das TIC nas atividades administrativas, de coordenação pedagógica e no projeto pedagógico da escola; e percepção sobre as limitações para a integração das TIC à educação;
• Professores (pessoas em funções docentes): perfil profissional e de uso do computador e da Internet; habilidades e capacitação para o uso das TIC; uso das TIC nas atividades gerais e de ensino-aprendizagem; uso de conteúdos educacionais digitais e percepção sobre as limitações para a integração das TIC à educação;
• Alunos: perfil de uso do computador e Internet; habilidades para o uso das TIC; capacitação para o uso das TIC; atividades realizadas com o uso de computador e/ou Internet na escola.
DOMÍNIOS DE INTERESSE PARA ANÁLISE E DIVULGAÇÃO
Para as unidades de análise e referência, os resultados são divulgados para domínios definidos com base nas variáveis e níveis descritos a seguir.
Para todas as unidades de análise:
• Região: corresponde à divisão regional do Brasil, segundo critérios do Instituto Brasileiro de Geografia e Estatística (IBGE), nas macrorregiões Centro–Oeste, Nordeste, Norte, Sudeste e Sul;
• Dependência administrativa: corresponde ao tipo de subordinação administrativa da escola – pública municipal, pública estadual ou particular.
Com exceção da escola:
• Sexo: corresponde à divisão em feminino ou masculino.
Para alunos e professores:
• Série: corresponde ao nível de ensino do processo educacional em que o respondente leciona ou estuda.

2016 PESQUISA TIC EDUCAÇÃORELATÓRIO METODOLÓGICO 71
PO
RTU
GU
ÊS
Para diretores, coordenadores pedagógicos e professores:
• Faixa etária: corresponde às faixas de idade em anos completos do respondente no dia da entrevista, expressa em anos completos;
• Faixa de renda mensal familiar em salário mínimo (SM): corresponde à soma da renda mensal de todos os membros do domicílio do respondente expressa em três faixas de múltiplos do SM, considerando o SM vigente definido pelo Ministério do Trabalho e do Emprego no mês anterior ao dia da entrevista;
• Faixa de renda mensal individual em SM: corresponde à soma da renda mensal total do respondente expressa em três faixas de múltiplos do SM, considerando o SM vigente definido pelo Ministério do Trabalho e do Emprego no mês anterior ao dia da entrevista.
INSTRUMENTOS DE COLETA
INFORMAÇÕES SOBRE OS INSTRUMENTOS DE COLETA
As entrevistas são realizadas com questionários estruturados específicos para os públicos abordados na pesquisa: alunos, professores, coordenadores pedagógicos e diretores. O questionário da unidade de análise Escolas é respondido pelos diretores. Mais informações sobre os instrumentos de coleta podem ser encontradas no Relatório de Coleta de Dados da pesquisa.
PLANO AMOSTRAL
A amostra de escolas urbanas é probabilística e selecionada em múltiplos estágios, que dependem do público-alvo da pesquisa. O primeiro estágio de seleção da amostra de escolas é realizado a partir da estratificação do universo da pesquisa segundo capitais e grandes regiões brasileiras. Em cada estrato foram selecionadas localidades que consistem em aglomerados de municípios vizinhos segundo características de número de turmas (a ser descrito em detalhe a seguir).
Para as capitais e localidades selecionadas, as escolas são divididas segundo os anos de ensino que estão disponíveis: 5o ou 9o anos do Ensino Fundamental, ou 2o ano do Ensino Médio, construindo três listas para seleção de escolas – as escolas-série. Sendo assim, uma escola que tenha turmas nos 5o e 9o anos do Ensino Fundamental é incluída no cadastro para seleção da amostra do 5o ano e do 9o ano. Isso significa que as escolas que possuem turmas em mais de uma série de interesse participam mais de uma vez do processo de amostragem. Em cada umas das listas, a seleção da amostra de escolas-série é realizada de forma independente – 2o estágio de seleção. Esse estágio traz para a pesquisa as escolas-série que fazem parte da amostra e, a partir dessa amostra, são atribuídos os respondentes para as unidades de análise: escolas e diretores.
Nas escolas-série selecionadas é realizada a listagem de turmas, coordenadores pedagógicos e professores de Língua Portuguesa, Matemática ou generalistas (para as turmas de 5o ano). A partir dessas listas, são selecionados os coordenadores pedagógicos e professores para responder à pesquisa – 3o estágio de seleção.

PESQUISA TIC EDUCAÇÃO 2016RELATÓRIO METODOLÓGICO72
PO
RTU
GU
ÊS
Para as turmas selecionadas no terceiro estágio, é realizada a listagem de alunos matriculados para a seleção de alunos que devem responder à pesquisa – 4o estágio de seleção. Essa é a última etapa para construção da amostra que atende a todos os universos de interesse da pesquisa.
CADASTRO E FONTES DE INFORMAÇÃO
O cadastro utilizado para seleção das escolas-série é o Censo Escolar da Educação Básica, coordenado pelo Instituto Nacional de Estudos e Pesquisas Educacionais Anísio Teixeira (Inep). Esse cadastro contém dados referentes a todas as escolas de Educação Básica brasileiras. A partir do cadastro mais recente de escolas do Inep (divulgado em março de cada ano), são separadas aquelas que satisfazem todas as condições de elegibilidade para participar da população da pesquisa, ou seja, escolas em funcionamento, localizadas em área urbana, que não estejam em áreas diferenciadas e que possuem a população-alvo do estudo.
As escolas potencialmente elegíveis também têm seus cadastros de turmas analisados para permitir identificar quais poderiam fazer parte da amostra. Isso é necessário porque a cobertura da pesquisa se refere apenas às turmas de educação regular. Turmas de Educação Infantil, Educação Especial, Educação de Jovens e Adultos (EJA) e de Ensino Profissionalizante estão fora do escopo da pesquisa.
As escolas elegíveis que tenham sido criadas durante o ano em que se dá a coleta de dados não fazem parte da população da pesquisa. Para todas as demais unidades de referência (diretores, coordenadores pedagógicos, professores e alunos), as condições de elegibilidade são aplicadas conforme a situação das escolas no ano da coleta, após atualização cadastral a ser realizada em cada estabelecimento escolar selecionado para a amostra.
Para a construção do conjunto de localidades que abrangem todo o território brasileiro, é utilizada a base cartográfica (shapefile) do IBGE com a divisão do país segundo municípios. A essa base foi acrescentada a informação sobre o número de escolas em cada município.
CONSTRUÇÃO DAS LOCALIDADES
A criação das localidades como agregação de municípios vizinhos é realizada segundo a metodologia Skater1 disponível no programa TerraView2. Ao todo, o Brasil possui 5.570 municípios nas 27 unidades da federação (UF). Estes municípios são agregados (a seus vizinhos) segundo os seguintes critérios:
- Uma localidade deveria pertencer apenas a uma UF;
- O número médio de escolas em uma localidade não deveria diferir de forma relevante da média de escolas por município na UF;
1 A metodologia Skater consiste na construção de aglomerados considerando a similaridade para medidas (estatísticas/dados) das unidades iniciais e a vizinhança geográfica dessas unidades (Assunção, R., Lage, J., & Reis, E., 2002).
2 O software TerraView é um programa de informações e aplicações geográficas gratuito desenvolvido pelo Instituto Nacional de Pesquisas Espaciais (Inpe).

2016 PESQUISA TIC EDUCAÇÃORELATÓRIO METODOLÓGICO 73
PO
RTU
GU
ÊS
- As capitais deveriam ficar isoladas e constituir um aglomerado próprio; e
- Os aglomerados resultantes deveriam ser heterogêneos internamente, isto é, contendo municípios com muitas escolas e municípios com poucas escolas.
O método é executado separadamente por UF, garantindo que não haja criação de aglomerados que ultrapassassem as fronteiras de duas ou mais regiões distintas.
De forma a obter heterogeneidade interna dos aglomerados, a variável de medida para a agregação de municípios é definida como:
Aij = Eij–∑
i
Eij ,Mj
onde,
Eijé o número de escolas do município i da UF j; e
Mjé o número de municípios da UF j.
Para garantir que as capitais fiquem separadas em aglomerados únicos, utiliza-se na metodologia uma variável CAP definida como:
CAP = 1 × (1 – I [capital]) + 100.000 × I [capital].
Como resultado do método, a partir dos 5.570 municípios são construídas 2.253 localidades. Todas as capitais, exceto Macapá, constituem um aglomerado isolado. Os municípios de Macapá e Itaubal formam um aglomerado, uma vez que Itaubal está integralmente circunscrito ao município da capital amapaense. A Tabela 1 apresenta o número de localidades segundo as regiões brasileiras.
TABELA 1NÚMERO DE LOCALIDADES, SEGUNDO REGIÃO
Região Número de localidades
Norte 210
Nordeste 821
Sudeste 587
Sul 461
Centro-Oeste 174
Total 2.253

PESQUISA TIC EDUCAÇÃO 2016RELATÓRIO METODOLÓGICO74
PO
RTU
GU
ÊS
DIMENSIONAMENTO DA AMOSTRA
O tamanho da amostra da pesquisa TIC Educação tem por objetivo proporcionar uma leitura dos resultados diante da heterogeneidade das unidades de referência e análise. As características de seleção da amostra, descritas em detalhes mais adiante, resultam em um tamanho de amostra variável.
ESTRATIFICAÇÃO DA AMOSTRA DE LOCALIDADES
A população-alvo da pesquisa é estratificada segundo municípios das capitais e grandes regiões brasileiras.
ALOCAÇÃO DA AMOSTRA POR GRANDES REGIÕES, CAPITAIS E UNIDADES DA FEDERAÇÃO
A estratégia geral de amostragem da pesquisa envolve a seleção de uma amostra de escolas em cada série de interesse. Para tanto, é considerada a seleção de localidades nos estratos e seleção de escolas-séries dentro das localidades selecionadas. A unidade primária de amostragem é a localidade nos estratos de regiões e as escolas-série nos estratos de capitais. A Tabela 2 apresenta a alocação da amostra por regiões:
TABELA 2ALOCAÇÃO DA AMOSTRA DE LOCALIDADES, SEGUNDO ESTRATOS
Estrato Número de localidades
Norte 30
Nordeste 30
Sudeste 30
Sul 30
Centro-Oeste 30
Capitais 27
Total 177
A amostra de localidades nas regiões é estratificada por unidades federativas dentro das regiões, de forma a termos informação de escolas em todas as UF. A estratificação por grandes regiões, UF e capitais considerou:
• Capitais (um estrato em cada uma das 27);
• Unidades da federação (27).
Ao todo, são 54 estratos finais. Todas as capitais são localidades presentes com certeza na amostra e 30 localidades são selecionadas aleatoriamente em cada grande região brasileira.

2016 PESQUISA TIC EDUCAÇÃORELATÓRIO METODOLÓGICO 75
PO
RTU
GU
ÊS
O tamanho da amostra de localidades por UF é determinado pela proporção de população da UF em relação à população da região, de tal forma que:
nh = 30 ×Phl ,
∑l
Phl
onde:
nh é o tamanho da amostra de localidades no estrato h; e
Phl é a população da localidade l no estrato h.
A distribuição da amostra de localidades por UF é apresentada na Tabela 3.
TABELA 3TAMANHO DA AMOSTRA DE LOCALIDADES, SEGUNDO UNIDADE DA FEDERAÇÃO
UF Capital Interior
Rondônia 1 2
Acre 1 2
Amazonas 1 6
Roraima 1 2
Pará 1 14
Amapá 1 2
Tocantins 1 2
Maranhão 1 3
Piauí 1 2
Ceará 1 4
Rio Grande do Norte 1 2
Paraíba 1 2
Pernambuco 1 5
Alagoas 1 2
Sergipe 1 2
Bahia 1 8
Minas Gerais 1 7
Espírito Santo 1 2
Rio de Janeiro 1 6
São Paulo 1 15
Paraná 1 11
Santa Catarina 1 7
Rio Grande do Sul 1 12
Mato Grosso do Sul 1 6
Mato Grosso 1 8
Goiás 1 16
Distrito Federal 1 0
Total 27 150

PESQUISA TIC EDUCAÇÃO 2016RELATÓRIO METODOLÓGICO76
PO
RTU
GU
ÊS
Após a seleção das localidades busca-se no Censo Escolar todas as escolas nos municípios que compõem a amostra (inclusive as capitais). A partir dessa base, as escolas são divididas em três grupos distintos para seleção de escolas-série (segundo estágio): escolas com 5o ano do Ensino Fundamental, escolas com 9o ano de Ensino Fundamental e escolas com 2o ano do Ensino Médio. Esses conjuntos de escolas separadas por série dão origem às populações de escolas-série. Dessa forma, uma escola que tenha turmas em mais de um nível de ensino pesquisado tem maior chance de participar da amostra final de escolas, pois participa mais de uma vez do processo de amostragem.
Uma vez selecionadas as amostras de escolas-série em cada localidade, são selecionadas amostras das demais unidades de referência e análise de interesse (diretores, alunos, coordenadores pedagógicos e professores), isto é, o plano amostral é implementado seguindo as etapas para a seleção das unidades de referência.
Enquanto as escolas-série são selecionadas na segunda etapa, a seleção das demais unidades de referência considera cada unidade escola-série como um conglomerado, dentro do qual é feito o cadastramento em campo e a seleção das demais unidades de referência, conforme detalhado adiante.
Os estratos para a seleção das unidades escola-série são definidos considerando a estratificação por UF/capital e a identificação da localidade selecionada. Dessa forma, todas as localidades dentro de um estrato têm pelo menos uma escola-série selecionada para a pesquisa. Essa alocação garante que os domínios de análise região e nível de ensino estejam contemplados pela estratificação. A dependência administrativa é considerada no processo de seleção da amostra de escolas-série, conforme explicitado no tópico seleção de escolas-série.
O tamanho total da amostra de escolas-série varia de acordo com as localidades que são selecionadas no primeiro estágio da amostra. Usualmente, os tamanhos das amostras por escolas-série se aproximam de 500 escolas em cada nível de ensino (Ensino Fundamental I, Ensino Fundamental II ou Ensino Médio), procurando alocar 100 escolas-série por grande região brasileira.
SELEÇÃO DA AMOSTRA
PRIMEIRO ESTÁGIO: SELEÇÃO DE LOCALIDADES
A seleção das localidades em cada estrato é realizada por meio de amostragem aleatória simples. Conforme já mencionado, todas as capitais são localidades presentes com certeza na amostra, e 30 localidades são selecionadas aleatoriamente em cada grande região brasileira. A probabilidade de seleção de cada localidade é dada por:
Phl =
⎧⎪ ⎪⎪ ⎪ ⎪⎨⎪ ⎪ ⎪ ⎪ ⎪⎩
nh , se não é município de capital,Lh
1 , se não é município de capital,

2016 PESQUISA TIC EDUCAÇÃORELATÓRIO METODOLÓGICO 77
PO
RTU
GU
ÊS
onde:
Phl é a probabilidade de seleção da localidade l no estrato h;
nh é o tamanho da amostra de localidades no estrato h; e
Lh é o total de localidades no estrato h.
SEGUNDO ESTÁGIO: SELEÇÃO DA AMOSTRA DE ESCOLAS
A partir da seleção de localidades, são separadas no Censo Escolar as escolas da população-alvo da pesquisa. Todas as localidades da amostra têm escolas selecionadas, garantindo espalhamento e presença de amostra em todas as unidades da federação. Para cada localidade é alocada uma amostra de escolas-série proporcional ao número de unidades escolas-séries presentes na localidade. Observa-se a distribuição de 100 escolas-série a selecionar em cada grande região brasileira. A alocação é apresentada no Relatório de Coleta de Dados da pesquisa.
As escolas pertencentes à população-alvo da pesquisa e situadas na amostra de localidades selecionadas são divididas em três bases de escolas-série: 5o ano ou 9o ano do Ensino Fundamental e 2o ano do Ensino Médio. Em cada uma dessas bases é feita uma seleção independente de escolas para participação na amostra. A seleção é feita utilizando o método de Amostragem Sequencial de Poisson – do inglês, Sequential Poisson Sampling (Ohlsson, 1998) – dentro de cada localidade para cada base de escola-série. A medida de tamanho mes
hldk utilizada é calculada padronizando-se por dependência administrativa. Para efetuar a padronização, utiliza-se a média de turmas por escola por tipo de dependência. Essa média é dada por:
meshld =
∑d Teshld ,
∑d Eeshld
onde:
meshld é a média do número de turmas da dependência d na localidade l do estrato h;
T eshld é o número de turmas da dependência d na localidade l do estrato h; e
meshld é o número de escolas da dependência d na localidade l do estrato h.
A medida padronizada para cada escola na lista de escolas-série é dada por:
meshldk =
T eshldk ,
meshld
onde:
T eshldk é o número de turmas da escola k da dependência d na localidade l no estrato h.

PESQUISA TIC EDUCAÇÃO 2016RELATÓRIO METODOLÓGICO78
PO
RTU
GU
ÊS
A probabilidade de seleção da escola k, na lista de escolas-série, é dada por:
peshldk = nes
hl ×mes
hldk ,∑d ∑k mes
hldk
onde:
peshldk
é a probabilidade de seleção da escola k da dependência d na localidade l no estrato h; e
neshl
é o tamanho da amostra de escolas-série na localidade l no estrato h.
TERCEIRO ESTÁGIO: SELEÇÃO DA AMOSTRA DE TURMAS
A partir da amostra de escolas-série, o número de turmas existentes em cada escola-série é levantado por telefone ou presencialmente, por meio do preenchimento de um formulário de arrolamento. No dia de realização das entrevistas, o entrevistador confere as informações obtidas anteriormente e, caso haja diferença, é considerada a informação mais atualizada. Essas informações são utilizadas para o cálculo do peso das turmas.
Para as escolas com uma, duas ou três turmas na série de interesse, é selecionada apenas uma turma e, no caso de escolas com quatro ou mais turmas, são selecionadas duas delas. A seleção das turmas é realizada de forma aleatória em cada escola-série, considerando o número de turmas a serem selecionadas.
QUARTO ESTÁGIO: SELEÇÃO DOS RESPONDENTES
SELEÇÃO DA AMOSTRA DE ALUNOS
Fixou-se em dez o número de alunos a serem entrevistados em cada série em cada uma das escolas. Nos casos em que a escola apresenta até três turmas para a série selecionada, os dez alunos são selecionados por amostragem inversa simples na turma selecionada. No caso de a escola ter mais de três turmas na série selecionada, a amostra de alunos é obtida mediante seleção de cinco estudantes por amostragem inversa em cada uma das duas turmas selecionadas. A seleção de alunos é realizada mediante um procedimento simples, que depende apenas da obtenção da lista de frequência com os nomes dos matriculados em cada turma junto à administração da escola ou com um professor.
A partir da lista de frequência de uma turma selecionada, os alunos matriculados são numerados de um até o número total de alunos na turma. Para cada uma foi previamente gerada uma lista com faixas de seleção com números aleatórios, variando de um ao número total de alunos matriculados na turma. De posse dessa informação, o entrevistador percorre a lista na ordem previamente definida para selecionar os alunos até que sejam entrevistados cinco ou dez, conforme o caso para a turma em questão.
SELEÇÃO DA AMOSTRA DE PROFESSORES
Em cada turma selecionada são entrevistados os professores que ministram as disciplinas de Português e Matemática. Nas turmas de 4a série / 5o ano são entrevistados os professores

2016 PESQUISA TIC EDUCAÇÃORELATÓRIO METODOLÓGICO 79
PO
RTU
GU
ÊS
generalistas que ministram as disciplinas básicas. Nas escolas selecionadas para a realização das entrevistas em duas turmas na mesma série, é entrevistado um professor de cada disciplina por turma, totalizando dois professores por turma. E nas escolas selecionadas para a realização de entrevistas em uma turma na mesma série, são entrevistados dois professores de cada disciplina na turma, totalizando quatro professores. Já no caso de a escola ser selecionada para a realização de entrevistas em duas ou três séries, os mesmos procedimentos descritos acima são utilizados para cada série selecionada.
Os professores são listados de acordo com a disciplina e turma que lecionam, sendo selecionados aleatoriamente.
SELEÇÃO DA AMOSTRA DE COORDENADORES PEDAGÓGICOS
É entrevistado um coordenador pedagógico por série. Nos casos em que exista mais de um coordenador pedagógico para a série selecionada, é realizada a listagem de coordenadores pedagógicos, e um deles é selecionado aleatoriamente.
SELEÇÃO DA AMOSTRA DE DIRETORES
É entrevistado apenas um diretor por escola. Ainda que alguma escola seja selecionada para a realização de entrevistas em mais de uma série, apenas um diretor é entrevistado na escola.
COLETA DE DADOS EM CAMPO
CRITÉRIOS PARA COLETA DE DADOS
A coleta de dados é feita por meio da visita presencial às escolas selecionadas e de entrevistas conduzidas com os diretores, coordenadores pedagógicos, professores e alunos selecionados para a amostra. Na maior parte dos casos, é realizado um agendamento prévio por telefone com o diretor ou responsável para que a visita dos entrevistadores não interfira no cotidiano da escola. Além disso, busca-se agendar uma data de realização das entrevistas em que o diretor, o coordenador pedagógico e os professores selecionados estejam presentes. Nos casos de difícil contato por telefone, os entrevistadores vão pessoalmente às escolas e fazem o agendamento e os arrolamentos no próprio local, e em alguns casos, as entrevistas são realizadas no mesmo dia.
Desse modo, na data agendada, os entrevistadores são enviados à escola e realizam as entrevistas seguindo os procedimentos e os questionários estruturados para cada público.
Cabe destacar que a pesquisa conta com o apoio institucional do Ministério da Educação (MEC), do Conselho Nacional de Secretários de Educação (Consed) e da União Nacional dos Dirigentes Municipais de Educação (Undime), que encaminham ofícios às escolas selecionadas antes e durante a realização da coleta de dados, a fim de informá-las sobre a pesquisa e de solicitar o apoio dos responsáveis no sentido de autorizar a realização das entrevistas.

PESQUISA TIC EDUCAÇÃO 2016RELATÓRIO METODOLÓGICO80
PO
RTU
GU
ÊS
PROCESSAMENTO DOS DADOS
PROCEDIMENTOS DE PONDERAÇÃO
A ponderação da pesquisa parte do cálculo de pesos básicos derivados das probabilidades de seleção em cada estágio, sobre os quais são aplicadas correções de não resposta. Os pesos das escolas são calibrados para os totais conhecidos da população-alvo da pesquisa.
PESO DAS ESCOLAS
O peso básico para cada escola é calculado a partir do inverso da probabilidade de seleção de escolas que consideram duas etapas de seleção: seleção de localidades e seleção de escolas no cadastro de escolas-série em localidades selecionadas.
De acordo com o que foi descrito anteriormente:
qeshldk = phl × pes
hldk,
onde:
qeshldk é o probabilidade de selecionar a escola k da dependência d na localidade l do estrato h.
Algumas escolas possuem até três séries de interesse da pesquisa. Sendo assim, elas têm uma probabilidade maior de serem selecionadas, já que estavam presentes em cada um dos cadastros de escolas-série. Dessa forma, a probabilidade de uma escola ser selecionada para participar da pesquisa independentemente da escola-série é dada por:
5o 9o 2oqhldk = qhldk + qhldk + qhldk 5o 9o 5o 2o 9o 2o
– 2 × (qhldk × qhldk) – 2 × (qhldk × qhldk)– 2 × (qhldk × qhldk)5o 9o 2o+ (qhldk × qhldk × qhldk).
Como o peso é o inverso da probabilidade de inclusão da escola na amostra, tem-se que o peso básico da escola whldk é dado por:
whldk = 1 .qhldk

2016 PESQUISA TIC EDUCAÇÃORELATÓRIO METODOLÓGICO 81
PO
RTU
GU
ÊS
CORREÇÃO DE NÃO RESPOSTA
Para efeito de correção de não resposta (cada unidade de análise pode possuir um contingente diferente de escolas respondentes), é considerado o ajuste dentro de cada estrato através da fórmula:
w*hldk = whldk ×
∑k∈s
whldk ,∑k∈r
whldk
onde:
w*hldk é o peso com correção de não resposta da escola k da dependência d na localidade l do estrato h;
s é o conjunto de escolas selecionadas da dependência d na localidade l do estrato h; e
r é o conjunto de escolas respondentes da dependência d na localidade l do estrato h.
CALIBRAÇÃO
Os pesos para as escolas respondentes, em todas as unidades de análise (escolas, diretores, coordenadores pedagógicos, professores e alunos) recebem o ajuste de não resposta (o número de respondentes é distinto em cada base) e a calibração para os totais de escolas por unidade da federação, dependência administrativa e série. Os totais das variáveis de calibração são obtidos no cadastro do Censo Escolar para a população-alvo da pesquisa, de onde foram selecionadas as amostras. O método utilizado é o ajuste iterativo sobre marginais, também conhecido por pós-estratificação multivariada incompleta ou raking. O peso final das escolas é: w*C
hldk .
PESO DOS DIRETORES
O peso da unidade de análise diretor é exatamente o mesmo peso calculado para a escola correspondente, uma vez que, quando há resposta da escola, sempre há resposta do diretor. Logo, o peso final dos diretores é dado por: w*C
hldk .
PESO DOS COORDENADORES PEDAGÓGICOS
O peso do coordenador pedagógico é calculado em duas etapas. A primeira é o cálculo do peso da escola respondente para essa unidade de análise (como descrito anteriormente). A segunda é o cálculo do inverso da probabilidade de seleção de cada coordenador pedagógico, por meio da razão entre o número de coordenadores listados e o de respondentes. O peso final do coordenador pedagógico é obtido pelo produto desses dois pesos.
w Chldk = w*C
hldk ×Chldk ,C r
hldk

PESQUISA TIC EDUCAÇÃO 2016RELATÓRIO METODOLÓGICO82
PO
RTU
GU
ÊS
onde:
w Chldk é o peso final para coordenadores na escola k da dependência d na localidade l do estrato h;
Chldk é o número de coordenadores listados na escola k da dependência d na localidade l do estrato h; e
C rhldk é o número de coordenadores respondentes na escola k da dependência d na localidade l
do estrato h.
PESO DOS PROFESSORES
O peso final dos professores é calculado em três etapas. A primeira utiliza o peso básico calibrado para as escolas em que é realizada pelo menos uma entrevista com professores. A segunda é o peso da turma que é obtido pela razão entre o número de turmas existentes e respondentes em cada série para cada escola, corrigido pela razão entre o número de turmas existentes e respondentes no estrato. O peso final da turma é dado por:
w **T a
= w*C
hldk ×T a
hldk ×T a
hl ,hldk T rahldk T ra
hl
onde:
w **T a
é o peso da turma T da séria a da escola k da dependência d na localidade l do estrato h;hldk
T ahldk é o número de turmas existentes no série a na escola k da dependência d na localidade l
do estrato h;
T rahldk é o número de turmas respondentes no série a na escola k da dependência d na localidade l
do estrato h;
T ahl é o número de turmas existentes na série a na localidade l do estrato h; e
T rahl é o número de turmas respondentes na série a na localidade l do estrato h.
Outra fonte levada em consideração para o cálculo do peso do professor é a disciplina lecionada. Em cada turma são levantadas as informações do número de professores existentes para cada uma das disciplinas de interesse. Dessa forma, para cada disciplina e para cada turma, obtém-se a razão entre o número de professores existentes e o número de entrevistas realizadas. O produto dos três fatores (escola, turma e disciplina) resulta no peso final de cada um dos professores entrevistados, dado por:
w Pa
= w **P
× w **T a
×P xa
hldk ,hldk hldk hldk P xra
hldk
onde:
w Pa
é o peso final do professor p da série a da escola k da dependência d na localidade l do estrato h;hldk
w **P é o peso corrigido para escolas com professores respondentes da escola k da dependência d
na localidade l do estrato h;hldk

2016 PESQUISA TIC EDUCAÇÃORELATÓRIO METODOLÓGICO 83
PO
RTU
GU
ÊS
w **T a
é o peso da turma T da série a da escola k da dependência d na localidade l do estrato h;hldk
P xahldk é o número de funções docentes existentes da disciplina x na série a na escola k da dependência d
na localidade l do estrato h; e
P xra é o número de funções docentes respondentes da disciplina x na série a na escola k
da dependência d na localidade l do estrato h.hldk
PESO DOS ALUNOS
Para o cálculo do peso final dos alunos é estabelecido o produto entre os pesos das escolas que tiveram alunos realizados, o peso da turma e o peso básico dos alunos. O peso da turma é obtido do mesmo modo como descrito em Peso dos Professores. A seleção de alunos é realizada por amostragem inversa simples, desse modo, o peso básico dos alunos é igual ao inverso da probabilidade de inclusão de cada aluno na amostra. O produto entre as três componentes resulta no peso final dos alunos, dado por:
w Aa
= w **A
× w**T ×
(Arahldk – 1)
×Aa
hldk ,hldk hldk hldk (Asa
hldk – 1) Arahldk
onde:
w Aa
é o peso final do aluno A da série a respondentes da escola k da dependência d na localidade l do estrato h;
hldk
w **A é o peso corrigido para escolas com alunos respondentes da escola k da dependência d
na localidade l do estrato h;hldk
w **T a
é o peso da turma T da série a da escola k da dependência d na localidade l do estrato h;hldk
Aahldk é o número de alunos existentes na série a da escola k da dependência d na localidade l
do estrato h;
Asahldk é o número de alunos selecionados na série a da escola k da dependência d na localidade l
do estrato h; e
Arahldk é o número de alunos respondentes na série a da escola k da dependência d na localidade l
do estrato h.
ERROS AMOSTRAIS
Os cálculos das medidas ou estimativas dos erros amostrais dos indicadores da pesquisa TIC Educação levam em consideração o plano amostral empregado na pesquisa. Foi utilizado o Método do Conglomerado Primário (do inglês, Ultimate Cluster) para estimação de variâncias para estimadores de totais em planos amostrais de múltiplos estágios. Proposto por Hansen, Hurwitz e Madow (1953), o método considera apenas a variação entre informações disponíveis no nível das unidades primárias de amostragem (UPA), tratando-as como se tivessem sido selecionadas do estrato com reposição da população.

PESQUISA TIC EDUCAÇÃO 2016RELATÓRIO METODOLÓGICO84
PO
RTU
GU
ÊS
Com base nesse conceito, é possível considerar a estratificação e a seleção com probabilidades desiguais, tanto das unidades primárias quanto das demais unidades de amostragem. A premissa para permitir a aplicação desse método é que estejam disponíveis estimadores não viciados dos totais da variável de interesse para cada um dos conglomerados primários selecionados. Esse método fornece a base para vários dos pacotes estatísticos especializados em cálculo de variâncias considerando o plano amostral.
A partir das variâncias estimadas, divulgam-se os erros amostrais expressos pela margem de erro. Para a divulgação, as margens de erros foram calculadas para um nível de confiança de 95%. Isso significa que, se a pesquisa for repetida várias vezes, em 95% delas o intervalo de confiança conterá o verdadeiro valor populacional. Outras medidas derivadas dessa estimativa de variabilidade são comumente apresentadas, tais como: erro padrão, coeficiente de variação ou intervalo de confiança.
O cálculo da margem de erro considera o produto do erro padrão (raiz quadrada da variância do estimador) pelo valor 1,96 (valor da distribuição normal que corresponde ao nível de significância escolhido de 95%). Esses cálculos são feitos para cada variável de cada uma das tabelas, o que assegura que todas as tabelas de indicadores possuem margens de erro relacionadas a cada estimativa apresentada em cada célula da tabela.
DISSEMINAÇÃO DOS DADOS
Os resultados desta pesquisa são apresentados de acordo com as variáveis descritas no item Unidade de Análise e Referência. Os arredondamentos em alguns resultados tornam a soma das estimativas por categorias de resposta diferentes de 100% em questões de resposta única. O somatório de frequências em questões de resposta múltipla usualmente é diferente de 100%.
Nesta publicação estão apresentadas as tabelas de alguns indicadores selecionados para cada unidade de análise. Os resultados completos, bem como as margens de erro, estão apresentados no site do Cetic.br e no portal de visualização de dados do Cetic.br.3
REFERÊNCIAS
Assunção, R., Lage, J., & Reis, E. (2002). Análise de conglomerados espaciais via árvore geradora mínima. Revista Brasileira de Estatística, 62(220), pp. 1-23.
Bolfarine, H., & Bussab, W. O. (2005). Elementos de amostragem. São Paulo: Blucher.
Cochran, W. G. (1977). Sampling techniques (3a ed.). Nova Iorque: John Wiley & Sons.
Comitê Gestor da Internet no Brasil - CGI.br. (2016). Pesquisa sobre o Uso das Tecnologias de Informação e Comunicação no Brasil: TIC Educação 2015. Recuperado em 20 de julho de 2017, de http://cetic.br/media/docs/publicacoes/2/TIC_Edu_2015_LIVRO_ELETRONICO.pdf
3 Mais informações no website do Cetic.br. Recuperado em 20 julho, 2017, de http://data.cetic.br/cetic/

2016 PESQUISA TIC EDUCAÇÃORELATÓRIO METODOLÓGICO 85
PO
RTU
GU
ÊS
Hansen, M. H., Hurwitx, W. N., & Madow, W. G. (1953). Sample survey methods and theory. Nova Iorque: Wiley.
Internacional Association for the Evaluation of Educational Achievement - IEA. (2009). Sites 2006 Technical Report. Recuperado em 20 março, 2013, de http://www.iea.nl/fileadmin/user_upload/Publications/Electronic_versions/SITES_2006_Technical_Report.pdf
Internacional Association for the Evaluation of Educational Achievement - IEA. (2009). Sites 2006 User Guide for the International Database. Recuperado em 20 março, 2013, de http://pub.iea.nl/fileadmin/user_upload/Publications/Electronic_versions/SITES_2006_IDB_User_Guide.pdf
Lumley, T. (2010). Complex surveys: a guide to analysis using R. Nova Jersey: John Wiley & Sons.
Ministério da Educação. Instituto Nacional de Estudos e Pesquisas Educacionais Anísio Teixeira - Inep. (2011). Plano de Desenvolvimento da Educação e Sistema Nacional de Avaliação da Educação Básica 2011. Recuperado em 25 julho, 2012, de http://www.oei.es/quipu/brasil/RelatorioSaeb2003_3.pdf
Ministério da Educação. Instituto Nacional de Estudos e Pesquisas Educacionais Anísio Teixeira - Inep. (2015). Censo Escolar 2014. Recuperado em 5 novembro, 2015, de http://portal.inep.gov.br/microdados
Ohlsson, E. (1995). Coordination of samples using permanent random numbers. In: B. G. Cox. Business survey methods (pp. 153-170). Nova Iorque: John Wiley.
Ohlsson, E. (1998). Sequential Poisson Sampling. Journal of Official Statistics, 14, pp. 149-162.
Särndal, C., Swensson, B., & Wretman, J. (1992). Model assisted survey sampling. Nova Iorque: Springer Verlag.
Thompson, S. K. (1999). Sampling. Nova Iorque: John Wiley & Sons.
Vasconcellos, M. T., Silva, P. L., & Szwarcwald, C. L. (2005). Sampling design for the World Health Survey in Brazil. Cadernos de Saúde Pública, 21.


2016 PESQUISA TIC EDUCAÇÃORELATÓRIO DE COLETA DE DADOS 87
PO
RTU
GU
ÊS
RELATÓRIO DE COLETA DE DADOS TIC EDUCAÇÃO 2016
INTRODUÇÃO
O Comitê Gestor da Internet no Brasil (CGI.br), por meio do Centro Regional de Estudos para o Desenvolvimento da Sociedade da Informação (Cetic.br), do Núcleo de Informação e Coordenação do Ponto BR (NIC.br), apresenta o relatório de coleta de dados da pesquisa TIC Educação 2016. O objetivo do relatório é informar características específicas da edição de 2016 do estudo, contemplando eventuais alterações realizadas nos instrumentos de coleta, a alocação da amostra implementada neste ano e as taxas de resposta verificadas.
A apresentação da metodologia completa da pesquisa, incluindo os objetivos, os principais conceitos e definições e as características do plano amostral empregado, está descrita no Relatório Metodológico, que também está incluído nesta edição.
ALOCAÇÃO DA AMOSTRA
A amostra planejada para a pesquisa TIC Educação de 2016 foi de 1.367 instituições.
A distribuição das escolas é variável entre as regiões e as dependências administrativas, conforme mostra a Tabela 1.
TABELA 1DISTRIBUIÇÃO DA AMOSTRA DE ESCOLAS, SEGUNDO REGIÃO E DEPENDÊNCIA ADMINISTRATIVA
Amostra
REGIÃO
Norte 273
Nordeste 273
Sudeste 285
Sul 260
Centro-Oeste 276
DEPENDÊNCIA ADMINISTRATIVA
Municipal 273
Estadual 273
Privada 285

PESQUISA TIC EDUCAÇÃO 2016RELATÓRIO DE COLETA DE DADOS88
PO
RTU
GU
ÊS
INSTRUMENTO DE COLETA
ENTREVISTAS COGNITIVAS E PRÉ-TESTES
Não foram aplicados pré-testes e entrevistas cognitivas na edição de 2016.
ALTERAÇÕES NOS INSTRUMENTOS DE COLETA
No planejamento da edição 2016 da pesquisa TIC Educação não foram realizadas mudanças significativas nos questionários dos quatro públicos pesquisados em relação à edição de 2015. Dentre as alterações realizadas, temos a exclusão de alguns indicadores e itens desatualizados em relação aos objetivos de medição da pesquisa; inclusão de indicadores para o aprimoramento da coleta sobre a realidade escolar e o uso de tecnologias; e alterações pontuais em enunciados e itens das perguntas para facilitar a compreensão por parte do entrevistado. A seguir, são apresentadas as alterações de cada questionário, separadas por público.
DIRETORES
Para diretores, foram realizadas algumas alterações na redação de itens do indicador de escolaridade. No indicador da unidade de análise Escolas, optou-se por questionar a quantidade de computadores de mesa em funcionamento somente e não mais a de instalados e em funcionamento. Foram excluídas as questões sobre: uso de Internet por professores nas aulas segundo o diretor, conteúdos oferecidos nas plataformas digitais nas quais a escola está presente e responsáveis por manutenção do blog.
COORDENADORES
No questionário de coordenadores foram realizadas algumas alterações somente na redação de itens do indicador de escolaridade.
PROFESSORES
No questionário de professores foram realizadas algumas alterações na redação de itens do indicador de escolaridade. Foram excluídas as questões sobre frequência de deslocamento de computador portátil ou tablet pessoais para a escola e habilidades gerais.
ALUNOS
Foram excluídas as questões sobre: uso de rede WiFi da escola mesmo que restrita, habilidades gerais, local de realização de atividades escolares com uso de Internet. Foi incluída questão sobre utilização do telefone celular em atividades escolares com orientação do professor.

2016 PESQUISA TIC EDUCAÇÃORELATÓRIO DE COLETA DE DADOS 89
PO
RTU
GU
ÊS
TREINAMENTO DE CAMPO
As entrevistas foram realizadas por uma equipe de profissionais treinados e supervisionados. Esses entrevistadores passaram por um treinamento específico para aplicação da pesquisa.
Além disso, toda a equipe do projeto também teve acesso ao manual de instruções da pesquisa, que continha a descrição de todos os procedimentos necessários para a realização da coleta de dados e o detalhamento dos objetivos e metodologia do estudo, para garantir a padronização e a qualidade do trabalho.
Ao todo, trabalharam na coleta de dados 145 entrevistadores e 19 supervisores de campo.
COLETA DE DADOS EM CAMPO
MÉTODO DE COLETA
Foram conduzidas entrevistas com questionários estruturados específicos para os públicos abordados na pesquisa: alunos de 5o ano e 9o ano do Ensino Fundamental e do 2o ano do Ensino Médio, professores de Língua Portuguesa, Matemática e multidisciplinares, coordenadores pedagógicos e diretores. Os indicadores da unidade de análise Escolas são respondidos pelos diretores. A aplicação do instrumento de coleta de dados teve duração média de 29 minutos para professores, de 35 minutos para diretores, de 13 minutos para coordenadores pedagógicos e de 9 minutos para alunos.
A coleta de dados foi feita por meio de visita às escolas selecionadas e de entrevistas conduzidas com os diretores, coordenadores pedagógicos, professores e alunos selecionados para a amostra. Na maior parte dos casos, foi realizado um agendamento prévio por telefone com o diretor ou responsável para que a visita dos entrevistadores não interferisse no cotidiano da escola. Além disso, buscou-se agendar uma data de realização das entrevistas em que o diretor, o coordenador pedagógico e os professores selecionados estivessem presentes na instituição.
Nos casos de difícil contato por telefone, os entrevistadores foram pessoalmente às escolas e fizeram o agendamento e o preenchimento do formulário de arrolamento no próprio local. Em situações de maior dificuldade de acesso, o arrolamento e as entrevistas foram realizados no mesmo dia em que ocorreu o primeiro contato com as escolas.
Desse modo, na data agendada, os entrevistadores foram enviados à escola e realizaram as entrevistas seguindo os procedimentos e os questionários estruturados para cada público.
Cabe destacar que a pesquisa contou com o apoio institucional do Ministério da Educação (MEC), do Conselho Nacional de Secretários de Educação (Consed) e da União Nacional dos Dirigentes Municipais de Educação (Undime), que encaminharam ofícios às escolas selecionadas antes e durante a realização do campo, a fim de informá-las sobre a pesquisa e solicitar o apoio dos responsáveis no sentido de autorizar a realização das entrevistas.

PESQUISA TIC EDUCAÇÃO 2016RELATÓRIO DE COLETA DE DADOS90
PO
RTU
GU
ÊS
DATA DE COLETA
A coleta de dados da TIC Educação 2016 ocorreu entre agosto e dezembro de 2016.
PROCEDIMENTOS E CONTROLES DE CAMPO
Uma vez selecionada a amostra de escolas, as unidades escolares foram contatadas previamente para agendamento da visita destinada à coleta dos dados. O contato prévio também serviu para atualizar a informação sobre a existência ou não de turmas para a série que foi selecionada. A partir dessa informação, foi levantado o número de turmas existentes e utilizado um formulário de arrolamento, no qual foram listadas todas as turmas existentes para a série selecionada. Essa informação foi necessária pois permitiu planejar a seleção das unidades de referência dos estágios seguintes e alocar equipes de campo do tamanho adequado para a visita às escolas. Na data de realização da visita à escola, cada entrevistador conferiu as informações contidas na folha de arrolamento preenchida no contato telefônico. Caso houvesse diferença, deveria ser considerada a informação mais atualizada obtida pelo entrevistador.
Para realizar as entrevistas com coordenadores pedagógicos, professores e alunos, foi necessária a realização de arrolamento e seleção de turmas. Assim, após a seleção das turmas, utilizou-se folha de arrolamento para seleção de cada um desses públicos.
Durante a visita à escola, foram solicitados os nomes dos professores de cada disciplina visada pela pesquisa (Língua Portuguesa, Matemática e multidisciplinares) que ministram aulas na turma selecionada. Os nomes foram registrados, por disciplina lecionada, em ordem alfabética na folha de arrolamento de professores. Registraram-se também os nomes de todos os coordenadores pedagógicos responsáveis pela série selecionada, em ordem alfabética na folha de arrolamento de coordenadores pedagógicos.
No caso dos alunos, a folha de arrolamento foi criada a partir da lista de frequência das turmas selecionadas, sendo que, em algumas delas, as entrevistas foram realizadas com a totalidade de alunos da turma selecionada, pois a quantidade disponível era menor do que a estipulada pela pesquisa.
Os motivos que impossibilitaram a realização das entrevistas foram:
• A escola estava sem aulas durante o período de estudo. Por exemplo, a escola se encontrava em recesso, greve, no fim do ano letivo, com uma paralisação das aulas ou, ainda, com problemas de segurança e intempéries extremas;
• A instituição escolar não autorizou a presença dos entrevistadores e, consequentemente, a realização da pesquisa;
• A escola não possuía mais turmas da série selecionada;
• A escola deixou de existir ou encerrou as atividades;
• A escola não satisfazia os critérios estabelecidos na estratificação: as informações reais ou atuais da escola eram diferentes das registradas no cadastro, logo, também na seleção da amostra;
• A escola não foi localizada ou encontrada;
• Não foi possível realizar o agendamento, por exemplo, devido à falta de datas para a realização das entrevistas ou a ausência do diretor.

2016 PESQUISA TIC EDUCAÇÃORELATÓRIO DE COLETA DE DADOS 91
PO
RTU
GU
ÊS
RESULTADO DA COLETA
Ao todo, na pesquisa TIC Educação de 2016, foram realizadas entrevistas em 1.106 escolas, alcançando 81% da amostra planejada de 1.367 escolas. Para o conjunto de unidades de análise da pesquisa temos:
– 935 escolas que responderam aos questionários de escolas e diretores;
– 894 escolas que responderam ao questionário de coordenadores pedagógicos, totalizando 922 coordenadores pedagógicos respondentes;
– 1.017 escolas que responderam ao questionário de professores, totalizando 1.854 professores respondentes; e
– 1.087 escolas que responderam ao questionário de alunos, totalizando 11.069 alunos respondentes.
A distribuição das escolas realizadas, bem como as taxas de resposta, é variável entre as regiões e as dependências administrativas. Os resultados estão dispostos na Tabela 2.
TABELA 2TAXA DE RESPOSTA DE ESCOLAS, SEGUNDO REGIÃO E DEPENDÊNCIA ADMINISTRATIVA
Amostra
REGIÃO
Norte 89%
Nordeste 86%
Sudeste 70%
Sul 80%
Centro-Oeste 80%
DEPENDÊNCIA ADMINISTRATIVA
Municipal 90%
Estadual 90%
Privada 59%


2016 PESQUISA TIC EDUCAÇÃOANÁLISE DOS RESULTADOS 93
PO
RTU
GU
ÊS
ANÁLISE DOS RESULTADOS TIC EDUCAÇÃO 2016
APRESENTAÇÃO
A publicação da sétima edição da pesquisa TIC Educação coincide com o 20o aniversário da criação da primeira etapa de implementação do Programa Nacional de Informática na Educação – ProInfo (Portaria n. 522, 1997). Trata-se de um marco importante, uma vez que o programa ainda continua sendo a mais longeva política pública de desenvolvimento de estratégias de integração das tecnologias ao processo de ensino e aprendizagem no Brasil, à qual se somaram ações como o Programa Um Computador por Aluno (Prouca), o Programa Banda Larga nas Escolas (PBLE), o Banco Internacional de Objetos Educacionais (Bioe), o Portal do Professor e o e-ProInfo, entre outras.
O projeto da pesquisa TIC Educação foi concebido quando o ProInfo encontrava-se em sua segunda fase de implementação e tinha entre seus objetivos monitorar os resultados obtidos pelo programa. Neste cenário, a pesquisa TIC Educação, realizada desde 2010, mapeia a disponibilidade e a qualidade da infraestrutura de acesso às tecnologias de informação e comunicação (TIC) nas escolas públicas e particulares; o uso das TIC por alunos, professores, coordenadores e diretores, tanto dentro quanto fora da escola; e a inserção das TIC na gestão escolar e na prática pedagógica, por meio da coleta de dados sobre as atividades desenvolvidas por professores em sala de aula e sobre a formação de educadores. Desde a primeira edição, o estudo também buscou ir além do mapeamento da infraestrutura presente nas escolas, incluindo, por exemplo, a geração de indicadores a respeito da percepção da comunidade escolar sobre o cenário de uso das TIC no âmbito educacional.
Com o avanço da inserção das tecnologias na sociedade e, por conseguinte, nos espaços de ensino e aprendizagem, o debate sobre a adoção das TIC na educação vem se transformando de forma acelerada. Percebe-se, por exemplo, maior enfoque na apropriação de tais recursos tecnológicos, entendida nesse contexto como o processo contínuo no qual o indivíduo se apodera das tecnologias, dos conteúdos, das linguagens, das formas de interação, atribuindo a eles novos ou renovados significados (Borges, 2009).
Em consonância com esse cenário, em 2016, o Centro Regional de Estudos para o Desenvolvimento da Sociedade da Informação (Cetic.br) iniciou um processo de aprimoramento dos indicadores coletados pela pesquisa TIC Educação, sistematizado no Marco Referencial Metodológico para a Medição do Acesso e Uso das Tecnologias de Informação e Comunicação (TIC) na Educação (Comitê Gestor da Internet do Brasil [CGI.br] & Unesco Institute for

PESQUISA TIC EDUCAÇÃO 2016ANÁLISE DOS RESULTADOS94
PO
RTU
GU
ÊS
Statistics [UIS], 2016), construído em torno da relação da “cultura digital na escola e da escola na cultura digital”, ou melhor:
[...] como a escola se apropria das TIC e dos produtos culturais dela provenientes e, por
outro lado, também atua como geradora de conhecimento e informação que, por meio
de seus atores (alunos, professores, coordenadores e diretores), serão disseminados nos
grupos e nichos que compõem a cultura digital. (p. 15)
O Marco Referencial Metodológico (CGI.br & UIS, 2016) elaborado para a pesquisa TIC Educação acompanha um movimento que vem ocorrendo também no âmbito das políticas públicas. No início da década de 1980, por exemplo, quando surgiram as primeiras iniciativas para a criação de uma política nacional de informatização da educação, como o projeto Educom1, o enfoque dos debates era a capacitação técnica para a informática, de modo a criar uma força de trabalho e pesquisa em torno de equipamentos e linguagens.
A primeira etapa do ProInfo, que durou de 1997 a 2006, surgiu a partir do aprimoramento dos objetivos do projeto Educom, no momento em que os computadores pessoais e a Internet começavam a chegar aos domicílios, e quando também se ampliavam os debates sobre a inclusão digital dos indivíduos. Segundo o texto da portaria que o criou, a finalidade do programa era “disseminar o uso pedagógico das tecnologias de informática e telecomunicações nas escolas públicas de Ensinos Fundamental e Médio pertencentes às redes estadual e municipal” (Portaria n. 522, 1997).
A meta de inclusão digital foi ampliada em 2007, quando teve início a segunda etapa do ProInfo, transformado em ProInfo Integrado. Para além da implementação de infraestrutura e capacitação de educadores, o programa passou a abranger também o desenvolvimento de conteúdos e repositórios de materiais didáticos digitais, a criação de plataformas de interação e comunicação e a promoção de comunidades virtuais para troca de experiências entre educadores, ações que se alinhavam à necessidade de aprimorar o uso das TIC nas escolas, especialmente pela demanda de conexão à Internet. Entre suas propostas, destacavam-se o objetivo 2 – “fomentar a melhoria do processo de ensino e aprendizagem com o uso das tecnologias de informação e comunicação” – e o objetivo 4 – “contribuir com a inclusão digital por meio da ampliação do acesso a computadores, da conexão à rede mundial de computadores e de outras tecnologias digitais, beneficiando a comunidade escolar e a população próxima às escolas” (Decreto n. 6.300, 2007). Ambos os objetivos revelam aspectos ainda não presentes no texto das outras políticas, como o papel das tecnologias no aprimoramento do processo de ensino e aprendizagem e o da escola enquanto centro de inclusão digital para a comunidade escolar e para a comunidade no entorno dela.
1 O projeto Educom, cuja implementação aconteceu entre os anos de 1985 e 1991, surgiu por iniciativa da SEI – Secretaria Especial da Presidência da República (SEI/CSN/PR). A SEI tinha por finalidade a regulamentação, a supervisão e o fomento às iniciativas de desenvolvimento do setor de tecnologia no país, responsável à época pela Política Nacional de Informática, que buscava “fomentar e estimular a informatização da sociedade brasileira, voltada para a capacitação científica e tecnológica capaz de promover a autonomia nacional, baseada em princípios e diretrizes fundamentados na realidade brasileira e decorrente das atividades de pesquisa e da consolidação da indústria nacional” (Moraes, 1997 como citado em Almeida & Valente, 2016).
2016 PESQUISA TIC EDUCAÇÃOANÁLISE DOS RESULTADOS 95
PO
RTU
GU
ÊS
Apesar de as políticas de fomento ao acesso às tecnologias na escola ainda se basearem nesses mesmos objetivos há mais de uma década, a leitura de documentos oficiais mais recentes, que subsidiam as decisões para a melhoria da qualidade da educação no país, já demonstra que as tecnologias estão assumindo outros papéis no processo de ensino e aprendizagem. As TIC estão presentes, por exemplo, nas metas 2, 3, 5, 7, 8, 9 e 16 do Plano Nacional de Educação 2014-2024 (Lei n. 13.005, 2014), como forma de apoio à garantia de acesso à educação para estudantes de educação especial, de escolas do campo e de comunidades indígenas e quilombolas; como área de estudo e pesquisa para estudantes de Ensino Médio; como forma de diversificar os métodos de ensino e as propostas pedagógicas a serem aplicados à aprendizagem de crianças e adolescentes de todos os níveis de ensino; como veículo de viabilização de novos ou renovados espaços de conhecimento, a exemplo das bibliotecas escolares; como meio de erradicação do analfabetismo, abrangendo jovens, adultos e idosos.
As tecnologias também estão no foco da terceira versão da Base Nacional Curricular Comum (MEC, 2017), que estabelece dez competências gerais que perpassam os componentes curriculares da Educação Básica para a construção de conhecimentos, habilidades, atitudes e valores e que, segundo o texto, “explicitam o compromisso da educação brasileira com a formação humana integral e com a construção de uma sociedade justa, democrática e inclusiva” (p. 18). A quinta competência diz respeito à utilização de tecnologias digitais de comunicação e informação, de forma “crítica, significativa, reflexiva e ética” (p. 18). Relacionar as TIC a tais objetivos significa considerá-las mais do que dispositivos de informação e comunicação, mais do que ferramentas de apoio aos métodos pedagógicos, significa considerá-las parte da construção social, ética e estética do ser.
Em âmbito internacional, o item 4 dos Objetivos de Desenvolvimento Sustentável (ODS)2, que diz respeito a “assegurar a educação inclusiva e equitativa de qualidade, e promover oportunidades de aprendizagem ao longo da vida para todos”, também traz a recomendação para o desenvolvimento de competências em tecnologias de informação e comunicação, conforme indica a meta 4.4, referente ao aprimoramento de competências de jovens e adultos para o emprego.
De forma a conservar a série histórica da pesquisa e permitir a inclusão de indicadores condizentes com esses novos enfoques sobre as tecnologias na educação, o Marco Referencial Metodológico (CGI.br & UIS, 2016) passou a delimitar três dimensões de análise para a pesquisa TIC Educação: acesso, uso e apropriação. O acesso compreende os meios de disponibilização de TIC para o desenvolvimento de projetos tanto dentro quanto fora da escola, como o uso de tecnologias móveis para criação de ambientes de aprendizagem, por exemplo. Também são abordados os aspectos das políticas públicas que possibilitam a oferta e o uso de TIC. A dimensão do uso se refere à forma como os atores da escola, professores e alunos em especial, utilizam as TIC para se informar, produzir conhecimento e criar ou aperfeiçoar os processos de ensino e aprendizagem. Já a dimensão de apropriação envolve a produção, a mixagem e a difusão do conhecimento.
2 Recuperado em 27 agosto, 2017, de https://nacoesunidas.org/pos2015/agenda2030/

PESQUISA TIC EDUCAÇÃO 2016ANÁLISE DOS RESULTADOS96
PO
RTU
GU
ÊS
Acesso, uso e apropriação são a base para a construção deste relatório de análise sobre os indicadores coletados durante o segundo semestre de 2016, dados que são relevantes, especialmente, para o desenvolvimento de políticas públicas. Tais dimensões perpassam as três seções que compõem este texto:
• Políticas públicas de TIC na educação – a partir dos objetivos propostos nas principais políticas públicas de implementação de TIC nas escolas, tais como o ProInfo, são apresentados os dados referentes ao cenário de acesso e uso das TIC em escolas localizadas em áreas urbanas;
• A cultura digital na escola – a partir do enfoque da cultura digital na escola e da escola na cultura digital, a seção apresenta três tendências emergentes no âmbito das TIC na educação, sob a perspectiva de três conceitos: abertura, ubiquidade e desenvolvimento de competências;
• Tecnologias de informação e comunicação nas escolas do campo: considerações preliminares – atendendo a um dos objetivos do Marco Referencial Metodológico (CGI.br & UIS, 2016), que diz respeito à ampliação do escopo da pesquisa, na edição 2016, foi realizado um estudo piloto que buscou coletar indicadores sobre a infraestrutura e o uso de TIC em escolas localizadas em áreas rurais. Esta seção apresenta alguns dos principais resultados observados.
Ao final deste relatório, há também uma seção com reflexões acerca de uma agenda para políticas públicas de TIC na educação.
POLÍTICAS PÚBLICAS DE TIC NA EDUCAÇÃO
A meta 7 do Plano Nacional de Educação (PNE) 2014-2024 – que se refere ao fomento à qualidade da Educação Básica em todas as etapas e modalidades, com melhoria do fluxo escolar e da aprendizagem, de modo a aumentar as médias nacionais do Índice de Desenvolvimento da Educação Básica (Ideb) – cita as TIC em quatro das estratégias para atingir esse objetivo: 7.12, 7.15, 7.20 e 7.22 (Lei n. 13.005, 2014, p. 61). Tais itens referem-se, respectivamente, ao desenvolvimento, à seleção, à certificação e à divulgação de recursos educacionais em todos os níveis de ensino; à universalização do acesso à banda larga de alta velocidade e ao aumento da relação computador/aluno(a) nas escolas da rede pública; à promoção do uso pedagógico das TIC nas escolas, inclusive pela universalização das bibliotecas nestas instituições, com computadores e acesso à Internet; e à informatização dos sistemas de gestão das escolas públicas.
Os dados da pesquisa TIC Educação mostram que houve avanços nos itens citados pelo PNE e, por conseguinte, na integração das tecnologias ao processo de ensino e aprendizagem, mas que ainda existem desafios a serem superados. A seleção de dados a seguir traz dois pontos de vista a respeito desses aspectos: o primeiro mostra os indicadores sobre a infraestrutura das escolas, assim como sobre o uso desse tipo de recurso pela comunidade escolar; já o segundo revela o ponto de vista dos educadores sobre a integração das TIC ao cotidiano das escolas.

MONITORANDO ESCOLAS DO CAMPO
O estudo piloto realizado em 2016 em escolas do campo mostra que 69% possuíam ao menos um tipo de computador (de mesa, portátil ou tablet). Ainda assim, a disponibilidade de infraestrutura de rede na região onde a escola se localiza e o custo de conexão à Internet estão entre os principais obstáculos para o uso dessas tecnologias no ambiente escolar.
INFRAESTRUTURA AINDA É DESAFIO PARA A APROPRIAÇÃO DAS TIC
Apesar de haver diferenças de percepção entre diretores e coordenadores pedagógicos, as questões relacionadas à infraestrutura são citadas por ambos os públicos, tanto em escolas públicas quanto em particulares, como ações que merecem atenção na integração das TIC ao processo de ensino e aprendizagem.
TIC EDUCAÇÃO—
2016—
DESTAQUES
USO DO TELEFONE CELULAR EM ATIVIDADES ESCOLARES
Os dados da pesquisa confirmam a tendência de aumento do uso de telefone celular tanto para a realização de atividades gerais quanto de atividades pedagógicas. Em 2016, 51% dos alunos da rede pública e 60% dos estudantes da rede particular afirmaram utilizar o celular em atividades para a escola a pedido dos professores, dado coletado pela primeira vez na pesquisa.
INTERNET NA ESCOLA
Em 2016, 95% das escolas públicas e 98% das escolas particulares localizadas em áreas urbanas possuíam ao menos um tipo de computador com conexão à Internet. O uso da Internet em sala de aula apresentou também uma variação positiva em 2016, especialmente nas escolas públicas, passando de 43% para 55%.

PESQUISA TIC EDUCAÇÃO 2016ANÁLISE DOS RESULTADOS98
PO
RTU
GU
ÊS
CONECTIVIDADE E ACESSO ÀS TIC NAS ESCOLAS
No que diz respeito à participação em programas de implementação de infraestrutura tecnológica, a proporção de escolas públicas localizadas em áreas urbanas que afirmaram participar do ProInfo (50%) apresenta estabilidade na série histórica da pesquisa desde 2011, período em que aumentou a proporção de escolas públicas que declararam participar do Programa Banda Larga nas Escolas (PBLE)3 (passando de 9% para 47%). As duas principais iniciativas de implementação de infraestrutura promovidas pelo governo federal são citadas pela maior parte das escolas.
Ao longo dos últimos anos, a pesquisa TIC Educação tem indicado que a presença de computadores está praticamente universalizada nas escolas públicas e particulares brasileiras localizadas em áreas urbanas: 99% delas possuíam ao menos um tipo de computador (de mesa, portátil ou tablet) em 2016. Possivelmente, no caso das públicas, isso seja um reflexo das políticas governamentais de provimento de equipamentos TIC para as instituições de ensino.
O computador de mesa continua sendo o tipo de dispositivo mais presente nas escolas, uma vez que 98% delas possuíam ao menos um equipamento (99% das escolas públicas e 96% das escolas particulares). É relevante observar também o crescimento de dispositivos portáteis: 86% das escolas públicas e 92% das particulares possuíam computadores portáteis na edição de 2016, sendo que em 2011 essa proporção era de 67% e 64%, respectivamente. Outro destaque da pesquisa diz respeito à presença de tablets. A coleta de dados sobre a presença desse tipo de equipamento nas escolas localizadas em áreas urbanas teve início na edição de 2012, quando apenas 2% das escolas públicas e 7% das particulares possuíam o dispositivo, números que passaram para 32% e 36%, respectivamente, em 2016.
Apesar desse cenário de universalização da presença de computadores, nem sempre eles estão acessíveis aos alunos. De acordo com os dados da pesquisa TIC Educação 2016, 18% das escolas que possuíam computador não o disponibilizavam para uso dos estudantes em atividades educacionais.
O mesmo cenário é observado no que se refere ao uso da Internet nos espaços da escola. Em 2016, 95% das escolas públicas e 98% das particulares localizadas em áreas urbanas possuíam ao menos um computador com conexão à Internet. Apenas 3% do total de escolas possuíam computador sem contar com acesso à Internet: 4% das públicas e 2% das particulares encontravam-se nessa situação em 2016. Mas, a comparação entre os percentuais de locais de acesso revela a prevalência de instalação de equipamentos conectados em espaços administrativos, especialmente nas escolas públicas, como se observa no Gráfico 1.
3 Recuperado em 31 julho, 2017, de http://portal.mec.gov.br/programa-saude-da-escola/193-secretarias-112877938/seed-educacao-a-distancia-96734370/15808-programa-banda-larga-nas-escolas

2016 PESQUISA TIC EDUCAÇÃOANÁLISE DOS RESULTADOS 99
PO
RTU
GU
ÊS
GRÁFICO 1ESCOLAS, POR LOCAL DE ACESSO À INTERNET (2015 – 2016)Total de escolas com acesso à Internet (%)
100
90
80
70
60
50
40
30
20
10
0 2015
ESCOLAS PÚBLICAS ESCOLAS PARTICULARES
20152016 2016
93
77 76
4343
93
86
5559
72
92
7873
47
55
99
93
45
69
82
SALA DO(A) COORDENADOR(A) PEDAGÓGICO(A) OU DO(A) DIRETOR(A)
SALA DOS PROFESSORES OU SALA DE REUNIÃO
LABORATÓRIO DE INFORMÁTICA
SALA DE AULA
BIBLIOTECA OU SALA DE ESTUDOS PARA OS ALUNOS
O Gráfico 1 mostra também que o uso de Internet em sala de aula nas escolas públicas apresentou variação positiva de 2015 para 2016: 43% das escolas públicas possuíam acesso à Internet nas salas de aula em 2015, número que passou para 55% em 2016. Nas escolas particulares, são observadas duas diferenças: a sala de aula apresentou o terceiro maior percentual de local de uso (82%) e o laboratório de informática foi o local onde menos se acessou a Internet (45%).
Com relação aos locais da escola em que os professores usam a Internet nas atividades com os alunos, a pesquisa TIC Educação indica também uma tendência de redução do uso no laboratório de informática em relação ao que foi observado até 2015. Apenas 27% dos professores de escolas públicas usuários de Internet utilizaram o laboratório com seus alunos, percentual que era de 35% em 2015. No caso dos professores de escolas particulares, em 2016, 28% afirmaram usar a Internet no laboratório de informática, percentual que se manteve estável, já que, em 2015, era de 29%.
A respeito das bibliotecas, citadas na meta 7, estratégia 7.20 do PNE, os percentuais ainda revelam pouca relevância da utilização de Internet nesses espaços por parte dos professores em atividades com os alunos. Em 2016, entre os professores usuários de Internet de escolas públicas, 13% afirmaram usar a Internet na biblioteca; entre os professores de escolas particulares, 18%.

PESQUISA TIC EDUCAÇÃO 2016ANÁLISE DOS RESULTADOS100
PO
RTU
GU
ÊS
Há uma relação entre o uso da Internet nos espaços escolares e a qualidade de conexão à rede. Assim como observado em edições anteriores da pesquisa, as velocidades de conexão disponíveis nas escolas brasileiras localizadas em áreas urbanas seguem aquém das necessidades de uso simultâneo da rede por vários equipamentos em diversos locais, questão que ainda é um desafio para o cumprimento da meta 7, estratégia 7.15 do PNE, de universalização do acesso. Na maior parte das escolas, a velocidade de conexão não ultrapassava 4 Mbps (42%) em 2016, cenário que é mais crítico entre as escolas públicas – a maior parte (45%) tinha disponíveis velocidades de até 4 Mbps – do que entre as escolas particulares – 59% tinha velocidades superiores a 5 Mbps. Ademais, outro ponto a ser destacado entre as instituições públicas é a incidência do desconhecimento do diretor com relação à principal velocidade de conexão existente na escola (30%), como já observado em edições anteriores da pesquisa (Tabela 1).
TABELA 1ESCOLAS, POR PRINCIPAL VELOCIDADE DE CONEXÃO À INTERNET (2015 – 2016)Total de escolas com acesso à Internet
(%)
Total de escolas Escolas públicas Escolas particulares
2015 2016 2015 2016 2015 2016
Até 999 Kbps 5 5 7 6 1 0
De 1 a 2 Mbps 32 25 38 27 23 20
De 3 a 4 Mbps 11 12 12 12 9 11
De 5 a 10 Mbps 21 22 16 19 28 31
11 Mbps ou mais 10 11 4 6 24 28
Não sabe/ Não respondeu 21 24 24 30 15 11
Já no que tange ao uso de sistemas de gestão escolar, tema da estratégia 7.22 do PNE, dados da pesquisa TIC Educação indicam que a utilização de Internet para a realização de tarefas administrativas foi uma prática presente na maioria das escolas brasileiras (95%), percentual que foi semelhante entre instituições públicas e particulares. Os dados revelam também que 74% do total de escolas localizadas em áreas urbanas utilizaram sistemas de gestão escolar, sendo que esse percentual foi de 69% nas particulares e de 76% nas públicas. São encontradas diferenças apenas quando se observa o uso por região, com atenção para a Nordeste: a região Centro-Oeste apresentou o maior percentual de escolas localizadas em áreas urbanas que usam sistemas de gestão escolar (88%), seguida das regiões Sul (82%), Sudeste (80%) e Norte (75%), enquanto na região Nordeste este percentual é de 59%.

2016 PESQUISA TIC EDUCAÇÃOANÁLISE DOS RESULTADOS 101
PO
RTU
GU
ÊS
AS TIC NA ESCOLA PELO PONTO VISTA DA COMUNIDADE ESCOLAR
De modo geral, a percepção dos alunos sobre os usos que os professores fazem das TIC durante as aulas é positiva. No que tange a esse aspecto, não foram observadas diferenças entre alunos de escolas públicas e particulares, havendo distinção apenas entre os níveis de ensino e as faixas etárias dos alunos, conforme mostra o Gráfico 2.
GRÁFICO 2ALUNOS, POR PERCEPÇÃO SOBRE POSSÍVEIS IMPACTOS DAS TIC (2016)Total de alunos (%)
100
90
80
70
60
50
40
30
20
10
0 Particular 9o ano do Ensino
FundamentalPública 5o ano do Ensino
Fundamental2o ano do
Ensino Médio
DEPENDÊNCIA ADMINISTRATIVATOTAL NÍVEL DE ENSINO
76
70
64
7772
63
81
73
65
76
70
64 65 6460
84
75
66
QUANDO O(A) PROFESSOR(A) USA A INTERNET, A AULA FICA MAIS LEGAL
QUANDO O(A) PROFESSOR(A) USA A INTERNET, EU APRENDO MAIS FÁCIL
QUANDO O(A) PROFESSOR(A) USA A INTERNET, EU PRESTO MAIS ATENÇÃO NA AULA
Assim como no caso dos alunos, a percepção de diretores, coordenadores pedagógicos e professores é bastante positiva com relação à utilização das TIC nas práticas pedagógicas, especialmente a respeito do acesso a materiais mais diversificados e de melhor qualidade por parte dos professores, da adoção de novos métodos pedagógicos e da maior colaboração dos professores entre si. O cumprimento de tarefas administrativas com maior facilidade é ressaltado na percepção de coordenadores de escolas particulares e professores de ambas as dependências administrativas, apesar de a diminuição do trabalho dos professores apresentar percentuais menores, segundo a avaliação de todos os educadores. Destaca-se, ainda, a percepção dos professores sobre o papel das TIC em sua relação com os estudantes: por meio delas, eles passaram a realizar avaliações mais individualizadas e se comunicar com os alunos com maior facilidade, como é possível observar na Tabela 2.

PESQUISA TIC EDUCAÇÃO 2016ANÁLISE DOS RESULTADOS102
PO
RTU
GU
ÊS
TABELA 2DIRETORES, COORDENADORES E PROFESSORES, POR PERCEPÇÃO SOBRE POSSÍVEIS IMPACTOS DAS TIC EM PRÁTICAS PEDAGÓGICAS (2016)Total de diretores, coordenadores pedagógicos e professores
2016(%)
Diretores 1 Coordenadores Pedagógicos Professores
Públicas Particulares Públicas Particulares Públicas Particulares
Os professores passaram a ter acesso a materiais mais diversificados / de melhor qualidade
93 92 83 83 93 97
Os professores passaram a adotar novos métodos pedagógicos 85 89 73 83 85 88
Os professores passaram a colaborar mais com outros colegas da escola 81 83 73 89 79 81
Os professores passaram a cumprir suas tarefas administrativas com maior facilidade 77 84 67 90 82 85
Os professores passaram a ter contato com educadores e com especialistas de outras escolas
68 75 49 64 66 69
Os professores passaram a fazer avaliações mais individualizadas dos alunos 57 66 50 53 75 75
A quantidade de trabalho dos professores diminuiu 34 37 28 30 54 57
Os professores passaram a se comunicar com o aluno com maior facilidade – – – – 75 84
1 Respostas ao item “Concordo”.
Por outro lado, a pesquisa TIC Educação 2016 também apresenta dados sobre as percepções de diretores, coordenadores pedagógicos e professores a respeito das barreiras para uso de TIC na escola. Em geral, observa-se uma tendência de que as principais barreiras na percepção dos três públicos se concentrem nas questões mais associadas à infraestrutura do que naquelas relativas às atividades pedagógicas, o que indica que ainda não foram superados os problemas de acesso às TIC na realidade escolar brasileira, seja na rede pública ou particular, como ilustra a Tabela 3.
Contudo, ainda que as percepções sobre as barreiras ao uso das tecnologias demonstrem claramente que as principais preocupações giram em torno dos aspectos relativos à infraestrutura, entre as ações prioritárias para a integração das TIC ao processo de ensino e aprendizagem aparecem também as questões relativas às práticas pedagógicas (Tabela 4). Para além do aumento do número de equipamentos por aluno (32%), os diretores das escolas públicas também citaram o desenvolvimento de novas práticas de ensino que envolvam o uso de computador e Internet (17%) – ação prioritária também para diretores das escolas particulares (36%) e coordenadores pedagógicos, tanto de escolas públicas (20%) quanto de escolas particulares (35%).

2016 PESQUISA TIC EDUCAÇÃOANÁLISE DOS RESULTADOS 103
PO
RTU
GU
ÊS
TABELA 3DIRETORES, COORDENADORES PEDAGÓGICOS E PROFESSORES, POR PERCEPÇÃO SOBRE BARREIRAS PARA O USO DAS TIC NAS ESCOLAS (2016)Total de diretores, coordenadores pedagógicos e professores
2016(%)
Diretores 1 Coordenadores Pedagógicos Professores
Públicas Particulares Públicas Particulares Públicas Particulares
Número insuficiente de computadores por aluno 77 47 77 52 77 42
Equipamentos obsoletos /ultrapassados 76 49 67 41 69 51
Baixa velocidade na conexão de Internet 73 49 75 47 72 49
Ausência de suporte técnico ou manutenção 70 46 69 33 66 43
Número insuficiente de computadores conectados à Internet 71 42 74 38 75 45
Falta de apoio pedagógico aos professores para o uso do computador e da Internet 54 27 34 22 41 20
Pressão ou falta de tempo para cumprir com o conteúdo previsto 42 21 39 24 42 30
Pressão para conseguir boas notas nas avaliações de desempenho 27 23 26 10 34 12
Ausência de curso específico para o uso de computador ou Internet nas aulas – – – – 53 31
1 Respostas ao item “Dificulta muito”.
TABELA 4DIRETORES E COORDENADORES PEDAGÓGICOS, POR AÇÕES PRIORITÁRIAS PARA INTEGRAÇÃO DO COMPUTADOR E DA INTERNET EM PRÁTICAS PEDAGÓGICAS (2016)Total de diretores e coordenadores pedagógicos
2016(%)
Diretores Coordenadores Pedagógicos
Públicas Particulares Públicas Particulares
Aumentar o número de computadores por aluno 32 16 22 18
Desenvolver novas práticas de ensino que envolvam o uso de computador e Internet 17 36 20 35
Melhorar as habilidades e competências técnicas dos professores no uso das tecnologias 19 22 21 17
Aumentar a velocidade de acesso à Internet 13 10 14 8
Aumentar o número de computadores conectados à Internet 13 6 16 13
Melhorar as habilidades e competências técnicas dos alunos no uso das tecnologias 3 5 5 8

PESQUISA TIC EDUCAÇÃO 2016ANÁLISE DOS RESULTADOS104
PO
RTU
GU
ÊS
A CULTURA DIGITAL NA ESCOLA
Como observado na primeira seção deste relatório, há ainda desafios a serem vencidos para que a integração das tecnologias se efetive no cotidiano escolar, por meio principalmente da ampliação e da qualificação do acesso aos dispositivos e redes, especialmente para utilização de professores e alunos em atividades de ensino e aprendizagem. Ao mesmo tempo, não se pode dizer que as escolas estejam isoladas e não sejam influenciadas pela cultura digital. Educadores e estudantes acabam integrando espontaneamente as tecnologias às atividades pedagógicas desenvolvidas tanto nos espaços da escola quanto fora dela.
Esta seção traz dados sobre as formas de apropriação das tecnologias por alunos e professores sob a ótica de três conceitos característicos da cultura digital: ubiquidade, abertura e habilidades e competências digitais.
UBIQUIDADE: O USO DE DISPOSITIVOS MÓVEIS NA APRENDIZAGEM
A ubiquidade diz respeito à presença e ao uso das mídias e tecnologias digitais a qualquer hora e em qualquer lugar, de forma onipresente, global, pervasiva. Refere-se aos equipamentos que viabilizam a computação ubíqua, como os dispositivos móveis (celulares, tablets, notebooks), e também aos aplicativos e serviços oferecidos na nuvem (cloud computing), ao acesso instantâneo à informação, às redes sociais que permitem interação com pessoas em espaços e tempos diversos, entre outros recursos (Almeida, 2016).
A naturalidade e a intensidade com que a computação ubíqua se integra ao cotidiano acaba por reconfigurar as formas de pensar, de interagir com o conhecimento, com as pessoas, com o ambiente, com o trabalho e, por conseguinte, influencia a relação com o aprender, originando o conceito de aprendizagem móvel e ubíqua (Almeida, 2016; Santaella, 2010).
Um reflexo da ubiquidade no contexto educacional pode ser verificado nos resultados da TIC Educação 2016, que confirmam a tendência de ampliação do acesso à Internet por meio do telefone celular para uso geral e para a realização de atividades escolares, tanto por professores quanto por alunos.
O telefone celular foi o principal dispositivo para acesso à Internet para 77% dos alunos usuários da rede, sendo que em 2015 essa proporção era de 73%. Ao mesmo tempo, o acesso à Internet prioritariamente por outros equipamentos, como computadores de mesa (9%) e notebooks (6%) apresenta tendência de redução. O Gráfico 3 ilustra o destaque que o celular adquire nas duas últimas edições da pesquisa.

2016 PESQUISA TIC EDUCAÇÃOANÁLISE DOS RESULTADOS 105
PO
RTU
GU
ÊS
GRÁFICO 3ALUNOS, POR PRINCIPAL EQUIPAMENTO UTILIZADO PARA ACESSAR A INTERNET (2015 – 2016)Total de alunos usuários de Internet (%)
100
90
80
70
60
50
40
30
20
10
0 2015
ESCOLAS PÚBLICAS ESCOLAS PARTICULARES
20152016 2016
74
11
572 1
73
10
4
9
2 2
78
956
2 1
70
7109
2 2
CELULAR
COMPUTADOR DE MESA OU FIXO
NOTEBOOK
TABLET
VIDEOGAME
TELEVISÃO
A pesquisa também indica que 19% dos alunos usuários de Internet disseram acessar a rede exclusivamente pelo telefone celular (uma variação de quatro pontos percentuais em relação a 2015), sendo 21% entre os alunos de escolas públicas e 5% entre os alunos de escolas particulares. De modo geral, o celular pode ser considerado o principal meio de acesso aos recursos da cultura digital para o aluno de escola pública, tendo em vista que o dispositivo tem sido disseminado nos últimos anos nos diversos segmentos da população brasileira, especialmente entre crianças e adolescentes4 e nas classes mais baixas5. Entre os alunos de escolas particulares, os percentuais (Gráfico 4) mostram um contexto de maior diversificação de dispositivos para acesso à Internet.
O telefone celular foi o equipamento mais utilizado (93%) pelos alunos de escolas localizadas em áreas urbanas em 2016. Entre os dispositivos estimulados na pesquisa – a saber, celular, computador de mesa, notebook, tablet, videogame e televisão –, apenas o acesso à Internet pela televisão apresentou maior variação entre as duas últimas edições do estudo, aumento verificado tanto entre alunos de escolas públicas (17% e 26%, respectivamente), quanto entre estudantes de escolas particulares (37% e 46%, respectivamente). Depois do
4 Outras informações podem ser encontradas também em Comitê Gestor da Internet no Brasil – CGI.br (2016). Pesquisa sobre o Uso da Internet por Crianças e Adolescentes no Brasil: TIC Kids Online Brasil 2015. São Paulo: CGI.br.
5 Outras informações podem ser encontradas também em Comitê Gestor da Internet no Brasil – CGI.br (2017). Pesquisa Sobre o Uso das Tecnologias de Informação e Comunicação nos Domicílios Brasileiros: TIC Domicílios 2016. São Paulo: CGI.br.

PESQUISA TIC EDUCAÇÃO 2016ANÁLISE DOS RESULTADOS106
PO
RTU
GU
ÊS
celular, o computador de mesa foi o equipamento mais utilizado pelos alunos de escolas públicas para acessar a Internet. Quando considerados somente os alunos de escolas particulares, o segundo equipamento mais utilizado foi o notebook.
GRÁFICO 4ALUNOS, POR EQUIPAMENTOS UTILIZADOS PARA ACESSAR A INTERNET (2015 – 2016)Total de alunos usuários de Internet (%)
100
90
80
70
60
50
40
30
20
10
0 2015
ESCOLAS PÚBLICAS ESCOLAS PARTICULARES
20152016 2016
90
45
21
54
17
34
1
93
68
39
64
37
52
0
93
43
24
50
2631
0
93
67
39
60
46
54
1
CELULAR
COMPUTADOR DE MESA OU FIXO
NOTEBOOK
TABLET
TELEVISÃO
VIDEOGAME
OUTRO APARELHO
Os dados da pesquisa revelam também que os alunos de escolas particulares têm mais acesso a dispositivos em seus domicílios, com destaque para os móveis. Em 2016, entre os alunos de escolas públicas, 43% possuíam computador de mesa no domicílio, 40% computador portátil e 32% tablet. Entre os alunos de escolas particulares, a posse de equipamentos, como apontado, foi maior: 60% possuíam computador de mesa, 72% computador portátil e 62% tablet.
Por um lado, é inegável o papel desempenhado pelo celular na inclusão digital dessas crianças e adolescentes, permitindo acesso a recursos e serviços de educação, cultura, governo, saúde, etc., especialmente quando conectados à Internet. Além disso, a posse de um dispositivo atribui maior autonomia ao usuário do que o acesso exclusivo por computadores da escola, da biblioteca ou de algum outro centro público de acesso, o que tem um potencial de impacto em seu nível de engajamento no uso das tecnologias. Por outro lado, o desenvolvimento de habilidades e competências digitais está fortemente relacionado à qualidade do acesso. Dessa forma, aqueles usuários que têm a possibilidade de utilizar diferentes dispositivos possuem também mais oportunidades de ter contato com diferentes linguagens do que aqueles que fazem uso apenas do telefone celular (Hargittai, 2010; boyd, 2014).

2016 PESQUISA TIC EDUCAÇÃOANÁLISE DOS RESULTADOS 107
PO
RTU
GU
ÊS
É importante lembrar que, apesar de, em 2016, 85% dos alunos das escolas urbanas brasileiras serem usuários de Internet, isto é, disseram utilizar a rede pelo menos uma vez nos três meses anteriores à pesquisa, há ainda um número considerável de estudantes que usaram a Internet há mais de três meses ou nunca acessaram a rede. A região Norte apresentou o maior percentual (29%) de alunos de escolas localizadas em áreas urbanas desconectados da Internet, sendo que nas outras regiões a limitação de conectividade também se manifestou: Nordeste (18%), Sul (14%), Centro-Oeste (12%) e Sudeste (11%).
Nesse sentido, os dados de posse de dispositivos revelam o quanto a escola pública e as políticas de acesso às TIC nessas instituições são importantes no contexto de diminuição da exclusão digital. Para parte significativa de crianças e adolescentes brasileiros (30% dos alunos de escolas públicas localizadas em áreas urbanas, por exemplo, que não possuem nenhum tipo de computador no domicílio) a escola pode representar uma alternativa importante de acesso às TIC.
Contudo, apesar de os dados indicarem o uso intenso de telefones celulares entre os alunos, a pesquisa TIC Educação revela que tais dispositivos ainda não foram plenamente apropriados pela cultura escolar. No Brasil, diversas redes municipais e estaduais6 proíbem o uso do equipamento na sala de aula, abrangendo, por vezes, outros espaços do ambiente escolar. Os resultados da pesquisa confirmam esse cenário: apenas 5% dos estudantes de escolas públicas e 9% dos alunos de escolas particulares afirmaram que é permitido utilizar o telefone celular na sala de aula da escola em que estudam.
Soma-se a esses resultados a indisponibilidade do acesso ao WiFi da escola para uso dos alunos. Apesar de os dados de escolas localizadas em áreas urbanas com acesso à Internet indicar um crescimento da quantidade de instituições com presença de rede sem fio, os percentuais de acesso pelos alunos se mantiveram nos mesmos patamares observados em 2015: a maioria das escolas, tanto públicas quanto particulares, que possuíam acesso à Internet (61% no total) não permitiam o uso da rede WiFi pelos alunos (Gráfico 5).
GRÁFICO 5ESCOLAS, POR RESTRIÇÕES PARA O USO DA CONEXÃO SEM FIO (2015 – 2016)Total de escolas com acesso à Internet (%)
DE USO LIVRE PARA TODOS, INCLUSIVE PARA OS ALUNOS
DE USO RESTRITO OU COM SENHA E OS ALUNOS NÃO PODEM ACESSÁ-LA
DE USO RESTRITO OU COM SENHA, MAS ALUNOS PODEM ACESSÁ-LA
NÃO POSSUI WiFi
2015
2016
1009080706050403020100
10 61 17 13
10 61 21 8
6 Atualmente o uso do celular na sala de aula é proibido por lei municipal em Recife (PE) e por leis estaduais nos estados do Ceará, Distrito Federal, Minas Gerais, Rio de Janeiro, Rio Grande do Sul, Santa Catarina e São Paulo. Em Santa Catarina, tramita projeto de lei que visa alterar a legislação vigente, a fim de autorizar o uso de celular em atividades pedagógicas. Recuperado em 03 agosto, 2017, de http://dc.clicrbs.com.br/sc/estilo-de-vida/noticia/2017/03/projeto-de-lei-propoe-liberar-uso-do-celular-em-sala-de-aula-em-sc-9744782.html
Em outubro de 2017, durante o fechamento desta publicação, a Assembleia Legislativa do Estado de São Paulo havia aprovado o projeto de Lei 860/2016, que propunha a flexibilização do uso de celular pelos alunos da rede pública estadual de ensino, durante o horário das aulas. O projeto de Lei iria ainda passar por sanção do governador. Recuperado em 26 outubro, 2017, de https://www.al.sp.gov.br/propositura/?id=1000021658

PESQUISA TIC EDUCAÇÃO 2016ANÁLISE DOS RESULTADOS108
PO
RTU
GU
ÊS Como alternativa para a utilização da Internet nos ambientes da escola, os alunos usaram recursos próprios: 27% dos estudantes usuários de Internet disseram utilizar conexão 3G ou 4G do próprio telefone celular na escola (eram 22% em 2015) e 11% por meio de conexão 3G ou 4G de outra pessoa (8% em 2015).
Ainda de modo a aprofundar a discussão sobre a presença de celular no processo de ensino e aprendizagem, em 2016, a pesquisa passou a levantar informações sobre o uso do dispositivo em atividades escolares sob orientação do professor. Por meio desse indicador, foi possível observar que, para 52% dos alunos, o uso do telefone celular para realização de atividades escolares já foi solicitado por algum de seus professores, percentual que atinge 51% entre estudantes de escolas públicas e 60% entre alunos de escolas particulares. Nessa prática, são verificadas diferenças apenas por nível de ensino: o indicador atinge a proporção de 74% entre alunos do 2o ano do Ensino Médio, 59% entre estudantes do 9o ano do Ensino Fundamental e apenas 27% entre alunos do 5o ano do Ensino Fundamental.
No que tange aos professores, o acesso à rede pelo telefone celular vem apresentando crescimento progressivo. Em 2011, 15% dos professores usuários de Internet declararam acessar a rede por meio do telefone celular, percentual que passou para 91% em 2016. Entre os professores usuários de Internet, 49% declararam utilizar a Internet do celular para desenvolver atividades com os alunos – em 2015, esse percentual era de 39%. O crescimento é verificado com maior ou menor variação entre os professores de todas as faixas etárias, em escolas públicas e particulares, conforme indica o Gráfico 6.
GRÁFICO 6PROFESSORES QUE ACESSARAM A INTERNET PELO TELEFONE CELULAR EM ATIVIDADES COM OS ALUNOS (2015 – 2016)Total de professores usuários de Internet (%)
100
90
80
70
60
50
40
30
20
10
0 Escolas
ParticularesDe 31 a 45 anos
De 46 anos ou mais
9o ano do Ensino
Fundamental
EscolasPúblicas
Até 30 anos
5o ano do Ensino
Fundamental
2o ano do Ensino Médio
DEPENDÊNCIA ADMINISTRATIVA
FAIXA ETÁRIATOTAL NÍVEL DE ENSINO
39
49
43
51
46
61
35
61
36
46
32
43
37
56
3842 42 41
2015 2016

2016 PESQUISA TIC EDUCAÇÃOANÁLISE DOS RESULTADOS 109
PO
RTU
GU
ÊS
ABERTURA: O USO DE RECURSOS EDUCACIONAIS ABERTOS POR PROFESSORES
O conceito de abertura no âmbito educacional surge da busca por formas de vencer o obstáculo de acesso, não apenas à escola, como à educação de qualidade, de oportunizar a universalização do conhecimento, a equidade e a liberdade de aprendizagem ao longo da vida, por meio de alternativas sustentáveis, não necessariamente dependentes de desenvolvimentos tecnológicos, mas que podem ser fortalecidas por eles (Santana, Rossini, & Pretto, 2013).
Recursos Educacionais Abertos (REA) incluem os conteúdos digitais de aprendizagem e ferramentas de apoio para o seu desenvolvimento (incluindo o uso desses elementos), bem como demais recursos necessários para a disponibilização de conteúdos de uma forma livre e aberta (Dutra & Tarouco, 2007). O termo foi cunhado em 2002, durante o Fórum da Organização das Nações Unidas para a Educação, a Ciência e a Cultura (Unesco) sobre Software Didáticos Abertos, para designar
[...] os materiais de ensino, aprendizagem e investigação em quaisquer suportes,
digitais ou outros, que se situem no domínio público ou que tenham sido divulgados
sob licença aberta que permite acesso, uso, adaptação e redistribuição gratuitos por
terceiros, mediante nenhuma restrição ou poucas restrições. O licenciamento aberto
é construído no âmbito da estrutura existente dos direitos de propriedade intelectual,
tais como se encontram definidos por convenções internacionais pertinentes, e respeita
a autoria da obra. (Organização das Nações Unidas para a Educação, a Ciência e a
Cultura [Unesco], 2012)
Desde 2014, a pesquisa TIC Educação investiga a utilização de Recursos Educacionais Abertos pelos professores, por meio do levantamento de informações sobre o uso de determinados conteúdos digitais, o acesso a plataformas específicas para a pesquisa, a redistribuição dos materiais produzidos e em qual nível a interação dos professores com os recursos acontece no contexto de preparação para as aulas.
O estudo revela que questões de provas e avaliações (85%), textos variados (83%), imagens, figuras, ilustrações e fotos (82%), notícias (79%), filmes e animações (59%), listas com indicações de leitura (55%) e videoaulas (52%) estão entre os conteúdos digitais mais utilizados pelos professores para a preparação de aulas. Na maioria dos itens, os percentuais de uso dos recursos estimulados na pesquisa não apresentaram diferenças relevantes entre a prática de professores que lecionam na rede pública e a daqueles que atuam na rede privada. A exceção foram os planos de aula obtidos na Internet, recurso mais utilizado por professores da rede pública (58%) do que pelos da rede privada (36%) – o que possivelmente tem como justificativa o fato de as escolas particulares geralmente adotarem materiais didáticos provenientes de sistemas de ensino, os quais já contém em sua elaboração, invariavelmente, orientações e planos de aula.
Com relação às plataformas de acesso aos conteúdos investigadas pela pesquisa, destacam-se as redes sociais, como Facebook ou Twitter, citadas por 25% dos professores usuários de Internet. No entanto, sites de escolas (68%), blogs de professores (71%), o Portal do Professor do MEC (61%), sites de revistas ou jornais (59%), sites de editoras (56%) e enciclopédias digitais, como Wikipedia (52%), ainda são as plataformas mais utilizadas pelos educadores.

PESQUISA TIC EDUCAÇÃO 2016ANÁLISE DOS RESULTADOS110
PO
RTU
GU
ÊS
Apenas 17% dos professores usuários de Internet afirmaram ter utilizado recursos obtidos na Internet sem realizar nenhuma alteração em seu conteúdo. Por outro lado, 87% afirmaram ter baixado ou copiado o conteúdo e realizado alterações e, em proporção semelhante, 82% disseram ter criado um conteúdo novo combinando vários materiais obtidos na Internet.
Os dados também revelam que apenas 27% dos professores usuários de Internet de escolas públicas e 30% daqueles que atuam em escolas particulares já publicaram ou postaram na Internet algum conteúdo produzido para suas aulas ou atividades com alunos (Tabela 5). Os resultados indicam que o compartilhamento de informações é realizado ainda, de maneira geral, com a rede próxima de pares, já que 72% dos professores usuários de Internet afirmaram compartilhar conteúdos educacionais com outros colegas.
TABELA 5PROFESSORES, POR USO DE RECURSOS OBTIDOS NA INTERNET PARA A PREPARAÇÃO DE AULAS OU ATIVIDADES COM ALUNOS, FORMA DE UTILIZAÇÃO E PUBLICAÇÃO DE RECURSOS PRODUZIDOS ATRAVÉS DAS TICTotal de professores usuários de Internet
(%) Públicas Particulares
Utilização de recursos da Internet
Professores que utilizam recursos obtidos na Internet na preparação de aulas 96 99
Tratamento dado ao recurso
Baixam conteúdos e fazem alterações 87 86
Criam um novo conteúdo combinando materiais 81 84
Utilizam o conteúdo sem realizar alterações 16 19
Modificam o conteúdo no site 12 7
Compartilhamento de recursos Professores que publicam o conteúdo produzido 27 30
HABILIDADES E COMPETÊNCIAS: PARA ALÉM DO ACESSO, A APROPRIAÇÃO DAS TECNOLOGIAS NO PROCESSO DE ENSINO E APRENDIZAGEM
O texto da terceira versão da Base Nacional Curricular Comum (MEC, 2017), que está em discussão pelo Conselho Nacional de Educação, traz, entre as dez competências gerais a serem desenvolvidas durante a Educação Básica, a utilização de “tecnologias digitais de comunicação e informação de forma crítica, significativa, reflexiva e ética nas diversas práticas do cotidiano (incluindo as escolares) ao se comunicar, acessar e disseminar informações, produzir conhecimentos e resolver problemas” (p. 18). Para que essa competência seja plenamente desenvolvida, equipar as escolas com infraestrutura e ofertar acesso às tecnologias à comunidade escolar pode não ser suficiente. É necessário que as pessoas se apropriem das tecnologias e entendam o seu funcionamento, possibilitando que novos usos sejam criados e que seus benefícios sejam aproveitados em prol do desenvolvimento do indivíduo e da comunidade.

2016 PESQUISA TIC EDUCAÇÃOANÁLISE DOS RESULTADOS 111
PO
RTU
GU
ÊS
Esse é um debate cada vez mais presente nas pesquisas sobre o uso de TIC pela população em geral, mas, especialmente no âmbito da educação, por sua influência nas formas de ensino e aprendizagem. A TIC Educação coleta dados sobre habilidades e competências TIC por meio da investigação de atividades realizadas por professores e alunos, dentro ou fora da escola, para entretenimento ou prática pedagógica.
Alunos usuários de Internet desempenham, por exemplo, com maior intensidade, as atividades de procura de informações em buscadores (87%), a visualização de vídeos (85%), o uso de ferramentas de comunicação, como chat do Facebook ou do WhatsApp (62%), e o acompanhamento de páginas em redes sociais (64%). Já as atividades que exigem habilidades técnicas específicas, como a edição de documentos pela Internet (24%), e a publicação de vídeos ou filmes em plataformas digitais (13%) são menos realizadas.
Além disso, conforme tendência observada em 2015, as redes sociais têm desempenhado um papel relevante na realização de trabalhos e lições da escola. Entre as opções estimuladas, o WhatsApp (54% para os alunos de escolas públicas e 63% para os alunos de escolas particulares) e o Facebook (35% para os alunos de escolas públicas e 31% para os alunos de escolas particulares) foram as redes sociais mais utilizadas com esses objetivos em 2016.
Assim como no caso dos alunos, entre as atividades on-line realizadas pelos professores destacam-se a busca por informação usando buscador (98%), o envio de mensagens instantâneas (94%), o envio de e-mail (91%) e a participação em redes sociais (87%). É menor a proporção de professores que realizam atividades que vão além da busca de informação e comunicação, envolvendo outros tipos de habilidades TIC: 38% disseram postar vídeos ou filmes na Internet, 31% criar ou atualizar blogs e 28% utilizar a Internet para fazer chamadas ou conversas através do Skype.
Se fora do contexto escolar é inegável que alunos e professores usam as TIC em seu cotidiano com certa diversidade de atividades, dentro do contexto educacional, o aproveitamento das TIC ainda é bastante centrado em atividades instrumentais, como pesquisa e busca por informação, para ambos os públicos. Em suma, fazer pesquisa para a escola, tarefas sobre um tema, trabalhos em grupo ou fazer lição que o professor solicita são as atividades mais realizadas pelos alunos usuários de Internet, percentuais que não apresentam diferenças relevantes entre os estudantes de escolas públicas e particulares. A exceção é o uso da Internet para falar com o professor, cujo percentual é maior entre os alunos de escolas particulares (49%), se comparado aos de escolas públicas (36%), conforme indica o Gráfico 7.
A maneira como os alunos se relacionam com as atividades de aprendizagem mantém uma estreita relação com a forma como elas são trabalhadas na escola. Observa-se que as atividades escolares mais citadas pelos estudantes são condizentes com aquelas também reportadas pelos professores no âmbito da prática pedagógica.
Entre as atividades realizadas pelos professores com o uso de TIC, a mais citada foi aula expositiva (52%), conforme o Gráfico 8. Outras formas de uso, que poderiam desenvolver mais as potencialidades dessas tecnologias em termos da produção autoral e autônoma de conhecimento, possibilitando maior apropriação desses recursos, são citadas por proporções menores de professores: 33% afirmaram promover debates ou apresentações com os alunos, 26% realizar interpretação de textos com os alunos e 21% trabalhar com jogos educativos com os alunos.

PESQUISA TIC EDUCAÇÃO 2016ANÁLISE DOS RESULTADOS112
PO
RTU
GU
ÊS
GRÁFICO 7ALUNOS, POR USO DA INTERNET EM ATIVIDADES ESCOLARES (2016)Total de alunos usuários de Internet (%)
49
24
57
61
74
81
85
83
89
92
93
96
76
24
36
58
60
82
Participar de cursos on-line
Falar com o(a) professor(a)
Jogar jogos educativos
Fazer apresentações para colegas de classe
Fazer trabalhos escolares com colegas a distância
Fazer lição ou exercícios que o professor passa
Realizar trabalhos em grupo
Fazer trabalhos sobre um tema
Fazer pesquisa para a escola
ESCOLAS PÚBLICAS ESCOLAS PARTICULARES
1009080706050403020100
GRÁFICO 8PROFESSORES, POR ATIVIDADES REALIZADAS COM OS ALUNOS (2016)Total de professores usuários de Internet (%)
80
18
21
50
77
33
80
41
93
42
93
29
98
40
99
90
34
32
26
82
52
48Elaborou planilhas e gráficos com os alunos
Trabalhou com jogos educativos com os alunos
Solicitou que os alunos produzissem textos, desenhos, maquetes, etc.
Fez pesquisa em livros e revistas com os alunos
Promoveu debates ou apresentações com os alunos
Realizou interpretação de textos com os alunos
Pediu para que os alunos realizassem trabalhos sobre temas específicos
Deu aulas expositivas
Solicitou trabalhos em grupo para os alunos
Tirou dúvidas de alguns alunos individualmente
Solicitou a realização de exercícios
ATIVIDADES REALIZADAS COM TIC ATIVIDADES REALIZADAS
1009080706050403020100
2016 PESQUISA TIC EDUCAÇÃOANÁLISE DOS RESULTADOS 113
PO
RTU
GU
ÊS
No âmbito do desenvolvimento de habilidades e competências no uso das TIC, desde 2015, a pesquisa TIC Educação investiga os tipos de orientações oferecidas aos alunos pelos professores sobre a utilização de Internet em suas atividades pessoais e escolares. Os resultados apontam que, segundo a maioria dos alunos, os professores indicam sites que eles deveriam utilizar para fazer trabalhos escolares (61%) ou os ajudam no uso da Internet para a realização de trabalhos ou lições (53%). Em menor proporção, a mediação do professor pode ser observada em itens como ensinar a usar a Internet de um jeito seguro (44%) e orientar sobre o que fazer se algo incomoda o aluno na Internet (33%) – indicando uma menor ênfase dos professores em aspectos relativos aos riscos associados ao uso da rede.
É inegável o papel do professor para que o potencial das tecnologias seja melhor aproveitado no contexto educacional, assim como na preparação do aluno para saber analisar quando e como utilizá-las em seu crescimento intelectual, ético, social e cultural. No entanto, nem sempre o professor está preparado para lidar com as questões trazidas pela cultura digital em sala de aula, fator que torna a formação de professores essencial para a integração das tecnologias na educação.
Em termos de formação inicial, menos da metade dos professores (43%) afirmaram ter cursado em sua graduação uma disciplina específica sobre como usar computador e Internet em atividades com alunos, percentual que é semelhante entre educadores de escolas públicas e particulares localizadas em áreas urbanas. Entre os professores que cursaram Pedagogia, a proporção é de 38%, a mesma observada entre os que cursaram licenciatura em Matemática, enquanto entre os que cursaram licenciatura em Letras a proporção diminui para 25%.
Se na formação inicial esses professores, em sua maioria, não cursaram disciplinas específicas sobre uso de computador e Internet com os alunos, na formação continuada em serviço o cenário não é muito diferente: 34% dos educadores – tanto de escolas públicas quanto de escolas particulares – disseram ter realizado algum treinamento sobre o uso do computador e de Internet nos 12 meses anteriores à pesquisa. O percentual de coordenadores pedagógicos que afirmaram que a escola ofereceu algum curso de formação continuada sobre o tema apresentou um decréscimo entre os dois últimos levantamentos – em 2015, 38% dos coordenadores pedagógicos de escolas públicas e 53% dos atuantes em escolas particulares declararam ter realizado atividades de formação de professores sobre TIC, percentuais que caíram para 33% e 44%, respectivamente, em 2016.
TECNOLOGIAS DE INFORMAÇÃO E COMUNICAÇÃO NAS ESCOLAS DO CAMPO
POLÍTICAS PÚBLICAS E EDUCAÇÃO DO CAMPO
Uma das ações previstas no Marco Referencial Metodológico para a Medição do Acesso e Uso das Tecnologias de Informação e Comunicação (TIC) na Educação (CGI.br & UIS, 2016) é ampliar a abrangência da coleta de dados realizada pela pesquisa TIC Educação, contemplando também as escolas localizadas em áreas rurais. Para que se pudesse estudar o contexto dessas instituições e mapear a melhor forma de abordar a comunidade escolar, durante os meses de outubro a dezembro de 2016 foi realizado um estudo piloto em 602 escolas do campo.
Escolas do campo são aquelas cuja sede se encontra no espaço geográfico classificado pelo Instituto Brasileiro de Geografia e Estatística (IBGE) como rural, mas também comporta aquelas que se identificam com o campo, ainda que sua sede esteja localizada em uma

PESQUISA TIC EDUCAÇÃO 2016ANÁLISE DOS RESULTADOS114
PO
RTU
GU
ÊS
área considerada urbana – neste caso, trata-se de instituições que atendem a populações de municípios com produção econômica, social e cultural majoritariamente vinculada ao campo (MEC, 2007, p. 14).
O documento Educação do Campo: Diferenças Mudando Paradigmas (MEC, 2007) é uma referência relevante para que se possa compreender os princípios e ideais que embasam as políticas públicas que se direcionam à educação do campo. Ele afirma a necessidade da mudança do paradigma da educação rural – vinculado “às propostas desenvolvimentistas para o campo, em geral centradas no agronegócio e na exploração indiscriminada dos recursos naturais” – para o paradigma da educação do campo, com os quais se relacionam os conceitos de sustentabilidade e diversidade, levando-se em conta a relação entre as pessoas e a natureza, assim como a “sustentabilidade ambiental, agrícola, agrária, econômica, social, política e cultural, bem como a equidade de gênero, étnico-racial, intergeracional e a diversidade sexual” (p. 13).
Trata-se de extrapolar a noção de espaço geográfico e valorizar “as necessidades culturais, os direitos sociais e a formação integral dos indivíduos” (p. 9) e reconhecer que a população do campo tem direito à educação de qualidade, como parte da universalização da educação nacional, mas, ao mesmo tempo à garantia de que suas particularidades e a sua cultura, o seu modo de viver, pensar e produzir serão considerados na construção do currículo e das políticas educacionais.
A Constituição Federal de 1988 já traz essa mudança de paradigma quando prevê o acesso à educação escolar enquanto princípio da democracia, mas compreende a educação do campo como um segmento específico, com particularidades sociais e pedagógicas próprias (Constituição da República Federativa do Brasil, 1988). A Lei de Diretrizes e Bases da Educação (LDB), de 20 de dezembro de 1996, reafirma a Constituição de 1988, fazendo constar em seus artigos o reconhecimento do direito à igualdade e à diferença, o que possibilita a definição de diretrizes operacionais para a educação do campo, adequando os conteúdos, a estrutura e as metodologias educacionais aos processos de aprendizado do aluno e à dinâmica específica do campo, sem, por outro lado, desvincular-se do projeto nacional de educação (Lei de Diretrizes e Bases, Lei n. 9.394, 1996). Por meio desses princípios, a escola do campo passou, por exemplo, a poder adotar um sistema de organização próprio, como as turmas formadas por alunos de idades e graus de conhecimento diferentes relacionados a uma mesma etapa de ensino e adequar o calendário escolar às fases do ciclo agrícola e às condições climáticas.
No que tange ao acesso às TIC, a principal política pública de fomento é o Programa Nacional de Educação do Campo (Pronacampo)7, estruturado a partir do Decreto no 7.352, de 4 de novembro de 2010, que tem como escopo a aplicação de um conjunto de ações em prol da ampliação do acesso e da qualificação da oferta de Educação Básica e Superior, do incentivo à permanência dos estudantes na escola, do aprimoramento da aprendizagem e da valorização do contexto das populações do campo. O programa é composto por quatro eixos: gestão e práticas pedagógicas; formação inicial e continuada de professores; educação de jovens e adultos e educação profissional; e infraestrutura física e tecnológica.
Como parte do objetivo geral de superar a defasagem de acesso à educação escolar pelas populações do campo, o item 4 do Decreto no 7.352, traz como meta contribuir para a “inclusão digital por meio da ampliação do acesso a computadores, a conexão à rede mundial
7 Recuperado em 27 agosto, 2017, de http://pronacampo.mec.gov.br/10-destaque/2-o-pronacampo
2016 PESQUISA TIC EDUCAÇÃOANÁLISE DOS RESULTADOS 115
PO
RTU
GU
ÊS
de computadores e a outras tecnologias digitais, beneficiando a comunidade escolar e a população próxima às escolas do campo” (Decreto n. 7.352, 2010).
Tais ações foram ratificadas pela Portaria n. 68, de 9 de novembro de 2012, que dispõe sobre a integração das escolas do campo ao ProInfo, por meio do Pronacampo (Portaria n. 68, 2012), e pela Portaria n. 86, de 1o de fevereiro de 2013, que traz um texto mais simplificado sobre as ações do Pronacampo se comparado ao Decreto 7.352, mas, no que se refere ao acesso às tecnologias, em seu artigo 8o, no item II, cita a “promoção da inclusão digital por meio da ampliação do acesso a computadores e às tecnologias digitais” (Portaria n. 86, 2013).
Segundo dados divulgados pelo Censo Escolar da Educação Básica 2016 (Instituto Nacional de Estudos e Pesquisas Educacionais Anísio Teixeira [Inep], 2017), embora 33,9% das escolas brasileiras estejam localizadas na zona rural, elas correspondem a apenas 11,4% das matrículas (5,6 milhões), com distribuição desigual entre as regiões do país. Por exemplo, enquanto “no Maranhão 34,4% das matrículas estão na zona rural, em São Paulo, esse número não chega a 2%” (p. 10). Há 4,5 mil escolas em áreas de assentamento, 2,4 mil em áreas remanescentes de quilombos e 3,1 mil em terras indígenas.
Do total de professores, 12,9% trabalham em escolas do campo e 2,8% atuam tanto em escolas localizadas em áreas urbanas quanto em escolas localizadas em áreas rurais. Entre as escolas que oferecem os anos iniciais do Ensino Fundamental, 19,9 mil contam com apenas um docente, sendo que 95,1% delas estão localizadas na área rural.
As escolas que ofertam Ensino Médio na zona rural representam a menor participação em toda a Educação Básica (10,2%). Se, no âmbito geral, 91,2% dos alunos matriculados estudam em escolas que possuem biblioteca ou sala de leitura, na zona rural esse número cai para 66,8%, sendo que o percentual é de 35,4% dos matriculados nos anos iniciais do Ensino Fundamental, 54,1% dos matriculados nos anos finais do Ensino Fundamental e 66,8% dos matriculados no Ensino Médio.
Os dados coletados pelo piloto realizado nas escolas do campo e que serão apresentados nesta seção são um primeiro passo para que se possa mapear a influência das políticas públicas no acesso às TIC nessas instituições.
AMOSTRA E METODOLOGIA DE COLETA DE DADOS
Como parte da edição de 2016 da TIC Educação, foi conduzido um estudo piloto com escolas que, segundo o Censo Escolar, estavam localizadas em áreas rurais. Optou-se por conduzir entrevistas telefônicas assistidas por computador (do inglês, computer assisted telephone interviewing – CATI).
Na primeira etapa, foi selecionada uma amostra estratificada por região de 5 mil escolas públicas e privadas, exceto federais, para a quais buscou-se contatos telefônicos nos cadastros do Instituto Nacional de Estudos e Pesquisas Educacionais Anísio Teixeira (Inep). Em 74% dos casos foi possível encontrar ao menos um número de telefone.
Já na segunda etapa, foi extraída uma amostra estratificada por região de 2 mil escolas com contatos telefônicos, derivada da amostra anterior de 5 mil, para a condução das entrevistas. O questionário foi aplicado com diretores ou responsáveis pela instituição, e a taxa de resposta foi de 30%, totalizando 602 entrevistas realizadas.
Na etapa de processamento dos resultados, a primeira correção de não resposta foi realizada dentro de cada estrato, de tal forma que as respostas fossem válidas para o conjunto de escolas.

PESQUISA TIC EDUCAÇÃO 2016ANÁLISE DOS RESULTADOS116
PO
RTU
GU
ÊS
Tendo como base de comparação algumas variáveis presentes no Censo Escolar, optou-se por ajustar as estimativas com a aplicação de um modelo logístico que incluiu as variáveis: região, existência de Internet segundo o Inep e existência de computador segundo o Inep. Com esse ajuste, foi possível minimizar diferenças que podem ser atribuídas ao perfil das escolas que não responderam ao estudo e que tendem a possuir uma infraestrutura tecnológica menos robusta, apesar de serem parte do universo de escolas rurais que possuem ao menos um contato telefônico.
INDICADORES DE TECNOLOGIA NAS ESCOLAS DO CAMPO
Segundo dados do estudo piloto realizado em escolas localizadas em áreas rurais, a maioria das instituições citam o ProInfo (22%) e o Programa Banda Larga nas Escolas (PBLE) (20%) como as principais políticas públicas das quais participam.
Assim como os diretores e coordenadores de escolas localizadas em áreas urbanas, os responsáveis pelas escolas do campo também mencionam como ação prioritária para a integração do computador e da Internet nas práticas de ensino aspectos relacionados à infraestrutura, como o aumento do número de computadores conectados à Internet (26%) e o aumento do número de computadores conectados por aluno (25%), mas destaca-se também a preocupação com o desenvolvimento de novas práticas de ensino que envolvam o uso de computador e Internet (22%).
Os indicadores referentes à formação dos professores mostram que esta parece ser uma das carências das escolas do campo para a integração das tecnologias às práticas de ensino e aprendizagem, uma vez que 84% das escolas não haviam realizado programas de formação para uso de computador e Internet em atividades pedagógicas nos 12 meses anteriores à pesquisa.
Dificuldades relacionadas à infraestrutura estão presentes também nos dados sobre a percepção dos responsáveis pela escola a respeito das barreiras para o uso das TIC, conforme indica a Tabela 6.
TABELA 6RESPONSÁVEIS PELA ESCOLA, POR PERCEPÇÃO SOBRE BARREIRAS PARA O USO DAS TIC NAS ESCOLAS (2016)Total de responsáveis pela escola
(%)Dificulta muito
Dificulta um pouco
Não dificulta nada
Nessa escola isso não acontece
Não sabe
Não respondeu
Baixa velocidade de conexão à Internet 69 15 6 9 1 1
Número insuficiente de computadores conectados à Internet 68 17 7 7 1 1
Ausência de suporte técnico e manutenção dos equipamentos 66 19 8 7 1 0
Número insuficiente de computadores por aluno 64 21 7 7 1 0
Equipamentos obsoletos ou ultrapassados 58 23 10 7 1 1
Falta de apoio pedagógico aos professores para o uso da Internet 49 32 11 6 1 0
Pressão ou falta de tempo para cumprir com o conteúdo previsto 39 35 20 5 1 0
Pressão para conseguir boas notas nas avaliações de desempenho 28 39 23 9 1 1

2016 PESQUISA TIC EDUCAÇÃOANÁLISE DOS RESULTADOS 117
PO
RTU
GU
ÊS
Em mais da metade do universo de escolas localizadas em áreas rurais (69%) havia pelo menos um tipo de computador, sendo que em 61% havia computadores de mesa, em 35% computadores portáteis ou notebooks e em 8%, tablets. Contudo, ainda de acordo com os dados do estudo, 25% das escolas que possuíam computador não disponibilizavam seu uso para os alunos.
No que se refere ao acesso à Internet, o percentual de escolas do campo com ao menos um tipo de computador com acesso à Internet é menor (45%) do que o de escolas que possuem computadores, sendo que 24% das escolas que possuíam computador não contavam com acesso à Internet. A Tabela 7 sintetiza os dados de faixas de posse de computadores em funcionamento, computadores com acesso à Internet e computadores disponíveis para os alunos:
TABELA 7ESCOLAS DO CAMPO, POR NÚMERO DE COMPUTADORES EM FUNCIONAMENTO, COM ACESSO À INTERNET E DISPONÍVEIS PARA USO DOS ALUNOS EM ATIVIDADES PEDAGÓGICAS (2016)Total de escolas do campo
(%)
Computador de mesa
Nenhum Até 5 computadores
De 6 a 20 computadores
21 computadores
ou mais
Não se aplica
Computadores em funcionamento 6 38 15 2 39
Computadores com acesso à Internet 18 27 9 1 44
Computadores disponíveis para uso dos alunos 20 23 12 1 44
(%)
Computador portátil ou notebook
Nenhum Até 5 computadores
De 6 a 20 computadores
21 computadores
ou mais
Não se aplica
Computadores em funcionamento 0 33 2 0 65
Computadores com acesso à Internet 9 25 1 0 65
Computadores disponíveis para uso dos alunos 19 16 1 0 65
(%)
Tablet
Nenhum Até 5 computadores
De 6 a 20 computadores
21 computadores
ou mais
Não se aplica
Computadores em funcionamento 1 4 2 1 92
Computadores com acesso à Internet 2 3 1 1 93
Computadores disponíveis para uso dos alunos 5 1 1 0 93
A velocidade de conexão à Internet é também um dos principais obstáculos a serem vencidos pelas escolas do campo, pois quase a metade das instituições possui velocidades de conexão de até 2Mbps (47%) – Tabela 8. Outro dado que chama a atenção é o fato de 37% dos responsáveis pelas instituições não saberem qual a velocidade de conexão à Internet da escola. Entre aquelas que têm ao menos um computador com acesso à Internet (45%), 68% possuem também Internet sem fio.

PESQUISA TIC EDUCAÇÃO 2016ANÁLISE DOS RESULTADOS118
PO
RTU
GU
ÊS
TABELA 8ESCOLAS DO CAMPO, POR VELOCIDADE DA PRINCIPAL CONEXÃO À INTERNET (2016)Total de escolas do campo
(%) TOTAL
Até 256 Kbps 11
De 257 Kbps até 999 Kbps 7
1 Mbps 14
2 Mbps 15
De 3 até 4 Mbps 8
De 5 até 8 Mbps 5
De 9 até 10 Mbps 2
De 11 até 20 Mbps 0
De 21 até 50 Mbps 1
51 Mbps ou mais 0
Não sabe 37
Não respondeu 0
Entre os motivos para não utilizar a Internet, destaca-se a falta de estrutura de acesso na região onde a escola está localizada (16%). O alto custo de conexão é o segundo motivo com maior percentual (10%). Observa-se também uma variação nos percentuais por região (Tabela 9). Na pesquisa TIC Domicílios 2016 (CGI.br, 2017), 60% dos domicílios de áreas rurais sem acesso à Internet também citaram o preço como motivo para o morador não usar a rede e 47%, a falta de disponibilidade de Internet na região. Os dados de ambas as pesquisas sinalizam dois dos principais desafios a serem vencidos pelas políticas públicas para ampliar a inclusão digital das populações do campo.
TABELA 9ESCOLAS DO CAMPO, POR MOTIVOS PARA NÃO UTILIZAR A INTERNET NA ESCOLA (2016)Total de escolas do campo
(%)
A escola não
necessita de Internet
Alto custo de conexão à Internet
Falta de infraestrutura de acesso à Internet na
região
O custo- benefício
não compensa
Pouca habilidade
dos funcionários
da escola
A escola não tem interesse
Preocupação com
segurança ou
privacidade
Outro
TOTAL 7 10 16 4 4 6 4 1
REG
IÃO
Norte 10 12 20 3 4 6 5 2
Centro-Oeste 0 1 3 1 3 1 1 1
Nordeste 8 12 19 4 6 8 5 1
Sudeste 5 7 13 5 1 4 3 2
Sul 1 3 4 1 1 1 1 0

2016 PESQUISA TIC EDUCAÇÃOANÁLISE DOS RESULTADOS 119
PO
RTU
GU
ÊS
Apenas 29% das escolas localizadas em áreas rurais possuem laboratório de informática, sendo que em 24% delas há computador de mesa instalado, mas somente 16% possuem acesso à Internet naquele local. Assim como nas escolas localizadas em áreas urbanas, parece haver uma priorização de acesso à Internet em espaços administrativos, como na sala da coordenação e da direção da escola, conforme se verifica na Tabela 10:
TABELA 10ESCOLAS DO CAMPO, POR LOCAL DE INSTALAÇÃO DOS COMPUTADORES DE MESA E DE ACESSO À INTERNET (2016)Total de escolas do campo
(%)
Laboratório de informática
Biblioteca ou sala de estudos para os alunos
Sala de aula Sala dos professores ou sala de reunião
Sala do(a) coordenador(a) pedagógico(a)
ou do diretor(a)
Local de instalação dos computadores de mesa 24 11 8 18 23
Local com acesso à Internet 16 13 16 17 23
CONSIDERAÇÕES FINAIS: AGENDA PARA POLÍTICAS PÚBLICAS
As sete edições da pesquisa TIC Educação compõem um conjunto de dados consistentes sobre infraestrutura e uso das tecnologias na educação brasileira, os quais podem servir de referência para a revisão e elaboração de políticas públicas para o setor. À medida que a série histórica da pesquisa se adensa, é possível observar alguns avanços e, ao mesmo tempo, a persistência de alguns desafios. Por exemplo, em 2014, os resultados do estudo chamavam a atenção para uma relativa estagnação no avanço da presença de redes sem fio nas escolas. Nesta última edição, destaca-se a ampliação significativa da presença de sinal WiFi. Entretanto, algumas barreiras continuam existindo, como as baixas velocidades de conexão à Internet, que dificultam o uso simultâneo da rede por diversos dispositivos, assim como a disponibilização do acesso à rede sem fio aos alunos.
Para além da infraestrutura, o bloqueio de acesso dos alunos à rede pode estar também relacionado ao receio da comunidade escolar com relação aos riscos do uso das tecnologias por parte de crianças e adolescentes, especialmente no ambiente escolar. Atualmente, o celular se consolida como principal meio de acesso à Internet entre crianças e adolescentes. Os dados da pesquisa apontam que professores têm feito, com certa frequência, uso desses aparelhos durante as aulas, bem como têm solicitado aos alunos a utilização de celulares para a realização de atividades. Contudo, ainda há leis que regulam a utilização desse tipo de dispositivo no espaço da escola, assim como há escolas públicas e particulares que mantêm as restrições ao uso dos aparelhos em sala de aula.
A formação de professores para uso de TIC em atividades com os alunos é outro tema cuja abordagem tem se consolidado nas últimas edições da pesquisa. Desde a edição de 2014, se tem pontuado a demanda por formação, tanto inicial quanto continuada, que auxilie os educadores no processo de apropriação das TIC, não só como ferramenta pedagógica, mas também como instrumentos que estimulem a criação e a produção de novos saberes e novos

PESQUISA TIC EDUCAÇÃO 2016ANÁLISE DOS RESULTADOS120
PO
RTU
GU
ÊS
espaços de aprendizagem. Contudo, a edição de 2016 aponta decréscimo no percentual de coordenadores pedagógicos que citaram ter tido na escola ações de formação continuada com essa finalidade.
É possível que um dos maiores desafios que as políticas públicas têm enfrentado no Brasil seja conseguir, de forma consistente e contínua, convergir de maneira equilibrada suas ações e investimentos nos âmbitos da infraestrutura, produção e disponibilização de recursos educacionais, formação de professores e desenvolvimento de competências.
Em estudo de referência sobre o histórico das iniciativas desenvolvidas no Brasil na área de tecnologia e educação, Almeida e Valente (2016) chamam a atenção para a descontinuidade das políticas públicas, bem como sua descoordenação, impedindo que haja uma atuação equilibrada e convergente que permita avanços no processo de apropriação das TIC na educação de forma plena.
Em seu estudo, Almeida e Valente propõem o Four in Balance (Kennisnet, 2015), modelo que foi aplicado ao sistema educacional holandês e que preconiza a adoção de políticas de uso e apropriação de TIC tendo como foco a construção de um sistema que integre, de forma equilibrada, quatro dimensões: visão (definição clara das metas da instituição com relação às expectativas ao uso das TIC na educação); infraestrutura (condições de infraestrutura necessárias para a utilização das TIC em contextos de ensino e aprendizagem); conteúdos e recursos educacionais (provimento de recursos educacionais que permitam a professores e alunos desenvolverem o uso das TIC integrado ao currículo); e competências (uso das TIC de forma didática, sabendo por que e como usá-las).
No caso brasileiro, os autores propõem ainda uma quinta dimensão, um eixo transversal, que englobaria o desenvolvimento de currículo, avaliação e pesquisa. Nesse sentido, os formuladores de políticas públicas teriam como desafio planejar e favorecer o desenvolvimento de ações focadas nas cinco dimensões, considerando as características e especificidades do sistema de ensino brasileiro, além de incluir todas as instâncias do setor no processo de formulação dessas políticas, especialmente, a comunidade escolar.
Em outras palavras, esse eixo transversal deve considerar a incorporação da cultura digital utilizando “novas dinâmicas e estratégias de ensino e diferentes metodologias de pesquisa e avaliação” (Almeida & Valente, 2016, p. 42). O desafio, portanto, refere-se ao equilíbrio das ações, para que se vinculem umas às outras, estejam elas no âmbito da infraestrutura, dos conteúdos e recursos educacionais ou das competências, considerando os diferentes saberes e incluindo a todos.
REFERÊNCIAS
Almeida, M. E. (2016). Currículo e narrativas digitais em tempos de ubiquidade: Criação e integração entre contextos de aprendizagem. Revista de Educação Pública, 25 (59/2), pp. 526-546.
Almeida, E., & Valente, J. A. (2016). Políticas de tecnologia na educação brasileira: Histórico, lições aprendidas e recomendações. Recuperado em 6 abril, 2017, disponível em http://www.cieb.net.br/cieb-estudos-politicas-de-tecnologia-na-educacao-brasileira-historico-licoes-aprendidas-e-recomendacoes/

2016 PESQUISA TIC EDUCAÇÃOANÁLISE DOS RESULTADOS 121
PO
RTU
GU
ÊS
Borges, M. A. (2009). Apropriação das tecnologias de informação e comunicação pelos gestores educacionais. Doutorado em Educação: Currículo, Programa de Pós-Graduação em Educação: Currículo, Pontifícia Universidade Católica de São Paulo, São Paulo.
boyd, d. (2014). It’s complicated: The social lives of networked teens. New Haven, London: Yale Universit Press.
Comitê Gestor da Internet no Brasil - CGI.br (2016). Pesquisa sobre o Uso da Internet por Crianças e Adolescentes no Brasil: TIC Kids Online Brasil 2015. São Paulo: CGI.br.
Comitê Gestor da Internet no Brasil - CGI.br (2017). Pesquisa sobre o Uso das Tecnologias de Informação e Comunicação nos Domicílios Brasileiros: TIC Domicílios 2016. São Paulo: CGI.br.
Comitê Gestor da Internet do Brasil - CGI.br e Unesco Institute for Statistics – UIS. (2016). Marco Referencial Metodológico para a Medição do Acesso e Uso das Tecnologias de Informação e Comunicação (TIC) na Educação. Recuperado em 11 setembro, 2017, de http://cetic.br/publicacao/marco-referencial-metodologico-para-a-medicao-do-acesso-e-uso-das-tecnologias-de-informacao-e-comunicacao-tic-na-educacao/
Constituição da República Federativa do Brasil de 1988. (1988). Recuperado em 27 agosto, 2017, de http://www.planalto.gov.br/ccivil_03/constituicao/constituicao.htm
Decreto n. 6.300, de 12 de dezembro de 2007. (2007). Dispõe sobre o Programa Nacional de Tecnologia Educacional – ProInfo. Recuperado em 29 de agosto, 2017, de http://www.planalto.gov.br/ccivil_03/_ato2007-2010/2007/decreto/d6300.htm
Decreto n. 7.352, de 4 de novembro de 2010. (2010). Dispõe sobre a política de educação do campo e o Programa Nacional de Educação na Reforma Agrária – Pronera. Recuperado em 11 setembro, 2017, de http://legislacao.planalto.gov.br/legisla/legislacao.nsf/Viw_Identificacao/DEC%207.352-2010?OpenDocument
Dutra, R. L., & Tarouco, L. M. (2007). Recursos educacionais abertos (open educational resources). Revista Novas Tecnologias na Educação (RENOTE), 5 (1). Recuperado em 27 julho, 2017, de http://seer.ufrgs.br/renote/article/view/14171
Hargittai, E. (2010). Digital na(t)ives? Variation in Internet skills and uses among members of the ‘net generation’. Sociological Inquiry, 80, pp. 92-113.
Instituto Nacional de Estudos e Pesquisas Educacionais Anísio Teixeira – Inep. (2017). Censo Escolar da Educação Básica 2016. Notas Estatísticas. Brasília: Inep.
Kennisnet. (2015). Four in Balance Monitor 2015. Zoetermeer: Kennisnet. Recuperado em 27 julho, 2017, de https://www.kennisnet.nl/fileadmin/kennisnet/corporate/algemeen/Four_in_balance_monitor_2015.pdf
Lei de Diretrizes e Bases da Educação, Lei n. 9.394, de 20 de dezembro de 1996 (1996). Estabelece as diretrizes e bases da educação nacional. Recuperado em 11 setembro, 2017, de http://www.planalto.gov.br/ccivil_03/leis/L9394.htm
Ministério da Educação. (2002). Relatório de Atividade 1996-2002. Brasília: Secretaria de Educação a Distância (SEED), Departamento de Informática na Educação a Distância (DIED). Recuperado em 27 agosto, 2017, de http://www.proinfo.gov.br/upload/img/relatorio_died.pdf
Ministério da Educação. (2007). Educação do campo: Diferenças mudando paradigmas. Cadernos Secad 2. Brasília: Secretaria de Educação Continuada, Alfabetização e Diversidade (Secad).
Ministério da Educação. (2017). Base Nacional Comum Curricular. Proposta preliminar. Terceira versão. Recuperado em 28 agosto, 2017, de http://basenacionalcomum.mec.gov.br/images/BNCCpublicacao.pdf

PESQUISA TIC EDUCAÇÃO 2016ANÁLISE DOS RESULTADOS122
PO
RTU
GU
ÊS
Moraes, M. C. (1997). Informática educativa no Brasil: Uma história vivida, algumas lições aprendidas. Revista Brasileira de Informática na Educação, 1(1), pp. 1-35. Recuperado em 27 agosto, 2017, de http://www.br-ie.org/pub/index.php/rbie/article/view/2320/2082
Organização das Nações Unidas para a Educação, a Ciência e a Cultura - Unesco. (2012). Declaração REA de Paris em 2012. Congresso Mundial sobre Recursos Educacionais Abertos (REA), 20 a 22 de junhos de 2012. Paris: Unesco.
Plano Nacional de Educação 2014-2024, Lei n . 13.005, de 25 de junho de 2014. (2014). Aprova o Plano Nacional de Educação (PNE) e dá outras providências. Recuperado em 28 agosto, 2017, de http://www.observatoriodopne.org.br/uploads/reference/file/439/documento-referencia.pdf
Portaria n. 522, de 9 de abril de 1997. (1997). Cria o Programa Nacional de Informática na Educação - ProInfo. Recuperado em 27 agosto, 2017, de http://www.dominiopublico.gov.br/download/texto/me001167.pdf
Portaria n. 68, de 9 de novembro de 2012. (2012). Dispõe sobre a ampliação da participação das escolas do campo no Programa Nacional de Tecnologia Educacional – Prolnfo, por meio do Pronacampo. Recuperado em 11 setembro, 2017, de http://pronacampo.mec.gov.br/images/pdf/port_68_09112012.pdf
Portaria n. 86, de 1o de fevereiro de 2013. (2013). Institui o Programa Nacional de Educação do Campo –Pronacampo, e define suas diretrizes gerais. Recuperado em 11 setembro, 2017, de http://pronacampo.mec.gov.br/images/pdf/port_86_01022013.pdf
Santaella, L. (2010). A aprendizagem ubíqua substitui a educação formal? Revista de computação e tecnologia da PUC-SP.
Santana, B., Rossini, C., & Pretto, N. L. (2013). Recursos Educacionales Abiertos. Prácticas colaborativas y políticas publicas. Salvador: Casa da Cultura Digital e Universidade Federal da Bahia.

2016 ICT IN EDUCATION SURVEYFOREWORD 123
EN
GLI
SH
ENGLISH

ICT IN EDUCATION SURVEY 2016FOREWORD124
EN
GLI
SH
2016 ICT IN EDUCATION SURVEYFOREWORD 125
EN
GLI
SH
FOREWORD
Since the advent of the Internet in Brazil in the late 1980s, the country has taken a leading role in the network’s operations and has consolidated its position as a key player in forums for debate on governance models. Following the creation of the Brazilian Internet Steering Committee (CGI.br) in 1995, the Brazilian Internet Governance Model became a benchmark for several countries. The management and use of revenue from domain name registration (.br domain) through the country’s registry, Registro.br, is a hallmark of Brazil’s model. Proceeds from domain registrations are given back to society through a set of activities – developed by the Brazilian Network Information Center (NIC.br), which was formalized in 2005 – that aim to expand and continuously improve Internet quality.
In addition to conducting studies on the implications of the Internet in Brazilian society, NIC.br generates reliable and internationally comparable statistics on access to and use of information and communication technologies (ICT). Since the creation of the Regional Center for Studies on the Development of the Information Society (Cetic.br) over a decade ago, NIC.br has systematically produced indicators that are used by government, businesses, academia, and society as a whole. Cetic.br’s surveys have contributed to the implementation of evidence-based public policies that benefit different sectors of government and enable citizens to follow topics of common interest regarding the Internet.
The data produced by Cetic.br is increasingly used in reports by organizations such as the Economic Commission for Latin America and the Caribbean (ECLAC), the International Telecommunications Union (ITU), the United Nations Educational, Scientific and Cultural Organization (UNESCO), and the Organisation for Economic Co-operation and Development (OECD). These data are useful because, especially in the area of ICT, Brazil was previously not properly represented in several of the parameters evaluated internationally, since the country had not consistently collected and analyzed data that could be disseminated.
In 2012, Cetic.br’s work gained international recognition when it became a UNESCO Category 2 Center and began supporting measurement activities in other Latin American countries and Portuguese-speaking Africa. Since then, the Center has promoted numerous capacity-building events on survey methodology, with the goal of improving statistics produced in these countries and strengthening overall production of comparable data on Internet access and use.
Although statistics reveal numerous challenges on the road towards universal Internet access and policies that benefit all Brazilians, we remain proud of a model that has generated effective contributions to government and society. This publication marks yet another milestone along this journey.
Enjoy your reading!Demi Getschko
Brazilian Network Information Center – NIC.br


2016 ICT IN EDUCATION SURVEYPRESENTATION 127
EN
GLI
SH
PRESENTATION
Although Brazil has vastly improved Internet connectivity and expanded fixed and mobile broadband networks, major challenges remain if the country is to increase its competitiveness and productivity in the digital economy. The trend towards digitalization is irreversible – it impacts all areas of society and the economy, including industry, trade, agriculture, and strategic sectors such as finance, logistics, infrastructure, and public services in general. For the digital transformation to prevail and benefit Brazilian society as a whole, public policy must foster an enabling environment.
The Ministry of Science, Technology, Innovation, and Communications (MCTIC) has partnered with other governmental departments, civil society, the scientific community, and the production sector to champion the development of a Brazilian Strategy for Digital Transformation. The strategy aims to enable progress in five areas: 1) infrastructure and ICT access; 2) research, development, and innovation; 3) trust in the digital environment; 4) education and professional capacity-building; and 5) the international dimension. The focus is on the government, on the one hand, and the economy, on the other. A channel for open dialogue was established through consultations with experts and sectoral meetings with different community leaders and representatives of the production sector – this led to the establishment and definition of priorities and goals for the next five years.
The establishment of clear priorities and goals is, however, not enough. Adopted policies and strategies must be monitored and assessed. To this end, the production of ICT statistics by the Brazilian Internet Steering Committee (CGI.br) is key – the surveys conducted by the Brazilian Network Information Center (NIC.br), through the Regional Center for Studies on the Development of the Information Society (Cetic.br), are essential tools. The generation of solid and up-to-date information about ICT access, use, and appropriation in various sectors, in addition to the analysis of results published by Cetic.br, enables the tracking of ICT demand in both households and businesses. These studies also help to monitor the provision of public services by government agencies and the penetration of technology in social policies regarding health care, education, and culture. The data generated by the CGI.br surveys can inform policymaking in the country and help Brazil to meet its goals and comply with the international agreements to which it is committed.
Finally, to further bridge the gap between policymakers and data producers, the MCTIC and Cetic.br sponsor an annual inter-ministerial meeting: “Dialogue on Public Policies and ICT Indicators in Brazil.” The third edition was held in June 2017. It hosted renowned national and international experts, chiefly from Latin American countries, and featured debates on the impacts and benefits of the digitalization process for social and economic development.

ICT IN EDUCATION SURVEY 2016PRESENTATION128
EN
GLI
SH
This is yet another testament to the government and CGI.br’s commitment to promoting discussions on the digital economy in all areas of society.
Maximiliano Salvadori MartinhãoThe Brazilian Internet Steering Committee – CGI.br

2016 ICT IN EDUCATION SURVEY INTRODUCTION 129
EN
GLI
SH
INTRODUCTION
The main mission of the Regional Center for Studies on the Development of the Information Society (Cetic.br) is to conduct specialized surveys with the goal of producing regular statistics on access to and use of information and communication technologies (ICT) in various sectors of society. This reflects the commitment of the Brazilian Internet Steering Committee (CGI.br) and the Network Information Center (NIC.br) to Brazilian society. The data produced by the ICT surveys is an important source of information for the elaboration of sectors’ specific policies and for monitoring goals of international agendas of which Brazil is a signatory country.
The regular surveys carried out by Cetic.br have shown that digital technologies are being more and more adopted by even larger portions of the population, although there are still disparities in Internet access and use. This is especially true when it comes to broadband connection in lower-income households.
Information and communication technologies are recognized by international organizations as a vital element in reaching the 17 goals in the 2030 Agenda for Sustainable Development of the United Nations. In this context, when the goal is to promote quality and inclusive education for the entire population, access to and use of technologies in classrooms is no exception. Ensuring inclusive and equitable quality education and promoting lifelong learning opportunities for all – as emphasized in Sustainable Development Goal 4 (SDG 4) – are important actions in the dissemination process of digital culture in educational and formative environments.
The results of the seventh edition of the ICT in Education survey provide an understanding of the current scenario and trends in pedagogical use of new technologies and the Internet in urban Brazilian schools, especially with respect to the role of teachers as central agents in the dissemination of ICT use within schools.
Furthermore, after 20 years of implementation of the National Educational Technology Program (ProInfo) – the longest-lasting nationwide policy to foster ICT use in education – it is important to take stock of the progress achieved and the obstacles that still exist to fully incorporate these technologies in the teaching and learning process in Brazilian Elementary and Secondary Education.
In 2016, for the first time, Cetic.br also conducted a pilot survey to measure the incorporation of ICT in schools located in rural areas, which is presented as a complement to the analysis of results in this publication. Based on this effort, future statistical production can incorporate the dynamics observed in the profile of rural schools, ensuring a more comprehensive outlook on the sector.

ICT IN EDUCATION SURVEY 2016INTRODUCTION130
EN
GLI
SH
The use of data produced by Cetic.br has intensified in recent years and has been more widely used by governments, international organizations, civil society, the private sector, and academic institutions, informing decision-making. For public managers, this information provides important input for developing and monitoring digital inclusion policies, in particular, those related to the use of technologies by school actors in Brazilian schools. Within the scope of academic research, survey data has become increasingly important in research on the socioeconomic impact of ICT on Brazilian society as well as to the construction of scientific knowledge. In the context of civil society and private sector, the data can also be used to assess market trends.
The ICT in Education survey has received institutional support from the Ministry of Education, the National Council of Secretaries of Education (CONSED), National Union of Municipal Education Leaders (Undime) and UNESCO Brazil. It has also received technical and methodological support from a group of academic researchers, representatives of civil society and the government, and experts in the intersection between education and digital technologies. The methodological framework used to create indicators and data collection instruments was based on the work of the International Association for the Evaluation of Educational Achievement (IEA), which was released in two publications: Sites 2006 (Technical Report – Second Information Technology in Education Study) and Sites 2006 (User Guide for the International Database). The UNESCO Guide to Measuring Information and Communication Technologies in Education, by the UNESCO Institute for Statistics (UIS), was also a reference to the survey methodological framework.
In line with the expansion of the adoption of technologies by society and the discussions surrounding its uptake in education, Cetic.br worked in partnership with UIS, during 2016, to revise and to improve the methodological framework and the definition of key indicators to measure the use of technologies in the educational environment. The revised framework places greater emphasis on the appropriation processes of technology as a means of improving learning opportunities. This framework is presented in the document Methodological Framework for Measurement of Access and Use (ICT) in Education1, which relies on the assumptions of the relationship between digital culture in schools and schools in the digital culture.
The Methodological Framework contemplates three dimensions of analysis: access, use and appropriation. Access is understood as the availability of ICT devices and networks to develop administrative and pedagogical activities, especially in classrooms, but also takes into account the use of such resources outside the school environment, such as access on mobile devices. The use dimension includes indicators on the strategies used by school actors to use ICT to acquire the knowledge and information they need to carry out the process of teaching and learning. The appropriation dimension is more closely related to the integration of technologies into curricula and the development of digital skills by both students and educators.
1 Available at: http://cetic.br/media/docs/publicacoes/8/methodological-framework-for-measurement-of-access-and-use-of-information-and-communication-technologies-in-education.pdf

2016 ICT IN EDUCATION SURVEY INTRODUCTION 131
EN
GLI
SH
ICT IN EDUCATION: SCHOOLS AND DIGITAL CULTURE
The current edition of the ICT in Education survey confirms important trends that had been shown throughout the time series of the survey, while it also introduces new indicators to be monitored. For the first time, the use of mobile phones in school activities was investigated among students. The use of this type of device was mentioned by 52% of students from schools located in urban areas from classes in the 5th and 9th years of Elementary Education and/or the 2nd year of Secondary Education.
After 20 years of implementation of ProInfo, the results showed that there are still challenges to be overcome in terms of access to ICT equipment and Internet connectivity available for pedagogical use. The presence of at least one type of computer (desktop, portable or tablet) was universal among public schools located in urban areas: 95% had at least one of these devices connected to the Internet. However, the speed of Internet connection was no higher than 4 Mbps in 45% of public schools and up to 2 Mbps in 33% of them.
Computer labs were present in 81% of public schools, and of these, only 59% were used in 2016, according to principals. Furthermore, only 31% of public school teachers reported using computers in the computer lab to develop activities with students.
Despite advances in the use of mobile phones as pedagogical tools, only 31% of students reported using these devices in school: 30% of public school students and 36% of private school students. Restrictions on student access to school Wi-Fi networks were one of the aspects that explain the low level of use of these devices in the school environment: while 92% of schools had Wi-Fi networks, 61% of principals reported that students were not allowed to use these connections.
The survey found that 40% of public school teachers who were Internet users reported using computers in classrooms in activities with students. However, only 26% said they were connected to the Internet when carrying out such activities. In private schools, these percentages were 58% and 54%, respectively.
The ICT in Education 2016 survey also presents indicators on the perceptions of teachers, directors of studies, and principals about the use of technologies in pedagogical practices. For 94% of teachers, the use of ICT allowed them access to more diversified and higher-quality learning materials. Furthermore, a high percentage of teachers agreed that adopting new teaching methods (85%) and performing administrative tasks more easily (82%) were a result of ICT use.
According to private school principals (36%) and directors of studies (35%), the development of new teaching practices based on computer and Internet use was considered a priority action for integration of ICT into school practices. In public schools, the development of new pedagogical practices also stood out; however, greater emphasis was placed on actions in the area of infrastructure. For 32% of principals and 22% of directors of studies, increasing the number of computers per student was considered a priority action.
The results of the 2016 ICT in Education survey – presented in detail in the aggregated tables and data analysis report presented in this publication – outline the scenario of ICT access and use by students and teachers in public and private Elementary and Secondary schools in Brazil.

ICT IN EDUCATION SURVEY 2016INTRODUCTION132
EN
GLI
SH
This publication is structured as follows:
Part 1 – Articles: Contributions from academic specialists and representatives of government and international organizations that discuss key aspects for understanding ICT policies in the sector: discussion about ICT in the proposed National Core Curriculum (BNCC) in Brazil; indicators to measure levels of innovation and technology adoption in education; implementation of public policies at the state level based on a case study in the state of Paraná; and cognitive aspects of ICT appropriation by adolescents in the school environment;
Part 2 – ICT in Education 2016: Presents the methodological report, which includes a description of methodological aspects that guided the survey; the data collection report, which includes the methodological improvements applied in 2016 to the field collection process; and analysis of the main findings, identifying the main trends observed with regard to ICT access and use by actors of the school system;
Part 3 – Tables of results: Presents tables of the results containing indicators selected for teachers and key respondents in the ICT in Education survey, and some indicators selected for students, directors of studies, principals and schools, allowing for a reading of crossed variables;
Part 4 – Appendix: Glossary of the terms intended to assist the reader in understanding commonly used terms and concepts.
The primary goal of the effort expended on the implementation of the ICT surveys by the Brazilian Internet Steering Committee (CGI.br) is to produce reliable, up-to-date and relevant data for our readers. We hope that the data and analyses from this edition of the survey provide important input for public administrators, academic researchers, private sector companies and civil society organizations in initiatives that are targeted at building an information and knowledge society.
Enjoy your reading!
Alexandre F. BarbosaRegional Center for the Development of the Information Society – Cetic.br

PART 1—
ARTICLES


2016 ICT IN EDUCATION SURVEYARTICLES 135
EN
GLI
SH
INNOVATION AND TECHNOLOGY IN EDUCATION: THE EDUTEC GUIDE – A DIAGNOSTIC AND PLANNING TOOL FOR EDUCATIONAL TECHNOLOGY POLICIES
Lucia Dellagnelo1
Innovation and technology can be important boosters of quality and equity in public education. International experiences have shown that countries that have been able to effectively use them, such as Singapore, South Korea and Estonia, have adopted certain measures in common.
The first measure refers to the formulation process of national innovation and technology policies, based on a shared vision that converges with the country’s economic and social development policies. The educational technology policies formulated by these countries are long-range. Their goals and results are reviewed periodically, and multi-year budgets are allocated for their implementation.
The second measure involves coordinating the participation of different actors and institutions in the implementation of policies. Innovation and technology policies in education require intertwinement of actions of various kinds and, therefore, demand firm, effective, multi-sectoral coordination. Many countries have created educational innovation centers to coordinate the implementation of these policies and continually monitor the results.
A third measure adopted by countries where innovation and technology have produced good results in education is multi-dimensional planning. To generate a positive impact in this sector, national policies must simultaneously encompass human factors (vision and skills of managers and teachers) and infrastructure factors (teaching resources, equipment and Internet connection).
After identifying multi-dimensionality as a key factor for the success of educational innovation and technology policies, researchers from Kennisnet, a center for educational innovation in the Netherlands, developed the Four in Balance model. It advocates for the planning and implementation of integrated actions based on four dimensions: vision, skills, content and digital educational resources, and infrastructure (Kennisnet, 2007).
1 PhD in education from Harvard University and managing director of the Innovation Center for Brazilian Education (Cieb).

ICT IN EDUCATION SURVEY 2016ARTICLES136
EN
GLI
SH
When these four elements are at different levels, the results of educational technology initiatives may be negatively affected, with little return on investments made (Tondeur, Coenders, Braak, Brummelhuis, & Wanderlinde, 2009).
The Innovation Center for Brazilian Education (Cieb) has adopted Four in Balance model as the conceptual framework for its work in the analysis and proposal of public policies that use innovation and technology to bring about systemic transformations in public education in Brazil.
EDUCATIONAL INNOVATION AND TECHNOLOGY POLICIES IN BRAZIL
An analysis of the history of educational innovation and technology policies in Brazil reveals certain contradictions. Although the country has participated in cutting-edge projects to use technology in education since the early 1980s, the policy still in effect is the National Educational Technology Program (ProInfo), created by Ordinance No. 522/MEC of April 9, 1997, to promote the pedagogical use of information and communication technologies (ICT) in public elementary and high school systems.
FIGURE 1EVOLUTION OF EDUCATIONAL INNOVATION AND TECHNOLOGY POLICIES
First experiences with use of computers in education
First government initiatives in educational technology resulting from the Educom Project, coordinated by the Ministry of Education
More conceptually advanced program, but no initiatives were carried out. Replaced by ProInfo in 1997
Immediate Action Program in Informatics in Primary and Secondary Education
Focus on preparation of new policies, assessment of EDUCOM, training, and promotion of software production
Main national educational technology policy in Brazil, in effect up to the present 20 years since the creation
of the last educational technology policy
Created to integrate distinct actions
– Broadband in Schools Program (PBLE)
– One Computer per Child Project (UCA)
– Distribution of tablets
1970s 1986
1985 1992 2007 2017
1997ProInfo
Integrated ProInfo
PRONINFEEducom Project
⎧⎪ ⎪⎪⎪⎪⎪⎪⎪⎪⎪⎪⎪⎪ ⎪ ⎪⎨⎪⎪⎪⎪⎪⎪⎪⎪⎪⎪⎪⎪⎪⎪⎪⎪⎪⎩
Brazil has a history of educational innovation and technology, but the policy in effect is ProInfo, which was formulated in 1997
Source: Cieb, 2017.
Besides needing to be updated, in light of all the technological advances in the last decade, ProInfo has been characterized in recent years as a set of actions that have included isolated dimensions of an educational innovation and technology policy (Almeida & Valente, 2016).

2016 ICT IN EDUCATION SURVEYARTICLES 137
EN
GLI
SH
Its main initiative in relation to states and cities was related to setting up computer labs in schools and promoting educational technology training courses, aimed at educational technology centers, which are linked to departments of education.
As a result of sporadic investments by federal, state and municipal governments, states and cities currently have differing levels of technology adoption in their school systems.
Identifying the level of technology use in schools is essential for educational managers to be able to plan investments and optimize the infrastructure they have. However, this is no simple task. The data available usually identifies existing infrastructure, but it does not determine how managers and teachers use digital content and resources to promote learning and improve the management of school systems. A study published in 2015 by the Organisation for Economic Co-operation and Development (OECD) illustrates the methodological difficulties in establishing direct correlations between the pedagogical use of technology and student learning (OCDE, 2015).
THE EDUTEC GUIDE: A TOOL FOR MANAGERS
With the purpose of supporting educational managers in determining the degree of adoption of technology in their schools and prioritizing their actions, in 2016 the Innovation Center for Brazilian Education developed and implemented a diagnostic tool to ascertain the degree of adoption of technology, called the EduTec Guide.
The conceptual basis for developing this guide was Four in Balance, mentioned above, in addition to other tools – such as the School Technology and Readiness Chart STaR Chart, from the United States (Kathleen, 2000; Texas Education Agency, 2006), and Skolementor, from Norway (Senter for IKT I Utdanningen, n.d.) – to ensure that the results would not be limited to providing diagnoses, but could also be used for planning and management of educational technology initiatives in school systems.
METHODOLOGY
The EduTec Guide was implemented between September and December 2016, in partnership with the National Council of Secretaries of Education (Consed). The terms of the partnership included public disclosure of aggregate data, which would protect the individual data of the participating states from being identified.
Fourteen states from all the regions of Brazil, plus the Federal District, participated in the application of the EduTec Guide. A total of 12,898 schools answered the questionnaire.
The sample was based on random selection from a list of schools in state public school systems. A minimum number was calculated in order for the reality of schools in each state educational system to be represented statistically. The margin of error of the study was plus or minus ten percent, with a confidence interval of 95%.

ICT IN EDUCATION SURVEY 2016ARTICLES138
EN
GLI
SH
The data collection was done in partnership with state departments of education through an online questionnaire answered by teachers from the selected schools in the sample for each state. The principal had to to be accompanied by at least two teachers to answer the questionnaire, which had 22 questions divided into the four dimensions of the model. There were five response options for each question, corresponding to the different degrees of adoption of educational technology (1 = exploratory; 2 = basic; 3 = intermediate; 4 = advanced; 5 = very advanced).
Upon completing the questionnaire, the schools received feedback on their degree of adoption of technology according to the answers given. After the responses from all the schools were received, the Cieb prepared a report for the education secretaries and their teams.
It is important to point out that the EduTec Guide was designed to be a diagnostic and planning tool, and not an academic research tool. The methodology used was adapted to the need for a simplified data collection process and quick feedback to the actors involved.
DIFFERENCES IN THE DEGREE OF ADOPTION OF TECHNOLOGIES AMONG STATES
As seen in Chart 1, the results of the EduTec Guide showed major diversity among Brazilian states in all the dimensions examined. Although no state educational network exceeded the intermediate level in the degree of adoption of technology in education, there were significant differences among the state public school systems.
CHART 1RESULTS OF THE EDUTEC GUIDE, BY ELEMENTMinimum, mean and maximum scores obtained among the states
VISION EXPERTISE CONTENT AND APPLICATIONS
INFRASTRUCTURE
Very Advanced (5.0)
Advanced (4.0)
Intermediate (3.0)
Basic (2.0)
Exploratory (1.0)
2.72.4
2.6
2.0
3.4 3.53.7
3.33.0 2.8
3.12.7
Source: EduTec Guide 2016 (Cieb, 2017)
The analysis of the aggregate data for each element yielded interesting information. The vision dimension, for example, which seeks to determine whether principals and teachers believe that technology can contribute to the improvement of education, and whether they do plan actions to implement it, the data showed that nine out of ten schools mentioned in their political pedagogical projects that the use of technology is important for reaching their objectives. However, less than 27% of the schools had defined an action strategy, and just 9% had set clear objectives and goals for technology use. Only 33% of the schools

2016 ICT IN EDUCATION SURVEYARTICLES 139
EN
GLI
SH
said that most of their teachers used some type of technology for teaching. Regarding the use of technology for internal communication and communicating with the community, 95% answered that technology was used for communication within the school’s team, but only 9% said they used it for communication with parents and students.
With respect to the skills dimension, which seeks to determine how knowledgeable and comfortable managers and teachers are with the use of technology for educational purposes, it is interesting to note that 99% of the schools reported that at least some teachers used these resources. However, almost 26% of educators used them only to prepare classes and lectures for students. As for professional training, 77% of the schools said that few teachers participated in courses on how to use technology and, when they did, it was only to learn about the basic tools. Among teachers and principals who received training in the use of technology, only 27% were satisfied with the training. Just 3.4% of the schools reported that their teachers had the necessary expertise to create content and applications and adopt new educational practices through the use of technology.
The content and educational digital resources dimension seeks to determine which types of resources are used in schools and how often. Although 95% of the schools responded that they used content and applications, only 37% said that these resources were aligned with the criteria and goals established in their political pedagogical projects. In relation to the source of these resources, approximately 65% reported accessing content and application repositories (national or local), and 35% of the schools said they accessed content only through Internet search engines. Just 5% of the schools reported that their teachers produced the content and applications they used.
In terms of the infrastructure dimension, the schools commented on the insufficient number and quality of devices available, as well as regular maintenance problems. In the participating schools, the ratio of students per functioning device (desktop, notebook or tablet) available for educational use ranged from 10 to 64 students per device. Only 31% reported having up to 15 students per device in the school. Furthermore, in 75% of the schools, the equipment was located in computer labs, with limited and sporadic use. In 21%, computers were used only for administrative purposes, and just 3.2% of the schools have computers for educational use in classrooms.
In terms of Internet connection, almost 16% said it was available only for administrative use. In 65%, connection was only via desktop computers, and the Internet was not sufficient for simultaneously accessing more complex educational resources that involved, for example, videos or games. Only 1.6% of the schools said they had wireless Internet access with capacity for multiple accesses to any type of digital educational resource.

ICT IN EDUCATION SURVEY 2016ARTICLES140
EN
GLI
SH
IMBALANCE AMONG DIMENSIONS WITHIN STATE SCHOOL SYSTEMS
Knowing the differences in the degree of adoption of technology among state public school systems is important, primarily for providing input for the formulation of national policies that take this diversity into account.
However, just as important as the variation in the degree of adoption of technology among states is the imbalance among the dimensions in the same state. According to the Four in Balance model, lack of balance undermines the results of educational technology initiatives and can hinder the optimization of investments in public school systems. Chart 2 shows examples of this imbalance in certain states.
CHART 2INTERNAL IMBALANCE AMONG ELEMENTS, AS SHOWN IN THE EXAMPLE OF FIVE STATES IN THE EDUTEC GUIDE
5.0
4.0
3.0
2.0
1.0
2.7 2.5 2.6
2.0
2.73.0 3.1
3.4
2.52.9 2.8 2.9
2.12.5 2.5
2.92.83.2 3.3 3.4
State 1 State 3State 2 State 4 State 5
VISION EXPERTISE CONTENT AND APPLICATIONS INFRASTRUCTURE
Source: EduTec Guide 2016 (Cieb, 2017)
In States 1 and 2, for example, investments for training teachers to use technology for educational purposes may be undermined by the low level of infrastructure available in the schools. In State 5, there is a balance between the expertise and infrastructure elements, but there are still not sufficient conditions for implementing the vision and full use of the digital educational resources existing in the public school system.
Imbalances among elements in the same state can be explained by the sporadic and fragmented nature of national educational technology policies, and also by the random prioritization of investments made by state public school systems.
As discussed earlier, the policies formulated in Brazil since the 1980s have recognized the multi-dimensional nature of educational technology, encompassing the dimensions of vision, expertise, content and digital educational resources, and infrastructure, but over time their implementation has taken on the form of isolated, scattered initiatives, without any mechanisms to monitor results. Unlike other countries such as Singapore, Chile, the United States and Uruguay, no long-range educational technology plans have been prepared, with allocated budgets and periodic reviews of their goals and results.

2016 ICT IN EDUCATION SURVEYARTICLES 141
EN
GLI
SH
The objective of the EduTec Guide is to help managers identify which dimensions in their school systems need more investment, in order to optimize educational technology initiatives. It is a constantly evolving tool that is intended to provide, at a later stage, technical guidance and assistance for planning and implementing innovation and technology plans that consider all the dimensions and identify priority actions for achieving balance among them.
The Cieb believes that innovation and the use of technology in schools are crucial for Brazil to confront the challenges of public education. The experience of countries like Estonia, which ranked third in the Programme for International Student Assessment (Pisa) of the OECD in 2015, shows that investments in innovation and technology, when properly planned and implemented, can result in exponential progress in quality and equity in education.
REFERENCES
Almeida, M. E., & Valente, J. A. (2016). Políticas de tecnologia na educação brasileira: Histórico, lições aprendidas e recomendações. CIEB Estudos, pp. 63-66. Retrieved on June 20, 2017, from http://www.cieb.net.br/wp-content/uploads/2016/12/CIEB-Estudos-4-Politicas-de-Tecnologia-na-Educacao-Brasileira.pdf
Innovation Center for Brazilian Education - Cieb. (2017). Resultados do Guia EduTec 2016: Adoação de tecnologia nas redes estaduais de ensino. Retrieved on June 20, 2017, from http://www.cieb.net.br/guia-edutec/
Kathleen, F. (2000). Teacher preparation STaR Chart: A self-assessment tool for colleges of education. Preparing a new generation of teachers. Washington: CEO Forum on Education and Technology. Retrieved on June 20, 2017, from https://eric.ed.gov/?id=ED437382
Kennisnet. (2007). Four in Balance Monitor 2007: ICT in Education in the Netherlands. Zoetermeer: Kennisnet. Retrieved on June 20, 2017, from http://downloads.kennisnet.nl/onderzoek/fourinbalancemonitor2007.pdf
Ordinance no. 522, of April 9, 1997. (1997). Retrieved on August 27, 2017, from http://www.dominiopublico.gov.br/download/texto/me001167.pdf
Organisation for Economic Co-operation and Development - OECD. (2015). Students, Computers and Learning: Making the Connection. Paris: OECD Publishing. Retrieved on June 20, 2017, from http://dx.doi.org/10.1787/9789264239555-en
Senter For IKT I Utdanningen. (s.d.). Skolementor. Retrieved on March 10, 2017, from http://www.skolementor.no
Texas Education Agency. (2006). Texas STaR Chart. School technology and readiness: A teacher tool for planning and self-assessing aligned with the long-range plan for technology, 2006-2020. Austin: TEA. Retrieved on June 20, 2017, from https://www.txstarchart.org/
Tondeur, J., Coenders, A., Braak, J. V., Brummelhuis, A. T., & Wanderlinde, R. (2009). Using online tools to support technology integration in education. In: L. T. Hin, & R. Subramaniam (Eds.), Handbook of research on new media literacy at the K-12 level: Issues and challenges (pp. 389-402). Retrieved on June 20, 2017, from http://www.igi-global.com/chapter/using-online-tools-support-technology/35927


2016 ICT IN EDUCATION SURVEYARTICLES 143
EN
GLI
SH
THE CONNECTED PROJECT: ENABLING THE CONSTRUCTION OF DIGITAL CULTURE IN PUBLIC SCHOOLS IN PARANÁ
Mary Ângela Teixeira Brandalise1
INTRODUCTION
The main objective of the study that gave rise to the present article was an analysis of the CONNECTED project, which is part of the educational policy of the state of Paraná. It was implemented in 70 state public schools in 2016. This research was based on an assessment by school managers (principals and pedagogical teams) about the project. The data collection instrument was an online questionnaire made up of open-ended and closed questions. It was sent to the emails of the schools and asked their managers to evaluate the project, based on the following dimensions: the infrastructure of information and communication technologies (ICT) in the school; participation of the management team, teachers and students; integration of ICT into pedagogical practices; and the results and effects achieved. Apart from this introduction and the final conclusions, the text is divided into three parts: the first is a brief summary of the theory of policy enactment of Ball, Maguire and Braun (2012); the second discusses the importance of digital culture in school environments and introduces the intention of the CONNECTED project; and the third is a policy enactment analysis based on the data collected.
THE THEORY OF POLICY ENACTMENT: PREMISES FOR THE ANALYSIS OF EDUCATIONAL POLICIES
Critical analyses of the evolution of educational policies, and their programs and projects, can use different analytical frameworks, such as the policy cycle approach of Ball, Maguire and
1 Professor in the graduate studies program in education of the State University of Ponta Grossa; PhD in education: curriculum from the Pontifical Catholic University of São Paulo and coordinator of the Study and Research Group on Educational Policy and Assessment (Geppea).

ICT IN EDUCATION SURVEY 2016ARTICLES144
EN
GLI
SH
Braun (2012). These authors proposed the theory of policy enactment in a book published in England in 2012: How schools do policy: policy enactments in secondary schools.2
The term policy enactment is difficult to translate. In Portuguese, it can be understood as putting policies into effect in a specific context. The theory of policy enactment “rejects the notion that policies are implemented. They are subject to processes of translation and interpretation within the context of practice.” (Ball, Maguire, & Braun, 2012, p. 12)
The authors argue that policies are translated, interpreted and enacted in various ways by the individuals involved in them. Interpretation consists of an initial reading of the policy to grasp its meaning, by questioning the meaning of the text for the parties involved and seeing how to put it into action. Interpretation is an institutional political process linked to the language of the policy, whereas translation is closer to the language of the policy in practice.
Translation is an interactive process in the creation of institutional texts and for putting these texts into action, through tactics that can include: lectures, meetings, gatherings, plans and events, in addition to producing artifacts and borrowing ideas and practices from other contexts, purchasing materials, consulting official websites and receiving support from local authorities. “Interpretation is about strategy and translation is about tactics, but they are also at times closely interwoven and overlapping. They work together to enroll or hail subjects and inscribe discourse into practices” (Ball et al., 2012, p. 47).
The authors say that putting policies into practice is a complex, non-linear, sophisticated and creative process, because they are implemented under different material conditions, with varied resources, in relation to specific tasks. The theory of political enactment attributes an essential role to context. The material, structural and relational dimensions need to be incorporated into policy analyses, in order to better understand their enactment in the institutional sphere. These conditions are called the contextual dimensions of policy enactment. They are:
– Situated contexts (e.g., locale, school histories and intakes);
– Professional cultures (e.g., teachers’ values, commitments and experiences and ‘policy
management’ in schools);
– Material contexts (e.g., staffing, budgets, buildings, technology, and infrastructure);
– External contexts (e.g., degree and quality of support from local authorities, pressures
and expectations from broader policy context, such as ratings, league table positions,
legal requirements and responsibilities). (Ball et al., 2012, p. 21).
2 The book was translated into Portuguese and published by Editora UEPG in 2016 under the title: Como as escolas fazem as políticas: atuação em escolas secundárias.

2016 ICT IN EDUCATION SURVEYARTICLES 145
EN
GLI
SH
The relevance of defining the contextual dimensions, according to the authors, is first of all related to the fact that policies are put into action in environments, such as schools, that differ greatly in terms of human, material and financial resources, infrastructure, school histories, socioeconomic profile of students, and other aspects. Second, there must be a change in the vision of schools as being homogeneous organizations, where the different cultures, histories, traditions, values and commitments that coexist within them are not taken into account. Last, the authors explain that external pressure on schools to achieve specific goals is always a deciding factor in relation to the initiatives they implement.
Policies, programs and educational projects are subject to numerous influences in the contexts where they are put into action. In other words, each school context is unique; it is an active force and not simply a backdrop. “Context initiates and activates policy processes and choices which are continuously constructed and developed, both from within and without, in relation to policy imperatives and expectations” (Ball et al., 2012, p. 24). Therefore, it is a mediating factor in policy enactment in schools.
Considering the viewpoints of these authors on the theory of policy enactment and the contextual dimensions, it is important to point out studies involving the analysis of educational policies, when put into practice in varied contexts, i.e., how they are recontextualized, interpreted and translated in training environments and educational institutions. A study conducted on CONNECTED, a project implemented in schools in Paraná, was based on these theoretical premises. Some of its results are presented and discussed in the present article.
DIGITAL CULTURE IN SCHOOLS: THE GOAL OF THE CONNECTED PROJECT
The issue of digital culture in schools is one of the main themes of the Survey on the Use of Information and Communication Technologies (ICT) in Brasilian Schools – ICT Education, carried out by the Regional Center for Studies on the Development of the Information Society (Cetic.br), given the importance of and need for the inclusion of schools and the whole school community – managers, teachers, students and parents – in the digital culture of society.
The complexity of conceptualizing digital culture is discussed by Iannone, Almeida and Valente (2016, p. 209). They note that “it is not just technology that determines or contributes to the creation and evolution of digital culture (…) but that which is identified as digital culture should be recognized in the light of recent technological developments and other knowledge that has been developed.” There is currently a strong trend toward disseminating digital culture in society and, consequently, in education, where it is reflected in pedagogical practices and the teaching and learning process that takes place in school environments. The authors explain that:
Schools that participate in and interact with digital culture play a key role in shaping
students who make decisions independently, defend their ideas, work in groups, take
an active and critical approach to situations, difficulties and challenges, and participate
in social transformation. In schools like this, the potential of ICT is incorporated into
their practices by using mobility, connection and multimodality to enable authorship by
students who: seek information from different sources; establish new relationships between

ICT IN EDUCATION SURVEY 2016ARTICLES146
EN
GLI
SH
information, systematized knowledge and knowledge that arises from the connections in
networks or is generated through life experiences; (reconstruct) knowledge represented by
multiple languages and nonlinear structures; and interact with and work in collaboration
with peers and experts located in different places (Iannone et al., 2016, p. 213).
Based on this perspective, in 2015, the Board of Educational Policies and Technologies of the State Department of Education of Paraná (Seed–PR) came up with the CONNECTED project3 for public schools in the state. The project is consistent with the objectives of the My School in Action Program (Minha Escola Tem Ação - META, in Portuguese, and Goal, in English), which seeks to: strengthen school management; improve the quality of elementary education in Paraná; reduce dropout and failure rates, decrease the number of passing grades issued by teachers’ councils; and reduce the number of older students in lower grades not corresponding to their age.
The CONNECTED project sought to meet Action 6 of the Goal Program, defined as: educational technology – pedagogical practices and school management. The proposal of the project in the sphere of educational policies in Paraná mainly considered developments and challenges in relation to: Internet and intranet connection in state public schools; distribution of educational tablets among elementary school teachers in Paraná; and trends and advantages of using mobile devices in school environments.
The project was implemented and carried out in 2016 in 70 schools in the state of Paraná. The intention was the deployment and maintenance of technological resources in order to increase access to ICT in different school environments, other than computer labs. The development of systems and teacher training for pedagogical use of these resources was also taken into consideration.
The central objective of the project was to encourage diversification of pedagogical practices through the distribution of educational tablets – expanding access by schools, teachers and students to technological resources – and improve the teaching and learning process, and school organization and management. In addition to meeting Action 6 of the Goal Program, the project also addresses all the other actions, as can be seen in the specific objectives:
– Provide educational professionals, who are involved in this process and working in the
indicated schools, with training for administration and use of the equipment distributed;
– Promote access to digital learning objects and use of the digital content repository of
Seed-PR;
– Encourage the use of available applications (online and offline) through differentiated
methodological proposals;
– Encourage the practice of producing educational objects through access to tools and
applications available on the Internet;
3 More information about the CONNECTED project can be found on the website of the Department of Education of Paraná. Retrieved on May 10, 2017, from http://www.gestaoescolar.diaadia.pr.gov.br/modules/conteudo/conteudo.php?conteudo=1544

2016 ICT IN EDUCATION SURVEYARTICLES 147
EN
GLI
SH
– Promote the sharing of practices and different teaching approaches through the use of
educational tablets among teachers;
– Assess the effects of the use of educational tablets on pedagogical practices and
school organization. (State Department of Education of Paraná [Seed-PR], 2016, p.4,
emphasis added)
To achieve these objectives, action goals were defined that involved: Internet connection infrastructure in schools; distribution of kits with informatics equipment; training of teachers; technical support for the resources for the use of educational technologies by the state school system; research; and monitoring of the actions carried out during the implementation of the project.
THE CONNECTED PROJECT IN THE CONTEXT OF SCHOOLS
This section will examine how the individuals who participated in the CONNECTED project enacted this policy, in a process of interpretation and translation (Ball et al., 2012), according to the assessments of school managers who were part of the project.
The empirical data collected from the group of participants was taken from 59 questionnaires completed by the schools. Each school received a code consisting of the letter S (school), followed by a number, such as S1, S2, S3... up to S59. The data analysis was qualitative and quantitative in nature, and the responses from participants were organized according to the methodology of Discourse of the Collective Subject (DCS) (Lefèvre & Lefèvre, 2005). This approach combines the central ideas of individual comments on a specific subject into one text to express the collective thought, thereby generating discourse on the collective subject. This text presents the DCS in relation to three categories: i) ICT infrastructure in schools; ii) participation of management teams, teachers and students; and iii) integration of ICT into pedagogical practices, and the results observed.
I – ICT INFRASTRUCTURE IN SCHOOLS
The schools that participated in the CONNECTED project belong to various regional education units of the state of Paraná, but are from a variety of regions and cities with distinct social and economic contexts and different organizational and physical structures. There was almost unanimous agreement among respondents regarding inadequacies in the infrastructure for the installation of technological equipment in their schools and low quality Internet and wireless networks, due to slow speeds and insufficient capacity for use by groups of students. On top of these deficiencies, there was also a problem with the quality of the tablets sent to the schools, which were too slow and often unable to run the applications in the activities planned by the teachers. Among those surveyed, the use of the devices was considered average by 43%, good by 38% and very good by 19%, which reveals that structural difficulties partly hindered the work of teachers, as can be seen in the following remarks:

ICT IN EDUCATION SURVEY 2016ARTICLES148
EN
GLI
SH
DCS1: The project was a milestone in the history of our school and, despite many
obstacles, was a great success (S8). The CONNECTED project is very good, stimulates
learning and makes classes more appealing. However, the tablets didn’t work and it was
necessary to use the computer labs and students’ mobile phones, for those who had one. In
addition, the Internet connection was insufficient and prevented working with the tablets
in the classrooms. We are waiting for funds to be released to expand the network, which
was planned at the time we joined the CONNECTED project (S13). We are in favor of
innovation and using media in the teaching and learning process, but it will never be
efficient or achieve the desired results if the supporting entity does not provide adequate
installation conditions and higher Internet capacity in schools (S4). The use of the tablets
in the classrooms was average due to the low quality of the mobile devices, in which case
students preferred using their own smartphones (S37). In order to be CONNECTED, it’s
necessary to invest in higher quality Internet and modern tablets. Most of the tablets are
obsolete. Without this, the CONNECTED project is simply a dream (S1).
The comments show how the policy was interpreted, translated and modified in the practical realm, in the face of deficient infrastructure in the schools as far as Internet network quality, i.e., because of the material contexts of the schools for using new technologies – as Ball et al. (2012) mentioned – due to funds not being released by the state, as defined in the initial proposal of the project. As teachers realized that the quality of the tablets was not sufficient to run certain applications in their activities, they sought alternatives with other mobile devices, such as students’ mobile phones. This indicates that the policy, when enacted, was recontextualized and modified, according to the material conditions available in the classrooms and schools.
II –PARTICIPATION OF MANAGEMENT TEAMS, TEACHERS AND STUDENTS
The participation of schools’ pedagogical teams in continuing education meetings was considered very good by 61% and good by 39%. The participation of teachers was deemed very good by 41%, good by 51%, and average by 8%. Regarding the participation of teachers in study groups, 41% of the managers considered it very good, 54% good and 5% average. In terms of planning of activities by teachers, 49% considered it very good, 42% good and 8% average.
The responses to the questionnaire on participation in training meetings emphasized training in reference to the use of technologies in pedagogical practices:
DCS3: The training time was very valuable and led to sharing experiences and interdisciplinary
planning (S11).The teachers received more information about informatics and felt better
prepared to work with new technologies and methodologies with students, implementing
them in their classes and making them more interesting (S17). Also important were:
– the search for knowledge by teachers on how to use new tools; availability and quick
answers from the teachers/tutors (S8);
– presence of and monitoring by the employee from the regional education unit to provide
the necessary support for the project to occur (S41); and
– the sharing of experiences and interests of the teachers, who even though very busy
remained in the course until the end of the training (S33).

2016 ICT IN EDUCATION SURVEYARTICLES 149
EN
GLI
SH
As for the participation of the whole school in carrying out the project, the respondents stated that:
DCS4: Worth noting is the involvement of the pedagogical team, teachers and students
in carrying out the activities. The group went beyond what was expected and embraced
the work proposals with a broad and objective approach. The school community was
mobilized with respect to digital inclusion in the educational context (S10). In classes
where technological resources are used, students participate more actively and there are
fewer disciplinary problems (S31). There was higher integration among students and greater
willingness to use new technologies (S9). The students who participated felt important and
their performance improved (S5).
The participation of the parties involved in the CONNECTED project, in all the stages of its development, demonstrated that most were committed to it. This facilitated the use of new technologies in the school and classroom context, enhanced the teaching and learning process, and generated an institutional trend toward dissemination of a new culture – a digital culture – as pointed out by Iannone et al. (2016).
III – INTEGRATION OF ICT IN PEDAGOGICAL PRACTICES AND THE RESULTS ACHIEVED
The use of tablets and other mobile devices, as well as the results and effects on pedagogical practices, student learning, and school organization, were assessed by the participants, as shown in the data in Table 1.
TABLE 1 ASSESSMENT OF THE RESULTS/EFFECTS OF THE CONNECTED PROJECT (2017)
Results /Effects Very good Good Average
The results /effects of the use of tablets and /or other mobile devices in the pedagogical practices of teachers 29% 44% 27%
The results /effects of the use of tablets and /or other mobile devices on student learning 22% 49% 29%
The results /effects of implementing the project on school organization 32% 54% 14%
Source: Survey questionnaires.
The investigation of the results/effects of the CONNECTED project on pedagogical practices, student learning and school organization showed that they were considered good, since the score of “Good” on the assessment scale received the highest percentage. The diversity of opinions can be seen in DCS6, where respondents explained the results/effects observed:
DCS6: The results were satisfactory. After joining the project, the teachers started
incorporating mobile devices, such as tablets and mobile phones, into their pedagogical
practices. The computer lab also started being used more during the project.

ICT IN EDUCATION SURVEY 2016ARTICLES150
EN
GLI
SH
The technologies are within reach of most people, and inserting them into the teaching
and learning process expands knowledge and improves the quality of education (S26).
The project enabled the use of various educational media. We understand the importance
of mobile learning and the use of these devices. Teaching practices can generate changes
in the quality of work carried out in the school environment. It could be seen that there is
a need to adapt to this style of learning, since students are more interested in learning this
way (S7). The methodological diversification through working with new media improved
the quality of the teaching and learning process (S1). The classes were more appealing
and dynamic, and there was also a significant change in the way students are evaluated
(S18). We noticed that the tablets that were provided are being used by many teachers
in the classroom as instruments for accessing research sources on various websites on a
wide range of topics. This is very important for student learning (S22). New technologies
need to be encouraged in the educational context. Teachers also need to be trained and
have the means to promote digital inclusion and improve teaching and learning, where
these resources serve as instruments to mediate the teaching and learning process. No
matter how big the challenges, they must be faced. The CONNECTED project is a way of
promoting this process and even demanding better conditions with respect to acquiring
new technologies and being trained in their use (S52).
The objective of the CONNECTED project was to foster diversification in pedagogical practices, through the distribution of educational tablets and increasing access to technological resources by schools, teachers and students, as well as help to improve the teaching and learning process and school organization and management. It can be inferred that even though the policy has been recontextualized in practice, due to the conditions of schools and their supporting entities, the creativity of teachers and pedagogical teams was essential for transforming the policy texts (interpretation and translation) into feasible situations within the complexity of the classroom environments where these policies were put into practice. As Ball et al. state (2012, p. 198), “policies will be open to situated changes; they may get integrated into older ways of working – the history of prior discourses – and become invisible or asserted within new technologies and new ways of doing school.”
FINAL CONSIDERATIONS
The analysis of the survey results, based on the theory of policy enactment, showed how schools dealt with the demands that arose, i.e., how the policy was put into practice. The different ways in which participants worked creatively to enact the CONNECTED policy, in light of their situated realities, were contextually mediated and institutionally conceived, generating a process of recontextualization that produced heterogeneous practices, depending on the actors of the policy and how it was theorized in each school. The educational policy in Paraná was designed to promote digital culture in the pedagogical practices of state schools. It can be concluded that the CONNECTED project enabled the schools involved to take the first steps toward building a digital culture, and that this culture can and should be in classrooms and schools. At the same time, improvement and continuity of the actions, as well as expansion of the CONNECTED project, are necessary for building a digital culture in public schools in Paraná.

2016 ICT IN EDUCATION SURVEYARTICLES 151
EN
GLI
SH
REFERENCES
Ball, S. J., Maguire, M., & Braun, A. (2012). Como as escolas fazem as políticas: atuação em escolas secundárias. Ponta Grossa: Editora UEPG.
Iannone, L. R., Almeida, M. E., & Valente, J. A. (2016). Pesquisa TIC Educação: Da inclusão para a cultura digital. In: CGI.br, Pesquisa sobre o uso das tecnologias de informação e comunicação nas escolas brasileiras: TIC Educação 2015. São Paulo: CGI.br. Retrieved from http://cetic.br/media/docs/publicacoes/2/TIC_Edu_2015_LIVRO_ELETRONICO.pdf
Lefèvre, F., & Lefèvre, A. M. (2005). Depoimentos e discursos: uma proposta de análise em pesquisa social. (Série Pesquisa , 12). Brasília: Liber Livro.
State Department of Education of Paraná [Seed-PR]. (2016). Projeto Conectados. Retrieved on October, 10, 2016, from http://www.gestaoescolar.diaadia.pr.gov.br/modules/conteudo/conteudo.php? conteudo=1544


2016 ICT IN EDUCATION SURVEYARTICLES 153
EN
GLI
SH
SOCIAL AND FORMATIVE APPROPRIATIONS OF DIGITAL TECHNOLOGIES BY ADOLESCENTS AND THEIR RELATIONSHIP WITH SCHOOL EDUCATION 1
Analigia Miranda da Silva2 and Claudia Maria de Lima3
INTRODUCTION
Thinking about education in contemporary times requires understanding educational practices in relationship to the current sociocultural context. The ways in which people relate, communicate, and learn have been changing, driven by the progress and diversification of digital technologies. These technologies promote sociocultural practices that transcend time and space, directly impacting how knowledge is produced, disseminated, and acquired (Pretto, 2010). In this context, because of the emergence of new formative needs, curricula and educational practices are in urgent need of review.
In light of the above, the present study was based on questions about what pedagogical practices are aligned with the modes of appropriation and learning strategies mobilized by students in contexts where information and communication digital technologies (ICT) are used in teaching. These questions culminated in the following research objectives: to identify and analyze modes of appropriation and learning strategies mobilized by adolescents in the last years of Elementary and Secondary Education, in contexts in which digital technology is used; and to identify and analyze the representations of teachers about their practices with such uses, in order to think/rethink teacher training about digital technologies in teaching and learning processes.
1 Study financed by the São Paulo Research Foundation (Fapesp).2 PhD and master’s degree in education from São Paulo State University (Unesp), Presidente Prudente, and undergraduate
degree in pedagogy from Unesp, São José do Rio Preto. Member of the research group on Information and Communication Technologies, Pedagogical Practices, and Teaching, also at Unesp.
3 Professor in the graduate program in education at Unesp, Presidente Prudente, and the Department of Education at Unesp, São José do Rio Preto. Lima also participates in the International Center for Studies on Social Representations and Subjectivity – Education (CIERS-ed) at the Carlos Chagas Foundation (FCC).

ICT IN EDUCATION SURVEY 2016ARTICLES154
EN
GLI
SH
The theoretical framework adopted by this study was the distributed cognition approach (Hutchins, 2000; Salomon, 2001), which is conceptually based on the ideas of Vygotsky (1998) about the relationship of higher mental functions with instruments and signs.
The link between the use of digital technologies and cognition is an important subject when thinking about school processes. From the Vygotskian point of view, the teaching-learning process is based on the premise of digital technologies as psychological instruments, with the capacity to mediate inter- and intra-mental processes that promote cognitive development.
The social and participative nature of digital technologies reflects the potential to promote new spaces for constructing knowledge that derive from shared action among subjects, in line with the distributed cognition approach (Salomon, 2001).
It is worth providing a specific definition of the concept of distributed cognition within its branch of knowledge. Distributed cognition is theoretically based on cognitive sciences, a recent field of study whose goal is to answer questions relative to the mind and the organization of the cognitive system (Matlin, 2004). However, some authors have explained that the traditional approach to cognitive studies restricts mental processes to individuals, differentiating culture from cognition, while the distributed cognition approach includes the mental processes that occur among a set of elements, whether human or technological, used to perform mental activities (Hollan, Hutchins, & Kirsh, 2000; Hutchins, 2000; Rogers, 1997).
The distributed cognition approach emerged from the studies of cognitive anthropologist Edwin Hutchins (1995) about the processes involved in high-sea navigation. This researcher shone a light on the phenomenon, demonstrating that ship navigation systems are based on complex relationships between humans and machines. He concluded that cognition emerges from a complex network of instruments, distributed in time and space, and interaction among humans. In other words, cognition is the result of a shared process among individuals, social groups, and technical artifacts associated with the relevant social-historical period.
Hollan, Hutchins and Kirsh (2000) wrote an article, Distributed cognition: toward a new foundation for human-computer interaction research, in which they stated that, like all other cognitive theories, distributed cognition seeks to understand the organization of cognitive systems. However, it distinguishes itself from traditional approaches when it extends its reach beyond the individual and includes groups, interactions, and materials found in the environment as fundamental parts of cognitive processes.
The distributed cognition approach is based on two principles: 1) cognitive development is considered wherever it may occur, especially based on the relationships established between subjects and means or tools; and 2) cognitive processes are considered beyond their biological mechanisms, in which the material world also provides opportunities to reorganize cognitive systems, which are distributed through inter- and intra-mental exchanges. Radically put, distributed cognition is based on the assumption that cognitive processes cannot be dissociated from the interaction of subjects with the world and its technical artifacts.

2016 ICT IN EDUCATION SURVEYARTICLES 155
EN
GLI
SH
Regarding the distributed nature of cognition, Salomon (2001) set out to understand where cognitions are situated. To answer this question, he based his inquiries on a perspective that considers the joint mental processes of individuals and the artifacts/tools at their disposal. The nature of this distribution is based on the principle of the establishment of the existence of several sources of distribution that operate simultaneously. As a result, new knowledge is constructed.
The interaction between different elements – subjects and artifacts – results in knowledge that can be attributed, not to any one element, but to the interaction among several elements. Thus, intelligence is collective, i.e., a product of individual and collective mental structures. Individual cognition inter-relates with social cognition, which is distributed through social resources, and both develop through an open and undefined process, like a spiral: learners learn about the environment with their existing cognitive structures (which includes biological aspects, prior knowledge, representations, and emotions, among other elements that make up human cognition) and structurally transform it, with more complex actions. This modified knowledge becomes part of the cognitive structure of the individual and the environment, i.e., it is transformed into social knowledge that is distributed via human and non-human agents. This is how distributed cognition understands social, cultural, and physical contexts.
Interaction among the parts of a distributed cognition system (which includes the cognition of individuals, the knowledge that circulates in the environment, and the various symbolic or mediating representations) continuously alters the system. It is in this sense that cognition is socially distributed, i.e., it contains an inherently social dimension, for even subjectivity cannot stand alone in the absence of social relationships.
The cybernetic network, with its symbolic, social, communicative, and consequently representational characteristics, in addition to its capabilities for expansion, adaptation, and re-adaptation, is a rich environment for distributed cognition. The network only exists because it is continuously fed by individual/collective thinking, through a dynamic and decentralized process. The process is both individual and collective: individual because learning is individual, based on individuals and their initial representations; and collective, because their learning includes what they can achieve with the help of others. This is what Vygotsky (1998) called the zone of proximal development, i.e., the distance between an individual’s current stage of development, which is determined by their ability to perform a task without assistance, and the potential level of development, determined by the ability to solve problems with the help of others.
In the case of distributed cognition, the zone of construction, i.e., the distance between what an individual can do alone and what they can do with the intervention of others, occurs when subjects, upon using technical artifacts, change themselves and the instruments on a continuum. It is important to reflect how students appropriate such tools and to think about formative possibilities in school practices with the use of these resources.

ICT IN EDUCATION SURVEY 2016ARTICLES156
EN
GLI
SH
THE STUDY
According to Gil (2008), study designs consist of broad plans that detail how to reach the objectives of an investigation, with the necessary instruments and procedures. This section presents the methodology and procedures adopted in the present study, which was composed of three inter-related phases to achieve the objectives of the study.
This was a qualitative (Lüdke & André, 1986) descriptive-explanatory study, including three data collection stages: a) semi-structured interviews (Szymanski, 2004) with 11 teachers who taught classes in the final years of Elementary Education and Secondary Education in a city in the state of São Paulo, Brazil; b) semi-structured questionnaires administered to 12 students in the last years of Elementary Education; c) interviews based on the clinical method (Piaget, 2007) with 9 adolescents between 13 and 17 years old. For each collection instrument, the guiding frameworks were based on the general objectives and specific objectives of each stage of the study.
Based on the information found on the website of the studied municipality’s Secretariat of Education, the researchers mapped out all the schools with classes in the last years of Elementary Education and with computer labs to select the school that would compose the sample.
After this process, the school with the most students was selected to ensure a meaningful field of research and an adequate number of participants. The school selected was the largest in the municipality, with an average of 365 Elementary Education students and 467 Secondary Education students.
Data analysis was performed by triangulating the three stages of the study, using content analysis (Bardin, 1997) and based on the dimensions of analysis determined by the clinical method.
RESULTS AND DISCUSSION
The present study was essentially based on the questions about the different possible cultural, social, and cognitive frameworks among students and teachers about how pedagogical practices can go hand-in-hand with the way students learn in the current historical-cultural context and which pedagogical practices are aligned with the modes of appropriation and learning strategies mobilized by students when using digital ICTs for pedagogical purposes. The objectives of this study were to analyze the modes of appropriation and learning strategies mobilized by adolescents in a Brazilian public school, and the representations of teachers about their practices from the perspective of teacher training within the scope of digital technologies.
First, data analysis identified and analyzed the representations of teachers about their practices when using digital technologies within the context of the educational process.
The results indicate that teachers did not recognize the new learning culture in which students are active participants, socially distributing knowledge via digital technologies. The social representations of the teachers about the use of technology by students focused on entertainment and disregarded the learning dimension. This is a relevant point, because

2016 ICT IN EDUCATION SURVEYARTICLES 157
EN
GLI
SH
if teachers do not consider the pedagogical potential of technology, they are not likely to use it in their practices. Martins and Moser (2012) indicated that students today are not able to concentrate in traditional classes (centered on teachers and the transmission of information) and do not learn this way. Schools expect students to learn through practices that require linearity, concentration and disciplinarity, going against the current of new types of learning. Sancovschi and Kastrup (2013) reinforce this idea, stating that “[...] attention that jumps from one topic to the other and lacks rhythm seems to be related to how new technologies, especially the computer and Internet, grab our attention” (p. 201). They emphasize the importance of understanding the new relationships between learning and digital technologies.
The teachers showed nascent perception of the importance of defining the historical-cultural context of students in order to think about pedagogical practices. However, teacher training does not deal with how students learn with digital technologies, lacking reflections about the new sociocultural context in which concepts such as borders, socialization, communication, and construction of knowledge are redefined. Together, these factors hinder a review of school curricula and educational practices in order to make changes that will meet to the formative needs of students.
The second objective of this study was to identify and analyze the modes of appropriation and learning strategies mobilized by adolescents in the last years of Elementary and Secondary Education when using technological resources. To reach this objective, two data collection and analysis phases were conducted, whose results will be summarized jointly.
Regarding the formative use of digital technologies by adolescents, both inside and outside of school, the present study found that youths used technological resources both for socialization purposes and for school activities and to access information. However, the way adolescents accessed information through technological resources did not correspond to the representations held by their teachers about informational appropriation.
Adolescents do not search for information in habitual manners, such as, for example, by accessing news sites and conducting searches, among other strategies; instead, they wait for information to reach them. For the teachers, this attitude denotes passivity regarding objects of knowledge. However, the research data did not demonstrate passivity or lack of action, as believed by the teachers, but different modes of action relative to circulating information.
Adolescents are immersed in a sociocultural context in which technologies change the dynamics of communication and knowledge production. Thus, they perceive that knowledge is socially produced, shared, and distributed. Their actions relative to this information occurs when they constantly access the Internet, aware that knowledge is circulating, and when they modify and re-transmit it.
The actions of adolescents regarding this knowledge are associated with the assumptions of distributed cognition (Salomon, 2001). The knowledge that is circulated is transformed through collaborative actions among individuals, who in turn change the initial knowledge with the help of digital technologies. Considering that cognitive processes occur in the minds of individuals in an inter-relational process between the social environment and physical environment, communicative and cultural practices given through digital technologies act on the learning processes of adolescents.

ICT IN EDUCATION SURVEY 2016ARTICLES158
EN
GLI
SH
In contrast, when the object of knowledge was associated with school, the learning processes of these adolescents were based on traditional pedagogical models, centered on the verticalization of knowledge and the transmitter-receiver concept of communicational knowledge and the organization established by school. However, in daily practice, without realizing it, they experienced new modes of learning.
Based on the discussions above, it can be understood that outside of school, the adolescents learned through sociocultural practices enabled by digital technologies, which shape their cognitive skills by providing them with new forms of socializing, constructing, and distributing knowledge. Adolescents experience collective intelligence and have the perception that knowledge is the fruit of collaboration among individuals, distributed via digital technologies. However, this form of learning, which is mobilized by adolescents every day, does not correspond with how they represented modes of learning school content. When content was associated with school, the adolescents based their learning processes on traditional pedagogical models that highlight the linearity and centralization of knowledge. On the other hand, they perceived that their school did not correspond to the sociocultural context and were uninterested in traditional education.
In this daily transition between modes of learning, adolescents lose themselves in their learning processes, since outside of school they are able to control how they learn, while in school, learning is controlled. This process denies adolescents autonomy, awareness, and control over their cognitive processes.
Providing students with control and management of their cognition processes is essential for them to mobilize their own learning strategies. This autonomy enables them to align themselves with what they already know and what they still do not know about the content to be addressed, enabling them to take an active and constructive role regarding their own knowledge.
FINAL CONSIDERATIONS
The knowledge constructed by this investigation allows for the inference that the use of digital technologies by adolescents promotes sociocultural practices that directly shape cognition and learning processes. Digital resources are cultural mediators (Vigotski, 1998), cognitive instruments that inter-relate the individual cognition of adolescents with knowledge circulating on online networks. Through their relationship with digital technologies, adolescents have changed how their activities and cognitive processes are demanded and/or mobilized, and this promotes their intellectual development.
The sociocultural changes that permeate society must be allowed into schools. In turn, schools should represent the primary decentralized sources of access to knowledge. More importantly, they should be recognized as spaces for reflection that helps students understand their own learning processes, providing them with the autonomy and skills to critically participate in, act on, and learn about this new reality.
Initial and ongoing teacher training must be based on pedagogical proposals that address the metacognitive processes of students, helping them to learn to think and reflect about their own thinking. Pedagogical processes must be directed toward the implementation of situations

2016 ICT IN EDUCATION SURVEYARTICLES 159
EN
GLI
SH
and conditions that build on the learning methods already established by students outside the school environment, but that are still disregarded in traditional educational processes.
Students take on a leading role in their learning process when they can control their learning strategies and are able to manage educational content according to their subjective needs and the rhythms of appropriating the information received. In the participative culture, enabled by digital technologies, adolescents already control what they learn and express their opinions or act on them, using their actual developmental level and moving toward their proximal development (Vigotski, 1998). It is up to schools to incorporate this way of constructing knowledge into their formative processes and, as occurs in digital culture, break with its space-time limitations on learning.
REFERENCES
Bardin, L. (1997). Análise de conteúdo. Lisboa: Edições 70.
Gil, A. C. (2008). Como elaborar projetos de pesquisa. São Paulo: Atlas.
Hollan, J., Hutchins, E., & Kirsh, D. (2000). Distributed Cognition: Toward a New Foundation for Human-Computer Interaction Research. ACM Transactions on Computer-Human Interaction , 7 (2), pp. 174-196. Retrieved on January 10, 2017, from https://www.lri.fr/~mbl/Stanford/CS477/papers/DistributedCognition-TOCHI.pdf
Hutchins, E. (1995). Cognition in the wild. Cambridge: MIT Press.
Hutchins, E. (2000). Distributed Cognition. Retrieved on February 10, 2017, from http://files.meetup.com/410989/DistributedCognition.pdf
Lüdke, M., & André, M. E. (1986). Pesquisa em educação: abordagens qualitativas. São Paulo: EPU.
Martins, O. B., & Moser, A. (2012). Conceito de mediação em Vygotsky, Leontiev e Wertsch. Revista Intersaberes , 7 (13), pp. 8-28.
Matlin, M. (2004). Psicologia cognitiva (5a ed.). Rio de Janeiro: LTC.
Piaget, J. (2007). Epsitemologia Genética (3a ed.). (Á. Cabral, Trad.). São Paulo: Matins Fontes.
Pretto, N. (2010). Redes colaborativas, ética hacker e educação. Educação em Revista , 26 (3), pp. 305-316. Retrieved on March 20, 2017, from http://www.scielo.br/pdf/edur/v26n3/v26n3a15
Rogers, Y. (1997). A Brief Introduction to Distributed Cognition. Retrieved on February 1, 2017, from http://www.csuchico.edu/~nschwartz/dcog-brief-intro.pdf
Salomon, G. (2001). No distribution without individuals cognition: A dynamic interactional view. In: G. Salomon, Distributed Cognitions: Psychological and educational considerations. Cambrigde: Cambrigde University Press.
Sancovschi, B., & Kastrup, V. (2013). Práticas de estudo contemporâneas e a aprendizagem da atenção. Psicologia & Sociedade , 25 (1), pp. 193-202.
Szymanski, H. (2004). Entrevista reflexiva: Um olhar psicológico sobre a entrevista em pesquisa. In: H. Szymanski, L. R. Almeida, & R. C. Brandini (Org.), A entrevista na pesquisa em educação: A prática reflexiva (pp. 9-61). Brasília: Líber.
Vigotski, L. S. (1998). A formação social da mente: O desenvolvimento dos processos psicológicos superiores. São Paulo: Martins Fontes.


2016 ICT IN EDUCATION SURVEYARTICLES 161
EN
GLI
SH
THE NATIONAL COMMON CURRICULUM AND THE USE OF ICT IN EDUCATION
Deise de Lacerda Paiva1
In Brazil, changes in the school curriculum have had high priority on the agendas of discussions in the area. Following the trend of countries such as Australia, South Korea, and Finland, Brazil has been undergoing curricular reform since 2017. Although education in these nations was already considered to be of high quality, with excellent results in the Programme for International Student Assessment (Pisa)2, some aspects still needed improvement. For this reason, these countries decided to carry out several changes to their school curriculums.
In the specific case of Brazil, the implementation of curricular changes presents a greater challenge than in other countries. Recently published results have shown that the country ranked near the bottom among Pisa results (Carta Educação, 2016a). Furthermore, data from the Brazilian Ministry of Education (MEC) revealed that only 54.3% of 19-year-olds had completed Secondary Education (Todos pela Educação, 2014), and 41.5% had not finished this level (Porvir, 2017). The Brazilian school structure is thought to be stuck in the past and distant from the reality of most young individuals. The country still preserves the same educational model as the last century: content-centered teaching based on the same 13-subject curriculum, which does not consider individual student pace or learning difficulties. Instead of contributing to social mobility and offering equal opportunities to all without distinctions, schools end up perpetuating social differences: “Indeed, all it takes to give the advantage to the most advantaged and place the most disadvantaged at a disadvantage is for schools to ignore [...] the cultural inequalities between children from different classes.” (Bourdieu, 2015, p. 59).
1 Master’s degree in language studies from the Pontifical Catholic University of Rio de Janeiro (PUC-RJ) and undergraduate degree in Portuguese language and literature from the Rio de Janeiro State University (UERJ). Current member of the Central Coordination for Online Education research group (CCEAD) of PUC-RJ.
2 Pisa is the most important educational survey in the world, elaborated triennially by the Organisation for Economic Co-operation and Development (OECD) to measure the quality, equity, and efficiency of school systems.

ICT IN EDUCATION SURVEY 2016ARTICLES162
EN
GLI
SH
The reality is that most Brazilian schools still function according to the “banking” concept of education, in which teachers are holders of “knowledge” and students are “containers” that must be “filled” (Freire, 2005, p. 66). Additionally, the traditional model does not meet the demands of the 21st century. To compensate for some of these discrepancies, schools have adopted several “innovations.” When thinking about innovation, it is believed that the mere use of computers (or other digital devices) in school can contribute to improving this scenario. However, as indicated by Valente:
[...] it is frightening to think that we need something like computers to make schools
more motivating and interesting. Schools should be interesting not because they possess
an artifact, but because of what happens in school in terms of learning and intellectual,
affective, cultural and social development. (1993, p. 3)
Memorizing content or using computers in the classroom is not enough. The complexity of the current world requires students to develop new skills, as the interaction with new technologies “render our old skills outdated, making us more dependent on the need to change in order to keep apace with the speed of its developments” (Bauman & May, 2010, p. 238).
Thus, the hope is that the changes brought about by the National Common Curriculum (BNCC) will awaken the interest of youths in school, somehow stimulating innovation in the classroom, through the adoption of new pedagogical approaches, such as learning through projects that integrate different subjects and greater use of ICT in the teaching and learning process, among other aspects. However, the process of integrating ICT into learning in Brazil encounters several obstacles, ranging from restricted access to the Internet in schools (especially public schools) to lack of teacher training in ICT use, since they are considered the main agents of change in this context.
The results of the ICT in Education 2015 survey, conducted by the Regional Center for Studies on the Development of the Information Society (Cetic.br), showed that Internet use in the classroom takes place in 43% of public schools and 72% of private schools in urban regions. Among public schools, 45% reported having connection speeds no higher than 2 Mbps. Furthermore, access to the Internet is available more often in principals’ offices and teacher rooms – 93% of public schools had Internet access in the offices of principals and directors of studies, and 77% in teacher rooms – than in spaces used by students (Brazilian Internet Steering Committee [CGI.br], 2016). Most teachers, in turn, are not prepared to use new technologies in the classroom. Few have specific training in the area, and therefore, do not have the resources to use digital technology as a tool in their pedagogical practice.
The goal of this article is to present recent discussions about the experiences in curricular changes associated with ICT use in education. A significant number of studies emphasize the before-after contrast of introducing technology or are restricted to describing the use of such technologies by schools. There is a paucity of studies that analyze or assess ICT use in the educational context (Rosado, Martins, & Carvalho, 2017). Such studies could contribute to improving the use of already existing technologies and teacher training.

2016 ICT IN EDUCATION SURVEYARTICLES 163
EN
GLI
SH
MODELS
AUSTRALIA
Australia is a federation, and its states and territories have the autonomy to create public policy, including in the field of education. The main goal of constructing a unified curriculum was to eradicate educational inequalities, since those discrepancies generated different outcomes between students in urban centers and the countryside. To create this curriculum, the country chose to combine the most successful practices from each territory with international frameworks (Centro de Referência em Educação Integral, 2014). The final result established a structure in which 80% of the curriculum was required to follow the unified core curriculum, while the other 20% could include local content and activities (Agência Senado, 2016). Furthermore, the curriculum was based on three main dimensions: eight learning areas (the most traditional ones and those considered important in contexts outside of school); three cross-curriculum priorities (Australia’s engagement with Asia, history and culture of aborigines and sustainability) and seven general skills (Porvir, 2014a).
At first, technology was treated as a cross-curricular theme. A few years later, in 2012, it gained the same relevance as the other capabilities and began to be developed separately, subdivided into: digital technology, which is centered on the development of computational thinking for problem-solving; and design thinking, when learning occurs through projects (Almeida & Valente, 2016).
At the same time, the country conducted a massive teacher training effort. In 2011 and 2012, a capacity-building project was conducted to develop teaching skills with ICT (Teaching Teachers for the Future – TTF), which served as the basis for creating a collaborative network with the participation of all the higher education institutions responsible for teacher training (Almeida & Valente, 2016).
In 2011, a committee was established that gathered representatives from all the territories and levels of education to specifically address ICT-related topics. Joint actions were established with the goal of contributing to “sustainable and meaningful change to teaching and learning in Australian schools that will prepare students for further education and training, and to live and work in a digital world” (Almeida & Valente, 2016, p. 11). These actions resulted in the creation of a directory of online resources (the National Network of Digital Learning Resources), investments in the digital literacy of teachers and school leaders, and a national accreditation system, among other developments.
SOUTH KOREA
The South Korean government is recognized worldwide for heavily investing in the area of education. Studies have shown that, in Korea, 97% of students have a complete education. The country is ranked among the first in the world in terms of quality of education according to the Pisa report – a level reached based on the enactment of a law that made Basic Education a government priority. In Korea, teachers are highly valued; they are evaluated regularly, and even share the responsibility for learning assessment with students.

ICT IN EDUCATION SURVEY 2016ARTICLES164
EN
GLI
SH
Decisions about education are centralized. The curriculum is defined by the government and is reviewed every five to ten years on average. Recent curricular changes aimed to “indicate the dimensions of the development of learning for the 21st century,” giving priority to the development of creativity and enhancing character, so that each student can develop freely and creatively (National Center on Education and the Economy - NCEE, 2014).
To encourage access to knowledge, the government invests in school infrastructure and the use of ICT in education. Furthermore, the country has plans to transfer all printed content to the digital environment (IstoÉ, 2016).
FINLAND
Like Korea, Finland also stands out as one of the top-ranked countries in the field of education according to the Pisa report. Schools have excellent infrastructure, including in the classroom, and teachers are highly valued, undergoing constant refresher training.
Curricular changes in Finland resulted in even more local autonomy. Prior to the reform, teachers and principals were already allowed to complement the core curriculum developed by the National Agency for Education3, including the autonomy to decide which materials, methods, and types of assessments to use in the classroom. However, the country decided to change the curriculum to abolish hermetic division of content, implementing transdisciplinary education, a concept called “phenomenon-based learning.” This approach entails exploring phenomena based on a multidisciplinary perspective in order to develop new skills and encourage teamwork among teachers (Carta Educação, 2016c). This type of approach became mandatory in the curriculum, tearing down the barriers between subjects.
In the Finnish case, technology is considered yet another instrument to help teachers in the classroom. All available technological resources are welcome in the school environment. Greater use of digital tools, such as games, aims to improve the learning process in the classroom. Furthermore, there is great focus on the development of individual skills coupled with other capabilities, such as collaboration, innovation and initiative.
3 In Finland, the Ministry of Education is responsible for education legislation, policy guidelines, and budget; the National Council is responsible for the national core curriculum; municipalities manage Pre-school and Secondary Education; and last, schools propose complementary content to the core curriculum according to local contexts.

2016 ICT IN EDUCATION SURVEYARTICLES 165
EN
GLI
SH
BRAZIL: THE NATIONAL COMMON CURRICULUM
Despite controversy regarding changes in the field, there seems to be consensus that education in the country is in urgent need of reform. In terms of the Pisa report, Brazil ranked 63rd in sciences, 59th in reading and 66th in mathematics among the 70 countries assessed in 2015 (Carta Educação, 2016a). These numbers indicate that education in Brazil needs improvement, but observation of the school structure across the country also is critical of the fact that it is stuck in the 19th century, with closed curricula, 13 rigid subjects, the same arrangement of desks in rows in the classroom, large classes, etc. To solve the problem of the bankruptcy of the current model, the government decided to implement a series of measures, such as creating a National Common Curriculum and ensuring its flexibility.
According to this proposal, the core curriculum, which is in its final stages of creation, clearly indicates the skills, including digital, that students must develop to face the challenges of the contemporary world (Brazilian Ministry of Education [MEC], 2017, n.d.). Based on Australia’s example, the implementation of a unified core curriculum is an attempt to promote improvements in Brazilian education as a whole, ensuring equity among schools and providing a common compulsory framework from which to develop school curricula (MEC, 2017). The third version, published by the government in April 2017, presents a list of the general skills to be developed, integrated with the curricular components (MEC, 2017). The fifth skill is: “use of digital communication and information technologies in a critical, meaningful, reflective and ethical way in the various practices of daily life (including that of schools) when communicating, accessing, and disseminating information, producing knowledge, and solving problems” (p. 18). This shows that Brazil understands that this capability must be developed separately, as in the Australian model. Despite these advances, the BNCC does not foresee any action relative to the improvement of infrastructure, or, at least, it is not coordinated with any existing policies, such as the National Educational Technology Program (ProInfo)4. It is also worth noting that the core curriculum does not include computer programming, robotics, technology, etc., contrary to the trend presented in other countries, as pointed out by Paulo Blikstein, an expert in technology applied to education (Folha de S. Paulo, 2017).
In turn, the recently implemented curriculum flexibility in Secondary Education (called the “New Secondary Education”) is understood as an extension of the BNCC. This new model establishes that all students complete the same core curriculum in the first year-and-a-half of Secondary Education. In the following year, students can choose academic tracks in different areas (languages, mathematics, natural sciences, human sciences, and technical and vocational training). In practice, 60% of the curriculum is made up of a core curriculum and the remaining 40% is flexible. Thus, students can complete the flexible portion according to their skills and interests (MEC, n.d.). Academic tracks tend to allow for interdisciplinarity among different areas, a practice adopted by the Finnish model, with phenomenon-based learning.
4 ProInfo carried out extensions and coordination with other government programs and initiatives until it became “Integrated ProInfo”, which includes the Broadband in Schools initiative and the One Computer per Student project, among others. The goal of the Integrated ProInfo was to merge its actions with school activities, especially in the classroom (Almeida & Valente, 2016). Over time, factors such as lack of coordination among proposals in central government and other federative bodies limited the program to isolated and sporadic actions (Almeida & Valente, 2016).

ICT IN EDUCATION SURVEY 2016ARTICLES166
EN
GLI
SH
The BNCC will also serve to guide other actions, such as developing policies to train teachers to work with the new core curriculum and producing didactic materials. Currently, a great number of teachers have not received any training in ICT use. Even though some studies have shown that most teachers use new types of media in lesson planning (CGI.br, 2016)5, there is no type of assessment that measures whether such use is effective and contributes to student learning.
Despite current limitations in infrastructure, some schools include the subject of informatics in education as part of their curricular framework. However, these classes are focused primarily on basic knowledge on how to use the Microsoft Office suite, online safety and the like. In other words, the focus is on functionality and not on the actual development of digital skills (Paula, Valente, & Burn, 2014). It is worth highlighting that the BNCC does not include any actions to improve infrastructure – one of the main concerns of the current South Korean model.
CONCLUSION
The experiences of other countries show that, in all of them, ICT-related actions have been implemented in one way or another. The main objective of these changes has been to develop the capabilities and skills necessary in the 21st century. However, there is no consensus yet about the benefits of such inclusion. Some view the reorganization of the curriculum according to capabilities in a positive light:
[...] the organization of schools is, and will continue to be, markedly disciplinary:
teachers are, and will continue to be, teachers of subjects, as there is no sense in
describing them as teachers of “capabilities.” However, it is urgent that schoolwork
be reorganized, reconfiguring its spaces and times, bringing new life to the meaning
of curricula as maps of how to obtain given knowledge, of personal education as the
constitution of a broad spectrum of capabilities and, above all, the role of teachers
in a scenario into which ideas of knowledge and value are definitively interwoven.
(Machado, 2002, p. 139).
In Brazil, curricular reform has been heavily criticized, especially in terms of its creation process: “The core curriculum exceeds the condition expressed by its name, as it does not ensure unity between different teaching proposals, but proposes standardizing the curriculum through lists of content and competencies” (Barreto, 2017, p. 138). Nonetheless, the changes introduced by the reform, above all, contribute to shifting the spotlight from the teaching process to the learning process, placing students at the center of the educational process.
5 Several studies in Brazil have been conducted about ICT. Most have been centered on access to digital devices and the Internet. These studies have already indicated the need to shift research efforts from access to ICT to ICT use and skills, with the goal of constituting a digital literacy indicator (Rosa; Dias, 2012).

2016 ICT IN EDUCATION SURVEYARTICLES 167
EN
GLI
SH
Brazilian curricular reform presents some parallels with the abovementioned models from other countries: reduction of regional disparities among the several existing curricula, such as in Australia; a focus on interdisciplinarity, like Finland; and a specific phase set apart for the production of materials, among others. In contrast with these nations, Brazil has not been able to implement a policy geared towards teacher recognition. Furthermore, teachers have harshly criticized the creation process of the BNCC for not including teachers as its lead players (Carta Educação, 2016b).
Even though it is in its final stages, the development and flexibility of the core curriculum still polarize opinions. Although it is understood that dividing content by areas of knowledge is an advancement, the changes have not addressed one of the key issues: the content-based teaching that prevails in Brazilian schools. This demonstrates that not only is curriculum flexibility necessary, but that there are urgent changes that must be implemented in pedagogical practice (inside and outside the classroom).
There is a long path ahead before such changes can bring effective improvements to Brazilian education. However, even though the new curriculum has not yet been adopted, it is already possible to conclude, based on the experiences of other countries and the analysis of the results of ICT use, that the Brazilian reality will have to be considered when integrating ICT into the curriculum. It is also important to establish public policies to improve school infrastructure and train teachers, who must help youth develop for the world of work and the society of the future.
REFERENCES
Agência Senado. (2016). Comissão de Educação ouvirá especialista australiano sobre currículo nacional. Retrieved on June, 20, 2017, from http://www12.senado.leg.br/noticias/materias/2016/03/29/comissao-de-educacao-ouvira-especialista-australiano-sobre-curriculo-nacional
Almeida, E., & Valente, J. A. (2016). Políticas de tecnologia na educação brasileira: Histórico, lições aprendidas e recomendações. Retrieved on April 6, 2017, from http://www.cieb.net.br/cieb-estudos-politicas-de-tecnologia-na-educacao-brasileira-historico-licoes-aprendidas-e-recomendacoes/
Barreto, R. G. (2017). Objetos como sujeitos: O deslocamento radical. In: G. Ferreira, A. Rosado, & J. S. Carvalho, Educação e Tecnologia: Abordagens críticas (pp. 124-140). Rio de Janeiro: Editora Universidade Estácio de Sá.
Bauman, Z., & May, T. (2010). Aprendendo a pensar com a sociologia. Rio de Janeiro: Zahar.
Bourdieu, P. (2015). Escritos de educação. Petrópolis: Vozes.
Brazilian Internet Steering Committee - CGI.br. (2016). Survey on the Use of Information and Communication Technologies in Brazilian Schools: ICT in Education 2015. São Paulo: CGI.br.
Brazilian Ministry of Education. (n.d.). Retrieved on April 6, 2017, from http://basenacionalcomum.mec.gov.br/perguntas-frequentes
Brazilian Ministry of Education. (2017). Base Nacional Comum Curricular. Proposta preliminar. Third version. Retrieved on 28 August, 2017, from http://basenacionalcomum.mec.gov.br/images/BNCCpublicacao.pdf
Carta Educação. (2016a). Brasil mantém últimas colocações no Pisa. Retrieved on July 25, 2017, from http://www.cartaeducacao.com.br/reportagens/brasil-mantem-ultimas-colocacoes-no-pisa

ICT IN EDUCATION SURVEY 2016ARTICLES168
EN
GLI
SH
Carta Educação. (2016b). Expectativa e críticas aguardam Base Nacional Comum Curricular nas escolas. Retrieved on July 26, 2017, from http://www.cartaeducacao.com.br/reportagens/expectativa-e-criticas-aguardam-base-nacional-comum-curricular-nas-escolas/
Carta Educação. (2016c). O que é que a Finlândia tem? Retrieved on July 25, 2017, from http://www.cartaeducacao.com.br/entrevistas/o-que-e-que-a-finlandia-tem/
Centro de Referência em Educação Integral. (2014). Currículo nacional australiano busca reduzir desigualdades e prioriza aprendizagem. Retrieved on March 26, 2016, from http://educacaointegral.org.br/ experiencias/curriculo-nacional-australiano-prioriza-educacao-igualitaria-equanime
Folha de S.Paulo. (2017). Em ciências, a base curricular é trágica, avalia especialista de Stanford. Retrieved on April 6, 2017, from http://www1.folha.uol.com.br/educacao/2017/04/1873204-em-ciencias-base-curricular-e-tragica-avalia-especialista-de-stanford.shtml
Freire, P. (2005). Pedagogia do Oprimido. Rio de Janeiro: Paz e Terra.
IstoÉ. (2016). Escola sem papel. Retrieved on July 26, 2017, from http://istoe.com.br/150285_ ESCOLA+SEM+PAPEL/
Machado, N. J. (2002). Sobre a idéia de competência. In: P. Perrenoud, & M. G. Thurler. As competências para ensinar no século XXI. Porto Alegre: Artmed Editora.
National Center on Education and the Economy - NCEE. (2014). Ensino sul-coreano: Como funciona o sistema educacional da Coreia do Sul? Retrieved on July 26, 2017, from http://sarangingayo.com.br/noticias-gerais/ensino-sul-coreano-como-funciona-o-sistema-educacional-da-coreia-do-sul/
Paula, B., Valente, J. A., & Burn, A. (2014). O uso de jogos digitais para desenvolvimento do currículo na Inglaterra. Currículo Sem Fronteiras , 14 (3), pp. 46-71.
Porvir. (2014a). Para combater desigualdades educacionais, Austrália criou base curricular objetiva, concisa e incluindo material com exemplos reais. Retrieved on July 25, 2017, from http://porvir.org/curriculo-australiano-preve-de-ciencias-criatividade
Porvir. (2014b). Pesquisas apontam caminhos para o currículo no Brasil. Retrieved on April 6, 2017, from http://porvir.org/pesquisas-apontam-caminhos-para-curriculo-brasil/
Porvir. (2017). Pesquisa revela que 41,5% dos jovens de 19 anos não concluíram ensino médio. Retrieved on July 25, 2017, from http://porvir.org/pesquisa-revela-415-dos-jovens-de-19-anos-nao-concluiram-ensino-medio
Rosa, F.R., & Dias, M.C.N. (2012). Por um um indicador de letramento digital: uma abordagem sobre competências e habilidades. Dissertação de mestrado profissional em Gestão das Políticas Públicas – EAESP-FGV. Retrieved on october 30, 2017, from http://bibliotecadigital.fgv.br/dspace/handle/10438/10143
Rosado, L. A., Martins, G., & Carvalho, J. (2017). Educação e tecnologia na literatura online em português. In: G. M. Ferreira, L. A. Rosado, & J. Carvalho, Educação e tecnologia: Abordagens críticas. Rio de Janeiro: Sociedade de Ensino Superior Estácio de Sá.
Senado Notícias. (2016). Relator mantém arte e educação física como disciplinas obrigatórias. Retrieved on April 9, 2017, from http://www12.senado.leg.br/noticias/materias/2016/11/29/relator-mantem-arte-e-educacao-fisica-como-disciplinas-obrigatorias
Todos pela Educação. (2014). Apenas 54,3% dos jovens concluem o Ensino Médio até os 19 anos. Retrieved on July 25, 2017, from http://www.todospelaeducacao.org.br/reportagens-tpe/32163/apenas-543-dos-jovens-concluem-o-ensino-medio-ate-os-19-anos
Valente, J. A. (1993). Por quê o computador na educação? Retrieved on July 25, 2017, from http://www.ich.pucminas.br/pged/db/wq/wq1_LE/local/txtie9doc.pdf

PART 2—
ICT IN EDUCATION 2016


2016 ICT IN EDUCATION SURVEYMETHODOLOGICAL REPORT 171
EN
GLI
SH
METHODOLOGICAL REPORT ICT IN EDUCATION 2016
INTRODUCTION
The Brazilian Internet Steering Committee (CGI.br), through the Regional Center for Studies on the Development of the Information Society (Cetic.br), a department of the Brazilian Network Information Center (NIC.br), presents the methodology of the Survey on the Use of Information and Communication Technologies in Brazilian Schools – ICT in Education.
The survey is based on the methodological framework used by the International Association for the Evaluation of Educational Achievement – IEA (2009), released in two publications from the Second Information Technology in Education Study (SITES 2006): Technical Report; and User Guide for the International Database. Throughout the history of the ICT in Education survey, some aspects of the methodology and questionnaire were adapted to meet the specific needs of the Brazilian school universe and the needs of various sectors of society, such as government, academia, civil society organizations and the private sector.
OBJECTIVE OF THE SURVEY
The objective of the ICT in Education survey is to identify ICT access, use, and appropriation in Brazilian schools in relation to pedagogical practices and school administration.
CONCEPTS AND DEFINITIONS
TARGET POPULATION
The target population for the survey consisted of functioning public (state and municipal) and private schools located in Brazilian urban areas that provide standard instruction in at least one of the investigated levels or grades. Three grades were studied in this survey, namely: 4th grade / 5th year of Elementary Education, 8th grade / 9th year of Elementary Education; and 2nd year of Secondary Education.

ICT IN EDUCATION SURVEY 2016METHODOLOGICAL REPORT172
EN
GLI
SH
The target population also included all school principals, enrolled students, and individuals who hold coordination positions (directors of studies) and teaching positions (teachers) involved with the classes in the educational levels considered in this survey.
ANALYSIS UNITS
To achieve its objective, the survey investigates various dimensions related to the analysis units. They are:
• Schools: Profile in terms of infrastructure and ICT practices;
• Principals: Profile of computer and Internet use; ICT use in administrative and management activities; interaction with the communities; and perception of limitations on integrating ICT into education;
• Directors of studies (individuals in coordination positions): Profile of computer and Internet use; ICT use in administrative and pedagogical coordination activities, and in the school’s pedagogical project; and perception of limitations on integrating ICT into education;
• Teachers (individuals in teaching positions): Professional profile and profile of computer and Internet use; ICT skills and training; ICT use in general and teaching-learning activities; use of digital educational resources; and perceptions of limitations on integrating ICT into education;
• Students: Profile of computer and Internet use; ICT skills and training; activities performed using computers and/or the Internet at school.
DOMAINS OF INTEREST FOR ANALYSIS AND DISSEMINATION
For the analysis units, the results were reported for domains defined according to the variables and levels described below.
For all analysis units:
• Region: Corresponds to the regional divisions of Brazil, according to the Brazilian Institute of Geography and Statistics (IBGE), into the macro-regions Center-West, Northeast, North, Southeast and South.
• Administrative jurisdiction: Corresponds to the administrative levels of the schools – municipal public, state public, or private.
With the exception of schools:
• Gender: corresponds to the division into male or female.
For students and teachers:
• Grade: Corresponds to the level of the educational process in which the respondents teach or study.
2016 ICT IN EDUCATION SURVEYMETHODOLOGICAL REPORT 173
EN
GLI
SH
For principals, directors of studies, and teachers:
• Age group: Corresponds to the ages of the respondents on the day of the interview, expressed in whole years;
• Monthly family income in minimum wages (MW): Corresponds to the monthly income of all the members of the respondent’s household, expressed in three ranges of multiples of MW, considering the value of the MW set by the Ministry of Labor and Employment in the month prior to the interview;
• Monthly individual income in MWs: Corresponds to the total monthly income of the respondent, expressed in three ranges of multiples of MW, considering the value of the MW set by the Ministry of Labor and Employment in the month prior to the interview.
DATA COLLECTION INSTRUMENTS
INFORMATION ON THE DATA COLLECTION INSTRUMENTS
Interviews were conducted using structured questionnaires specific to the population addressed in the survey: students, teachers, directors of studies, and principals. The questionnaire about the analysis unit Schools was answered by the principals. More information about data collection instruments is available in the Data Collection Report.
SAMPLING PLAN
Probability sampling was used to select urban schools, conducted in multiple stages, depending on the survey’s target audience. The first stage of school sample selection consisted of stratifying the target population according to capital cities and Brazilian macro-regions. In each stratum, locations were selected, which consists of clusters of neighboring municipalities according to the number of classes (described below in detail).
Based on the selected capitals and locations, schools were partitioned according to available grades: 5th year or 9th year of Elementary Education, or 2nd year of Secondary Education, creating three lists for school selection – schools-grades. Thus, schools that had both 5th and 9th years of Elementary Education were included in the survey frame for the selection of the 5th year and 9th year sample. This means that schools with classes in more than one grade of interest were included more than once in the sampling process. In each of these lists, the selection of the school-grade sample was conducted independently – the second stage of selection. This stage selected the sample of schools-grades for the survey, and based on this sample, respondents were selected for the analysis units “schools” and “principals.”
From the selected schools-grades, a list of classes, directors of studies, and Portuguese, mathematics, or basic subject teachers (for 4th grade / 5th year classes) was assembled. Based on this list, directors of studies and teachers were selected for interviews – the third stage of selection.

ICT IN EDUCATION SURVEY 2016METHODOLOGICAL REPORT174
EN
GLI
SH
From the list of classes selected in the third stage, a list of regularly enrolled students was created from which students were selected for interviews – the fourth stage of selection. This was the last stage of sample section, including all the universes of interest for the survey.
SURVEY FRAME AND SOURCES OF INFORMATION
The survey frame used to select the schools-grades was the Basic Education School Census, coordinated by the National Institute for Educational Studies and Research “Anísio Teixeira” (Inep). This survey frame contains data on all Brazilian Basic Education schools. Based on the most recent Inep registry (published every year in March), the schools that met all the eligibility requirements for the survey population were included, i.e., functioning schools located in urban areas, not located in differentiated areas, and that included the survey’s target population.
Class listings for the potentially eligible schools were also analyzed to determine which could be included in the sample. This was necessary because the survey only included regular education classes. Early Childhood Education, Special Needs Education, Youth and Adult Education (Educação de Jovens e Adultos – EJA) and Vocational Training were outside the scope of the survey.
Eligible schools that were established in the year of data collection were not included in the survey population. For all other reference units (principals, directors of studies, teachers, and students), the eligibility conditions were applied according to the school’s status in the year of data collection, after updating the records of selected schools.
The IBGE basemap (shapefile) was used to assemble a set of locations that covered all of the Brazilian territory. In this map, the country is divided into municipalities. The number of schools in each municipality was added to this basemap.
CONSTRUCTING LOCATIONS
The creation of locations as clusters of neighboring municipalities was conducted according to the SKATER1 method available in TerraView2 software. In all, there are 5,570 municipalities in Brazil’s 27 federative units (FU). These municipalities were clustered (with neighboring municipalities) according to the following criteria:
- Locations must belong to only one FU;
- The mean number of schools in a location cannot differ relevantly from the mean number of schools per municipality in the FU;
1 The SKATER method consists of constructing clusters considering similarities in measurements (statistics/data) between the initial unit and its geographic neighborhood (Assunção, R., Lage, J., & Reis, E., 2002).
2 TerraView software is a free geographic information and application program developed by the National Institute for Space Research (Inpe).

2016 ICT IN EDUCATION SURVEYMETHODOLOGICAL REPORT 175
EN
GLI
SH
- Capital cities must be isolated and form their own cluster; and
- The resulting clusters must be internally heterogeneous, i.e., they cannot contain municipalities with many schools and others with few.
This method was carried out separately for each FU, thus ensuring that no clusters crossed borders between two or more distinct macro-regions.
To obtain internal heterogeneity of the clusters, the variable used to group municipalities was defined by the following equation:
Aij = Eij–∑
i
Eij ,Mj
where:
Eijis the number of schools in municipality i in FU j; and
Mjis the number of municipalities in FU j.
The CAP method was used to ensure that capitals were kept separate in single clusters; it was obtained by the following equation:
CAP = 1 × (1 – I [capital]) + 100,000 × I [capital].
This method led to the construction of 2,235 locations from among the total of 5,570 municipalities. All capital cities, except for Macapá (capital of the state of Amapá), constituted isolated clusters. The municipalities of Macapá and Itaubal formed one cluster, since Itaubal is completely surrounded by the capital city. Table 1 presents the number of locations by Brazilian region.
TABLE 1NUMBER OF LOCATIONS BY MACRO-REGION
Region Number of locations
North 210
Northeast 821
Southeast 587
South 461
Center-West 174
Total 2,253

ICT IN EDUCATION SURVEY 2016METHODOLOGICAL REPORT176
EN
GLI
SH
SAMPLE SIZE DETERMINATION
The objective of the ICT in Education survey sample size was to provide a more accurate reading of the results, given the heterogeneity of the analysis units. The sample selection characteristics, described in detail below, resulted in varying sample sizes.
STRATIFICATION OF THE LOCATION SAMPLE
The target population of the survey was stratified according to capital cities and Brazilian macro-regions.
SAMPLE ALLOCATION BY MACRO-REGIONS, CAPITALS, AND FEDERATIVE UNITS
The general sampling strategy used in the survey involved selecting a sample of schools from each target grade of interest. Therefore, the selection of locations within the strata and the selection of schools-grades within the selected locations is considered. The primary sampling units consisted of the locations in the strata of regions and schools-grades within the capital strata. Table 2 presents the sample allocation by region:
TABLE 2SAMPLE ALLOCATION OF LOCATIONS, BY STRATA
Stratum Number of locations
North 30
Northeast 30
Southeast 30
South 30
Center-West 30
Capitals 27
Total 177
The location sample in the regions was stratified by the federative unit that makes up each region, so that information was gathered from schools in all the FUs. Stratification by macro-region, FU, and capital city considered:
• Capitals (one stratum in each of the 27 FUs);
• Federative units (27).
Thus, 54 final strata were created. All the capitals were automatically included in the sample, and 30 locations were randomly selected from each Brazilian macro-region. The sample size

2016 ICT IN EDUCATION SURVEYMETHODOLOGICAL REPORT 177
EN
GLI
SH
of locations was determined by the ratio of the population in the FU to the population in the region, so that:
nh = 30 ×Phl ,
∑l
Phl
where:
nh is the location sample size in stratum h; and
Phl is the population of location l in stratum h.
Table 3 presents the distribution of the location sample by FU.
TABLE 3LOCATION SAMPLE SIZE BY FEDERATIVE UNIT
FU Capital Countryside
Rondônia 1 2
Acre 1 2
Amazonas 1 6
Roraima 1 2
Pará 1 14
Amapá 1 2
Tocantins 1 2
Maranhão 1 3
Piauí 1 2
Ceará 1 4
Rio Grande do Norte 1 2
Paraíba 1 2
Pernambuco 1 5
Alagoas 1 2
Sergipe 1 2
Bahia 1 8
Minas Gerais 1 7
Espírito Santo 1 2
Rio de Janeiro 1 6
São Paulo 1 15
Paraná 1 11
Santa Catarina 1 7
Rio Grande do Sul 1 12
Mato Grosso do Sul 1 6
Mato Grosso 1 8
Goiás 1 16
Federal District 1 0
Total 27 150

ICT IN EDUCATION SURVEY 2016METHODOLOGICAL REPORT178
EN
GLI
SH
After the locations were selected, a list of all the schools in the municipalities that made up the sample (including capital cities) was obtained from the School Census. From this list, schools were divided into three distinct groups for school-grade selection (second stage): schools with classes in the 5th year of Elementary Education, schools with classes in the 9th year of Elementary Education, and schools with classes in the 2nd year of Secondary Education. Grouping schools by grade resulted in the population of schools-grades. Thus, schools with classes in more than one of the studied grade levels were more likely to be included in the final school sample, given that they were included more than once in the sampling process.
With the school-grade samples determined for each location, samples were selected for the other analysis units (principals, students, directors of studies, and teachers), i.e., the sampling plan was implemented in stages for the selection of the reference units.
While the school-grade units were selected in the second stage, the selection of the other units of reference considered each school-grade unit as a cluster. Based on these clusters, the field survey frame and the selection of other reference units was carried out, as described below.
The strata for school-grade unit selection were defined considering stratification by FU/capital and the identification of the selected location. Thus, at least one school-grade was selected from every location within a given stratum. This allocation ensured that the domains of analysis “region” and “level of education” were considered in the sample selection process of schools-grades, as explained in the section on the selection of schools-grades.
The total sample size of schools-grades varied according to the locations selected in the first stage of the sampling process. The sample size of school-grade units usually consisted of approximately 500 schools in each level of education (Elementary Education I, Elementary Education II, or Secondary Education), in an attempt to allocate 100 schools-grades per Brazilian macro-region.
SAMPLE SELECTION
FIRST STAGE: LOCATION SELECTION
The selection of locations in each stratum was conducted using simple random sampling. As mentioned above, all the capitals were automatically included in the sample, and 30 locations were randomly selected from each Brazilian macro-region. The selection probability of each location was given by the following formula:
Phl =
⎧⎪ ⎪⎪ ⎪ ⎪⎨⎪ ⎪ ⎪ ⎪ ⎪⎩
nh , if not a capital municipality,Lh
1 , if a capital municipality.

2016 ICT IN EDUCATION SURVEYMETHODOLOGICAL REPORT 179
EN
GLI
SH
where:
Phl is the probability of selection of location l in stratum h;
nh is the sample size of locations in stratum h; and
Lh is the total number of locations in stratum h.
SECOND STAGE: SCHOOL SAMPLE SELECTION
Based on the selection of locations, the schools that composed the survey’s target population were pulled from the School Census. Schools were selected from all the locations in the sample, ensuring dispersion and sample presence in all federative units. For each location, the allocation of the school-grade sample was proportional to the number of school-grade units present in the location. Thus, 100 schools-grades were selected from each Brazilian macro-region. More information on sample allocation is presented in the Data Collection Report.
The schools that belonged to the survey’s target population and were located in the sample of selected locations were divided into three levels of schools-grades: 5th or 9th year of Elementary Education and 2nd year of Secondary Education. From each of these levels, schools were selected independently to compose the survey sample. Selection was conducted using sequential Poisson sampling (Ohlsson, 1998) within each location for each school-grade level. The size measurement used ( mi ) was calculated by standardizing it by administrative jurisdiction. Standardization was conducted using the mean number of classes per school per type of jurisdiction, calculated as follows:
meshld =
∑d Teshld ,
∑d Eeshld
where:
meshld is the mean of the number of classes in jurisdiction d in location l in stratum h;
T eshld is the number of classes in jurisdiction d in location l in stratum h; and
meshld is the number of schools in jurisdiction d in location l in stratum h.
The standardized measurement for each school on the list of schools-grades was given by:
meshldk =
T eshldk ,
meshld
where:
T eshldk is the number of classes in school k in jurisdiction d in location l in stratum h.

ICT IN EDUCATION SURVEY 2016METHODOLOGICAL REPORT180
EN
GLI
SH
The probability of selecting school k, from the list of schools-grades was calculated as follows:
peshldk = nes
hl ×mes
hldk ,∑d ∑k mes
hldk
where:
peshldk
is the probability selecting school k in jurisdiction d in location l in stratum h; and
neshl
is the sample size of schools-grades in location l in stratum h.
THIRD STAGE: CLASS SAMPLE SELECTION
From the school sample, information on the number of classes in the existing grades of interest in each school was gathered by phone or in person, using a listing form. The interviewer verified the information on the previously completed listing form and, in the case of differences, took into account the most up-to-date information. This information was used to calculate the weight of the classes.
For schools with one, two or three classes in the grades of interest, only one class was selected, and in the case of schools with four or more classes, only two classes were selected. Classes were randomly selected from each school-grade, considering the number of classes to be selected.
FOURTH STAGE: SELECTION OF RESPONDENTS
STUDENT SAMPLE SELECTION
The number of students to be interviewed in each grade at each school was set at ten. In cases where a school had up to three classes for the selected grade, the ten students were selected by inverse simple random sampling from the selected classes. If a school had more than three classes in the selected grade, the student sample was obtained by selecting five students by inverse sampling from each of the two selected classes. Students were selected through a simple procedure of obtaining attendance sheets with the names of the students enrolled in each class from the school administration office or a teacher.
From the attendance sheet for the selected classes, listed students were numbered from one to the total number of students in the class. For each class, a list was generated in advance with selection ranges with randomly permuted numbers, ranging from 1 to the total number of students enrolled in the class. Based on this information, the interviewer went through the list in the previously established order to select students until five or ten students were interviewed, depending on the class in question.
TEACHER SAMPLE SELECTION
Portuguese language and mathematics teachers were interviewed in each selected class. In the 4th grade / 5th year classes, basic subject teachers were interviewed. In schools selected

2016 ICT IN EDUCATION SURVEYMETHODOLOGICAL REPORT 181
EN
GLI
SH
for interviews in two classes in the same grade, one teacher from each subject and class was interviewed, totaling two teachers per class. For schools selected for interviews in one class in one grade, two teachers of each subject in each class were interviewed, totaling four teachers. In the case of schools selected for interviews in two or three grades, the same procedures were used for each selected grade.
The teachers were listed on a sheet according to subject and class taught, from which they were randomly selected.
DIRECTOR OF STUDIES SAMPLE SELECTION
One director of studies was interviewed per grade. In cases of more than one director of studies being in charge of the selected grade, a list of the directors of studies was prepared, and one was selected at random.
PRINCIPAL SAMPLE SELECTION
Only one principal was interviewed per school, even when a given school was selected for interviews with more than one grade.
FIELD DATA COLLECTION
CRITERIA FOR DATA COLLECTION
Data collection was accomplished through visits to the selected schools and interviews conducted with the principals, directors of studies, teachers and students selected for the sample. In most cases, appointments were scheduled in advance by telephone with the principal or person in charge, so that the interviewers’ visits would not interfere with the normal school routine. Also, the aim was to schedule the interviews on dates when the principal, director of studies, and selected teachers would be at the schools. In cases when contact by phone was difficult, the interviewers went personally to the schools to schedule the visits and complete the listing forms. In cases with the most problematic access, listing and interviews were held on the same day on which the first contact with the school occurred.
On the scheduled date, the interviewers went to the schools and conducted the interviews, following the procedures and structured questionnaires for each population.
The survey received institutional support from the Ministry of Education (MEC), National Council of Secretaries of Education (CONSED) and National Union of Municipal Education Leaders (UNDIME), which sent official letters to the selected schools before and during the field initiative, in order to inform them about the survey and request the support of those responsible for authorization of the interviews.

ICT IN EDUCATION SURVEY 2016METHODOLOGICAL REPORT182
EN
GLI
SH
DATA PROCESSING
WEIGHTING PROCEDURES
Survey weighting was based on the calculation of basic weights derived from the probability of selection in each stage, which were then adjusted for nonresponse. The weights for schools were adjusted for the total number of schools in the survey’s target population.
WEIGHT FOR SCHOOLS
The basic weight for each school was calculated based on the inverse of the selection probability of schools that considered the two selection stages: selection of locations and selection of schools on the list of schools-grades from the selected location.
As described previously:
qeshldk = phl × pes
hldk,
where:
qeshldk is the probability of selection of school k in jurisdiction d in location l in stratum h.
Some schools had up to three grades of interest, so they had a greater probability of being selected, as they were present in each of the school-grade listings. Thus, the probability of a school being selected to participate in the survey, independent of school-grade, was calculated as follows:
5o 9o 2oqhldk = qhldk + qhldk + qhldk 5o 9o 5o 2o 9o 2o
– 2 × (qhldk × qhldk) – 2 × (qhldk × qhldk)– 2 × (qhldk × qhldk)5o 9o 2o+ (qhldk × qhldk × qhldk).
Since the weight is the inverse of the probability of selecting a school to compose the sample, the school’s basic whldk weight was determined by:
whldk = 1 .qhldk

2016 ICT IN EDUCATION SURVEYMETHODOLOGICAL REPORT 183
EN
GLI
SH
ADJUSTMENT FOR NONRESPONSE
Adjustment for nonresponse (each analysis unit can present a different contingent of responding schools) was performed within each stratum, obtained by:
w*hldk = whldk ×
∑k∈s
whldk ,∑k∈r
whldk
where:
w*hldk is the adjusted weight of school k in jurisdiction d in location l in stratum h;
s is the group of selected schools in jurisdiction d in location l in stratum h; and
r is the group of responding schools in jurisdiction d in location l in stratum h.
CALIBRATION
The weights for responding schools, in all analysis units (schools, principals, directors of studies, teachers, and students) were adjusted for nonresponse (the number of respondents was different for each analysis unit) and calibrated for the total of schools per federative unit, administrative jurisdiction and grade. The total number of calibration variables were obtained from the School Census registry for the survey’s target population, from which the samples were selected. Iterative proportional fitting (IPF) for marginal values was used, also known as incomplete multivariate post-stratification or raking. The final weight of the schools was: w*C
hldk .
WEIGHT FOR PRINCIPALS
The weight for the analysis unit principals was the same as that calculated for the corresponding school, given that responses for a given school always implied response by its principal. Thus, the final weight for principals was obtained by: w*C
hldk .
WEIGHT FOR DIRECTORS OF STUDIES
The weight for directors of studies was calculated in two stages. The first entailed calculating the weight of the responding school for this analysis unit (as described above). The second entailed calculating the inverse of the probability of selection for each director of studies, through the ratio between the number of directors of studies listed and the number of directors of studies interviewed. The final weight for directors of studies was obtained by multiplying these two stages.
w Chldk = w*C
hldk ×Chldk ,C r
hldk
ICT IN EDUCATION SURVEY 2016METHODOLOGICAL REPORT184
EN
GLI
SH
where:
w Chldk Is the final weight for directors of studies in school k in jurisdiction d in location l in stratum h;
Chldk is the number of directors of studies listed in school k in jurisdiction d in location l in stratum h; and
C rhldk is the number of responding directors of studies in school k in jurisdiction d in location l
in stratum h.
WEIGHT FOR TEACHERS
The final weight for teachers was calculated in three steps. The first used the calibrated basic weight for schools in which at least one interview with a teacher was conducted. The second was the weight for the class, obtained through the ratio between the number of existing classes and the number of responding classes in each grade in each school, adjusted for the ratio between the number of existing classes and the number of responding classes in the stratum. The final weight for classes was obtained by:
w **T a
= w*C
hldk ×T a
hldk ×T a
hl ,hldk T rahldk T ra
hl
where:
w **T a
is the weight of class T in grade a from school k in jurisdiction d in location l in stratum h;hldk
T ahldk is the number of existing classes in grade a from school k in jurisdiction d in location l
in stratum h;
T rahldk is the number of responding classes in grade a from school k in jurisdiction d in location l
in stratum h;
T ahl is the number of existing classes in grade a in location l in stratum h; and
T rahl is the number of responding classes in grade a in location l in stratum h.
Another factor considered when calculating the weight for teachers was the subject taught. Information about the number of teachers available for each of the subjects of interest was collected. The ratio between the number of teachers available and the number of teachers interviewed for each subject and each class was obtained. The product of the three factors (school, class, and subject) resulted in the final weight for each of the teachers interviewed, given by:
w Pa
= w **P
× w **T a
×P xa
hldk ,hldk hldk hldk P xra
hldk
where:
w Pa
is the final weight for teacher p in grade a from school k in jurisdiction d in location l in stratum h;hldk
w **P is the adjusted weight for schools with responding teachers from school k in jurisdiction d
in location l in stratum h;hldk

2016 ICT IN EDUCATION SURVEYMETHODOLOGICAL REPORT 185
EN
GLI
SH
w **T a
is the weight of class T in grade a from school k in jurisdiction d in location l in stratum h;hldk
P xahldk is the number of existing teaching positions for subject x in grade a from school k in jurisdiction d
in location l in stratum h; and
P xra is the number of responding teaching positions for subject x in grade a from school k in dependence d
in location l in stratum h.hldk
WEIGHT FOR STUDENTS
The final weight for students was obtained through the product of the weights of the schools in which students were surveyed, the student’s class, and the basic weight of students. The weight for classes was obtained in the same way as that described for teachers. Student selection was conducted by simple inverse sampling, thus, the basic weight of students was equal to the inverse probability of each student being included in the sample. The final weight for students was obtained through the product of the three components, given by:
w Aa
= w **A
× w**T ×
(Arahldk – 1)
×Aa
hldk ,hldk hldk hldk (Asa
hldk – 1) Arahldk
where:
w Aa
is the final weight of responding student A in grade a from school k in jurisdiction d in location l of stratum h;
hldk
w **A is the adjusted weight for schools with responding students from school k in jurisdiction d
in location l in stratum h;hldk
w **T a
is the weight of class T in grade a from school k in jurisdiction d in location l in stratum h;hldk
Aahldk is the number of existing students in grade a from school k in jurisdiction d in location l
in stratum h;
Asahldk is the number of selected students in grade a from school k in jurisdiction d in location l
in stratum h; and
Arahldk is the number of responding students in grade a from school k in jurisdiction d in location l
in stratum h.
SAMPLING ERRORS
Sampling error measurements of indicators in the ICT in Education survey were calculated using the study’s sampling plan. The ultimate cluster method was used; this approach allows estimates of variances in the total estimators in multi-stage sampling plans. Proposed by Hansen, Hurwitz and Madow (1953), the method uses only the variation between information available in the primary sampling units and allows them to be selected from the stratums with replacement of the population.

ICT IN EDUCATION SURVEY 2016METHODOLOGICAL REPORT186
EN
GLI
SH
Based on this concept, it was possible to consider stratification and selection with unequal probabilities for both the primary units and the additional units in the sample. The premise underlying the application of this method is that unbiased estimators of the total values of the variables of interest for each of the primary aggregates selected are available. This method provides the foundation for several statistical packages specialized in calculating variances considering sampling plans.
Using the estimated variances, sampling errors were expressed by the margin of error; the margins of error were calculated for a 95% confidence level. This indicates that the results, based on this sample, were considered accurate within the range defined by the margins of error: 19 times out of 20. This means that, if the survey were repeated multiple times, in 95% of the cases the interval would contain the true population value. Other measurements derived from this variance estimate are usually presented, such as standard deviation, coefficient of variation and confidence interval.
Calculation of margin of error is the product of standard error (square root of variance) by 1.96 (value of the normal distribution corresponding to the chosen significance level of 95%). These calculations were made for each variable in each table, which ensured that all tables had margins of error associated with each estimate presented in each table cell.
DATA DISSEMINATION
The results of this study are presented according to the variables described in the Analysis Unit section. The rounding of some results caused the sum of estimates for response categories to be different from 100% for single-answer questions. The sum of frequencies in multiple-answer questions is usually different from 100%.
In this publication, tables of certain selected indicators for each analysis unit are presented. The full results, as well as the margins of error, are presented on the Cetic.br website and Data Visualization Portal.3
REFERENCES
Assunção, R., Lage, J., & Reis, E. (2002). Análise de conglomerados espaciais via árvore geradora mínima. Revista Brasileira de Estatística, 62(220), pp. 1-23.
Bolfarine, H., & Bussab, W. O. (2005). Elementos de amostragem. São Paulo: Blucher.
Brazilian Internet Steering Committee - CGI.br. (2016). Survey on the Use of Information and Communication Technologies in Brazilian Schools: ICT Education 2015. Retrieved on July 20, 2017, from http://cetic.br/media/docs/publicacoes/2/TIC_Edu_2015_LIVRO_ELETRONICO.pdf
3 More information on Cetic.br’s website. Retrieved on July 20, 2017, from http://data.cetic.br/cetic/

2016 ICT IN EDUCATION SURVEYMETHODOLOGICAL REPORT 187
EN
GLI
SH
Brazilian Ministry of Education. National Institute for Educational Studies and Research “Anísio Teixeira” - Inep. (2011). Plano de Desenvolvimento da Educação e Sistema Nacional de Avaliação da Educação Básica 2011. Retrieved on July 25, 2012, from http://www.oei.es/quipu/brasil/RelatorioSaeb2003_3.pdf
Brazilian Ministry of Education. National Institute for Educational Studies and Research “Anísio Teixeira” - Inep. (2015). Censo Escolar 2014. Retrieved on November 5, 2015, from http://portal.inep.gov.br/microdados
Cochran, W. G. (1977). Sampling techniques (3a ed.). New York: John Wiley & Sons.
Hansen, M. H., Hurwitx, W. N., & Madow, W. G. (1953). Sample survey methods and theory. New York: Wiley.
Internacional Association for the Evaluation of Educational Achievement - IEA. (2009). Sites 2006 Technical Report. Retrieved on March 20, 2013, from http://www.iea.nl/fileadmin/user_upload/Publications/Electronic_versions/SITES_2006_Technical_Report.pdf
Internacional Association for the Evaluation of Educational Achievement - IEA. (2009). Sites 2006 User Guide for the International Database. Retrieved on March 20, 2013, from http://pub.iea.nl/fileadmin/user_upload/Publications/Electronic_versions/SITES_2006_IDB_User_Guide.pdf
Lumley, T. (2010). Complex surveys: a guide to analysis using R. Nova Jersey: John Wiley & Sons.
Ohlsson, E. (1995). Coordination of samples using permanent random numbers. In: B. G. Cox, Business survey methods (pp. 153-170). New York: John Wiley.
Ohlsson, E. (1998). Sequential Poisson Sampling. Journal of Official Statistics, 14 (pp. 149-162).
Särndal, C., Swensson, B., & Wretman, J. (1992). Model assisted survey sampling. New York: Springer Verlag.
Thompson, S. K. (1999). Sampling. New York: John Wiley & Sons.
Vasconcellos, M. T., Silva, P. L., & Szwarcwald, C. L. (2005). Sampling design for the World Health Survey in Brazil. Cadernos de Saúde Pública, 21.


2016 ICT IN EDUCATION SURVEYDATA COLLECTION REPORT 189
EN
GLI
SH
DATA COLLECTION REPORT ICT IN EDUCATION 2016
INTRODUCTION
The Brazilian Internet Steering Committee (CGI.br), through the Regional Center for Studies on the Development of the Information Society (Cetic.br), a department of the Brazilian Network Information Center (NIC.br), presents the data collection report for the seventh edition of the ICT in Education survey. The objective of this report is to provide information about the specific features of the 2016 survey, including changes made to the data collection instruments, sample allocation, and response rates.
The complete survey methodology, including the objectives, main concepts, definitions, and characteristics of the sampling plan, are described in the Methodological Report, available in this publication.
SAMPLE ALLOCATION
The planned sample for the ICT in Education 2016 survey included 1,367 institutions.
The distribution of schools varied among regions and administrative jurisdictions, as shown in Table 1.
TABLE 1SCHOOL SAMPLE DISTRIBUTION, BY REGION AND ADMINISTRATIVE JURISDICTION
Sample
REGION
North 273
Northeast 273
Southeast 285
South 260
Center-West 276
ADMINISTRATIVE JURISDICTION
Municipal 273
State 273
Private 285

ICT IN EDUCATION SURVEY 2016DATA COLLECTION REPORT190
EN
GLI
SH
DATA COLLECTION INSTRUMENTS
PRETESTS
Pretesting was not performed in the 2016 edition of the survey.
CHANGES IN THE DATA COLLECTION INSTRUMENTS
In planning the 2016 version of the ICT in Education survey, no significant changes were made to the 2015 questionnaires for the four target groups surveyed. Some of the minor changes included: the exclusion of certain indicators and outdated items related to the survey’s measurement objectives; inclusion of indicators to improve data collection in terms of the school reality and the use of technologies; and one-off changes in wording and answer options for the questions to improve understanding by respondents. The changes in each questionnaire, by target group, are shown below.
PRINCIPALS
For principals, some answer options for the education level indicator were changed. Regarding the school as analysis unit, a question was modified to ask about the number of functioning desktop computers instead of only installed and functioning desktop computers. Questions about the following topics were excluded: Internet use by teachers in classrooms according to principals, content provided on digital platforms on which the school is present, and who is responsible for the maintenance of blogs.
DIRECTORS OF STUDIES
Changes were made only to the answer options for the education level indicator.
TEACHERS
Some changes were made to the answer options for the education level indicator. Questions about how often teachers took their personal portable computers or tablets to school, and general skills, were excluded.
STUDENTS
Questions on the following topics were removed: use of Wi-Fi network at school, even if restricted; general skills; and the location where school activities using the Internet are carried out. A question about the use of mobile phones in school activities with teacher guidance was included.

2016 ICT IN EDUCATION SURVEYDATA COLLECTION REPORT 191
EN
GLI
SH
INTERVIEWER TRAINING
The interviews were conducted by a team of interviewers who underwent training to administer the surveys.
Furthermore, the survey team also had access to the survey’s instruction manual, which contained a description of all the necessary procedures to carry out data collection and details about the objectives and methodology of the survey, thus ensuring the standardization and quality of the work.
Data collection was carried out by 145 interviewers and 19 field supervisors.
DATA COLLECTION PROCEDURES
DATA COLLECTION METHOD
Interviews were conducted using structured questionnaires specific to the populations addressed in the survey: students in the 5th and 9th years of Elementary Education and in the 2nd year of Secondary Education; Portuguese language, mathematics and multidisciplinary teachers; directors of studies; and principals. The indicators for the school analysis unit were reported by the principals. Data collection using these questionnaires took, on average, 29 minutes for teachers, 34 minutes for principals, 13 minutes for directors of studies, and 9 minutes for students.
Data collection was accomplished through visits to the selected schools and interviews conducted with the principals, directors of studies, teachers, and students selected for the sample. In most cases, appointments were scheduled in advance by telephone with the principal or person in charge, so that the interviewers’ visits would not interfere with the normal school routine. Also, the aim was to schedule the interviews on a date when the principal, director of studies, teachers and students would be at the institutions.
In cases when contact by phone was difficult, the interviewers went personally to the schools to schedule the visits and complete the listing forms. In cases with the most problematic access, listing and interviews were carried out on the same day on which the first contact with the school occurred.
On the scheduled date, the interviewers went to the schools and conducted the interviews, following the procedures and structured questionnaires for each population.
The survey received institutional support from the Ministry of Education (MEC), National Council of Secretaries of Education (CONSED) and National Union of Municipal Education Leaders (UNDIME), which sent official letters to the selected schools before and during the field initiative, in order to inform them about the survey and request the support of those responsible for authorization of the interviews.

ICT IN EDUCATION SURVEY 2016DATA COLLECTION REPORT192
EN
GLI
SH
DATA COLLECTION PERIOD
Data collection in the schools took place between August and December 2016.
PROCEDURES AND CONTROLS
The data collection step of contacting the schools in advance to schedule the visits for doing the interviews served the additional purpose of allowing confirmation of whether the schools had classes in the selected grades. With this information, the number of existing classes was surveyed and a listing form was used to compile all the classes in each selected grade. This information was necessary for planning the selection of reference units in the following stages and for allocating appropriately sized field teams for school visits. On the date of the school visit, each interviewer checked the information on the listing form completed during the initial phone call. In cases of divergent information, the most recent information obtained by the interviewer was considered.
The interviews with directors of studies, teachers and students required completion of a listing and selection of classes. After the class selection, the listing form was used to select each of these target groups.
During the school visit, the names of the teachers who taught the subjects targeted by the survey (Portuguese language, mathematics, and multidisciplinary) in the selected classes were requested. Their names were recorded in alphabetical order according to the subject taught on the teacher listing form. During the initial telephone call, the names of all the directors of studies for the selected grades were also collected and listed in alphabetical order on the director of studies listing form.
For students, listing forms were created based on the attendance sheets for the selected classes. In some cases, interviews were conducted with all the students in the class because the number of students available was less than that required by the survey.
Interviews were not conducted in the following situations:
• The school had no classes during the survey period. For example, the school was out of session, on strike, it was the end of the school year, classes were suspended, or there were security problems or extreme weather events;
• The school did not authorize the presence of the interviewers and, consequently, conducting the survey;
• The school no longer taught the selected grades;
• The school had ceased to exist or ended its activities;
• The school did not meet the established stratification criteria. The real or current information for the school was different from what was registered in the sample frame and, consequently, also in the sample selection;
• The school was not located or found;
• It was not possible to schedule the visit, for example, due to the lack of available dates or the principal’s absence.

2016 ICT IN EDUCATION SURVEYDATA COLLECTION REPORT 193
EN
GLI
SH
DATA COLLECTION RESULTS
In the ICT in Education 2016 survey, 1,106 schools were interviewed, reaching 81% of the planned sample of 1,367. In terms of the survey analysis units:
– 935 schools answered the school and principal questionnaires;
– 894 schools answered the director of studies questionnaires, with a total of 922 directors of studies interviewed;
– 1,017 schools answered the teacher questionnaires, with a total of 1,854 teachers interviewed;
– 1,087 schools answered the student questionnaires, with a total of 11,069 students interviewed.
The resulting distribution of schools and their response rates varied among regions and administrative jurisdictions. The results are shown in Table 2.
TABLE 2SCHOOL RESPONSE RATE, BY REGION AND ADMINISTRATIVE JURISDICTION
Sample
REGION
North 89%
Northeast 86%
Southeast 70%
South 80%
Center-West 80%
ADMINISTRATIVE JURISDICTION
Municipal 90%
State 90%
Private 59%


2016 ICT IN EDUCATION SURVEYANALYSIS OF RESULTS 195
EN
GLI
SH
ANALYSIS OF RESULTS ICT IN EDUCATION 2016
PRESENTATION
The seventh edition of the ICT in Education survey coincided with the 20th anniversary of the creation of the National Program for Informatics in Education – ProInfo (Ordinance no. 522, 1997). This is an important milestone, because the program is still the longest-lasting public policy for the development of strategies to integrate technology in the teaching and learning process in Brazil. Besides ProInfo, Brazil also developed actions such as the One Laptop per Child program (Prouca), the Broadband in Schools Program (PBLE), the International Database of Educational Objects (Bioe), the Teacher’s Web Portal, and the e-ProInfo virtual learning environment, among others.
The ICT in Education survey has been conducted annually since 2010. It was created during the second implementation phase of ProInfo, and had among its goals monitoring the outcomes generated by the program. In this context, the survey portrays the availability and quality of the infrastructure for access to information and communication technologies (ICT) in public and private schools; ICT use by students, teachers, directors of studies and principals, both inside and outside of schools; and the adoption of ICT in school management and pedagogical practice by collecting data about the activities developed by teachers in classrooms and teacher training. Since its inception, the survey has also aimed to go beyond mapping the existing ICT infrastructure in schools, also including, for example, indicators on how school members perceive the use of ICT in education.
With the fast dissemination of technology into society and, consequently, into spaces of teaching and learning, discussions about ICT adoption in education have been changing at a rapid pace. Greater emphasis has been placed on the appropriation of such technological resources. Appropriation in this context is understood as an ongoing process in which individuals take ownership of technology, content, languages, and forms of interaction, assigning them new or renewed meaning (Borges, 2009).
In consonance with this scenario, in 2016, the Regional Center for Studies on the Development of the Information Society (Cetic.br) initiated a process to update and improve the indicators collected by the ICT in Education survey. These efforts were systematized in the Methodological Framework for Measurement of Access and Use of Information and Communication Technologies (ICT) in Education (Brazilian Internet Steering Committee [CGI.br] & Unesco Institute for

ICT IN EDUCATION SURVEY 2016ANALYSIS OF RESULTS196
EN
GLI
SH
Statistics [UIS], 2016), whose development was based on the relationship of “digital culture in schools and schools in digital culture,” or better yet:
[...] As schools appropriate ICT and the cultural products arising from it and, at the same
time, act as generators of knowledge and information through their actors (students,
teachers, directors of studies and principals), ICT will be disseminated among the groups
and niches that make up the digital culture. (p. 16)
The Methodological Framework (CGI.br & UIS, 2016) created for the ICT in Education survey is in line with a movement that has also been occurring within the policy agenda. The first initiatives to create a national policy for the computerization of education emerged in the beginning of the 1980s, which is the case of the Educom project.1 At the time, discussions focused on building technical capacities for informatics, in order to create a work and research force around the devices and languages.
The first stage of the ProInfo, which lasted from 1997 to 2006, emerged as an improvement on the objectives of the Educom project. This occurred at a time during which personal computers and the Internet began to enter households, and debates about the digital inclusion of individuals were also growing. According to the text of the ordinance that created the program, its purpose was to “disseminate the pedagogical use of informatics and telecommunication technologies in public Elementary and Secondary Education schools belonging to the state and municipal school systems” (Ordinance no. 522, 1997).
The target for digital inclusion was expanded in 2007, with the second stage of ProInfo, which which was renamed Integrated ProInfo. In addition to the implementation of infrastructure and training educators, the program also encompassed the development of contents and repositories of digital learning materials, the creation of interaction and communication platforms, and the promotion of virtual communities for educators to share their experiences. All these actions were aligned with the need to improve ICT use in schools, especially in terms of the demand for Internet connection. Among its proposals, special mention goes to objective 2 – “to promote the improvement of the teaching and learning process through the use of information and communication technologies” – and objective 4 – “to contribute to digital inclusion by expanding access to computers, connection to the World Wide Web of computers, and other digital technologies, benefitting the school community and its neighboring population” (Decree no. 6.300, 2007). Both objectives introduced aspects that were not yet present in the texts of other policies, such as the role of technology in improving the teaching and learning process and the role of schools as centers for digital inclusion for school members and their neighboring communities.
1 The Educom project, which was implemented between 1985 and 1991, was an initiative by the Special Secretariat of the Presidency of the Republic (SEI/CSN/PR). The goal of SEI was to regulate, oversee and foster development initiatives in Brazil’s technological sector. At the time, it was responsible for the National Informatics Policy, which sought to “foster and encourage the computerization of Brazilian society, aimed at building scientific and technological capacities capable of promoting national autonomy, based on principles and guidelines grounded in the Brazilian reality and resulting from research activities and the consolidation of the national industry” (Moraes, 1997, as cited in Almeida & Valente, 2016).

2016 ICT IN EDUCATION SURVEYANALYSIS OF RESULTS 197
EN
GLI
SH
Even though policies that foster access to technology in schools have been based on these same objectives for over a decade, more recent official documents, which underpin decisions to improve the quality of education in the country, already indicate other roles assigned to technology in the teaching and learning process. For example, ICT is present in goals 2, 3, 5, 7, 8, 9 and 16 of the National Education Plan (PNE) 2014-2024 (Law no. 13.005, 2014), as a way to support the right to access to education in special needs schools, rural schools, and indigenous and quilombola (descendants of Afro-Brazilian slaves who resisted slavery and its legacy) communities; as an area of study and research for Secondary Education students; as a way of diversifying teaching methods and pedagogical proposals applied to the learning of children at all levels of education; as a vehicle that enables new or renewed spaces of knowledge, such as school libraries; and as a means to eradicate illiteracy, encompassing youths, adults, and older adults.
Technology is also the focus of the third version of the National Core Curriculum (MEC, 2017), which establishes ten general competencies that are included in all the curricular components of Basic Education for the construction of knowledge, skills, attitudes, and values. According to the text, this “expresses the commitment of Brazilian education to comprehensive human education and the construction of a just, democratic and inclusive society” (p. 18). The fifth competency addresses the “critical, meaningful, reflexive and ethical” (p.18) use of digital information and communication technologies. Associating ICT to such objectives means considering them as more than just devices for information and communication, but as part of the social, ethical, and aesthetic construction of being.
At the international level, goal 4 of the UN Sustainable Development Goals (SGDs),2 which seeks to “Ensure inclusive and equitable quality education and promote lifelong learning opportunities for all,” also recommends the development of ICT skills, as indicated in goal 4.4, regarding the number of youths and adults with relevant skills for employment.
To conserve the historical comparisons of the survey’s indicators and enable the inclusion of new indicators aligned with these new focus points involving technology in education, the Methodological Framework (CGI.br & UIS, 2016) established three dimensions for the analysis of the ICT in Education survey: access, use, and appropriation. Access is defined as the means of making ICT available to develop projects both inside and outside of schools, such as the use of mobile technologies to create learning environments. This dimension also includes aspects of public policy that enable the supply and use of ICT. Use involves how school actors, especially teachers and students, use ICT to gather information, produce knowledge, and create or improve the teaching and learning process. Finally, appropriation involves the production, mixing, and dissemination of knowledge.
2 Retrieved on August 27, from https://nacoesunidas.org/pos2015/agenda2030/

ICT IN EDUCATION SURVEY 2016ANALYSIS OF RESULTS198
EN
GLI
SH
Access, use, and appropriation form the basis for constructing the present analysis report on the indicators collected during the second half of 2016, data which are especially relevant to the development of policies. These dimensions are present in the three sections that compose this text:
• Policies for ICT in education – based on the objectives proposed in the main public policies for the implementation of ICT in schools, such as ProInfo, this section presents data regarding the scenario of ICT access and use in schools located in urban areas;
• Digital culture in schools – based on the perspective of digital culture inside and outside of schools, this section presents three emerging trends within the scope of ICT in education, based on three concepts: openness, ubiquity, and capacity-building;
• ICT in rural schools: preliminary considerations – based on one of the goals of the Methodological Framework (CGI.br & UIS, 2016), which refers to the expansion of the scope of the survey in 2017, when a pilot study was conducted with the goal of collecting indicators about ICT infrastructure and use in schools located in rural areas. This section presents some of the main findings.
At the end of this report, there is also a section with reflections about an agenda for ICT in education policies.
ICT IN EDUCATION POLICIES
Goal 7 of the National Education Plan (PNE) 2014-2024 aims to support the quality of Basic Education at all levels and in all modalities by improving student flow through the grade levels and increasing the national mean scores on the Index of Development of Basic Education (Ideb). ICT is included in of four the strategies defined to reach this goal. Strategy 7.12 refers to the development, selection, certification, and dissemination of educational resources at all levels of education. Strategy 7.15 concerns providing universal access to high-speed broadband and increasing the computer/student ratio in public schools. Strategy 7.20 refers to promoting the pedagogical use of ICT in schools, including making libraries with computers and Internet access universal in these institutions. Strategy 7.22 concerns computerizing public school management systems (Law no. 13.005, 2014, p. 61).
The data from the ICT in Education survey shows that progress has been made in the items cited by the PNE and, consequently, in the integration of technology into the teaching and learning processes. However, there are still challenges to overcome. The following selection of data presents these aspects from two points of view. The first shows indicators related to school infrastructure and the use of ICT by the school community. The second shows how educators view the integration of ICT into school routines.

MONITORING RURAL SCHOOLS
The pilot study conducted in 2016 with rural schools showed that 69% had at least one type of computer (desktop, portable or tablet). Thus, the main barriers to the use of these technologies in schools were still the availability of Internet infrastructure in the region and the cost of Internet connection.
INFRASTRUCTURE IS STILL A CHALLENGE FOR ICT APPROPRIATION
Despite differences in the perceptions of principals and directors of studies, both groups still mentioned infrastructure-related issues in both public and private schools as actions that should be given priority for the integration of ICT into the teaching and learning process.
ICT IN EDUCATION—
2016—
HIGHLIGHTS
THE USE OF MOBILE PHONES IN SCHOOL ACTIVITIES
The data confirms the upward trend in the use of mobile phones for carrying out general activities in addition to pedagogical activities. In 2016, 51% of public school students and 60% of private school students reported using mobile phones for school activities at their teacher’s request, data collected for the first time in this edition of the survey.
INTERNET IN THE SCHOOL
In 2016, 95% of public schools and 98% of private schools located in urban areas had at least one type of computer with Internet connection. Internet use in the classroom also presented a positive change in 2016, especially in public schools, growing from 43% in 2015 to 55%.

ICT IN EDUCATION SURVEY 2016ANALYSIS OF RESULTS200
EN
GLI
SH
CONNECTIVITY AND ACCESS TO ICT IN SCHOOLS
Regarding participation in programs that foster the implementation of technological infrastructure, the proportion of public schools in urban areas that participated in ProInfo (50%) has remained stable throughout the survey’s historical series since 2011. During this period, the proportion of public schools that said they participated in the Broadband in Schools Program (PBLE)3 increased, from 9% to 47%. Most schools mentioned ProInfo and PBLE, the two main federal government initiatives related to the implementation of infrastructure.
In recent years, the ICT in Education survey has indicated that the presence of computers is practically universal in Brazilian public and private schools located in urban areas. In 2016, 99% had at least one type of computer (desktop, portable or tablet). In the case of public schools, this reflects the oucomes of government policies that aim to supply ICT equipment to educational institutions.
Desktop computers are still the most common type of equipment present in schools: 98% had at least one of these devices (99% of public schools and 96% of private schools). It is also worth noting the increase in the presence of portable devices: 86% of public schools and 92% of private schools had portable computers in 2016, while in 2011, this proportion was 67% and 64%, respectively. Another highlight of the survey regards the presence of tablets. Data collection about the presence of this type of equipment in schools located in urban areas began in 2012, when only 2% of public schools and 7% of private schools had tablets, percentages that achieved 32% and 36%, respectively, in 2016.
Despite this scenario of universal presence of computers, they are not always accessible to students. According to the data from the ICT in Education 2016 survey, 18% of the schools that had computers did not make them available for students to use in educational activities.
The same reality was observed in terms of Internet use in the school environment. In 2016, 95% of public schools and 98% of private schools located in urban areas had at least one computer with Internet connection. Only 3% of the all schools had computers without Internet access: in 2016, this was the case for 4% of public schools and 2% of private schools. However, an analysis of the percentages of locations of Internet access reveals the prevalence of connected devices installed in administrative spaces, especially in public schools, as observed in Chart 1.
3 Retrieved on July 31, 2017, from http://portal.mec.gov.br/programa-saude-da-escola/193-secretarias-112877938/seed- educacao-a-distancia-96734370/15808-programa-banda-larga-nas-escolas

2016 ICT IN EDUCATION SURVEYANALYSIS OF RESULTS 201
EN
GLI
SH
CHART 1SCHOOLS BY LOCATION OF INTERNET ACCESS (2015 – 2016)Total number of schools with Internet access (%)
100
90
80
70
60
50
40
30
20
10
0 2015
PUBLIC SCHOOLS PRIVATE SCHOOLS
20152016 2016
93
77 76
4343
93
86
5559
72
92
7873
47
55
99
93
45
69
82
DIRECTOR OF STUDIES’ OR PRINCIPAL’S OFFICE
TEACHER’S ROOM OR MEETING ROOM
COMPUTER LAB
CLASSROOM
LIBRARY OR STUDY ROOM
Chart 1 also shows that Internet use in the classrooms of public schools increased between 2015 and 2016, from 43% to 55%. In private schools, two differences were observed: classrooms were the third most common location for Internet use (82%), while the least common were computer labs (45%).
Regarding locations in schools where teachers use the Internet in activities with students, the survey also showed a downward trend in the use of the computer labs when compared to 2015. Only 27% of public school teachers who used the Internet used computer labs with their students, a figure that was 35% in 2015. In the case of private school teachers, 28% reported using the Internet in computer labs in 2016, a percentage that had remained stable since 2015, with 29%.
Considering libraries, which are mentioned in goal 7, strategy 7.20 of the PNE, the percentages show a low level of relevance of Internet use in this location by teachers in activities with students. In 2016, 13% of public school teachers who were Internet users reported accessing the Internet in libraries, while among private school teachers, this percentage was 18%.

ICT IN EDUCATION SURVEY 2016ANALYSIS OF RESULTS202
EN
GLI
SH
There was a correlation between Internet use in locations inside within and the quality of connection speeds. As observed in previous editions of the survey, connection speeds available in urban Brazilian schools are still below what is required for the network to be used simultaneously by several devices in different locations, an issue that is still a challenge to achieving goal 7, strategy 7.15 of the PNE regarding universal access. In most of the schools, connection speeds were no higher than 4 Mbps (42%) in 2016. This reality was more critical among public schools – most (45%) had connection speeds up to 4 Mbps – than private schools – of which 59% had connection speeds higher than 5 Mbps. Furthermore, also noteworthy is the incidence of public school principals who were not aware of the main connection speed available at their school (30%), as already observed in other editions of the survey (Table 1).
TABLE 1SCHOOLS, BY MAIN INTERNET CONNECTION SPEED (2015 – 2016)Total number of schools with Internet access
(%)
Total schools Public schools Private schools
2015 2016 2015 2016 2015 2016
Up to 999 Kbps 5 5 7 6 1 0
1 to 2 Mbps 32 25 38 27 23 20
3 to 4 Mbps 11 12 12 12 9 11
5 to 10 Mbps 21 22 16 19 28 31
11 Mbps or more 10 11 4 6 24 28
Does not know / Did not answer 21 24 24 30 15 11
Considering the use of school management systems, addressed in strategy 7.22 of the PNE, data from the 2016 ICT in Education survey showed that using the Internet to carry out administrative tasks was a reality in most Brazilian schools (95%), with no significant differences between public and private institutions. The data also revealed that 74% of the total number of schools located in urban areas used school management systems: 69% of private and 76% of public schools. Differences were observed in terms of the use of these systems by region, with special mention of the Northeast: While the Center-West presented the highest percentage of urban schools that used school management systems (88%), followed by schools in the South (82%), Southeast (80%) and North (75%), this percentage was 59% in the Northeast.

2016 ICT IN EDUCATION SURVEYANALYSIS OF RESULTS 203
EN
GLI
SH
ICT IN SCHOOLS FROM THE POINT OF VIEW OF SCHOOL MEMBERS
In general, students viewed the use of ICT in classrooms by teachers in a positive light. No significant differences were observed between public and private school students; the only distinction observed was between levels of education and student age groups, as shown in Chart 2.
CHART 2STUDENTS, BY PERCEPTIONS OF IMPACTS OF ICT (2016)Total number of students (%)
100
90
80
70
60
50
40
30
20
10
0 Private 9th year of
Elementary Education
Public 5th year of Elementary Education
2nd year of Secondary Education
ADMINISTRATIVE JURISDICTIONTOTAL GRADE LEVEL
76
70
64
7772
63
81
73
65
76
70
64 65 6460
84
75
66
WHEN TEACHERS USE THE INTERNET, IT MAKES CLASSES NICER
WHEN TEACHERS USE THE INTERNET, LEARNING IS EASIER
WHEN TEACHERS USE THE INTERNET, I PAY MORE ATTENTION IN CLASS
Like students, principals, directors of studies and teachers also had a positive view of ICT use in pedagogical practices, especially in terms of access to more diversified and better-quality materials by teachers, adoption of new pedagogical methods, and greater collaboration among teachers. Carrying out administrative tasks more easily was emphasized by directors of studies in private schools and teachers in both public and private schools, even though “reduced teacher workload” was mentioned less frequently by all professionals. Furthermore, special mention goes to perceptions of teachers about the role of ICT in their relationships with students: ICT was seen as enabling them to customize students’ assessments and communicate with them more easily, as shown in Table 2.

ICT IN EDUCATION SURVEY 2016ANALYSIS OF RESULTS204
EN
GLI
SH
TABLE 2PRINCIPALS, DIRECTORS OF STUDIES, AND TEACHERS, BY PERCEPTIONS OF IMPACTS OF ICT ON PEDAGOGICAL PRACTICES (2016)Total number of principals, directors of studies, and teachers
2016(%)
Principals 1 Directors of studies Teachers
Public Private Public Private Public Private
Teachers gained access to more diversisty of better-quality materials 93 92 83 83 93 97
Teachers started using new teaching strategies 85 89 73 83 85 88
Teachers started collaborating more with colleagues in schools 81 83 73 89 79 81
Teachers carried out administrative tasks more easily 77 84 67 90 82 85
Teachers began communicating with teachers and experts from other schools 68 75 49 64 66 69
Teachers were able to customize students’ assessments 57 66 50 53 75 75
Teacher workloads decreased 34 37 28 30 54 57
Teachers communicated with students more easily – – – – 75 84
1 Answers to the “I agree” item.
The 2016 ICT in Education survey also presents data about the perceptions of principals, directors of studies, and teachers of the barriers to ICT use in schools. In general, the main barriers perceived by the three groups were centered more around issues associated with infrastructure than pedagogical activities, which indicates that problems related to ICT access in the Brazilian school context have not been overcome in neither the public nor private school systems, as shown in Table 3.
However, even though the perceived barriers to technology use are frequently related to infrastructure, issues relative to pedagogical practices also emerged among the priority actions for the integration of ICT in the teaching and learning process (Table 4). In addition to increased number of devices per student (32%), public school principals also mentioned the development of new teaching practices that involve the use of computers and the Internet (17%) – also a priority action for private school principals (36%) and directors of studies in both public (20%) and private schools (35%).

2016 ICT IN EDUCATION SURVEYANALYSIS OF RESULTS 205
EN
GLI
SH
TABLE 3PRINCIPALS, DIRECTORS OF STUDIES, AND TEACHERS, BY PERCEPTIONS OF BARRIERS TO ICT USE IN SCHOOLS (2016)Total number of principals, directors of studies, and teachers
2016(%)
Principals 1 Directors of studies Teachers
Public Private Public Private Public Private
Insufficient number of computers per student 77 47 77 52 77 42
Obsolete or outdated equipment 76 49 67 41 69 51
Low Internet connection speed 73 49 75 47 72 49
Lack of technical support or equipment maintenance 70 46 69 33 66 43
Insufficient number of computers connected to the Internet 71 42 74 38 75 45
Lack of pedagogical support for teachers to use computers and the Internet 54 27 34 22 41 20
Pressure or lack of time to cover the curricula 42 21 39 24 42 30
Pressure to achieve good performance appraisals 27 23 26 10 34 12
Lack of specific training for computer and Internet use in the classroom – – – – 53 31
1 Answers to the “Strongly hinders” item.
TABLE 4PRINCIPALS AND DIRECTORS OF STUDIES BY PRIORITY ACTIONS TO INTEGRATE COMPUTER AND INTERNET USE INTO PEDAGOGICAL PRACTICES (2016)Total number of principals and directors of studies
2016(%)
Principals Directors of studies
Public Private Public Private
Increasing the number of computers per student 32 16 22 18
Developing new teaching practices that involve computer and Internet use 17 36 20 35
Improving teacher technical skills and competencies in the use of these technologies 19 22 21 17
Increasing the speed of Internet access 13 10 14 8
Increasing the number of computers connected to the Internet 13 6 16 13
Improving student technical skills and competencies in the use of these technologies 3 5 5 8

ICT IN EDUCATION SURVEY 2016ANALYSIS OF RESULTS206
EN
GLI
SH
DIGITAL CULTURE IN SCHOOLS
As observed in the first section of this report, many challenges must still be overcome before the effective integration of technologies into school routines, especially the expansion and improvement of the quality of access to devices and networks, primarily for use by teachers and students in teaching and learning activities. However, that is not to say that schools are isolated and are not influenced by digital culture. Educators and students end up integrating technology spontaneously into pedagogical activities developed both inside and outside of schools.
This section presents data about how students and teachers appropriate technology, from the perspective of the three concepts that characterize digital culture: ubiquity, openness, and digital skills and competencies.
UBIQUITY: THE USE OF MOBILE DEVICES IN LEARNING
Ubiquity relates to the presence and use of digital media and technology anytime and anywhere, making it omnipresent, global, and pervasive. The concept refers not only to devices that enable ubiquitous computer-based technology, such as mobile devices (mobile phones, tablets, notebooks), but also to applications and services provided over the Internet (cloud computing), instant access to information, and social networks that allow users to interact with people in different places and at different times, among other resources (Almeida, 2016).
The intensity with which ubiquitous computer-based technology is integrated into daily life ends up reshaping how individuals think and how they interact with knowledge, people, the environment, and work, influencing their relationship with learning. That is the origin of the concept of mobile and ubiquitous learning (Almeida, 2016; Santaella, 2010).
One reflection of ubiquity in the educational context can be observed in the results of the 2016 ICT in Education survey. The data confirmed the growth trend in Internet access via mobile phones for general use and to carry out school activities, among both teachers and students.
Mobile phones were the main device used to access the Internet for 77% of students who used the Internet, while in 2015, this proportion was 73%. Primary Internet access through other equipment, such as desktop computers (9%) and notebooks (6%) presented a downward trend. Chart 3 illustrates the emphasis given to mobile phones in the last two editions of the survey.
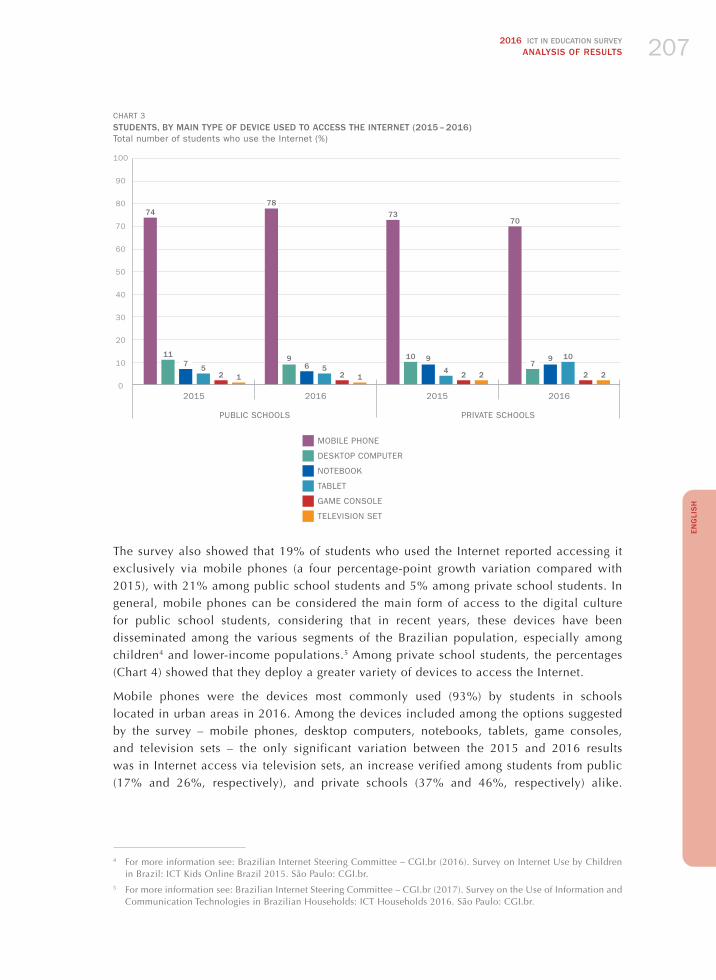
2016 ICT IN EDUCATION SURVEYANALYSIS OF RESULTS 207
EN
GLI
SH
CHART 3STUDENTS, BY MAIN TYPE OF DEVICE USED TO ACCESS THE INTERNET (2015 – 2016)Total number of students who use the Internet (%)
100
90
80
70
60
50
40
30
20
10
0 2015
PUBLIC SCHOOLS PRIVATE SCHOOLS
20152016 2016
74
11
572 1
73
10
4
9
2 2
78
956
2 1
70
7109
2 2
MOBILE PHONE
DESKTOP COMPUTER
NOTEBOOK
TABLET
GAME CONSOLE
TELEVISION SET
The survey also showed that 19% of students who used the Internet reported accessing it exclusively via mobile phones (a four percentage-point growth variation compared with 2015), with 21% among public school students and 5% among private school students. In general, mobile phones can be considered the main form of access to the digital culture for public school students, considering that in recent years, these devices have been disseminated among the various segments of the Brazilian population, especially among children4 and lower-income populations.5 Among private school students, the percentages (Chart 4) showed that they deploy a greater variety of devices to access the Internet.
Mobile phones were the devices most commonly used (93%) by students in schools located in urban areas in 2016. Among the devices included among the options suggested by the survey – mobile phones, desktop computers, notebooks, tablets, game consoles, and television sets – the only significant variation between the 2015 and 2016 results was in Internet access via television sets, an increase verified among students from public (17% and 26%, respectively), and private schools (37% and 46%, respectively) alike.
4 For more information see: Brazilian Internet Steering Committee – CGI.br (2016). Survey on Internet Use by Children in Brazil: ICT Kids Online Brazil 2015. São Paulo: CGI.br.
5 For more information see: Brazilian Internet Steering Committee – CGI.br (2017). Survey on the Use of Information and Communication Technologies in Brazilian Households: ICT Households 2016. São Paulo: CGI.br.

ICT IN EDUCATION SURVEY 2016ANALYSIS OF RESULTS208
EN
GLI
SH
Second to mobile phones, desktop computers were the devices most commonly used by public school students to access the Internet. Among private school students, the second most commonly used devices were notebooks.
CHART 4STUDENTS, BY DEVICES USED TO ACCESS THE INTERNET (2015 – 2016)Total number of students who use the Internet (%)
100
90
80
70
60
50
40
30
20
10
0 2015
PUBLIC SCHOOLS PRIVATE SCHOOLS
20152016 2016
90
45
21
54
17
34
1
93
68
39
64
37
52
0
93
43
24
50
2631
0
93
67
39
60
46
54
1
MOBILE PHONE
DESKTOP COMPUTER
NOTEBOOK
TABLET
TELEVISION SET
GAME CONSOLE
OTHER DEVICE
The survey also revealed that private school students had more devices in their households, especially mobile devices. In 2016, among public school students, 43% had desktop computers at home, 40% had portable computers, and 32% had tablets. Among private school students, these percentages were higher: 60% had desktop computers, 72% had portable computers, and 62% had tablets.
The role played by mobile phones in the digital inclusion of these children is undeniable, enabling access to educational, cultural, government, health, and other resources and services, especially when connected to the Internet. Additionally, the availability of devices allows users greater autonomy than relying exclusively on access through computers in schools, libraries, and other public access centers, which has the potential to impact their level of engagement with technology use. The development of digital skills and competencies is strongly related to quality of access. Users who are able to use different types of devices also have more opportunities to become familiar with different languages than users who only access the Internet through mobile phones (Hargittai, 2010; boyd, 2014).

2016 ICT IN EDUCATION SURVEYANALYSIS OF RESULTS 209
EN
GLI
SH
It is important to emphasize that even though 85% of students in urban schools in Brazil were Internet users in 2016 (i.e., reported using the Internet at least once in the three months prior to the survey), there was still a considerable number of students who had used the Internet more than three months prior to the survey or who had never accessed the Internet at all. The North region presented the highest percentage (29%) of students from schools in urban areas who were not Internet users, also a reality in the other regions: Northeast (18%), South (14%), Center-West (12%), and Southeast (11%).
The data about ownership of devices reinforce the relevance of public schools and policies for ICT access in these institutions to bridge the digital divide. For a significant portion of Brazilian children (for example, 30% of public school students located in urban areas do not have any type of computer in the household), schools can represent an important option for ICT access.
However, even though the data indicates intensive use of mobile phones among students, the 2016 ICT in Education survey revealed that such devices have not been appropriated by the school. In Brazil, several municipal and state school systems6 prohibit their use in classrooms, sometimes encompassing all school facilities. The results of the survey confirmed this scenario: only 5% of public school students and 9% of private school students said they were allowed to use mobile phones in classrooms.
Coupled with these results is the unavailability of access to school Wi-Fi networks for student use. Even though the data from schools in urban areas with Internet access showed an increase in the number of institutions with wireless networks, the proportions of students that could access them remained at the same levels as those observed in 2015: most schools, both public and private, that had Internet access (61% total) did not allow students to use their Wi-Fi networks (Chart 5).
CHART 5SCHOOLS, BY RESTRICTIONS ON USE OF WIRELESS CONNECTIONS (2015 – 2016)Total number of schools with Internet access (%)
FREELY USED BY ALL, INCLUDING STUDENTS
RESTRICTED USE AND PASSWORDS NOT GIVEN TO STUDENTS
RESTRICTED USE AND PASSWORDS GIVEN TO STUDENTS
SCHOOLS WITHOUT Wi-Fi
2015
2016
1009080706050403020100
10 61 17 13
10 61 21 8
6 Currently, mobile phone use is prohibited by municipal law in Recife (Pernambuco) and by state laws in the states of Ceará, Federal District, Minas Gerais, Rio de Janeiro, Rio Grande do Sul, Santa Catarina and São Paulo. In Santa Catarina, a bill has been proposed to modify the current legislation, to allow the use of mobile phones in pedagogical activities. Retrieved on August 3, 2017, from http://dc.clicrbs.com.br/sc/estilo-de-vida/noticia/2017/03/projeto-de-lei-propoe-liberar-uso-do-celular-em-sala-de-aula-em-sc-9744782.html In October 2017, the Legislative Assembly of the State of São Paulo had approved the draft Law 860/2016, which proposed to make the use of mobile phones more flexible by the students of the state public school system, during school hours. The bill would still go through the governor’s sanction. Retrieved on October 26, 2017, from https://www.al.sp.gov.br/propositura/?id=1000021658

ICT IN EDUCATION SURVEY 2016ANALYSIS OF RESULTS210
EN
GLI
SH
As an alternative to Internet use in the school environment, students use their own resources: 27% of students who were Internet users reported using 3G or 4G networks on their own mobile phones (22% in 2015), and 11% used the 3G or 4G networks of other people (8% in 2015).
To deepen the discussion about the presence of mobile phones in the teaching and learning processes, the 2016 survey began gathering information about the use of these devices in school activities under teacher guidance. This indicator showed that for 52% of students, the use of mobile phones to carry out school activities had already been requested by some of their teachers, a percentage that reached 51% of public school students and 60% of private school students. Regarding this practice, the only difference was observed among grade levels: the indicator reached the proportion of 74% among students in the 2nd year of Secondary Education, 59% among students in the 9th year of Elementary Education, and only 27% of students in the 5th year of Elementary Education.
Regarding teachers, access to the Internet via mobile phones presents progressive growth. In 2011, 15% of teachers who used the Internet reported accessing it via mobile phones, a percentage that jumped to 91% in 2016. Among teachers who used the Internet, 49% reported using the Internet via mobile phones to develop activities with their students; in 2015, this percentage was 39%. This growth was verified with greater or smaller variations among teachers in all age groups in public and private schools, as shown in Chart 6.
CHART 6TEACHERS WHO ACCESSED THE INTERNET VIA MOBILE PHONES IN ACTIVITIES WITH STUDENTS (2015 – 2016)Total number of teachers who are Internet users (%)
100
90
80
70
60
50
40
30
20
10
0 Private schools
31 to 45 years old
46 years old or older
9th year of Elementary Education
Public schools
Up to 30 years old
5th year of Elementary Education
2nd year of Secondary Education
ADMINISTRATIVE JURISDICTION
AGE GROUPTOTAL GRADE LEVEL
39
49
43
51
46
61
35
61
36
46
32
43
37
56
3842 42 41
2015 2016

2016 ICT IN EDUCATION SURVEYANALYSIS OF RESULTS 211
EN
GLI
SH
OPENNESS: THE USE OF OPEN EDUCATIONAL RESOURCES BY TEACHERS
The concept of openness in the educational context emerges from the search for ways of overcoming barriers, not only to access in schools, but also to quality education. It also involves the universalization of knowledge, equity and freedom to sustainably engage in lifelong learning. These do not necessary depend on technological developments, but can be enhanced by them (Santana, Rossini, & Pretto, 2013).
Open educational resources include digital learning content and support tools for its development (including the use of these elements), in addition to the necessary resources to make content freely and openly available (Dutra & Tarouco, 2007). The term was coined in 2002, during the UNESCO Forum on the Impact of Open Courseware in Higher Education, to designate:
[…] teaching, learning and research materials in any medium, digital or otherwise,
that reside in the public domain or have been released under an open license that
permits no-cost access, use, adaptation and redistribution by others with no or limited
restrictions. Open licensing is built within the existing framework of intellectual
property rights as defined by relevant international conventions and respects
the authorship of the work. (United Nations Educational, Scientific and Cultural
Organisation [UNESCO], 2012).
Since 2014, the ICT in Education survey has investigated the use of open educational resources by teachers. This has been examined by collecting information about use of certain digital content, access to specific platforms for research, redistribution of materials produced, and to what extent teachers interact with open resources for lesson planning.
The 2016 survey revealed that tests and evaluations (85%), varied texts (83%), images, figures, illustrations or photos (82%), news (79%), films and animation (59%), lists with reading suggestions (55%), and video classes (52%) were the digital content most commonly used by teachers to prepare lessons. For most items, the percentages of use of the resources investigated by the survey presented relevant differences between the practice of private and public school teachers. The exception was lesson plans obtained from the Internet, which were used more by public school teachers (58%) than by those working in private schools (36%). This may be because private schools generally adopt course materials from education systems, which invariably contain orientation and lesson plans.
Regarding the options for platforms used to access the content suggested by the survey, social networks stand out, such as Facebook and Twitter, which were mentioned by 25% of teachers who used the Internet. However, school websites (68%), teacher blogs (71%), the Ministry of Education Teacher’s Web Portal (61%), magazine or newspaper websites (59%), publishers’ websites (56%), and digital encyclopedias, such as Wikipedia (52%) were still the resources most commonly used by educators.

ICT IN EDUCATION SURVEY 2016ANALYSIS OF RESULTS212
EN
GLI
SH
Only 17% of teachers reported having used resources from the Internet without making any changes to them. Eighty-seven percent reported having downloaded or copied content and modified it and, in a similar proportion, 82% said they had created new content by combining different materials obtained from the Internet.
The data also showed that only 27% of public school teachers and 30% of private school teachers who used the Internet had published or posted content produced for their classes or activities with students on the Internet (Table 5). The results indicated that information is still generally shared by close networks of peers, since 72% of the teachers who used the Internet said they had shared educational materials with colleagues.
TABLE 5TEACHERS, BY WAYS OF USING RESOURCES OBTAINED ON THE INTERNET TO PREPARE CLASSES OR ACTIVITIES WITH STUDENTS AND PUBLISHING RESOURCES PRODUCED VIA ICTTotal number of teachers who use the Internet
(%) Public Private
Using Internet resources Teachers who used resources obtained from the Internet 96 99
What was done with the resources
Download or copy content and modify it 87 86
Create new content by combining different materials 81 84
Use content without modifying it 16 19
Modify the content on the website 12 7
Sharing resources Teachers who shared the content they produce 27 30
SKILLS AND COMPETENCIES: BEYOND ACCESS, THE APPROPRIATION OF TECHNOLOGIES IN THE TEACHING AND LEARNING PROCESSES
The third version of the National Core Curriculum (MEC, 2017), which was based on discussions in the National Education Council, includes in its scope the use of “digital communication and information technologies in a critical, meaningful, reflective and ethical way in the various practices of daily life (including that of schools) when communicating, accessing, and disseminating information, producing knowledge, and solving problems” (p. 18). For this competency to be fully developed, it is not enough to merely provide schools with infrastructure and give school communities access to technologies. Individuals must appropriate these technologies and understand how they work, enabling the creation of new uses and ensuring enjoyment of their benefits by individuals and communities.

2016 ICT IN EDUCATION SURVEYANALYSIS OF RESULTS 213
EN
GLI
SH
This discussion is occurring increasingly in research about the use of ICT by the population in general, especially in the context of education, because of its influence in forms of teaching and learning. The ICT in Education survey gathers data about ICT skills by investigating activities carried out by teachers and students, both inside and outside of schools, for entertainment and in pedagogical practices.
The activities carried out most intensely by students who used the Internet were searching for information using search engines (87%), watching videos (85%), using communication tools such as chat on Facebook or WhatsApp (62%), and following pages on social networking websites (64%). Activities that require specific technical skills, such as editing documents on the Internet (24%), and posting films or videos on digital platforms (13%) were less common.
Furthermore, following along with the trend observed in 2015, social networks have continued to play an important role in doing schoolwork and assignments. Among the options suggested by the survey, WhatsApp (54% of public school students and 63% of private school students) and Facebook (35% of public school students and 31% of private school students) were the social networks most commonly used for this purpose in 2016.
Similar to students, the most common online activities carried out by teachers were using search engines to search for information (98%), sending instant messages (94%), sending e-mails (91%), and participating in social networks (87%). A lower proportion of teachers carried out activities that go beyond searching for information and communicating and involve other types of ICT skills: 38% said they posted films or videos on the Internet, 31% created or updated blogs, and 28% used the Internet to make phone calls or chat through Skype.
If it is undeniable that, outside of the school context, students and teachers use ICT in their daily lives to carry out a wide range of activities, in the educational context, ICT use is still strongly centered on instrumental activities, such as searching for information, for both audiences. School research, theme assignments, group work and doing homework assigned by teachers were the most common activities carried out by students who used the Internet, percentages that did not vary significantly between public and private school students. An exception was using the Internet to contact teachers, which was more common among private school students (49%) than public school students (36%), as shown in Chart 7.
How students interact with learning activities is closely related to how they are used in schools. The activities most cited by students corroborated those reported by teachers within the scope of pedagogical practices.
Among the activities carried out by teachers with the use of ICT, the most common was giving lectures (52%). Other forms of use that better tap into the potential of these technologies in terms of authorial and autonomous production of knowledge, enabling greater appropriation of these resources, were cited by a lower proportion of teachers: 33% promoted debates or presentations with students, 26% exercised reading comprehension with students, and 21% used educational games with students.

ICT IN EDUCATION SURVEY 2016ANALYSIS OF RESULTS214
EN
GLI
SH
CHART 7STUDENTS, BY INTERNET USE IN SCHOOL ACTIVITIES (2016)Total number of students who use the Internet (%)
49
24
57
61
74
81
85
83
89
92
93
96
76
24
36
58
60
82
Taking part in online courses
Talking to the teacher
Educational games
Presentations to classmates
School projects with classmates online
Homework and exercises assigned by the teacher
Group assignments
Theme assignments
School research
PUBLIC SCHOOLS PRIVATE SCHOOLS
1009080706050403020100
CHART 8TEACHERS, BY ACTIVITIES CARRIED OUT WITH STUDENTS (2016)Total number of teachers who are Internet users (%)
80
18
21
50
77
33
80
41
93
42
93
29
98
40
99
90
34
32
26
82
52
48Developed spreadsheets
and charts with the students
Worked with educational games with students
Requested texts, drawings or maquettes
Searched in books and magazines with students
Promoted debates or presentations with students
Conducted reading comprehension activities with students
Requested theme assignments
Gave lectures
Requested group assignments
Answered questions of some students
Requested assignments
ACTIVITIES CARRIED OUT USING ICT ACTIVITIES CARRIED OUT
1009080706050403020100

2016 ICT IN EDUCATION SURVEYANALYSIS OF RESULTS 215
EN
GLI
SH
Within the context of development of ICT skills, since 2015, the ICT in Education survey has investigated types of guidance provided by teachers to students about Internet use in their personal and school activities. The results for 2016 showed that, according to most students, teachers told them what websites they should use to complete schoolwork (61%) or helped them use the Internet to complete homework or assignments (53%). In lower proportions, teacher mediation was observed in items such as showing students how to use the Internet safely (44%) and providing guidance if something bothered students on the Internet (33%) – indicating that teachers placed less emphasis on aspects related to the risks associated with Internet use.
Teachers play an essential role in developing the potential of technologies in the educational context, and in preparing students to analyze when and how to use them for their intellectual, ethical, social, and cultural growth. However, teachers are not always prepared to handle issues presented by the digital culture in classrooms, an aspect that points to the importance of teacher training for the integration of technology into education.
In terms of initial training, less than half of the teachers (43%) reported having specific subject on how to use computers and the Internet in activities with students during their Tertiary Education, a percentage that was similar between public and private school teachers in urban areas. Among those with degrees in education, this proportion was 8%, the same as that observed among those with degrees in mathematics, while among those with language teaching degrees, this percentage was 25%.
With regard to this type of course work in terms of continuing education, this scenario did not differ much: 34% of educators – in both public and private schools – had attended some form of training about the use of computers and Internet in the 12 months prior to the survey. The percentage of directors of studies whose schools had conducted some form of continuing education courses about the topic showed a downward trend. In 2015, 38% of directors of studies in public schools and 53% in private schools reported having carried out training activities about ICT with teachers, percentages that in 2016 fell to 33% and 44%, respectively.
INFORMATION AND COMMUNICATION TECHNOLOGIES IN RURAL SCHOOLS
PUBLIC POLICY AND RURAL EDUCATION
One of the actions provided for in the Methodological Framework for the Measurement of the Access and Use of Information and Communication Technologies (ICT) (CGI.br & UIS, 2016) is expanding the scope of data collection conducted by the ICT in Education survey to include schools in rural areas. To study the context of these institutions and how to best approach these school communities, a pilot study was conducted between October and December 2016 with 602 rural schools.
Rural schools are those whose headquarters are located in geographic areas classified as “rural” by the Brazilian Institute of Geography and Statistics (IBGE), in addition to those that identify themselves as rural, even when they are in areas considered urban. This includes institutions that cater to the populations of municipalities with rural-based economic, social, and cultural production (MEC, 2007).

ICT IN EDUCATION SURVEY 2016ANALYSIS OF RESULTS216
EN
GLI
SH
The document Rural Education: Differences Changing Paradigms (Brazilian Ministry of Education, 2007) provides an important framework for understanding the principles and ideals that underpin public policies that target rural education. It posits the need to change the rural education paradigm from one that is linked with “proposals for agricultural development, generally centered around agribusiness and the indiscriminate exploitation of natural resources” to one that is related to concepts of sustainability and diversity, considering the relationship between people and nature, and “environmental, agricultural, agrarian, economic, social, political, and cultural sustainability,” in addition to gender, ethnic-racial, and intergenerational equity and sexual diversity” (p. 13).
This means overcoming the idea of geographic area and recognizing the importance of “the cultural needs, social rights, and comprehensive education of individuals” (p. 9), acknowledging that rural populations are entitled to quality education. This is in terms, not only of the nationwide goal of universal education, but also the need to respect rural particularities and culture and consider rural ways of living, thinking and producing when constructing the curriculum and educational policies.
The Federal Constitution of 1988 had already presented this change in paradigm when it provided for access to education in schools as a democratic principle, but it understood rural education as a specific segment with its own social and pedagogical particularities (Constitution of the Federative Republic of Brazil, 1988). The Law on Brazilian Education Guidelines and Bases (LDB), of December 20, 1996, reaffirmed the Constitution of 1988, recognizing in its articles the right to equality and recognition of differences. This legislation allows the creation of operational guidelines specific to rural education, in which educational content, structure and methodologies are tailored to the learning processes of students and the specific dynamics of rural life, while still conforming to the national education project (Law on Brazilian Education Guidelines and Bases, Law no. 9.394, 1996). Because of these principles, rural schools can now adopt their own organizational system: Classes can be made up of students of different ages and levels of knowledge related to the same grade level, and school calendars can be adjusted to the agricultural cycle and weather conditions.
Regarding access to ICT, the main public policy is the National Programme for Rural Education (Pronacampo),7 whose development was based on Decree no. 7.352, of November 4, 2010. Its objective is to apply a set of actions to help expand access to and quality of Basic and Tertiary Education in rural areas, foster student retention, improve learning, and acknowledge the perspectives of rural populations. The program is based on four axes: pedagogical management and practices; initial and ongoing teacher training; youth and adult education and vocational training; and physical and technological infrastructure.
Since part of the general objective is to overcome the gap in access to school education among rural populations, the goal set forth in item 4 of the decree is to contribute to “digital inclusion by expanding access to computers, the World Wide Web of computers, and other digital technologies, benefitting school communities and neighboring rural populations” (Decree no. 7.352, 2010).
7 Retrieved on August 27, from http://pronacampo.mec.gov.br/10-destaque/2-o-pronacampo

2016 ICT IN EDUCATION SURVEYANALYSIS OF RESULTS 217
EN
GLI
SH
These actions were ratified by Ordinance no. 68, of November 9, 2012, which integrated rural schools into ProInfo through Pronacampo, and Ordinance no. 86, of February 1, 2013, which presented simpler text about the actions of Pronacampo than Decree no. 7.352. However, in terms of access to technologies, in article 8, item II, the ordinance makes reference to the “promotion of digital inclusion by expanding access to computers and digital technologies.”
According to data presented in the 2016 Basic Education School Census (Anísio Teixeira National Institute for Educational Studies and Research [Inep], 2017), even though 33.9% of Brazilian schools were located in rural areas, they corresponded to only 11.4% of enrollments (5.6 million), unequally distributed among the country’s regions. For example, while “in the state of Maranhão, 34.4% of enrollments occur in rural areas, in the state of São Paulo, this number does not reach 2%.” There are 4,500 schools in rural settlement areas, 2,400 in quilombola areas, and 3,100 on indigenous land.
Of the total number of teachers, 12.9% worked in rural schools and 2.8% worked in both urban and rural schools. Among the total number of schools with classes in the initial years of Elementary Education, 19,900 had only one teacher, and of these, 95.1% were located in rural areas.
Secondary Education schools in rural areas represented the lowest percentage of all Basic Education (10.2%). In general, 91.2% of enrolled students attended schools with libraries or reading rooms; in rural areas, this figure dropped to 66.8%, with 35.4% of students enrolled in the initial years of Elementary Education, 54.1% of those enrolled in the final years of Elementary Education, and 66.8% of those in Secondary Education.
The data collected in the pilot study conducted with rural schools, which will be presented in this section represents a first step toward defining the influence of public policies on ICT access in these institutions.
SAMPLE AND DATA COLLECTION METHODOLOGY
As part of the 2016 ICT in Education survey, a pilot study was conducted with schools located in areas defined as rural by the School Census. The interviews were conducted using computer-assisted telephone interviewing (CATI).
In the first stage, the sample was stratified by region and included 5,000 public and private schools, excluding federal schools. Their telephone numbers were looked up in the registries of the Anísio Teixeira National Institute for Educational Studies and Research (Inep). In 74% of cases, at least one telephone number was found.
The second stage consisted of extracting a stratified sample by region of 2,000 schools with telephone numbers, derived from the previous sample of 5,000, to conduct the interviews. The questionnaires were administered with school principals or those responsible for the institutions, and the response rate was 30%, or 602 interviews.
In the data processing phase, the first adjustment for nonresponse was conducted within each stratum, so that the answers could be valid for the total number of schools. Based on the comparison of some of the variables present in the School Census, a logistic model was used to adjust the estimates, including the following variables: region, presence of the Internet according to Inep, and presence of computers according to Inep. These adjustments helped

ICT IN EDUCATION SURVEY 2016ANALYSIS OF RESULTS218
EN
GLI
SH
minimize differences that could be attributed to the profile of the schools that did not provide interviews; because they did not have telephone lines, it could be inferred that they had less solid technological infrastructure.
INDICATORS OF TECHNOLOGY IN RURAL SCHOOLS
The data from the pilot study conducted in rural schools indicated that most institutions cited ProInfo (22%) and the Broadband in Schools Program (PBLE) (20%) as the main public policy programs in which they participated.
Similar to principals and directors of studies located in urban areas, those responsible for rural schools also mentioned aspects related to infrastructure as priority actions for the integration of computers and the Internet into teaching practices, such as increasing the number of computers connected to the Internet (26%) and the number of computers per student (25%). However, there was also concern about developing new teaching practices involving computer and Internet use (22%).
Indicators relative to teacher training revealed that this was one of the main barriers to the integration of technologies into teaching and learning practices that was cited by rural schools. In the 12 months prior to the survey, 84% of schools had not carried out any training programs with teachers for computer and Internet use in pedagogical activities.
Barriers related to infrastructure also appeared in the data about the perceptions of those responsible for schools about barriers to ICT use, as shown in Table 6.
TABLE 6PERSON RESPONSIBLE FOR SCHOOL, BY PERCEPTION OF BARRIERS TO ICT USE IN SCHOOLS (2016)Total number of persons responsible for schools
(%)Strongly hinders
Hinders Does not hinder
Does not apply to this
school
Does not know
Did not answer
Low Internet connection speed 69 15 6 9 1 1
Insufficient number of computers connected to the Internet 68 17 7 7 1 1
Lack of technical support or equipment maintenance 66 19 8 7 1 0
Insufficient number of computers per student 64 21 7 7 1 0
Obsolete or outdated equipment 58 23 10 7 1 1
Lack of pedagogical support for teachers to use computers and the Internet 49 32 11 6 1 0
Pressure or lack of time to cover the curricula 39 35 20 5 1 0
Pressure to achieve good performance appraisals 28 39 23 9 1 1

2016 ICT IN EDUCATION SURVEYANALYSIS OF RESULTS 219
EN
GLI
SH
More than half of the total number of schools located in rural areas (69%) had at least one type of computer, of which 61% had desktop computers, 35% had portable computers or notebooks, and 8%, tablets. However, 25% of schools with computers did not make them available to students.
Regarding Internet access, the percentage of rural schools with at least one type of computer with access to the Internet was lower (45%) than schools with computers, being that 24% of schools had computers that were not connected to the Internet. Table 7 summarizes the data about the number of functioning computers owned, computers with Internet access, and computers made available to students:
TABLE 7RURAL SCHOOLS, BY NUMBER OF FUNCTIONING COMPUTERS, THOSE WITH INTERNET ACCESS, AND THOSE AVAILABLE FOR STUDENT USE IN PEDAGOGICAL ACTIVITIES (2016)Total number of rural schools
(%)
Desktop computers
None Up to 5 computers
6 to 20 computers
21 computers
or more
Does not apply
Functioning computers 6 38 15 2 39
Computers with Internet access 18 27 9 1 44
Computers available to students 20 23 12 1 44
(%)
Portable computers and notebooks
None Up to 5 computers
6 to 20 computers
21 computers
or more
Does not apply
Functioning computers 0 33 2 0 65
Computers with Internet access 9 25 1 0 65
Computers available to students 19 16 1 0 65
(%)
Tablets
None Up to 5 computers
6 to 20 computers
21 computers
or more
Does not apply
Functioning computers 1 4 2 1 92
Computers with Internet access 2 3 1 1 93
Computers available to students 5 1 1 0 93
Internet connection speed is also an important barrier to be overcome by rural schools: almost half of the institutions had connection speeds of up to 2 Mbps (47%), as shown in Table 8. Also noteworthy was the finding that 37% of those responsible for the institutions were not aware of the main connection speed available in their schools. Furthermore, among schools with at least one computer with Internet access (45%), 68% also had wireless Internet connections.

ICT IN EDUCATION SURVEY 2016ANALYSIS OF RESULTS220
EN
GLI
SH
TABLE 8RURAL SCHOOLS, BY MAIN INTERNET CONNECTION SPEED (2016)Total number of rural schools
(%) TOTAL
Up to 256 Kbps 11
257 Kbps to 999 Kbps 7
1 Mbps 14
2 Mbps 15
3 to 4 Mbps 8
5 to 8 Mbps 5
9 to 10 Mbps 2
11 to 20 Mbps 0
21 to 50 Mbps 1
51 Mbps or more 0
Does not know 37
Did not answer 0
Among the reasons for not using the Internet, special mention goes to lack of infrastructure in the region where the schools are located (16%). High cost of connection was the second most common reason (10%). Percentages by region also varied (Table 9). In the ICT Households 2016 (CGI.br, 2017) survey, 60% of the households in rural areas without access to the Internet also mentioned high cost as the main reason for not using the Internet and 47% mentioned lack of Internet availability in the region. The data from both surveys point to the two main challenges that must be overcome by public policies to expand digital inclusion of the rural population.
TABLE 9RURAL SCHOOLS, BY REASONS FOR NOT USING THE INTERNET (2016)Total number of rural schools
(%)
School does not need the Internet
High cost of Internet connection
Lack of infrastructure for Internet access in the region
Cost-benefit ratio was
not worth it
Lack of skills
of school employees
School is not
interested
Concern with
security or privacy
Other
TOTAL 7 10 16 4 4 6 4 1
REG
ION
North 10 12 20 3 4 6 5 2
Center-West 0 1 3 1 3 1 1 1
Northeast 8 12 19 4 6 8 5 1
Southeast 5 7 13 5 1 4 3 2
South 1 3 4 1 1 1 1 0

2016 ICT IN EDUCATION SURVEYANALYSIS OF RESULTS 221
EN
GLI
SH
Only 29% of rural schools had computer labs, and of these, 24% had desktop computers installed, but only 16% had Internet access in their locations. Similar to urban schools, priority seemed to go to administrative spaces, such as school coordination and administrative offices, as shown in Table 10.
TABLE 10RURAL SCHOOLS, BY LOCATION OF DESKTOP COMPUTERS INSTALLED AND INTERNET ACCESS (2016)Total number of rural schools
(%)
Computer lab Library or study room
Classroom Teachers’ room or
meeting room
Directors of studies
or principals’ office
Location of installed desktop computers 24 11 8 18 23
Location with Internet access 16 13 16 17 23
FINAL CONSIDERATIONS: AN AGENDA FOR PUBLIC POLICIES
The seven editions of the ICT in Education survey provide a set of consistent data about the infrastructure and use of technologies in Brazilian education, which can serve as a framework for reviewing and creating public policies for the sector. As the survey’s historical series has added to the density of the data collected, progress can be observed; at the same time, some challenges persist. For example, in 2014, the study highlighted the relative stagnation in the progress of the presence of Wi-Fi networks in schools. The data from 2016 revealed significant expansion in the presence of Wi-Fi signal in schools. However, barriers still exist, such as low connection speeds, which hinder the simultaneous use of the network by multiple devices, and unavailability of Wi-Fi access to students.
Apart from infrastructure, restricting students’ access to the Internet may also be related to concerns in school communities about the risks of technology use by children, especially in the school environment. Mobile phones have consolidated their leading position as the main form of Internet access among children. Data from the survey showed that teachers use these devices quite often; they also request that students use their mobile phones to carry out activities. However, there are still laws that regulate the use of these devices in schools, and there are also public and private schools that restrict their use in classrooms.
Teacher training on the use of ICT in activities with students is another topic that has been consolidated over the last few years of the survey. Since 2014, the results have shown the need for training, both initial and continuing, to help educators in the process of appropriating ICT, not only as pedagogical tools, but also as instruments that encourage the creation and production of new knowledge and new spaces for learning. However, the 2016 edition pointed to a reduction in the percentage of directors of studies who said that continuing education actions for this purpose had been promoted by their schools.
ICT IN EDUCATION SURVEY 2016ANALYSIS OF RESULTS222
EN
GLI
SH
One of the greatest challenges faced by public policies in Brazil is to achieve the balanced convergence of its actions and investments within the scope of infrastructure, the production and supply of educational resources, teacher training, and the consistent and continuous development of competencies.
In a reference study about initiatives developed in Brazil in the field of technology and education, Almeida and Valente (2016) highlighted the discontinuity of policies, in addition to their lack of coordination, which hinders balanced and convergent actions that fully enable advancements in the process of ICT appropriation in education.
In their study, Almeida and Valente proposed Four in Balance (Kennisnet, 2015), a model that has been applied to the Dutch educational system. The model proposes the adoption of policies for ICT use and appropriation that focus on constructing a system that strikes the right balance between four basic dimensions: vision (clearly defined institutional aims regarding expectations for ICT use in education); infrastructure (the infrastructure conditions necessary to use ICT in teaching and learning contexts); content and applications (providing educational resources that allow teachers and students to develop ICT use integrated with the curriculum); and expertise (didactic ICT use, knowing why and how to use them).
The authors proposed a fifth dimension for Brazil, a cross-sectional axis, which encompasses the development, assessment and research for the curriculum. Policymakers are faced with the challenge of planning and fostering the development of actions focused on all five dimensions, considering the characteristics and particularities of the Brazilian education system, in addition to including all stakeholders in the sector in the process of formulating such policies, especially school communities.
In other words, this cross-sectional axis should consider the incorporation of digital culture by using “new teaching dynamics and strategies and different research and assessment methodologies” (Almeida & Valente, 2016, p. 42). Therefore, the challenge lies in finding a balance among these actions, so that they all interrelate, whether within the scope of infrastructure, educational content and applications, or competencies, taking into account different sources of knowledge and the inclusion of all.
REFERENCES
Almeida, M. E. (2016). Currículo e narrativas digitais em tempos de ubiquidade: Criação e integração entre contextos de aprendizagem. Revista de Educação Pública , 25 (59/2), pp. 526-546.
Almeida, E., & Valente, J. A. (2016). Políticas de tecnologia na educação brasileira: Histórico, lições aprendidas e recomendações. Retrieved on April 6, 2017, from http://www.cieb.net.br
Anísio Teixeira National Institute for Educational Studies and Research - Inep. (2017). Censo Escolar da Educação Básica 2016. Notas Estatísticas . Brasília: Inep.
Borges, M. A. (2009). Apropriação das tecnologias de informação e comunicação pelos gestores educacionais. Doctoral dissertation in Education: Curriculum, Graduate Program in Education: Curriculum, Pontifical Catholic University of São Paulo, São Paulo, Brazil.
boyd, d. (2014). It’s complicated: The social lives of networked teens. New Haven, London: Yale University Press.

2016 ICT IN EDUCATION SURVEYANALYSIS OF RESULTS 223
EN
GLI
SH
Brazilian Internet Steering Committee - CGI.br and Unesco Institute for Statistics - UIS. (2016). Methodological Framework for Measurement of Access and Use (ICT) in Education. Retrieved on September 11, 2017, from http://cetic.br/publicacao/methodological-framework-for-measurement-of-access-and-use-of-information-and-communication-technologies-ict-in-education/
Brazilian Internet Steering Committee - CGI.br (2017). Survey on the Use of Information and Communication Technologies in Brazilian Households: ICT Households 2016. São Paulo: CGI.br.
Brazilian Ministry of Education. (2002). Relatório de Atividade 1996-2002. Brasília: Secretariat for Distance Education (SEED), Department for Computers in Distance Education (DIED). Retrieved on August 27, 2017, from http://www.proinfo.gov.br/upload/img/relatorio_died.pdf
Brazilian Ministry of Education. (2007). Educação do campo: Diferenças mudando paradigmas. Cadernos SECAD 2. Brasília: Secretariat for Ongoing Education, Literacy, and Diversity (Secad).
Brazilian Ministry of Education. (2017). Base Nacional Comum Curricular. Proposta preliminar. Third version. Retrieved on August 28, 2017, from http://basenacionalcomum.mec.gov.br/images/BNCCpublicacao.pdf
Constitution of the Federative Republic of Brazil. (1988). Retrieved on August 27, 2017, from http://www.planalto.gov.br/ccivil_03/constituicao/constituição.htm
Decree no. 6.300, of December 12, 2007. (2007). Implements the National Program for Informatics in Education – ProInfo. Retrieved on August 27, 2017, from https://www.planalto.gov.br/ccivil_03/_ato2007-2010/2007/decreto/d6300.htm
Decree no. 7.352, of November 4, 2010. (2010). Implements the policy for rural education and the National Program for Education in Land Reform – PRONERA. Retrieved on September 11, 2017, from http://legislacao.planalto.gov.br/legisla/legislacao.nsf/Viw_Identificacao/DEC%207.352-2010?OpenDocument
Dutra, R. L., & Tarouco, L. M. (2007). Recursos educacionais abertos (open educational resources). Revista Novas Tecnologias na Educação (RENOTE) , 5 (1). Retrieved on July 27, 2017, from http://seer.ufrgs.br/renote/article/view/14171
Hargittai, E. (2010). Digital na(t)ives? Variation in Internet skills and uses among members of the ‘net generation’. Sociological Inquiry , 80, pp. 92-113.
Kennisnet. (2015). Four in Balance Monitor 2015. Zoetermeer: Kennisnet. Retrieved on July 7, 2017, from https://www.kennisnet.nl/fileadmin/kennisnet/corporate/algemeen/Four_in_balance_monitor_2015.pdf
Law for Educational Directives and Frameworks, Law no. 9.394, of December 20, 1996 (1996). Establishes the directives and frameworks for national education. Retrieved on September 11, 2017, from http://www.planalto.gov.br/ccivil_03/leis/L9394.htm
Moraes, M. C. (1997). Informática educativa no Brasil: uma história vivida, algumas lições aprendidas. Revista Brasileira de Informática na Educação, 1(1), pp. 1-35. Retrieved on August 27, 2017, from http://www.br-ie. org/pub/index.php/rbie/article/view/2320/2082
National Plan of Education 2014-2024, Law no. 13.005, of June 25, 2014. (2014). Appoves the National Plan of Education (PNE) and other provisions. Retrieved on August 28, 2017, from http://www.observatoriodopne.org.br/uploads/reference/file/439/documento-referencia.pdf
Ordinance no. 522, of April 9, 1997. (1997). Retrieved on August 27, 2017, from https://www.fnde.gov.br/fndelegis/action/UrlPublicasAction.php?acao=getAtoPublico&sgl_tipo=POR&num_ato=00000522&seq_ato=000&vlr_ano=1997&sgl_orgao=MED

ICT IN EDUCATION SURVEY 2016ANALYSIS OF RESULTS224
EN
GLI
SH
Ordinance no. 68, of November 9, 2012. (2012). Establishes the expansion of the participation of rural schools in the National Program for Informatics in Education - Prolnfo, through Pronacampo. Retrieved on September 11, 2017, from http://pronacampo.mec.gov.br/images/pdf/port_68_09112012.pdf
Ordinance no. 86, of February 1, 2013. (2013). Institutes the National Program for Rural Education - PRONACAMPO, and defines general directives. Retrieved on September 11, 2017, from http://pronacampo.mec.gov.br/images/pdf/port_86_01022013.pdf
Santaella, L. (2010). A aprendizagem ubíqua substitui a educação formal? Revista de computação e tecnologia da PUC-SP .
Santana, B., Rossini, C., & Pretto, N. L. (2013). Recursos Educacionales Abiertos. Prácticas colaborativas y políticas publicas. Salvador: Casa da Cultura Digital e Universidade Federal da Bahia.
United Nations Educational, Scientific and Cultural Organisation - UNESCO. (2012). 2012 Paris OER Declaration. World Open Educational Resource (OER) Congress, June 20 to 22, 2012. Paris: UNESCO.

PARTE 3—
TABELAS DE RESULTADOS
INDICADORES SELECIONADOS PARA PROFESSORES
PART 3—
TABLES OF RESULTS
SELECTED INDICATORS FOR TEACHERS


2016 PESQUISA TIC EDUCAÇÃOPROFESSORES INDICADORES SELECIONADOS TABELAS DE RESULTADOS 227
EN
GLI
SH P
OR
TUG
UÊSA1 PROFESSORES, POR GRAU DE ESCOLARIDADE
TEACHERS BY LEVEL OF EDUCATIONTOTAL DE PROFESSORESTOTAL NUMBER OF TEACHERS
Percentual (%)Percentage (%)
Ensino MédioSecondary Education
MagistérioTeacher Training
Técnico / Profissionalizante
Professional Training
OutrosOther
TOTAL 57 23 54
SEXOSEX
Feminino / Female 64 23 50
Masculino / Male 30 22 65
FAIXA ETÁRIAAGE GROUP
Até 30 anosUp to 30 years old 24 11 79
De 31 a 45 anos31 to 45 years old 62 24 49
De 46 anos ou mais46 years old or older 59 25 52
RENDA FAMILIARFAMILY INCOME
Até 3 SMUp to 3 MW 64 23 59
Mais de 3 até 5 SM3 MW to 5 MW 60 22 50
Mais de 5 SMMore than 5 MW 50 23 55
RENDA PESSOALPERSONAL INCOME
Até 3 SMUp to 3 MW 64 22 54
Mais de 3 até 5 SM3 MW to 5 MW 51 22 52
Mais de 5 SMMore than 5 MW 50 26 57
REGIÃOREGION
Norte / North 61 18 49
Centro-Oeste / Center-West 51 22 56
Nordeste / Northeast 65 20 48
Sudeste / Southeast 52 25 60
Sul / South 58 25 46
DEPENDÊNCIA ADMINISTRATIVAADMINISTRATIVE JURISDICTION
Pública Municipal / Municipal Public 71 20 40
Pública Estadual / State Public 45 22 60
Total – Públicas / Total – Public schools 56 21 51
Particular / Private 58 29 65
SÉRIEGRADE
4a série / 5o ano do Ensino Fundamental4th grade / 5th year of Elementary Education 81 21 45
8a série / 9o ano do Ensino Fundamental8th grade / 9th year of Elementary Education 47 26 55
2o ano do Ensino Médio2nd year of Secondary Education 36 21 63
Fonte: CGI.br/NIC.br, Centro Regional de Estudos para o Desenvolvimento da Sociedade da Informação (Cetic.br), Pesquisa Sobre o Uso das Tecnologias de Informação e Comunicação nas Escolas Brasileiras – TIC Educação 2016.Source: CGI.br/NIC.br, Regional Center for Studies on the Development of the Information Society (Cetic.br), Survey on the Use of Information and Communication Technologies in Brazilian Schools – ICT In Education 2016.
CONTINUA / CONTINUES �

ICT IN EDUCATION SURVEY 2016TABLES OF RESULTS SELECTED INDICATORS TEACHERS228
EN
GLI
SH P
OR
TUG
UÊS A1 PROFESSORES, POR GRAU DE ESCOLARIDADE
TEACHERS BY LEVEL OF EDUCATIONTOTAL DE PROFESSORESTOTAL NUMBER OF TEACHERS
Percentual (%)Percentage (%)
Ensino SuperiorTertiary Education
Peda
gogi
aPe
dago
gy
Mag
isté
rio /
Nor
mal
Sup
erio
rTe
ache
r Tra
inin
g /
Reg
ular
Und
ergr
adua
te C
ours
e
Lice
ncia
tura
em
Mat
emát
ica
Und
ergr
adua
te D
egre
e in
Mat
hem
atic
s
Lice
ncia
tura
em
Let
ras
Und
ergr
adua
te D
egre
e in
Lan
guag
es
Out
ros
Oth
er
Curs
o de
esp
ecia
lizaç
ãoSp
ecia
lizat
ion
Cour
se
Mes
trad
oM
aste
r’s D
egre
e
Dou
tora
doD
octo
rate
TOTAL 34 10 29 37 28 67 7 1
SEXOSEX
Feminino / Female 40 11 20 39 28 68 7 1
Masculino / Male 15 7 59 28 26 63 6 1
FAIXA ETÁRIAAGE GROUP
Até 30 anosUp to 30 years old 24 8 37 34 22 51 9 0
De 31 a 45 anos31 to 45 years old 36 8 28 36 30 66 6 1
De 46 anos ou mais46 years old or older 37 13 28 40 27 75 8 1
RENDA FAMILIARFAMILY INCOME
Até 3 SMUp to 3 MW 43 12 17 23 19 47 2 0
Mais de 3 até 5 SM3 MW to 5 MW 39 8 26 40 30 66 5 0
Mais de 5 SMMore than 5 MW 28 10 36 40 29 76 9 2
RENDA PESSOALPERSONAL INCOME
Até 3 SMUp to 3 MW 40 11 19 34 28 57 3 0
Mais de 3 até 5 SM3 MW to 5 MW 33 9 37 39 24 74 8 1
Mais de 5 SMMore than 5 MW 24 9 36 41 35 80 11 3
REGIÃOREGION
Norte / North 37 13 31 32 17 72 8 0
Centro-Oeste / Center-West 41 10 26 38 30 77 3 0
Nordeste / Northeast 37 10 23 33 24 71 6 0
Sudeste / Southeast 36 9 32 37 33 61 6 2
Sul / South 20 10 31 47 23 75 10 0
DEPENDÊNCIA ADMINISTRATIVAADMINISTRATIVE JURISDICTION
Pública Municipal / Municipal Public 46 11 16 26 28 71 5 0
Pública Estadual / State Public 22 9 41 46 25 74 6 0
Total – Públicas / Total – Public schools 32 10 30 37 27 73 6 0
Particular / Private 43 10 24 34 33 46 9 2
SÉRIEGRADE
4a série / 5o ano do Ensino Fundamental4th grade / 5th year of Elementary Education 65 14 5 15 32 61 2 0
8a série / 9o ano do Ensino Fundamental8th grade / 9th year of Elementary Education 16 5 40 49 27 70 9 1
2o ano do Ensino Médio2nd year of Secondary Education 15 9 47 51 24 73 9 1
Fonte: CGI.br/NIC.br, Centro Regional de Estudos para o Desenvolvimento da Sociedade da Informação (Cetic.br), Pesquisa Sobre o Uso das Tecnologias de Informação e Comunicação nas Escolas Brasileiras – TIC Educação 2016.Source: CGI.br/NIC.br, Regional Center for Studies on the Development of the Information Society (Cetic.br), Survey on the Use of Information and Communication Technologies in Brazilian Schools – ICT In Education 2016.
� CONCLUSÃO / CONCLUSION

2016 PESQUISA TIC EDUCAÇÃOPROFESSORES INDICADORES SELECIONADOS TABELAS DE RESULTADOS 229
EN
GLI
SH P
OR
TUG
UÊSA5 PROFESSORES, POR TEMPO DE EXPERIÊNCIA PROFISSIONAL
TEACHERS BY YEARS OF PROFESSIONAL EXPERIENCETOTAL DE PROFESSORESTOTAL NUMBER OF TEACHERS
Percentual (%)Percentage (%)
Até 5 anosUp to 5 years
De 6 a 10 anos
6 to 10 years
De 11 a 15
anos11 to 15
years
De 16 a 20 anos
16 to 20 years
De 21 anos ou mais21 years or more
TOTAL 12 18 18 22 30
SEXOSEX
Feminino / Female 11 15 19 23 32
Masculino / Male 13 29 16 20 22
FAIXA ETÁRIAAGE GROUP
Até 30 anosUp to 30 years old 49 47 4 0 0
De 31 a 45 anos31 to 45 years old 8 19 29 28 16
De 46 anos ou mais46 years old or older 3 5 5 20 66
RENDA FAMILIARFAMILY INCOME
Até 3 SMUp to 3 MW 18 22 13 21 26
Mais de 3 até 5 SM3 MW to 5 MW 10 17 21 23 28
Mais de 5 SMMore than 5 MW 10 18 17 22 34
RENDA PESSOALPERSONAL INCOME
Até 3 SMUp to 3 MW 15 20 21 23 20
Mais de 3 até 5 SM3 MW to 5 MW 9 16 17 23 35
Mais de 5 SMMore than 5 MW 7 16 12 18 46
REGIÃOREGION
Norte / North 14 20 14 24 27
Centro-Oeste / Center-West 14 26 18 17 25
Nordeste / Northeast 8 18 21 24 28
Sudeste / Southeast 12 17 19 22 29
Sul / South 14 14 12 19 41
DEPENDÊNCIA ADMINISTRATIVAADMINISTRATIVE JURISDICTION
Pública Municipal / Municipal Public 11 14 15 24 36
Pública Estadual / State Public 12 20 17 22 29
Total – Públicas / Total – Public schools 12 17 16 23 32
Particular / Private 10 21 25 20 23
SÉRIEGRADE
4a série / 5o ano do Ensino Fundamental4th grade / 5th year of Elementary Education 10 13 17 22 37
8a série / 9o ano do Ensino Fundamental8th grade / 9th year of Elementary Education 13 20 20 22 25
2o ano do Ensino Médio2nd year of Secondary Education 12 21 17 23 27
Fonte: CGI.br/NIC.br, Centro Regional de Estudos para o Desenvolvimento da Sociedade da Informação (Cetic.br), Pesquisa Sobre o Uso das Tecnologias de Informação e Comunicação nas Escolas Brasileiras – TIC Educação 2016.Source: CGI.br/NIC.br, Regional Center for Studies on the Development of the Information Society (Cetic.br), Survey on the Use of Information and Communication Technologies in Brazilian Schools – ICT In Education 2016.

ICT IN EDUCATION SURVEY 2016TABLES OF RESULTS SELECTED INDICATORS TEACHERS230
EN
GLI
SH P
OR
TUG
UÊS A6A PROFESSORES, POR HORAS SEMANAIS DEDICADAS ÀS AULAS
TEACHERS BY WEEKLY TEACHING WORKLOADTOTAL DE PROFESSORESTOTAL NUMBER OF TEACHERS
Percentual (%)Percentage (%)
Até 20Up to
20 hours
De 21 até 3921 to
39 hours
4040 hours
De 41 ou mais41 hours or more
TOTAL 24 39 18 19
SEXOSEX
Feminino / Female 27 39 18 16
Masculino / Male 17 40 15 28
FAIXA ETÁRIAAGE GROUP
Até 30 anosUp to 30 years old 20 52 15 13
De 31 a 45 anos31 to 45 years old 27 35 18 20
De 46 anos ou mais46 years old or older 22 41 17 19
RENDA FAMILIARFAMILY INCOME
Até 3 SMUp to 3 MW 47 29 16 8
Mais de 3 até 5 SM3 MW to 5 MW 24 37 22 17
Mais de 5 SMMore than 5 MW 15 45 15 25
RENDA PESSOALPERSONAL INCOME
Até 3 SMUp to 3 MW 38 34 18 10
Mais de 3 até 5 SM3 MW to 5 MW 14 46 18 22
Mais de 5 SMMore than 5 MW 9 41 15 36
REGIÃOREGION
Norte / North 25 27 23 25
Centro-Oeste / Center-West 19 42 16 23
Nordeste / Northeast 29 32 22 17
Sudeste / Southeast 25 43 12 20
Sul / South 17 45 26 12
DEPENDÊNCIA ADMINISTRATIVAADMINISTRATIVE JURISDICTION
Pública Municipal / Municipal Public 24 39 22 15
Pública Estadual / State Public 19 43 16 22
Total – Públicas / Total – Public schools 21 41 19 19
Particular / Private 37 31 13 20
SÉRIEGRADE
4a série / 5o ano do Ensino Fundamental4th grade / 5th year of Elementary Education 34 30 21 16
8a série / 9o ano do Ensino Fundamental8th grade / 9th year of Elementary Education 20 45 15 19
2o ano do Ensino Médio2nd year of Secondary Education 17 44 16 23
Fonte: CGI.br/NIC.br, Centro Regional de Estudos para o Desenvolvimento da Sociedade da Informação (Cetic.br), Pesquisa Sobre o Uso das Tecnologias de Informação e Comunicação nas Escolas Brasileiras – TIC Educação 2016.Source: CGI.br/NIC.br, Regional Center for Studies on the Development of the Information Society (Cetic.br), Survey on the Use of Information and Communication Technologies in Brazilian Schools – ICT In Education 2016.

2016 PESQUISA TIC EDUCAÇÃOPROFESSORES INDICADORES SELECIONADOS TABELAS DE RESULTADOS 231
EN
GLI
SH P
OR
TUG
UÊSA6B PROFESSORES, POR HORAS SEMANAIS DEDICADAS ÀS ATIVIDADES ADMINISTRATIVAS E DE PLANEJAMENTO
TEACHERS BY WEEKLY ADMINISTRATIVE AND PLANNING WORK HOURSTOTAL DE PROFESSORESTOTAL NUMBER OF TEACHERS
Percentual (%)Percentage (%)
Até 5Up to 5 hours
De 6 a 106 to 10 hours
De 11 ou mais11 or more hours
TOTAL 26 38 36
SEXOSEX
Feminino / Female 28 36 36
Masculino / Male 19 44 37
FAIXA ETÁRIAAGE GROUP
Até 30 anosUp to 30 years old 17 42 41
De 31 a 45 anos31 to 45 years old 26 39 35
De 46 anos ou mais46 years old or older 29 35 35
RENDA FAMILIARFAMILY INCOME
Até 3 SMUp to 3 MW 36 35 29
Mais de 3 até 5 SM3 MW to 5 MW 26 37 37
Mais de 5 SMMore than 5 MW 22 39 39
RENDA PESSOALPERSONAL INCOME
Até 3 SMUp to 3 MW 32 38 30
Mais de 3 até 5 SM3 MW to 5 MW 22 39 39
Mais de 5 SMMore than 5 MW 19 34 47
REGIÃOREGION
Norte / North 32 38 30
Centro-Oeste / Center-West 14 39 47
Nordeste / Northeast 28 35 37
Sudeste / Southeast 28 39 33
Sul / South 18 38 44
DEPENDÊNCIA ADMINISTRATIVAADMINISTRATIVE JURISDICTION
Pública Municipal / Municipal Public 30 37 33
Pública Estadual / State Public 24 38 38
Total – Públicas / Total – Public schools 27 37 36
Particular / Private 24 41 36
SÉRIEGRADE
4a série / 5o ano do Ensino Fundamental4th grade / 5th year of Elementary Education 34 38 28
8a série / 9o ano do Ensino Fundamental8th grade / 9th year of Elementary Education 18 38 43
2o ano do Ensino Médio2nd year of Secondary Education 23 38 39
Fonte: CGI.br/NIC.br, Centro Regional de Estudos para o Desenvolvimento da Sociedade da Informação (Cetic.br), Pesquisa Sobre o Uso das Tecnologias de Informação e Comunicação nas Escolas Brasileiras – TIC Educação 2016.Source: CGI.br/NIC.br, Regional Center for Studies on the Development of the Information Society (Cetic.br), Survey on the Use of Information and Communication Technologies in Brazilian Schools – ICT In Education 2016.

ICT IN EDUCATION SURVEY 2016TABLES OF RESULTS SELECTED INDICATORS TEACHERS232
EN
GLI
SH P
OR
TUG
UÊS A7 PROFESSORES, POR REDES DE ENSINO EM QUE ATUA
TEACHERS BY EDUCATIONAL SECTORS IN WHICH THEY WORKTOTAL DE PROFESSORESTOTAL NUMBER OF TEACHERS
Percentual (%)Percentage (%)
Pública MunicipalMunicipal
Public
Pública Estadual
State Public
Pública FederalFederal Public
ParticularPrivate
TOTAL 45 51 2 25
SEXOSEX
Feminino / Female 46 46 1 27
Masculino / Male 43 69 3 18
FAIXA ETÁRIAAGE GROUP
Até 30 anosUp to 30 years old 34 55 3 29
De 31 a 45 anos31 to 45 years old 44 46 2 31
De 46 anos ou mais46 years old or older 51 58 1 12
RENDA FAMILIARFAMILY INCOME
Até 3 SMUp to 3 MW 49 29 1 34
Mais de 3 até 5 SM3 MW to 5 MW 42 54 1 26
Mais de 5 SMMore than 5 MW 47 57 2 21
RENDA PESSOALPERSONAL INCOME
Até 3 SMUp to 3 MW 43 38 1 32
Mais de 3 até 5 SM3 MW to 5 MW 45 63 3 17
Mais de 5 SMMore than 5 MW 51 56 1 23
REGIÃOREGION
Norte / North 52 56 1 18
Centro-Oeste / Center-West 34 48 16 19
Nordeste / Northeast 55 43 1 28
Sudeste / Southeast 40 52 1 27
Sul / South 40 62 1 19
DEPENDÊNCIA ADMINISTRATIVAADMINISTRATIVE JURISDICTION
Pública Municipal / Municipal Public 100 15 1 6
Pública Estadual / State Public 20 97 3 6
Total – Públicas / Total – Public schools 55 62 2 6
Particular / Private 6 9 1 100
SÉRIEGRADE
4a série / 5o ano do Ensino Fundamental4th grade / 5th year of Elementary Education 62 17 2 33
8a série / 9o ano do Ensino Fundamental8th grade / 9th year of Elementary Education 51 52 2 23
2o ano do Ensino Médio2nd year of Secondary Education 20 90 2 16
Fonte: CGI.br/NIC.br, Centro Regional de Estudos para o Desenvolvimento da Sociedade da Informação (Cetic.br), Pesquisa Sobre o Uso das Tecnologias de Informação e Comunicação nas Escolas Brasileiras – TIC Educação 2016.Source: CGI.br/NIC.br, Regional Center for Studies on the Development of the Information Society (Cetic.br), Survey on the Use of Information and Communication Technologies in Brazilian Schools – ICT In Education 2016.

2016 PESQUISA TIC EDUCAÇÃOPROFESSORES INDICADORES SELECIONADOS TABELAS DE RESULTADOS 233
EN
GLI
SH P
OR
TUG
UÊSA8 PROFESSORES, POR NÚMERO DE ESCOLAS EM QUE ATUA
TEACHERS BY NUMBER OF SCHOOLS WHERE THEY WORKTOTAL DE PROFESSORESTOTAL NUMBER OF TEACHERS
Percentual (%)Percentage (%)
UmaOne
DuasTwo
Três ou maisThree or more
TOTAL 58 35 7
SEXOSEX
Feminino / Female 61 33 6
Masculino / Male 49 39 12
FAIXA ETÁRIAAGE GROUP
Até 30 anosUp to 30 years old 59 29 12
De 31 a 45 anos31 to 45 years old 58 35 7
De 46 anos ou mais46 years old or older 58 36 6
RENDA FAMILIARFAMILY INCOME
Até 3 SMUp to 3 MW 75 20 5
Mais de 3 até 5 SM3 MW to 5 MW 62 34 5
Mais de 5 SMMore than 5 MW 49 40 10
RENDA PESSOALPERSONAL INCOME
Até 3 SMUp to 3 MW 73 23 4
Mais de 3 até 5 SM3 MW to 5 MW 50 41 10
Mais de 5 SMMore than 5 MW 40 50 10
REGIÃOREGION
Norte / North 55 31 14
Centro-Oeste / Center-West 60 36 4
Nordeste / Northeast 61 32 8
Sudeste / Southeast 56 38 6
Sul / South 62 29 8
DEPENDÊNCIA ADMINISTRATIVAADMINISTRATIVE JURISDICTION
Pública Municipal / Municipal Public 54 41 5
Pública Estadual / State Public 55 37 8
Total – Públicas / Total – Public schools 55 38 7
Particular / Private 72 19 9
SÉRIEGRADE
4a série / 5o ano do Ensino Fundamental4th grade / 5th year of Elementary Education 67 30 3
8a série / 9o ano do Ensino Fundamental8th grade / 9th year of Elementary Education 51 39 10
2o ano do Ensino Médio2nd year of Secondary Education 55 35 10
Fonte: CGI.br/NIC.br, Centro Regional de Estudos para o Desenvolvimento da Sociedade da Informação (Cetic.br), Pesquisa Sobre o Uso das Tecnologias de Informação e Comunicação nas Escolas Brasileiras – TIC Educação 2016.Source: CGI.br/NIC.br, Regional Center for Studies on the Development of the Information Society (Cetic.br), Survey on the Use of Information and Communication Technologies in Brazilian Schools – ICT In Education 2016.
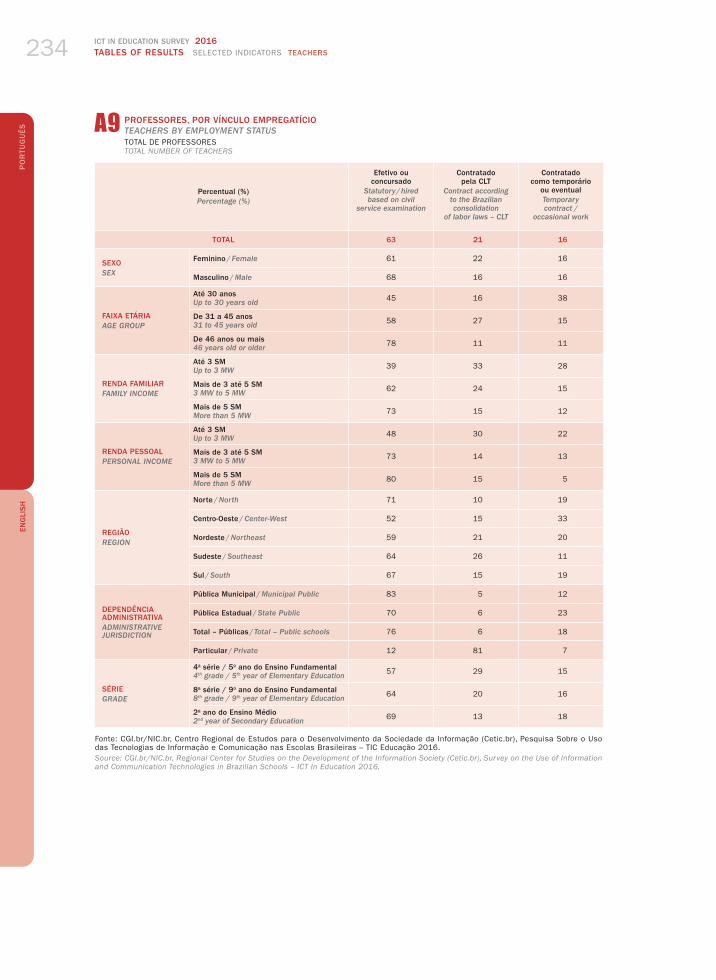
ICT IN EDUCATION SURVEY 2016TABLES OF RESULTS SELECTED INDICATORS TEACHERS234
EN
GLI
SH P
OR
TUG
UÊS A9 PROFESSORES, POR VÍNCULO EMPREGATÍCIO
TEACHERS BY EMPLOYMENT STATUSTOTAL DE PROFESSORESTOTAL NUMBER OF TEACHERS
Percentual (%)Percentage (%)
Efetivo ou concursado
Statutory / hired based on civil
service examination
Contratado pela CLT
Contract according to the Brazilian consolidation
of labor laws – CLT
Contratado como temporário
ou eventualTemporary contract /
occasional work
TOTAL 63 21 16
SEXOSEX
Feminino / Female 61 22 16
Masculino / Male 68 16 16
FAIXA ETÁRIAAGE GROUP
Até 30 anosUp to 30 years old 45 16 38
De 31 a 45 anos31 to 45 years old 58 27 15
De 46 anos ou mais46 years old or older 78 11 11
RENDA FAMILIARFAMILY INCOME
Até 3 SMUp to 3 MW 39 33 28
Mais de 3 até 5 SM3 MW to 5 MW 62 24 15
Mais de 5 SMMore than 5 MW 73 15 12
RENDA PESSOALPERSONAL INCOME
Até 3 SMUp to 3 MW 48 30 22
Mais de 3 até 5 SM3 MW to 5 MW 73 14 13
Mais de 5 SMMore than 5 MW 80 15 5
REGIÃOREGION
Norte / North 71 10 19
Centro-Oeste / Center-West 52 15 33
Nordeste / Northeast 59 21 20
Sudeste / Southeast 64 26 11
Sul / South 67 15 19
DEPENDÊNCIA ADMINISTRATIVAADMINISTRATIVE JURISDICTION
Pública Municipal / Municipal Public 83 5 12
Pública Estadual / State Public 70 6 23
Total – Públicas / Total – Public schools 76 6 18
Particular / Private 12 81 7
SÉRIEGRADE
4a série / 5o ano do Ensino Fundamental4th grade / 5th year of Elementary Education 57 29 15
8a série / 9o ano do Ensino Fundamental8th grade / 9th year of Elementary Education 64 20 16
2o ano do Ensino Médio2nd year of Secondary Education 69 13 18
Fonte: CGI.br/NIC.br, Centro Regional de Estudos para o Desenvolvimento da Sociedade da Informação (Cetic.br), Pesquisa Sobre o Uso das Tecnologias de Informação e Comunicação nas Escolas Brasileiras – TIC Educação 2016.Source: CGI.br/NIC.br, Regional Center for Studies on the Development of the Information Society (Cetic.br), Survey on the Use of Information and Communication Technologies in Brazilian Schools – ICT In Education 2016.
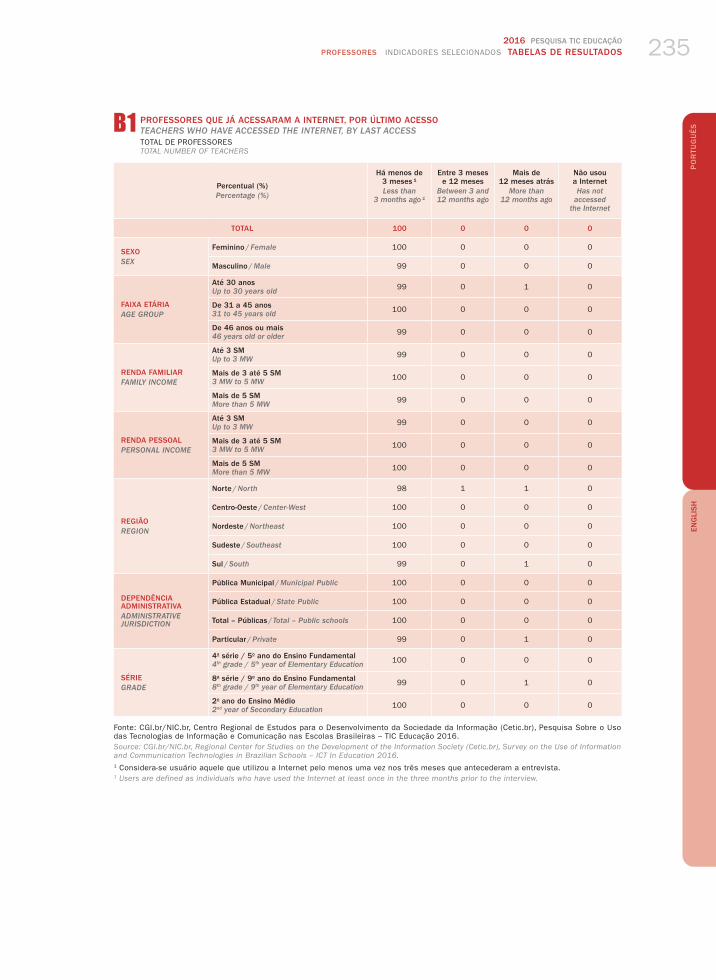
2016 PESQUISA TIC EDUCAÇÃOPROFESSORES INDICADORES SELECIONADOS TABELAS DE RESULTADOS 235
EN
GLI
SH P
OR
TUG
UÊSB1 PROFESSORES QUE JÁ ACESSARAM A INTERNET, POR ÚLTIMO ACESSO
TEACHERS WHO HAVE ACCESSED THE INTERNET, BY LAST ACCESSTOTAL DE PROFESSORESTOTAL NUMBER OF TEACHERS
Percentual (%)Percentage (%)
Há menos de 3 meses ¹Less than
3 months ago ¹
Entre 3 meses e 12 meses
Between 3 and 12 months ago
Mais de 12 meses atrás
More than 12 months ago
Não usou a InternetHas not
accessed the Internet
TOTAL 100 0 0 0
SEXOSEX
Feminino / Female 100 0 0 0
Masculino / Male 99 0 0 0
FAIXA ETÁRIAAGE GROUP
Até 30 anosUp to 30 years old 99 0 1 0
De 31 a 45 anos31 to 45 years old 100 0 0 0
De 46 anos ou mais46 years old or older 99 0 0 0
RENDA FAMILIARFAMILY INCOME
Até 3 SMUp to 3 MW 99 0 0 0
Mais de 3 até 5 SM3 MW to 5 MW 100 0 0 0
Mais de 5 SMMore than 5 MW 99 0 0 0
RENDA PESSOALPERSONAL INCOME
Até 3 SMUp to 3 MW 99 0 0 0
Mais de 3 até 5 SM3 MW to 5 MW 100 0 0 0
Mais de 5 SMMore than 5 MW 100 0 0 0
REGIÃOREGION
Norte / North 98 1 1 0
Centro-Oeste / Center-West 100 0 0 0
Nordeste / Northeast 100 0 0 0
Sudeste / Southeast 100 0 0 0
Sul / South 99 0 1 0
DEPENDÊNCIA ADMINISTRATIVAADMINISTRATIVE JURISDICTION
Pública Municipal / Municipal Public 100 0 0 0
Pública Estadual / State Public 100 0 0 0
Total – Públicas / Total – Public schools 100 0 0 0
Particular / Private 99 0 1 0
SÉRIEGRADE
4a série / 5o ano do Ensino Fundamental4th grade / 5th year of Elementary Education 100 0 0 0
8a série / 9o ano do Ensino Fundamental8th grade / 9th year of Elementary Education 99 0 1 0
2o ano do Ensino Médio2nd year of Secondary Education 100 0 0 0
Fonte: CGI.br/NIC.br, Centro Regional de Estudos para o Desenvolvimento da Sociedade da Informação (Cetic.br), Pesquisa Sobre o Uso das Tecnologias de Informação e Comunicação nas Escolas Brasileiras – TIC Educação 2016.Source: CGI.br/NIC.br, Regional Center for Studies on the Development of the Information Society (Cetic.br), Survey on the Use of Information and Communication Technologies in Brazilian Schools – ICT In Education 2016.1 Considera-se usuário aquele que utilizou a Internet pelo menos uma vez nos três meses que antecederam a entrevista.1 Users are defined as individuals who have used the Internet at least once in the three months prior to the interview.
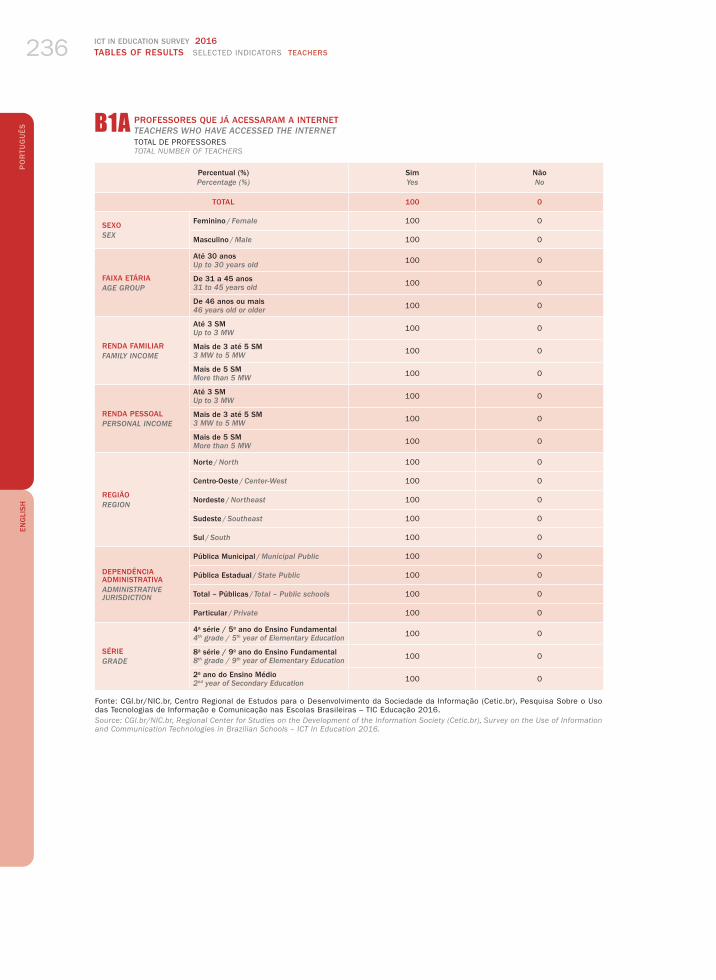
ICT IN EDUCATION SURVEY 2016TABLES OF RESULTS SELECTED INDICATORS TEACHERS236
EN
GLI
SH P
OR
TUG
UÊS B1A PROFESSORES QUE JÁ ACESSARAM A INTERNET
TEACHERS WHO HAVE ACCESSED THE INTERNETTOTAL DE PROFESSORESTOTAL NUMBER OF TEACHERS
Percentual (%)Percentage (%)
SimYes
NãoNo
TOTAL 100 0
SEXOSEX
Feminino / Female 100 0
Masculino / Male 100 0
FAIXA ETÁRIAAGE GROUP
Até 30 anosUp to 30 years old 100 0
De 31 a 45 anos31 to 45 years old 100 0
De 46 anos ou mais46 years old or older 100 0
RENDA FAMILIARFAMILY INCOME
Até 3 SMUp to 3 MW 100 0
Mais de 3 até 5 SM3 MW to 5 MW 100 0
Mais de 5 SMMore than 5 MW 100 0
RENDA PESSOALPERSONAL INCOME
Até 3 SMUp to 3 MW 100 0
Mais de 3 até 5 SM3 MW to 5 MW 100 0
Mais de 5 SMMore than 5 MW 100 0
REGIÃOREGION
Norte / North 100 0
Centro-Oeste / Center-West 100 0
Nordeste / Northeast 100 0
Sudeste / Southeast 100 0
Sul / South 100 0
DEPENDÊNCIA ADMINISTRATIVAADMINISTRATIVE JURISDICTION
Pública Municipal / Municipal Public 100 0
Pública Estadual / State Public 100 0
Total – Públicas / Total – Public schools 100 0
Particular / Private 100 0
SÉRIEGRADE
4a série / 5o ano do Ensino Fundamental4th grade / 5th year of Elementary Education 100 0
8a série / 9o ano do Ensino Fundamental8th grade / 9th year of Elementary Education 100 0
2o ano do Ensino Médio2nd year of Secondary Education 100 0
Fonte: CGI.br/NIC.br, Centro Regional de Estudos para o Desenvolvimento da Sociedade da Informação (Cetic.br), Pesquisa Sobre o Uso das Tecnologias de Informação e Comunicação nas Escolas Brasileiras – TIC Educação 2016.Source: CGI.br/NIC.br, Regional Center for Studies on the Development of the Information Society (Cetic.br), Survey on the Use of Information and Communication Technologies in Brazilian Schools – ICT In Education 2016.

2016 PESQUISA TIC EDUCAÇÃOPROFESSORES INDICADORES SELECIONADOS TABELAS DE RESULTADOS 237
EN
GLI
SH P
OR
TUG
UÊSB3 PROFESSORES, POR TIPO DE COMPUTADOR EXISTENTE NO DOMICÍLIO
TEACHERS BY TYPES OF COMPUTERS IN THE HOUSEHOLDTOTAL DE PROFESSORESTOTAL NUMBER OF TEACHERS
Percentual (%)Percentage (%)
Computador portátil ou notebook
Desktop computer
Computador de mesaPortable computer
TabletTablet
TOTAL 88 67 56
SEXOSEX
Feminino / Female 89 66 57
Masculino / Male 84 69 55
FAIXA ETÁRIAAGE GROUP
Até 30 anosUp to 30 years old 94 49 42
De 31 a 45 anos31 to 45 years old 86 67 58
De 46 anos ou mais46 years old or older 89 73 59
RENDA FAMILIARFAMILY INCOME
Até 3 SMUp to 3 MW 76 63 54
Mais de 3 até 5 SM3 MW to 5 MW 86 67 54
Mais de 5 SMMore than 5 MW 94 68 59
RENDA PESSOALPERSONAL INCOME
Até 3 SMUp to 3 MW 82 66 51
Mais de 3 até 5 SM3 MW to 5 MW 91 67 59
Mais de 5 SMMore than 5 MW 95 68 65
REGIÃOREGION
Norte / North 89 52 45
Centro-Oeste / Center-West 92 68 55
Nordeste / Northeast 86 63 52
Sudeste / Southeast 86 72 60
Sul / South 95 65 60
DEPENDÊNCIA ADMINISTRATIVAADMINISTRATIVE JURISDICTION
Pública Municipal / Municipal Public 87 67 52
Pública Estadual / State Public 88 64 60
Total – Públicas / Total – Public schools 88 65 56
Particular / Private 89 74 56
SÉRIEGRADE
4a série / 5o ano do Ensino Fundamental4th grade / 5th year of Elementary Education 86 70 54
8a série / 9o ano do Ensino Fundamental8th grade / 9th year of Elementary Education 92 64 54
2o ano do Ensino Médio2nd year of Secondary Education 86 65 60
Fonte: CGI.br/NIC.br, Centro Regional de Estudos para o Desenvolvimento da Sociedade da Informação (Cetic.br), Pesquisa Sobre o Uso das Tecnologias de Informação e Comunicação nas Escolas Brasileiras – TIC Educação 2016.Source: CGI.br/NIC.br, Regional Center for Studies on the Development of the Information Society (Cetic.br), Survey on the Use of Information and Communication Technologies in Brazilian Schools – ICT In Education 2016.

ICT IN EDUCATION SURVEY 2016TABLES OF RESULTS SELECTED INDICATORS TEACHERS238
EN
GLI
SH P
OR
TUG
UÊS
Percentual (%)Percentage (%)
Computador de mesaDesktop computer
Recursos pessoais próprios
Own resources
Recursos de algum membro
da famíliaA family
member’s resources
Recursos subsidiados por algum programa
do governoSubsidized
by government programs
OutroOther
Não possui computador
de mesaDoes not
own a desktop
computer
TOTAL 60 6 1 0 33
SEXOSEX
Feminino / Female 59 7 1 0 34
Masculino / Male 64 4 0 0 31
FAIXA ETÁRIAAGE GROUP
Até 30 anosUp to 30 years old 34 15 0 0 51
De 31 a 45 anos31 to 45 years old 62 4 0 0 33
De 46 anos ou mais46 years old or older 66 6 1 0 27
RENDA FAMILIARFAMILY INCOME
Até 3 SMUp to 3 MW 54 8 0 0 37
Mais de 3 até 5 SM3 MW to 5 MW 62 4 0 0 33
Mais de 5 SMMore than 5 MW 61 6 1 0 32
RENDA PESSOALPERSONAL INCOME
Até 3 SMUp to 3 MW 59 7 0 0 34
Mais de 3 até 5 SM3 MW to 5 MW 59 7 1 0 33
Mais de 5 SMMore than 5 MW 65 2 1 0 32
REGIÃOREGION
Norte / North 46 4 2 0 48
Centro-Oeste / Center-West 59 9 1 0 32
Nordeste / Northeast 56 7 0 0 37
Sudeste / Southeast 66 6 0 0 28
Sul / South 59 5 0 0 35
DEPENDÊNCIA ADMINISTRATIVAADMINISTRATIVE JURISDICTION
Pública Municipal / Municipal Public 58 8 1 0 33
Pública Estadual / State Public 57 6 1 0 36
Total – Públicas / Total – Public schools 57 7 1 0 35
Particular / Private 70 3 0 0 26
SÉRIEGRADE
4a série / 5o ano do Ensino Fundamental4th grade / 5th year of Elementary Education 62 8 0 0 30
8a série / 9o ano do Ensino Fundamental8th grade / 9th year of Elementary Education 60 4 0 0 36
2o ano do Ensino Médio2nd year of Secondary Education 58 6 1 0 35
Fonte: CGI.br/NIC.br, Centro Regional de Estudos para o Desenvolvimento da Sociedade da Informação (Cetic.br), Pesquisa Sobre o Uso das Tecnologias de Informação e Comunicação nas Escolas Brasileiras – TIC Educação 2016.Source: CGI.br/NIC.br, Regional Center for Studies on the Development of the Information Society (Cetic.br), Survey on the Use of Information and Communication Technologies in Brazilian Schools – ICT In Education 2016.
B4 PROFESSORES, POR FORMA DE AQUISIÇÃO DO COMPUTADOR EXISTENTE NO DOMICÍLIOTEACHERS BY TYPE OF ACQUISITION OF HOUSEHOLD COMPUTERSTOTAL DE PROFESSORESTOTAL NUMBER OF TEACHERS
CONTINUA / CONTINUES �

2016 PESQUISA TIC EDUCAÇÃOPROFESSORES INDICADORES SELECIONADOS TABELAS DE RESULTADOS 239
EN
GLI
SH P
OR
TUG
UÊS
Percentual (%)Percentage (%)
Computador portátil ou notebookPortable computer
Recursos pessoais próprios
Own resources
Recursos de algum membro
da famíliaA family
member’s resources
Recursos subsidiados por algum programa
do governoSubsidized
by government programs
OutroOther
Não possui computador portátil ou notebookDoes not
own a portable computer or laptop
TOTAL 78 5 4 1 12
SEXOSEX
Feminino / Female 80 5 3 0 11
Masculino / Male 73 5 6 1 16
FAIXA ETÁRIAAGE GROUP
Até 30 anosUp to 30 years old 83 8 2 0 6
De 31 a 45 anos31 to 45 years old 76 5 4 0 14
De 46 anos ou mais46 years old or older 80 4 5 1 11
RENDA FAMILIARFAMILY INCOME
Até 3 SMUp to 3 MW 71 4 2 0 24
Mais de 3 até 5 SM3 MW to 5 MW 77 5 3 1 14
Mais de 5 SMMore than 5 MW 82 5 6 1 6
RENDA PESSOALPERSONAL INCOME
Até 3 SMUp to 3 MW 74 5 3 0 18
Mais de 3 até 5 SM3 MW to 5 MW 82 4 4 1 9
Mais de 5 SMMore than 5 MW 83 6 6 1 5
REGIÃOREGION
Norte / North 77 2 9 0 11
Centro-Oeste / Center-West 82 7 2 2 8
Nordeste / Northeast 77 5 3 0 14
Sudeste / Southeast 77 5 3 1 14
Sul / South 84 6 5 1 5
DEPENDÊNCIA ADMINISTRATIVAADMINISTRATIVE JURISDICTION
Pública Municipal / Municipal Public 79 3 4 1 13
Pública Estadual / State Public 77 6 5 0 12
Total – Públicas / Total – Public schools 78 5 5 1 12
Particular / Private 81 7 0 0 11
SÉRIEGRADE
4a série / 5o ano do Ensino Fundamental4th grade / 5th year of Elementary Education 79 3 3 0 14
8a série / 9o ano do Ensino Fundamental8th grade / 9th year of Elementary Education 81 6 4 1 8
2o ano do Ensino Médio2nd year of Secondary Education 74 6 5 0 14
Fonte: CGI.br/NIC.br, Centro Regional de Estudos para o Desenvolvimento da Sociedade da Informação (Cetic.br), Pesquisa Sobre o Uso das Tecnologias de Informação e Comunicação nas Escolas Brasileiras – TIC Educação 2016.Source: CGI.br/NIC.br, Regional Center for Studies on the Development of the Information Society (Cetic.br), Survey on the Use of Information and Communication Technologies in Brazilian Schools – ICT In Education 2016.
B4 PROFESSORES, POR FORMA DE AQUISIÇÃO DO COMPUTADOR EXISTENTE NO DOMICÍLIOTEACHERS BY TYPE OF ACQUISITION OF HOUSEHOLD COMPUTERSTOTAL DE PROFESSORESTOTAL NUMBER OF TEACHERS
� CONTINUAÇÃO / CONTINUATION

ICT IN EDUCATION SURVEY 2016TABLES OF RESULTS SELECTED INDICATORS TEACHERS240
EN
GLI
SH P
OR
TUG
UÊS
Percentual (%)Percentage (%)
TabletTablet
Recursos pessoais próprios
Own resources
Recursos de algum membro
da famíliaA family
member’s resources
Recursos subsidiados por algum programa
do governoSubsidized
by government programs
OutroOther
Não possui tablet
Does not own a tablet
TOTAL 37 5 13 1 44
SEXOSEX
Feminino / Female 38 6 11 1 43
Masculino / Male 34 2 18 1 45
FAIXA ETÁRIAAGE GROUP
Até 30 anosUp to 30 years old 26 7 8 2 58
De 31 a 45 anos31 to 45 years old 40 4 14 0 42
De 46 anos ou mais46 years old or older 37 7 14 1 41
RENDA FAMILIARFAMILY INCOME
Até 3 SMUp to 3 MW 40 8 6 0 46
Mais de 3 até 5 SM3 MW to 5 MW 34 4 16 0 46
Mais de 5 SMMore than 5 MW 39 6 14 1 41
RENDA PESSOALPERSONAL INCOME
Até 3 SMUp to 3 MW 37 5 8 0 49
Mais de 3 até 5 SM3 MW to 5 MW 36 4 18 1 41
Mais de 5 SMMore than 5 MW 42 7 15 2 35
REGIÃOREGION
Norte / North 26 3 15 1 55
Centro-Oeste / Center-West 38 10 6 2 45
Nordeste / Northeast 31 5 16 0 48
Sudeste / Southeast 42 7 10 1 40
Sul / South 38 3 18 1 40
DEPENDÊNCIA ADMINISTRATIVAADMINISTRATIVE JURISDICTION
Pública Municipal / Municipal Public 39 5 8 1 48
Pública Estadual / State Public 31 6 22 1 40
Total – Públicas / Total – Public schools 34 6 16 1 44
Particular / Private 49 4 2 1 44
SÉRIEGRADE
4a série / 5o ano do Ensino Fundamental4th grade / 5th year of Elementary Education 44 8 2 1 46
8a série / 9o ano do Ensino Fundamental8th grade / 9th year of Elementary Education 35 5 13 1 46
2o ano do Ensino Médio2nd year of Secondary Education 31 3 25 1 40
Fonte: CGI.br/NIC.br, Centro Regional de Estudos para o Desenvolvimento da Sociedade da Informação (Cetic.br), Pesquisa Sobre o Uso das Tecnologias de Informação e Comunicação nas Escolas Brasileiras – TIC Educação 2016.Source: CGI.br/NIC.br, Regional Center for Studies on the Development of the Information Society (Cetic.br), Survey on the Use of Information and Communication Technologies in Brazilian Schools – ICT In Education 2016.
B4 PROFESSORES, POR FORMA DE AQUISIÇÃO DO COMPUTADOR EXISTENTE NO DOMICÍLIOTEACHERS BY TYPE OF ACQUISITION OF HOUSEHOLD COMPUTERSTOTAL DE PROFESSORESTOTAL NUMBER OF TEACHERS
� CONCLUSÃO / CONCLUSION

2016 PESQUISA TIC EDUCAÇÃOPROFESSORES INDICADORES SELECIONADOS TABELAS DE RESULTADOS 241
EN
GLI
SH P
OR
TUG
UÊS
Percentual (%)Percentage (%)
Computador portátil ou notebookPortable computer
SimYes
NãoNo
Não possui computador portátil
ou notebookDoes not own
a portable computer or laptop
TOTAL 50 37 12
SEXOSEX
Feminino / Female 51 38 11
Masculino / Male 49 35 16
FAIXA ETÁRIAAGE GROUP
Até 30 anosUp to 30 years old 52 41 6
De 31 a 45 anos31 to 45 years old 53 32 14
De 46 anos ou mais46 years old or older 44 45 11
RENDA FAMILIARFAMILY INCOME
Até 3 SMUp to 3 MW 43 33 24
Mais de 3 até 5 SM3 MW to 5 MW 50 35 14
Mais de 5 SMMore than 5 MW 52 41 6
RENDA PESSOALPERSONAL INCOME
Até 3 SMUp to 3 MW 45 37 18
Mais de 3 até 5 SM3 MW to 5 MW 54 37 9
Mais de 5 SMMore than 5 MW 53 42 5
REGIÃOREGION
Norte / North 58 30 11
Centro-Oeste / Center-West 70 22 8
Nordeste / Northeast 48 38 14
Sudeste / Southeast 46 39 14
Sul / South 53 43 5
DEPENDÊNCIA ADMINISTRATIVAADMINISTRATIVE JURISDICTION
Pública Municipal / Municipal Public 52 34 13
Pública Estadual / State Public 49 39 12
Total – Públicas / Total – Public schools 51 37 12
Particular / Private 48 41 11
SÉRIEGRADE
4a série / 5o ano do Ensino Fundamental4th grade / 5th year of Elementary Education 52 34 14
8a série / 9o ano do Ensino Fundamental8th grade / 9th year of Elementary Education 51 40 8
2o ano do Ensino Médio2nd year of Secondary Education 47 39 14
Fonte: CGI.br/NIC.br, Centro Regional de Estudos para o Desenvolvimento da Sociedade da Informação (Cetic.br), Pesquisa Sobre o Uso das Tecnologias de Informação e Comunicação nas Escolas Brasileiras – TIC Educação 2016.Source: CGI.br/NIC.br, Regional Center for Studies on the Development of the Information Society (Cetic.br), Survey on the Use of Information and Communication Technologies in Brazilian Schools – ICT In Education 2016.
B5 PROFESSORES, POR DESLOCAMENTO DO COMPUTADOR À ESCOLATEACHERS WHO HAVE TAKEN PORTABLE COMPUTERS TO SCHOOLTOTAL DE PROFESSORESTOTAL NUMBER OF TEACHERS
CONTINUA / CONTINUES �
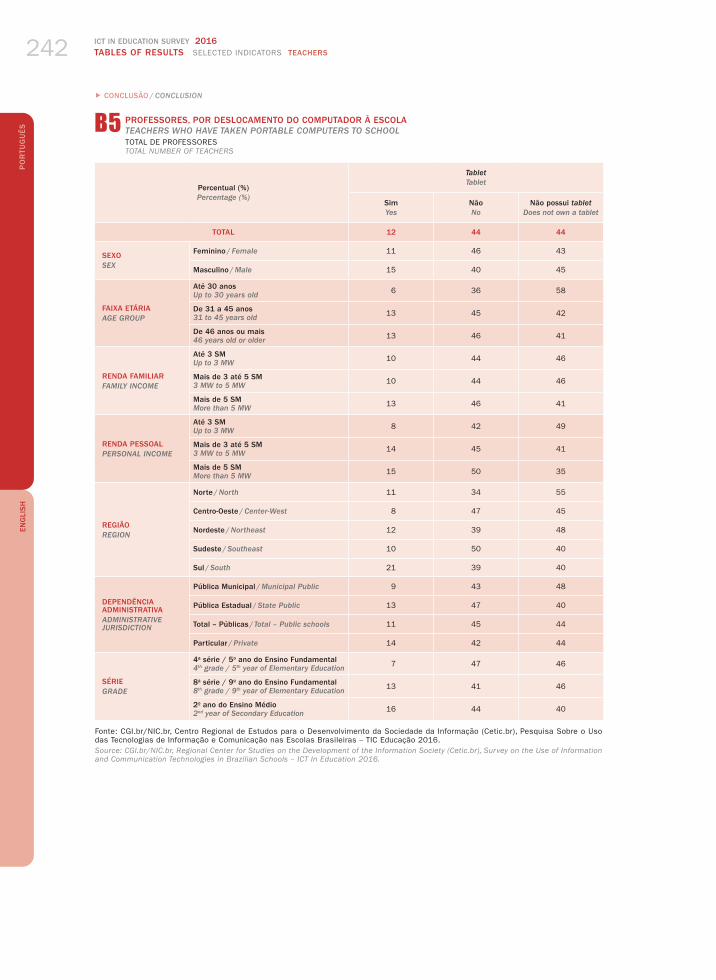
ICT IN EDUCATION SURVEY 2016TABLES OF RESULTS SELECTED INDICATORS TEACHERS242
EN
GLI
SH P
OR
TUG
UÊS
Percentual (%)Percentage (%)
TabletTablet
SimYes
NãoNo
Não possui tabletDoes not own a tablet
TOTAL 12 44 44
SEXOSEX
Feminino / Female 11 46 43
Masculino / Male 15 40 45
FAIXA ETÁRIAAGE GROUP
Até 30 anosUp to 30 years old 6 36 58
De 31 a 45 anos31 to 45 years old 13 45 42
De 46 anos ou mais46 years old or older 13 46 41
RENDA FAMILIARFAMILY INCOME
Até 3 SMUp to 3 MW 10 44 46
Mais de 3 até 5 SM3 MW to 5 MW 10 44 46
Mais de 5 SMMore than 5 MW 13 46 41
RENDA PESSOALPERSONAL INCOME
Até 3 SMUp to 3 MW 8 42 49
Mais de 3 até 5 SM3 MW to 5 MW 14 45 41
Mais de 5 SMMore than 5 MW 15 50 35
REGIÃOREGION
Norte / North 11 34 55
Centro-Oeste / Center-West 8 47 45
Nordeste / Northeast 12 39 48
Sudeste / Southeast 10 50 40
Sul / South 21 39 40
DEPENDÊNCIA ADMINISTRATIVAADMINISTRATIVE JURISDICTION
Pública Municipal / Municipal Public 9 43 48
Pública Estadual / State Public 13 47 40
Total – Públicas / Total – Public schools 11 45 44
Particular / Private 14 42 44
SÉRIEGRADE
4a série / 5o ano do Ensino Fundamental4th grade / 5th year of Elementary Education 7 47 46
8a série / 9o ano do Ensino Fundamental8th grade / 9th year of Elementary Education 13 41 46
2o ano do Ensino Médio2nd year of Secondary Education 16 44 40
Fonte: CGI.br/NIC.br, Centro Regional de Estudos para o Desenvolvimento da Sociedade da Informação (Cetic.br), Pesquisa Sobre o Uso das Tecnologias de Informação e Comunicação nas Escolas Brasileiras – TIC Educação 2016.Source: CGI.br/NIC.br, Regional Center for Studies on the Development of the Information Society (Cetic.br), Survey on the Use of Information and Communication Technologies in Brazilian Schools – ICT In Education 2016.
B5 PROFESSORES, POR DESLOCAMENTO DO COMPUTADOR À ESCOLATEACHERS WHO HAVE TAKEN PORTABLE COMPUTERS TO SCHOOLTOTAL DE PROFESSORESTOTAL NUMBER OF TEACHERS
� CONCLUSÃO / CONCLUSION

2016 PESQUISA TIC EDUCAÇÃOPROFESSORES INDICADORES SELECIONADOS TABELAS DE RESULTADOS 243
EN
GLI
SH P
OR
TUG
UÊSB6 PROFESSORES COM ACESSO À INTERNET NO DOMICÍLIO
TEACHERS WITH INTERNET ACCESS IN THE HOUSEHOLDTOTAL DE PROFESSORESTOTAL NUMBER OF TEACHERS
Percentual (%)Percentage (%)
SimYes
NãoNo
TOTAL 97 3
SEXOSEX
Feminino / Female 97 3
Masculino / Male 95 5
FAIXA ETÁRIAAGE GROUP
Até 30 anosUp to 30 years old 96 4
De 31 a 45 anos31 to 45 years old 96 4
De 46 anos ou mais46 years old or older 98 2
RENDA FAMILIARFAMILY INCOME
Até 3 SMUp to 3 MW 93 7
Mais de 3 até 5 SM3 MW to 5 MW 96 4
Mais de 5 SMMore than 5 MW 98 2
RENDA PESSOALPERSONAL INCOME
Até 3 SMUp to 3 MW 95 5
Mais de 3 até 5 SM3 MW to 5 MW 97 3
Mais de 5 SMMore than 5 MW 98 2
REGIÃOREGION
Norte / North 86 14
Centro-Oeste / Center-West 96 4
Nordeste / Northeast 96 4
Sudeste / Southeast 99 1
Sul / South 99 1
DEPENDÊNCIA ADMINISTRATIVAADMINISTRATIVE JURISDICTION
Pública Municipal / Municipal Public 95 5
Pública Estadual / State Public 97 3
Total – Públicas / Total – Public schools 96 4
Particular / Private 99 1
SÉRIEGRADE
4a série / 5o ano do Ensino Fundamental4th grade / 5th year of Elementary Education 96 4
8a série / 9o ano do Ensino Fundamental8th grade / 9th year of Elementary Education 96 4
2o ano do Ensino Médio2nd year of Secondary Education 98 2
Fonte: CGI.br/NIC.br, Centro Regional de Estudos para o Desenvolvimento da Sociedade da Informação (Cetic.br), Pesquisa Sobre o Uso das Tecnologias de Informação e Comunicação nas Escolas Brasileiras – TIC Educação 2016.Source: CGI.br/NIC.br, Regional Center for Studies on the Development of the Information Society (Cetic.br), Survey on the Use of Information and Communication Technologies in Brazilian Schools – ICT In Education 2016.
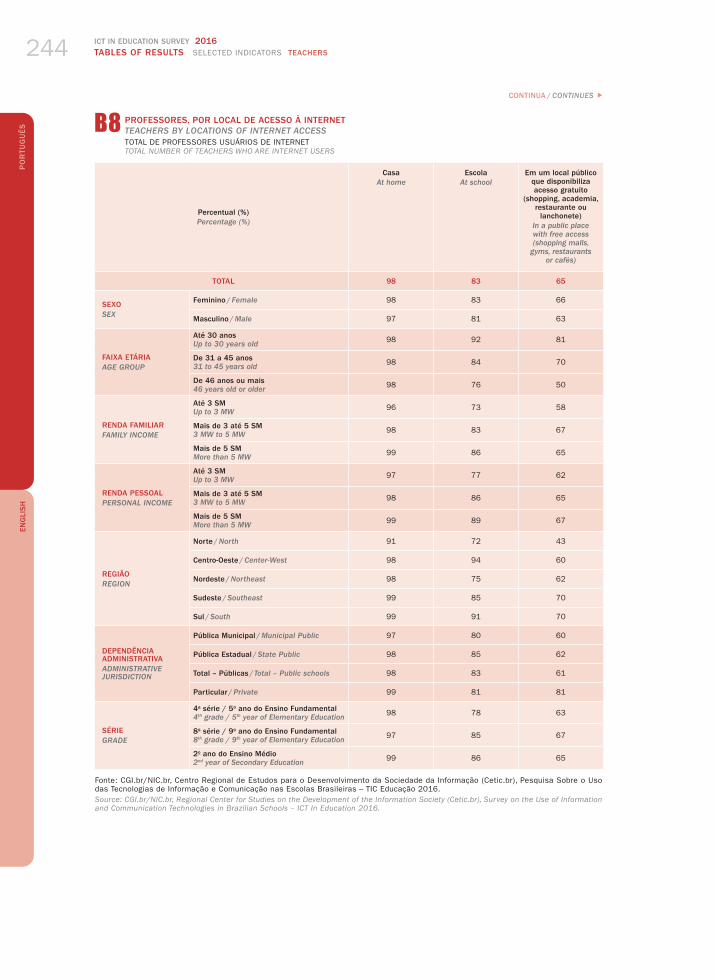
ICT IN EDUCATION SURVEY 2016TABLES OF RESULTS SELECTED INDICATORS TEACHERS244
EN
GLI
SH P
OR
TUG
UÊS
Percentual (%)Percentage (%)
CasaAt home
EscolaAt school
Em um local público que disponibiliza acesso gratuito
(shopping, academia, restaurante ou
lanchonete)In a public place with free access (shopping malls,
gyms, restaurants or cafés)
TOTAL 98 83 65
SEXOSEX
Feminino / Female 98 83 66
Masculino / Male 97 81 63
FAIXA ETÁRIAAGE GROUP
Até 30 anosUp to 30 years old 98 92 81
De 31 a 45 anos31 to 45 years old 98 84 70
De 46 anos ou mais46 years old or older 98 76 50
RENDA FAMILIARFAMILY INCOME
Até 3 SMUp to 3 MW 96 73 58
Mais de 3 até 5 SM3 MW to 5 MW 98 83 67
Mais de 5 SMMore than 5 MW 99 86 65
RENDA PESSOALPERSONAL INCOME
Até 3 SMUp to 3 MW 97 77 62
Mais de 3 até 5 SM3 MW to 5 MW 98 86 65
Mais de 5 SMMore than 5 MW 99 89 67
REGIÃOREGION
Norte / North 91 72 43
Centro-Oeste / Center-West 98 94 60
Nordeste / Northeast 98 75 62
Sudeste / Southeast 99 85 70
Sul / South 99 91 70
DEPENDÊNCIA ADMINISTRATIVAADMINISTRATIVE JURISDICTION
Pública Municipal / Municipal Public 97 80 60
Pública Estadual / State Public 98 85 62
Total – Públicas / Total – Public schools 98 83 61
Particular / Private 99 81 81
SÉRIEGRADE
4a série / 5o ano do Ensino Fundamental4th grade / 5th year of Elementary Education 98 78 63
8a série / 9o ano do Ensino Fundamental8th grade / 9th year of Elementary Education 97 85 67
2o ano do Ensino Médio2nd year of Secondary Education 99 86 65
Fonte: CGI.br/NIC.br, Centro Regional de Estudos para o Desenvolvimento da Sociedade da Informação (Cetic.br), Pesquisa Sobre o Uso das Tecnologias de Informação e Comunicação nas Escolas Brasileiras – TIC Educação 2016.Source: CGI.br/NIC.br, Regional Center for Studies on the Development of the Information Society (Cetic.br), Survey on the Use of Information and Communication Technologies in Brazilian Schools – ICT In Education 2016.
B8 PROFESSORES, POR LOCAL DE ACESSO À INTERNETTEACHERS BY LOCATIONS OF INTERNET ACCESSTOTAL DE PROFESSORES USUÁRIOS DE INTERNETTOTAL NUMBER OF TEACHERS WHO ARE INTERNET USERS
CONTINUA / CONTINUES �

2016 PESQUISA TIC EDUCAÇÃOPROFESSORES INDICADORES SELECIONADOS TABELAS DE RESULTADOS 245
EN
GLI
SH P
OR
TUG
UÊS
Percentual (%)Percentage (%)
Casa de outra pessoaAt someone else’s house
Em deslocamentoOn the move
Em algum outro estabelecimento
de ensinoAt any other educational institution
TOTAL 62 60 37
SEXOSEX
Feminino / Female 62 62 36
Masculino / Male 62 52 41
FAIXA ETÁRIAAGE GROUP
Até 30 anosUp to 30 years old 86 71 57
De 31 a 45 anos31 to 45 years old 67 66 40
De 46 anos ou mais46 years old or older 43 46 26
RENDA FAMILIARFAMILY INCOME
Até 3 SMUp to 3 MW 66 56 46
Mais de 3 até 5 SM3 MW to 5 MW 59 64 30
Mais de 5 SMMore than 5 MW 62 58 40
RENDA PESSOALPERSONAL INCOME
Até 3 SMUp to 3 MW 57 61 39
Mais de 3 até 5 SM3 MW to 5 MW 67 61 34
Mais de 5 SMMore than 5 MW 60 54 41
REGIÃOREGION
Norte / North 58 42 35
Centro-Oeste / Center-West 73 54 36
Nordeste / Northeast 61 54 40
Sudeste / Southeast 60 69 39
Sul / South 67 56 31
DEPENDÊNCIA ADMINISTRATIVAADMINISTRATIVE JURISDICTION
Pública Municipal / Municipal Public 59 55 41
Pública Estadual / State Public 62 58 32
Total – Públicas / Total – Public schools 61 57 36
Particular / Private 66 73 43
SÉRIEGRADE
4a série / 5o ano do Ensino Fundamental4th grade / 5th year of Elementary Education 58 58 35
8a série / 9o ano do Ensino Fundamental8th grade / 9th year of Elementary Education 68 62 45
2o ano do Ensino Médio2nd year of Secondary Education 61 61 33
Fonte: CGI.br/NIC.br, Centro Regional de Estudos para o Desenvolvimento da Sociedade da Informação (Cetic.br), Pesquisa Sobre o Uso das Tecnologias de Informação e Comunicação nas Escolas Brasileiras – TIC Educação 2016.Source: CGI.br/NIC.br, Regional Center for Studies on the Development of the Information Society (Cetic.br), Survey on the Use of Information and Communication Technologies in Brazilian Schools – ICT In Education 2016.
B8 PROFESSORES, POR LOCAL DE ACESSO À INTERNETTEACHERS BY LOCATIONS OF INTERNET ACCESSTOTAL DE PROFESSORES USUÁRIOS DE INTERNETTOTAL NUMBER OF TEACHERS WHO ARE INTERNET USERS
� CONTINUAÇÃO / CONTINUATION
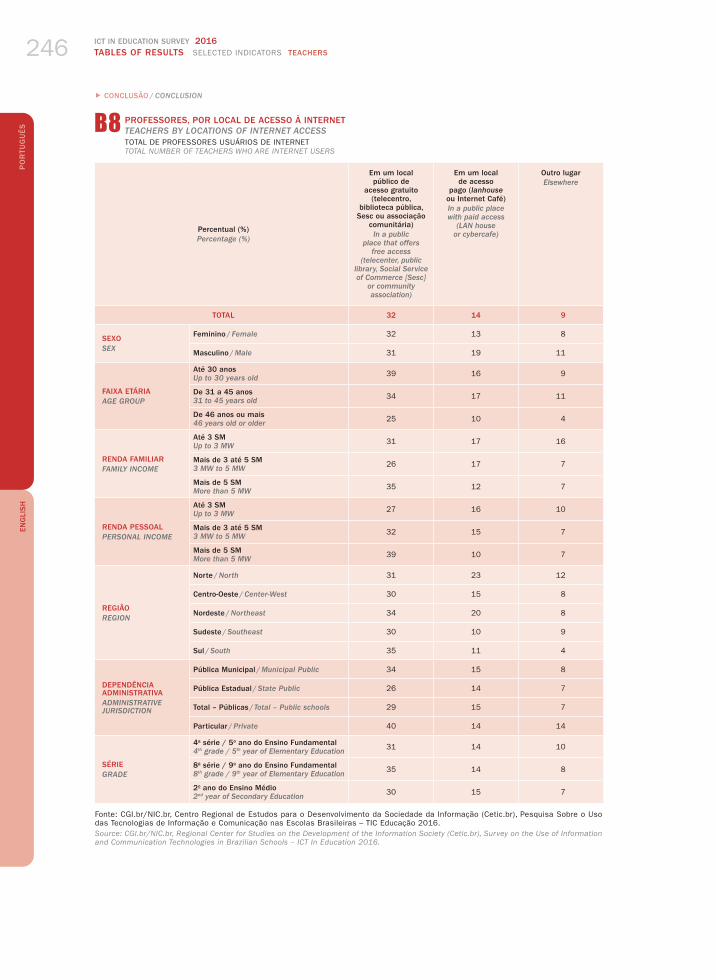
ICT IN EDUCATION SURVEY 2016TABLES OF RESULTS SELECTED INDICATORS TEACHERS246
EN
GLI
SH P
OR
TUG
UÊS B8 PROFESSORES, POR LOCAL DE ACESSO À INTERNET
TEACHERS BY LOCATIONS OF INTERNET ACCESSTOTAL DE PROFESSORES USUÁRIOS DE INTERNETTOTAL NUMBER OF TEACHERS WHO ARE INTERNET USERS
Percentual (%)Percentage (%)
Em um local público de
acesso gratuito (telecentro,
biblioteca pública, Sesc ou associação
comunitária)In a public
place that offers free access
(telecenter, public library, Social Service of Commerce [Sesc]
or community association)
Em um local de acesso
pago (lanhouse ou Internet Café)In a public place with paid access
(LAN house or cybercafe)
Outro lugarElsewhere
TOTAL 32 14 9
SEXOSEX
Feminino / Female 32 13 8
Masculino / Male 31 19 11
FAIXA ETÁRIAAGE GROUP
Até 30 anosUp to 30 years old 39 16 9
De 31 a 45 anos31 to 45 years old 34 17 11
De 46 anos ou mais46 years old or older 25 10 4
RENDA FAMILIARFAMILY INCOME
Até 3 SMUp to 3 MW 31 17 16
Mais de 3 até 5 SM3 MW to 5 MW 26 17 7
Mais de 5 SMMore than 5 MW 35 12 7
RENDA PESSOALPERSONAL INCOME
Até 3 SMUp to 3 MW 27 16 10
Mais de 3 até 5 SM3 MW to 5 MW 32 15 7
Mais de 5 SMMore than 5 MW 39 10 7
REGIÃOREGION
Norte / North 31 23 12
Centro-Oeste / Center-West 30 15 8
Nordeste / Northeast 34 20 8
Sudeste / Southeast 30 10 9
Sul / South 35 11 4
DEPENDÊNCIA ADMINISTRATIVAADMINISTRATIVE JURISDICTION
Pública Municipal / Municipal Public 34 15 8
Pública Estadual / State Public 26 14 7
Total – Públicas / Total – Public schools 29 15 7
Particular / Private 40 14 14
SÉRIEGRADE
4a série / 5o ano do Ensino Fundamental4th grade / 5th year of Elementary Education 31 14 10
8a série / 9o ano do Ensino Fundamental8th grade / 9th year of Elementary Education 35 14 8
2o ano do Ensino Médio2nd year of Secondary Education 30 15 7
Fonte: CGI.br/NIC.br, Centro Regional de Estudos para o Desenvolvimento da Sociedade da Informação (Cetic.br), Pesquisa Sobre o Uso das Tecnologias de Informação e Comunicação nas Escolas Brasileiras – TIC Educação 2016.Source: CGI.br/NIC.br, Regional Center for Studies on the Development of the Information Society (Cetic.br), Survey on the Use of Information and Communication Technologies in Brazilian Schools – ICT In Education 2016.
� CONCLUSÃO / CONCLUSION

2016 PESQUISA TIC EDUCAÇÃOPROFESSORES INDICADORES SELECIONADOS TABELAS DE RESULTADOS 247
EN
GLI
SH P
OR
TUG
UÊS
Percentual (%)Percentage (%)
CasaAt home
EscolaAt school
Casa de outra pessoaAt someone else’s house
TOTAL 86 12 1
SEXOSEX
Feminino / Female 86 12 1
Masculino / Male 87 11 1
FAIXA ETÁRIAAGE GROUP
Até 30 anosUp to 30 years old 89 7 0
De 31 a 45 anos31 to 45 years old 83 14 1
De 46 anos ou mais46 years old or older 90 9 1
RENDA FAMILIARFAMILY INCOME
Até 3 SMUp to 3 MW 89 7 2
Mais de 3 até 5 SM3 MW to 5 MW 85 13 1
Mais de 5 SMMore than 5 MW 86 12 1
RENDA PESSOALPERSONAL INCOME
Até 3 SMUp to 3 MW 88 9 1
Mais de 3 até 5 SM3 MW to 5 MW 85 12 1
Mais de 5 SMMore than 5 MW 84 15 0
REGIÃOREGION
Norte / North 76 15 2
Centro-Oeste / Center-West 80 13 6
Nordeste / Northeast 89 8 1
Sudeste / Southeast 87 12 0
Sul / South 87 13 0
DEPENDÊNCIA ADMINISTRATIVAADMINISTRATIVE JURISDICTION
Pública Municipal / Municipal Public 87 11 1
Pública Estadual / State Public 86 11 1
Total – Públicas / Total – Public schools 86 11 1
Particular / Private 85 14 0
SÉRIEGRADE
4a série / 5o ano do Ensino Fundamental4th grade / 5th year of Elementary Education 87 10 2
8a série / 9o ano do Ensino Fundamental8th grade / 9th year of Elementary Education 85 13 1
2o ano do Ensino Médio2nd year of Secondary Education 86 12 0
Fonte: CGI.br/NIC.br, Centro Regional de Estudos para o Desenvolvimento da Sociedade da Informação (Cetic.br), Pesquisa Sobre o Uso das Tecnologias de Informação e Comunicação nas Escolas Brasileiras – TIC Educação 2016.Source: CGI.br/NIC.br, Regional Center for Studies on the Development of the Information Society (Cetic.br), Survey on the Use of Information and Communication Technologies in Brazilian Schools – ICT In Education 2016.
B9 PROFESSORES, POR PRINCIPAL LOCAL DE ACESSO À INTERNETTEACHERS BY MAIN LOCATION OF INTERNET ACCESSTOTAL DE PROFESSORES USUÁRIOS DE INTERNETTOTAL NUMBER OF TEACHERS WHO ARE INTERNET USERS
CONTINUA / CONTINUES �

ICT IN EDUCATION SURVEY 2016TABLES OF RESULTS SELECTED INDICATORS TEACHERS248
EN
GLI
SH P
OR
TUG
UÊS
Percentual (%)Percentage (%)
Em algum outro estabelecimento
de ensinoAt any other educational institution
Em um local público de
acesso gratuito (telecentro,
biblioteca pública, Sesc ou associação
comunitária)In a public
place that offers free access
(telecenter, public library, Social Service of Commerce [Sesc]
or community association)
Em um local de acesso
pago (lanhouse ou Internet Café)In a public place with paid access
(LAN house or cybercafe)
TOTAL 0 0 0
SEXOSEX
Feminino / Female 0 0 0
Masculino / Male 0 0 0
FAIXA ETÁRIAAGE GROUP
Até 30 anosUp to 30 years old 0 0 0
De 31 a 45 anos31 to 45 years old 0 0 0
De 46 anos ou mais46 years old or older 0 0 0
RENDA FAMILIARFAMILY INCOME
Até 3 SMUp to 3 MW 0 0 1
Mais de 3 até 5 SM3 MW to 5 MW 0 0 0
Mais de 5 SMMore than 5 MW 0 0 0
RENDA PESSOALPERSONAL INCOME
Até 3 SMUp to 3 MW 0 0 0
Mais de 3 até 5 SM3 MW to 5 MW 0 0 0
Mais de 5 SMMore than 5 MW 0 0 0
REGIÃOREGION
Norte / North 0 0 2
Centro-Oeste / Center-West 0 0 0
Nordeste / Northeast 0 0 0
Sudeste / Southeast 0 0 0
Sul / South 0 0 0
DEPENDÊNCIA ADMINISTRATIVAADMINISTRATIVE JURISDICTION
Pública Municipal / Municipal Public 0 0 0
Pública Estadual / State Public 0 0 0
Total – Públicas / Total – Public schools 0 0 0
Particular / Private 0 0 0
SÉRIEGRADE
4a série / 5o ano do Ensino Fundamental4th grade / 5th year of Elementary Education 0 0 0
8a série / 9o ano do Ensino Fundamental8th grade / 9th year of Elementary Education 0 0 0
2o ano do Ensino Médio2nd year of Secondary Education 0 0 0
Fonte: CGI.br/NIC.br, Centro Regional de Estudos para o Desenvolvimento da Sociedade da Informação (Cetic.br), Pesquisa Sobre o Uso das Tecnologias de Informação e Comunicação nas Escolas Brasileiras – TIC Educação 2016.Source: CGI.br/NIC.br, Regional Center for Studies on the Development of the Information Society (Cetic.br), Survey on the Use of Information and Communication Technologies in Brazilian Schools – ICT In Education 2016.
B9 PROFESSORES, POR PRINCIPAL LOCAL DE ACESSO À INTERNETTEACHERS BY MAIN LOCATION OF INTERNET ACCESSTOTAL DE PROFESSORES USUÁRIOS DE INTERNETTOTAL NUMBER OF TEACHERS WHO ARE INTERNET USERS
� CONTINUAÇÃO / CONTINUATION

2016 PESQUISA TIC EDUCAÇÃOPROFESSORES INDICADORES SELECIONADOS TABELAS DE RESULTADOS 249
EN
GLI
SH P
OR
TUG
UÊS
Percentual (%)Percentage (%)
Em deslocamentoOn the move
Em um local público que disponibiliza acesso gratuito
(shopping, academia, restaurante ou
lanchonete)In a public place with free access (shopping malls,
gyms, restaurants or cafés)
Outro lugarElsewhere
TOTAL 0 0 0
SEXOSEX
Feminino / Female 0 0 0
Masculino / Male 1 0 0
FAIXA ETÁRIAAGE GROUP
Até 30 anosUp to 30 years old 1 1 1
De 31 a 45 anos31 to 45 years old 0 0 0
De 46 anos ou mais46 years old or older 0 0 0
RENDA FAMILIARFAMILY INCOME
Até 3 SMUp to 3 MW 0 0 0
Mais de 3 até 5 SM3 MW to 5 MW 1 0 0
Mais de 5 SMMore than 5 MW 0 0 0
RENDA PESSOALPERSONAL INCOME
Até 3 SMUp to 3 MW 0 0 0
Mais de 3 até 5 SM3 MW to 5 MW 1 0 1
Mais de 5 SMMore than 5 MW 0 0 0
REGIÃOREGION
Norte / North 2 1 1
Centro-Oeste / Center-West 0 0 0
Nordeste / Northeast 0 0 0
Sudeste / Southeast 0 0 0
Sul / South 0 0 0
DEPENDÊNCIA ADMINISTRATIVAADMINISTRATIVE JURISDICTION
Pública Municipal / Municipal Public 0 1 0
Pública Estadual / State Public 1 0 0
Total – Públicas / Total – Public schools 0 0 0
Particular / Private 0 0 0
SÉRIEGRADE
4a série / 5o ano do Ensino Fundamental4th grade / 5th year of Elementary Education 0 0 0
8a série / 9o ano do Ensino Fundamental8th grade / 9th year of Elementary Education 0 1 1
2o ano do Ensino Médio2nd year of Secondary Education 1 0 0
Fonte: CGI.br/NIC.br, Centro Regional de Estudos para o Desenvolvimento da Sociedade da Informação (Cetic.br), Pesquisa Sobre o Uso das Tecnologias de Informação e Comunicação nas Escolas Brasileiras – TIC Educação 2016.Source: CGI.br/NIC.br, Regional Center for Studies on the Development of the Information Society (Cetic.br), Survey on the Use of Information and Communication Technologies in Brazilian Schools – ICT In Education 2016.
B9 PROFESSORES, POR PRINCIPAL LOCAL DE ACESSO À INTERNETTEACHERS BY MAIN LOCATION OF INTERNET ACCESSTOTAL DE PROFESSORES USUÁRIOS DE INTERNETTOTAL NUMBER OF TEACHERS WHO ARE INTERNET USERS
� CONCLUSÃO / CONCLUSION

ICT IN EDUCATION SURVEY 2016TABLES OF RESULTS SELECTED INDICATORS TEACHERS250
EN
GLI
SH P
OR
TUG
UÊS B10 PROFESSORES QUE USARAM A INTERNET POR MEIO DO TELEFONE CELULAR NOS ÚLTIMOS TRÊS MESES
TEACHERS WHO USED THE INTERNET VIA MOBILE PHONES IN THE LAST THREE MONTHSTOTAL DE PROFESSORESTOTAL NUMBER OF TEACHERS
Percentual (%)Percentage (%)
SimYes
NãoNo
TOTAL 91 9
SEXOSEX
Feminino / Female 91 9
Masculino / Male 90 10
FAIXA ETÁRIAAGE GROUP
Até 30 anosUp to 30 years old 98 2
De 31 a 45 anos31 to 45 years old 93 7
De 46 anos ou mais46 years old or older 83 17
RENDA FAMILIARFAMILY INCOME
Até 3 SMUp to 3 MW 91 9
Mais de 3 até 5 SM3 MW to 5 MW 90 10
Mais de 5 SMMore than 5 MW 91 9
RENDA PESSOALPERSONAL INCOME
Até 3 SMUp to 3 MW 88 12
Mais de 3 até 5 SM3 MW to 5 MW 93 7
Mais de 5 SMMore than 5 MW 90 10
REGIÃOREGION
Norte / North 87 13
Centro-Oeste / Center-West 94 6
Nordeste / Northeast 86 14
Sudeste / Southeast 94 6
Sul / South 90 10
DEPENDÊNCIA ADMINISTRATIVAADMINISTRATIVE JURISDICTION
Pública Municipal / Municipal Public 88 12
Pública Estadual / State Public 93 7
Total – Públicas / Total – Public schools 90 10
Particular / Private 91 9
SÉRIEGRADE
4a série / 5o ano do Ensino Fundamental4th grade / 5th year of Elementary Education 89 11
8a série / 9o ano do Ensino Fundamental8th grade / 9th year of Elementary Education 90 10
2o ano do Ensino Médio2nd year of Secondary Education 93 7
Fonte: CGI.br/NIC.br, Centro Regional de Estudos para o Desenvolvimento da Sociedade da Informação (Cetic.br), Pesquisa Sobre o Uso das Tecnologias de Informação e Comunicação nas Escolas Brasileiras – TIC Educação 2016.Source: CGI.br/NIC.br, Regional Center for Studies on the Development of the Information Society (Cetic.br), Survey on the Use of Information and Communication Technologies in Brazilian Schools – ICT In Education 2016.

2016 PESQUISA TIC EDUCAÇÃOPROFESSORES INDICADORES SELECIONADOS TABELAS DE RESULTADOS 251
EN
GLI
SH P
OR
TUG
UÊSC4 PROFESSORES, POR ATIVIDADES REALIZADAS NA INTERNET
TEACHERS BY ACTIVITIES CARRIED OUT ON THE INTERNETTOTAL DE PROFESSORES USUÁRIOS DE INTERNETTOTAL NUMBER OF TEACHERS WHO ARE INTERNET USERS
Percentual (%)Percentage (%)
Procurar informação,
usando buscador
Using search engines to search for
information
Enviar mensagens
instantâneasSending instant
messages
Enviar e-mailsSending e-mails
Participar de redes sociaisParticipating
in social networking websites
TOTAL 98 94 91 87
SEXOSEX
Feminino / Female 98 95 90 89
Masculino / Male 97 91 95 80
FAIXA ETÁRIAAGE GROUP
Até 30 anosUp to 30 years old 100 95 97 91
De 31 a 45 anos31 to 45 years old 99 96 91 89
De 46 anos ou mais46 years old or older 95 90 91 81
RENDA FAMILIARFAMILY INCOME
Até 3 SMUp to 3 MW 96 91 84 88
Mais de 3 até 5 SM3 MW to 5 MW 99 96 92 89
Mais de 5 SMMore than 5 MW 98 94 93 85
RENDA PESSOALPERSONAL INCOME
Até 3 SMUp to 3 MW 98 94 88 88
Mais de 3 até 5 SM3 MW to 5 MW 98 94 93 86
Mais de 5 SMMore than 5 MW 97 95 95 85
REGIÃOREGION
Norte / North 95 93 83 79
Centro-Oeste / Center-West 98 96 90 89
Nordeste / Northeast 98 93 84 88
Sudeste / Southeast 98 95 96 87
Sul / South 99 93 96 88
DEPENDÊNCIA ADMINISTRATIVAADMINISTRATIVE JURISDICTION
Pública Municipal / Municipal Public 96 92 88 88
Pública Estadual / State Public 98 94 94 85
Total – Públicas / Total – Public schools 97 93 91 86
Particular / Private 100 99 91 89
SÉRIEGRADE
4a série / 5o ano do Ensino Fundamental4th grade / 5th year of Elementary Education 97 94 85 90
8a série / 9o ano do Ensino Fundamental8th grade / 9th year of Elementary Education 98 96 96 88
2o ano do Ensino Médio2nd year of Secondary Education 98 93 95 83
Fonte: CGI.br/NIC.br, Centro Regional de Estudos para o Desenvolvimento da Sociedade da Informação (Cetic.br), Pesquisa Sobre o Uso das Tecnologias de Informação e Comunicação nas Escolas Brasileiras – TIC Educação 2016.Source: CGI.br/NIC.br, Regional Center for Studies on the Development of the Information Society (Cetic.br), Survey on the Use of Information and Communication Technologies in Brazilian Schools – ICT In Education 2016.
CONTINUA / CONTINUES �

ICT IN EDUCATION SURVEY 2016TABLES OF RESULTS SELECTED INDICATORS TEACHERS252
EN
GLI
SH P
OR
TUG
UÊS C4 PROFESSORES, POR ATIVIDADES REALIZADAS NA INTERNET
TEACHERS BY ACTIVITIES CARRIED OUT ON THE INTERNETTOTAL DE PROFESSORES USUÁRIOS DE INTERNETTOTAL NUMBER OF TEACHERS WHO ARE INTERNET USERS
Percentual (%)Percentage (%)
Configurar as opções de segurança e
privacidade das redes sociaisConfiguring security and
privacy options in social
networking websites
Baixar e instalar
software ou programas de computadorDownloading and installing
software
Participar de cursos
on-line pela Internet
Participating in online
courses via the Internet
Participar de fóruns ou
grupos de discussão
on-lineTaking part in online
discussion forums or
groups
TOTAL 67 53 40 39
SEXOSEX
Feminino / Female 66 49 40 37
Masculino / Male 68 68 40 43
FAIXA ETÁRIAAGE GROUP
Até 30 anosUp to 30 years old 78 69 44 45
De 31 a 45 anos31 to 45 years old 68 56 42 41
De 46 anos ou mais46 years old or older 61 43 34 33
RENDA FAMILIARFAMILY INCOME
Até 3 SMUp to 3 MW 66 53 28 26
Mais de 3 até 5 SM3 MW to 5 MW 65 50 37 38
Mais de 5 SMMore than 5 MW 67 55 46 44
RENDA PESSOALPERSONAL INCOME
Até 3 SMUp to 3 MW 66 50 35 33
Mais de 3 até 5 SM3 MW to 5 MW 69 55 44 43
Mais de 5 SMMore than 5 MW 63 54 42 43
REGIÃOREGION
Norte / North 63 47 29 29
Centro-Oeste / Center-West 70 57 43 39
Nordeste / Northeast 64 51 37 36
Sudeste / Southeast 70 56 43 43
Sul / South 63 49 40 34
DEPENDÊNCIA ADMINISTRATIVAADMINISTRATIVE JURISDICTION
Pública Municipal / Municipal Public 64 52 39 34
Pública Estadual / State Public 69 53 43 42
Total – Públicas / Total – Public schools 67 52 41 38
Particular / Private 66 57 35 41
SÉRIEGRADE
4a série / 5o ano do Ensino Fundamental4th grade / 5th year of Elementary Education 64 49 37 33
8a série / 9o ano do Ensino Fundamental8th grade / 9th year of Elementary Education 66 56 43 41
2o ano do Ensino Médio2nd year of Secondary Education 70 56 41 43
Fonte: CGI.br/NIC.br, Centro Regional de Estudos para o Desenvolvimento da Sociedade da Informação (Cetic.br), Pesquisa Sobre o Uso das Tecnologias de Informação e Comunicação nas Escolas Brasileiras – TIC Educação 2016.Source: CGI.br/NIC.br, Regional Center for Studies on the Development of the Information Society (Cetic.br), Survey on the Use of Information and Communication Technologies in Brazilian Schools – ICT In Education 2016.
� CONTINUAÇÃO / CONTINUATION

2016 PESQUISA TIC EDUCAÇÃOPROFESSORES INDICADORES SELECIONADOS TABELAS DE RESULTADOS 253
EN
GLI
SH P
OR
TUG
UÊSC4 PROFESSORES, POR ATIVIDADES REALIZADAS NA INTERNET
TEACHERS BY ACTIVITIES CARRIED OUT ON THE INTERNETTOTAL DE PROFESSORES USUÁRIOS DE INTERNETTOTAL NUMBER OF TEACHERS WHO ARE INTERNET USERS
Percentual (%)Percentage (%)
Postar filmes ou vídeos
pela InternetPosting films
or videos on the Internet
Criar e atualizar blogs e páginas
na InternetCreating or
updating blogs and Internet pages
Usar a Internet para realizar chamadas ou
conversas através do Skype
Using the Internet to chat or make
calls through Skype
TOTAL 38 31 28
SEXOSEX
Feminino / Female 39 32 28
Masculino / Male 35 30 28
FAIXA ETÁRIAAGE GROUP
Até 30 anosUp to 30 years old 48 39 31
De 31 a 45 anos31 to 45 years old 38 31 31
De 46 anos ou mais46 years old or older 35 30 21
RENDA FAMILIARFAMILY INCOME
Até 3 SMUp to 3 MW 48 37 28
Mais de 3 até 5 SM3 MW to 5 MW 32 25 29
Mais de 5 SMMore than 5 MW 39 34 25
RENDA PESSOALPERSONAL INCOME
Até 3 SMUp to 3 MW 38 31 30
Mais de 3 até 5 SM3 MW to 5 MW 40 30 24
Mais de 5 SMMore than 5 MW 35 36 27
REGIÃOREGION
Norte / North 37 24 25
Centro-Oeste / Center-West 45 38 39
Nordeste / Northeast 46 31 24
Sudeste / Southeast 34 33 29
Sul / South 35 29 27
DEPENDÊNCIA ADMINISTRATIVAADMINISTRATIVE JURISDICTION
Pública Municipal / Municipal Public 40 32 22
Pública Estadual / State Public 36 31 28
Total – Públicas / Total – Public schools 38 32 26
Particular / Private 40 31 36
SÉRIEGRADE
4a série / 5o ano do Ensino Fundamental4th grade / 5th year of Elementary Education 39 30 28
8a série / 9o ano do Ensino Fundamental8th grade / 9th year of Elementary Education 39 36 27
2o ano do Ensino Médio2nd year of Secondary Education 37 30 27
Fonte: CGI.br/NIC.br, Centro Regional de Estudos para o Desenvolvimento da Sociedade da Informação (Cetic.br), Pesquisa Sobre o Uso das Tecnologias de Informação e Comunicação nas Escolas Brasileiras – TIC Educação 2016.Source: CGI.br/NIC.br, Regional Center for Studies on the Development of the Information Society (Cetic.br), Survey on the Use of Information and Communication Technologies in Brazilian Schools – ICT In Education 2016.
� CONCLUSÃO / CONCLUSION

ICT IN EDUCATION SURVEY 2016TABLES OF RESULTS SELECTED INDICATORS TEACHERS254
EN
GLI
SH P
OR
TUG
UÊS D1A PROFESSORES, POR FORMA DE APRENDIZADO E ATUALIZAÇÃO NO USO DO COMPUTADOR E DA INTERNET
TEACHERS BY HOW THEY LEARN ABOUT AND UPDATE THEMSELVES ON COMPUTER AND INTERNET USETOTAL DE PROFESSORESTOTAL NUMBER OF TEACHERS
Percentual (%)Percentage (%)
Sozinho(a)Self-taught
Com outras pessoas
With other people
Contatos informais
com outros professores
Informal chats with other teachers
Com vídeos ou tutoriais
on-lineWith online videos or tutorials
TOTAL 91 83 78 67
SEXOSEX
Feminino / Female 90 84 78 65
Masculino / Male 95 79 78 75
FAIXA ETÁRIAAGE GROUP
Até 30 anosUp to 30 years old 96 79 72 81
De 31 a 45 anos31 to 45 years old 94 81 79 67
De 46 anos ou mais46 years old or older 83 86 79 62
RENDA FAMILIARFAMILY INCOME
Até 3 SMUp to 3 MW 84 92 74 57
Mais de 3 até 5 SM3 MW to 5 MW 93 79 79 65
Mais de 5 SMMore than 5 MW 92 83 80 72
RENDA PESSOALPERSONAL INCOME
Até 3 SMUp to 3 MW 89 82 76 57
Mais de 3 até 5 SM3 MW to 5 MW 92 82 81 74
Mais de 5 SMMore than 5 MW 93 86 79 74
REGIÃOREGION
Norte / North 88 80 73 64
Centro-Oeste / Center-West 91 85 80 74
Nordeste / Northeast 88 87 79 69
Sudeste / Southeast 93 80 78 67
Sul / South 92 83 83 65
DEPENDÊNCIA ADMINISTRATIVAADMINISTRATIVE JURISDICTION
Pública Municipal / Municipal Public 89 87 81 67
Pública Estadual / State Public 93 80 78 69
Total – Públicas / Total – Public schools 91 83 80 68
Particular / Private 91 81 73 62
SÉRIEGRADE
4a série / 5o ano do Ensino Fundamental4th grade / 5th year of Elementary Education 88 88 77 61
8a série / 9o ano do Ensino Fundamental8th grade / 9th year of Elementary Education 91 83 78 72
2o ano do Ensino Médio2nd year of Secondary Education 95 76 80 70
Fonte: CGI.br/NIC.br, Centro Regional de Estudos para o Desenvolvimento da Sociedade da Informação (Cetic.br), Pesquisa Sobre o Uso das Tecnologias de Informação e Comunicação nas Escolas Brasileiras – TIC Educação 2016.Source: CGI.br/NIC.br, Regional Center for Studies on the Development of the Information Society (Cetic.br), Survey on the Use of Information and Communication Technologies in Brazilian Schools – ICT In Education 2016.
CONTINUA / CONTINUES �

2016 PESQUISA TIC EDUCAÇÃOPROFESSORES INDICADORES SELECIONADOS TABELAS DE RESULTADOS 255
EN
GLI
SH P
OR
TUG
UÊSD1A PROFESSORES, POR FORMA DE APRENDIZADO E ATUALIZAÇÃO NO USO DO COMPUTADOR E DA INTERNET
TEACHERS BY HOW THEY LEARN ABOUT AND UPDATE THEMSELVES ON COMPUTER AND INTERNET USETOTAL DE PROFESSORESTOTAL NUMBER OF TEACHERS
Percentual (%)Percentage (%)
Com alunosWith students
Algum grupo de professores
da própria escola
With a group of teachers
from the school
Revistas e textos
especializados sobre
computador e InternetReading
specialized magazines and
texts about computers and
the Internet
Cursos específicos
sobre computador e InternetTaking a specific
course about computers and
the Internet
TOTAL 50 47 42 37
SEXOSEX
Feminino / Female 53 49 40 36
Masculino / Male 41 39 48 40
FAIXA ETÁRIAAGE GROUP
Até 30 anosUp to 30 years old 48 33 40 37
De 31 a 45 anos31 to 45 years old 55 49 43 38
De 46 anos ou mais46 years old or older 43 48 40 35
RENDA FAMILIARFAMILY INCOME
Até 3 SMUp to 3 MW 43 42 37 33
Mais de 3 até 5 SM3 MW to 5 MW 55 45 42 35
Mais de 5 SMMore than 5 MW 50 50 43 41
RENDA PESSOALPERSONAL INCOME
Até 3 SMUp to 3 MW 52 46 40 36
Mais de 3 até 5 SM3 MW to 5 MW 47 45 41 37
Mais de 5 SMMore than 5 MW 53 51 48 43
REGIÃOREGION
Norte / North 38 42 43 33
Centro-Oeste / Center-West 40 48 43 49
Nordeste / Northeast 52 52 42 38
Sudeste / Southeast 52 44 42 38
Sul / South 53 49 37 30
DEPENDÊNCIA ADMINISTRATIVAADMINISTRATIVE JURISDICTION
Pública Municipal / Municipal Public 46 50 45 41
Pública Estadual / State Public 49 46 40 35
Total – Públicas / Total – Public schools 48 48 43 37
Particular / Private 62 44 38 36
SÉRIEGRADE
4a série / 5o ano do Ensino Fundamental4th grade / 5th year of Elementary Education 48 50 40 38
8a série / 9o ano do Ensino Fundamental8th grade / 9th year of Elementary Education 55 49 44 41
2o ano do Ensino Médio2nd year of Secondary Education 49 41 41 32
Fonte: CGI.br/NIC.br, Centro Regional de Estudos para o Desenvolvimento da Sociedade da Informação (Cetic.br), Pesquisa Sobre o Uso das Tecnologias de Informação e Comunicação nas Escolas Brasileiras – TIC Educação 2016.Source: CGI.br/NIC.br, Regional Center for Studies on the Development of the Information Society (Cetic.br), Survey on the Use of Information and Communication Technologies in Brazilian Schools – ICT In Education 2016.
� CONTINUAÇÃO / CONTINUATION

ICT IN EDUCATION SURVEY 2016TABLES OF RESULTS SELECTED INDICATORS TEACHERS256
EN
GLI
SH P
OR
TUG
UÊS D1A PROFESSORES, POR FORMA DE APRENDIZADO E ATUALIZAÇÃO NO USO DO COMPUTADOR E DA INTERNET
TEACHERS BY HOW THEY LEARN ABOUT AND UPDATE THEMSELVES ON COMPUTER AND INTERNET USETOTAL DE PROFESSORESTOTAL NUMBER OF TEACHERS
Percentual (%)Percentage (%)
Formadores de outras organizações externas à escola
Trainers from organizations external
to the school
Coordenador(a) pedagógico(a)With a director
of studies
Formadores da secretaria de ensino
Trainers from the Department of
Education
TOTAL 34 34 21
SEXOSEX
Feminino / Female 35 36 22
Masculino / Male 34 27 20
FAIXA ETÁRIAAGE GROUP
Até 30 anosUp to 30 years old 31 25 18
De 31 a 45 anos31 to 45 years old 32 32 20
De 46 anos ou mais46 years old or older 39 40 25
RENDA FAMILIARFAMILY INCOME
Até 3 SMUp to 3 MW 38 38 18
Mais de 3 até 5 SM3 MW to 5 MW 31 36 20
Mais de 5 SMMore than 5 MW 35 31 24
RENDA PESSOALPERSONAL INCOME
Até 3 SMUp to 3 MW 31 37 17
Mais de 3 até 5 SM3 MW to 5 MW 35 34 25
Mais de 5 SMMore than 5 MW 40 29 24
REGIÃOREGION
Norte / North 37 23 17
Centro-Oeste / Center-West 42 36 25
Nordeste / Northeast 31 35 18
Sudeste / Southeast 34 35 21
Sul / South 37 34 31
DEPENDÊNCIA ADMINISTRATIVAADMINISTRATIVE JURISDICTION
Pública Municipal / Municipal Public 44 37 27
Pública Estadual / State Public 31 31 23
Total – Públicas / Total – Public schools 36 34 24
Particular / Private 27 36 9
SÉRIEGRADE
4a série / 5o ano do Ensino Fundamental4th grade / 5th year of Elementary Education 35 43 20
8a série / 9o ano do Ensino Fundamental8th grade / 9th year of Elementary Education 36 28 23
2o ano do Ensino Médio2nd year of Secondary Education 32 29 22
Fonte: CGI.br/NIC.br, Centro Regional de Estudos para o Desenvolvimento da Sociedade da Informação (Cetic.br), Pesquisa Sobre o Uso das Tecnologias de Informação e Comunicação nas Escolas Brasileiras – TIC Educação 2016.Source: CGI.br/NIC.br, Regional Center for Studies on the Development of the Information Society (Cetic.br), Survey on the Use of Information and Communication Technologies in Brazilian Schools – ICT In Education 2016.
� CONTINUAÇÃO / CONTINUATION

2016 PESQUISA TIC EDUCAÇÃOPROFESSORES INDICADORES SELECIONADOS TABELAS DE RESULTADOS 257
EN
GLI
SH P
OR
TUG
UÊSD1A PROFESSORES, POR FORMA DE APRENDIZADO E ATUALIZAÇÃO NO USO DO COMPUTADOR E DA INTERNET
TEACHERS BY HOW THEY LEARN ABOUT AND UPDATE THEMSELVES ON COMPUTER AND INTERNET USETOTAL DE PROFESSORESTOTAL NUMBER OF TEACHERS
Percentual (%)Percentage (%)
Diretor(a) da escola
School principal
Monitor(a) ou responsável pela
sala de informática da escola
Monitor or person responsible
for the school computer lab
Outra formaOther
TOTAL 21 19 1
SEXOSEX
Feminino / Female 23 20 1
Masculino / Male 16 16 0
FAIXA ETÁRIAAGE GROUP
Até 30 anosUp to 30 years old 17 13 1
De 31 a 45 anos31 to 45 years old 21 19 1
De 46 anos ou mais46 years old or older 23 22 0
RENDA FAMILIARFAMILY INCOME
Até 3 SMUp to 3 MW 25 19 1
Mais de 3 até 5 SM3 MW to 5 MW 20 15 0
Mais de 5 SMMore than 5 MW 21 23 0
RENDA PESSOALPERSONAL INCOME
Até 3 SMUp to 3 MW 21 18 1
Mais de 3 até 5 SM3 MW to 5 MW 22 21 0
Mais de 5 SMMore than 5 MW 20 20 0
REGIÃOREGION
Norte / North 16 17 2
Centro-Oeste / Center-West 25 30 0
Nordeste / Northeast 20 11 0
Sudeste / Southeast 23 20 0
Sul / South 20 31 0
DEPENDÊNCIA ADMINISTRATIVAADMINISTRATIVE JURISDICTION
Pública Municipal / Municipal Public 25 28 0
Pública Estadual / State Public 19 12 1
Total – Públicas / Total – Public schools 22 19 0
Particular / Private 19 20 1
SÉRIEGRADE
4a série / 5o ano do Ensino Fundamental4th grade / 5th year of Elementary Education 27 23 1
8a série / 9o ano do Ensino Fundamental8th grade / 9th year of Elementary Education 16 21 1
2o ano do Ensino Médio2nd year of Secondary Education 19 12 0
Fonte: CGI.br/NIC.br, Centro Regional de Estudos para o Desenvolvimento da Sociedade da Informação (Cetic.br), Pesquisa Sobre o Uso das Tecnologias de Informação e Comunicação nas Escolas Brasileiras – TIC Educação 2016.Source: CGI.br/NIC.br, Regional Center for Studies on the Development of the Information Society (Cetic.br), Survey on the Use of Information and Communication Technologies in Brazilian Schools – ICT In Education 2016.
� CONCLUSÃO / CONCLUSION

ICT IN EDUCATION SURVEY 2016TABLES OF RESULTS SELECTED INDICATORS TEACHERS258
EN
GLI
SH P
OR
TUG
UÊS D2 PROFESSORES, POR MODO DE ACESSO AO CURSO DE CAPACITAÇÃO
TEACHERS BY HOW THEY GAINED ACCESS TO TRAININGTOTAL DE PROFESSORESTOTAL NUMBER OF TEACHERS
Percentual (%)Percentage (%)
Oferecido pelo governo ou
Secretarias de Educação
Provided by the government /Department of Education
Pago com recursos própriosPaid for
the course themselves
Oferecido pela escola
durante treinamentosProvided by the school, in training sessions
Oferecido por uma
instituição de Ensino SuperiorProvided
by a higher education institution
or university
TOTAL 15 12 11 7
SEXOSEX
Feminino / Female 15 13 11 7
Masculino / Male 17 10 11 10
FAIXA ETÁRIAAGE GROUP
Até 30 anosUp to 30 years old 12 6 7 12
De 31 a 45 anos31 to 45 years old 16 15 12 6
De 46 anos ou mais46 years old or older 14 10 9 7
RENDA FAMILIARFAMILY INCOME
Até 3 SMUp to 3 MW 8 13 6 5
Mais de 3 até 5 SM3 MW to 5 MW 17 12 12 6
Mais de 5 SMMore than 5 MW 17 12 12 9
RENDA PESSOALPERSONAL INCOME
Até 3 SMUp to 3 MW 12 14 9 6
Mais de 3 até 5 SM3 MW to 5 MW 20 9 14 8
Mais de 5 SMMore than 5 MW 15 12 10 9
REGIÃOREGION
Norte / North 15 10 12 9
Centro-Oeste / Center-West 20 9 16 5
Nordeste / Northeast 13 11 5 5
Sudeste / Southeast 12 14 10 8
Sul / South 29 10 22 11
DEPENDÊNCIA ADMINISTRATIVAADMINISTRATIVE JURISDICTION
Pública Municipal / Municipal Public 15 14 9 5
Pública Estadual / State Public 20 10 11 8
Total – Públicas / Total – Public schools 18 11 10 7
Particular / Private 4 15 12 9
SÉRIEGRADE
4a série / 5o ano do Ensino Fundamental4th grade / 5th year of Elementary Education 10 14 9 3
8a série / 9o ano do Ensino Fundamental8th grade / 9th year of Elementary Education 17 15 11 12
2o ano do Ensino Médio2nd year of Secondary Education 19 7 12 8
Fonte: CGI.br/NIC.br, Centro Regional de Estudos para o Desenvolvimento da Sociedade da Informação (Cetic.br), Pesquisa Sobre o Uso das Tecnologias de Informação e Comunicação nas Escolas Brasileiras – TIC Educação 2016.Source: CGI.br/NIC.br, Regional Center for Studies on the Development of the Information Society (Cetic.br), Survey on the Use of Information and Communication Technologies in Brazilian Schools – ICT In Education 2016.
CONTINUA / CONTINUES �

2016 PESQUISA TIC EDUCAÇÃOPROFESSORES INDICADORES SELECIONADOS TABELAS DE RESULTADOS 259
EN
GLI
SH P
OR
TUG
UÊSD2 PROFESSORES, POR MODO DE ACESSO AO CURSO DE CAPACITAÇÃO
TEACHERS BY HOW THEY GAINED ACCESS TO TRAININGTOTAL DE PROFESSORESTOTAL NUMBER OF TEACHERS
Percentual (%)Percentage (%)
Oferecido por uma empresa,
ONG, associação, telecentro ou alguma outra
entidadeProvided by a company,
NGO, association, telecenter or other entity
OutroOther
Não fez um curso
de educação continuadaDid not take a continuing education
course
TOTAL 3 0 70
SEXOSEX
Feminino / Female 3 0 70
Masculino / Male 6 1 68
FAIXA ETÁRIAAGE GROUP
Até 30 anosUp to 30 years old 4 0 73
De 31 a 45 anos31 to 45 years old 3 0 67
De 46 anos ou mais46 years old or older 3 0 73
RENDA FAMILIARFAMILY INCOME
Até 3 SMUp to 3 MW 5 0 76
Mais de 3 até 5 SM3 MW to 5 MW 3 0 68
Mais de 5 SMMore than 5 MW 2 0 69
RENDA PESSOALPERSONAL INCOME
Até 3 SMUp to 3 MW 4 0 71
Mais de 3 até 5 SM3 MW to 5 MW 3 1 68
Mais de 5 SMMore than 5 MW 1 0 70
REGIÃOREGION
Norte / North 4 1 70
Centro-Oeste / Center-West 3 0 70
Nordeste / Northeast 3 0 75
Sudeste / Southeast 3 0 70
Sul / South 4 0 57
DEPENDÊNCIA ADMINISTRATIVAADMINISTRATIVE JURISDICTION
Pública Municipal / Municipal Public 3 0 71
Pública Estadual / State Public 4 0 69
Total – Públicas / Total – Public schools 3 0 70
Particular / Private 3 0 70
SÉRIEGRADE
4a série / 5o ano do Ensino Fundamental4th grade / 5th year of Elementary Education 2 0 73
8a série / 9o ano do Ensino Fundamental8th grade / 9th year of Elementary Education 3 1 65
2o ano do Ensino Médio2nd year of Secondary Education 4 0 70
Fonte: CGI.br/NIC.br, Centro Regional de Estudos para o Desenvolvimento da Sociedade da Informação (Cetic.br), Pesquisa Sobre o Uso das Tecnologias de Informação e Comunicação nas Escolas Brasileiras – TIC Educação 2016.Source: CGI.br/NIC.br, Regional Center for Studies on the Development of the Information Society (Cetic.br), Survey on the Use of Information and Communication Technologies in Brazilian Schools – ICT In Education 2016.
� CONCLUSÃO / CONCLUSION

ICT IN EDUCATION SURVEY 2016TABLES OF RESULTS SELECTED INDICATORS TEACHERS260
EN
GLI
SH P
OR
TUG
UÊS D4 PROFESSORES QUE CURSARAM DISCIPLINA ESPECÍFICA SOBRE COMO USAR COMPUTADOR E INTERNET EM
ATIVIDADES COM ALUNOS NA GRADUAÇÃOTEACHERS WHOSE TERTIARY EDUCATION INCLUDED A SPECIFIC SUBJECT ON HOW TO USE COMPUTERS AND THE INTERNET IN ACTIVITIES WITH STUDENTSTOTAL DE PROFESSORESTOTAL NUMBER OF TEACHERS
Percentual (%)Percentage (%)
SimYes
NãoNo
Não sabeDoes not
know
Não respondeu
Did not answer
Não possui formação de nível superiorDoes not have a Tertiary
Education degree
TOTAL 43 54 1 0 3
SEXOSEX
Feminino / Female 41 56 1 0 3
Masculino / Male 50 47 0 0 3
FAIXA ETÁRIAAGE GROUP
Até 30 anosUp to 30 years old 64 34 0 0 2
De 31 a 45 anos31 to 45 years old 40 55 1 0 4
De 46 anos ou mais46 years old or older 40 58 0 0 2
RENDA FAMILIARFAMILY INCOME
Até 3 SMUp to 3 MW 40 49 0 0 11
Mais de 3 até 5 SM3 MW to 5 MW 42 54 1 0 3
Mais de 5 SMMore than 5 MW 45 54 0 0 0
RENDA PESSOALPERSONAL INCOME
Até 3 SMUp to 3 MW 42 52 0 0 6
Mais de 3 até 5 SM3 MW to 5 MW 44 55 0 0 1
Mais de 5 SMMore than 5 MW 44 55 0 1 0
REGIÃOREGION
Norte / North 51 47 1 0 1
Centro-Oeste / Center-West 47 52 0 0 0
Nordeste / Northeast 44 51 0 0 4
Sudeste / Southeast 42 53 1 0 3
Sul / South 35 64 0 0 0
DEPENDÊNCIA ADMINISTRATIVAADMINISTRATIVE JURISDICTION
Pública Municipal / Municipal Public 46 46 1 0 7
Pública Estadual / State Public 40 59 0 0 1
Total – Públicas / Total – Public schools 43 53 1 0 3
Particular / Private 43 55 0 1 1
SÉRIEGRADE
4a série / 5o ano do Ensino Fundamental4th grade / 5th year of Elementary Education 45 47 1 0 7
8a série / 9o ano do Ensino Fundamental8th grade / 9th year of Elementary Education 46 53 1 0 1
2o ano do Ensino Médio2nd year of Secondary Education 38 62 0 0 0
Fonte: CGI.br/NIC.br, Centro Regional de Estudos para o Desenvolvimento da Sociedade da Informação (Cetic.br), Pesquisa Sobre o Uso das Tecnologias de Informação e Comunicação nas Escolas Brasileiras – TIC Educação 2016.Source: CGI.br/NIC.br, Regional Center for Studies on the Development of the Information Society (Cetic.br), Survey on the Use of Information and Communication Technologies in Brazilian Schools – ICT In Education 2016.
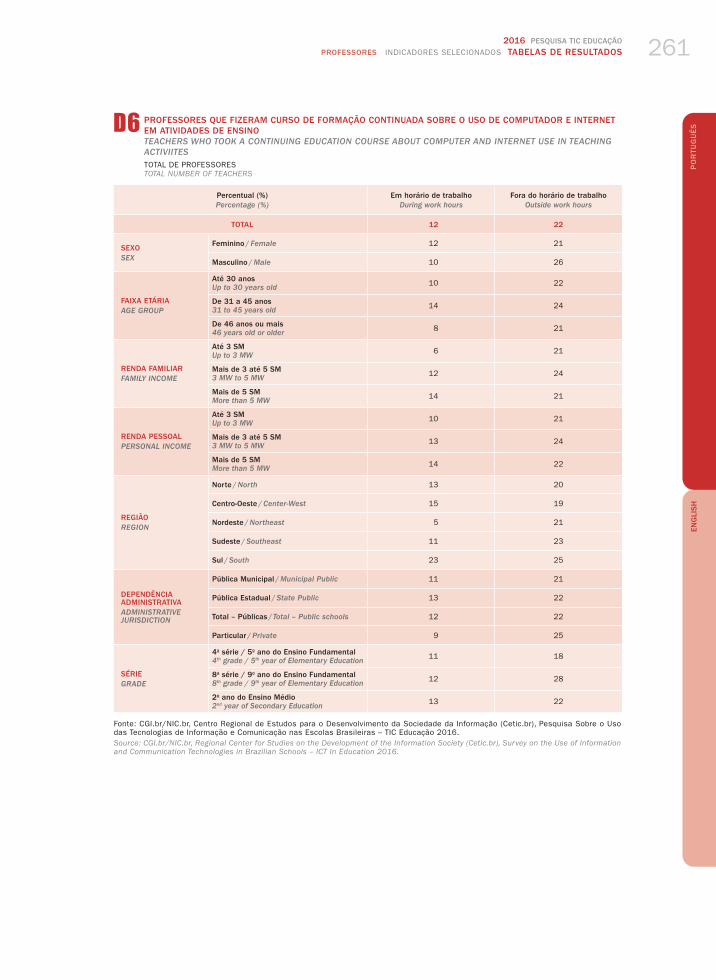
2016 PESQUISA TIC EDUCAÇÃOPROFESSORES INDICADORES SELECIONADOS TABELAS DE RESULTADOS 261
EN
GLI
SH P
OR
TUG
UÊSD6 PROFESSORES QUE FIZERAM CURSO DE FORMAÇÃO CONTINUADA SOBRE O USO DE COMPUTADOR E INTERNET
EM ATIVIDADES DE ENSINOTEACHERS WHO TOOK A CONTINUING EDUCATION COURSE ABOUT COMPUTER AND INTERNET USE IN TEACHING ACTIVIITESTOTAL DE PROFESSORESTOTAL NUMBER OF TEACHERS
Percentual (%)Percentage (%)
Em horário de trabalhoDuring work hours
Fora do horário de trabalhoOutside work hours
TOTAL 12 22
SEXOSEX
Feminino / Female 12 21
Masculino / Male 10 26
FAIXA ETÁRIAAGE GROUP
Até 30 anosUp to 30 years old 10 22
De 31 a 45 anos31 to 45 years old 14 24
De 46 anos ou mais46 years old or older 8 21
RENDA FAMILIARFAMILY INCOME
Até 3 SMUp to 3 MW 6 21
Mais de 3 até 5 SM3 MW to 5 MW 12 24
Mais de 5 SMMore than 5 MW 14 21
RENDA PESSOALPERSONAL INCOME
Até 3 SMUp to 3 MW 10 21
Mais de 3 até 5 SM3 MW to 5 MW 13 24
Mais de 5 SMMore than 5 MW 14 22
REGIÃOREGION
Norte / North 13 20
Centro-Oeste / Center-West 15 19
Nordeste / Northeast 5 21
Sudeste / Southeast 11 23
Sul / South 23 25
DEPENDÊNCIA ADMINISTRATIVAADMINISTRATIVE JURISDICTION
Pública Municipal / Municipal Public 11 21
Pública Estadual / State Public 13 22
Total – Públicas / Total – Public schools 12 22
Particular / Private 9 25
SÉRIEGRADE
4a série / 5o ano do Ensino Fundamental4th grade / 5th year of Elementary Education 11 18
8a série / 9o ano do Ensino Fundamental8th grade / 9th year of Elementary Education 12 28
2o ano do Ensino Médio2nd year of Secondary Education 13 22
Fonte: CGI.br/NIC.br, Centro Regional de Estudos para o Desenvolvimento da Sociedade da Informação (Cetic.br), Pesquisa Sobre o Uso das Tecnologias de Informação e Comunicação nas Escolas Brasileiras – TIC Educação 2016.Source: CGI.br/NIC.br, Regional Center for Studies on the Development of the Information Society (Cetic.br), Survey on the Use of Information and Communication Technologies in Brazilian Schools – ICT In Education 2016.

ICT IN EDUCATION SURVEY 2016TABLES OF RESULTS SELECTED INDICATORS TEACHERS262
EN
GLI
SH P
OR
TUG
UÊS D6A PROFESSORES, POR PERCEPÇÃO SOBRE CURSO DE FORMAÇÃO CONTINUADA SOBRE O USO DE COMPUTADOR
E INTERNET EM ATIVIDADES DE ENSINOTEACHERS BY PERCEPTIONS OF CONTINUING EDUCATION COURSES ABOUT COMPUTER AND INTERNET USE IN TEACHING ACTIVITIESTOTAL DE PROFESSORESTOTAL NUMBER OF TEACHERS
Percentual (%)Percentage (%)
Contribuiu muito
Contributed a lot
Contribuiu pouco
Contributed a little
Não contribuiu nada
Did not contribute
Não fez um curso
de educação continuadaDid not take a continuing education
course
TOTAL 20 9 1 70
SEXOSEX
Feminino / Female 19 9 1 70
Masculino / Male 21 10 1 68
FAIXA ETÁRIAAGE GROUP
Até 30 anosUp to 30 years old 19 8 0 73
De 31 a 45 anos31 to 45 years old 22 10 1 67
De 46 anos ou mais46 years old or older 16 9 2 73
RENDA FAMILIARFAMILY INCOME
Até 3 SMUp to 3 MW 20 4 0 76
Mais de 3 até 5 SM3 MW to 5 MW 20 10 2 68
Mais de 5 SMMore than 5 MW 19 11 1 69
RENDA PESSOALPERSONAL INCOME
Até 3 SMUp to 3 MW 20 8 1 71
Mais de 3 até 5 SM3 MW to 5 MW 19 12 1 68
Mais de 5 SMMore than 5 MW 20 9 2 70
REGIÃOREGION
Norte / North 23 6 1 70
Centro-Oeste / Center-West 22 7 1 70
Nordeste / Northeast 18 6 0 75
Sudeste / Southeast 20 9 1 70
Sul / South 19 20 4 57
DEPENDÊNCIA ADMINISTRATIVAADMINISTRATIVE JURISDICTION
Pública Municipal / Municipal Public 20 8 1 71
Pública Estadual / State Public 19 10 2 69
Total – Públicas / Total – Public schools 19 9 2 70
Particular / Private 21 9 0 70
SÉRIEGRADE
4a série / 5o ano do Ensino Fundamental4th grade / 5th year of Elementary Education 19 7 1 73
8a série / 9o ano do Ensino Fundamental8th grade / 9th year of Elementary Education 24 10 1 65
2o ano do Ensino Médio2nd year of Secondary Education 17 11 2 70
Fonte: CGI.br/NIC.br, Centro Regional de Estudos para o Desenvolvimento da Sociedade da Informação (Cetic.br), Pesquisa Sobre o Uso das Tecnologias de Informação e Comunicação nas Escolas Brasileiras – TIC Educação 2016.Source: CGI.br/NIC.br, Regional Center for Studies on the Development of the Information Society (Cetic.br), Survey on the Use of Information and Communication Technologies in Brazilian Schools – ICT In Education 2016.

2016 PESQUISA TIC EDUCAÇÃOPROFESSORES INDICADORES SELECIONADOS TABELAS DE RESULTADOS 263
EN
GLI
SH P
OR
TUG
UÊSE2A PROFESSORES, POR ATIVIDADES REALIZADAS COM OS ALUNOS
TEACHERS BY ACTIVITIES CARRIED OUT WITH STUDENTSTOTAL DE PROFESSORESTOTAL NUMBER OF TEACHERS
Percentual (%)Percentage (%)
Solicitou a realização de
exercíciosRequested
assignments
Tirou dúvidas de alguns alunos
individualmenteAnswered
questions of some students
individually
Solicitou trabalhos em grupoRequested
group assignments
Deu aulas expositivas
Gave lectures
TOTAL 99 98 93 93
SEXOSEX
Feminino / Female 99 98 94 93
Masculino / Male 98 98 91 91
FAIXA ETÁRIAAGE GROUP
Até 30 anosUp to 30 years old 99 98 87 91
De 31 a 45 anos31 to 45 years old 99 99 95 92
De 46 anos ou mais46 years old or older 98 96 93 95
RENDA FAMILIARFAMILY INCOME
Até 3 SMUp to 3 MW 99 98 97 88
Mais de 3 até 5 SM3 MW to 5 MW 99 98 93 94
Mais de 5 SMMore than 5 MW 98 98 92 94
RENDA PESSOALPERSONAL INCOME
Até 3 SMUp to 3 MW 99 97 95 91
Mais de 3 até 5 SM3 MW to 5 MW 99 98 93 93
Mais de 5 SMMore than 5 MW 97 99 92 98
REGIÃOREGION
Norte / North 97 98 93 94
Centro-Oeste / Center-West 98 99 91 92
Nordeste / Northeast 99 96 95 95
Sudeste / Southeast 99 99 94 91
Sul / South 99 98 87 94
DEPENDÊNCIA ADMINISTRATIVAADMINISTRATIVE JURISDICTION
Pública Municipal / Municipal Public 97 97 93 89
Pública Estadual / State Public 99 98 93 94
Total – Públicas / Total – Public schools 98 98 93 92
Particular / Private 99 100 95 96
SÉRIEGRADE
4a série / 5o ano do Ensino Fundamental4th grade / 5th year of Elementary Education 98 98 94 90
8a série / 9o ano do Ensino Fundamental8th grade / 9th year of Elementary Education 98 97 92 95
2o ano do Ensino Médio2nd year of Secondary Education 99 98 93 94
Fonte: CGI.br/NIC.br, Centro Regional de Estudos para o Desenvolvimento da Sociedade da Informação (Cetic.br), Pesquisa Sobre o Uso das Tecnologias de Informação e Comunicação nas Escolas Brasileiras – TIC Educação 2016.Source: CGI.br/NIC.br, Regional Center for Studies on the Development of the Information Society (Cetic.br), Survey on the Use of Information and Communication Technologies in Brazilian Schools – ICT In Education 2016.
CONTINUA / CONTINUES �

ICT IN EDUCATION SURVEY 2016TABLES OF RESULTS SELECTED INDICATORS TEACHERS264
EN
GLI
SH P
OR
TUG
UÊS E2A PROFESSORES, POR ATIVIDADES REALIZADAS COM OS ALUNOS
TEACHERS BY ACTIVITIES CARRIED OUT WITH STUDENTSTOTAL DE PROFESSORESTOTAL NUMBER OF TEACHERS
Percentual (%)Percentage (%)
Solicitou a realização
de trabalhos sobre temas específicosRequested
theme assignments
Realizou interpretação de textos com
os alunosConducted
reading comprehension activities with
students
Promoveu debates ou
apresentações com os alunos
Promoted debates or
presentations with students
Fez pesquisas em livros e
revistas com os alunos
Searched in books and
magazines with students
TOTAL 90 82 80 80
SEXOSEX
Feminino / Female 93 85 84 84
Masculino / Male 83 71 69 67
FAIXA ETÁRIAAGE GROUP
Até 30 anosUp to 30 years old 91 73 76 71
De 31 a 45 anos31 to 45 years old 93 84 85 84
De 46 anos ou mais46 years old or older 86 81 74 76
RENDA FAMILIARFAMILY INCOME
Até 3 SMUp to 3 MW 92 79 85 88
Mais de 3 até 5 SM3 MW to 5 MW 91 86 83 83
Mais de 5 SMMore than 5 MW 90 79 76 75
RENDA PESSOALPERSONAL INCOME
Até 3 SMUp to 3 MW 92 84 85 85
Mais de 3 até 5 SM3 MW to 5 MW 90 82 78 78
Mais de 5 SMMore than 5 MW 88 76 72 72
REGIÃOREGION
Norte / North 86 83 77 81
Centro-Oeste / Center-West 84 90 83 83
Nordeste / Northeast 88 84 84 84
Sudeste / Southeast 94 80 80 77
Sul / South 89 80 75 79
DEPENDÊNCIA ADMINISTRATIVAADMINISTRATIVE JURISDICTION
Pública Municipal / Municipal Public 92 85 82 85
Pública Estadual / State Public 89 79 77 76
Total – Públicas / Total – Public schools 90 82 79 80
Particular / Private 92 82 85 82
SÉRIEGRADE
4a série / 5o ano do Ensino Fundamental4th grade / 5th year of Elementary Education 95 92 89 91
8a série / 9o ano do Ensino Fundamental8th grade / 9th year of Elementary Education 85 74 74 75
2o ano do Ensino Médio2nd year of Secondary Education 90 77 75 71
Fonte: CGI.br/NIC.br, Centro Regional de Estudos para o Desenvolvimento da Sociedade da Informação (Cetic.br), Pesquisa Sobre o Uso das Tecnologias de Informação e Comunicação nas Escolas Brasileiras – TIC Educação 2016.Source: CGI.br/NIC.br, Regional Center for Studies on the Development of the Information Society (Cetic.br), Survey on the Use of Information and Communication Technologies in Brazilian Schools – ICT In Education 2016.
� CONTINUAÇÃO / CONTINUATION

2016 PESQUISA TIC EDUCAÇÃOPROFESSORES INDICADORES SELECIONADOS TABELAS DE RESULTADOS 265
EN
GLI
SH P
OR
TUG
UÊSE2A PROFESSORES, POR ATIVIDADES REALIZADAS COM OS ALUNOS
TEACHERS BY ACTIVITIES CARRIED OUT WITH STUDENTSTOTAL DE PROFESSORESTOTAL NUMBER OF TEACHERS
Percentual (%)Percentage (%)
Solicitou que os alunos produzissem
textos, desenhos ou maquetes
Requested texts, graphics or maquettes
Trabalhou com jogos educativos com os alunosWorked with
educational games with students
Elaborou planilhas e gráficos com
os alunosDeveloped
spreadsheets and graphs
with students
TOTAL 77 50 48
SEXOSEX
Feminino / Female 82 53 46
Masculino / Male 58 42 56
FAIXA ETÁRIAAGE GROUP
Até 30 anosUp to 30 years old 76 53 56
De 31 a 45 anos31 to 45 years old 80 56 46
De 46 anos ou mais46 years old or older 72 40 49
RENDA FAMILIARFAMILY INCOME
Até 3 SMUp to 3 MW 84 63 49
Mais de 3 até 5 SM3 MW to 5 MW 80 52 43
Mais de 5 SMMore than 5 MW 73 44 51
RENDA PESSOALPERSONAL INCOME
Até 3 SMUp to 3 MW 83 58 45
Mais de 3 até 5 SM3 MW to 5 MW 74 47 49
Mais de 5 SMMore than 5 MW 69 37 50
REGIÃOREGION
Norte / North 70 59 55
Centro-Oeste / Center-West 80 59 57
Nordeste / Northeast 77 50 42
Sudeste / Southeast 78 51 49
Sul / South 79 40 50
DEPENDÊNCIA ADMINISTRATIVAADMINISTRATIVE JURISDICTION
Pública Municipal / Municipal Public 81 63 62
Pública Estadual / State Public 72 38 43
Total – Públicas / Total – Public schools 76 49 51
Particular / Private 82 55 36
SÉRIEGRADE
4a série / 5o ano do Ensino Fundamental4th grade / 5th year of Elementary Education 92 78 60
8a série / 9o ano do Ensino Fundamental8th grade / 9th year of Elementary Education 68 36 42
2o ano do Ensino Médio2nd year of Secondary Education 67 31 39
Fonte: CGI.br/NIC.br, Centro Regional de Estudos para o Desenvolvimento da Sociedade da Informação (Cetic.br), Pesquisa Sobre o Uso das Tecnologias de Informação e Comunicação nas Escolas Brasileiras – TIC Educação 2016.Source: CGI.br/NIC.br, Regional Center for Studies on the Development of the Information Society (Cetic.br), Survey on the Use of Information and Communication Technologies in Brazilian Schools – ICT In Education 2016.
� CONCLUSÃO / CONCLUSION

ICT IN EDUCATION SURVEY 2016TABLES OF RESULTS SELECTED INDICATORS TEACHERS266
EN
GLI
SH P
OR
TUG
UÊS E3 PROFESSORES, POR USO DO COMPUTADOR E DA INTERNET PARA REALIZAR ATIVIDADES COM OS ALUNOS
TEACHERS BY COMPUTER AND INTERNET USE IN ACTIVITIES WITH STUDENTSTOTAL DE PROFESSORES USUÁRIOS DE INTERNETTOTAL NUMBER OF TEACHERS WHO ARE INTERNET USERS
Percentual (%)Percentage (%)
Deu aulas expositivasGave lectures
Solicitou trabalhos em grupoRequested group assignments
SimYes
NãoNo
Não realizou
esta atividadeDid not carry
out this activity
SimYes
NãoNo
Não realizou
esta atividadeDid not carry
out this activity
TOTAL 52 41 7 42 51 7
SEXOSEX
Feminino / Female 54 39 7 43 50 6
Masculino / Male 45 47 9 36 54 9
FAIXA ETÁRIAAGE GROUP
Até 30 anosUp to 30 years old 61 31 9 43 44 13
De 31 a 45 anos31 to 45 years old 54 38 8 44 51 5
De 46 anos ou mais46 years old or older 45 50 5 38 54 7
RENDA FAMILIARFAMILY INCOME
Até 3 SMUp to 3 MW 54 34 13 45 52 3
Mais de 3 até 5 SM3 MW to 5 MW 48 46 6 36 57 8
Mais de 5 SMMore than 5 MW 54 40 6 45 48 8
RENDA PESSOALPERSONAL INCOME
Até 3 SMUp to 3 MW 52 39 9 40 54 5
Mais de 3 até 5 SM3 MW to 5 MW 49 44 7 42 50 7
Mais de 5 SMMore than 5 MW 57 41 2 43 48 8
REGIÃOREGION
Norte / North 49 45 6 38 55 7
Centro-Oeste / Center-West 55 37 8 38 53 9
Nordeste / Northeast 49 45 5 39 56 5
Sudeste / Southeast 53 38 9 45 49 6
Sul / South 54 40 5 42 45 13
DEPENDÊNCIA ADMINISTRATIVAADMINISTRATIVE JURISDICTION
Pública Municipal / Municipal Public 51 38 11 39 54 7
Pública Estadual / State Public 46 49 6 39 54 7
Total – Públicas / Total – Public schools 48 44 8 39 54 7
Particular / Private 69 27 4 55 40 5
SÉRIEGRADE
4a série / 5o ano do Ensino Fundamental4th grade / 5th year of Elementary Education 56 34 10 41 54 6
8a série / 9o ano do Ensino Fundamental8th grade / 9th year of Elementary Education 50 45 5 43 49 8
2o ano do Ensino Médio2nd year of Secondary Education 49 45 6 43 50 7
Fonte: CGI.br/NIC.br, Centro Regional de Estudos para o Desenvolvimento da Sociedade da Informação (Cetic.br), Pesquisa Sobre o Uso das Tecnologias de Informação e Comunicação nas Escolas Brasileiras – TIC Educação 2016.Source: CGI.br/NIC.br, Regional Center for Studies on the Development of the Information Society (Cetic.br), Survey on the Use of Information and Communication Technologies in Brazilian Schools – ICT In Education 2016.
CONTINUA / CONTINUES �

2016 PESQUISA TIC EDUCAÇÃOPROFESSORES INDICADORES SELECIONADOS TABELAS DE RESULTADOS 267
EN
GLI
SH P
OR
TUG
UÊSE3 PROFESSORES, POR USO DO COMPUTADOR E DA INTERNET PARA REALIZAR ATIVIDADES COM OS ALUNOS
TEACHERS BY COMPUTER AND INTERNET USE IN ACTIVITIES WITH STUDENTSTOTAL DE PROFESSORES USUÁRIOS DE INTERNETTOTAL NUMBER OF TEACHERS WHO ARE INTERNET USERS
Percentual (%)Percentage (%)
Solicitou a realização de trabalhos sobre temas específicosRequested theme
assignments
Solicitou a realização de exercíciosRequested
assignments
SimYes
NãoNo
Não realizou
esta atividadeDid not carry
out this activity
SimYes
NãoNo
Não realizou
esta atividadeDid not carry
out this activity
TOTAL 41 49 9 40 58 2
SEXOSEX
Feminino / Female 43 50 7 40 58 1
Masculino / Male 36 47 17 40 58 2
FAIXA ETÁRIAAGE GROUP
Até 30 anosUp to 30 years old 43 49 9 41 58 1
De 31 a 45 anos31 to 45 years old 44 48 7 43 56 1
De 46 anos ou mais46 years old or older 36 51 13 35 63 2
RENDA FAMILIARFAMILY INCOME
Até 3 SMUp to 3 MW 42 50 8 37 61 1
Mais de 3 até 5 SM3 MW to 5 MW 37 54 9 38 62 1
Mais de 5 SMMore than 5 MW 43 46 10 41 57 2
RENDA PESSOALPERSONAL INCOME
Até 3 SMUp to 3 MW 41 51 8 39 59 1
Mais de 3 até 5 SM3 MW to 5 MW 41 50 10 36 62 1
Mais de 5 SMMore than 5 MW 40 48 12 45 52 3
REGIÃOREGION
Norte / North 37 49 14 42 55 3
Centro-Oeste / Center-West 37 47 16 41 57 2
Nordeste / Northeast 36 53 11 32 67 1
Sudeste / Southeast 42 51 7 43 56 1
Sul / South 53 36 11 44 54 2
DEPENDÊNCIA ADMINISTRATIVAADMINISTRATIVE JURISDICTION
Pública Municipal / Municipal Public 38 54 8 35 62 3
Pública Estadual / State Public 38 50 11 38 61 1
Total – Públicas / Total – Public schools 38 52 10 37 61 2
Particular / Private 53 39 8 53 46 1
SÉRIEGRADE
4a série / 5o ano do Ensino Fundamental4th grade / 5th year of Elementary Education 39 57 5 42 56 2
8a série / 9o ano do Ensino Fundamental8th grade / 9th year of Elementary Education 42 43 15 37 62 2
2o ano do Ensino Médio2nd year of Secondary Education 43 47 10 40 59 1
Fonte: CGI.br/NIC.br, Centro Regional de Estudos para o Desenvolvimento da Sociedade da Informação (Cetic.br), Pesquisa Sobre o Uso das Tecnologias de Informação e Comunicação nas Escolas Brasileiras – TIC Educação 2016.Source: CGI.br/NIC.br, Regional Center for Studies on the Development of the Information Society (Cetic.br), Survey on the Use of Information and Communication Technologies in Brazilian Schools – ICT In Education 2016.
� CONTINUAÇÃO / CONTINUATION

ICT IN EDUCATION SURVEY 2016TABLES OF RESULTS SELECTED INDICATORS TEACHERS268
EN
GLI
SH P
OR
TUG
UÊS E3 PROFESSORES, POR USO DO COMPUTADOR E DA INTERNET PARA REALIZAR ATIVIDADES COM OS ALUNOS
TEACHERS BY COMPUTER AND INTERNET USE IN ACTIVITIES WITH STUDENTSTOTAL DE PROFESSORES USUÁRIOS DE INTERNETTOTAL NUMBER OF TEACHERS WHO ARE INTERNET USERS
Percentual (%)Percentage (%)
Solicitou que os alunos produzissem textos,
desenhos ou maquetesRequested texts,
graphics or maquettes
Promoveu debates ou apresentações com os alunos
Promoted debates or presentations with students
SimYes
NãoNo
Não realizou
esta atividadeDid not carry
out this activity
SimYes
NãoNo
Não realizou
esta atividadeDid not carry
out this activity
TOTAL 34 42 23 33 47 20
SEXOSEX
Feminino / Female 37 45 18 34 50 17
Masculino / Male 25 33 42 30 39 31
FAIXA ETÁRIAAGE GROUP
Até 30 anosUp to 30 years old 32 44 25 39 37 24
De 31 a 45 anos31 to 45 years old 37 43 20 34 51 15
De 46 anos ou mais46 years old or older 31 41 28 29 45 26
RENDA FAMILIARFAMILY INCOME
Até 3 SMUp to 3 MW 37 47 17 32 53 16
Mais de 3 até 5 SM3 MW to 5 MW 32 48 20 30 52 17
Mais de 5 SMMore than 5 MW 35 37 27 34 42 24
RENDA PESSOALPERSONAL INCOME
Até 3 SMUp to 3 MW 34 49 17 33 53 15
Mais de 3 até 5 SM3 MW to 5 MW 34 40 26 33 44 22
Mais de 5 SMMore than 5 MW 36 34 31 31 41 28
REGIÃOREGION
Norte / North 33 37 30 34 41 24
Centro-Oeste / Center-West 33 47 20 39 44 17
Nordeste / Northeast 29 47 24 33 51 16
Sudeste / Southeast 35 42 22 32 48 20
Sul / South 43 35 21 31 43 25
DEPENDÊNCIA ADMINISTRATIVAADMINISTRATIVE JURISDICTION
Pública Municipal / Municipal Public 36 45 19 30 52 18
Pública Estadual / State Public 31 41 28 33 44 23
Total – Públicas / Total – Public schools 33 43 24 32 47 21
Particular / Private 40 42 18 37 47 15
SÉRIEGRADE
4a série / 5o ano do Ensino Fundamental4th grade / 5th year of Elementary Education 37 55 8 29 60 11
8a série / 9o ano do Ensino Fundamental8th grade / 9th year of Elementary Education 35 32 32 34 40 26
2o ano do Ensino Médio2nd year of Secondary Education 30 37 33 36 39 25
Fonte: CGI.br/NIC.br, Centro Regional de Estudos para o Desenvolvimento da Sociedade da Informação (Cetic.br), Pesquisa Sobre o Uso das Tecnologias de Informação e Comunicação nas Escolas Brasileiras – TIC Educação 2016.Source: CGI.br/NIC.br, Regional Center for Studies on the Development of the Information Society (Cetic.br), Survey on the Use of Information and Communication Technologies in Brazilian Schools – ICT In Education 2016.
� CONTINUAÇÃO / CONTINUATION

2016 PESQUISA TIC EDUCAÇÃOPROFESSORES INDICADORES SELECIONADOS TABELAS DE RESULTADOS 269
EN
GLI
SH P
OR
TUG
UÊSE3 PROFESSORES, POR USO DO COMPUTADOR E DA INTERNET PARA REALIZAR ATIVIDADES COM OS ALUNOS
TEACHERS BY COMPUTER AND INTERNET USE IN ACTIVITIES WITH STUDENTSTOTAL DE PROFESSORES USUÁRIOS DE INTERNETTOTAL NUMBER OF TEACHERS WHO ARE INTERNET USERS
Percentual (%)Percentage (%)
Fez pesquisas em livros e revistas com os alunosSearched in books and
magazines with students
Tirou dúvidas de alguns alunos individualmenteAnswered questions of
some students individually
SimYes
NãoNo
Não realizou
esta atividadeDid not carry
out this activity
SimYes
NãoNo
Não realizou
esta atividadeDid not carry
out this activity
TOTAL 32 48 20 29 69 2
SEXOSEX
Feminino / Female 34 50 16 28 69 2
Masculino / Male 26 42 32 30 69 1
FAIXA ETÁRIAAGE GROUP
Até 30 anosUp to 30 years old 26 46 28 37 61 2
De 31 a 45 anos31 to 45 years old 35 50 16 32 67 1
De 46 anos ou mais46 years old or older 30 46 24 21 76 4
RENDA FAMILIARFAMILY INCOME
Até 3 SMUp to 3 MW 37 51 12 34 65 1
Mais de 3 até 5 SM3 MW to 5 MW 30 53 17 27 70 2
Mais de 5 SMMore than 5 MW 31 44 24 28 70 2
RENDA PESSOALPERSONAL INCOME
Até 3 SMUp to 3 MW 36 49 15 31 66 3
Mais de 3 até 5 SM3 MW to 5 MW 28 50 22 27 71 2
Mais de 5 SMMore than 5 MW 29 43 28 25 74 1
REGIÃOREGION
Norte / North 34 47 19 32 65 2
Centro-Oeste / Center-West 28 55 17 32 67 1
Nordeste / Northeast 32 52 16 25 72 3
Sudeste / Southeast 31 46 22 29 70 1
Sul / South 36 43 21 31 66 3
DEPENDÊNCIA ADMINISTRATIVAADMINISTRATIVE JURISDICTION
Pública Municipal / Municipal Public 34 51 15 28 69 3
Pública Estadual / State Public 26 50 24 25 73 2
Total – Públicas / Total – Public schools 29 50 20 26 72 2
Particular / Private 43 39 18 39 60 0
SÉRIEGRADE
4a série / 5o ano do Ensino Fundamental4th grade / 5th year of Elementary Education 38 53 8 32 66 2
8a série / 9o ano do Ensino Fundamental8th grade / 9th year of Elementary Education 29 46 25 27 70 3
2o ano do Ensino Médio2nd year of Secondary Education 28 43 29 26 73 2
Fonte: CGI.br/NIC.br, Centro Regional de Estudos para o Desenvolvimento da Sociedade da Informação (Cetic.br), Pesquisa Sobre o Uso das Tecnologias de Informação e Comunicação nas Escolas Brasileiras – TIC Educação 2016.Source: CGI.br/NIC.br, Regional Center for Studies on the Development of the Information Society (Cetic.br), Survey on the Use of Information and Communication Technologies in Brazilian Schools – ICT In Education 2016.
� CONTINUAÇÃO / CONTINUATION

ICT IN EDUCATION SURVEY 2016TABLES OF RESULTS SELECTED INDICATORS TEACHERS270
EN
GLI
SH P
OR
TUG
UÊS E3 PROFESSORES, POR USO DO COMPUTADOR E DA INTERNET PARA REALIZAR ATIVIDADES COM OS ALUNOS
TEACHERS BY COMPUTER AND INTERNET USE IN ACTIVITIES WITH STUDENTSTOTAL DE PROFESSORES USUÁRIOS DE INTERNETTOTAL NUMBER OF TEACHERS WHO ARE INTERNET USERS
Percentual (%)Percentage (%)
Realizou interpretação de textos com os alunos
Conducted reading comprehension activities with students
Trabalhou com jogos educativos com os alunosWorked with educational
games with students
SimYes
NãoNo
Não realizou
esta atividadeDid not carry
out this activity
SimYes
NãoNo
Não realizou
esta atividadeDid not carry
out this activity
TOTAL 26 55 18 21 29 50
SEXOSEX
Feminino / Female 28 57 15 23 30 47
Masculino / Male 22 49 30 18 24 58
FAIXA ETÁRIAAGE GROUP
Até 30 anosUp to 30 years old 26 47 27 20 33 47
De 31 a 45 anos31 to 45 years old 29 55 16 25 31 44
De 46 anos ou mais46 years old or older 22 59 19 16 24 60
RENDA FAMILIARFAMILY INCOME
Até 3 SMUp to 3 MW 21 58 21 24 40 37
Mais de 3 até 5 SM3 MW to 5 MW 28 58 14 22 30 48
Mais de 5 SMMore than 5 MW 26 53 21 21 23 56
RENDA PESSOALPERSONAL INCOME
Até 3 SMUp to 3 MW 28 57 16 22 36 42
Mais de 3 até 5 SM3 MW to 5 MW 25 56 18 21 26 53
Mais de 5 SMMore than 5 MW 24 52 24 21 16 63
REGIÃOREGION
Norte / North 29 54 17 23 36 42
Centro-Oeste / Center-West 37 53 10 32 27 41
Nordeste / Northeast 26 58 16 18 32 50
Sudeste / Southeast 25 55 21 22 29 49
Sul / South 27 53 20 19 20 61
DEPENDÊNCIA ADMINISTRATIVAADMINISTRATIVE JURISDICTION
Pública Municipal / Municipal Public 28 57 15 24 40 37
Pública Estadual / State Public 21 59 21 18 20 62
Total – Públicas / Total – Public schools 24 58 18 21 29 51
Particular / Private 38 44 19 24 31 45
SÉRIEGRADE
4a série / 5o ano do Ensino Fundamental4th grade / 5th year of Elementary Education 30 62 8 31 47 22
8a série / 9o ano do Ensino Fundamental8th grade / 9th year of Elementary Education 25 49 26 14 21 65
2o ano do Ensino Médio2nd year of Secondary Education 23 53 24 16 15 69
Fonte: CGI.br/NIC.br, Centro Regional de Estudos para o Desenvolvimento da Sociedade da Informação (Cetic.br), Pesquisa Sobre o Uso das Tecnologias de Informação e Comunicação nas Escolas Brasileiras – TIC Educação 2016.Source: CGI.br/NIC.br, Regional Center for Studies on the Development of the Information Society (Cetic.br), Survey on the Use of Information and Communication Technologies in Brazilian Schools – ICT In Education 2016.
� CONTINUAÇÃO / CONTINUATION

2016 PESQUISA TIC EDUCAÇÃOPROFESSORES INDICADORES SELECIONADOS TABELAS DE RESULTADOS 271
EN
GLI
SH P
OR
TUG
UÊSE3 PROFESSORES, POR USO DO COMPUTADOR E DA INTERNET PARA REALIZAR ATIVIDADES COM OS ALUNOS
TEACHERS BY COMPUTER AND INTERNET USE IN ACTIVITIES WITH STUDENTSTOTAL DE PROFESSORES USUÁRIOS DE INTERNETTOTAL NUMBER OF TEACHERS WHO ARE INTERNET USERS
Percentual (%)Percentage (%)
Elaborou planilhas e gráficos com os alunosDeveloped spreadsheets and graphs with the students
SimYes
NãoNo
Não realizou esta atividadeDid not carry
out this activity
TOTAL 18 31 52
SEXOSEX
Feminino / Female 16 30 54
Masculino / Male 23 32 44
FAIXA ETÁRIAAGE GROUP
Até 30 anosUp to 30 years old 22 34 44
De 31 a 45 anos31 to 45 years old 18 27 54
De 46 anos ou mais46 years old or older 14 35 51
RENDA FAMILIARFAMILY INCOME
Até 3 SMUp to 3 MW 17 32 51
Mais de 3 até 5 SM3 MW to 5 MW 16 26 58
Mais de 5 SMMore than 5 MW 17 34 49
RENDA PESSOALPERSONAL INCOME
Até 3 SMUp to 3 MW 17 28 55
Mais de 3 até 5 SM3 MW to 5 MW 17 32 51
Mais de 5 SMMore than 5 MW 17 33 50
REGIÃOREGION
Norte / North 18 36 46
Centro-Oeste / Center-West 18 39 43
Nordeste / Northeast 16 25 58
Sudeste / Southeast 18 31 51
Sul / South 18 33 49
DEPENDÊNCIA ADMINISTRATIVAADMINISTRATIVE JURISDICTION
Pública Municipal / Municipal Public 20 42 38
Pública Estadual / State Public 15 28 57
Total – Públicas / Total – Public schools 17 34 49
Particular / Private 20 16 64
SÉRIEGRADE
4a série / 5o ano do Ensino Fundamental4th grade / 5th year of Elementary Education 18 42 40
8a série / 9o ano do Ensino Fundamental8th grade / 9th year of Elementary Education 17 25 58
2o ano do Ensino Médio2nd year of Secondary Education 18 22 61
Fonte: CGI.br/NIC.br, Centro Regional de Estudos para o Desenvolvimento da Sociedade da Informação (Cetic.br), Pesquisa Sobre o Uso das Tecnologias de Informação e Comunicação nas Escolas Brasileiras – TIC Educação 2016.Source: CGI.br/NIC.br, Regional Center for Studies on the Development of the Information Society (Cetic.br), Survey on the Use of Information and Communication Technologies in Brazilian Schools – ICT In Education 2016.
� CONCLUSÃO / CONCLUSION

ICT IN EDUCATION SURVEY 2016TABLES OF RESULTS SELECTED INDICATORS TEACHERS272
EN
GLI
SH P
OR
TUG
UÊS E4A PROFESSORES, POR LOCAL DE USO DO COMPUTADOR EM ATIVIDADES COM OS ALUNOS
TEACHERS BY LOCATION OF COMPUTER USE IN ACTIVITIES WITH STUDENTSTOTAL DE PROFESSORES USUÁRIOS DE INTERNETTOTAL NUMBER OF TEACHERS WHO ARE INTERNET USERS
Percentual (%)Percentage (%)
Sala de aulaClassroom
Laboratório de informáticaComputer lab
Sala dos professores
Teachers’ room
SimYes
NãoNo
SimYes
NãoNo
SimYes
NãoNo
TOTAL 43 24 31 37 24 43
SEXOSEX
Feminino / Female 44 24 31 37 24 44
Masculino / Male 39 26 28 37 25 40
FAIXA ETÁRIAAGE GROUP
Até 30 anosUp to 30 years old 54 18 30 41 31 40
De 31 a 45 anos31 to 45 years old 46 22 31 37 25 43
De 46 anos ou mais46 years old or older 34 30 31 34 21 44
RENDA FAMILIARFAMILY INCOME
Até 3 SMUp to 3 MW 45 23 23 45 18 49
Mais de 3 até 5 SM3 MW to 5 MW 38 24 32 31 23 40
Mais de 5 SMMore than 5 MW 45 26 33 38 27 44
RENDA PESSOALPERSONAL INCOME
Até 3 SMUp to 3 MW 40 23 27 36 23 40
Mais de 3 até 5 SM3 MW to 5 MW 44 26 35 35 21 49
Mais de 5 SMMore than 5 MW 49 24 33 40 33 41
REGIÃOREGION
Norte / North 45 18 23 41 19 44
Centro-Oeste / Center-West 52 27 45 33 29 50
Nordeste / Northeast 42 18 19 42 24 36
Sudeste / Southeast 43 27 33 37 25 45
Sul / South 42 29 47 24 25 46
DEPENDÊNCIA ADMINISTRATIVAADMINISTRATIVE JURISDICTION
Pública Municipal / Municipal Public 41 24 31 34 24 41
Pública Estadual / State Public 39 26 31 34 24 41
Total – Públicas / Total – Public schools 40 25 31 34 24 41
Particular / Private 58 20 29 48 25 52
SÉRIEGRADE
4a série / 5o ano do Ensino Fundamental4th grade / 5th year of Elementary Education 47 22 31 38 24 45
8a série / 9o ano do Ensino Fundamental8th grade / 9th year of Elementary Education 42 26 32 35 24 43
2o ano do Ensino Médio2nd year of Secondary Education 40 26 29 37 25 41
Fonte: CGI.br/NIC.br, Centro Regional de Estudos para o Desenvolvimento da Sociedade da Informação (Cetic.br), Pesquisa Sobre o Uso das Tecnologias de Informação e Comunicação nas Escolas Brasileiras – TIC Educação 2016.Source: CGI.br/NIC.br, Regional Center for Studies on the Development of the Information Society (Cetic.br), Survey on the Use of Information and Communication Technologies in Brazilian Schools – ICT In Education 2016.
CONTINUA / CONTINUES �

2016 PESQUISA TIC EDUCAÇÃOPROFESSORES INDICADORES SELECIONADOS TABELAS DE RESULTADOS 273
EN
GLI
SH P
OR
TUG
UÊSE4A PROFESSORES, POR LOCAL DE USO DO COMPUTADOR EM ATIVIDADES COM OS ALUNOS
TEACHERS BY LOCATION OF COMPUTER USE IN ACTIVITIES WITH STUDENTSTOTAL DE PROFESSORES USUÁRIOS DE INTERNETTOTAL NUMBER OF TEACHERS WHO ARE INTERNET USERS
Percentual (%)Percentage (%)
BibliotecaLibrary
Secretaria ou diretoriaReception /
principal’s office
Centro público de acesso gratuito
Free public access center
SimYes
NãoNo
SimYes
NãoNo
SimYes
NãoNo
TOTAL 17 50 14 53 8 60
SEXOSEX
Feminino / Female 17 51 14 54 9 59
Masculino / Male 17 48 15 50 5 61
FAIXA ETÁRIAAGE GROUP
Até 30 anosUp to 30 years old 10 62 15 56 7 65
De 31 a 45 anos31 to 45 years old 18 50 14 54 10 58
De 46 anos ou mais46 years old or older 19 46 13 51 4 61
RENDA FAMILIARFAMILY INCOME
Até 3 SMUp to 3 MW 12 55 17 50 18 50
Mais de 3 até 5 SM3 MW to 5 MW 20 43 12 51 6 57
Mais de 5 SMMore than 5 MW 18 53 13 58 5 66
RENDA PESSOALPERSONAL INCOME
Até 3 SMUp to 3 MW 17 46 14 49 10 53
Mais de 3 até 5 SM3 MW to 5 MW 18 53 10 60 6 65
Mais de 5 SMMore than 5 MW 19 54 18 55 6 67
REGIÃOREGION
Norte / North 14 50 17 46 5 59
Centro-Oeste / Center-West 14 65 22 57 10 68
Nordeste / Northeast 17 44 16 44 8 53
Sudeste / Southeast 18 52 12 58 8 61
Sul / South 21 50 11 59 7 64
DEPENDÊNCIA ADMINISTRATIVAADMINISTRATIVE JURISDICTION
Pública Municipal / Municipal Public 18 47 19 46 8 57
Pública Estadual / State Public 15 50 11 54 5 60
Total – Públicas / Total – Public schools 16 49 14 51 6 59
Particular / Private 20 57 13 65 15 63
SÉRIEGRADE
4a série / 5o ano do Ensino Fundamental4th grade / 5th year of Elementary Education 18 51 17 52 11 57
8a série / 9o ano do Ensino Fundamental8th grade / 9th year of Elementary Education 19 49 12 55 5 62
2o ano do Ensino Médio2nd year of Secondary Education 15 51 12 54 6 60
Fonte: CGI.br/NIC.br, Centro Regional de Estudos para o Desenvolvimento da Sociedade da Informação (Cetic.br), Pesquisa Sobre o Uso das Tecnologias de Informação e Comunicação nas Escolas Brasileiras – TIC Educação 2016.Source: CGI.br/NIC.br, Regional Center for Studies on the Development of the Information Society (Cetic.br), Survey on the Use of Information and Communication Technologies in Brazilian Schools – ICT In Education 2016.
� CONTINUAÇÃO / CONTINUATION
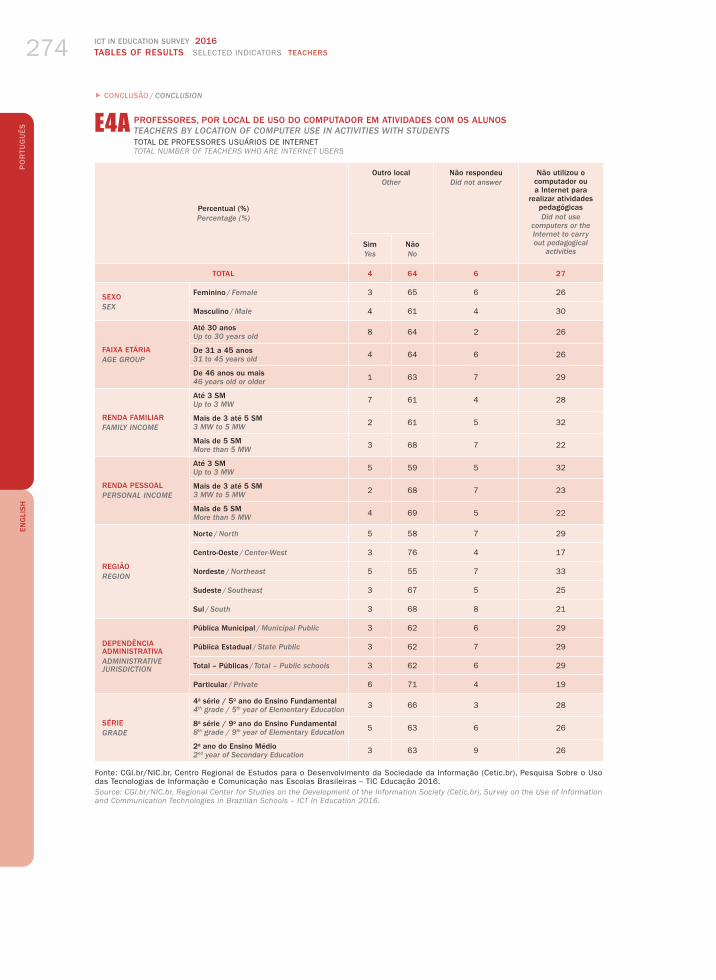
ICT IN EDUCATION SURVEY 2016TABLES OF RESULTS SELECTED INDICATORS TEACHERS274
EN
GLI
SH P
OR
TUG
UÊS E4A PROFESSORES, POR LOCAL DE USO DO COMPUTADOR EM ATIVIDADES COM OS ALUNOS
TEACHERS BY LOCATION OF COMPUTER USE IN ACTIVITIES WITH STUDENTSTOTAL DE PROFESSORES USUÁRIOS DE INTERNETTOTAL NUMBER OF TEACHERS WHO ARE INTERNET USERS
Percentual (%)Percentage (%)
Outro localOther
Não respondeuDid not answer
Não utilizou o computador ou a Internet para
realizar atividades pedagógicasDid not use
computers or the Internet to carry out pedagogical
activitiesSimYes
NãoNo
TOTAL 4 64 6 27
SEXOSEX
Feminino / Female 3 65 6 26
Masculino / Male 4 61 4 30
FAIXA ETÁRIAAGE GROUP
Até 30 anosUp to 30 years old 8 64 2 26
De 31 a 45 anos31 to 45 years old 4 64 6 26
De 46 anos ou mais46 years old or older 1 63 7 29
RENDA FAMILIARFAMILY INCOME
Até 3 SMUp to 3 MW 7 61 4 28
Mais de 3 até 5 SM3 MW to 5 MW 2 61 5 32
Mais de 5 SMMore than 5 MW 3 68 7 22
RENDA PESSOALPERSONAL INCOME
Até 3 SMUp to 3 MW 5 59 5 32
Mais de 3 até 5 SM3 MW to 5 MW 2 68 7 23
Mais de 5 SMMore than 5 MW 4 69 5 22
REGIÃOREGION
Norte / North 5 58 7 29
Centro-Oeste / Center-West 3 76 4 17
Nordeste / Northeast 5 55 7 33
Sudeste / Southeast 3 67 5 25
Sul / South 3 68 8 21
DEPENDÊNCIA ADMINISTRATIVAADMINISTRATIVE JURISDICTION
Pública Municipal / Municipal Public 3 62 6 29
Pública Estadual / State Public 3 62 7 29
Total – Públicas / Total – Public schools 3 62 6 29
Particular / Private 6 71 4 19
SÉRIEGRADE
4a série / 5o ano do Ensino Fundamental4th grade / 5th year of Elementary Education 3 66 3 28
8a série / 9o ano do Ensino Fundamental8th grade / 9th year of Elementary Education 5 63 6 26
2o ano do Ensino Médio2nd year of Secondary Education 3 63 9 26
Fonte: CGI.br/NIC.br, Centro Regional de Estudos para o Desenvolvimento da Sociedade da Informação (Cetic.br), Pesquisa Sobre o Uso das Tecnologias de Informação e Comunicação nas Escolas Brasileiras – TIC Educação 2016.Source: CGI.br/NIC.br, Regional Center for Studies on the Development of the Information Society (Cetic.br), Survey on the Use of Information and Communication Technologies in Brazilian Schools – ICT In Education 2016.
� CONCLUSÃO / CONCLUSION

2016 PESQUISA TIC EDUCAÇÃOPROFESSORES INDICADORES SELECIONADOS TABELAS DE RESULTADOS 275
EN
GLI
SH P
OR
TUG
UÊSE4B PROFESSORES, POR LOCAL DE USO DA INTERNET EM ATIVIDADES COM OS ALUNOS
TEACHERS BY LOCATION OF INTERNET USE IN ACTIVITIES WITH STUDENTSTOTAL DE PROFESSORES USUÁRIOS DE INTERNETTOTAL NUMBER OF TEACHERS WHO ARE INTERNET USERS
Percentual (%)Percentage (%)
Sala de aulaClassroom
SimYes
NãoNo
Não respondeu
Did not answer
Não utilizou o computador ou a
Internet para realizar atividades pedagógicas
e nem computador neste local
Did not use computers or the Internet to
carry out pedagogical activities or did not
use this location
TOTAL 31 12 0 57
SEXOSEX
Feminino / Female 33 12 0 56
Masculino / Male 28 11 0 61
FAIXA ETÁRIAAGE GROUP
Até 30 anosUp to 30 years old 41 13 0 46
De 31 a 45 anos31 to 45 years old 34 12 0 54
De 46 anos ou mais46 years old or older 23 11 0 66
RENDA FAMILIARFAMILY INCOME
Até 3 SMUp to 3 MW 35 10 0 55
Mais de 3 até 5 SM3 MW to 5 MW 27 11 0 62
Mais de 5 SMMore than 5 MW 33 12 0 55
RENDA PESSOALPERSONAL INCOME
Até 3 SMUp to 3 MW 28 11 0 60
Mais de 3 até 5 SM3 MW to 5 MW 32 12 0 56
Mais de 5 SMMore than 5 MW 38 10 1 51
REGIÃOREGION
Norte / North 31 14 0 55
Centro-Oeste / Center-West 39 13 0 48
Nordeste / Northeast 30 12 0 58
Sudeste / Southeast 32 11 0 57
Sul / South 30 10 1 58
DEPENDÊNCIA ADMINISTRATIVAADMINISTRATIVE JURISDICTION
Pública Municipal / Municipal Public 29 12 0 59
Pública Estadual / State Public 24 15 0 62
Total – Públicas / Total – Public schools 26 14 0 60
Particular / Private 54 4 0 42
SÉRIEGRADE
4a série / 5o ano do Ensino Fundamental4th grade / 5th year of Elementary Education 36 11 0 53
8a série / 9o ano do Ensino Fundamental8th grade / 9th year of Elementary Education 31 11 0 58
2o ano do Ensino Médio2nd year of Secondary Education 26 14 0 60
Fonte: CGI.br/NIC.br, Centro Regional de Estudos para o Desenvolvimento da Sociedade da Informação (Cetic.br), Pesquisa Sobre o Uso das Tecnologias de Informação e Comunicação nas Escolas Brasileiras – TIC Educação 2016.Source: CGI.br/NIC.br, Regional Center for Studies on the Development of the Information Society (Cetic.br), Survey on the Use of Information and Communication Technologies in Brazilian Schools – ICT In Education 2016.
CONTINUA / CONTINUES �

ICT IN EDUCATION SURVEY 2016TABLES OF RESULTS SELECTED INDICATORS TEACHERS276
EN
GLI
SH P
OR
TUG
UÊS E4B PROFESSORES, POR LOCAL DE USO DA INTERNET EM ATIVIDADES COM OS ALUNOS
TEACHERS BY LOCATION OF INTERNET USE IN ACTIVITIES WITH STUDENTSTOTAL DE PROFESSORES USUÁRIOS DE INTERNETTOTAL NUMBER OF TEACHERS WHO ARE INTERNET USERS
Percentual (%)Percentage (%)
Laboratório de informáticaComputer lab
SimYes
NãoNo
Não respondeu
Did not answer
Não utilizou o computador ou a
Internet para realizar atividades pedagógicas
e nem computador neste local
Did not use computers or the Internet to
carry out pedagogical activities or did not
use this location
TOTAL 27 4 0 69
SEXOSEX
Feminino / Female 27 4 0 69
Masculino / Male 26 2 0 72
FAIXA ETÁRIAAGE GROUP
Até 30 anosUp to 30 years old 24 6 0 70
De 31 a 45 anos31 to 45 years old 27 3 0 69
De 46 anos ou mais46 years old or older 28 3 0 69
RENDA FAMILIARFAMILY INCOME
Até 3 SMUp to 3 MW 21 2 0 77
Mais de 3 até 5 SM3 MW to 5 MW 29 3 0 68
Mais de 5 SMMore than 5 MW 28 5 0 67
RENDA PESSOALPERSONAL INCOME
Até 3 SMUp to 3 MW 23 4 0 73
Mais de 3 até 5 SM3 MW to 5 MW 31 4 0 65
Mais de 5 SMMore than 5 MW 30 3 0 67
REGIÃOREGION
Norte / North 21 2 0 77
Centro-Oeste / Center-West 33 12 0 55
Nordeste / Northeast 17 2 0 81
Sudeste / Southeast 29 4 0 67
Sul / South 42 5 0 53
DEPENDÊNCIA ADMINISTRATIVAADMINISTRATIVE JURISDICTION
Pública Municipal / Municipal Public 26 5 0 69
Pública Estadual / State Public 27 4 0 69
Total – Públicas / Total – Public schools 27 4 0 69
Particular / Private 28 1 0 71
SÉRIEGRADE
4a série / 5o ano do Ensino Fundamental4th grade / 5th year of Elementary Education 25 6 0 69
8a série / 9o ano do Ensino Fundamental8th grade / 9th year of Elementary Education 31 2 0 68
2o ano do Ensino Médio2nd year of Secondary Education 26 3 0 71
Fonte: CGI.br/NIC.br, Centro Regional de Estudos para o Desenvolvimento da Sociedade da Informação (Cetic.br), Pesquisa Sobre o Uso das Tecnologias de Informação e Comunicação nas Escolas Brasileiras – TIC Educação 2016.Source: CGI.br/NIC.br, Regional Center for Studies on the Development of the Information Society (Cetic.br), Survey on the Use of Information and Communication Technologies in Brazilian Schools – ICT In Education 2016.
� CONTINUAÇÃO / CONTINUATION

2016 PESQUISA TIC EDUCAÇÃOPROFESSORES INDICADORES SELECIONADOS TABELAS DE RESULTADOS 277
EN
GLI
SH P
OR
TUG
UÊSE4B PROFESSORES, POR LOCAL DE USO DA INTERNET EM ATIVIDADES COM OS ALUNOS
TEACHERS BY LOCATION OF INTERNET USE IN ACTIVITIES WITH STUDENTSTOTAL DE PROFESSORES USUÁRIOS DE INTERNETTOTAL NUMBER OF TEACHERS WHO ARE INTERNET USERS
Percentual (%)Percentage (%)
Sala dos professoresTeachers’ room
SimYes
NãoNo
Não respondeu
Did not answer
Não utilizou o computador ou a
Internet para realizar atividades pedagógicas
e nem computador neste local
Did not use computers or the Internet to
carry out pedagogical activities or did not
use this location
TOTAL 22 2 0 76
SEXOSEX
Feminino / Female 23 1 0 76
Masculino / Male 21 4 0 75
FAIXA ETÁRIAAGE GROUP
Até 30 anosUp to 30 years old 28 3 0 69
De 31 a 45 anos31 to 45 years old 23 2 0 75
De 46 anos ou mais46 years old or older 19 2 0 79
RENDA FAMILIARFAMILY INCOME
Até 3 SMUp to 3 MW 17 2 0 82
Mais de 3 até 5 SM3 MW to 5 MW 21 2 0 77
Mais de 5 SMMore than 5 MW 25 2 0 73
RENDA PESSOALPERSONAL INCOME
Até 3 SMUp to 3 MW 21 1 0 77
Mais de 3 até 5 SM3 MW to 5 MW 20 2 0 79
Mais de 5 SMMore than 5 MW 29 3 0 67
REGIÃOREGION
Norte / North 17 3 0 81
Centro-Oeste / Center-West 28 1 0 72
Nordeste / Northeast 23 1 0 76
Sudeste / Southeast 23 2 0 75
Sul / South 20 5 0 75
DEPENDÊNCIA ADMINISTRATIVAADMINISTRATIVE JURISDICTION
Pública Municipal / Municipal Public 23 1 0 76
Pública Estadual / State Public 22 2 0 76
Total – Públicas / Total – Public schools 22 2 0 76
Particular / Private 22 3 0 75
SÉRIEGRADE
4a série / 5o ano do Ensino Fundamental4th grade / 5th year of Elementary Education 23 1 0 76
8a série / 9o ano do Ensino Fundamental8th grade / 9th year of Elementary Education 22 3 0 76
2o ano do Ensino Médio2nd year of Secondary Education 22 2 0 75
Fonte: CGI.br/NIC.br, Centro Regional de Estudos para o Desenvolvimento da Sociedade da Informação (Cetic.br), Pesquisa Sobre o Uso das Tecnologias de Informação e Comunicação nas Escolas Brasileiras – TIC Educação 2016.Source: CGI.br/NIC.br, Regional Center for Studies on the Development of the Information Society (Cetic.br), Survey on the Use of Information and Communication Technologies in Brazilian Schools – ICT In Education 2016.
� CONTINUAÇÃO / CONTINUATION

ICT IN EDUCATION SURVEY 2016TABLES OF RESULTS SELECTED INDICATORS TEACHERS278
EN
GLI
SH P
OR
TUG
UÊS E4B PROFESSORES, POR LOCAL DE USO DA INTERNET EM ATIVIDADES COM OS ALUNOS
TEACHERS BY LOCATION OF INTERNET USE IN ACTIVITIES WITH STUDENTSTOTAL DE PROFESSORES USUÁRIOS DE INTERNETTOTAL NUMBER OF TEACHERS WHO ARE INTERNET USERS
Percentual (%)Percentage (%)
BibliotecaLibrary
SimYes
NãoNo
Não respondeu
Did not answer
Não utilizou o computador ou a
Internet para realizar atividades pedagógicas
e nem computador neste local
Did not use computers or the Internet to
carry out pedagogical activities or did not
use this location
TOTAL 14 3 0 83
SEXOSEX
Feminino / Female 14 3 0 83
Masculino / Male 14 3 0 83
FAIXA ETÁRIAAGE GROUP
Até 30 anosUp to 30 years old 7 3 0 90
De 31 a 45 anos31 to 45 years old 14 4 0 82
De 46 anos ou mais46 years old or older 16 2 0 81
RENDA FAMILIARFAMILY INCOME
Até 3 SMUp to 3 MW 11 2 0 88
Mais de 3 até 5 SM3 MW to 5 MW 16 3 0 80
Mais de 5 SMMore than 5 MW 14 4 0 83
RENDA PESSOALPERSONAL INCOME
Até 3 SMUp to 3 MW 14 3 0 83
Mais de 3 até 5 SM3 MW to 5 MW 14 4 0 82
Mais de 5 SMMore than 5 MW 16 3 0 81
REGIÃOREGION
Norte / North 10 3 0 86
Centro-Oeste / Center-West 11 3 0 86
Nordeste / Northeast 13 4 0 83
Sudeste / Southeast 15 3 0 82
Sul / South 16 5 0 79
DEPENDÊNCIA ADMINISTRATIVAADMINISTRATIVE JURISDICTION
Pública Municipal / Municipal Public 13 5 0 82
Pública Estadual / State Public 12 3 0 85
Total – Públicas / Total – Public schools 13 4 0 84
Particular / Private 18 2 0 80
SÉRIEGRADE
4a série / 5o ano do Ensino Fundamental4th grade / 5th year of Elementary Education 15 3 0 82
8a série / 9o ano do Ensino Fundamental8th grade / 9th year of Elementary Education 14 5 0 81
2o ano do Ensino Médio2nd year of Secondary Education 12 3 0 85
Fonte: CGI.br/NIC.br, Centro Regional de Estudos para o Desenvolvimento da Sociedade da Informação (Cetic.br), Pesquisa Sobre o Uso das Tecnologias de Informação e Comunicação nas Escolas Brasileiras – TIC Educação 2016.Source: CGI.br/NIC.br, Regional Center for Studies on the Development of the Information Society (Cetic.br), Survey on the Use of Information and Communication Technologies in Brazilian Schools – ICT In Education 2016.
� CONTINUAÇÃO / CONTINUATION

2016 PESQUISA TIC EDUCAÇÃOPROFESSORES INDICADORES SELECIONADOS TABELAS DE RESULTADOS 279
EN
GLI
SH P
OR
TUG
UÊSE4B PROFESSORES, POR LOCAL DE USO DA INTERNET EM ATIVIDADES COM OS ALUNOS
TEACHERS BY LOCATION OF INTERNET USE IN ACTIVITIES WITH STUDENTSTOTAL DE PROFESSORES USUÁRIOS DE INTERNETTOTAL NUMBER OF TEACHERS WHO ARE INTERNET USERS
Percentual (%)Percentage (%)
Secretaria ou diretoriaReception / principal’s office
SimYes
NãoNo
Não respondeu
Did not answer
Não utilizou o computador ou a
Internet para realizar atividades pedagógicas
e nem computador neste local
Did not use computers or the Internet to
carry out pedagogical activities or did not
use this location
TOTAL 13 1 0 86
SEXOSEX
Feminino / Female 13 1 0 86
Masculino / Male 14 2 0 85
FAIXA ETÁRIAAGE GROUP
Até 30 anosUp to 30 years old 14 1 0 85
De 31 a 45 anos31 to 45 years old 13 1 0 86
De 46 anos ou mais46 years old or older 13 1 0 87
RENDA FAMILIARFAMILY INCOME
Até 3 SMUp to 3 MW 17 1 0 83
Mais de 3 até 5 SM3 MW to 5 MW 11 1 0 88
Mais de 5 SMMore than 5 MW 12 1 0 87
RENDA PESSOALPERSONAL INCOME
Até 3 SMUp to 3 MW 14 1 0 86
Mais de 3 até 5 SM3 MW to 5 MW 10 1 0 90
Mais de 5 SMMore than 5 MW 16 2 0 82
REGIÃOREGION
Norte / North 16 1 0 83
Centro-Oeste / Center-West 18 4 0 78
Nordeste / Northeast 15 1 0 84
Sudeste / Southeast 12 0 0 88
Sul / South 10 1 0 89
DEPENDÊNCIA ADMINISTRATIVAADMINISTRATIVE JURISDICTION
Pública Municipal / Municipal Public 18 1 0 81
Pública Estadual / State Public 10 1 0 89
Total – Públicas / Total – Public schools 13 1 0 86
Particular / Private 12 0 0 87
SÉRIEGRADE
4a série / 5o ano do Ensino Fundamental4th grade / 5th year of Elementary Education 16 1 0 83
8a série / 9o ano do Ensino Fundamental8th grade / 9th year of Elementary Education 11 1 0 88
2o ano do Ensino Médio2nd year of Secondary Education 11 1 0 88
Fonte: CGI.br/NIC.br, Centro Regional de Estudos para o Desenvolvimento da Sociedade da Informação (Cetic.br), Pesquisa Sobre o Uso das Tecnologias de Informação e Comunicação nas Escolas Brasileiras – TIC Educação 2016.Source: CGI.br/NIC.br, Regional Center for Studies on the Development of the Information Society (Cetic.br), Survey on the Use of Information and Communication Technologies in Brazilian Schools – ICT In Education 2016.
� CONTINUAÇÃO / CONTINUATION
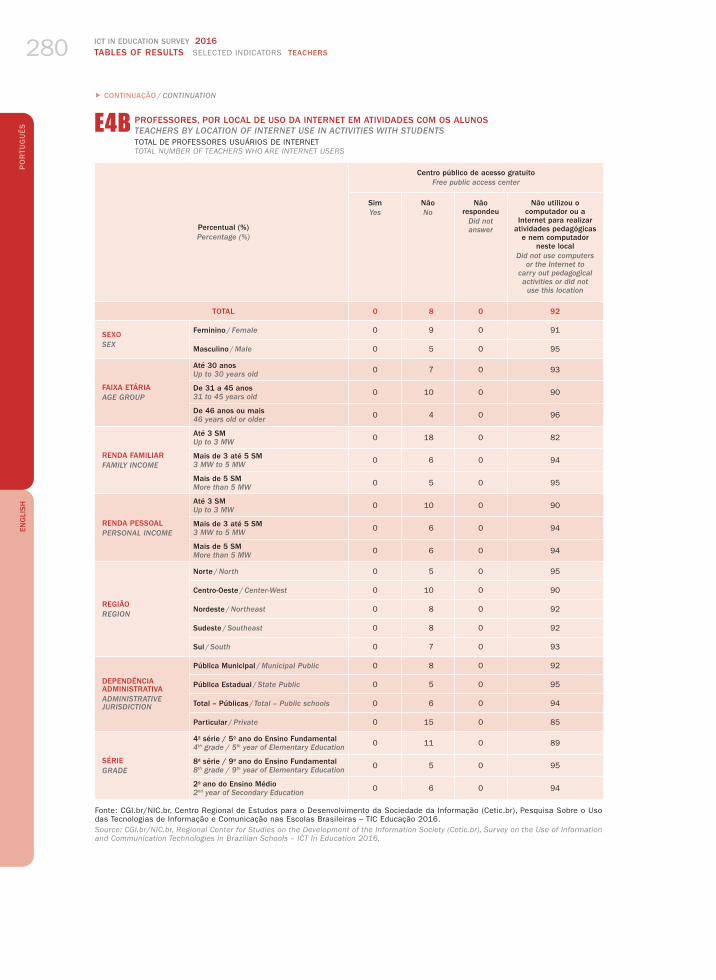
ICT IN EDUCATION SURVEY 2016TABLES OF RESULTS SELECTED INDICATORS TEACHERS280
EN
GLI
SH P
OR
TUG
UÊS E4B PROFESSORES, POR LOCAL DE USO DA INTERNET EM ATIVIDADES COM OS ALUNOS
TEACHERS BY LOCATION OF INTERNET USE IN ACTIVITIES WITH STUDENTSTOTAL DE PROFESSORES USUÁRIOS DE INTERNETTOTAL NUMBER OF TEACHERS WHO ARE INTERNET USERS
Percentual (%)Percentage (%)
Centro público de acesso gratuitoFree public access center
SimYes
NãoNo
Não respondeu
Did not answer
Não utilizou o computador ou a
Internet para realizar atividades pedagógicas
e nem computador neste local
Did not use computers or the Internet to
carry out pedagogical activities or did not
use this location
TOTAL 0 8 0 92
SEXOSEX
Feminino / Female 0 9 0 91
Masculino / Male 0 5 0 95
FAIXA ETÁRIAAGE GROUP
Até 30 anosUp to 30 years old 0 7 0 93
De 31 a 45 anos31 to 45 years old 0 10 0 90
De 46 anos ou mais46 years old or older 0 4 0 96
RENDA FAMILIARFAMILY INCOME
Até 3 SMUp to 3 MW 0 18 0 82
Mais de 3 até 5 SM3 MW to 5 MW 0 6 0 94
Mais de 5 SMMore than 5 MW 0 5 0 95
RENDA PESSOALPERSONAL INCOME
Até 3 SMUp to 3 MW 0 10 0 90
Mais de 3 até 5 SM3 MW to 5 MW 0 6 0 94
Mais de 5 SMMore than 5 MW 0 6 0 94
REGIÃOREGION
Norte / North 0 5 0 95
Centro-Oeste / Center-West 0 10 0 90
Nordeste / Northeast 0 8 0 92
Sudeste / Southeast 0 8 0 92
Sul / South 0 7 0 93
DEPENDÊNCIA ADMINISTRATIVAADMINISTRATIVE JURISDICTION
Pública Municipal / Municipal Public 0 8 0 92
Pública Estadual / State Public 0 5 0 95
Total – Públicas / Total – Public schools 0 6 0 94
Particular / Private 0 15 0 85
SÉRIEGRADE
4a série / 5o ano do Ensino Fundamental4th grade / 5th year of Elementary Education 0 11 0 89
8a série / 9o ano do Ensino Fundamental8th grade / 9th year of Elementary Education 0 5 0 95
2o ano do Ensino Médio2nd year of Secondary Education 0 6 0 94
Fonte: CGI.br/NIC.br, Centro Regional de Estudos para o Desenvolvimento da Sociedade da Informação (Cetic.br), Pesquisa Sobre o Uso das Tecnologias de Informação e Comunicação nas Escolas Brasileiras – TIC Educação 2016.Source: CGI.br/NIC.br, Regional Center for Studies on the Development of the Information Society (Cetic.br), Survey on the Use of Information and Communication Technologies in Brazilian Schools – ICT In Education 2016.
� CONTINUAÇÃO / CONTINUATION

2016 PESQUISA TIC EDUCAÇÃOPROFESSORES INDICADORES SELECIONADOS TABELAS DE RESULTADOS 281
EN
GLI
SH P
OR
TUG
UÊSE4B PROFESSORES, POR LOCAL DE USO DA INTERNET EM ATIVIDADES COM OS ALUNOS
TEACHERS BY LOCATION OF INTERNET USE IN ACTIVITIES WITH STUDENTSTOTAL DE PROFESSORES USUÁRIOS DE INTERNETTOTAL NUMBER OF TEACHERS WHO ARE INTERNET USERS
Percentual (%)Percentage (%)
OutroOther
SimYes
NãoNo
Não utilizou o computador ou a Internet para realizar
atividades pedagógicas e nem computador neste localDid not use computers or the Internet to carry
out pedagogical activities or did not use this location
TOTAL 4 0 96
SEXOSEX
Feminino / Female 3 0 97
Masculino / Male 4 0 96
FAIXA ETÁRIAAGE GROUP
Até 30 anosUp to 30 years old 8 0 92
De 31 a 45 anos31 to 45 years old 4 0 96
De 46 anos ou mais46 years old or older 1 0 99
RENDA FAMILIARFAMILY INCOME
Até 3 SMUp to 3 MW 7 0 93
Mais de 3 até 5 SM3 MW to 5 MW 2 0 98
Mais de 5 SMMore than 5 MW 3 0 97
RENDA PESSOALPERSONAL INCOME
Até 3 SMUp to 3 MW 5 0 96
Mais de 3 até 5 SM3 MW to 5 MW 2 0 98
Mais de 5 SMMore than 5 MW 4 0 96
REGIÃOREGION
Norte / North 5 0 95
Centro-Oeste / Center-West 3 0 97
Nordeste / Northeast 5 0 95
Sudeste / Southeast 3 0 97
Sul / South 3 0 97
DEPENDÊNCIA ADMINISTRATIVAADMINISTRATIVE JURISDICTION
Pública Municipal / Municipal Public 3 0 97
Pública Estadual / State Public 3 0 97
Total – Públicas / Total – Public schools 3 0 97
Particular / Private 6 0 94
SÉRIEGRADE
4a série / 5o ano do Ensino Fundamental4th grade / 5th year of Elementary Education 3 0 97
8a série / 9o ano do Ensino Fundamental8th grade / 9th year of Elementary Education 5 0 95
2o ano do Ensino Médio2nd year of Secondary Education 3 0 97
Fonte: CGI.br/NIC.br, Centro Regional de Estudos para o Desenvolvimento da Sociedade da Informação (Cetic.br), Pesquisa Sobre o Uso das Tecnologias de Informação e Comunicação nas Escolas Brasileiras – TIC Educação 2016.Source: CGI.br/NIC.br, Regional Center for Studies on the Development of the Information Society (Cetic.br), Survey on the Use of Information and Communication Technologies in Brazilian Schools – ICT In Education 2016.
� CONCLUSÃO / CONCLUSION

ICT IN EDUCATION SURVEY 2016TABLES OF RESULTS SELECTED INDICATORS TEACHERS282
EN
GLI
SH P
OR
TUG
UÊS E4C PROFESSORES, POR FREQUÊNCIA DE USO DO LABORATÓRIO DE INFORMÁTICA COM OS ALUNOS
TEACHERS BY FREQUENCY OF COMPUTER LAB USE WITH STUDENTSTOTAL DE PROFESSORES USUÁRIOS DE INTERNETTOTAL NUMBER OF TEACHERS WHO ARE INTERNET USERS
Percentual (%)Percentage (%)
Todos os dias ou quase
todos os diasEvery day or almost every day
Pelo menos uma vez
por semanaAt least
once a week
Pelo menos uma vez por mêsAt least
once a month
Menos de uma vez por mêsLess than
once a month
TOTAL 1 10 11 9
SEXOSEX
Feminino / Female 1 12 9 9
Masculino / Male 0 3 15 10
FAIXA ETÁRIAAGE GROUP
Até 30 anosUp to 30 years old 0 8 12 10
De 31 a 45 anos31 to 45 years old 1 10 12 8
De 46 anos ou mais46 years old or older 1 11 9 11
RENDA FAMILIARFAMILY INCOME
Até 3 SMUp to 3 MW 1 11 6 5
Mais de 3 até 5 SM3 MW to 5 MW 0 11 12 9
Mais de 5 SMMore than 5 MW 1 9 12 10
RENDA PESSOALPERSONAL INCOME
Até 3 SMUp to 3 MW 0 11 8 8
Mais de 3 até 5 SM3 MW to 5 MW 2 9 13 11
Mais de 5 SMMore than 5 MW 0 11 13 8
REGIÃOREGION
Norte / North 0 8 6 8
Centro-Oeste / Center-West 1 19 15 10
Nordeste / Northeast 0 4 9 5
Sudeste / Southeast 2 12 11 8
Sul / South 1 11 15 19
DEPENDÊNCIA ADMINISTRATIVAADMINISTRATIVE JURISDICTION
Pública Municipal / Municipal Public 1 13 9 7
Pública Estadual / State Public 0 6 12 12
Total – Públicas / Total – Public schools 1 10 11 10
Particular / Private 1 12 9 7
SÉRIEGRADE
4a série / 5o ano do Ensino Fundamental4th grade / 5th year of Elementary Education 2 18 5 6
8a série / 9o ano do Ensino Fundamental8th grade / 9th year of Elementary Education 0 7 16 9
2o ano do Ensino Médio2nd year of Secondary Education 1 3 12 13
Fonte: CGI.br/NIC.br, Centro Regional de Estudos para o Desenvolvimento da Sociedade da Informação (Cetic.br), Pesquisa Sobre o Uso das Tecnologias de Informação e Comunicação nas Escolas Brasileiras – TIC Educação 2016.Source: CGI.br/NIC.br, Regional Center for Studies on the Development of the Information Society (Cetic.br), Survey on the Use of Information and Communication Technologies in Brazilian Schools – ICT In Education 2016.
CONTINUA / CONTINUES �

2016 PESQUISA TIC EDUCAÇÃOPROFESSORES INDICADORES SELECIONADOS TABELAS DE RESULTADOS 283
EN
GLI
SH P
OR
TUG
UÊSE4C PROFESSORES, POR FREQUÊNCIA DE USO DO LABORATÓRIO DE INFORMÁTICA COM OS ALUNOS
TEACHERS BY FREQUENCY OF COMPUTER LAB USE WITH STUDENTSTOTAL DE PROFESSORES USUÁRIOS DE INTERNETTOTAL NUMBER OF TEACHERS WHO ARE INTERNET USERS
Percentual (%)Percentage (%)
Não sabeDoes not know
Não respondeuDid not answer
Não utiliza o laboratório de informáticaDoes not use
the computer lab
TOTAL 0 0 69
SEXOSEX
Feminino / Female 0 0 69
Masculino / Male 0 0 72
FAIXA ETÁRIAAGE GROUP
Até 30 anosUp to 30 years old 0 0 70
De 31 a 45 anos31 to 45 years old 0 0 69
De 46 anos ou mais46 years old or older 0 0 69
RENDA FAMILIARFAMILY INCOME
Até 3 SMUp to 3 MW 0 0 77
Mais de 3 até 5 SM3 MW to 5 MW 0 0 68
Mais de 5 SMMore than 5 MW 0 0 67
RENDA PESSOALPERSONAL INCOME
Até 3 SMUp to 3 MW 0 0 73
Mais de 3 até 5 SM3 MW to 5 MW 0 0 65
Mais de 5 SMMore than 5 MW 0 0 67
REGIÃOREGION
Norte / North 0 0 77
Centro-Oeste / Center-West 0 0 55
Nordeste / Northeast 0 0 81
Sudeste / Southeast 0 0 67
Sul / South 0 1 53
DEPENDÊNCIA ADMINISTRATIVAADMINISTRATIVE JURISDICTION
Pública Municipal / Municipal Public 0 0 69
Pública Estadual / State Public 0 0 69
Total – Públicas / Total – Public schools 0 0 69
Particular / Private 0 0 71
SÉRIEGRADE
4a série / 5o ano do Ensino Fundamental4th grade / 5th year of Elementary Education 0 0 69
8a série / 9o ano do Ensino Fundamental8th grade / 9th year of Elementary Education 0 0 68
2o ano do Ensino Médio2nd year of Secondary Education 0 0 71
Fonte: CGI.br/NIC.br, Centro Regional de Estudos para o Desenvolvimento da Sociedade da Informação (Cetic.br), Pesquisa Sobre o Uso das Tecnologias de Informação e Comunicação nas Escolas Brasileiras – TIC Educação 2016.Source: CGI.br/NIC.br, Regional Center for Studies on the Development of the Information Society (Cetic.br), Survey on the Use of Information and Communication Technologies in Brazilian Schools – ICT In Education 2016.
� CONCLUSÃO / CONCLUSION

ICT IN EDUCATION SURVEY 2016TABLES OF RESULTS SELECTED INDICATORS TEACHERS284
EN
GLI
SH P
OR
TUG
UÊS E10 PROFESSORES, POR USO DO COMPUTADOR E DA INTERNET NAS ATIVIDADES GERAIS
TEACHERS BY COMPUTER AND INTERNET USE IN GENERAL ACTIVITIESTOTAL DE PROFESSORES USUÁRIOS DE INTERNETTOTAL NUMBER OF TEACHERS WHO ARE INTERNET USERS
Percentual (%)Percentage (%)
Buscar conteúdo a ser trabalhado em sala de aulaSearching for content
to be used in the classroom
Buscar exemplos de planos de aula
Searching for sample
lesson plans
Outras finalidades relativas à atividade docenteOther
purposes related to teaching activities
Usar portais de professores
Accessing teacher web
portals
TOTAL 96 80 76 73
SEXOSEX
Feminino / Female 96 81 76 75
Masculino / Male 97 78 76 66
FAIXA ETÁRIAAGE GROUP
Até 30 anosUp to 30 years old 100 85 81 71
De 31 a 45 anos31 to 45 years old 97 82 80 77
De 46 anos ou mais46 years old or older 92 76 68 65
RENDA FAMILIARFAMILY INCOME
Até 3 SMUp to 3 MW 98 85 76 71
Mais de 3 até 5 SM3 MW to 5 MW 94 80 79 73
Mais de 5 SMMore than 5 MW 96 78 73 72
RENDA PESSOALPERSONAL INCOME
Até 3 SMUp to 3 MW 95 80 78 71
Mais de 3 até 5 SM3 MW to 5 MW 96 81 76 72
Mais de 5 SMMore than 5 MW 97 77 70 75
REGIÃOREGION
Norte / North 96 77 78 62
Centro-Oeste / Center-West 99 84 83 76
Nordeste / Northeast 93 76 74 66
Sudeste / Southeast 96 83 77 77
Sul / South 97 81 74 75
DEPENDÊNCIA ADMINISTRATIVAADMINISTRATIVE JURISDICTION
Pública Municipal / Municipal Public 98 84 74 72
Pública Estadual / State Public 96 78 74 68
Total – Públicas / Total – Public schools 96 81 74 70
Particular / Private 94 77 86 85
SÉRIEGRADE
4a série / 5o ano do Ensino Fundamental4th grade / 5th year of Elementary Education 95 81 80 74
8a série / 9o ano do Ensino Fundamental8th grade / 9th year of Elementary Education 97 81 73 78
2o ano do Ensino Médio2nd year of Secondary Education 97 79 74 67
Fonte: CGI.br/NIC.br, Centro Regional de Estudos para o Desenvolvimento da Sociedade da Informação (Cetic.br), Pesquisa Sobre o Uso das Tecnologias de Informação e Comunicação nas Escolas Brasileiras – TIC Educação 2016.Source: CGI.br/NIC.br, Regional Center for Studies on the Development of the Information Society (Cetic.br), Survey on the Use of Information and Communication Technologies in Brazilian Schools – ICT In Education 2016.
CONTINUA / CONTINUES �

2016 PESQUISA TIC EDUCAÇÃOPROFESSORES INDICADORES SELECIONADOS TABELAS DE RESULTADOS 285
EN
GLI
SH P
OR
TUG
UÊSE10 PROFESSORES, POR USO DO COMPUTADOR E DA INTERNET NAS ATIVIDADES GERAIS
TEACHERS BY COMPUTER AND INTERNET USE IN GENERAL ACTIVITIESTOTAL DE PROFESSORES USUÁRIOS DE INTERNETTOTAL NUMBER OF TEACHERS WHO ARE INTERNET USERS
Percentual (%)Percentage (%)
Realizar tarefas administrativas
da escolaCarrying out
administrative school tasks
Compartilhar conteúdos
educacionais com outros professores
Sharing educational content with
other teachers
Pesquisar ou baixar livros
na InternetResearching
or downloading books available on the Internet
Utilizar programas educativos da TV para mostrar em sala de aula
Using educational TV programsfor classroom
viewing
TOTAL 73 72 68 43
SEXOSEX
Feminino / Female 73 73 68 47
Masculino / Male 73 65 69 32
FAIXA ETÁRIAAGE GROUP
Até 30 anosUp to 30 years old 74 77 83 40
De 31 a 45 anos31 to 45 years old 74 74 70 44
De 46 anos ou mais46 years old or older 72 66 59 43
RENDA FAMILIARFAMILY INCOME
Até 3 SMUp to 3 MW 72 73 72 55
Mais de 3 até 5 SM3 MW to 5 MW 69 71 64 39
Mais de 5 SMMore than 5 MW 76 71 67 41
RENDA PESSOALPERSONAL INCOME
Até 3 SMUp to 3 MW 68 70 65 44
Mais de 3 até 5 SM3 MW to 5 MW 75 73 68 39
Mais de 5 SMMore than 5 MW 79 73 71 48
REGIÃOREGION
Norte / North 76 69 71 42
Centro-Oeste / Center-West 94 73 79 51
Nordeste / Northeast 59 67 72 47
Sudeste / Southeast 78 75 65 42
Sul / South 73 71 65 38
DEPENDÊNCIA ADMINISTRATIVAADMINISTRATIVE JURISDICTION
Pública Municipal / Municipal Public 69 79 66 49
Pública Estadual / State Public 76 68 69 37
Total – Públicas / Total – Public schools 73 73 67 42
Particular / Private 74 67 70 46
SÉRIEGRADE
4a série / 5o ano do Ensino Fundamental4th grade / 5th year of Elementary Education 69 77 63 52
8a série / 9o ano do Ensino Fundamental8th grade / 9th year of Elementary Education 74 71 71 43
2o ano do Ensino Médio2nd year of Secondary Education 77 65 71 33
Fonte: CGI.br/NIC.br, Centro Regional de Estudos para o Desenvolvimento da Sociedade da Informação (Cetic.br), Pesquisa Sobre o Uso das Tecnologias de Informação e Comunicação nas Escolas Brasileiras – TIC Educação 2016.Source: CGI.br/NIC.br, Regional Center for Studies on the Development of the Information Society (Cetic.br), Survey on the Use of Information and Communication Technologies in Brazilian Schools – ICT In Education 2016.
� CONCLUSÃO / CONCLUSION

ICT IN EDUCATION SURVEY 2016TABLES OF RESULTS SELECTED INDICATORS TEACHERS286
EN
GLI
SH P
OR
TUG
UÊS E10A PROFESSORES, POR TIPO DE COMPUTADOR MAIS UTILIZADO NAS ATIVIDADES GERAIS
TEACHERS BY TYPES OF COMPUTERS MOST USED IN GENERAL ACTIVITIESTOTAL DE PROFESSORES USUÁRIOS DE INTERNETTOTAL NUMBER OF TEACHERS WHO ARE INTERNET USERS
Percentual (%)Percentage (%)
Buscar conteúdo a ser trabalhado em sala de aulaSearching for content to be used in the classroom
Computador da escola
School computer
Computador próprio
Own computer
Não sabeDid not answer
Não respondeuDoes not
know
Não utilizou o computador ou a Internet para realizar
esta atividadeDid not use
computers or the Internet to carry out this
activity
TOTAL 10 85 0 0 4
SEXOSEX
Feminino / Female 10 86 0 0 4
Masculino / Male 13 83 0 0 3
FAIXA ETÁRIAAGE GROUP
Até 30 anosUp to 30 years old 16 83 1 0 0
De 31 a 45 anos31 to 45 years old 10 88 0 0 3
De 46 anos ou mais46 years old or older 9 82 0 1 8
RENDA FAMILIARFAMILY INCOME
Até 3 SMUp to 3 MW 12 86 0 0 2
Mais de 3 até 5 SM3 MW to 5 MW 11 83 0 0 6
Mais de 5 SMMore than 5 MW 10 86 0 1 4
RENDA PESSOALPERSONAL INCOME
Até 3 SMUp to 3 MW 10 84 0 0 5
Mais de 3 até 5 SM3 MW to 5 MW 13 83 0 0 4
Mais de 5 SMMore than 5 MW 6 90 0 1 3
REGIÃOREGION
Norte / North 14 81 0 0 4
Centro-Oeste / Center-West 12 88 0 0 1
Nordeste / Northeast 11 82 0 0 7
Sudeste / Southeast 8 88 0 0 4
Sul / South 16 81 1 0 3
DEPENDÊNCIA ADMINISTRATIVAADMINISTRATIVE JURISDICTION
Pública Municipal / Municipal Public 12 85 0 1 2
Pública Estadual / State Public 11 84 0 0 4
Total – Públicas / Total – Public schools 11 85 0 0 4
Particular / Private 6 87 0 0 6
SÉRIEGRADE
4a série / 5o ano do Ensino Fundamental4th grade / 5th year of Elementary Education 11 83 0 1 5
8a série / 9o ano do Ensino Fundamental8th grade / 9th year of Elementary Education 8 88 0 0 3
2o ano do Ensino Médio2nd year of Secondary Education 12 85 0 0 4
Fonte: CGI.br/NIC.br, Centro Regional de Estudos para o Desenvolvimento da Sociedade da Informação (Cetic.br), Pesquisa Sobre o Uso das Tecnologias de Informação e Comunicação nas Escolas Brasileiras – TIC Educação 2016.Source: CGI.br/NIC.br, Regional Center for Studies on the Development of the Information Society (Cetic.br), Survey on the Use of Information and Communication Technologies in Brazilian Schools – ICT In Education 2016.
CONTINUA / CONTINUES �

2016 PESQUISA TIC EDUCAÇÃOPROFESSORES INDICADORES SELECIONADOS TABELAS DE RESULTADOS 287
EN
GLI
SH P
OR
TUG
UÊSE10A PROFESSORES, POR TIPO DE COMPUTADOR MAIS UTILIZADO NAS ATIVIDADES GERAIS
TEACHERS BY TYPES OF COMPUTERS MOST USED IN GENERAL ACTIVITIESTOTAL DE PROFESSORES USUÁRIOS DE INTERNETTOTAL NUMBER OF TEACHERS WHO ARE INTERNET USERS
Percentual (%)Percentage (%)
Buscar exemplos de planos de aulaSearching for sample lesson plans
Computador da escola
School computer
Computador próprio
Own computer
Não sabeDid not answer
Não respondeuDoes not
know
Não utilizou o computador ou a Internet para realizar
esta atividadeDid not use
computers or the Internet to carry out this
activity
TOTAL 10 70 0 0 20
SEXOSEX
Feminino / Female 9 72 0 0 19
Masculino / Male 14 63 0 0 22
FAIXA ETÁRIAAGE GROUP
Até 30 anosUp to 30 years old 16 69 0 0 15
De 31 a 45 anos31 to 45 years old 10 72 0 0 18
De 46 anos ou mais46 years old or older 9 67 0 0 24
RENDA FAMILIARFAMILY INCOME
Até 3 SMUp to 3 MW 10 75 0 0 15
Mais de 3 até 5 SM3 MW to 5 MW 12 69 0 0 20
Mais de 5 SMMore than 5 MW 10 68 0 0 22
RENDA PESSOALPERSONAL INCOME
Até 3 SMUp to 3 MW 11 69 0 0 20
Mais de 3 até 5 SM3 MW to 5 MW 11 70 0 0 19
Mais de 5 SMMore than 5 MW 7 71 0 0 23
REGIÃOREGION
Norte / North 13 65 0 0 23
Centro-Oeste / Center-West 9 75 0 0 16
Nordeste / Northeast 10 66 0 0 24
Sudeste / Southeast 10 73 0 0 17
Sul / South 12 69 0 0 19
DEPENDÊNCIA ADMINISTRATIVAADMINISTRATIVE JURISDICTION
Pública Municipal / Municipal Public 11 73 0 0 16
Pública Estadual / State Public 10 68 0 0 22
Total – Públicas / Total – Public schools 11 70 0 0 19
Particular / Private 8 69 0 0 23
SÉRIEGRADE
4a série / 5o ano do Ensino Fundamental4th grade / 5th year of Elementary Education 11 69 0 0 19
8a série / 9o ano do Ensino Fundamental8th grade / 9th year of Elementary Education 8 73 0 0 19
2o ano do Ensino Médio2nd year of Secondary Education 11 68 0 0 21
Fonte: CGI.br/NIC.br, Centro Regional de Estudos para o Desenvolvimento da Sociedade da Informação (Cetic.br), Pesquisa Sobre o Uso das Tecnologias de Informação e Comunicação nas Escolas Brasileiras – TIC Educação 2016.Source: CGI.br/NIC.br, Regional Center for Studies on the Development of the Information Society (Cetic.br), Survey on the Use of Information and Communication Technologies in Brazilian Schools – ICT In Education 2016.
� CONTINUAÇÃO / CONTINUATION

ICT IN EDUCATION SURVEY 2016TABLES OF RESULTS SELECTED INDICATORS TEACHERS288
EN
GLI
SH P
OR
TUG
UÊS E10A PROFESSORES, POR TIPO DE COMPUTADOR MAIS UTILIZADO NAS ATIVIDADES GERAIS
TEACHERS BY TYPES OF COMPUTERS MOST USED IN GENERAL ACTIVITIESTOTAL DE PROFESSORES USUÁRIOS DE INTERNETTOTAL NUMBER OF TEACHERS WHO ARE INTERNET USERS
Percentual (%)Percentage (%)
Compartilhar conteúdos educacionais com outros professoresSharing educational content with other teachers
Computador da escola
School computer
Computador próprio
Own computer
Não sabeDid not answer
Não respondeuDoes not
know
Não utilizou o computador ou a Internet para realizar
esta atividadeDid not use
computers or the Internet to carry out this
activity
TOTAL 9 62 0 0 28
SEXOSEX
Feminino / Female 8 64 0 1 27
Masculino / Male 12 54 0 0 35
FAIXA ETÁRIAAGE GROUP
Até 30 anosUp to 30 years old 12 65 0 0 23
De 31 a 45 anos31 to 45 years old 10 63 0 0 26
De 46 anos ou mais46 years old or older 6 59 0 1 34
RENDA FAMILIARFAMILY INCOME
Até 3 SMUp to 3 MW 12 60 0 0 27
Mais de 3 até 5 SM3 MW to 5 MW 10 61 0 0 29
Mais de 5 SMMore than 5 MW 8 63 0 1 29
RENDA PESSOALPERSONAL INCOME
Até 3 SMUp to 3 MW 10 60 0 0 30
Mais de 3 até 5 SM3 MW to 5 MW 11 62 0 0 27
Mais de 5 SMMore than 5 MW 4 67 0 1 27
REGIÃOREGION
Norte / North 9 60 0 0 31
Centro-Oeste / Center-West 11 62 0 0 27
Nordeste / Northeast 9 57 0 1 33
Sudeste / Southeast 8 66 0 1 25
Sul / South 12 59 1 0 29
DEPENDÊNCIA ADMINISTRATIVAADMINISTRATIVE JURISDICTION
Pública Municipal / Municipal Public 8 69 0 1 22
Pública Estadual / State Public 10 58 0 0 32
Total – Públicas / Total – Public schools 9 63 0 1 27
Particular / Private 9 58 0 0 33
SÉRIEGRADE
4a série / 5o ano do Ensino Fundamental4th grade / 5th year of Elementary Education 10 67 0 1 23
8a série / 9o ano do Ensino Fundamental8th grade / 9th year of Elementary Education 6 64 0 1 29
2o ano do Ensino Médio2nd year of Secondary Education 11 54 0 0 35
Fonte: CGI.br/NIC.br, Centro Regional de Estudos para o Desenvolvimento da Sociedade da Informação (Cetic.br), Pesquisa Sobre o Uso das Tecnologias de Informação e Comunicação nas Escolas Brasileiras – TIC Educação 2016.Source: CGI.br/NIC.br, Regional Center for Studies on the Development of the Information Society (Cetic.br), Survey on the Use of Information and Communication Technologies in Brazilian Schools – ICT In Education 2016.
� CONTINUAÇÃO / CONTINUATION

2016 PESQUISA TIC EDUCAÇÃOPROFESSORES INDICADORES SELECIONADOS TABELAS DE RESULTADOS 289
EN
GLI
SH P
OR
TUG
UÊSE10A PROFESSORES, POR TIPO DE COMPUTADOR MAIS UTILIZADO NAS ATIVIDADES GERAIS
TEACHERS BY TYPES OF COMPUTERS MOST USED IN GENERAL ACTIVITIESTOTAL DE PROFESSORES USUÁRIOS DE INTERNETTOTAL NUMBER OF TEACHERS WHO ARE INTERNET USERS
Percentual (%)Percentage (%)
Realizar tarefas administrativas da escolaCarrying out administrative school tasks
Computador da escola
School computer
Computador próprio
Own computer
Não sabeDid not answer
Não respondeuDoes not
know
Não utilizou o computador ou a Internet para realizar
esta atividadeDid not use
computers or the Internet to carry out this
activity
TOTAL 18 55 0 0 27
SEXOSEX
Feminino / Female 18 55 0 0 27
Masculino / Male 18 55 0 0 27
FAIXA ETÁRIAAGE GROUP
Até 30 anosUp to 30 years old 19 55 0 0 26
De 31 a 45 anos31 to 45 years old 16 58 0 0 26
De 46 anos ou mais46 years old or older 22 50 0 0 28
RENDA FAMILIARFAMILY INCOME
Até 3 SMUp to 3 MW 15 57 0 0 28
Mais de 3 até 5 SM3 MW to 5 MW 19 50 0 0 31
Mais de 5 SMMore than 5 MW 18 58 0 0 24
RENDA PESSOALPERSONAL INCOME
Até 3 SMUp to 3 MW 14 55 0 0 32
Mais de 3 até 5 SM3 MW to 5 MW 22 54 0 0 25
Mais de 5 SMMore than 5 MW 22 57 0 0 21
REGIÃOREGION
Norte / North 19 57 0 0 24
Centro-Oeste / Center-West 16 78 0 0 6
Nordeste / Northeast 9 50 0 0 41
Sudeste / Southeast 23 54 0 0 22
Sul / South 18 54 0 0 27
DEPENDÊNCIA ADMINISTRATIVAADMINISTRATIVE JURISDICTION
Pública Municipal / Municipal Public 23 46 0 0 31
Pública Estadual / State Public 19 57 0 0 24
Total – Públicas / Total – Public schools 20 52 0 0 27
Particular / Private 9 65 0 0 26
SÉRIEGRADE
4a série / 5o ano do Ensino Fundamental4th grade / 5th year of Elementary Education 18 51 0 0 31
8a série / 9o ano do Ensino Fundamental8th grade / 9th year of Elementary Education 18 57 0 0 26
2o ano do Ensino Médio2nd year of Secondary Education 18 58 0 0 23
Fonte: CGI.br/NIC.br, Centro Regional de Estudos para o Desenvolvimento da Sociedade da Informação (Cetic.br), Pesquisa Sobre o Uso das Tecnologias de Informação e Comunicação nas Escolas Brasileiras – TIC Educação 2016.Source: CGI.br/NIC.br, Regional Center for Studies on the Development of the Information Society (Cetic.br), Survey on the Use of Information and Communication Technologies in Brazilian Schools – ICT In Education 2016.
� CONTINUAÇÃO / CONTINUATION

ICT IN EDUCATION SURVEY 2016TABLES OF RESULTS SELECTED INDICATORS TEACHERS290
EN
GLI
SH P
OR
TUG
UÊS E10A PROFESSORES, POR TIPO DE COMPUTADOR MAIS UTILIZADO NAS ATIVIDADES GERAIS
TEACHERS BY TYPES OF COMPUTERS MOST USED IN GENERAL ACTIVITIESTOTAL DE PROFESSORES USUÁRIOS DE INTERNETTOTAL NUMBER OF TEACHERS WHO ARE INTERNET USERS
Percentual (%)Percentage (%)
Pesquisar ou baixar livros na InternetResearching or downloading books available on the Internet
Computador da escola
School computer
Computador próprio
Own computer
Não sabeDid not answer
Não respondeuDoes not
know
Não utilizou o computador ou a Internet para realizar
esta atividadeDid not use
computers or the Internet to carry out this
activity
TOTAL 4 64 0 0 32
SEXOSEX
Feminino / Female 4 64 0 0 32
Masculino / Male 6 63 0 1 31
FAIXA ETÁRIAAGE GROUP
Até 30 anosUp to 30 years old 6 77 0 0 17
De 31 a 45 anos31 to 45 years old 4 66 0 0 30
De 46 anos ou mais46 years old or older 3 55 0 0 41
RENDA FAMILIARFAMILY INCOME
Até 3 SMUp to 3 MW 3 69 0 0 28
Mais de 3 até 5 SM3 MW to 5 MW 3 61 0 0 36
Mais de 5 SMMore than 5 MW 5 62 0 0 33
RENDA PESSOALPERSONAL INCOME
Até 3 SMUp to 3 MW 4 61 0 0 35
Mais de 3 até 5 SM3 MW to 5 MW 5 63 0 0 32
Mais de 5 SMMore than 5 MW 2 69 0 0 29
REGIÃOREGION
Norte / North 5 65 0 0 29
Centro-Oeste / Center-West 3 75 0 1 21
Nordeste / Northeast 5 67 0 0 28
Sudeste / Southeast 3 62 0 0 35
Sul / South 7 58 0 0 35
DEPENDÊNCIA ADMINISTRATIVAADMINISTRATIVE JURISDICTION
Pública Municipal / Municipal Public 4 61 0 0 34
Pública Estadual / State Public 4 64 0 0 31
Total – Públicas / Total – Public schools 4 63 0 0 33
Particular / Private 2 68 0 0 30
SÉRIEGRADE
4a série / 5o ano do Ensino Fundamental4th grade / 5th year of Elementary Education 4 59 0 0 37
8a série / 9o ano do Ensino Fundamental8th grade / 9th year of Elementary Education 2 69 0 0 29
2o ano do Ensino Médio2nd year of Secondary Education 5 65 0 0 29
Fonte: CGI.br/NIC.br, Centro Regional de Estudos para o Desenvolvimento da Sociedade da Informação (Cetic.br), Pesquisa Sobre o Uso das Tecnologias de Informação e Comunicação nas Escolas Brasileiras – TIC Educação 2016.Source: CGI.br/NIC.br, Regional Center for Studies on the Development of the Information Society (Cetic.br), Survey on the Use of Information and Communication Technologies in Brazilian Schools – ICT In Education 2016.
� CONTINUAÇÃO / CONTINUATION

2016 PESQUISA TIC EDUCAÇÃOPROFESSORES INDICADORES SELECIONADOS TABELAS DE RESULTADOS 291
EN
GLI
SH P
OR
TUG
UÊSE10A PROFESSORES, POR TIPO DE COMPUTADOR MAIS UTILIZADO NAS ATIVIDADES GERAIS
TEACHERS BY TYPES OF COMPUTERS MOST USED IN GENERAL ACTIVITIESTOTAL DE PROFESSORES USUÁRIOS DE INTERNETTOTAL NUMBER OF TEACHERS WHO ARE INTERNET USERS
Percentual (%)Percentage (%)
Usar portais de professoresAccessing teacher web portals
Computador da escola
School computer
Computador próprio
Own computer
Não sabeDid not answer
Não respondeuDoes not
know
Não utilizou o computador ou a Internet para realizar
esta atividadeDid not use
computers or the Internet to carry out this
activity
TOTAL 10 62 0 0 27
SEXOSEX
Feminino / Female 10 64 0 0 25
Masculino / Male 11 54 0 0 34
FAIXA ETÁRIAAGE GROUP
Até 30 anosUp to 30 years old 11 61 0 0 29
De 31 a 45 anos31 to 45 years old 11 66 0 0 23
De 46 anos ou mais46 years old or older 9 55 0 1 35
RENDA FAMILIARFAMILY INCOME
Até 3 SMUp to 3 MW 8 64 0 0 29
Mais de 3 até 5 SM3 MW to 5 MW 10 63 0 0 27
Mais de 5 SMMore than 5 MW 12 60 0 1 28
RENDA PESSOALPERSONAL INCOME
Até 3 SMUp to 3 MW 8 63 0 0 29
Mais de 3 até 5 SM3 MW to 5 MW 13 59 0 0 28
Mais de 5 SMMore than 5 MW 11 63 0 1 25
REGIÃOREGION
Norte / North 8 54 0 0 38
Centro-Oeste / Center-West 10 66 0 0 24
Nordeste / Northeast 7 59 0 0 34
Sudeste / Southeast 11 65 0 0 23
Sul / South 14 61 0 0 25
DEPENDÊNCIA ADMINISTRATIVAADMINISTRATIVE JURISDICTION
Pública Municipal / Municipal Public 15 56 0 1 28
Pública Estadual / State Public 9 59 0 0 32
Total – Públicas / Total – Public schools 12 58 0 0 30
Particular / Private 5 80 0 0 15
SÉRIEGRADE
4a série / 5o ano do Ensino Fundamental4th grade / 5th year of Elementary Education 11 62 0 1 26
8a série / 9o ano do Ensino Fundamental8th grade / 9th year of Elementary Education 10 68 0 0 22
2o ano do Ensino Médio2nd year of Secondary Education 10 57 0 0 33
Fonte: CGI.br/NIC.br, Centro Regional de Estudos para o Desenvolvimento da Sociedade da Informação (Cetic.br), Pesquisa Sobre o Uso das Tecnologias de Informação e Comunicação nas Escolas Brasileiras – TIC Educação 2016.Source: CGI.br/NIC.br, Regional Center for Studies on the Development of the Information Society (Cetic.br), Survey on the Use of Information and Communication Technologies in Brazilian Schools – ICT In Education 2016.
� CONTINUAÇÃO / CONTINUATION

ICT IN EDUCATION SURVEY 2016TABLES OF RESULTS SELECTED INDICATORS TEACHERS292
EN
GLI
SH P
OR
TUG
UÊS E10A PROFESSORES, POR TIPO DE COMPUTADOR MAIS UTILIZADO NAS ATIVIDADES GERAIS
TEACHERS BY TYPES OF COMPUTERS MOST USED IN GENERAL ACTIVITIESTOTAL DE PROFESSORES USUÁRIOS DE INTERNETTOTAL NUMBER OF TEACHERS WHO ARE INTERNET USERS
Percentual (%)Percentage (%)
Utilizar programas educativos da TV para mostrar em sala de aulaUsing educational TV programs for classroom viewing
Computador da escola
School computer
Computador próprio
Own computer
Não sabeDid not answer
Não respondeuDoes not
know
Não utilizou o computador ou a Internet para realizar
esta atividadeDid not use
computers or the Internet to carry out this
activity
TOTAL 10 33 0 0 57
SEXOSEX
Feminino / Female 10 36 0 0 53
Masculino / Male 8 24 0 0 68
FAIXA ETÁRIAAGE GROUP
Até 30 anosUp to 30 years old 12 28 0 0 60
De 31 a 45 anos31 to 45 years old 10 34 0 0 56
De 46 anos ou mais46 years old or older 9 34 0 0 57
RENDA FAMILIARFAMILY INCOME
Até 3 SMUp to 3 MW 11 44 0 0 45
Mais de 3 até 5 SM3 MW to 5 MW 10 29 0 0 61
Mais de 5 SMMore than 5 MW 8 33 0 0 59
RENDA PESSOALPERSONAL INCOME
Até 3 SMUp to 3 MW 10 34 0 0 56
Mais de 3 até 5 SM3 MW to 5 MW 11 28 0 0 61
Mais de 5 SMMore than 5 MW 8 40 0 0 52
REGIÃOREGION
Norte / North 9 34 0 0 58
Centro-Oeste / Center-West 11 39 0 0 49
Nordeste / Northeast 9 38 0 0 53
Sudeste / Southeast 9 33 0 0 58
Sul / South 13 24 0 0 62
DEPENDÊNCIA ADMINISTRATIVAADMINISTRATIVE JURISDICTION
Pública Municipal / Municipal Public 13 36 0 0 51
Pública Estadual / State Public 7 30 0 0 63
Total – Públicas / Total – Public schools 10 33 0 0 58
Particular / Private 11 35 0 0 54
SÉRIEGRADE
4a série / 5o ano do Ensino Fundamental4th grade / 5th year of Elementary Education 12 41 0 0 48
8a série / 9o ano do Ensino Fundamental8th grade / 9th year of Elementary Education 11 32 0 0 57
2o ano do Ensino Médio2nd year of Secondary Education 7 26 0 0 67
Fonte: CGI.br/NIC.br, Centro Regional de Estudos para o Desenvolvimento da Sociedade da Informação (Cetic.br), Pesquisa Sobre o Uso das Tecnologias de Informação e Comunicação nas Escolas Brasileiras – TIC Educação 2016.Source: CGI.br/NIC.br, Regional Center for Studies on the Development of the Information Society (Cetic.br), Survey on the Use of Information and Communication Technologies in Brazilian Schools – ICT In Education 2016.
� CONTINUAÇÃO / CONTINUATION
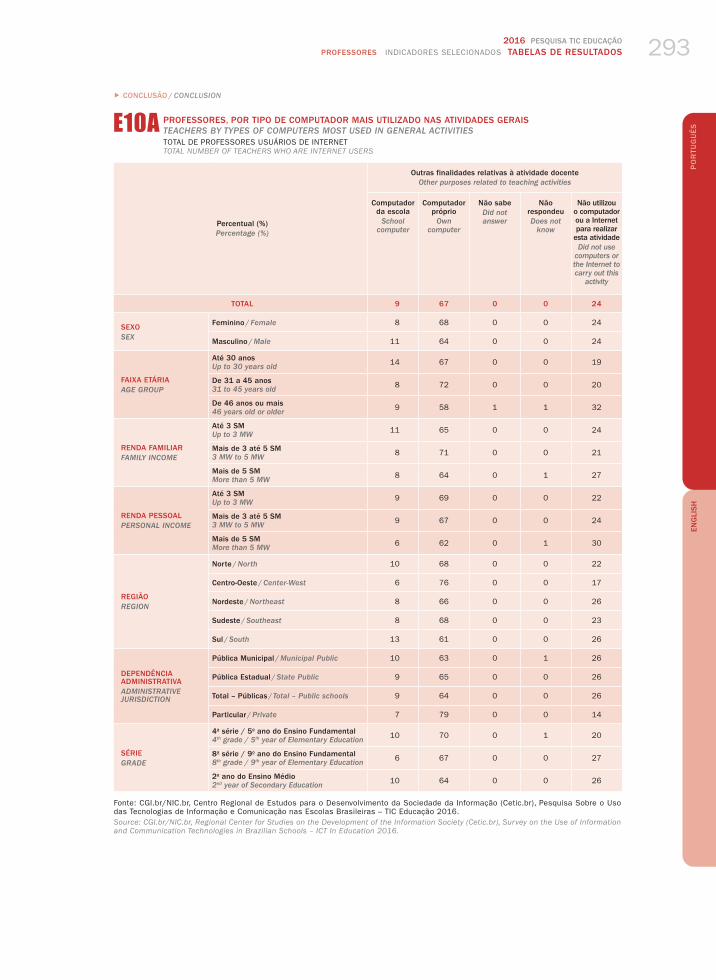
2016 PESQUISA TIC EDUCAÇÃOPROFESSORES INDICADORES SELECIONADOS TABELAS DE RESULTADOS 293
EN
GLI
SH P
OR
TUG
UÊSE10A PROFESSORES, POR TIPO DE COMPUTADOR MAIS UTILIZADO NAS ATIVIDADES GERAIS
TEACHERS BY TYPES OF COMPUTERS MOST USED IN GENERAL ACTIVITIESTOTAL DE PROFESSORES USUÁRIOS DE INTERNETTOTAL NUMBER OF TEACHERS WHO ARE INTERNET USERS
Percentual (%)Percentage (%)
Outras finalidades relativas à atividade docenteOther purposes related to teaching activities
Computador da escola
School computer
Computador próprio
Own computer
Não sabeDid not answer
Não respondeuDoes not
know
Não utilizou o computador ou a Internet para realizar
esta atividadeDid not use
computers or the Internet to carry out this
activity
TOTAL 9 67 0 0 24
SEXOSEX
Feminino / Female 8 68 0 0 24
Masculino / Male 11 64 0 0 24
FAIXA ETÁRIAAGE GROUP
Até 30 anosUp to 30 years old 14 67 0 0 19
De 31 a 45 anos31 to 45 years old 8 72 0 0 20
De 46 anos ou mais46 years old or older 9 58 1 1 32
RENDA FAMILIARFAMILY INCOME
Até 3 SMUp to 3 MW 11 65 0 0 24
Mais de 3 até 5 SM3 MW to 5 MW 8 71 0 0 21
Mais de 5 SMMore than 5 MW 8 64 0 1 27
RENDA PESSOALPERSONAL INCOME
Até 3 SMUp to 3 MW 9 69 0 0 22
Mais de 3 até 5 SM3 MW to 5 MW 9 67 0 0 24
Mais de 5 SMMore than 5 MW 6 62 0 1 30
REGIÃOREGION
Norte / North 10 68 0 0 22
Centro-Oeste / Center-West 6 76 0 0 17
Nordeste / Northeast 8 66 0 0 26
Sudeste / Southeast 8 68 0 0 23
Sul / South 13 61 0 0 26
DEPENDÊNCIA ADMINISTRATIVAADMINISTRATIVE JURISDICTION
Pública Municipal / Municipal Public 10 63 0 1 26
Pública Estadual / State Public 9 65 0 0 26
Total – Públicas / Total – Public schools 9 64 0 0 26
Particular / Private 7 79 0 0 14
SÉRIEGRADE
4a série / 5o ano do Ensino Fundamental4th grade / 5th year of Elementary Education 10 70 0 1 20
8a série / 9o ano do Ensino Fundamental8th grade / 9th year of Elementary Education 6 67 0 0 27
2o ano do Ensino Médio2nd year of Secondary Education 10 64 0 0 26
Fonte: CGI.br/NIC.br, Centro Regional de Estudos para o Desenvolvimento da Sociedade da Informação (Cetic.br), Pesquisa Sobre o Uso das Tecnologias de Informação e Comunicação nas Escolas Brasileiras – TIC Educação 2016.Source: CGI.br/NIC.br, Regional Center for Studies on the Development of the Information Society (Cetic.br), Survey on the Use of Information and Communication Technologies in Brazilian Schools – ICT In Education 2016.
� CONCLUSÃO / CONCLUSION

ICT IN EDUCATION SURVEY 2016TABLES OF RESULTS SELECTED INDICATORS TEACHERS294
EN
GLI
SH P
OR
TUG
UÊS E10B PROFESSORES, POR FREQUÊNCIA DE ACESSO À INTERNET EM ATIVIDADES COM OS ALUNOS, COMPUTADOR
PRÓPRIO OU DA ESCOLATEACHERS BY FREQUENCY OF INTERNET ACCESS IN ACTIVITIES WITH STUDENTS VIA THEIR OWN OR SCHOOL COMPUTERSTOTAL DE PROFESSORES USUÁRIOS DE INTERNETTOTAL NUMBER OF TEACHERS WHO ARE INTERNET USERS
Percentual (%)Percentage (%)
Computador da escolaSchool computer
Mai
s de
um
a ve
z po
r di
aM
ore
than
onc
e a
day
Pelo
men
os u
ma
vez
por
dia
At
leas
t on
ce a
day
Pelo
men
os u
ma
vez
por
sem
ana
At
leas
t on
ce a
wee
k
Pelo
men
os u
ma
vez
por
mês
At
leas
t on
ce a
mon
th
Men
os d
e um
a ve
z po
r m
êsLe
ss t
han
once
a m
onth
Nun
caN
ever
Na
esco
la n
ão t
em c
ompu
tado
r pa
ra u
so c
om o
s al
unos
Ther
e is
no
com
pute
r at
thi
s sc
hool
for
stu
dent
s to
use
Não
uso
u a
Inte
rnet
na
esco
laD
id n
ot u
se t
he In
tern
et a
t sc
hool
TOTAL 6 7 21 13 12 24 1 17
SEXOSEX
Feminino / Female 5 8 23 12 11 23 1 17
Masculino / Male 9 4 14 13 15 25 0 19
FAIXA ETÁRIAAGE GROUP
Até 30 anosUp to 30 years old 7 5 26 14 16 23 1 8
De 31 a 45 anos31 to 45 years old 6 7 21 13 10 26 1 16
De 46 anos ou mais46 years old or older 5 8 19 11 13 20 0 24
RENDA FAMILIARFAMILY INCOME
Até 3 SMUp to 3 MW 3 4 27 11 7 21 1 27
Mais de 3 até 5 SM3 MW to 5 MW 5 8 21 11 10 26 0 17
Mais de 5 SMMore than 5 MW 6 7 19 15 15 23 1 14
RENDA PESSOALPERSONAL INCOME
Até 3 SMUp to 3 MW 4 7 24 12 8 22 0 23
Mais de 3 até 5 SM3 MW to 5 MW 8 7 19 11 15 26 1 14
Mais de 5 SMMore than 5 MW 4 10 19 18 15 22 1 11
REGIÃOREGION
Norte / North 8 5 17 10 6 25 1 28
Centro-Oeste / Center-West 6 7 26 15 11 28 0 6
Nordeste / Northeast 4 8 23 8 9 23 0 25
Sudeste / Southeast 7 8 20 15 13 23 0 15
Sul / South 5 5 22 14 19 24 2 9
DEPENDÊNCIA ADMINISTRATIVAADMINISTRATIVE JURISDICTION
Pública Municipal / Municipal Public 3 8 28 13 10 18 0 20
Pública Estadual / State Public 5 5 15 12 16 31 1 15
Total – Públicas / Total – Public schools 4 6 21 12 13 26 1 17
Particular / Private 12 10 22 13 7 16 0 19
SÉRIEGRADE
4a série / 5o ano do Ensino Fundamental4th grade / 5th year of Elementary Education 4 7 29 10 9 19 0 22
8a série / 9o ano do Ensino Fundamental8th grade / 9th year of Elementary Education 7 8 15 16 13 24 1 15
2o ano do Ensino Médio2nd year of Secondary Education 7 6 16 13 14 30 0 14
Fonte: CGI.br/NIC.br, Centro Regional de Estudos para o Desenvolvimento da Sociedade da Informação (Cetic.br), Pesquisa Sobre o Uso das Tecnologias de Informação e Comunicação nas Escolas Brasileiras – TIC Educação 2016.Source: CGI.br/NIC.br, Regional Center for Studies on the Development of the Information Society (Cetic.br), Survey on the Use of Information and Communication Technologies in Brazilian Schools – ICT In Education 2016.
CONTINUA / CONTINUES �

2016 PESQUISA TIC EDUCAÇÃOPROFESSORES INDICADORES SELECIONADOS TABELAS DE RESULTADOS 295
EN
GLI
SH P
OR
TUG
UÊSE10B PROFESSORES, POR FREQUÊNCIA DE ACESSO À INTERNET EM ATIVIDADES COM OS ALUNOS, COMPUTADOR
PRÓPRIO OU DA ESCOLATEACHERS BY FREQUENCY OF INTERNET ACCESS IN ACTIVITIES WITH STUDENTS VIA THEIR OWN OR SCHOOL COMPUTERSTOTAL DE PROFESSORES USUÁRIOS DE INTERNETTOTAL NUMBER OF TEACHERS WHO ARE INTERNET USERS
Percentual (%)Percentage (%)
Computador ou tablet próprioOwn computer or tablet
Mai
s de
um
a ve
z po
r di
aM
ore
than
onc
e a
day
Pelo
men
os u
ma
vez
por
dia
At
leas
t on
ce a
day
Pelo
men
os u
ma
vez
por
sem
ana
At
leas
t on
ce a
wee
k
Pelo
men
os u
ma
vez
por
mês
At
leas
t on
ce a
mon
th
Men
os d
e um
a ve
z po
r m
êsLe
ss t
han
once
a m
onth
Nun
caN
ever
Não
uso
u a
Inte
rnet
na
esco
la
e nã
o co
stum
a le
var
seu
com
puta
dor
para
a e
scol
aD
id n
ot u
se t
he In
tern
et a
t sc
hool
an
d us
ually
doe
s no
t ta
ke t
heir
own
com
pute
r to
sch
ool
TOTAL 11 8 12 8 3 7 52
SEXOSEX
Feminino / Female 11 8 12 8 3 7 51
Masculino / Male 13 7 11 6 3 6 54
FAIXA ETÁRIAAGE GROUP
Até 30 anosUp to 30 years old 8 13 11 9 4 6 49
De 31 a 45 anos31 to 45 years old 14 7 12 9 3 6 49
De 46 anos ou mais46 years old or older 7 7 11 5 3 9 58
RENDA FAMILIARFAMILY INCOME
Até 3 SMUp to 3 MW 7 7 12 5 2 4 64
Mais de 3 até 5 SM3 MW to 5 MW 12 9 13 6 3 7 51
Mais de 5 SMMore than 5 MW 11 7 11 10 3 8 49
RENDA PESSOALPERSONAL INCOME
Até 3 SMUp to 3 MW 10 8 10 6 2 4 60
Mais de 3 até 5 SM3 MW to 5 MW 13 8 12 6 5 9 46
Mais de 5 SMMore than 5 MW 9 7 13 14 2 9 46
REGIÃOREGION
Norte / North 16 5 10 6 3 6 53
Centro-Oeste / Center-West 17 12 15 12 4 8 32
Nordeste / Northeast 13 8 13 7 2 5 51
Sudeste / Southeast 9 8 10 8 3 6 56
Sul / South 8 6 17 8 5 10 46
DEPENDÊNCIA ADMINISTRATIVAADMINISTRATIVE JURISDICTION
Pública Municipal / Municipal Public 11 8 12 7 3 8 51
Pública Estadual / State Public 10 8 12 8 4 7 51
Total – Públicas / Total – Public schools 10 8 12 8 3 7 51
Particular / Private 15 7 10 7 1 5 55
SÉRIEGRADE
4a série / 5o ano do Ensino Fundamental4th grade / 5th year of Elementary Education 12 10 11 6 2 4 56
8a série / 9o ano do Ensino Fundamental8th grade / 9th year of Elementary Education 11 7 10 10 4 11 47
2o ano do Ensino Médio2nd year of Secondary Education 11 6 14 8 3 6 53
Fonte: CGI.br/NIC.br, Centro Regional de Estudos para o Desenvolvimento da Sociedade da Informação (Cetic.br), Pesquisa Sobre o Uso das Tecnologias de Informação e Comunicação nas Escolas Brasileiras – TIC Educação 2016.Source: CGI.br/NIC.br, Regional Center for Studies on the Development of the Information Society (Cetic.br), Survey on the Use of Information and Communication Technologies in Brazilian Schools – ICT In Education 2016.
� CONCLUSÃO / CONCLUSION

ICT IN EDUCATION SURVEY 2016TABLES OF RESULTS SELECTED INDICATORS TEACHERS296
EN
GLI
SH P
OR
TUG
UÊS E14 PROFESSORES QUE ACESSARAM A INTERNET PELO TELEFONE CELULAR EM ATIVIDADES COM OS ALUNOS
TEACHERS WHO ACCESSED THE INTERNET VIA MOBILE PHONES DURING ACTIVITIES WITH STUDENTSTOTAL DE PROFESSORES USUÁRIOS DE INTERNETTOTAL NUMBER OF TEACHERS WHO ARE INTERNET USERS
Percentual (%)Percentage (%)
SimYes
NãoNo
Não usou a Internet no celular
Did not use the Internet via mobile phones
TOTAL 49 42 9
SEXOSEX
Feminino / Female 53 38 9
Masculino / Male 36 55 10
FAIXA ETÁRIAAGE GROUP
Até 30 anosUp to 30 years old 56 42 2
De 31 a 45 anos31 to 45 years old 51 42 7
De 46 anos ou mais46 years old or older 43 41 17
RENDA FAMILIARFAMILY INCOME
Até 3 SMUp to 3 MW 49 42 9
Mais de 3 até 5 SM3 MW to 5 MW 50 40 10
Mais de 5 SMMore than 5 MW 49 42 9
RENDA PESSOALPERSONAL INCOME
Até 3 SMUp to 3 MW 51 38 12
Mais de 3 até 5 SM3 MW to 5 MW 49 44 7
Mais de 5 SMMore than 5 MW 46 44 10
REGIÃOREGION
Norte / North 47 40 13
Centro-Oeste / Center-West 53 42 6
Nordeste / Northeast 46 40 14
Sudeste / Southeast 52 41 6
Sul / South 44 46 10
DEPENDÊNCIA ADMINISTRATIVAADMINISTRATIVE JURISDICTION
Pública Municipal / Municipal Public 48 40 12
Pública Estadual / State Public 45 48 7
Total – Públicas / Total – Public schools 46 45 9
Particular / Private 61 30 9
SÉRIEGRADE
4a série / 5o ano do Ensino Fundamental4th grade / 5th year of Elementary Education 61 28 11
8a série / 9o ano do Ensino Fundamental8th grade / 9th year of Elementary Education 42 48 10
2o ano do Ensino Médio2nd year of Secondary Education 41 52 7
Fonte: CGI.br/NIC.br, Centro Regional de Estudos para o Desenvolvimento da Sociedade da Informação (Cetic.br), Pesquisa Sobre o Uso das Tecnologias de Informação e Comunicação nas Escolas Brasileiras – TIC Educação 2016.Source: CGI.br/NIC.br, Regional Center for Studies on the Development of the Information Society (Cetic.br), Survey on the Use of Information and Communication Technologies in Brazilian Schools – ICT In Education 2016.

2016 PESQUISA TIC EDUCAÇÃOPROFESSORES INDICADORES SELECIONADOS TABELAS DE RESULTADOS 297
EN
GLI
SH P
OR
TUG
UÊSE15 PROFESSORES, POR FREQUÊNCIA DE ACESSO À INTERNET PELO TELEFONE CELULAR EM ATIVIDADES
COM OS ALUNOSTEACHERS BY FREQUENCY OF INTERNET ACCESS VIA MOBILE PHONES WITH STUDENTSTOTAL DE PROFESSORES USUÁRIOS DE INTERNETTOTAL NUMBER OF TEACHERS WHO ARE INTERNET USERS
Percentual (%)Percentage (%)
Mais de uma vez por dia
More than once a day
Pelo menos uma vez por diaAt least
once a day
Pelo menos uma vez
por semanaAt least
once a week
Pelo menos uma vez por mêsAt least
once a month
TOTAL 6 7 18 12
SEXOSEX
Feminino / Female 6 7 20 13
Masculino / Male 3 6 13 9
FAIXA ETÁRIAAGE GROUP
Até 30 anosUp to 30 years old 6 10 20 16
De 31 a 45 anos31 to 45 years old 7 5 19 13
De 46 anos ou mais46 years old or older 4 8 16 9
RENDA FAMILIARFAMILY INCOME
Até 3 SMUp to 3 MW 4 10 24 6
Mais de 3 até 5 SM3 MW to 5 MW 5 4 13 20
Mais de 5 SMMore than 5 MW 6 8 20 9
RENDA PESSOALPERSONAL INCOME
Até 3 SMUp to 3 MW 4 7 19 13
Mais de 3 até 5 SM3 MW to 5 MW 7 5 16 14
Mais de 5 SMMore than 5 MW 5 9 19 9
REGIÃOREGION
Norte / North 10 7 12 12
Centro-Oeste / Center-West 16 4 22 6
Nordeste / Northeast 3 9 17 12
Sudeste / Southeast 6 7 19 12
Sul / South 1 3 18 15
DEPENDÊNCIA ADMINISTRATIVAADMINISTRATIVE JURISDICTION
Pública Municipal / Municipal Public 5 9 17 13
Pública Estadual / State Public 5 6 16 9
Total – Públicas / Total – Public schools 5 7 16 11
Particular / Private 9 6 24 18
SÉRIEGRADE
4a série / 5o ano do Ensino Fundamental4th grade / 5th year of Elementary Education 8 9 22 15
8a série / 9o ano do Ensino Fundamental8th grade / 9th year of Elementary Education 4 6 15 11
2o ano do Ensino Médio2nd year of Secondary Education 4 4 16 10
Fonte: CGI.br/NIC.br, Centro Regional de Estudos para o Desenvolvimento da Sociedade da Informação (Cetic.br), Pesquisa Sobre o Uso das Tecnologias de Informação e Comunicação nas Escolas Brasileiras – TIC Educação 2016.Source: CGI.br/NIC.br, Regional Center for Studies on the Development of the Information Society (Cetic.br), Survey on the Use of Information and Communication Technologies in Brazilian Schools – ICT In Education 2016.
CONTINUA / CONTINUES �

ICT IN EDUCATION SURVEY 2016TABLES OF RESULTS SELECTED INDICATORS TEACHERS298
EN
GLI
SH P
OR
TUG
UÊS E15 PROFESSORES, POR FREQUÊNCIA DE ACESSO À INTERNET PELO TELEFONE CELULAR EM ATIVIDADES
COM OS ALUNOSTEACHERS BY FREQUENCY OF INTERNET ACCESS VIA MOBILE PHONES WITH STUDENTSTOTAL DE PROFESSORES USUÁRIOS DE INTERNETTOTAL NUMBER OF TEACHERS WHO ARE INTERNET USERS
Percentual (%)Percentage (%)
Menos de uma vez por mêsLess than
once a month
Não sabeDoes not know
Não respondeuDid not answer
Não usou a Internet no
celular e para atividades
pedagógicasDid not use the Internet via mobile
phones and for pedagogical
activities
TOTAL 6 0 0 51
SEXOSEX
Feminino / Female 7 1 0 47
Masculino / Male 4 0 0 64
FAIXA ETÁRIAAGE GROUP
Até 30 anosUp to 30 years old 4 0 0 44
De 31 a 45 anos31 to 45 years old 7 0 0 49
De 46 anos ou mais46 years old or older 5 1 0 57
RENDA FAMILIARFAMILY INCOME
Até 3 SMUp to 3 MW 5 0 0 51
Mais de 3 até 5 SM3 MW to 5 MW 7 1 0 50
Mais de 5 SMMore than 5 MW 6 0 0 51
RENDA PESSOALPERSONAL INCOME
Até 3 SMUp to 3 MW 7 0 0 49
Mais de 3 até 5 SM3 MW to 5 MW 6 1 0 51
Mais de 5 SMMore than 5 MW 4 0 0 54
REGIÃOREGION
Norte / North 5 0 0 53
Centro-Oeste / Center-West 5 0 0 47
Nordeste / Northeast 4 0 0 54
Sudeste / Southeast 7 1 0 48
Sul / South 7 0 0 56
DEPENDÊNCIA ADMINISTRATIVAADMINISTRATIVE JURISDICTION
Pública Municipal / Municipal Public 5 0 0 52
Pública Estadual / State Public 8 1 0 55
Total – Públicas / Total – Public schools 7 1 0 54
Particular / Private 4 0 0 39
SÉRIEGRADE
4a série / 5o ano do Ensino Fundamental4th grade / 5th year of Elementary Education 7 0 0 39
8a série / 9o ano do Ensino Fundamental8th grade / 9th year of Elementary Education 7 0 0 58
2o ano do Ensino Médio2nd year of Secondary Education 5 1 0 59
Fonte: CGI.br/NIC.br, Centro Regional de Estudos para o Desenvolvimento da Sociedade da Informação (Cetic.br), Pesquisa Sobre o Uso das Tecnologias de Informação e Comunicação nas Escolas Brasileiras – TIC Educação 2016.Source: CGI.br/NIC.br, Regional Center for Studies on the Development of the Information Society (Cetic.br), Survey on the Use of Information and Communication Technologies in Brazilian Schools – ICT In Education 2016.
� CONCLUSÃO / CONCLUSION

2016 PESQUISA TIC EDUCAÇÃOPROFESSORES INDICADORES SELECIONADOS TABELAS DE RESULTADOS 299
EN
GLI
SH P
OR
TUG
UÊSF2 PROFESSORES, POR PERCEPÇÃO SOBRE BARREIRAS PARA O USO DAS TIC NA ESCOLA
TEACHERS BY PERCEPTIONS OF BARRIERS TO ICT USE IN SCHOOLSTOTAL DE PROFESSORESTOTAL NUMBER OF TEACHERS
Percentual (%)Percentage (%)
Número insuficiente de computadores por alunoInsufficient number of computers per student
Dificulta muito
Strongly hinders
Dificulta um poucoHinders
Não dificulta
nadaDoes not hinder
Nessa escola
isso não aconteceThis does not apply
to this school
Não sabeDoes not
know
Não respondeu
Did not answer
TOTAL 70 16 11 2 1 0
SEXOSEX
Feminino / Female 69 17 11 3 1 0
Masculino / Male 75 14 10 0 1 0
FAIXA ETÁRIAAGE GROUP
Até 30 anosUp to 30 years old 71 15 11 3 0 0
De 31 a 45 anos31 to 45 years old 70 17 10 1 1 0
De 46 anos ou mais46 years old or older 69 14 12 3 1 0
RENDA FAMILIARFAMILY INCOME
Até 3 SMUp to 3 MW 66 23 5 5 1 0
Mais de 3 até 5 SM3 MW to 5 MW 78 12 7 1 1 0
Mais de 5 SMMore than 5 MW 65 16 15 2 1 1
RENDA PESSOALPERSONAL INCOME
Até 3 SMUp to 3 MW 74 16 6 3 1 0
Mais de 3 até 5 SM3 MW to 5 MW 70 17 10 1 1 1
Mais de 5 SMMore than 5 MW 59 16 22 2 0 0
REGIÃOREGION
Norte / North 85 10 2 2 1 0
Centro-Oeste / Center-West 67 18 13 2 0 1
Nordeste / Northeast 84 8 3 3 1 0
Sudeste / Southeast 62 21 14 2 1 0
Sul / South 62 17 18 1 2 0
DEPENDÊNCIA ADMINISTRATIVAADMINISTRATIVE JURISDICTION
Pública Municipal / Municipal Public 73 13 8 4 1 1
Pública Estadual / State Public 80 12 6 1 1 0
Total – Públicas / Total – Public schools 77 13 7 2 1 0
Particular / Private 42 29 26 3 1 0
SÉRIEGRADE
4a série / 5o ano do Ensino Fundamental4th grade / 5th year of Elementary Education 66 20 9 4 1 1
8a série / 9o ano do Ensino Fundamental8th grade / 9th year of Elementary Education 74 11 14 1 1 0
2o ano do Ensino Médio2nd year of Secondary Education 71 16 10 2 2 0
Fonte: CGI.br/NIC.br, Centro Regional de Estudos para o Desenvolvimento da Sociedade da Informação (Cetic.br), Pesquisa Sobre o Uso das Tecnologias de Informação e Comunicação nas Escolas Brasileiras – TIC Educação 2016.Source: CGI.br/NIC.br, Regional Center for Studies on the Development of the Information Society (Cetic.br), Survey on the Use of Information and Communication Technologies in Brazilian Schools – ICT In Education 2016.
CONTINUA / CONTINUES �

ICT IN EDUCATION SURVEY 2016TABLES OF RESULTS SELECTED INDICATORS TEACHERS300
EN
GLI
SH P
OR
TUG
UÊS F2 PROFESSORES, POR PERCEPÇÃO SOBRE BARREIRAS PARA O USO DAS TIC NA ESCOLA
TEACHERS BY PERCEPTIONS OF BARRIERS TO ICT USE IN SCHOOLSTOTAL DE PROFESSORESTOTAL NUMBER OF TEACHERS
Percentual (%)Percentage (%)
Número insuficiente de computadores conectados à InternetInsufficient number of computers connected to the Internet
Dificulta muito
Strongly hinders
Dificulta um poucoHinders
Não dificulta
nadaDoes not hinder
Nessa escola
isso não aconteceThis does not apply
to this school
Não sabeDoes not
know
Não respondeu
Did not answer
TOTAL 69 16 13 2 1 0
SEXOSEX
Feminino / Female 69 16 13 2 0 0
Masculino / Male 70 16 11 2 1 0
FAIXA ETÁRIAAGE GROUP
Até 30 anosUp to 30 years old 74 12 12 1 0 0
De 31 a 45 anos31 to 45 years old 69 15 13 2 1 0
De 46 anos ou mais46 years old or older 67 18 12 3 1 0
RENDA FAMILIARFAMILY INCOME
Até 3 SMUp to 3 MW 66 17 13 4 0 0
Mais de 3 até 5 SM3 MW to 5 MW 74 16 9 1 0 0
Mais de 5 SMMore than 5 MW 66 15 15 2 1 0
RENDA PESSOALPERSONAL INCOME
Até 3 SMUp to 3 MW 70 16 11 3 1 0
Mais de 3 até 5 SM3 MW to 5 MW 72 16 11 1 1 0
Mais de 5 SMMore than 5 MW 61 17 20 2 0 0
REGIÃOREGION
Norte / North 83 11 4 2 0 0
Centro-Oeste / Center-West 70 11 16 2 0 0
Nordeste / Northeast 75 15 7 2 0 0
Sudeste / Southeast 66 17 14 3 0 0
Sul / South 59 15 23 2 2 0
DEPENDÊNCIA ADMINISTRATIVAADMINISTRATIVE JURISDICTION
Pública Municipal / Municipal Public 74 13 10 3 0 0
Pública Estadual / State Public 76 15 8 1 1 0
Total – Públicas / Total – Public schools 75 14 9 2 1 0
Particular / Private 45 22 28 5 0 0
SÉRIEGRADE
4a série / 5o ano do Ensino Fundamental4th grade / 5th year of Elementary Education 66 19 13 3 0 0
8a série / 9o ano do Ensino Fundamental8th grade / 9th year of Elementary Education 72 12 14 2 0 0
2o ano do Ensino Médio2nd year of Secondary Education 70 15 11 2 1 0
Fonte: CGI.br/NIC.br, Centro Regional de Estudos para o Desenvolvimento da Sociedade da Informação (Cetic.br), Pesquisa Sobre o Uso das Tecnologias de Informação e Comunicação nas Escolas Brasileiras – TIC Educação 2016.Source: CGI.br/NIC.br, Regional Center for Studies on the Development of the Information Society (Cetic.br), Survey on the Use of Information and Communication Technologies in Brazilian Schools – ICT In Education 2016.
� CONTINUAÇÃO / CONTINUATION

2016 PESQUISA TIC EDUCAÇÃOPROFESSORES INDICADORES SELECIONADOS TABELAS DE RESULTADOS 301
EN
GLI
SH P
OR
TUG
UÊSF2 PROFESSORES, POR PERCEPÇÃO SOBRE BARREIRAS PARA O USO DAS TIC NA ESCOLA
TEACHERS BY PERCEPTIONS OF BARRIERS TO ICT USE IN SCHOOLSTOTAL DE PROFESSORESTOTAL NUMBER OF TEACHERS
Percentual (%)Percentage (%)
Baixa velocidade de conexão à InternetLow speed of connection to the Internet
Dificulta muito
Strongly hinders
Dificulta um poucoHinders
Não dificulta
nadaDoes not hinder
Nessa escola
isso não aconteceThis does not apply
to this school
Não sabeDoes not
know
Não respondeu
Did not answer
TOTAL 67 19 11 2 1 0
SEXOSEX
Feminino / Female 67 19 11 2 1 0
Masculino / Male 69 18 11 1 1 0
FAIXA ETÁRIAAGE GROUP
Até 30 anosUp to 30 years old 67 18 13 1 1 0
De 31 a 45 anos31 to 45 years old 66 18 12 3 1 0
De 46 anos ou mais46 years old or older 70 20 8 1 1 0
RENDA FAMILIARFAMILY INCOME
Até 3 SMUp to 3 MW 64 23 11 0 2 0
Mais de 3 até 5 SM3 MW to 5 MW 70 18 10 3 0 0
Mais de 5 SMMore than 5 MW 66 19 12 2 1 0
RENDA PESSOALPERSONAL INCOME
Até 3 SMUp to 3 MW 68 19 9 3 1 0
Mais de 3 até 5 SM3 MW to 5 MW 69 18 12 1 0 0
Mais de 5 SMMore than 5 MW 62 22 13 2 1 0
REGIÃOREGION
Norte / North 81 12 4 2 0 0
Centro-Oeste / Center-West 67 17 14 2 1 0
Nordeste / Northeast 76 15 5 3 0 0
Sudeste / Southeast 61 22 14 2 1 0
Sul / South 62 23 13 0 3 0
DEPENDÊNCIA ADMINISTRATIVAADMINISTRATIVE JURISDICTION
Pública Municipal / Municipal Public 71 18 9 1 0 0
Pública Estadual / State Public 72 16 9 1 1 0
Total – Públicas / Total – Public schools 72 17 9 1 1 0
Particular / Private 49 26 17 6 2 0
SÉRIEGRADE
4a série / 5o ano do Ensino Fundamental4th grade / 5th year of Elementary Education 63 21 13 3 0 0
8a série / 9o ano do Ensino Fundamental8th grade / 9th year of Elementary Education 72 19 7 1 1 0
2o ano do Ensino Médio2nd year of Secondary Education 68 16 12 2 1 0
Fonte: CGI.br/NIC.br, Centro Regional de Estudos para o Desenvolvimento da Sociedade da Informação (Cetic.br), Pesquisa Sobre o Uso das Tecnologias de Informação e Comunicação nas Escolas Brasileiras – TIC Educação 2016.Source: CGI.br/NIC.br, Regional Center for Studies on the Development of the Information Society (Cetic.br), Survey on the Use of Information and Communication Technologies in Brazilian Schools – ICT In Education 2016.
� CONTINUAÇÃO / CONTINUATION
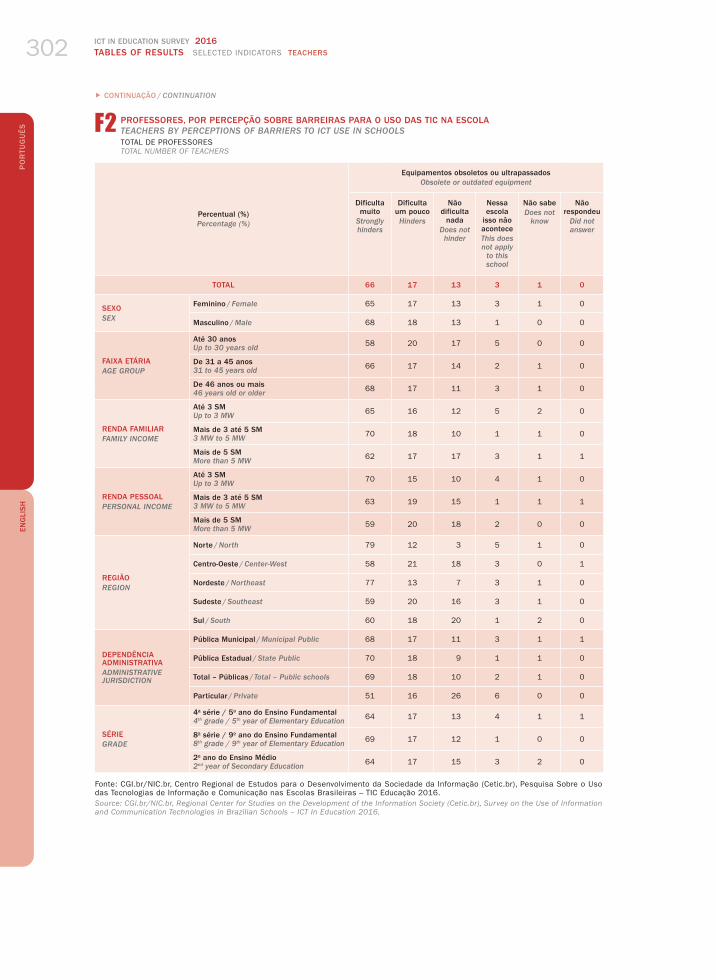
ICT IN EDUCATION SURVEY 2016TABLES OF RESULTS SELECTED INDICATORS TEACHERS302
EN
GLI
SH P
OR
TUG
UÊS F2 PROFESSORES, POR PERCEPÇÃO SOBRE BARREIRAS PARA O USO DAS TIC NA ESCOLA
TEACHERS BY PERCEPTIONS OF BARRIERS TO ICT USE IN SCHOOLSTOTAL DE PROFESSORESTOTAL NUMBER OF TEACHERS
Percentual (%)Percentage (%)
Equipamentos obsoletos ou ultrapassadosObsolete or outdated equipment
Dificulta muito
Strongly hinders
Dificulta um poucoHinders
Não dificulta
nadaDoes not hinder
Nessa escola
isso não aconteceThis does not apply
to this school
Não sabeDoes not
know
Não respondeu
Did not answer
TOTAL 66 17 13 3 1 0
SEXOSEX
Feminino / Female 65 17 13 3 1 0
Masculino / Male 68 18 13 1 0 0
FAIXA ETÁRIAAGE GROUP
Até 30 anosUp to 30 years old 58 20 17 5 0 0
De 31 a 45 anos31 to 45 years old 66 17 14 2 1 0
De 46 anos ou mais46 years old or older 68 17 11 3 1 0
RENDA FAMILIARFAMILY INCOME
Até 3 SMUp to 3 MW 65 16 12 5 2 0
Mais de 3 até 5 SM3 MW to 5 MW 70 18 10 1 1 0
Mais de 5 SMMore than 5 MW 62 17 17 3 1 1
RENDA PESSOALPERSONAL INCOME
Até 3 SMUp to 3 MW 70 15 10 4 1 0
Mais de 3 até 5 SM3 MW to 5 MW 63 19 15 1 1 1
Mais de 5 SMMore than 5 MW 59 20 18 2 0 0
REGIÃOREGION
Norte / North 79 12 3 5 1 0
Centro-Oeste / Center-West 58 21 18 3 0 1
Nordeste / Northeast 77 13 7 3 1 0
Sudeste / Southeast 59 20 16 3 1 0
Sul / South 60 18 20 1 2 0
DEPENDÊNCIA ADMINISTRATIVAADMINISTRATIVE JURISDICTION
Pública Municipal / Municipal Public 68 17 11 3 1 1
Pública Estadual / State Public 70 18 9 1 1 0
Total – Públicas / Total – Public schools 69 18 10 2 1 0
Particular / Private 51 16 26 6 0 0
SÉRIEGRADE
4a série / 5o ano do Ensino Fundamental4th grade / 5th year of Elementary Education 64 17 13 4 1 1
8a série / 9o ano do Ensino Fundamental8th grade / 9th year of Elementary Education 69 17 12 1 0 0
2o ano do Ensino Médio2nd year of Secondary Education 64 17 15 3 2 0
Fonte: CGI.br/NIC.br, Centro Regional de Estudos para o Desenvolvimento da Sociedade da Informação (Cetic.br), Pesquisa Sobre o Uso das Tecnologias de Informação e Comunicação nas Escolas Brasileiras – TIC Educação 2016.Source: CGI.br/NIC.br, Regional Center for Studies on the Development of the Information Society (Cetic.br), Survey on the Use of Information and Communication Technologies in Brazilian Schools – ICT In Education 2016.
� CONTINUAÇÃO / CONTINUATION

2016 PESQUISA TIC EDUCAÇÃOPROFESSORES INDICADORES SELECIONADOS TABELAS DE RESULTADOS 303
EN
GLI
SH P
OR
TUG
UÊSF2 PROFESSORES, POR PERCEPÇÃO SOBRE BARREIRAS PARA O USO DAS TIC NA ESCOLA
TEACHERS BY PERCEPTIONS OF BARRIERS TO ICT USE IN SCHOOLSTOTAL DE PROFESSORESTOTAL NUMBER OF TEACHERS
Percentual (%)Percentage (%)
Ausência de suporte técnico e manutenção dos equipamentosLack of technical support or equipment maintenance
Dificulta muito
Strongly hinders
Dificulta um poucoHinders
Não dificulta
nadaDoes not hinder
Nessa escola
isso não aconteceThis does not apply
to this school
Não sabeDoes not
know
Não respondeu
Did not answer
TOTAL 61 25 11 2 1 0
SEXOSEX
Feminino / Female 62 24 12 2 1 0
Masculino / Male 61 27 7 2 3 0
FAIXA ETÁRIAAGE GROUP
Até 30 anosUp to 30 years old 62 26 10 1 0 0
De 31 a 45 anos31 to 45 years old 61 24 11 3 2 0
De 46 anos ou mais46 years old or older 62 25 11 2 0 0
RENDA FAMILIARFAMILY INCOME
Até 3 SMUp to 3 MW 62 24 10 3 2 0
Mais de 3 até 5 SM3 MW to 5 MW 65 24 8 1 2 0
Mais de 5 SMMore than 5 MW 57 26 13 2 1 0
RENDA PESSOALPERSONAL INCOME
Até 3 SMUp to 3 MW 68 20 9 2 2 0
Mais de 3 até 5 SM3 MW to 5 MW 59 27 12 2 1 0
Mais de 5 SMMore than 5 MW 51 33 14 1 0 0
REGIÃOREGION
Norte / North 74 18 3 3 2 0
Centro-Oeste / Center-West 58 23 16 2 1 0
Nordeste / Northeast 71 21 5 3 0 0
Sudeste / Southeast 57 28 12 2 2 0
Sul / South 53 25 20 0 1 0
DEPENDÊNCIA ADMINISTRATIVAADMINISTRATIVE JURISDICTION
Pública Municipal / Municipal Public 62 23 11 2 2 0
Pública Estadual / State Public 69 21 7 1 1 0
Total – Públicas / Total – Public schools 66 22 8 2 2 0
Particular / Private 43 34 20 4 0 0
SÉRIEGRADE
4a série / 5o ano do Ensino Fundamental4th grade / 5th year of Elementary Education 61 23 12 2 2 0
8a série / 9o ano do Ensino Fundamental8th grade / 9th year of Elementary Education 62 27 9 1 0 0
2o ano do Ensino Médio2nd year of Secondary Education 61 24 11 3 2 0
Fonte: CGI.br/NIC.br, Centro Regional de Estudos para o Desenvolvimento da Sociedade da Informação (Cetic.br), Pesquisa Sobre o Uso das Tecnologias de Informação e Comunicação nas Escolas Brasileiras – TIC Educação 2016.Source: CGI.br/NIC.br, Regional Center for Studies on the Development of the Information Society (Cetic.br), Survey on the Use of Information and Communication Technologies in Brazilian Schools – ICT In Education 2016.
� CONTINUAÇÃO / CONTINUATION

ICT IN EDUCATION SURVEY 2016TABLES OF RESULTS SELECTED INDICATORS TEACHERS304
EN
GLI
SH P
OR
TUG
UÊS F2 PROFESSORES, POR PERCEPÇÃO SOBRE BARREIRAS PARA O USO DAS TIC NA ESCOLA
TEACHERS BY PERCEPTIONS OF BARRIERS TO ICT USE IN SCHOOLSTOTAL DE PROFESSORESTOTAL NUMBER OF TEACHERS
Percentual (%)Percentage (%)
Ausência de curso específico para o uso do computador e da Internet nas aulasLack of specific training for computer
and Internet use in the classroom
Dificulta muito
Strongly hinders
Dificulta um poucoHinders
Não dificulta
nadaDoes not hinder
Nessa escola
isso não aconteceThis does not apply
to this school
Não sabeDoes not
know
Não respondeu
Did not answer
TOTAL 49 28 22 1 0 0
SEXOSEX
Feminino / Female 48 28 23 1 0 0
Masculino / Male 50 27 21 2 0 0
FAIXA ETÁRIAAGE GROUP
Até 30 anosUp to 30 years old 36 26 37 1 0 0
De 31 a 45 anos31 to 45 years old 48 29 22 1 0 0
De 46 anos ou mais46 years old or older 54 27 17 1 0 0
RENDA FAMILIARFAMILY INCOME
Até 3 SMUp to 3 MW 61 27 13 0 0 0
Mais de 3 até 5 SM3 MW to 5 MW 50 28 21 0 0 0
Mais de 5 SMMore than 5 MW 42 28 27 2 0 0
RENDA PESSOALPERSONAL INCOME
Até 3 SMUp to 3 MW 55 25 18 1 0 0
Mais de 3 até 5 SM3 MW to 5 MW 46 29 23 1 0 1
Mais de 5 SMMore than 5 MW 38 32 30 1 0 0
REGIÃOREGION
Norte / North 68 21 10 1 0 0
Centro-Oeste / Center-West 51 25 23 1 0 0
Nordeste / Northeast 59 22 18 1 0 0
Sudeste / Southeast 43 31 25 1 0 0
Sul / South 34 34 31 1 0 0
DEPENDÊNCIA ADMINISTRATIVAADMINISTRATIVE JURISDICTION
Pública Municipal / Municipal Public 51 29 18 1 0 1
Pública Estadual / State Public 54 28 16 1 0 0
Total – Públicas / Total – Public schools 53 28 17 1 0 0
Particular / Private 31 25 43 1 0 0
SÉRIEGRADE
4a série / 5o ano do Ensino Fundamental4th grade / 5th year of Elementary Education 53 24 21 1 0 1
8a série / 9o ano do Ensino Fundamental8th grade / 9th year of Elementary Education 46 29 23 1 0 0
2o ano do Ensino Médio2nd year of Secondary Education 46 30 23 2 0 0
Fonte: CGI.br/NIC.br, Centro Regional de Estudos para o Desenvolvimento da Sociedade da Informação (Cetic.br), Pesquisa Sobre o Uso das Tecnologias de Informação e Comunicação nas Escolas Brasileiras – TIC Educação 2016.Source: CGI.br/NIC.br, Regional Center for Studies on the Development of the Information Society (Cetic.br), Survey on the Use of Information and Communication Technologies in Brazilian Schools – ICT In Education 2016.
� CONTINUAÇÃO / CONTINUATION

2016 PESQUISA TIC EDUCAÇÃOPROFESSORES INDICADORES SELECIONADOS TABELAS DE RESULTADOS 305
EN
GLI
SH P
OR
TUG
UÊSF2 PROFESSORES, POR PERCEPÇÃO SOBRE BARREIRAS PARA O USO DAS TIC NA ESCOLA
TEACHERS BY PERCEPTIONS OF BARRIERS TO ICT USE IN SCHOOLSTOTAL DE PROFESSORESTOTAL NUMBER OF TEACHERS
Percentual (%)Percentage (%)
Pressão ou falta de tempo para cumprir com o conteúdo previstoPressure or lack of time to cover the curricula
Dificulta muito
Strongly hinders
Dificulta um poucoHinders
Não dificulta
nadaDoes not hinder
Nessa escola
isso não aconteceThis does not apply
to this school
Não sabeDoes not
know
Não respondeu
Did not answer
TOTAL 39 35 24 2 0 0
SEXOSEX
Feminino / Female 38 35 25 2 0 0
Masculino / Male 43 35 20 2 0 0
FAIXA ETÁRIAAGE GROUP
Até 30 anosUp to 30 years old 35 38 27 1 0 0
De 31 a 45 anos31 to 45 years old 40 35 22 2 0 0
De 46 anos ou mais46 years old or older 39 33 25 2 0 0
RENDA FAMILIARFAMILY INCOME
Até 3 SMUp to 3 MW 44 36 19 1 0 0
Mais de 3 até 5 SM3 MW to 5 MW 39 34 26 1 0 0
Mais de 5 SMMore than 5 MW 38 36 24 2 0 0
RENDA PESSOALPERSONAL INCOME
Até 3 SMUp to 3 MW 41 34 23 2 0 0
Mais de 3 até 5 SM3 MW to 5 MW 40 34 23 2 0 1
Mais de 5 SMMore than 5 MW 34 40 25 2 0 0
REGIÃOREGION
Norte / North 43 36 18 2 0 0
Centro-Oeste / Center-West 41 30 26 2 0 0
Nordeste / Northeast 38 33 26 3 0 0
Sudeste / Southeast 40 37 21 1 0 0
Sul / South 34 32 33 2 0 0
DEPENDÊNCIA ADMINISTRATIVAADMINISTRATIVE JURISDICTION
Pública Municipal / Municipal Public 39 35 23 2 0 1
Pública Estadual / State Public 44 32 22 2 0 0
Total – Públicas / Total – Public schools 42 33 23 2 0 0
Particular / Private 30 41 27 2 0 0
SÉRIEGRADE
4a série / 5o ano do Ensino Fundamental4th grade / 5th year of Elementary Education 32 39 26 2 0 1
8a série / 9o ano do Ensino Fundamental8th grade / 9th year of Elementary Education 44 34 20 1 0 0
2o ano do Ensino Médio2nd year of Secondary Education 43 31 23 2 0 0
Fonte: CGI.br/NIC.br, Centro Regional de Estudos para o Desenvolvimento da Sociedade da Informação (Cetic.br), Pesquisa Sobre o Uso das Tecnologias de Informação e Comunicação nas Escolas Brasileiras – TIC Educação 2016.Source: CGI.br/NIC.br, Regional Center for Studies on the Development of the Information Society (Cetic.br), Survey on the Use of Information and Communication Technologies in Brazilian Schools – ICT In Education 2016.
� CONTINUAÇÃO / CONTINUATION

ICT IN EDUCATION SURVEY 2016TABLES OF RESULTS SELECTED INDICATORS TEACHERS306
EN
GLI
SH P
OR
TUG
UÊS F2 PROFESSORES, POR PERCEPÇÃO SOBRE BARREIRAS PARA O USO DAS TIC NA ESCOLA
TEACHERS BY PERCEPTIONS OF BARRIERS TO ICT USE IN SCHOOLSTOTAL DE PROFESSORESTOTAL NUMBER OF TEACHERS
Percentual (%)Percentage (%)
Falta de apoio pedagógico aos professores para o uso do computador e da InternetLack of pedagogical support for teachers
to use computers and the Internet
Dificulta muito
Strongly hinders
Dificulta um poucoHinders
Não dificulta
nadaDoes not hinder
Nessa escola
isso não aconteceThis does not apply
to this school
Não sabeDoes not
know
Não respondeu
Did not answer
TOTAL 36 27 34 3 0 0
SEXOSEX
Feminino / Female 35 26 36 3 0 0
Masculino / Male 41 28 28 3 1 0
FAIXA ETÁRIAAGE GROUP
Até 30 anosUp to 30 years old 30 31 37 2 0 0
De 31 a 45 anos31 to 45 years old 37 28 32 3 0 0
De 46 anos ou mais46 years old or older 38 22 36 4 1 0
RENDA FAMILIARFAMILY INCOME
Até 3 SMUp to 3 MW 29 34 35 1 0 0
Mais de 3 até 5 SM3 MW to 5 MW 45 28 25 2 0 0
Mais de 5 SMMore than 5 MW 32 23 41 4 1 0
RENDA PESSOALPERSONAL INCOME
Até 3 SMUp to 3 MW 42 29 27 2 1 0
Mais de 3 até 5 SM3 MW to 5 MW 35 25 35 4 0 0
Mais de 5 SMMore than 5 MW 25 25 48 3 0 0
REGIÃOREGION
Norte / North 48 32 17 3 0 0
Centro-Oeste / Center-West 33 25 37 4 0 0
Nordeste / Northeast 53 28 17 2 0 0
Sudeste / Southeast 26 27 44 3 0 0
Sul / South 34 18 43 3 2 0
DEPENDÊNCIA ADMINISTRATIVAADMINISTRATIVE JURISDICTION
Pública Municipal / Municipal Public 39 25 33 3 0 0
Pública Estadual / State Public 42 27 27 3 1 0
Total – Públicas / Total – Public schools 41 26 30 3 1 0
Particular / Private 20 27 49 4 0 0
SÉRIEGRADE
4a série / 5o ano do Ensino Fundamental4th grade / 5th year of Elementary Education 36 26 36 3 0 0
8a série / 9o ano do Ensino Fundamental8th grade / 9th year of Elementary Education 37 26 35 2 0 0
2o ano do Ensino Médio2nd year of Secondary Education 37 27 31 4 1 0
Fonte: CGI.br/NIC.br, Centro Regional de Estudos para o Desenvolvimento da Sociedade da Informação (Cetic.br), Pesquisa Sobre o Uso das Tecnologias de Informação e Comunicação nas Escolas Brasileiras – TIC Educação 2016.Source: CGI.br/NIC.br, Regional Center for Studies on the Development of the Information Society (Cetic.br), Survey on the Use of Information and Communication Technologies in Brazilian Schools – ICT In Education 2016.
� CONTINUAÇÃO / CONTINUATION

2016 PESQUISA TIC EDUCAÇÃOPROFESSORES INDICADORES SELECIONADOS TABELAS DE RESULTADOS 307
EN
GLI
SH P
OR
TUG
UÊSF2 PROFESSORES, POR PERCEPÇÃO SOBRE BARREIRAS PARA O USO DAS TIC NA ESCOLA
TEACHERS BY PERCEPTIONS OF BARRIERS TO ICT USE IN SCHOOLSTOTAL DE PROFESSORESTOTAL NUMBER OF TEACHERS
Percentual (%)Percentage (%)
Pressão para conseguir boas notas nas avaliações de desempenhoPressure to achieve good performance appraisals
Dificulta muito
Strongly hinders
Dificulta um poucoHinders
Não dificulta
nadaDoes not hinder
Nessa escola
isso não aconteceThis does not apply
to this school
Não sabeDoes not
know
Não respondeu
Did not answer
TOTAL 29 36 32 2 0 0
SEXOSEX
Feminino / Female 28 36 33 3 0 0
Masculino / Male 36 34 29 1 0 0
FAIXA ETÁRIAAGE GROUP
Até 30 anosUp to 30 years old 25 34 39 1 1 0
De 31 a 45 anos31 to 45 years old 27 40 30 2 0 0
De 46 anos ou mais46 years old or older 35 29 32 3 1 0
RENDA FAMILIARFAMILY INCOME
Até 3 SMUp to 3 MW 23 51 25 1 0 0
Mais de 3 até 5 SM3 MW to 5 MW 32 36 30 2 0 0
Mais de 5 SMMore than 5 MW 29 31 36 3 0 1
RENDA PESSOALPERSONAL INCOME
Até 3 SMUp to 3 MW 31 43 24 2 0 0
Mais de 3 até 5 SM3 MW to 5 MW 30 33 34 3 1 1
Mais de 5 SMMore than 5 MW 25 25 47 2 0 0
REGIÃOREGION
Norte / North 40 34 22 4 0 0
Centro-Oeste / Center-West 36 27 35 2 0 0
Nordeste / Northeast 32 43 23 3 0 0
Sudeste / Southeast 27 35 35 2 0 0
Sul / South 24 28 47 1 0 0
DEPENDÊNCIA ADMINISTRATIVAADMINISTRATIVE JURISDICTION
Pública Municipal / Municipal Public 31 33 33 2 0 1
Pública Estadual / State Public 36 32 29 2 1 0
Total – Públicas / Total – Public schools 34 33 31 2 0 0
Particular / Private 12 49 37 3 0 0
SÉRIEGRADE
4a série / 5o ano do Ensino Fundamental4th grade / 5th year of Elementary Education 25 41 30 2 0 1
8a série / 9o ano do Ensino Fundamental8th grade / 9th year of Elementary Education 31 30 37 2 0 0
2o ano do Ensino Médio2nd year of Secondary Education 33 34 30 3 1 0
Fonte: CGI.br/NIC.br, Centro Regional de Estudos para o Desenvolvimento da Sociedade da Informação (Cetic.br), Pesquisa Sobre o Uso das Tecnologias de Informação e Comunicação nas Escolas Brasileiras – TIC Educação 2016.Source: CGI.br/NIC.br, Regional Center for Studies on the Development of the Information Society (Cetic.br), Survey on the Use of Information and Communication Technologies in Brazilian Schools – ICT In Education 2016.
� CONCLUSÃO / CONCLUSION

ICT IN EDUCATION SURVEY 2016TABLES OF RESULTS SELECTED INDICATORS TEACHERS308
EN
GLI
SH P
OR
TUG
UÊS F3 PROFESSORES, POR PERCEPÇÃO SOBRE POSSÍVEIS IMPACTOS DAS TIC EM PRÁTICAS PEDAGÓGICAS
TEACHERS BY PERCEPTIONS OF POSSIBLE IMPACTS OF ICT ON PEDAGOGICAL PRACTICESTOTAL DE PROFESSORESTOTAL NUMBER OF TEACHERS
Percentual (%)Percentage (%)
Passou a ter acesso a materiais mais diversificados
ou de melhor qualidadeGained access to more diverse
or better-quality materials
Passou a adotar novos métodos de ensino
Started using new teaching techniques
ConcordaAgrees
Não concorda
nem discordaNeither agrees
nor disagrees
DiscordaDisagrees
ConcordaAgrees
Não concorda
nem discordaNeither agrees
nor disagrees
DiscordaDisagrees
TOTAL 94 3 3 85 8 6
SEXOSEX
Feminino / Female 94 4 2 86 8 6
Masculino / Male 93 2 5 84 10 6
FAIXA ETÁRIAAGE GROUP
Até 30 anosUp to 30 years old 97 2 1 96 2 2
De 31 a 45 anos31 to 45 years old 96 2 1 86 8 5
De 46 anos ou mais46 years old or older 87 6 6 79 11 10
RENDA FAMILIARFAMILY INCOME
Até 3 SMUp to 3 MW 97 2 1 91 5 3
Mais de 3 até 5 SM3 MW to 5 MW 92 2 5 84 7 8
Mais de 5 SMMore than 5 MW 94 4 2 84 11 6
RENDA PESSOALPERSONAL INCOME
Até 3 SMUp to 3 MW 94 3 4 88 5 7
Mais de 3 até 5 SM3 MW to 5 MW 93 4 3 82 11 7
Mais de 5 SMMore than 5 MW 96 3 2 84 11 4
REGIÃOREGION
Norte / North 94 3 3 89 5 5
Centro-Oeste / Center-West 95 1 4 92 3 5
Nordeste / Northeast 95 2 3 89 4 6
Sudeste / Southeast 92 4 3 82 12 6
Sul / South 96 3 2 84 8 9
DEPENDÊNCIA ADMINISTRATIVAADMINISTRATIVE JURISDICTION
Pública Municipal / Municipal Public 95 3 2 88 9 3
Pública Estadual / State Public 91 5 4 82 9 8
Total – Públicas / Total – Public schools 93 4 3 85 9 6
Particular / Private 97 1 2 88 5 8
SÉRIEGRADE
4a série / 5o ano do Ensino Fundamental4th grade / 5th year of Elementary Education 97 2 1 91 4 5
8a série / 9o ano do Ensino Fundamental8th grade / 9th year of Elementary Education 94 3 2 85 10 5
2o ano do Ensino Médio2nd year of Secondary Education 90 4 5 79 12 9
Fonte: CGI.br/NIC.br, Centro Regional de Estudos para o Desenvolvimento da Sociedade da Informação (Cetic.br), Pesquisa Sobre o Uso das Tecnologias de Informação e Comunicação nas Escolas Brasileiras – TIC Educação 2016.Source: CGI.br/NIC.br, Regional Center for Studies on the Development of the Information Society (Cetic.br), Survey on the Use of Information and Communication Technologies in Brazilian Schools – ICT In Education 2016.
CONTINUA / CONTINUES �

2016 PESQUISA TIC EDUCAÇÃOPROFESSORES INDICADORES SELECIONADOS TABELAS DE RESULTADOS 309
EN
GLI
SH P
OR
TUG
UÊSF3 PROFESSORES, POR PERCEPÇÃO SOBRE POSSÍVEIS IMPACTOS DAS TIC EM PRÁTICAS PEDAGÓGICAS
TEACHERS BY PERCEPTIONS OF POSSIBLE IMPACTS OF ICT ON PEDAGOGICAL PRACTICESTOTAL DE PROFESSORESTOTAL NUMBER OF TEACHERS
Percentual (%)Percentage (%)
Passou a cumprir suas tarefas administrativas com maior facilidade
Carried out administrative tasks more easily
Passou a colaborar mais com outros colegas da escola
Started collaborating more with colleagues
in the school
ConcordaAgrees
Não concorda
nem discordaNeither agrees
nor disagrees
DiscordaDisagrees
ConcordaAgrees
Não concorda
nem discordaNeither agrees
nor disagrees
DiscordaDisagrees
TOTAL 82 8 10 79 11 10
SEXOSEX
Feminino / Female 83 8 9 81 9 9
Masculino / Male 80 6 13 73 15 12
FAIXA ETÁRIAAGE GROUP
Até 30 anosUp to 30 years old 88 9 3 72 18 10
De 31 a 45 anos31 to 45 years old 83 7 10 83 9 8
De 46 anos ou mais46 years old or older 79 8 13 76 11 13
RENDA FAMILIARFAMILY INCOME
Até 3 SMUp to 3 MW 93 5 3 87 9 4
Mais de 3 até 5 SM3 MW to 5 MW 79 8 13 77 9 13
Mais de 5 SMMore than 5 MW 81 8 10 77 13 10
RENDA PESSOALPERSONAL INCOME
Até 3 SMUp to 3 MW 85 6 9 82 9 9
Mais de 3 até 5 SM3 MW to 5 MW 79 11 9 75 13 11
Mais de 5 SMMore than 5 MW 84 5 11 80 10 10
REGIÃOREGION
Norte / North 76 11 13 83 7 10
Centro-Oeste / Center-West 94 2 4 84 9 7
Nordeste / Northeast 84 4 12 82 7 11
Sudeste / Southeast 82 10 8 78 14 8
Sul / South 82 6 12 73 11 16
DEPENDÊNCIA ADMINISTRATIVAADMINISTRATIVE JURISDICTION
Pública Municipal / Municipal Public 88 6 6 87 8 6
Pública Estadual / State Public 77 10 13 72 14 13
Total – Públicas / Total – Public schools 82 8 10 79 11 10
Particular / Private 85 6 9 81 7 10
SÉRIEGRADE
4a série / 5o ano do Ensino Fundamental4th grade / 5th year of Elementary Education 88 5 7 87 6 7
8a série / 9o ano do Ensino Fundamental8th grade / 9th year of Elementary Education 82 8 9 81 11 9
2o ano do Ensino Médio2nd year of Secondary Education 75 10 14 68 16 14
Fonte: CGI.br/NIC.br, Centro Regional de Estudos para o Desenvolvimento da Sociedade da Informação (Cetic.br), Pesquisa Sobre o Uso das Tecnologias de Informação e Comunicação nas Escolas Brasileiras – TIC Educação 2016.Source: CGI.br/NIC.br, Regional Center for Studies on the Development of the Information Society (Cetic.br), Survey on the Use of Information and Communication Technologies in Brazilian Schools – ICT In Education 2016.
� CONTINUAÇÃO / CONTINUATION

ICT IN EDUCATION SURVEY 2016TABLES OF RESULTS SELECTED INDICATORS TEACHERS310
EN
GLI
SH P
OR
TUG
UÊS F3 PROFESSORES, POR PERCEPÇÃO SOBRE POSSÍVEIS IMPACTOS DAS TIC EM PRÁTICAS PEDAGÓGICAS
TEACHERS BY PERCEPTIONS OF POSSIBLE IMPACTS OF ICT ON PEDAGOGICAL PRACTICESTOTAL DE PROFESSORESTOTAL NUMBER OF TEACHERS
Percentual (%)Percentage (%)
Passou a se comunicar com os alunos com maior facilidade
Communicated with students more easily
Passou a fazer avaliações mais individualizadas dos alunos
Enabled customizing students’ assessments
ConcordaAgrees
Não concorda
nem discordaNeither agrees
nor disagrees
DiscordaDisagrees
ConcordaAgrees
Não concorda
nem discordaNeither agrees
nor disagrees
DiscordaDisagrees
TOTAL 77 10 13 75 8 16
SEXOSEX
Feminino / Female 78 9 12 76 9 15
Masculino / Male 71 12 17 71 8 21
FAIXA ETÁRIAAGE GROUP
Até 30 anosUp to 30 years old 83 10 7 77 11 12
De 31 a 45 anos31 to 45 years old 78 8 14 78 6 16
De 46 anos ou mais46 years old or older 72 13 14 70 11 18
RENDA FAMILIARFAMILY INCOME
Até 3 SMUp to 3 MW 86 9 5 85 5 10
Mais de 3 até 5 SM3 MW to 5 MW 75 10 15 72 8 20
Mais de 5 SMMore than 5 MW 74 11 15 74 9 16
RENDA PESSOALPERSONAL INCOME
Até 3 SMUp to 3 MW 82 7 11 81 5 14
Mais de 3 até 5 SM3 MW to 5 MW 70 13 17 69 11 19
Mais de 5 SMMore than 5 MW 77 12 11 73 10 18
REGIÃOREGION
Norte / North 82 6 12 74 8 18
Centro-Oeste / Center-West 80 8 12 80 8 13
Nordeste / Northeast 78 7 15 79 6 14
Sudeste / Southeast 75 14 11 76 9 15
Sul / South 75 7 17 62 11 26
DEPENDÊNCIA ADMINISTRATIVAADMINISTRATIVE JURISDICTION
Pública Municipal / Municipal Public 81 9 9 80 8 12
Pública Estadual / State Public 70 13 17 72 10 18
Total – Públicas / Total – Public schools 75 11 14 75 9 15
Particular / Private 84 5 11 75 5 19
SÉRIEGRADE
4a série / 5o ano do Ensino Fundamental4th grade / 5th year of Elementary Education 84 7 10 82 6 12
8a série / 9o ano do Ensino Fundamental8th grade / 9th year of Elementary Education 76 12 12 74 8 18
2o ano do Ensino Médio2nd year of Secondary Education 69 12 19 68 11 19
Fonte: CGI.br/NIC.br, Centro Regional de Estudos para o Desenvolvimento da Sociedade da Informação (Cetic.br), Pesquisa Sobre o Uso das Tecnologias de Informação e Comunicação nas Escolas Brasileiras – TIC Educação 2016.Source: CGI.br/NIC.br, Regional Center for Studies on the Development of the Information Society (Cetic.br), Survey on the Use of Information and Communication Technologies in Brazilian Schools – ICT In Education 2016.
� CONTINUAÇÃO / CONTINUATION

2016 PESQUISA TIC EDUCAÇÃOPROFESSORES INDICADORES SELECIONADOS TABELAS DE RESULTADOS 311
EN
GLI
SH P
OR
TUG
UÊSF3 PROFESSORES, POR PERCEPÇÃO SOBRE POSSÍVEIS IMPACTOS DAS TIC EM PRÁTICAS PEDAGÓGICAS
TEACHERS BY PERCEPTIONS OF POSSIBLE IMPACTS OF ICT ON PEDAGOGICAL PRACTICESTOTAL DE PROFESSORESTOTAL NUMBER OF TEACHERS
Percentual (%)Percentage (%)
Passou a ter contato com professores e com
especialistas de outras escolasBegan communicating
with teachers and experts from other schools
Passou a ter menos trabalhoThe workload has decreased
ConcordaAgrees
Não concorda
nem discordaNeither agrees
nor disagrees
DiscordaDisagrees
ConcordaAgrees
Não concorda
nem discordaNeither agrees
nor disagrees
DiscordaDisagrees
TOTAL 67 10 23 55 12 33
SEXOSEX
Feminino / Female 67 9 23 54 13 34
Masculino / Male 66 10 24 59 12 30
FAIXA ETÁRIAAGE GROUP
Até 30 anosUp to 30 years old 63 13 24 54 17 28
De 31 a 45 anos31 to 45 years old 69 8 23 54 11 35
De 46 anos ou mais46 years old or older 64 11 25 56 12 31
RENDA FAMILIARFAMILY INCOME
Até 3 SMUp to 3 MW 69 11 20 68 12 21
Mais de 3 até 5 SM3 MW to 5 MW 66 7 27 53 11 35
Mais de 5 SMMore than 5 MW 67 11 22 51 14 35
RENDA PESSOALPERSONAL INCOME
Até 3 SMUp to 3 MW 65 9 25 61 11 28
Mais de 3 até 5 SM3 MW to 5 MW 65 10 24 47 13 40
Mais de 5 SMMore than 5 MW 75 9 17 55 14 30
REGIÃOREGION
Norte / North 67 9 24 54 10 36
Centro-Oeste / Center-West 60 9 31 59 17 24
Nordeste / Northeast 64 10 26 60 11 28
Sudeste / Southeast 70 10 20 54 13 33
Sul / South 63 8 28 46 11 43
DEPENDÊNCIA ADMINISTRATIVAADMINISTRATIVE JURISDICTION
Pública Municipal / Municipal Public 72 10 18 64 10 26
Pública Estadual / State Public 62 9 28 47 15 38
Total – Públicas / Total – Public schools 66 10 24 54 13 33
Particular / Private 69 9 22 57 11 32
SÉRIEGRADE
4a série / 5o ano do Ensino Fundamental4th grade / 5th year of Elementary Education 72 8 20 68 9 24
8a série / 9o ano do Ensino Fundamental8th grade / 9th year of Elementary Education 67 11 22 50 15 35
2o ano do Ensino Médio2nd year of Secondary Education 60 10 29 44 14 42
Fonte: CGI.br/NIC.br, Centro Regional de Estudos para o Desenvolvimento da Sociedade da Informação (Cetic.br), Pesquisa Sobre o Uso das Tecnologias de Informação e Comunicação nas Escolas Brasileiras – TIC Educação 2016.Source: CGI.br/NIC.br, Regional Center for Studies on the Development of the Information Society (Cetic.br), Survey on the Use of Information and Communication Technologies in Brazilian Schools – ICT In Education 2016.
� CONCLUSÃO / CONCLUSION

ICT IN EDUCATION SURVEY 2016TABLES OF RESULTS SELECTED INDICATORS TEACHERS312
EN
GLI
SH P
OR
TUG
UÊS F4 PROFESSORES, POR PERCEPÇÃO SOBRE O USO DAS TIC NA ESCOLA
TEACHERS BY PERCEPTIONS OF ICT USE IN SCHOOLTOTAL DE PROFESSORESTOTAL NUMBER OF TEACHERS
Percentual (%)Percentage (%)
A direção ou coordenação pedagógica desta escola incentiva os professores a usarem a Internet nas atividades pedagógicasThe school administration or coordination of studies department encourages teachers to use the Internet in pedagogical activities
ConcordaAgrees
Não concorda nem discordaNeither agrees nor disagrees
DiscordaDisagrees
Não sabeDoes not know
TOTAL 71 13 15 0
SEXOSEX
Feminino / Female 72 13 15 0
Masculino / Male 68 14 18 0
FAIXA ETÁRIAAGE GROUP
Até 30 anosUp to 30 years old 70 17 12 1
De 31 a 45 anos31 to 45 years old 73 11 16 0
De 46 anos ou mais46 years old or older 69 14 15 0
RENDA FAMILIARFAMILY INCOME
Até 3 SMUp to 3 MW 73 6 21 0
Mais de 3 até 5 SM3 MW to 5 MW 69 18 13 0
Mais de 5 SMMore than 5 MW 73 12 15 0
RENDA PESSOALPERSONAL INCOME
Até 3 SMUp to 3 MW 69 14 16 0
Mais de 3 até 5 SM3 MW to 5 MW 75 11 13 0
Mais de 5 SMMore than 5 MW 69 14 16 0
REGIÃOREGION
Norte / North 68 14 18 0
Centro-Oeste / Center-West 86 8 6 0
Nordeste / Northeast 71 10 19 0
Sudeste / Southeast 69 16 15 0
Sul / South 74 10 14 1
DEPENDÊNCIA ADMINISTRATIVAADMINISTRATIVE JURISDICTION
Pública Municipal / Municipal Public 68 13 19 0
Pública Estadual / State Public 72 13 14 0
Total – Públicas / Total – Public schools 70 13 16 0
Particular / Private 76 11 13 0
SÉRIEGRADE
4a série / 5o ano do Ensino Fundamental4th grade / 5th year of Elementary Education 75 11 14 0
8a série / 9o ano do Ensino Fundamental8th grade / 9th year of Elementary Education 68 13 18 1
2o ano do Ensino Médio2nd year of Secondary Education 70 15 14 0
Fonte: CGI.br/NIC.br, Centro Regional de Estudos para o Desenvolvimento da Sociedade da Informação (Cetic.br), Pesquisa Sobre o Uso das Tecnologias de Informação e Comunicação nas Escolas Brasileiras – TIC Educação 2016.Source: CGI.br/NIC.br, Regional Center for Studies on the Development of the Information Society (Cetic.br), Survey on the Use of Information and Communication Technologies in Brazilian Schools – ICT In Education 2016.
CONTINUA / CONTINUES �

2016 PESQUISA TIC EDUCAÇÃOPROFESSORES INDICADORES SELECIONADOS TABELAS DE RESULTADOS 313
EN
GLI
SH P
OR
TUG
UÊSF4 PROFESSORES, POR PERCEPÇÃO SOBRE O USO DAS TIC NA ESCOLA
TEACHERS BY PERCEPTIONS OF ICT USE IN SCHOOLTOTAL DE PROFESSORESTOTAL NUMBER OF TEACHERS
Percentual (%)Percentage (%)
A direção ou coordenação pedagógica desta escola incentiva os professores a usarem a Internet nas atividades administrativas
The school administration or coordination of studies department encourages teachers to use the Internet in administrative activities
ConcordaAgrees
Não concorda nem discordaNeither agrees nor disagrees
DiscordaDisagrees
Não sabeDoes not know
TOTAL 69 13 17 1
SEXOSEX
Feminino / Female 69 14 17 1
Masculino / Male 69 12 19 0
FAIXA ETÁRIAAGE GROUP
Até 30 anosUp to 30 years old 72 14 13 1
De 31 a 45 anos31 to 45 years old 68 14 17 1
De 46 anos ou mais46 years old or older 70 11 19 0
RENDA FAMILIARFAMILY INCOME
Até 3 SMUp to 3 MW 68 11 21 0
Mais de 3 até 5 SM3 MW to 5 MW 64 17 18 0
Mais de 5 SMMore than 5 MW 73 11 15 1
RENDA PESSOALPERSONAL INCOME
Até 3 SMUp to 3 MW 64 17 19 1
Mais de 3 até 5 SM3 MW to 5 MW 70 11 18 0
Mais de 5 SMMore than 5 MW 78 10 12 0
REGIÃOREGION
Norte / North 61 13 25 0
Centro-Oeste / Center-West 86 6 7 1
Nordeste / Northeast 66 12 21 0
Sudeste / Southeast 70 15 14 1
Sul / South 68 11 21 1
DEPENDÊNCIA ADMINISTRATIVAADMINISTRATIVE JURISDICTION
Pública Municipal / Municipal Public 68 12 20 0
Pública Estadual / State Public 70 13 17 1
Total – Públicas / Total – Public schools 69 13 18 1
Particular / Private 69 15 16 0
SÉRIEGRADE
4a série / 5o ano do Ensino Fundamental4th grade / 5th year of Elementary Education 67 15 17 0
8a série / 9o ano do Ensino Fundamental8th grade / 9th year of Elementary Education 73 9 17 0
2o ano do Ensino Médio2nd year of Secondary Education 67 14 18 1
Fonte: CGI.br/NIC.br, Centro Regional de Estudos para o Desenvolvimento da Sociedade da Informação (Cetic.br), Pesquisa Sobre o Uso das Tecnologias de Informação e Comunicação nas Escolas Brasileiras – TIC Educação 2016.Source: CGI.br/NIC.br, Regional Center for Studies on the Development of the Information Society (Cetic.br), Survey on the Use of Information and Communication Technologies in Brazilian Schools – ICT In Education 2016.
� CONTINUAÇÃO / CONTINUATION

ICT IN EDUCATION SURVEY 2016TABLES OF RESULTS SELECTED INDICATORS TEACHERS314
EN
GLI
SH P
OR
TUG
UÊS F4 PROFESSORES, POR PERCEPÇÃO SOBRE O USO DAS TIC NA ESCOLA
TEACHERS BY PERCEPTIONS OF ICT USE IN SCHOOLTOTAL DE PROFESSORESTOTAL NUMBER OF TEACHERS
Percentual (%)Percentage (%)
O projeto político pedagógico desta escola orienta que a Internet seja usada em atividades com os alunos
The school’s politico-pedagogical project instructs teachers to use the Internet in activities with students
ConcordaAgrees
Não concorda nem discordaNeither agrees nor disagrees
DiscordaDisagrees
Não sabeDoes not know
TOTAL 64 10 23 2
SEXOSEX
Feminino / Female 66 10 22 2
Masculino / Male 58 14 27 2
FAIXA ETÁRIAAGE GROUP
Até 30 anosUp to 30 years old 60 20 16 3
De 31 a 45 anos31 to 45 years old 61 10 26 3
De 46 anos ou mais46 years old or older 69 9 21 1
RENDA FAMILIARFAMILY INCOME
Até 3 SMUp to 3 MW 54 11 33 3
Mais de 3 até 5 SM3 MW to 5 MW 67 10 21 2
Mais de 5 SMMore than 5 MW 66 10 22 2
RENDA PESSOALPERSONAL INCOME
Até 3 SMUp to 3 MW 61 10 26 2
Mais de 3 até 5 SM3 MW to 5 MW 68 11 20 1
Mais de 5 SMMore than 5 MW 63 9 25 3
REGIÃOREGION
Norte / North 59 10 29 2
Centro-Oeste / Center-West 75 11 11 3
Nordeste / Northeast 53 9 35 3
Sudeste / Southeast 68 12 19 2
Sul / South 69 8 18 4
DEPENDÊNCIA ADMINISTRATIVAADMINISTRATIVE JURISDICTION
Pública Municipal / Municipal Public 58 10 30 2
Pública Estadual / State Public 66 13 18 2
Total – Públicas / Total – Public schools 63 12 24 2
Particular / Private 69 6 23 3
SÉRIEGRADE
4a série / 5o ano do Ensino Fundamental4th grade / 5th year of Elementary Education 65 7 26 2
8a série / 9o ano do Ensino Fundamental8th grade / 9th year of Elementary Education 59 10 28 3
2o ano do Ensino Médio2nd year of Secondary Education 67 14 16 2
Fonte: CGI.br/NIC.br, Centro Regional de Estudos para o Desenvolvimento da Sociedade da Informação (Cetic.br), Pesquisa Sobre o Uso das Tecnologias de Informação e Comunicação nas Escolas Brasileiras – TIC Educação 2016.Source: CGI.br/NIC.br, Regional Center for Studies on the Development of the Information Society (Cetic.br), Survey on the Use of Information and Communication Technologies in Brazilian Schools – ICT In Education 2016.
� CONTINUAÇÃO / CONTINUATION

2016 PESQUISA TIC EDUCAÇÃOPROFESSORES INDICADORES SELECIONADOS TABELAS DE RESULTADOS 315
EN
GLI
SH P
OR
TUG
UÊSF4 PROFESSORES, POR PERCEPÇÃO SOBRE O USO DAS TIC NA ESCOLA
TEACHERS BY PERCEPTIONS OF ICT USE IN SCHOOLTOTAL DE PROFESSORESTOTAL NUMBER OF TEACHERS
Percentual (%)Percentage (%)
Esta escola oferece acesso à Internet aos alunosThis school provides Internet access to students
ConcordaAgrees
Não concorda nem discordaNeither agrees nor disagrees
DiscordaDisagrees
Não sabeDoes not know
TOTAL 50 9 40 1
SEXOSEX
Feminino / Female 51 10 39 1
Masculino / Male 46 9 43 2
FAIXA ETÁRIAAGE GROUP
Até 30 anosUp to 30 years old 54 8 38 1
De 31 a 45 anos31 to 45 years old 47 11 41 1
De 46 anos ou mais46 years old or older 52 8 37 3
RENDA FAMILIARFAMILY INCOME
Até 3 SMUp to 3 MW 38 10 48 3
Mais de 3 até 5 SM3 MW to 5 MW 48 11 40 1
Mais de 5 SMMore than 5 MW 55 8 36 1
RENDA PESSOALPERSONAL INCOME
Até 3 SMUp to 3 MW 44 10 44 2
Mais de 3 até 5 SM3 MW to 5 MW 52 9 39 1
Mais de 5 SMMore than 5 MW 59 9 31 1
REGIÃOREGION
Norte / North 32 15 52 1
Centro-Oeste / Center-West 51 7 40 1
Nordeste / Northeast 32 12 53 2
Sudeste / Southeast 60 8 32 1
Sul / South 58 8 32 1
DEPENDÊNCIA ADMINISTRATIVAADMINISTRATIVE JURISDICTION
Pública Municipal / Municipal Public 44 7 48 1
Pública Estadual / State Public 49 10 39 1
Total – Públicas / Total – Public schools 47 9 43 1
Particular / Private 60 12 26 2
SÉRIEGRADE
4a série / 5o ano do Ensino Fundamental4th grade / 5th year of Elementary Education 46 9 43 2
8a série / 9o ano do Ensino Fundamental8th grade / 9th year of Elementary Education 50 10 41 0
2o ano do Ensino Médio2nd year of Secondary Education 53 10 35 2
Fonte: CGI.br/NIC.br, Centro Regional de Estudos para o Desenvolvimento da Sociedade da Informação (Cetic.br), Pesquisa Sobre o Uso das Tecnologias de Informação e Comunicação nas Escolas Brasileiras – TIC Educação 2016.Source: CGI.br/NIC.br, Regional Center for Studies on the Development of the Information Society (Cetic.br), Survey on the Use of Information and Communication Technologies in Brazilian Schools – ICT In Education 2016.
� CONTINUAÇÃO / CONTINUATION
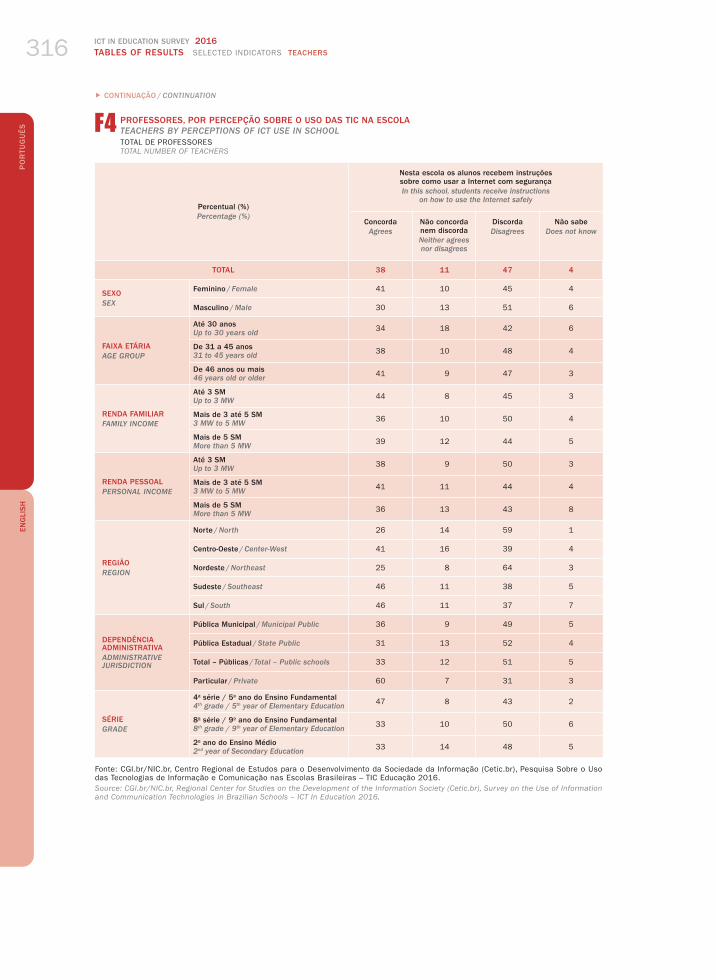
ICT IN EDUCATION SURVEY 2016TABLES OF RESULTS SELECTED INDICATORS TEACHERS316
EN
GLI
SH P
OR
TUG
UÊS F4 PROFESSORES, POR PERCEPÇÃO SOBRE O USO DAS TIC NA ESCOLA
TEACHERS BY PERCEPTIONS OF ICT USE IN SCHOOLTOTAL DE PROFESSORESTOTAL NUMBER OF TEACHERS
Percentual (%)Percentage (%)
Nesta escola os alunos recebem instruções sobre como usar a Internet com segurançaIn this school, students receive instructions
on how to use the Internet safely
ConcordaAgrees
Não concorda nem discordaNeither agrees nor disagrees
DiscordaDisagrees
Não sabeDoes not know
TOTAL 38 11 47 4
SEXOSEX
Feminino / Female 41 10 45 4
Masculino / Male 30 13 51 6
FAIXA ETÁRIAAGE GROUP
Até 30 anosUp to 30 years old 34 18 42 6
De 31 a 45 anos31 to 45 years old 38 10 48 4
De 46 anos ou mais46 years old or older 41 9 47 3
RENDA FAMILIARFAMILY INCOME
Até 3 SMUp to 3 MW 44 8 45 3
Mais de 3 até 5 SM3 MW to 5 MW 36 10 50 4
Mais de 5 SMMore than 5 MW 39 12 44 5
RENDA PESSOALPERSONAL INCOME
Até 3 SMUp to 3 MW 38 9 50 3
Mais de 3 até 5 SM3 MW to 5 MW 41 11 44 4
Mais de 5 SMMore than 5 MW 36 13 43 8
REGIÃOREGION
Norte / North 26 14 59 1
Centro-Oeste / Center-West 41 16 39 4
Nordeste / Northeast 25 8 64 3
Sudeste / Southeast 46 11 38 5
Sul / South 46 11 37 7
DEPENDÊNCIA ADMINISTRATIVAADMINISTRATIVE JURISDICTION
Pública Municipal / Municipal Public 36 9 49 5
Pública Estadual / State Public 31 13 52 4
Total – Públicas / Total – Public schools 33 12 51 5
Particular / Private 60 7 31 3
SÉRIEGRADE
4a série / 5o ano do Ensino Fundamental4th grade / 5th year of Elementary Education 47 8 43 2
8a série / 9o ano do Ensino Fundamental8th grade / 9th year of Elementary Education 33 10 50 6
2o ano do Ensino Médio2nd year of Secondary Education 33 14 48 5
Fonte: CGI.br/NIC.br, Centro Regional de Estudos para o Desenvolvimento da Sociedade da Informação (Cetic.br), Pesquisa Sobre o Uso das Tecnologias de Informação e Comunicação nas Escolas Brasileiras – TIC Educação 2016.Source: CGI.br/NIC.br, Regional Center for Studies on the Development of the Information Society (Cetic.br), Survey on the Use of Information and Communication Technologies in Brazilian Schools – ICT In Education 2016.
� CONTINUAÇÃO / CONTINUATION
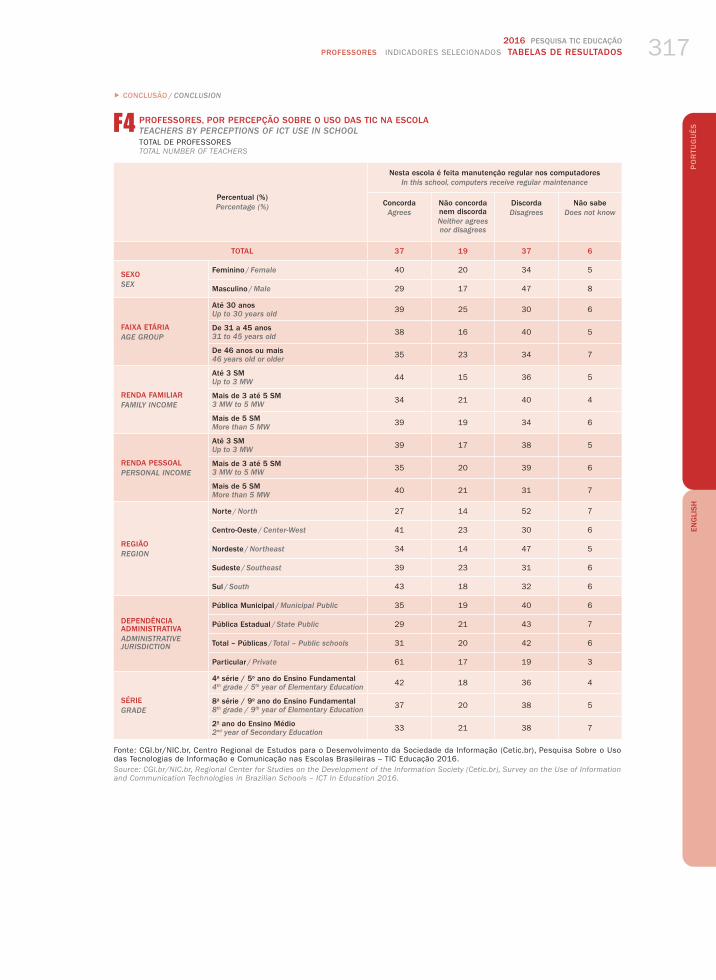
2016 PESQUISA TIC EDUCAÇÃOPROFESSORES INDICADORES SELECIONADOS TABELAS DE RESULTADOS 317
EN
GLI
SH P
OR
TUG
UÊSF4 PROFESSORES, POR PERCEPÇÃO SOBRE O USO DAS TIC NA ESCOLA
TEACHERS BY PERCEPTIONS OF ICT USE IN SCHOOLTOTAL DE PROFESSORESTOTAL NUMBER OF TEACHERS
Percentual (%)Percentage (%)
Nesta escola é feita manutenção regular nos computadoresIn this school, computers receive regular maintenance
ConcordaAgrees
Não concorda nem discordaNeither agrees nor disagrees
DiscordaDisagrees
Não sabeDoes not know
TOTAL 37 19 37 6
SEXOSEX
Feminino / Female 40 20 34 5
Masculino / Male 29 17 47 8
FAIXA ETÁRIAAGE GROUP
Até 30 anosUp to 30 years old 39 25 30 6
De 31 a 45 anos31 to 45 years old 38 16 40 5
De 46 anos ou mais46 years old or older 35 23 34 7
RENDA FAMILIARFAMILY INCOME
Até 3 SMUp to 3 MW 44 15 36 5
Mais de 3 até 5 SM3 MW to 5 MW 34 21 40 4
Mais de 5 SMMore than 5 MW 39 19 34 6
RENDA PESSOALPERSONAL INCOME
Até 3 SMUp to 3 MW 39 17 38 5
Mais de 3 até 5 SM3 MW to 5 MW 35 20 39 6
Mais de 5 SMMore than 5 MW 40 21 31 7
REGIÃOREGION
Norte / North 27 14 52 7
Centro-Oeste / Center-West 41 23 30 6
Nordeste / Northeast 34 14 47 5
Sudeste / Southeast 39 23 31 6
Sul / South 43 18 32 6
DEPENDÊNCIA ADMINISTRATIVAADMINISTRATIVE JURISDICTION
Pública Municipal / Municipal Public 35 19 40 6
Pública Estadual / State Public 29 21 43 7
Total – Públicas / Total – Public schools 31 20 42 6
Particular / Private 61 17 19 3
SÉRIEGRADE
4a série / 5o ano do Ensino Fundamental4th grade / 5th year of Elementary Education 42 18 36 4
8a série / 9o ano do Ensino Fundamental8th grade / 9th year of Elementary Education 37 20 38 5
2o ano do Ensino Médio2nd year of Secondary Education 33 21 38 7
Fonte: CGI.br/NIC.br, Centro Regional de Estudos para o Desenvolvimento da Sociedade da Informação (Cetic.br), Pesquisa Sobre o Uso das Tecnologias de Informação e Comunicação nas Escolas Brasileiras – TIC Educação 2016.Source: CGI.br/NIC.br, Regional Center for Studies on the Development of the Information Society (Cetic.br), Survey on the Use of Information and Communication Technologies in Brazilian Schools – ICT In Education 2016.
� CONCLUSÃO / CONCLUSION

ICT IN EDUCATION SURVEY 2016TABLES OF RESULTS SELECTED INDICATORS TEACHERS318
EN
GLI
SH P
OR
TUG
UÊS G1 PROFESSORES, POR USO DE RECURSOS OBTIDOS NA INTERNET PARA A PREPARAÇÃO DE AULAS OU ATIVIDADES
COM ALUNOSTEACHERS BY USE OF RESOURCES OBTAINED ON THE INTERNET FOR PREPARING CLASSES OR ACTIVITIES WITH STUDENTSTOTAL DE PROFESSORES USUÁRIOS DE INTERNETTOTAL NUMBER OF TEACHERS WHO ARE INTERNET USERS
Percentual (%)Percentage (%)
SimYes
NãoNo
TOTAL 96 4
SEXOSEX
Feminino / Female 97 3
Masculino / Male 95 5
FAIXA ETÁRIAAGE GROUP
Até 30 anosUp to 30 years old 98 2
De 31 a 45 anos31 to 45 years old 98 2
De 46 anos ou mais46 years old or older 93 7
RENDA FAMILIARFAMILY INCOME
Até 3 SMUp to 3 MW 99 1
Mais de 3 até 5 SM3 MW to 5 MW 97 3
Mais de 5 SMMore than 5 MW 95 5
RENDA PESSOALPERSONAL INCOME
Até 3 SMUp to 3 MW 98 2
Mais de 3 até 5 SM3 MW to 5 MW 96 4
Mais de 5 SMMore than 5 MW 95 5
REGIÃOREGION
Norte / North 96 4
Centro-Oeste / Center-West 98 2
Nordeste / Northeast 98 2
Sudeste / Southeast 95 5
Sul / South 97 3
DEPENDÊNCIA ADMINISTRATIVAADMINISTRATIVE JURISDICTION
Pública Municipal / Municipal Public 97 3
Pública Estadual / State Public 95 5
Total – Públicas / Total – Public schools 96 4
Particular / Private 99 1
SÉRIEGRADE
4a série / 5o ano do Ensino Fundamental4th grade / 5th year of Elementary Education 98 2
8a série / 9o ano do Ensino Fundamental8th grade / 9th year of Elementary Education 97 3
2o ano do Ensino Médio2nd year of Secondary Education 94 6
Fonte: CGI.br/NIC.br, Centro Regional de Estudos para o Desenvolvimento da Sociedade da Informação (Cetic.br), Pesquisa Sobre o Uso das Tecnologias de Informação e Comunicação nas Escolas Brasileiras – TIC Educação 2016.Source: CGI.br/NIC.br, Regional Center for Studies on the Development of the Information Society (Cetic.br), Survey on the Use of Information and Communication Technologies in Brazilian Schools – ICT In Education 2016.

2016 PESQUISA TIC EDUCAÇÃOPROFESSORES INDICADORES SELECIONADOS TABELAS DE RESULTADOS 319
EN
GLI
SH P
OR
TUG
UÊSG2 PROFESSORES, POR TIPO DE RECURSOS OBTIDOS NA INTERNET PARA A PREPARAÇÃO DE AULAS OU
ATIVIDADES COM ALUNOSTEACHERS BY TYPE OF RESOURCES OBTAINED ON THE INTERNET FOR PREPARING CLASSES OR ACTIVITIES WITH STUDENTSTOTAL DE PROFESSORES USUÁRIOS DE INTERNETTOTAL NUMBER OF TEACHERS WHO ARE INTERNET USERS
Percentual (%)Percentage (%)
Questões de prova ou avaliações
Exam questions or evaluations
Textos variadosVaried texts
Imagens, figuras,
ilustrações ou fotosImages, figures,
illustrations or photos
NotíciasNews
TOTAL 85 83 82 79
SEXOSEX
Feminino / Female 86 86 83 82
Masculino / Male 85 72 80 68
FAIXA ETÁRIAAGE GROUP
Até 30 anosUp to 30 years old 89 83 93 76
De 31 a 45 anos31 to 45 years old 87 84 84 82
De 46 anos ou mais46 years old or older 81 80 75 74
RENDA FAMILIARFAMILY INCOME
Até 3 SMUp to 3 MW 83 87 90 85
Mais de 3 até 5 SM3 MW to 5 MW 88 83 85 80
Mais de 5 SMMore than 5 MW 85 82 77 76
RENDA PESSOALPERSONAL INCOME
Até 3 SMUp to 3 MW 84 85 86 84
Mais de 3 até 5 SM3 MW to 5 MW 86 82 81 75
Mais de 5 SMMore than 5 MW 88 82 74 75
REGIÃOREGION
Norte / North 84 83 86 76
Centro-Oeste / Center-West 83 87 87 84
Nordeste / Northeast 82 80 86 79
Sudeste / Southeast 89 84 79 79
Sul / South 80 82 80 76
DEPENDÊNCIA ADMINISTRATIVAADMINISTRATIVE JURISDICTION
Pública Municipal / Municipal Public 85 86 85 81
Pública Estadual / State Public 86 79 76 74
Total – Públicas / Total – Public schools 86 82 80 77
Particular / Private 85 86 91 85
SÉRIEGRADE
4a série / 5o ano do Ensino Fundamental4th grade / 5th year of Elementary Education 83 90 93 88
8a série / 9o ano do Ensino Fundamental8th grade / 9th year of Elementary Education 90 80 79 75
2o ano do Ensino Médio2nd year of Secondary Education 85 77 73 70
Fonte: CGI.br/NIC.br, Centro Regional de Estudos para o Desenvolvimento da Sociedade da Informação (Cetic.br), Pesquisa Sobre o Uso das Tecnologias de Informação e Comunicação nas Escolas Brasileiras – TIC Educação 2016.Source: CGI.br/NIC.br, Regional Center for Studies on the Development of the Information Society (Cetic.br), Survey on the Use of Information and Communication Technologies in Brazilian Schools – ICT In Education 2016.
CONTINUA / CONTINUES �

ICT IN EDUCATION SURVEY 2016TABLES OF RESULTS SELECTED INDICATORS TEACHERS320
EN
GLI
SH P
OR
TUG
UÊS G2 PROFESSORES, POR TIPO DE RECURSOS OBTIDOS NA INTERNET PARA A PREPARAÇÃO DE AULAS OU
ATIVIDADES COM ALUNOSTEACHERS BY TYPE OF RESOURCES OBTAINED ON THE INTERNET FOR PREPARING CLASSES OR ACTIVITIES WITH STUDENTSTOTAL DE PROFESSORES USUÁRIOS DE INTERNETTOTAL NUMBER OF TEACHERS WHO ARE INTERNET USERS
Percentual (%)Percentage (%)
Filmes ou animações
Films or animations
Listas com indicações de leitura
Lists with reading suggestions
Planos de aulaLesson plans
TOTAL 59 55 54
SEXOSEX
Feminino / Female 62 57 53
Masculino / Male 48 50 56
FAIXA ETÁRIAAGE GROUP
Até 30 anosUp to 30 years old 70 56 59
De 31 a 45 anos31 to 45 years old 62 56 53
De 46 anos ou mais46 years old or older 50 53 53
RENDA FAMILIARFAMILY INCOME
Até 3 SMUp to 3 MW 65 64 60
Mais de 3 até 5 SM3 MW to 5 MW 57 54 50
Mais de 5 SMMore than 5 MW 58 54 55
RENDA PESSOALPERSONAL INCOME
Até 3 SMUp to 3 MW 63 60 54
Mais de 3 até 5 SM3 MW to 5 MW 58 53 55
Mais de 5 SMMore than 5 MW 52 51 52
REGIÃOREGION
Norte / North 60 51 58
Centro-Oeste / Center-West 63 61 62
Nordeste / Northeast 59 57 50
Sudeste / Southeast 59 56 54
Sul / South 58 48 53
DEPENDÊNCIA ADMINISTRATIVAADMINISTRATIVE JURISDICTION
Pública Municipal / Municipal Public 67 52 61
Pública Estadual / State Public 49 55 55
Total – Públicas / Total – Public schools 57 54 58
Particular / Private 67 60 36
SÉRIEGRADE
4a série / 5o ano do Ensino Fundamental4th grade / 5th year of Elementary Education 70 60 54
8a série / 9o ano do Ensino Fundamental8th grade / 9th year of Elementary Education 56 51 56
2o ano do Ensino Médio2nd year of Secondary Education 49 54 50
Fonte: CGI.br/NIC.br, Centro Regional de Estudos para o Desenvolvimento da Sociedade da Informação (Cetic.br), Pesquisa Sobre o Uso das Tecnologias de Informação e Comunicação nas Escolas Brasileiras – TIC Educação 2016.Source: CGI.br/NIC.br, Regional Center for Studies on the Development of the Information Society (Cetic.br), Survey on the Use of Information and Communication Technologies in Brazilian Schools – ICT In Education 2016.
� CONTINUAÇÃO / CONTINUATION

2016 PESQUISA TIC EDUCAÇÃOPROFESSORES INDICADORES SELECIONADOS TABELAS DE RESULTADOS 321
EN
GLI
SH P
OR
TUG
UÊSG2 PROFESSORES, POR TIPO DE RECURSOS OBTIDOS NA INTERNET PARA A PREPARAÇÃO DE AULAS OU
ATIVIDADES COM ALUNOSTEACHERS BY TYPE OF RESOURCES OBTAINED ON THE INTERNET FOR PREPARING CLASSES OR ACTIVITIES WITH STUDENTSTOTAL DE PROFESSORES USUÁRIOS DE INTERNETTOTAL NUMBER OF TEACHERS WHO ARE INTERNET USERS
Percentual (%)Percentage (%)
VideoaulasVideo-classes
Programas educacionais
de computador ou softwareComputer
or software educational
projects
JogosGames
TOTAL 52 40 38
SEXOSEX
Feminino / Female 54 41 38
Masculino / Male 47 38 39
FAIXA ETÁRIAAGE GROUP
Até 30 anosUp to 30 years old 59 44 38
De 31 a 45 anos31 to 45 years old 52 39 40
De 46 anos ou mais46 years old or older 50 42 35
RENDA FAMILIARFAMILY INCOME
Até 3 SMUp to 3 MW 57 37 46
Mais de 3 até 5 SM3 MW to 5 MW 51 41 37
Mais de 5 SMMore than 5 MW 52 40 35
RENDA PESSOALPERSONAL INCOME
Até 3 SMUp to 3 MW 53 35 40
Mais de 3 até 5 SM3 MW to 5 MW 50 42 35
Mais de 5 SMMore than 5 MW 55 48 37
REGIÃOREGION
Norte / North 56 43 44
Centro-Oeste / Center-West 55 48 44
Nordeste / Northeast 57 41 42
Sudeste / Southeast 51 37 36
Sul / South 47 46 31
DEPENDÊNCIA ADMINISTRATIVAADMINISTRATIVE JURISDICTION
Pública Municipal / Municipal Public 53 45 50
Pública Estadual / State Public 52 38 30
Total – Públicas / Total – Public schools 53 41 39
Particular / Private 52 36 35
SÉRIEGRADE
4a série / 5o ano do Ensino Fundamental4th grade / 5th year of Elementary Education 51 46 53
8a série / 9o ano do Ensino Fundamental8th grade / 9th year of Elementary Education 53 39 34
2o ano do Ensino Médio2nd year of Secondary Education 53 35 23
Fonte: CGI.br/NIC.br, Centro Regional de Estudos para o Desenvolvimento da Sociedade da Informação (Cetic.br), Pesquisa Sobre o Uso das Tecnologias de Informação e Comunicação nas Escolas Brasileiras – TIC Educação 2016.Source: CGI.br/NIC.br, Regional Center for Studies on the Development of the Information Society (Cetic.br), Survey on the Use of Information and Communication Technologies in Brazilian Schools – ICT In Education 2016.
� CONTINUAÇÃO / CONTINUATION

ICT IN EDUCATION SURVEY 2016TABLES OF RESULTS SELECTED INDICATORS TEACHERS322
EN
GLI
SH P
OR
TUG
UÊS G2 PROFESSORES, POR TIPO DE RECURSOS OBTIDOS NA INTERNET PARA A PREPARAÇÃO DE AULAS OU
ATIVIDADES COM ALUNOSTEACHERS BY TYPE OF RESOURCES OBTAINED ON THE INTERNET FOR PREPARING CLASSES OR ACTIVITIES WITH STUDENTSTOTAL DE PROFESSORES USUÁRIOS DE INTERNETTOTAL NUMBER OF TEACHERS WHO ARE INTERNET USERS
Percentual (%)Percentage (%)
Apresentações prontas
Ready-made presentations
PodcastsPodcasts
Não utilizou recursos obtidos
da InternetDid not use
resources obtained on the Internet
TOTAL 38 13 4
SEXOSEX
Feminino / Female 38 13 3
Masculino / Male 35 13 5
FAIXA ETÁRIAAGE GROUP
Até 30 anosUp to 30 years old 34 15 2
De 31 a 45 anos31 to 45 years old 37 13 2
De 46 anos ou mais46 years old or older 40 13 7
RENDA FAMILIARFAMILY INCOME
Até 3 SMUp to 3 MW 46 14 1
Mais de 3 até 5 SM3 MW to 5 MW 40 13 3
Mais de 5 SMMore than 5 MW 33 12 5
RENDA PESSOALPERSONAL INCOME
Até 3 SMUp to 3 MW 41 11 2
Mais de 3 até 5 SM3 MW to 5 MW 36 16 4
Mais de 5 SMMore than 5 MW 36 9 5
REGIÃOREGION
Norte / North 39 10 4
Centro-Oeste / Center-West 43 9 2
Nordeste / Northeast 45 17 2
Sudeste / Southeast 34 12 5
Sul / South 34 13 3
DEPENDÊNCIA ADMINISTRATIVAADMINISTRATIVE JURISDICTION
Pública Municipal / Municipal Public 40 14 3
Pública Estadual / State Public 34 11 5
Total – Públicas / Total – Public schools 37 12 4
Particular / Private 42 16 1
SÉRIEGRADE
4a série / 5o ano do Ensino Fundamental4th grade / 5th year of Elementary Education 42 14 2
8a série / 9o ano do Ensino Fundamental8th grade / 9th year of Elementary Education 38 14 3
2o ano do Ensino Médio2nd year of Secondary Education 33 12 6
Fonte: CGI.br/NIC.br, Centro Regional de Estudos para o Desenvolvimento da Sociedade da Informação (Cetic.br), Pesquisa Sobre o Uso das Tecnologias de Informação e Comunicação nas Escolas Brasileiras – TIC Educação 2016.Source: CGI.br/NIC.br, Regional Center for Studies on the Development of the Information Society (Cetic.br), Survey on the Use of Information and Communication Technologies in Brazilian Schools – ICT In Education 2016.
� CONCLUSÃO / CONCLUSION

2016 PESQUISA TIC EDUCAÇÃOPROFESSORES INDICADORES SELECIONADOS TABELAS DE RESULTADOS 323
EN
GLI
SH P
OR
TUG
UÊSG2A PROFESSORES, POR FREQUÊNCIA DE ACESSO A RECURSOS DA INTERNET PARA A PREPARAÇÃO DE AULAS
TEACHERS BY FREQUENCY OF ACCESS TO INTERNET RESOURCES FOR PREPARING CLASSESTOTAL DE PROFESSORES USUÁRIOS DE INTERNETTOTAL NUMBER OF TEACHERS WHO ARE INTERNET USERS
Percentual (%)Percentage (%)
Todos os dias ou quase
todos os diasEvery day or almost every day
Pelo menos uma vez
por semanaAt least
once a week
Pelo menos uma vez por mêsAt least
once a month
Menos de uma vez por mêsLess than
once a month
TOTAL 33 50 11 2
SEXOSEX
Feminino / Female 35 50 10 1
Masculino / Male 28 48 13 5
FAIXA ETÁRIAAGE GROUP
Até 30 anosUp to 30 years old 46 40 9 3
De 31 a 45 anos31 to 45 years old 34 53 10 1
De 46 anos ou mais46 years old or older 28 47 13 5
RENDA FAMILIARFAMILY INCOME
Até 3 SMUp to 3 MW 48 38 12 1
Mais de 3 até 5 SM3 MW to 5 MW 30 58 8 1
Mais de 5 SMMore than 5 MW 31 48 12 4
RENDA PESSOALPERSONAL INCOME
Até 3 SMUp to 3 MW 37 48 10 2
Mais de 3 até 5 SM3 MW to 5 MW 33 50 10 3
Mais de 5 SMMore than 5 MW 28 53 13 2
REGIÃOREGION
Norte / North 30 52 10 4
Centro-Oeste / Center-West 44 45 7 2
Nordeste / Northeast 33 51 12 2
Sudeste / Southeast 34 50 9 2
Sul / South 30 46 17 4
DEPENDÊNCIA ADMINISTRATIVAADMINISTRATIVE JURISDICTION
Pública Municipal / Municipal Public 38 47 9 3
Pública Estadual / State Public 27 53 12 3
Total – Públicas / Total – Public schools 32 50 11 3
Particular / Private 40 48 11 0
SÉRIEGRADE
4a série / 5o ano do Ensino Fundamental4th grade / 5th year of Elementary Education 40 49 7 2
8a série / 9o ano do Ensino Fundamental8th grade / 9th year of Elementary Education 33 46 15 2
2o ano do Ensino Médio2nd year of Secondary Education 26 53 13 3
Fonte: CGI.br/NIC.br, Centro Regional de Estudos para o Desenvolvimento da Sociedade da Informação (Cetic.br), Pesquisa Sobre o Uso das Tecnologias de Informação e Comunicação nas Escolas Brasileiras – TIC Educação 2016.Source: CGI.br/NIC.br, Regional Center for Studies on the Development of the Information Society (Cetic.br), Survey on the Use of Information and Communication Technologies in Brazilian Schools – ICT In Education 2016.
CONTINUA / CONTINUES �

ICT IN EDUCATION SURVEY 2016TABLES OF RESULTS SELECTED INDICATORS TEACHERS324
EN
GLI
SH P
OR
TUG
UÊS G2A PROFESSORES, POR FREQUÊNCIA DE ACESSO A RECURSOS DA INTERNET PARA A PREPARAÇÃO DE AULAS
TEACHERS BY FREQUENCY OF ACCESS TO INTERNET RESOURCES FOR PREPARING CLASSESTOTAL DE PROFESSORES USUÁRIOS DE INTERNETTOTAL NUMBER OF TEACHERS WHO ARE INTERNET USERS
Percentual (%)Percentage (%)
Não sabeDoes not know
Não respondeuDid not answer
Não utilizou recursos obtidos
da InternetDoes not use
resources obtained on the Internet
TOTAL 0 0 4
SEXOSEX
Feminino / Female 0 0 3
Masculino / Male 0 0 5
FAIXA ETÁRIAAGE GROUP
Até 30 anosUp to 30 years old 0 0 2
De 31 a 45 anos31 to 45 years old 0 0 2
De 46 anos ou mais46 years old or older 0 0 7
RENDA FAMILIARFAMILY INCOME
Até 3 SMUp to 3 MW 0 0 1
Mais de 3 até 5 SM3 MW to 5 MW 0 0 3
Mais de 5 SMMore than 5 MW 0 0 5
RENDA PESSOALPERSONAL INCOME
Até 3 SMUp to 3 MW 0 0 2
Mais de 3 até 5 SM3 MW to 5 MW 0 0 4
Mais de 5 SMMore than 5 MW 0 0 5
REGIÃOREGION
Norte / North 0 0 4
Centro-Oeste / Center-West 0 0 2
Nordeste / Northeast 0 0 2
Sudeste / Southeast 0 0 5
Sul / South 0 0 3
DEPENDÊNCIA ADMINISTRATIVAADMINISTRATIVE JURISDICTION
Pública Municipal / Municipal Public 0 0 3
Pública Estadual / State Public 0 0 5
Total – Públicas / Total – Public schools 0 0 4
Particular / Private 0 0 1
SÉRIEGRADE
4a série / 5o ano do Ensino Fundamental4th grade / 5th year of Elementary Education 0 0 2
8a série / 9o ano do Ensino Fundamental8th grade / 9th year of Elementary Education 0 0 3
2o ano do Ensino Médio2nd year of Secondary Education 0 0 6
Fonte: CGI.br/NIC.br, Centro Regional de Estudos para o Desenvolvimento da Sociedade da Informação (Cetic.br), Pesquisa Sobre o Uso das Tecnologias de Informação e Comunicação nas Escolas Brasileiras – TIC Educação 2016.Source: CGI.br/NIC.br, Regional Center for Studies on the Development of the Information Society (Cetic.br), Survey on the Use of Information and Communication Technologies in Brazilian Schools – ICT In Education 2016.
� CONCLUSÃO / CONCLUSION

2016 PESQUISA TIC EDUCAÇÃOPROFESSORES INDICADORES SELECIONADOS TABELAS DE RESULTADOS 325
EN
GLI
SH P
OR
TUG
UÊSG2B PROFESSORES, POR PLATAFORMAS ACESSADAS PARA A PREPARAÇÃO DE AULAS
TEACHERS BY PLATFORMS ACCESSED TO PREPARE CLASSESTOTAL DE PROFESSORES USUÁRIOS DE INTERNETTOTAL NUMBER OF TEACHERS WHO ARE INTERNET USERS
Percentual (%)Percentage (%)
Blogs de professores e de escolas
School or teacher blogs
Sites de escolasSchool
websites
Portal do professor do MEC
Ministry of Education
teacher portal
Sites de revistas
ou jornaisMagazine or newspaper websites
TOTAL 71 68 61 59
SEXOSEX
Feminino / Female 72 70 64 61
Masculino / Male 66 61 51 54
FAIXA ETÁRIAAGE GROUP
Até 30 anosUp to 30 years old 79 76 50 66
De 31 a 45 anos31 to 45 years old 76 69 63 60
De 46 anos ou mais46 years old or older 58 62 62 56
RENDA FAMILIARFAMILY INCOME
Até 3 SMUp to 3 MW 78 79 76 63
Mais de 3 até 5 SM3 MW to 5 MW 72 67 58 55
Mais de 5 SMMore than 5 MW 67 64 58 62
RENDA PESSOALPERSONAL INCOME
Até 3 SMUp to 3 MW 73 72 65 60
Mais de 3 até 5 SM3 MW to 5 MW 70 66 59 58
Mais de 5 SMMore than 5 MW 67 62 56 61
REGIÃOREGION
Norte / North 64 59 57 54
Centro-Oeste / Center-West 75 76 59 69
Nordeste / Northeast 68 65 63 59
Sudeste / Southeast 74 70 62 59
Sul / South 68 69 58 62
DEPENDÊNCIA ADMINISTRATIVAADMINISTRATIVE JURISDICTION
Pública Municipal / Municipal Public 74 72 68 60
Pública Estadual / State Public 66 62 58 61
Total – Públicas / Total – Public schools 69 67 62 60
Particular / Private 77 73 55 56
SÉRIEGRADE
4a série / 5o ano do Ensino Fundamental4th grade / 5th year of Elementary Education 78 77 66 62
8a série / 9o ano do Ensino Fundamental8th grade / 9th year of Elementary Education 69 66 63 57
2o ano do Ensino Médio2nd year of Secondary Education 64 58 52 58
Fonte: CGI.br/NIC.br, Centro Regional de Estudos para o Desenvolvimento da Sociedade da Informação (Cetic.br), Pesquisa Sobre o Uso das Tecnologias de Informação e Comunicação nas Escolas Brasileiras – TIC Educação 2016.Source: CGI.br/NIC.br, Regional Center for Studies on the Development of the Information Society (Cetic.br), Survey on the Use of Information and Communication Technologies in Brazilian Schools – ICT In Education 2016.
CONTINUA / CONTINUES �

ICT IN EDUCATION SURVEY 2016TABLES OF RESULTS SELECTED INDICATORS TEACHERS326
EN
GLI
SH P
OR
TUG
UÊS G2B PROFESSORES, POR PLATAFORMAS ACESSADAS PARA A PREPARAÇÃO DE AULAS
TEACHERS BY PLATFORMS ACCESSED TO PREPARE CLASSESTOTAL DE PROFESSORES USUÁRIOS DE INTERNETTOTAL NUMBER OF TEACHERS WHO ARE INTERNET USERS
Percentual (%)Percentage (%)
Sites de editorasPublisher websites
Enciclopédias digitaisDigital
encyclopedias
Redes sociaisSocial
networking websites
OutrosOther
TOTAL 56 52 25 19
SEXOSEX
Feminino / Female 58 52 25 18
Masculino / Male 52 53 23 24
FAIXA ETÁRIAAGE GROUP
Até 30 anosUp to 30 years old 61 58 18 12
De 31 a 45 anos31 to 45 years old 58 55 26 23
De 46 anos ou mais46 years old or older 51 44 24 15
RENDA FAMILIARFAMILY INCOME
Até 3 SMUp to 3 MW 64 55 34 9
Mais de 3 até 5 SM3 MW to 5 MW 57 52 23 22
Mais de 5 SMMore than 5 MW 53 51 22 19
RENDA PESSOALPERSONAL INCOME
Até 3 SMUp to 3 MW 60 52 28 15
Mais de 3 até 5 SM3 MW to 5 MW 54 55 21 20
Mais de 5 SMMore than 5 MW 52 46 24 23
REGIÃOREGION
Norte / North 51 53 27 29
Centro-Oeste / Center-West 53 60 27 10
Nordeste / Northeast 61 54 31 17
Sudeste / Southeast 54 50 22 20
Sul / South 59 50 17 17
DEPENDÊNCIA ADMINISTRATIVAADMINISTRATIVE JURISDICTION
Pública Municipal / Municipal Public 61 50 25 15
Pública Estadual / State Public 48 49 22 21
Total – Públicas / Total – Public schools 54 50 23 19
Particular / Private 65 61 29 21
SÉRIEGRADE
4a série / 5o ano do Ensino Fundamental4th grade / 5th year of Elementary Education 62 55 35 16
8a série / 9o ano do Ensino Fundamental8th grade / 9th year of Elementary Education 58 55 20 23
2o ano do Ensino Médio2nd year of Secondary Education 47 46 16 20
Fonte: CGI.br/NIC.br, Centro Regional de Estudos para o Desenvolvimento da Sociedade da Informação (Cetic.br), Pesquisa Sobre o Uso das Tecnologias de Informação e Comunicação nas Escolas Brasileiras – TIC Educação 2016.Source: CGI.br/NIC.br, Regional Center for Studies on the Development of the Information Society (Cetic.br), Survey on the Use of Information and Communication Technologies in Brazilian Schools – ICT In Education 2016.
� CONCLUSÃO / CONCLUSION

2016 PESQUISA TIC EDUCAÇÃOPROFESSORES INDICADORES SELECIONADOS TABELAS DE RESULTADOS 327
EN
GLI
SH P
OR
TUG
UÊSG5 PROFESSORES, POR TIPO DE MOTIVAÇÃO PARA O USO DE RECURSOS OBTIDOS NA INTERNET
TEACHERS BY REASONS FOR USING RESOURCES OBTAINED ON THE INTERNETTOTAL DE PROFESSORES USUÁRIOS DE INTERNETTOTAL NUMBER OF TEACHERS WHO ARE INTERNET USERS
Percentual (%)Percentage (%)
Motivação própria
Personal reason
Colegas ou outros
educadoresColleague or another educator
Projeto Político
PedagógicoPolitico-
pedagogical project
AlunosStudents
TOTAL 96 67 57 55
SEXOSEX
Feminino / Female 96 68 59 57
Masculino / Male 94 64 48 48
FAIXA ETÁRIAAGE GROUP
Até 30 anosUp to 30 years old 98 59 48 58
De 31 a 45 anos31 to 45 years old 98 70 56 57
De 46 anos ou mais46 years old or older 91 66 61 51
RENDA FAMILIARFAMILY INCOME
Até 3 SMUp to 3 MW 99 66 70 57
Mais de 3 até 5 SM3 MW to 5 MW 97 69 59 52
Mais de 5 SMMore than 5 MW 93 67 51 57
RENDA PESSOALPERSONAL INCOME
Até 3 SMUp to 3 MW 97 69 63 56
Mais de 3 até 5 SM3 MW to 5 MW 94 67 53 54
Mais de 5 SMMore than 5 MW 95 62 51 55
REGIÃOREGION
Norte / North 95 63 57 61
Centro-Oeste / Center-West 96 64 53 63
Nordeste / Northeast 97 72 62 58
Sudeste / Southeast 95 67 56 51
Sul / South 96 61 48 58
DEPENDÊNCIA ADMINISTRATIVAADMINISTRATIVE JURISDICTION
Pública Municipal / Municipal Public 97 72 54 58
Pública Estadual / State Public 94 63 52 52
Total – Públicas / Total – Public schools 95 67 53 54
Particular / Private 98 69 71 58
SÉRIEGRADE
4a série / 5o ano do Ensino Fundamental4th grade / 5th year of Elementary Education 97 75 68 63
8a série / 9o ano do Ensino Fundamental8th grade / 9th year of Elementary Education 96 65 47 53
2o ano do Ensino Médio2nd year of Secondary Education 93 60 52 47
Fonte: CGI.br/NIC.br, Centro Regional de Estudos para o Desenvolvimento da Sociedade da Informação (Cetic.br), Pesquisa Sobre o Uso das Tecnologias de Informação e Comunicação nas Escolas Brasileiras – TIC Educação 2016.Source: CGI.br/NIC.br, Regional Center for Studies on the Development of the Information Society (Cetic.br), Survey on the Use of Information and Communication Technologies in Brazilian Schools – ICT In Education 2016.
CONTINUA / CONTINUES �

ICT IN EDUCATION SURVEY 2016TABLES OF RESULTS SELECTED INDICATORS TEACHERS328
EN
GLI
SH P
OR
TUG
UÊS G5 PROFESSORES, POR TIPO DE MOTIVAÇÃO PARA O USO DE RECURSOS OBTIDOS NA INTERNET
TEACHERS BY REASONS FOR USING RESOURCES OBTAINED ON THE INTERNETTOTAL DE PROFESSORES USUÁRIOS DE INTERNETTOTAL NUMBER OF TEACHERS WHO ARE INTERNET USERS
Percentual (%)Percentage (%)
Coordenação pedagógicaCoordination
of studies
Direção da escola
School administration
Secretaria de Educação ou outros órgãos
governamentaisDepartment of Education
or other government
agencies
OutrosOther
TOTAL 55 46 33 8
SEXOSEX
Feminino / Female 54 46 33 7
Masculino / Male 57 46 32 8
FAIXA ETÁRIAAGE GROUP
Até 30 anosUp to 30 years old 53 47 30 7
De 31 a 45 anos31 to 45 years old 55 47 31 7
De 46 anos ou mais46 years old or older 54 45 37 8
RENDA FAMILIARFAMILY INCOME
Até 3 SMUp to 3 MW 62 54 42 8
Mais de 3 até 5 SM3 MW to 5 MW 53 46 32 6
Mais de 5 SMMore than 5 MW 54 45 31 9
RENDA PESSOALPERSONAL INCOME
Até 3 SMUp to 3 MW 57 49 33 8
Mais de 3 até 5 SM3 MW to 5 MW 54 46 36 8
Mais de 5 SMMore than 5 MW 52 43 29 6
REGIÃOREGION
Norte / North 51 39 29 16
Centro-Oeste / Center-West 65 55 36 9
Nordeste / Northeast 61 52 34 8
Sudeste / Southeast 53 44 33 6
Sul / South 47 44 35 4
DEPENDÊNCIA ADMINISTRATIVAADMINISTRATIVE JURISDICTION
Pública Municipal / Municipal Public 60 50 41 9
Pública Estadual / State Public 48 40 35 8
Total – Públicas / Total – Public schools 53 45 37 8
Particular / Private 62 54 15 5
SÉRIEGRADE
4a série / 5o ano do Ensino Fundamental4th grade / 5th year of Elementary Education 65 54 40 8
8a série / 9o ano do Ensino Fundamental8th grade / 9th year of Elementary Education 52 46 28 8
2o ano do Ensino Médio2nd year of Secondary Education 46 37 30 7
Fonte: CGI.br/NIC.br, Centro Regional de Estudos para o Desenvolvimento da Sociedade da Informação (Cetic.br), Pesquisa Sobre o Uso das Tecnologias de Informação e Comunicação nas Escolas Brasileiras – TIC Educação 2016.Source: CGI.br/NIC.br, Regional Center for Studies on the Development of the Information Society (Cetic.br), Survey on the Use of Information and Communication Technologies in Brazilian Schools – ICT In Education 2016.
� CONCLUSÃO / CONCLUSION
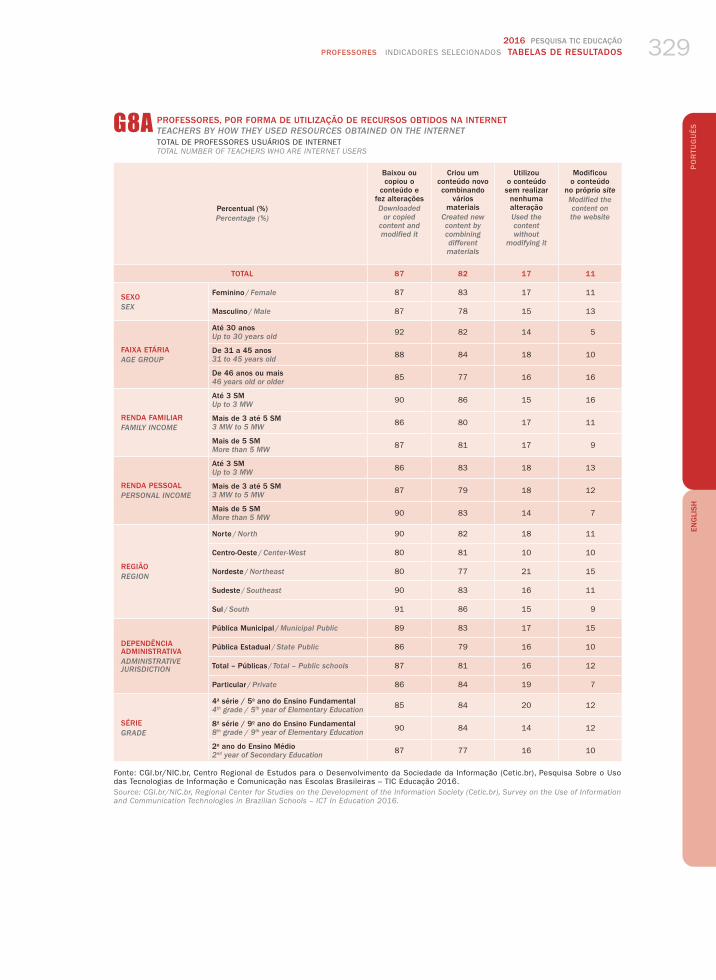
2016 PESQUISA TIC EDUCAÇÃOPROFESSORES INDICADORES SELECIONADOS TABELAS DE RESULTADOS 329
EN
GLI
SH P
OR
TUG
UÊSG8A PROFESSORES, POR FORMA DE UTILIZAÇÃO DE RECURSOS OBTIDOS NA INTERNET
TEACHERS BY HOW THEY USED RESOURCES OBTAINED ON THE INTERNETTOTAL DE PROFESSORES USUÁRIOS DE INTERNETTOTAL NUMBER OF TEACHERS WHO ARE INTERNET USERS
Percentual (%)Percentage (%)
Baixou ou copiou o
conteúdo e fez alteraçõesDownloaded
or copied content and modified it
Criou um conteúdo novo combinando
vários materiais
Created new content by combining different materials
Utilizou o conteúdo sem realizar
nenhuma alteraçãoUsed the content without
modifying it
Modificou o conteúdo
no próprio siteModified the content on the website
TOTAL 87 82 17 11
SEXOSEX
Feminino / Female 87 83 17 11
Masculino / Male 87 78 15 13
FAIXA ETÁRIAAGE GROUP
Até 30 anosUp to 30 years old 92 82 14 5
De 31 a 45 anos31 to 45 years old 88 84 18 10
De 46 anos ou mais46 years old or older 85 77 16 16
RENDA FAMILIARFAMILY INCOME
Até 3 SMUp to 3 MW 90 86 15 16
Mais de 3 até 5 SM3 MW to 5 MW 86 80 17 11
Mais de 5 SMMore than 5 MW 87 81 17 9
RENDA PESSOALPERSONAL INCOME
Até 3 SMUp to 3 MW 86 83 18 13
Mais de 3 até 5 SM3 MW to 5 MW 87 79 18 12
Mais de 5 SMMore than 5 MW 90 83 14 7
REGIÃOREGION
Norte / North 90 82 18 11
Centro-Oeste / Center-West 80 81 10 10
Nordeste / Northeast 80 77 21 15
Sudeste / Southeast 90 83 16 11
Sul / South 91 86 15 9
DEPENDÊNCIA ADMINISTRATIVAADMINISTRATIVE JURISDICTION
Pública Municipal / Municipal Public 89 83 17 15
Pública Estadual / State Public 86 79 16 10
Total – Públicas / Total – Public schools 87 81 16 12
Particular / Private 86 84 19 7
SÉRIEGRADE
4a série / 5o ano do Ensino Fundamental4th grade / 5th year of Elementary Education 85 84 20 12
8a série / 9o ano do Ensino Fundamental8th grade / 9th year of Elementary Education 90 84 14 12
2o ano do Ensino Médio2nd year of Secondary Education 87 77 16 10
Fonte: CGI.br/NIC.br, Centro Regional de Estudos para o Desenvolvimento da Sociedade da Informação (Cetic.br), Pesquisa Sobre o Uso das Tecnologias de Informação e Comunicação nas Escolas Brasileiras – TIC Educação 2016.Source: CGI.br/NIC.br, Regional Center for Studies on the Development of the Information Society (Cetic.br), Survey on the Use of Information and Communication Technologies in Brazilian Schools – ICT In Education 2016.

ICT IN EDUCATION SURVEY 2016TABLES OF RESULTS SELECTED INDICATORS TEACHERS330
EN
GLI
SH P
OR
TUG
UÊS G10 PROFESSORES, POR PUBLICAÇÃO DE RECURSOS PRODUZIDOS ATRAVÉS DAS TIC
TEACHERS BY PUBLICATION OF RESOURCES PRODUCED VIA ICTTOTAL DE PROFESSORES USUÁRIOS DE INTERNETTOTAL NUMBER OF TEACHERS WHO ARE INTERNET USERS
Percentual (%)Percentage (%)
SimYes
NãoNo
Não modificou o conteúdo ou
criou um novo a partir do conteúdo obtido da Internet
Did not modify content or create something new
based on content obtained on the Internet
TOTAL 28 65 7
SEXOSEX
Feminino / Female 27 66 7
Masculino / Male 31 60 9
FAIXA ETÁRIAAGE GROUP
Até 30 anosUp to 30 years old 38 60 3
De 31 a 45 anos31 to 45 years old 29 64 7
De 46 anos ou mais46 years old or older 21 69 10
RENDA FAMILIARFAMILY INCOME
Até 3 SMUp to 3 MW 31 65 4
Mais de 3 até 5 SM3 MW to 5 MW 26 66 8
Mais de 5 SMMore than 5 MW 28 64 8
RENDA PESSOALPERSONAL INCOME
Até 3 SMUp to 3 MW 22 70 8
Mais de 3 até 5 SM3 MW to 5 MW 33 60 7
Mais de 5 SMMore than 5 MW 30 64 6
REGIÃOREGION
Norte / North 24 69 6
Centro-Oeste / Center-West 27 68 5
Nordeste / Northeast 28 60 12
Sudeste / Southeast 28 66 6
Sul / South 27 68 5
DEPENDÊNCIA ADMINISTRATIVAADMINISTRATIVE JURISDICTION
Pública Municipal / Municipal Public 28 67 6
Pública Estadual / State Public 27 65 8
Total – Públicas / Total – Public schools 27 66 7
Particular / Private 30 61 8
SÉRIEGRADE
4a série / 5o ano do Ensino Fundamental4th grade / 5th year of Elementary Education 28 66 7
8a série / 9o ano do Ensino Fundamental8th grade / 9th year of Elementary Education 29 65 6
2o ano do Ensino Médio2nd year of Secondary Education 27 64 9
Fonte: CGI.br/NIC.br, Centro Regional de Estudos para o Desenvolvimento da Sociedade da Informação (Cetic.br), Pesquisa Sobre o Uso das Tecnologias de Informação e Comunicação nas Escolas Brasileiras – TIC Educação 2016.Source: CGI.br/NIC.br, Regional Center for Studies on the Development of the Information Society (Cetic.br), Survey on the Use of Information and Communication Technologies in Brazilian Schools – ICT In Education 2016.

2016 PESQUISA TIC EDUCAÇÃOPROFESSORES INDICADORES SELECIONADOS TABELAS DE RESULTADOS 331
EN
GLI
SH P
OR
TUG
UÊSG12 PROFESSORES, POR PERCEPÇÃO SOBRE BARREIRAS PARA A PUBLICAÇÃO DE RECURSOS NA INTERNET
TEACHERS BY PERCEPTIONS OF BARRIERS TO PUBLISHING RESOURCES ON THE INTERNETTOTAL DE PROFESSORES USUÁRIOS DE INTERNETTOTAL NUMBER OF TEACHERS WHO ARE INTERNET USERS
Percentual (%)Percentage (%)
Falta de tempoLack of time
Dificulta muito
Strongly hinders
Dificulta um poucoHinders
Não dificulta
nadaDoes not hinder
Não sabe
Does not know
Não respondeu
Did not answer
Não modificou o conteúdo ou criou um novo a partir do conteúdo
obtido da InternetDid not
modify content or create
something new based on content obtained on the Internet
TOTAL 51 30 11 0 0 7
SEXOSEX
Feminino / Female 51 30 11 0 0 7
Masculino / Male 52 29 10 0 0 9
FAIXA ETÁRIAAGE GROUP
Até 30 anosUp to 30 years old 53 39 5 0 0 3
De 31 a 45 anos31 to 45 years old 54 28 11 0 0 7
De 46 anos ou mais46 years old or older 46 30 13 0 1 10
RENDA FAMILIARFAMILY INCOME
Até 3 SMUp to 3 MW 36 46 14 0 0 4
Mais de 3 até 5 SM3 MW to 5 MW 56 24 11 0 1 8
Mais de 5 SMMore than 5 MW 54 29 9 0 0 8
RENDA PESSOALPERSONAL INCOME
Até 3 SMUp to 3 MW 49 31 11 0 0 8
Mais de 3 até 5 SM3 MW to 5 MW 53 29 10 0 1 7
Mais de 5 SMMore than 5 MW 53 29 11 1 0 6
REGIÃOREGION
Norte / North 52 27 14 0 0 6
Centro-Oeste / Center-West 54 31 10 0 0 5
Nordeste / Northeast 45 31 12 0 0 12
Sudeste / Southeast 54 30 9 0 0 6
Sul / South 51 30 10 1 2 5
DEPENDÊNCIA ADMINISTRATIVAADMINISTRATIVE JURISDICTION
Pública Municipal / Municipal Public 48 31 15 0 0 6
Pública Estadual / State Public 54 27 10 0 1 8
Total – Públicas / Total – Public schools 51 29 12 0 1 7
Particular / Private 51 34 6 0 0 8
SÉRIEGRADE
4a série / 5o ano do Ensino Fundamental4th grade / 5th year of Elementary Education 42 37 14 0 0 7
8a série / 9o ano do Ensino Fundamental8th grade / 9th year of Elementary Education 60 23 10 1 0 6
2o ano do Ensino Médio2nd year of Secondary Education 55 27 7 0 1 9
Fonte: CGI.br/NIC.br, Centro Regional de Estudos para o Desenvolvimento da Sociedade da Informação (Cetic.br), Pesquisa Sobre o Uso das Tecnologias de Informação e Comunicação nas Escolas Brasileiras – TIC Educação 2016.Source: CGI.br/NIC.br, Regional Center for Studies on the Development of the Information Society (Cetic.br), Survey on the Use of Information and Communication Technologies in Brazilian Schools – ICT In Education 2016.
CONTINUA / CONTINUES �

ICT IN EDUCATION SURVEY 2016TABLES OF RESULTS SELECTED INDICATORS TEACHERS332
EN
GLI
SH P
OR
TUG
UÊS G12 PROFESSORES, POR PERCEPÇÃO SOBRE BARREIRAS PARA A PUBLICAÇÃO DE RECURSOS NA INTERNET
TEACHERS BY PERCEPTIONS OF BARRIERS TO PUBLISHING RESOURCES ON THE INTERNETTOTAL DE PROFESSORES USUÁRIOS DE INTERNETTOTAL NUMBER OF TEACHERS WHO ARE INTERNET USERS
Percentual (%)Percentage (%)
Uso de computador ultrapassadoOutdated computer
Dificulta muito
Strongly hinders
Dificulta um poucoHinders
Não dificulta
nadaDoes not hinder
Não sabe
Does not know
Não respondeu
Did not answer
Não modificou o conteúdo ou criou um novo a partir do conteúdo
obtido da InternetDid not
modify content or create
something new based on content obtained on the Internet
TOTAL 47 18 27 0 0 7
SEXOSEX
Feminino / Female 48 17 28 0 0 7
Masculino / Male 43 21 27 0 0 9
FAIXA ETÁRIAAGE GROUP
Até 30 anosUp to 30 years old 46 15 37 0 0 3
De 31 a 45 anos31 to 45 years old 48 18 27 0 0 7
De 46 anos ou mais46 years old or older 46 18 25 1 1 10
RENDA FAMILIARFAMILY INCOME
Até 3 SMUp to 3 MW 53 15 28 1 0 4
Mais de 3 até 5 SM3 MW to 5 MW 51 18 23 0 0 8
Mais de 5 SMMore than 5 MW 41 19 31 0 1 8
RENDA PESSOALPERSONAL INCOME
Até 3 SMUp to 3 MW 50 17 25 0 0 8
Mais de 3 até 5 SM3 MW to 5 MW 50 17 25 0 0 7
Mais de 5 SMMore than 5 MW 34 20 37 1 1 6
REGIÃOREGION
Norte / North 53 18 22 1 0 6
Centro-Oeste / Center-West 42 18 35 0 0 5
Nordeste / Northeast 44 18 25 0 0 12
Sudeste / Southeast 52 16 26 0 1 6
Sul / South 33 23 38 1 0 5
DEPENDÊNCIA ADMINISTRATIVAADMINISTRATIVE JURISDICTION
Pública Municipal / Municipal Public 44 21 28 0 1 6
Pública Estadual / State Public 49 17 25 0 0 8
Total – Públicas / Total – Public schools 47 19 27 0 0 7
Particular / Private 48 13 31 0 0 8
SÉRIEGRADE
4a série / 5o ano do Ensino Fundamental4th grade / 5th year of Elementary Education 48 21 24 0 1 7
8a série / 9o ano do Ensino Fundamental8th grade / 9th year of Elementary Education 47 15 32 1 0 6
2o ano do Ensino Médio2nd year of Secondary Education 46 17 27 0 0 9
Fonte: CGI.br/NIC.br, Centro Regional de Estudos para o Desenvolvimento da Sociedade da Informação (Cetic.br), Pesquisa Sobre o Uso das Tecnologias de Informação e Comunicação nas Escolas Brasileiras – TIC Educação 2016.Source: CGI.br/NIC.br, Regional Center for Studies on the Development of the Information Society (Cetic.br), Survey on the Use of Information and Communication Technologies in Brazilian Schools – ICT In Education 2016.
� CONTINUAÇÃO / CONTINUATION

2016 PESQUISA TIC EDUCAÇÃOPROFESSORES INDICADORES SELECIONADOS TABELAS DE RESULTADOS 333
EN
GLI
SH P
OR
TUG
UÊSG12 PROFESSORES, POR PERCEPÇÃO SOBRE BARREIRAS PARA A PUBLICAÇÃO DE RECURSOS NA INTERNET
TEACHERS BY PERCEPTIONS OF BARRIERS TO PUBLISHING RESOURCES ON THE INTERNETTOTAL DE PROFESSORES USUÁRIOS DE INTERNETTOTAL NUMBER OF TEACHERS WHO ARE INTERNET USERS
Percentual (%)Percentage (%)
Baixa velocidade de conexão à InternetLow speed of connection to the Internet
Dificulta muito
Strongly hinders
Dificulta um poucoHinders
Não dificulta
nadaDoes not hinder
Não sabe
Does not know
Não respondeu
Did not answer
Não modificou o conteúdo ou criou um novo a partir do conteúdo
obtido da InternetDid not
modify content or create
something new based on content obtained on the Internet
TOTAL 46 24 23 0 0 7
SEXOSEX
Feminino / Female 46 24 22 0 0 7
Masculino / Male 45 22 23 0 1 9
FAIXA ETÁRIAAGE GROUP
Até 30 anosUp to 30 years old 40 30 27 0 0 3
De 31 a 45 anos31 to 45 years old 48 22 22 0 0 7
De 46 anos ou mais46 years old or older 44 23 22 0 1 10
RENDA FAMILIARFAMILY INCOME
Até 3 SMUp to 3 MW 52 21 23 0 0 4
Mais de 3 até 5 SM3 MW to 5 MW 50 23 19 0 0 8
Mais de 5 SMMore than 5 MW 41 25 25 0 1 8
RENDA PESSOALPERSONAL INCOME
Até 3 SMUp to 3 MW 50 24 18 0 0 8
Mais de 3 até 5 SM3 MW to 5 MW 43 25 24 0 1 7
Mais de 5 SMMore than 5 MW 41 23 29 1 0 6
REGIÃOREGION
Norte / North 58 25 10 0 0 6
Centro-Oeste / Center-West 49 22 23 0 0 5
Nordeste / Northeast 49 21 18 0 0 12
Sudeste / Southeast 44 24 25 0 0 6
Sul / South 34 27 32 1 0 5
DEPENDÊNCIA ADMINISTRATIVAADMINISTRATIVE JURISDICTION
Pública Municipal / Municipal Public 44 27 23 0 0 6
Pública Estadual / State Public 48 23 21 0 0 8
Total – Públicas / Total – Public schools 46 24 22 0 0 7
Particular / Private 45 20 27 0 0 8
SÉRIEGRADE
4a série / 5o ano do Ensino Fundamental4th grade / 5th year of Elementary Education 46 28 20 0 0 7
8a série / 9o ano do Ensino Fundamental8th grade / 9th year of Elementary Education 48 20 25 0 1 6
2o ano do Ensino Médio2nd year of Secondary Education 44 22 24 0 0 9
Fonte: CGI.br/NIC.br, Centro Regional de Estudos para o Desenvolvimento da Sociedade da Informação (Cetic.br), Pesquisa Sobre o Uso das Tecnologias de Informação e Comunicação nas Escolas Brasileiras – TIC Educação 2016.Source: CGI.br/NIC.br, Regional Center for Studies on the Development of the Information Society (Cetic.br), Survey on the Use of Information and Communication Technologies in Brazilian Schools – ICT In Education 2016.
� CONTINUAÇÃO / CONTINUATION

ICT IN EDUCATION SURVEY 2016TABLES OF RESULTS SELECTED INDICATORS TEACHERS334
EN
GLI
SH P
OR
TUG
UÊS G12 PROFESSORES, POR PERCEPÇÃO SOBRE BARREIRAS PARA A PUBLICAÇÃO DE RECURSOS NA INTERNET
TEACHERS BY PERCEPTIONS OF BARRIERS TO PUBLISHING RESOURCES ON THE INTERNETTOTAL DE PROFESSORES USUÁRIOS DE INTERNETTOTAL NUMBER OF TEACHERS WHO ARE INTERNET USERS
Percentual (%)Percentage (%)
Receio de se exporConcerns about self-exposure
Dificulta muito
Strongly hinders
Dificulta um poucoHinders
Não dificulta
nadaDoes not hinder
Não sabe
Does not know
Não respondeu
Did not answer
Não modificou o conteúdo ou criou um novo a partir do conteúdo
obtido da InternetDid not
modify content or create
something new based on content obtained on the Internet
TOTAL 33 33 25 1 1 7
SEXOSEX
Feminino / Female 35 33 23 1 1 7
Masculino / Male 28 30 33 0 0 9
FAIXA ETÁRIAAGE GROUP
Até 30 anosUp to 30 years old 23 45 29 0 0 3
De 31 a 45 anos31 to 45 years old 34 30 27 0 1 7
De 46 anos ou mais46 years old or older 36 32 21 1 1 10
RENDA FAMILIARFAMILY INCOME
Até 3 SMUp to 3 MW 35 43 16 0 2 4
Mais de 3 até 5 SM3 MW to 5 MW 37 30 24 0 1 8
Mais de 5 SMMore than 5 MW 30 31 30 1 0 8
RENDA PESSOALPERSONAL INCOME
Até 3 SMUp to 3 MW 35 36 19 1 1 8
Mais de 3 até 5 SM3 MW to 5 MW 31 33 27 0 1 7
Mais de 5 SMMore than 5 MW 32 25 36 1 0 6
REGIÃOREGION
Norte / North 35 34 23 0 0 6
Centro-Oeste / Center-West 30 34 31 1 0 5
Nordeste / Northeast 32 33 22 0 1 12
Sudeste / Southeast 38 31 24 1 1 6
Sul / South 21 34 38 1 2 5
DEPENDÊNCIA ADMINISTRATIVAADMINISTRATIVE JURISDICTION
Pública Municipal / Municipal Public 37 34 23 0 1 6
Pública Estadual / State Public 33 28 29 1 1 8
Total – Públicas / Total – Public schools 35 30 27 1 1 7
Particular / Private 28 41 21 0 0 8
SÉRIEGRADE
4a série / 5o ano do Ensino Fundamental4th grade / 5th year of Elementary Education 36 38 18 0 1 7
8a série / 9o ano do Ensino Fundamental8th grade / 9th year of Elementary Education 35 29 29 1 0 6
2o ano do Ensino Médio2nd year of Secondary Education 28 29 32 1 1 9
Fonte: CGI.br/NIC.br, Centro Regional de Estudos para o Desenvolvimento da Sociedade da Informação (Cetic.br), Pesquisa Sobre o Uso das Tecnologias de Informação e Comunicação nas Escolas Brasileiras – TIC Educação 2016.Source: CGI.br/NIC.br, Regional Center for Studies on the Development of the Information Society (Cetic.br), Survey on the Use of Information and Communication Technologies in Brazilian Schools – ICT In Education 2016.
� CONTINUAÇÃO / CONTINUATION

2016 PESQUISA TIC EDUCAÇÃOPROFESSORES INDICADORES SELECIONADOS TABELAS DE RESULTADOS 335
EN
GLI
SH P
OR
TUG
UÊSG12 PROFESSORES, POR PERCEPÇÃO SOBRE BARREIRAS PARA A PUBLICAÇÃO DE RECURSOS NA INTERNET
TEACHERS BY PERCEPTIONS OF BARRIERS TO PUBLISHING RESOURCES ON THE INTERNETTOTAL DE PROFESSORES USUÁRIOS DE INTERNETTOTAL NUMBER OF TEACHERS WHO ARE INTERNET USERS
Percentual (%)Percentage (%)
Falta de conhecimento sobre onde publicarLack of knowledge about where to publish
Dificulta muito
Strongly hinders
Dificulta um poucoHinders
Não dificulta
nadaDoes not hinder
Não sabe
Does not know
Não respondeu
Did not answer
Não modificou o conteúdo ou criou um novo a partir do conteúdo
obtido da InternetDid not
modify content or create
something new based on content obtained on the Internet
TOTAL 32 41 20 0 0 7
SEXOSEX
Feminino / Female 32 41 19 0 0 7
Masculino / Male 31 39 20 0 1 9
FAIXA ETÁRIAAGE GROUP
Até 30 anosUp to 30 years old 26 42 29 0 0 3
De 31 a 45 anos31 to 45 years old 30 43 20 0 0 7
De 46 anos ou mais46 years old or older 37 36 16 0 1 10
RENDA FAMILIARFAMILY INCOME
Até 3 SMUp to 3 MW 34 44 18 0 0 4
Mais de 3 até 5 SM3 MW to 5 MW 37 40 15 0 0 8
Mais de 5 SMMore than 5 MW 27 40 23 0 1 8
RENDA PESSOALPERSONAL INCOME
Até 3 SMUp to 3 MW 34 43 15 0 0 8
Mais de 3 até 5 SM3 MW to 5 MW 32 40 19 0 1 7
Mais de 5 SMMore than 5 MW 28 36 28 1 1 6
REGIÃOREGION
Norte / North 42 35 16 1 0 6
Centro-Oeste / Center-West 33 33 29 0 0 5
Nordeste / Northeast 32 37 20 0 0 12
Sudeste / Southeast 30 45 18 0 1 6
Sul / South 30 40 24 1 0 5
DEPENDÊNCIA ADMINISTRATIVAADMINISTRATIVE JURISDICTION
Pública Municipal / Municipal Public 30 40 22 0 1 6
Pública Estadual / State Public 34 40 17 0 0 8
Total – Públicas / Total – Public schools 33 40 19 0 1 7
Particular / Private 28 42 22 0 0 8
SÉRIEGRADE
4a série / 5o ano do Ensino Fundamental4th grade / 5th year of Elementary Education 29 43 20 0 1 7
8a série / 9o ano do Ensino Fundamental8th grade / 9th year of Elementary Education 33 38 22 0 1 6
2o ano do Ensino Médio2nd year of Secondary Education 33 40 17 1 0 9
Fonte: CGI.br/NIC.br, Centro Regional de Estudos para o Desenvolvimento da Sociedade da Informação (Cetic.br), Pesquisa Sobre o Uso das Tecnologias de Informação e Comunicação nas Escolas Brasileiras – TIC Educação 2016.Source: CGI.br/NIC.br, Regional Center for Studies on the Development of the Information Society (Cetic.br), Survey on the Use of Information and Communication Technologies in Brazilian Schools – ICT In Education 2016.
� CONTINUAÇÃO / CONTINUATION

ICT IN EDUCATION SURVEY 2016TABLES OF RESULTS SELECTED INDICATORS TEACHERS336
EN
GLI
SH P
OR
TUG
UÊS G12 PROFESSORES, POR PERCEPÇÃO SOBRE BARREIRAS PARA A PUBLICAÇÃO DE RECURSOS NA INTERNET
TEACHERS BY PERCEPTIONS OF BARRIERS TO PUBLISHING RESOURCES ON THE INTERNETTOTAL DE PROFESSORES USUÁRIOS DE INTERNETTOTAL NUMBER OF TEACHERS WHO ARE INTERNET USERS
Percentual (%)Percentage (%)
Programas para criar e produzir conteúdosPrograms to create or produce content
Dificulta muito
Strongly hinders
Dificulta um poucoHinders
Não dificulta
nadaDoes not hinder
Não sabe
Does not know
Não respondeu
Did not answer
Não modificou o conteúdo ou criou um novo a partir do conteúdo
obtido da InternetDid not
modify content or create
something new based on content obtained on the Internet
TOTAL 31 39 22 1 0 7
SEXOSEX
Feminino / Female 30 40 21 1 0 7
Masculino / Male 32 34 23 1 1 9
FAIXA ETÁRIAAGE GROUP
Até 30 anosUp to 30 years old 29 37 32 0 0 3
De 31 a 45 anos31 to 45 years old 34 39 19 1 0 7
De 46 anos ou mais46 years old or older 26 39 23 1 1 10
RENDA FAMILIARFAMILY INCOME
Até 3 SMUp to 3 MW 28 48 20 0 0 4
Mais de 3 até 5 SM3 MW to 5 MW 32 41 20 1 0 8
Mais de 5 SMMore than 5 MW 30 35 24 1 1 8
RENDA PESSOALPERSONAL INCOME
Até 3 SMUp to 3 MW 30 43 18 0 0 8
Mais de 3 até 5 SM3 MW to 5 MW 32 35 24 1 1 7
Mais de 5 SMMore than 5 MW 26 39 26 2 1 6
REGIÃOREGION
Norte / North 43 32 17 1 0 6
Centro-Oeste / Center-West 37 31 24 3 0 5
Nordeste / Northeast 32 38 18 0 0 12
Sudeste / Southeast 28 42 22 1 1 6
Sul / South 25 38 30 1 0 5
DEPENDÊNCIA ADMINISTRATIVAADMINISTRATIVE JURISDICTION
Pública Municipal / Municipal Public 33 38 21 1 1 6
Pública Estadual / State Public 33 35 22 1 0 8
Total – Públicas / Total – Public schools 33 36 22 1 1 7
Particular / Private 20 49 21 1 0 8
SÉRIEGRADE
4a série / 5o ano do Ensino Fundamental4th grade / 5th year of Elementary Education 28 44 20 0 1 7
8a série / 9o ano do Ensino Fundamental8th grade / 9th year of Elementary Education 34 34 23 1 1 6
2o ano do Ensino Médio2nd year of Secondary Education 29 37 22 1 0 9
Fonte: CGI.br/NIC.br, Centro Regional de Estudos para o Desenvolvimento da Sociedade da Informação (Cetic.br), Pesquisa Sobre o Uso das Tecnologias de Informação e Comunicação nas Escolas Brasileiras – TIC Educação 2016.Source: CGI.br/NIC.br, Regional Center for Studies on the Development of the Information Society (Cetic.br), Survey on the Use of Information and Communication Technologies in Brazilian Schools – ICT In Education 2016.
� CONTINUAÇÃO / CONTINUATION

2016 PESQUISA TIC EDUCAÇÃOPROFESSORES INDICADORES SELECIONADOS TABELAS DE RESULTADOS 337
EN
GLI
SH P
OR
TUG
UÊSG12 PROFESSORES, POR PERCEPÇÃO SOBRE BARREIRAS PARA A PUBLICAÇÃO DE RECURSOS NA INTERNET
TEACHERS BY PERCEPTIONS OF BARRIERS TO PUBLISHING RESOURCES ON THE INTERNETTOTAL DE PROFESSORES USUÁRIOS DE INTERNETTOTAL NUMBER OF TEACHERS WHO ARE INTERNET USERS
Percentual (%)Percentage (%)
Receio sobre violação de direitos autoraisConcerns about copyright infringement
Dificulta muito
Strongly hinders
Dificulta um poucoHinders
Não dificulta
nadaDoes not hinder
Não sabe
Does not know
Não respondeu
Did not answer
Não modificou o conteúdo ou criou um novo a partir do conteúdo
obtido da InternetDid not
modify content or create
something new based on content obtained on the Internet
TOTAL 29 36 24 3 2 7
SEXOSEX
Feminino / Female 28 36 24 3 1 7
Masculino / Male 29 37 23 0 2 9
FAIXA ETÁRIAAGE GROUP
Até 30 anosUp to 30 years old 28 32 35 0 1 3
De 31 a 45 anos31 to 45 years old 28 39 23 2 1 7
De 46 anos ou mais46 years old or older 30 32 21 6 2 10
RENDA FAMILIARFAMILY INCOME
Até 3 SMUp to 3 MW 32 41 20 2 1 4
Mais de 3 até 5 SM3 MW to 5 MW 28 39 22 0 2 8
Mais de 5 SMMore than 5 MW 27 32 26 5 2 8
RENDA PESSOALPERSONAL INCOME
Até 3 SMUp to 3 MW 30 41 19 2 1 8
Mais de 3 até 5 SM3 MW to 5 MW 28 34 27 1 2 7
Mais de 5 SMMore than 5 MW 26 30 27 8 2 6
REGIÃOREGION
Norte / North 27 45 18 2 2 6
Centro-Oeste / Center-West 33 29 31 2 1 5
Nordeste / Northeast 33 33 21 1 0 12
Sudeste / Southeast 28 37 23 4 2 6
Sul / South 21 36 33 4 2 5
DEPENDÊNCIA ADMINISTRATIVAADMINISTRATIVE JURISDICTION
Pública Municipal / Municipal Public 32 33 23 5 2 6
Pública Estadual / State Public 29 33 27 2 1 8
Total – Públicas / Total – Public schools 30 33 25 3 2 7
Particular / Private 23 49 19 1 1 8
SÉRIEGRADE
4a série / 5o ano do Ensino Fundamental4th grade / 5th year of Elementary Education 30 43 18 2 1 7
8a série / 9o ano do Ensino Fundamental8th grade / 9th year of Elementary Education 30 32 27 4 1 6
2o ano do Ensino Médio2nd year of Secondary Education 26 32 28 2 2 9
Fonte: CGI.br/NIC.br, Centro Regional de Estudos para o Desenvolvimento da Sociedade da Informação (Cetic.br), Pesquisa Sobre o Uso das Tecnologias de Informação e Comunicação nas Escolas Brasileiras – TIC Educação 2016.Source: CGI.br/NIC.br, Regional Center for Studies on the Development of the Information Society (Cetic.br), Survey on the Use of Information and Communication Technologies in Brazilian Schools – ICT In Education 2016.
� CONTINUAÇÃO / CONTINUATION
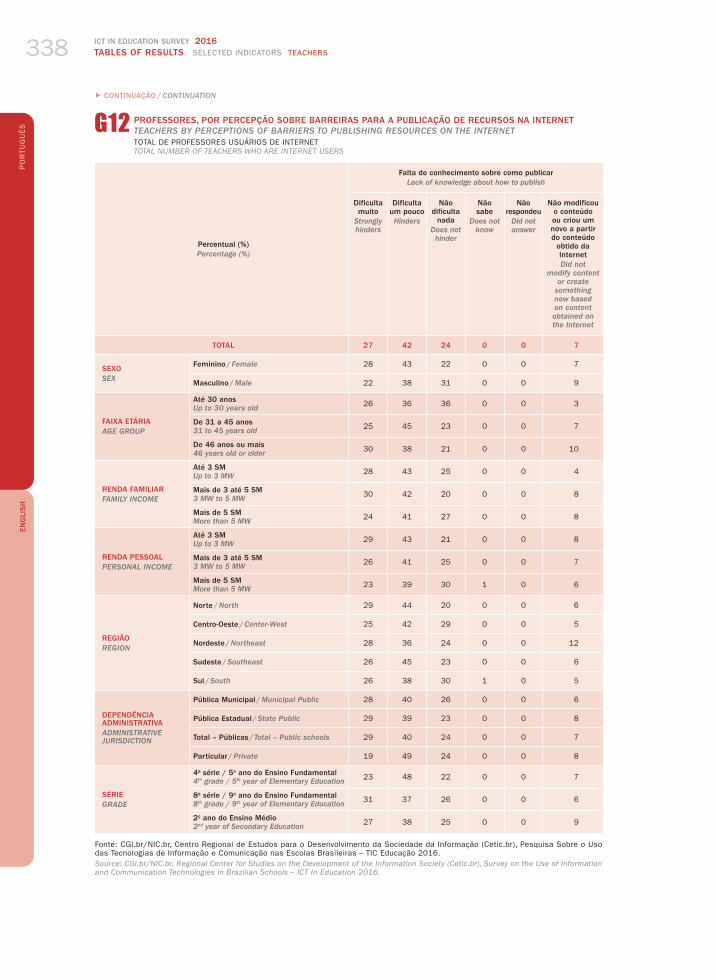
ICT IN EDUCATION SURVEY 2016TABLES OF RESULTS SELECTED INDICATORS TEACHERS338
EN
GLI
SH P
OR
TUG
UÊS G12 PROFESSORES, POR PERCEPÇÃO SOBRE BARREIRAS PARA A PUBLICAÇÃO DE RECURSOS NA INTERNET
TEACHERS BY PERCEPTIONS OF BARRIERS TO PUBLISHING RESOURCES ON THE INTERNETTOTAL DE PROFESSORES USUÁRIOS DE INTERNETTOTAL NUMBER OF TEACHERS WHO ARE INTERNET USERS
Percentual (%)Percentage (%)
Falta de conhecimento sobre como publicarLack of knowledge about how to publish
Dificulta muito
Strongly hinders
Dificulta um poucoHinders
Não dificulta
nadaDoes not hinder
Não sabe
Does not know
Não respondeu
Did not answer
Não modificou o conteúdo ou criou um novo a partir do conteúdo
obtido da InternetDid not
modify content or create
something new based on content obtained on the Internet
TOTAL 27 42 24 0 0 7
SEXOSEX
Feminino / Female 28 43 22 0 0 7
Masculino / Male 22 38 31 0 0 9
FAIXA ETÁRIAAGE GROUP
Até 30 anosUp to 30 years old 26 36 36 0 0 3
De 31 a 45 anos31 to 45 years old 25 45 23 0 0 7
De 46 anos ou mais46 years old or older 30 38 21 0 0 10
RENDA FAMILIARFAMILY INCOME
Até 3 SMUp to 3 MW 28 43 25 0 0 4
Mais de 3 até 5 SM3 MW to 5 MW 30 42 20 0 0 8
Mais de 5 SMMore than 5 MW 24 41 27 0 0 8
RENDA PESSOALPERSONAL INCOME
Até 3 SMUp to 3 MW 29 43 21 0 0 8
Mais de 3 até 5 SM3 MW to 5 MW 26 41 25 0 0 7
Mais de 5 SMMore than 5 MW 23 39 30 1 0 6
REGIÃOREGION
Norte / North 29 44 20 0 0 6
Centro-Oeste / Center-West 25 42 29 0 0 5
Nordeste / Northeast 28 36 24 0 0 12
Sudeste / Southeast 26 45 23 0 0 6
Sul / South 26 38 30 1 0 5
DEPENDÊNCIA ADMINISTRATIVAADMINISTRATIVE JURISDICTION
Pública Municipal / Municipal Public 28 40 26 0 0 6
Pública Estadual / State Public 29 39 23 0 0 8
Total – Públicas / Total – Public schools 29 40 24 0 0 7
Particular / Private 19 49 24 0 0 8
SÉRIEGRADE
4a série / 5o ano do Ensino Fundamental4th grade / 5th year of Elementary Education 23 48 22 0 0 7
8a série / 9o ano do Ensino Fundamental8th grade / 9th year of Elementary Education 31 37 26 0 0 6
2o ano do Ensino Médio2nd year of Secondary Education 27 38 25 0 0 9
Fonte: CGI.br/NIC.br, Centro Regional de Estudos para o Desenvolvimento da Sociedade da Informação (Cetic.br), Pesquisa Sobre o Uso das Tecnologias de Informação e Comunicação nas Escolas Brasileiras – TIC Educação 2016.Source: CGI.br/NIC.br, Regional Center for Studies on the Development of the Information Society (Cetic.br), Survey on the Use of Information and Communication Technologies in Brazilian Schools – ICT In Education 2016.
� CONTINUAÇÃO / CONTINUATION

2016 PESQUISA TIC EDUCAÇÃOPROFESSORES INDICADORES SELECIONADOS TABELAS DE RESULTADOS 339
EN
GLI
SH P
OR
TUG
UÊSG12 PROFESSORES, POR PERCEPÇÃO SOBRE BARREIRAS PARA A PUBLICAÇÃO DE RECURSOS NA INTERNET
TEACHERS BY PERCEPTIONS OF BARRIERS TO PUBLISHING RESOURCES ON THE INTERNETTOTAL DE PROFESSORES USUÁRIOS DE INTERNETTOTAL NUMBER OF TEACHERS WHO ARE INTERNET USERS
Percentual (%)Percentage (%)
Não ser remuneradoIs not paid to publish
Dificulta muito
Strongly hinders
Dificulta um poucoHinders
Não dificulta
nadaDoes not hinder
Não sabe
Does not know
Não respondeu
Did not answer
Não modificou o conteúdo ou criou um novo a partir do conteúdo
obtido da InternetDid not
modify content or create
something new based on content obtained on the Internet
TOTAL 22 23 47 0 0 7
SEXOSEX
Feminino / Female 21 23 49 0 1 7
Masculino / Male 25 26 39 0 0 9
FAIXA ETÁRIAAGE GROUP
Até 30 anosUp to 30 years old 22 27 48 0 0 3
De 31 a 45 anos31 to 45 years old 22 25 45 0 0 7
De 46 anos ou mais46 years old or older 21 19 48 0 1 10
RENDA FAMILIARFAMILY INCOME
Até 3 SMUp to 3 MW 28 32 36 0 0 4
Mais de 3 até 5 SM3 MW to 5 MW 19 22 50 0 0 8
Mais de 5 SMMore than 5 MW 21 22 48 0 1 8
RENDA PESSOALPERSONAL INCOME
Até 3 SMUp to 3 MW 21 27 44 0 0 8
Mais de 3 até 5 SM3 MW to 5 MW 25 22 45 0 1 7
Mais de 5 SMMore than 5 MW 16 21 55 1 1 6
REGIÃOREGION
Norte / North 29 22 40 1 1 6
Centro-Oeste / Center-West 25 21 49 0 0 5
Nordeste / Northeast 18 22 48 0 0 12
Sudeste / Southeast 22 26 45 0 1 6
Sul / South 22 17 55 1 0 5
DEPENDÊNCIA ADMINISTRATIVAADMINISTRATIVE JURISDICTION
Pública Municipal / Municipal Public 20 19 54 0 1 6
Pública Estadual / State Public 26 25 41 0 0 8
Total – Públicas / Total – Public schools 23 22 47 0 0 7
Particular / Private 17 28 47 0 1 8
SÉRIEGRADE
4a série / 5o ano do Ensino Fundamental4th grade / 5th year of Elementary Education 16 25 51 0 1 7
8a série / 9o ano do Ensino Fundamental8th grade / 9th year of Elementary Education 24 20 49 0 0 6
2o ano do Ensino Médio2nd year of Secondary Education 27 24 39 0 0 9
Fonte: CGI.br/NIC.br, Centro Regional de Estudos para o Desenvolvimento da Sociedade da Informação (Cetic.br), Pesquisa Sobre o Uso das Tecnologias de Informação e Comunicação nas Escolas Brasileiras – TIC Educação 2016.Source: CGI.br/NIC.br, Regional Center for Studies on the Development of the Information Society (Cetic.br), Survey on the Use of Information and Communication Technologies in Brazilian Schools – ICT In Education 2016.
� CONTINUAÇÃO / CONTINUATION

ICT IN EDUCATION SURVEY 2016TABLES OF RESULTS SELECTED INDICATORS TEACHERS340
EN
GLI
SH P
OR
TUG
UÊS G12 PROFESSORES, POR PERCEPÇÃO SOBRE BARREIRAS PARA A PUBLICAÇÃO DE RECURSOS NA INTERNET
TEACHERS BY PERCEPTIONS OF BARRIERS TO PUBLISHING RESOURCES ON THE INTERNETTOTAL DE PROFESSORES USUÁRIOS DE INTERNETTOTAL NUMBER OF TEACHERS WHO ARE INTERNET USERS
Percentual (%)Percentage (%)
Falta de interesse em publicarLack of interest in publishing
Dificulta muito
Strongly hinders
Dificulta um poucoHinders
Não dificulta
nadaDoes not hinder
Não sabe
Does not know
Não respondeu
Did not answer
Não modificou o conteúdo ou criou um novo a partir do conteúdo
obtido da InternetDid not
modify content or create
something new based on content obtained on the Internet
TOTAL 21 36 35 1 0 7
SEXOSEX
Feminino / Female 22 34 36 0 0 7
Masculino / Male 17 41 32 1 0 9
FAIXA ETÁRIAAGE GROUP
Até 30 anosUp to 30 years old 24 39 35 0 0 3
De 31 a 45 anos31 to 45 years old 19 36 38 0 0 7
De 46 anos ou mais46 years old or older 23 35 31 1 1 10
RENDA FAMILIARFAMILY INCOME
Até 3 SMUp to 3 MW 19 50 26 0 0 4
Mais de 3 até 5 SM3 MW to 5 MW 19 32 41 0 0 8
Mais de 5 SMMore than 5 MW 22 33 35 1 1 8
RENDA PESSOALPERSONAL INCOME
Até 3 SMUp to 3 MW 20 38 34 0 0 8
Mais de 3 até 5 SM3 MW to 5 MW 20 35 36 1 0 7
Mais de 5 SMMore than 5 MW 22 30 39 1 1 6
REGIÃOREGION
Norte / North 20 45 28 1 0 6
Centro-Oeste / Center-West 16 37 42 0 0 5
Nordeste / Northeast 19 38 31 0 0 12
Sudeste / Southeast 23 33 37 0 0 6
Sul / South 18 34 41 1 1 5
DEPENDÊNCIA ADMINISTRATIVAADMINISTRATIVE JURISDICTION
Pública Municipal / Municipal Public 21 34 38 1 1 6
Pública Estadual / State Public 22 37 32 1 0 8
Total – Públicas / Total – Public schools 22 36 34 1 0 7
Particular / Private 17 36 39 0 0 8
SÉRIEGRADE
4a série / 5o ano do Ensino Fundamental4th grade / 5th year of Elementary Education 15 35 43 0 1 7
8a série / 9o ano do Ensino Fundamental8th grade / 9th year of Elementary Education 24 36 33 1 0 6
2o ano do Ensino Médio2nd year of Secondary Education 24 37 29 1 0 9
Fonte: CGI.br/NIC.br, Centro Regional de Estudos para o Desenvolvimento da Sociedade da Informação (Cetic.br), Pesquisa Sobre o Uso das Tecnologias de Informação e Comunicação nas Escolas Brasileiras – TIC Educação 2016.Source: CGI.br/NIC.br, Regional Center for Studies on the Development of the Information Society (Cetic.br), Survey on the Use of Information and Communication Technologies in Brazilian Schools – ICT In Education 2016.
� CONTINUAÇÃO / CONTINUATION

2016 PESQUISA TIC EDUCAÇÃOPROFESSORES INDICADORES SELECIONADOS TABELAS DE RESULTADOS 341
EN
GLI
SH P
OR
TUG
UÊSG12 PROFESSORES, POR PERCEPÇÃO SOBRE BARREIRAS PARA A PUBLICAÇÃO DE RECURSOS NA INTERNET
TEACHERS BY PERCEPTIONS OF BARRIERS TO PUBLISHING RESOURCES ON THE INTERNETTOTAL DE PROFESSORES USUÁRIOS DE INTERNETTOTAL NUMBER OF TEACHERS WHO ARE INTERNET USERS
Percentual (%)Percentage (%)
Falta de incentivo ou apoio da escolaLack of incentive or support from school
Dificulta muito
Strongly hinders
Dificulta um poucoHinders
Não dificulta
nadaDoes not hinder
Não sabe
Does not know
Não respondeu
Did not answer
Não modificou o conteúdo ou criou um novo a partir do conteúdo
obtido da InternetDid not
modify content or create
something new based on content obtained on the Internet
TOTAL 20 25 47 1 0 7
SEXOSEX
Feminino / Female 20 22 51 1 0 7
Masculino / Male 22 33 36 0 0 9
FAIXA ETÁRIAAGE GROUP
Até 30 anosUp to 30 years old 18 30 49 0 0 3
De 31 a 45 anos31 to 45 years old 21 24 47 1 0 7
De 46 anos ou mais46 years old or older 19 24 46 0 0 10
RENDA FAMILIARFAMILY INCOME
Até 3 SMUp to 3 MW 16 30 49 0 0 4
Mais de 3 até 5 SM3 MW to 5 MW 24 23 45 0 0 8
Mais de 5 SMMore than 5 MW 17 24 49 1 0 8
RENDA PESSOALPERSONAL INCOME
Até 3 SMUp to 3 MW 23 25 45 0 0 8
Mais de 3 até 5 SM3 MW to 5 MW 17 26 49 0 0 7
Mais de 5 SMMore than 5 MW 17 23 52 1 0 6
REGIÃOREGION
Norte / North 27 33 33 1 0 6
Centro-Oeste / Center-West 14 27 52 1 0 5
Nordeste / Northeast 22 28 39 0 0 12
Sudeste / Southeast 19 22 52 0 0 6
Sul / South 17 21 55 1 0 5
DEPENDÊNCIA ADMINISTRATIVAADMINISTRATIVE JURISDICTION
Pública Municipal / Municipal Public 22 25 47 0 0 6
Pública Estadual / State Public 20 26 44 1 0 8
Total – Públicas / Total – Public schools 21 26 46 0 0 7
Particular / Private 16 21 54 1 0 8
SÉRIEGRADE
4a série / 5o ano do Ensino Fundamental4th grade / 5th year of Elementary Education 18 23 52 0 0 7
8a série / 9o ano do Ensino Fundamental8th grade / 9th year of Elementary Education 22 25 47 1 0 6
2o ano do Ensino Médio2nd year of Secondary Education 20 27 43 1 0 9
Fonte: CGI.br/NIC.br, Centro Regional de Estudos para o Desenvolvimento da Sociedade da Informação (Cetic.br), Pesquisa Sobre o Uso das Tecnologias de Informação e Comunicação nas Escolas Brasileiras – TIC Educação 2016.Source: CGI.br/NIC.br, Regional Center for Studies on the Development of the Information Society (Cetic.br), Survey on the Use of Information and Communication Technologies in Brazilian Schools – ICT In Education 2016.
� CONCLUSÃO / CONCLUSION

ICT IN EDUCATION SURVEY 2016TABLES OF RESULTS SELECTED INDICATORS TEACHERS342
EN
GLI
SH P
OR
TUG
UÊS G13 PROFESSORES, POR VERIFICAÇÃO DAS PERMISSÕES DE USO DE RECURSOS OBTIDOS NA INTERNET
TEACHERS BY VERIFICATION OF PERMISSION TO USE RESOURCES OBTAINED ON THE INTERNETTOTAL DE PROFESSORES USUÁRIOS DE INTERNETTOTAL NUMBER OF TEACHERS WHO ARE INTERNET USERS
Percentual (%)Percentage (%)
SimYes
NãoNo
Não sabe
Does not know
Não respondeu
Did not answer
Não utilizou recursos
obtidos da Internet
Did not use resources
obtained on the Internet
TOTAL 62 34 1 0 4
SEXOSEX
Feminino / Female 65 31 1 0 3
Masculino / Male 51 43 0 0 5
FAIXA ETÁRIAAGE GROUP
Até 30 anosUp to 30 years old 55 43 0 0 2
De 31 a 45 anos31 to 45 years old 64 34 0 0 2
De 46 anos ou mais46 years old or older 62 30 1 0 7
RENDA FAMILIARFAMILY INCOME
Até 3 SMUp to 3 MW 59 39 2 0 1
Mais de 3 até 5 SM3 MW to 5 MW 67 31 0 0 3
Mais de 5 SMMore than 5 MW 60 35 0 0 5
RENDA PESSOALPERSONAL INCOME
Até 3 SMUp to 3 MW 64 32 1 0 2
Mais de 3 até 5 SM3 MW to 5 MW 63 32 0 0 4
Mais de 5 SMMore than 5 MW 53 42 0 0 5
REGIÃOREGION
Norte / North 64 32 0 0 4
Centro-Oeste / Center-West 67 30 1 0 2
Nordeste / Northeast 66 30 1 0 2
Sudeste / Southeast 59 37 0 0 5
Sul / South 62 35 0 0 3
DEPENDÊNCIA ADMINISTRATIVAADMINISTRATIVE JURISDICTION
Pública Municipal / Municipal Public 61 35 0 0 3
Pública Estadual / State Public 62 33 0 0 5
Total – Públicas / Total – Public schools 62 34 0 0 4
Particular / Private 63 34 2 0 1
SÉRIEGRADE
4a série / 5o ano do Ensino Fundamental4th grade / 5th year of Elementary Education 68 29 1 0 2
8a série / 9o ano do Ensino Fundamental8th grade / 9th year of Elementary Education 57 39 0 0 3
2o ano do Ensino Médio2nd year of Secondary Education 59 35 0 0 6
Fonte: CGI.br/NIC.br, Centro Regional de Estudos para o Desenvolvimento da Sociedade da Informação (Cetic.br), Pesquisa Sobre o Uso das Tecnologias de Informação e Comunicação nas Escolas Brasileiras – TIC Educação 2016.Source: CGI.br/NIC.br, Regional Center for Studies on the Development of the Information Society (Cetic.br), Survey on the Use of Information and Communication Technologies in Brazilian Schools – ICT In Education 2016.

2016 PESQUISA TIC EDUCAÇÃOPROFESSORES INDICADORES SELECIONADOS TABELAS DE RESULTADOS 343
EN
GLI
SH P
OR
TUG
UÊSG15 PROFESSORES, POR PERCEPÇÃO SOBRE A VERIFICAÇÃO DAS PERMISSÕES DE USO DE RECURSOS OBTIDOS
NA INTERNETTEACHERS BY PERCEPTIONS OF THE VERIFICATION OF PERMISSION TO USE RESOURCES OBTAINED ON THE INTERNETTOTAL DE PROFESSORES USUÁRIOS DE INTERNETTOTAL NUMBER OF TEACHERS WHO ARE INTERNET USERS
Percentual (%)Percentage (%)
Foi fácil encontrar as informaçõesIt was easy to
find the information
Foi difícil encontrar as informaçõesIt was difficult to
find the information
Não encontrou as informações
Did not find the information
TOTAL 42 16 3
SEXOSEX
Feminino / Female 44 17 3
Masculino / Male 34 14 3
FAIXA ETÁRIAAGE GROUP
Até 30 anosUp to 30 years old 33 17 5
De 31 a 45 anos31 to 45 years old 45 16 2
De 46 anos ou mais46 years old or older 40 16 4
RENDA FAMILIARFAMILY INCOME
Até 3 SMUp to 3 MW 43 13 2
Mais de 3 até 5 SM3 MW to 5 MW 46 18 2
Mais de 5 SMMore than 5 MW 39 16 5
RENDA PESSOALPERSONAL INCOME
Até 3 SMUp to 3 MW 45 16 2
Mais de 3 até 5 SM3 MW to 5 MW 42 19 2
Mais de 5 SMMore than 5 MW 34 9 8
REGIÃOREGION
Norte / North 43 20 1
Centro-Oeste / Center-West 47 16 5
Nordeste / Northeast 45 19 2
Sudeste / Southeast 41 13 3
Sul / South 36 19 6
DEPENDÊNCIA ADMINISTRATIVAADMINISTRATIVE JURISDICTION
Pública Municipal / Municipal Public 40 18 2
Pública Estadual / State Public 41 15 5
Total – Públicas / Total – Public schools 40 17 4
Particular / Private 48 14 1
SÉRIEGRADE
4a série / 5o ano do Ensino Fundamental4th grade / 5th year of Elementary Education 47 18 3
8a série / 9o ano do Ensino Fundamental8th grade / 9th year of Elementary Education 40 14 4
2o ano do Ensino Médio2nd year of Secondary Education 39 16 3
Fonte: CGI.br/NIC.br, Centro Regional de Estudos para o Desenvolvimento da Sociedade da Informação (Cetic.br), Pesquisa Sobre o Uso das Tecnologias de Informação e Comunicação nas Escolas Brasileiras – TIC Educação 2016.Source: CGI.br/NIC.br, Regional Center for Studies on the Development of the Information Society (Cetic.br), Survey on the Use of Information and Communication Technologies in Brazilian Schools – ICT In Education 2016.
CONTINUA / CONTINUES �

ICT IN EDUCATION SURVEY 2016TABLES OF RESULTS SELECTED INDICATORS TEACHERS344
EN
GLI
SH P
OR
TUG
UÊS G15 PROFESSORES, POR PERCEPÇÃO SOBRE A VERIFICAÇÃO DAS PERMISSÕES DE USO DE RECURSOS OBTIDOS
NA INTERNETTEACHERS BY PERCEPTIONS OF THE VERIFICATION OF PERMISSION TO USE RESOURCES OBTAINED ON THE INTERNETTOTAL DE PROFESSORES USUÁRIOS DE INTERNETTOTAL NUMBER OF TEACHERS WHO ARE INTERNET USERS
Percentual (%)Percentage (%)
Não sabeDoes not know
Não respondeuDid not answer
Não verificou as permissões de uso
quando obteve algum conteúdo da Internet
Did not verify the permission to use resources obtained
on the Internet
TOTAL 1 0 38
SEXOSEX
Feminino / Female 1 0 35
Masculino / Male 0 0 49
FAIXA ETÁRIAAGE GROUP
Até 30 anosUp to 30 years old 0 0 45
De 31 a 45 anos31 to 45 years old 0 0 36
De 46 anos ou mais46 years old or older 1 0 38
RENDA FAMILIARFAMILY INCOME
Até 3 SMUp to 3 MW 0 0 41
Mais de 3 até 5 SM3 MW to 5 MW 1 0 33
Mais de 5 SMMore than 5 MW 1 0 40
RENDA PESSOALPERSONAL INCOME
Até 3 SMUp to 3 MW 0 0 36
Mais de 3 até 5 SM3 MW to 5 MW 1 0 37
Mais de 5 SMMore than 5 MW 1 0 47
REGIÃOREGION
Norte / North 0 0 36
Centro-Oeste / Center-West 0 0 33
Nordeste / Northeast 0 0 34
Sudeste / Southeast 1 0 41
Sul / South 1 0 38
DEPENDÊNCIA ADMINISTRATIVAADMINISTRATIVE JURISDICTION
Pública Municipal / Municipal Public 1 0 39
Pública Estadual / State Public 1 0 38
Total – Públicas / Total – Public schools 1 0 38
Particular / Private 0 0 37
SÉRIEGRADE
4a série / 5o ano do Ensino Fundamental4th grade / 5th year of Elementary Education 1 0 32
8a série / 9o ano do Ensino Fundamental8th grade / 9th year of Elementary Education 0 0 43
2o ano do Ensino Médio2nd year of Secondary Education 1 0 41
Fonte: CGI.br/NIC.br, Centro Regional de Estudos para o Desenvolvimento da Sociedade da Informação (Cetic.br), Pesquisa Sobre o Uso das Tecnologias de Informação e Comunicação nas Escolas Brasileiras – TIC Educação 2016.Source: CGI.br/NIC.br, Regional Center for Studies on the Development of the Information Society (Cetic.br), Survey on the Use of Information and Communication Technologies in Brazilian Schools – ICT In Education 2016.
� CONCLUSÃO / CONCLUSION
TABELAS DE RESULTADOS
INDICADORES SELECIONADOS PARA ALUNOS, COORDENADORES
PEDAGÓGICOS, DIRETORES E ESCOLAS
TABLES OF RESULTS
SELECTED INDICATORS FOR STUDENTS, DIRECTORS OF STUDIES,
PRINCIPALS AND SCHOOLS


2016 PESQUISA TIC EDUCAÇÃOALUNOS INDICADORES SELECIONADOS TABELAS DE RESULTADOS 347
EN
GLI
SH P
OR
TUG
UÊSB4 ALUNOS QUE JÁ ACESSARAM A INTERNET, POR ÚLTIMO ACESSO
STUDENTS WHO HAVE ACCESSED THE INTERNET, BY LAST ACCESSTOTAL DE ALUNOSTOTAL NUMBER OF STUDENTS
Percentual (%)Percentage (%)
Há menos de 3 meses ¹Less than
3 months ago ¹
Há mais de 3 meses
More than 3 months ago
Não utiliza Internet
Has not used the Internet
TOTAL 85 9 5
SEXOSEX
Feminino / Female 86 8 5
Masculino / Male 84 10 5
REGIÃOREGION
Norte / North 71 13 16
Centro-Oeste / Center-West 88 10 2
Nordeste / Northeast 82 8 10
Sudeste / Southeast 89 9 2
Sul / South 86 11 3
DEPENDÊNCIA ADMINISTRATIVAADMINISTRATIVE JURISDICTION
Pública Municipal / Municipal Public 75 14 11
Pública Estadual / State Public 91 7 2
Total – Públicas / Total – Public schools 84 10 6
Particular / Private 94 5 0
SÉRIEGRADE
4a série / 5o ano do Ensino Fundamental4th grade / 5th year of Elementary Education 74 15 11
8a série / 9o ano do Ensino Fundamental8th grade / 9th year of Elementary Education 90 8 2
2o ano do Ensino Médio2nd year of Secondary Education 94 5 2
Fonte: CGI.br/NIC.br, Centro Regional de Estudos para Desenvolvimento da Sociedade da Informação (Cetic.br), Pesquisa Sobre o Uso das Tecnologias de Informação e Comunicação nas Escolas Brasileiras – TIC Educação 2016.Source: CGI.br/NIC.br, Regional Center for Studies on the Development of the Information Society (Cetic.br), Survey on the Use of Information and Communication Technologies in Brazilian Schools – ICT In Education 2016.1 Considera-se usuário aquele que utilizou a Internet pelo menos uma vez nos três meses que antecederam a entrevista.¹ Users are defined as individuals who have used the Internet at least once in the three months prior to the interview.

ICT IN EDUCATION SURVEY 2016TABLES OF RESULTS SELECTED INDICATORS STUDENTS348
EN
GLI
SH P
OR
TUG
UÊS B4A ALUNOS, POR FREQUÊNCIA DE ACESSO À INTERNET
STUDENTS BY FREQUENCY OF INTERNET ACCESSTOTAL DE ALUNOS USUÁRIOS DE INTERNETTOTAL NUMBER OF STUDENTS WHO USE THE INTERNET
Percentual (%)Percentage (%)
Mais de uma vez por dia
More than once a day
Pelo menos uma vez por diaAt least
once a day
Pelo menos uma vez
por semanaAt least
once a week
Pelo menos uma vez por mêsAt least
once a month
Menos de uma vez por mêsLess than
once a month
TOTAL 68 19 9 2 2
SEXOSEX
Feminino / Female 69 18 9 2 2
Masculino / Male 67 20 9 2 2
REGIÃOREGION
Norte / North 52 20 18 5 5
Centro-Oeste / Center-West 69 19 7 2 3
Nordeste / Northeast 58 25 12 3 2
Sudeste / Southeast 76 15 6 1 2
Sul / South 67 20 9 2 2
DEPENDÊNCIA ADMINISTRATIVAADMINISTRATIVE JURISDICTION
Pública Municipal / Municipal Public 54 23 14 4 5
Pública Estadual / State Public 75 16 6 1 1
Total – Públicas / Total – Public schools 67 18 9 2 3
Particular / Private 72 20 6 1 1
SÉRIEGRADE
4a série / 5o ano do Ensino Fundamental4th grade / 5th year of Elementary Education 45 28 17 4 5
8a série / 9o ano do Ensino Fundamental8th grade / 9th year of Elementary Education 75 16 6 2 1
2o ano do Ensino Médio2nd year of Secondary Education 82 13 4 1 0
Fonte: CGI.br/NIC.br, Centro Regional de Estudos para Desenvolvimento da Sociedade da Informação (Cetic.br), Pesquisa Sobre o Uso das Tecnologias de Informação e Comunicação nas Escolas Brasileiras – TIC Educação 2016.Source: CGI.br/NIC.br, Regional Center for Studies on the Development of the Information Society (Cetic.br), Survey on the Use of Information and Communication Technologies in Brazilian Schools – ICT In Education 2016.

2016 PESQUISA TIC EDUCAÇÃOALUNOS INDICADORES SELECIONADOS TABELAS DE RESULTADOS 349
EN
GLI
SH P
OR
TUG
UÊSB10 ALUNOS, POR LOCAL DE ACESSO À INTERNET
STUDENTS BY LOCATIONS OF INTERNET ACCESSTOTAL DE ALUNOS USUÁRIOS DE INTERNETTOTAL NUMBER OF STUDENTS WHO USE THE INTERNET
Percentual (%)Percentage (%)
Sala de casa ou outro lugar que não seja
o quartoLiving room
(or other public room)
at home
Casa de outra pessoa
Someone else’s house
QuartoBedroom
Outro local, como shopping,
igreja ou lanchoneteElsewhere,
e.g. shopping mall, church,
café
TOTAL 88 87 75 55
SEXOSEX
Feminino / Female 90 87 77 56
Masculino / Male 86 86 74 55
REGIÃOREGION
Norte / North 83 85 63 53
Centro-Oeste / Center-West 87 89 73 60
Nordeste / Northeast 82 85 65 44
Sudeste / Southeast 90 87 82 60
Sul / South 91 87 79 59
DEPENDÊNCIA ADMINISTRATIVAADMINISTRATIVE JURISDICTION
Pública Municipal / Municipal Public 83 81 63 44
Pública Estadual / State Public 89 89 80 60
Total – Públicas / Total – Public schools 87 86 73 54
Particular / Private 92 89 86 62
SÉRIEGRADE
4a série / 5o ano do Ensino Fundamental4th grade / 5th year of Elementary Education 83 78 59 39
8a série / 9o ano do Ensino Fundamental8th grade / 9th year of Elementary Education 89 90 80 59
2o ano do Ensino Médio2nd year of Secondary Education 91 91 85 66
Fonte: CGI.br/NIC.br, Centro Regional de Estudos para Desenvolvimento da Sociedade da Informação (Cetic.br), Pesquisa Sobre o Uso das Tecnologias de Informação e Comunicação nas Escolas Brasileiras – TIC Educação 2016.Source: CGI.br/NIC.br, Regional Center for Studies on the Development of the Information Society (Cetic.br), Survey on the Use of Information and Communication Technologies in Brazilian Schools – ICT In Education 2016.
CONTINUA / CONTINUES �

ICT IN EDUCATION SURVEY 2016TABLES OF RESULTS SELECTED INDICATORS STUDENTS350
EN
GLI
SH P
OR
TUG
UÊS B10 ALUNOS, POR LOCAL DE ACESSO À INTERNET
STUDENTS BY LOCATIONS OF INTERNET ACCESSTOTAL DE ALUNOS USUÁRIOS DE INTERNETTOTAL NUMBER OF STUDENTS WHO USE THE INTERNET
Percentual (%)Percentage (%)
Em deslocamentoOn the move
EscolaSchool
Lanhouse ou cybercaféLAN house
or cybercafe
TelecentroTelecenter
TOTAL 49 39 28 16
SEXOSEX
Feminino / Female 51 42 24 13
Masculino / Male 48 36 32 19
REGIÃOREGION
Norte / North 39 30 33 10
Centro-Oeste / Center-West 48 34 28 12
Nordeste / Northeast 35 30 29 10
Sudeste / Southeast 57 44 27 20
Sul / South 53 46 27 18
DEPENDÊNCIA ADMINISTRATIVAADMINISTRATIVE JURISDICTION
Pública Municipal / Municipal Public 40 25 27 14
Pública Estadual / State Public 56 47 29 16
Total – Públicas / Total – Public schools 49 38 28 16
Particular / Private 49 43 25 19
SÉRIEGRADE
4a série / 5o ano do Ensino Fundamental4th grade / 5th year of Elementary Education 32 19 25 10
8a série / 9o ano do Ensino Fundamental8th grade / 9th year of Elementary Education 52 41 29 18
2o ano do Ensino Médio2nd year of Secondary Education 61 55 30 20
Fonte: CGI.br/NIC.br, Centro Regional de Estudos para Desenvolvimento da Sociedade da Informação (Cetic.br), Pesquisa Sobre o Uso das Tecnologias de Informação e Comunicação nas Escolas Brasileiras – TIC Educação 2016.Source: CGI.br/NIC.br, Regional Center for Studies on the Development of the Information Society (Cetic.br), Survey on the Use of Information and Communication Technologies in Brazilian Schools – ICT In Education 2016.
� CONCLUSÃO / CONCLUSION

2016 PESQUISA TIC EDUCAÇÃOALUNOS INDICADORES SELECIONADOS TABELAS DE RESULTADOS 351
EN
GLI
SH P
OR
TUG
UÊSB15 ALUNOS, POR EQUIPAMENTOS UTILIZADOS PARA ACESSAR A INTERNET
STUDENTS BY DEVICES USED TO ACCESS THE INTERNETTOTAL DE ALUNOS USUÁRIOS DE INTERNETTOTAL NUMBER OF STUDENTS WHO USE THE INTERNET
Percentual (%)Percentage (%)
CelularMobile phone
Computador de mesaDesktop computer
Computador portátilPortable computer
TabletTablet
TOTAL 93 52 47 35
SEXOSEX
Feminino / Female 94 49 48 36
Masculino / Male 92 55 45 34
REGIÃOREGION
Norte / North 94 35 36 27
Centro-Oeste / Center-West 94 49 51 35
Nordeste / Northeast 93 38 37 31
Sudeste / Southeast 93 61 50 39
Sul / South 93 56 55 32
DEPENDÊNCIA ADMINISTRATIVAADMINISTRATIVE JURISDICTION
Pública Municipal / Municipal Public 89 46 37 34
Pública Estadual / State Public 96 53 47 30
Total – Públicas / Total – Public schools 93 50 43 31
Particular / Private 93 60 67 54
SÉRIEGRADE
4a série / 5o ano do Ensino Fundamental4th grade / 5th year of Elementary Education 87 47 40 43
8a série / 9o ano do Ensino Fundamental8th grade / 9th year of Elementary Education 95 54 48 34
2o ano do Ensino Médio2nd year of Secondary Education 97 54 51 29
Fonte: CGI.br/NIC.br, Centro Regional de Estudos para Desenvolvimento da Sociedade da Informação (Cetic.br), Pesquisa Sobre o Uso das Tecnologias de Informação e Comunicação nas Escolas Brasileiras – TIC Educação 2016.Source: CGI.br/NIC.br, Regional Center for Studies on the Development of the Information Society (Cetic.br), Survey on the Use of Information and Communication Technologies in Brazilian Schools – ICT In Education 2016.
CONTINUA / CONTINUES �

ICT IN EDUCATION SURVEY 2016TABLES OF RESULTS SELECTED INDICATORS STUDENTS352
EN
GLI
SH P
OR
TUG
UÊS B15 ALUNOS, POR EQUIPAMENTOS UTILIZADOS PARA ACESSAR A INTERNET
STUDENTS BY DEVICES USED TO ACCESS THE INTERNETTOTAL DE ALUNOS USUÁRIOS DE INTERNETTOTAL NUMBER OF STUDENTS WHO USE THE INTERNET
Percentual (%)Percentage (%)
TelevisãoTelevision set
VideogameGame console
OutroOther
TOTAL 29 26 1
SEXOSEX
Feminino / Female 27 16 0
Masculino / Male 31 37 1
REGIÃOREGION
Norte / North 19 18 1
Centro-Oeste / Center-West 35 28 1
Nordeste / Northeast 18 15 0
Sudeste / Southeast 34 32 1
Sul / South 33 29 1
DEPENDÊNCIA ADMINISTRATIVAADMINISTRATIVE JURISDICTION
Pública Municipal / Municipal Public 22 20 0
Pública Estadual / State Public 28 26 1
Total – Públicas / Total – Public schools 26 24 0
Particular / Private 46 39 1
SÉRIEGRADE
4a série / 5o ano do Ensino Fundamental4th grade / 5th year of Elementary Education 26 24 0
8a série / 9o ano do Ensino Fundamental8th grade / 9th year of Elementary Education 32 28 1
2o ano do Ensino Médio2nd year of Secondary Education 29 26 1
Fonte: CGI.br/NIC.br, Centro Regional de Estudos para Desenvolvimento da Sociedade da Informação (Cetic.br), Pesquisa Sobre o Uso das Tecnologias de Informação e Comunicação nas Escolas Brasileiras – TIC Educação 2016.Source: CGI.br/NIC.br, Regional Center for Studies on the Development of the Information Society (Cetic.br), Survey on the Use of Information and Communication Technologies in Brazilian Schools – ICT In Education 2016.
� CONCLUSÃO / CONCLUSION

2016 PESQUISA TIC EDUCAÇÃOALUNOS INDICADORES SELECIONADOS TABELAS DE RESULTADOS 353
EN
GLI
SH P
OR
TUG
UÊSE1 ALUNOS, POR USO DA INTERNET EM ATIVIDADES ESCOLARES
STUDENTS BY INTERNET USE IN SCHOOL ACTIVITIESTOTAL DE ALUNOS USUÁRIOS DE INTERNETTOTAL NUMBER OF STUDENTS WHO USE THE INTERNET
Percentual (%)Percentage (%)
Fazer pesquisa para a escola
School research
Fazer trabalhos sobre um tema
Theme assignments
Realizar trabalhos em grupo
Group assignments
Fazer lição ou exercícios
que o professor passa
Homework and exercises assigned by the teacher
TOTAL 93 90 85 82
SEXOSEX
Feminino / Female 95 91 87 82
Masculino / Male 91 88 83 81
REGIÃOREGION
Norte / North 91 86 85 81
Centro-Oeste / Center-West 92 86 85 84
Nordeste / Northeast 93 88 81 76
Sudeste / Southeast 94 92 87 84
Sul / South 92 89 86 83
DEPENDÊNCIA ADMINISTRATIVAADMINISTRATIVE JURISDICTION
Pública Municipal / Municipal Public 88 81 78 74
Pública Estadual / State Public 96 94 90 87
Total – Públicas / Total – Public schools 93 89 85 82
Particular / Private 96 92 83 81
SÉRIEGRADE
4a série / 5o ano do Ensino Fundamental4th grade / 5th year of Elementary Education 86 78 69 72
8a série / 9o ano do Ensino Fundamental8th grade / 9th year of Elementary Education 96 93 90 81
2o ano do Ensino Médio2nd year of Secondary Education 98 97 94 90
Fonte: CGI.br/NIC.br, Centro Regional de Estudos para Desenvolvimento da Sociedade da Informação (Cetic.br), Pesquisa Sobre o Uso das Tecnologias de Informação e Comunicação nas Escolas Brasileiras – TIC Educação 2016.Source: CGI.br/NIC.br, Regional Center for Studies on the Development of the Information Society (Cetic.br), Survey on the Use of Information and Communication Technologies in Brazilian Schools – ICT In Education 2016.
CONTINUA / CONTINUES �

ICT IN EDUCATION SURVEY 2016TABLES OF RESULTS SELECTED INDICATORS STUDENTS354
EN
GLI
SH P
OR
TUG
UÊS E1 ALUNOS, POR USO DA INTERNET EM ATIVIDADES ESCOLARES
STUDENTS BY INTERNET USE IN SCHOOL ACTIVITIESTOTAL DE ALUNOS USUÁRIOS DE INTERNETTOTAL NUMBER OF STUDENTS WHO USE THE INTERNET
Percentual (%)Percentage (%)
Fazer trabalhos escolares com
colegas a distânciaSchool projects
with online classmates
Fazer apresentações para colegas
de classePresentations to classmates
Jogar jogos educativosEducational
games
TOTAL 74 59 58
SEXOSEX
Feminino / Female 76 61 53
Masculino / Male 73 56 63
REGIÃOREGION
Norte / North 70 62 58
Centro-Oeste / Center-West 75 59 57
Nordeste / Northeast 74 56 58
Sudeste / Southeast 75 59 58
Sul / South 76 63 55
DEPENDÊNCIA ADMINISTRATIVAADMINISTRATIVE JURISDICTION
Pública Municipal / Municipal Public 65 48 69
Pública Estadual / State Public 80 65 49
Total – Públicas / Total – Public schools 74 58 57
Particular / Private 76 60 61
SÉRIEGRADE
4a série / 5o ano do Ensino Fundamental4th grade / 5th year of Elementary Education 54 42 81
8a série / 9o ano do Ensino Fundamental8th grade / 9th year of Elementary Education 81 61 50
2o ano do Ensino Médio2nd year of Secondary Education 86 70 44
Fonte: CGI.br/NIC.br, Centro Regional de Estudos para Desenvolvimento da Sociedade da Informação (Cetic.br), Pesquisa Sobre o Uso das Tecnologias de Informação e Comunicação nas Escolas Brasileiras – TIC Educação 2016.Source: CGI.br/NIC.br, Regional Center for Studies on the Development of the Information Society (Cetic.br), Survey on the Use of Information and Communication Technologies in Brazilian Schools – ICT In Education 2016.
� CONTINUAÇÃO / CONTINUATION

2016 PESQUISA TIC EDUCAÇÃOALUNOS INDICADORES SELECIONADOS TABELAS DE RESULTADOS 355
EN
GLI
SH P
OR
TUG
UÊSE1 ALUNOS, POR USO DA INTERNET EM ATIVIDADES ESCOLARES
STUDENTS BY INTERNET USE IN SCHOOL ACTIVITIESTOTAL DE ALUNOS USUÁRIOS DE INTERNETTOTAL NUMBER OF STUDENTS WHO USE THE INTERNET
Percentual (%)Percentage (%)
Falar com o(a) professor(a)Talking to
the teacher
Participar de cursos on-lineTaking part in online courses
Outra tarefaOther activity
TOTAL 38 24 6
SEXOSEX
Feminino / Female 39 22 5
Masculino / Male 38 25 6
REGIÃOREGION
Norte / North 34 24 11
Centro-Oeste / Center-West 32 23 4
Nordeste / Northeast 44 24 7
Sudeste / Southeast 37 24 5
Sul / South 42 21 3
DEPENDÊNCIA ADMINISTRATIVAADMINISTRATIVE JURISDICTION
Pública Municipal / Municipal Public 35 18 5
Pública Estadual / State Public 38 27 6
Total – Públicas / Total – Public schools 36 24 5
Particular / Private 49 24 8
SÉRIEGRADE
4a série / 5o ano do Ensino Fundamental4th grade / 5th year of Elementary Education 35 16 7
8a série / 9o ano do Ensino Fundamental8th grade / 9th year of Elementary Education 39 24 4
2o ano do Ensino Médio2nd year of Secondary Education 42 30 6
Fonte: CGI.br/NIC.br, Centro Regional de Estudos para Desenvolvimento da Sociedade da Informação (Cetic.br), Pesquisa Sobre o Uso das Tecnologias de Informação e Comunicação nas Escolas Brasileiras – TIC Educação 2016.Source: CGI.br/NIC.br, Regional Center for Studies on the Development of the Information Society (Cetic.br), Survey on the Use of Information and Communication Technologies in Brazilian Schools – ICT In Education 2016.
� CONCLUSÃO / CONCLUSION

ICT IN EDUCATION SURVEY 2016TABLES OF RESULTS SELECTED INDICATORS DIRECTOR OF STUDIES356
EN
GLI
SH P
OR
TUG
UÊS C1A COORDENADORES PEDAGÓGICOS, POR AÇÕES PRIORITÁRIAS PARA A INTEGRAÇÃO DO COMPUTADOR
E DA INTERNET EM PRÁTICAS PEDAGÓGICASDIRECTORS OF STUDIES BY PRIORITY ACTIONS TO INTEGRATE COMPUTERS AND THE INTERNET INTO PEDAGOGICAL ACTIVITIESTOTAL DE COORDENADORES PEDAGÓGICOSTOTAL NUMBER OF DIRECTORS OF STUDIES
Percentual (%)Percentage (%)
Desenvolver novas práticas de ensino que
envolvam o uso de computador
e InternetDeveloping
new teaching practices that
involve computer and Internet use
Aumentar o número de
computadores por alunoIncreasing the number
of computers per student
Melhorar as habilidades e competências técnicas dos
professores no uso das tecnologias
Improving teacher technical skills and
competencies in the use of these
technologies
TOTAL 24 21 20
SEXOSEX
Feminino / Female 22 23 19
Masculino / Male 37 10 27
FAIXA ETÁRIAAGE GROUP
Até 39 anosUp to 39 years old 24 22 19
De 40 a 47 anos40 to 47 years old 26 26 18
De 48 anos ou mais48 years old or older 22 15 21
RENDA FAMILIARFAMILY INCOME
Até 3 SMUp to 3 MW 35 27 23
Mais de 3 até 5 SM3 MW to 5 MW 17 22 19
Mais de 5 SMMore than 5 MW 23 19 19
RENDA PESSOALPERSONAL INCOME
Até 3 SMUp to 3 MW 34 21 21
Mais de 3 até 5 SM3 MW to 5 MW 16 26 22
Mais de 5 SMMore than 5 MW 21 14 14
REGIÃOREGION
Norte / North 19 24 19
Centro-Oeste / Center-West 15 17 24
Nordeste / Northeast 29 15 24
Sudeste / Southeast 26 25 16
Sul / South 16 26 18
DEPENDÊNCIA ADMINISTRATIVAADMINISTRATIVE JURISDICTION
Pública Municipal / Municipal Public 19 19 21
Pública Estadual / State Public 22 26 20
Total – Públicas / Total – Public schools 20 22 21
Particular / Private 35 18 17
Fonte: CGI.br/NIC.br, Centro Regional de Estudos para o Desenvolvimento da Sociedade da Informação (Cetic.br), Pesquisa Sobre o Uso das Tecnologias de Informação e Comunicação nas Escolas Brasileiras – TIC Educação 2016.Source: CGI.br/NIC.br, Regional Center for Studies on the Development of the Information Society (Cetic.br), Survey on the Use of Information and Communication Technologies in Brazilian Schools – ICT In Education 2016.
CONTINUA / CONTINUES �
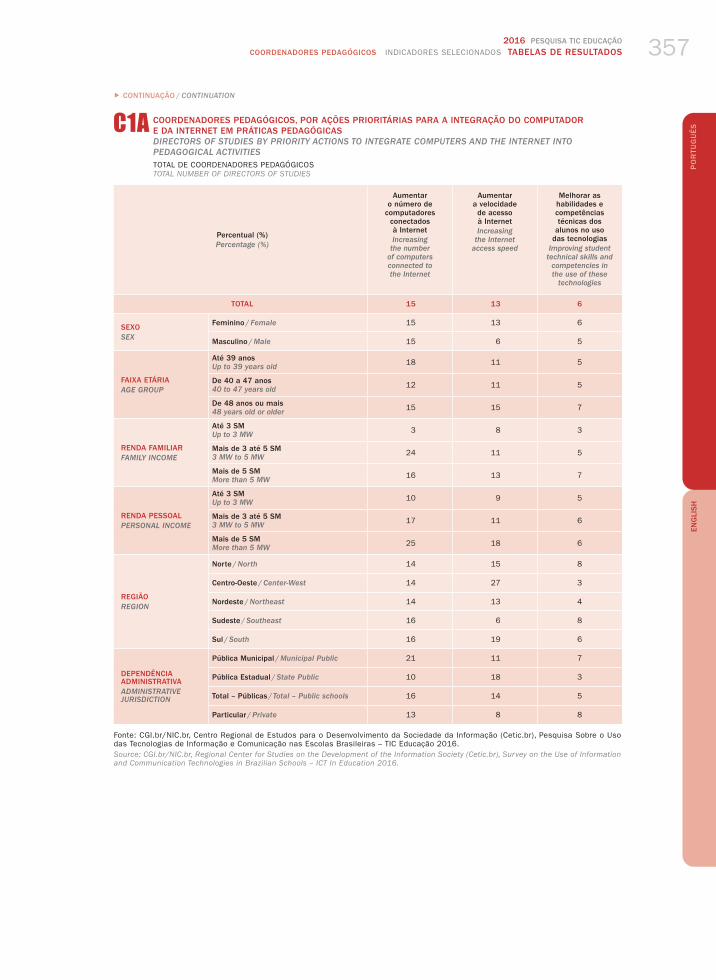
2016 PESQUISA TIC EDUCAÇÃOCOORDENADORES PEDAGÓGICOS INDICADORES SELECIONADOS TABELAS DE RESULTADOS 357
EN
GLI
SH P
OR
TUG
UÊSC1A COORDENADORES PEDAGÓGICOS, POR AÇÕES PRIORITÁRIAS PARA A INTEGRAÇÃO DO COMPUTADOR
E DA INTERNET EM PRÁTICAS PEDAGÓGICASDIRECTORS OF STUDIES BY PRIORITY ACTIONS TO INTEGRATE COMPUTERS AND THE INTERNET INTO PEDAGOGICAL ACTIVITIESTOTAL DE COORDENADORES PEDAGÓGICOSTOTAL NUMBER OF DIRECTORS OF STUDIES
Percentual (%)Percentage (%)
Aumentar o número de
computadores conectados à InternetIncreasing the number
of computers connected to the Internet
Aumentar a velocidade de acesso à InternetIncreasing
the Internet access speed
Melhorar as habilidades e competências técnicas dos
alunos no uso das tecnologias
Improving student technical skills and
competencies in the use of these
technologies
TOTAL 15 13 6
SEXOSEX
Feminino / Female 15 13 6
Masculino / Male 15 6 5
FAIXA ETÁRIAAGE GROUP
Até 39 anosUp to 39 years old 18 11 5
De 40 a 47 anos40 to 47 years old 12 11 5
De 48 anos ou mais48 years old or older 15 15 7
RENDA FAMILIARFAMILY INCOME
Até 3 SMUp to 3 MW 3 8 3
Mais de 3 até 5 SM3 MW to 5 MW 24 11 5
Mais de 5 SMMore than 5 MW 16 13 7
RENDA PESSOALPERSONAL INCOME
Até 3 SMUp to 3 MW 10 9 5
Mais de 3 até 5 SM3 MW to 5 MW 17 11 6
Mais de 5 SMMore than 5 MW 25 18 6
REGIÃOREGION
Norte / North 14 15 8
Centro-Oeste / Center-West 14 27 3
Nordeste / Northeast 14 13 4
Sudeste / Southeast 16 6 8
Sul / South 16 19 6
DEPENDÊNCIA ADMINISTRATIVAADMINISTRATIVE JURISDICTION
Pública Municipal / Municipal Public 21 11 7
Pública Estadual / State Public 10 18 3
Total – Públicas / Total – Public schools 16 14 5
Particular / Private 13 8 8
Fonte: CGI.br/NIC.br, Centro Regional de Estudos para o Desenvolvimento da Sociedade da Informação (Cetic.br), Pesquisa Sobre o Uso das Tecnologias de Informação e Comunicação nas Escolas Brasileiras – TIC Educação 2016.Source: CGI.br/NIC.br, Regional Center for Studies on the Development of the Information Society (Cetic.br), Survey on the Use of Information and Communication Technologies in Brazilian Schools – ICT In Education 2016.
� CONTINUAÇÃO / CONTINUATION

ICT IN EDUCATION SURVEY 2016TABLES OF RESULTS SELECTED INDICATORS DIRECTOR OF STUDIES358
EN
GLI
SH P
OR
TUG
UÊS C1A COORDENADORES PEDAGÓGICOS, POR AÇÕES PRIORITÁRIAS PARA A INTEGRAÇÃO DO COMPUTADOR
E DA INTERNET EM PRÁTICAS PEDAGÓGICASDIRECTORS OF STUDIES BY PRIORITY ACTIONS TO INTEGRATE COMPUTERS AND THE INTERNET INTO PEDAGOGICAL ACTIVITIESTOTAL DE COORDENADORES PEDAGÓGICOSTOTAL NUMBER OF DIRECTORS OF STUDIES
Percentual (%)Percentage (%)
OutraOther
Nenhuma dessasNone
of these
Não sabeDoes not
know
Não respondeu
Did not answer
TOTAL 1 1 0 0
SEXOSEX
Feminino / Female 1 1 0 0
Masculino / Male 0 0 0 0
FAIXA ETÁRIAAGE GROUP
Até 39 anosUp to 39 years old 0 0 0 0
De 40 a 47 anos40 to 47 years old 2 0 0 0
De 48 anos ou mais48 years old or older 0 1 1 1
RENDA FAMILIARFAMILY INCOME
Até 3 SMUp to 3 MW 0 0 0 0
Mais de 3 até 5 SM3 MW to 5 MW 2 0 0 0
Mais de 5 SMMore than 5 MW 0 1 1 0
RENDA PESSOALPERSONAL INCOME
Até 3 SMUp to 3 MW 1 0 0 0
Mais de 3 até 5 SM3 MW to 5 MW 1 1 0 0
Mais de 5 SMMore than 5 MW 0 0 1 0
REGIÃOREGION
Norte / North 1 1 0 0
Centro-Oeste / Center-West 0 0 0 0
Nordeste / Northeast 2 0 0 0
Sudeste / Southeast 0 1 1 1
Sul / South 0 0 0 0
DEPENDÊNCIA ADMINISTRATIVAADMINISTRATIVE JURISDICTION
Pública Municipal / Municipal Public 1 1 1 0
Pública Estadual / State Public 0 0 0 0
Total – Públicas / Total – Public schools 1 1 0 0
Particular / Private 0 0 0 1
Fonte: CGI.br/NIC.br, Centro Regional de Estudos para o Desenvolvimento da Sociedade da Informação (Cetic.br), Pesquisa Sobre o Uso das Tecnologias de Informação e Comunicação nas Escolas Brasileiras – TIC Educação 2016.Source: CGI.br/NIC.br, Regional Center for Studies on the Development of the Information Society (Cetic.br), Survey on the Use of Information and Communication Technologies in Brazilian Schools – ICT In Education 2016.
� CONCLUSÃO / CONCLUSION

2016 PESQUISA TIC EDUCAÇÃOCOORDENADORES PEDAGÓGICOS INDICADORES SELECIONADOS TABELAS DE RESULTADOS 359
EN
GLI
SH P
OR
TUG
UÊSC3 COORDENADORES PEDAGÓGICOS, POR INICIATIVAS REALIZADAS NO ÚLTIMO ANO EM DECORRÊNCIA
DA INTRODUÇÃO DAS TIC NA ESCOLADIRECTORS OF STUDIES BY INITIATIVES CARRIED OUT IN THE LAST YEAR AS A RESULT OF THE INTRODUCTION OF ICT IN SCHOOLTOTAL DE COORDENADORES PEDAGÓGICOSTOTAL NUMBER OF DIRECTORS OF STUDIES
Percentual (%)Percentage (%)
Discussão com os professores sobre o uso do
computador e da Internet em novas práticas de ensino
Discussing computer and Internet use in new teaching practices with
teachers
Consulta aos professores sobre suas expectativas
de mudanças na escolaConsulting
teachers about their expectations
for change at school
Debate com os alunos sobre as mudanças nas atividades
em classeCarrying out discussions
with students about changes in classroom
activities
TOTAL 79 73 65
SEXOSEX
Feminino / Female 80 73 65
Masculino / Male 73 78 62
FAIXA ETÁRIAAGE GROUP
Até 39 anosUp to 39 years old 73 71 62
De 40 a 47 anos40 to 47 years old 81 76 65
De 48 anos ou mais48 years old or older 84 72 66
RENDA FAMILIARFAMILY INCOME
Até 3 SMUp to 3 MW 82 79 83
Mais de 3 até 5 SM3 MW to 5 MW 76 75 59
Mais de 5 SMMore than 5 MW 79 70 60
RENDA PESSOALPERSONAL INCOME
Até 3 SMUp to 3 MW 80 77 73
Mais de 3 até 5 SM3 MW to 5 MW 77 74 61
Mais de 5 SMMore than 5 MW 82 65 56
REGIÃOREGION
Norte / North 68 65 59
Centro-Oeste / Center-West 81 76 64
Nordeste / Northeast 75 73 62
Sudeste / Southeast 82 71 70
Sul / South 88 84 59
DEPENDÊNCIA ADMINISTRATIVAADMINISTRATIVE JURISDICTION
Pública Municipal / Municipal Public 71 72 57
Pública Estadual / State Public 80 72 64
Total – Públicas / Total – Public schools 75 72 60
Particular / Private 91 76 78
Fonte: CGI.br/NIC.br, Centro Regional de Estudos para o Desenvolvimento da Sociedade da Informação (Cetic.br), Pesquisa Sobre o Uso das Tecnologias de Informação e Comunicação nas Escolas Brasileiras – TIC Educação 2016.Source: CGI.br/NIC.br, Regional Center for Studies on the Development of the Information Society (Cetic.br), Survey on the Use of Information and Communication Technologies in Brazilian Schools – ICT In Education 2016.
CONTINUA / CONTINUES �

ICT IN EDUCATION SURVEY 2016TABLES OF RESULTS SELECTED INDICATORS DIRECTOR OF STUDIES360
EN
GLI
SH P
OR
TUG
UÊS C3 COORDENADORES PEDAGÓGICOS, POR INICIATIVAS REALIZADAS NO ÚLTIMO ANO EM DECORRÊNCIA
DA INTRODUÇÃO DAS TIC NA ESCOLADIRECTORS OF STUDIES BY INITIATIVES CARRIED OUT IN THE LAST YEAR AS A RESULT OF THE INTRODUCTION OF ICT IN SCHOOLTOTAL DE COORDENADORES PEDAGÓGICOSTOTAL NUMBER OF DIRECTORS OF STUDIES
Percentual (%)Percentage (%)
Debate com os pais sobre as mudanças nas
atividades em classeCarrying out discussions
with parents about changes in classroom activities
Orientação aos alunos e pais sobre como utilizar a Internet com segurança
Guiding students and parents regarding
safe Internet use
TOTAL 49 59
SEXOSEX
Feminino / Female 50 57
Masculino / Male 43 73
FAIXA ETÁRIAAGE GROUP
Até 39 anosUp to 39 years old 50 60
De 40 a 47 anos40 to 47 years old 50 60
De 48 anos ou mais48 years old or older 49 56
RENDA FAMILIARFAMILY INCOME
Até 3 SMUp to 3 MW 66 63
Mais de 3 até 5 SM3 MW to 5 MW 52 61
Mais de 5 SMMore than 5 MW 39 54
RENDA PESSOALPERSONAL INCOME
Até 3 SMUp to 3 MW 58 59
Mais de 3 até 5 SM3 MW to 5 MW 47 60
Mais de 5 SMMore than 5 MW 34 54
REGIÃOREGION
Norte / North 51 46
Centro-Oeste / Center-West 48 77
Nordeste / Northeast 54 52
Sudeste / Southeast 47 63
Sul / South 44 58
DEPENDÊNCIA ADMINISTRATIVAADMINISTRATIVE JURISDICTION
Pública Municipal / Municipal Public 45 49
Pública Estadual / State Public 45 60
Total – Públicas / Total – Public schools 45 54
Particular / Private 63 71
Fonte: CGI.br/NIC.br, Centro Regional de Estudos para o Desenvolvimento da Sociedade da Informação (Cetic.br), Pesquisa Sobre o Uso das Tecnologias de Informação e Comunicação nas Escolas Brasileiras – TIC Educação 2016.Source: CGI.br/NIC.br, Regional Center for Studies on the Development of the Information Society (Cetic.br), Survey on the Use of Information and Communication Technologies in Brazilian Schools – ICT In Education 2016.
� CONCLUSÃO / CONCLUSION

2016 PESQUISA TIC EDUCAÇÃOCOORDENADORES PEDAGÓGICOS INDICADORES SELECIONADOS TABELAS DE RESULTADOS 361
EN
GLI
SH P
OR
TUG
UÊSC5 COORDENADORES PEDAGÓGICOS, POR PERCEPÇÃO SOBRE O PROJETO POLÍTICO PEDAGÓGICO DA ESCOLA
DIRECTORS OF STUDIES BY PERCEPTIONS OF THE SCHOOL’S POLITICO-PEDAGOGICAL PROJECTTOTAL DE COORDENADORES PEDAGÓGICOSTOTAL NUMBER OF DIRECTORS OF STUDIES
Percentual (%)Percentage (%)
Prevê o uso de Internet para atividades em classeProvides for Internet use in classroom activities
Contém orientações sobre como usar a Internet nas
atividades em classeIncludes guidance on how
to use the Internet in classroom activities
TOTAL 78 66
SEXOSEX
Feminino / Female 79 65
Masculino / Male 73 73
FAIXA ETÁRIAAGE GROUP
Até 39 anosUp to 39 years old 70 62
De 40 a 47 anos40 to 47 years old 82 64
De 48 anos ou mais48 years old or older 83 72
RENDA FAMILIARFAMILY INCOME
Até 3 SMUp to 3 MW 72 71
Mais de 3 até 5 SM3 MW to 5 MW 80 67
Mais de 5 SMMore than 5 MW 79 62
RENDA PESSOALPERSONAL INCOME
Até 3 SMUp to 3 MW 69 65
Mais de 3 até 5 SM3 MW to 5 MW 84 64
Mais de 5 SMMore than 5 MW 82 70
REGIÃOREGION
Norte / North 65 54
Centro-Oeste / Center-West 93 81
Nordeste / Northeast 71 63
Sudeste / Southeast 80 68
Sul / South 88 65
DEPENDÊNCIA ADMINISTRATIVAADMINISTRATIVE JURISDICTION
Pública Municipal / Municipal Public 70 55
Pública Estadual / State Public 87 63
Total – Públicas / Total – Public schools 78 59
Particular / Private 79 86
Fonte: CGI.br/NIC.br, Centro Regional de Estudos para o Desenvolvimento da Sociedade da Informação (Cetic.br), Pesquisa Sobre o Uso das Tecnologias de Informação e Comunicação nas Escolas Brasileiras – TIC Educação 2016.Source: CGI.br/NIC.br, Regional Center for Studies on the Development of the Information Society (Cetic.br), Survey on the Use of Information and Communication Technologies in Brazilian Schools – ICT In Education 2016.
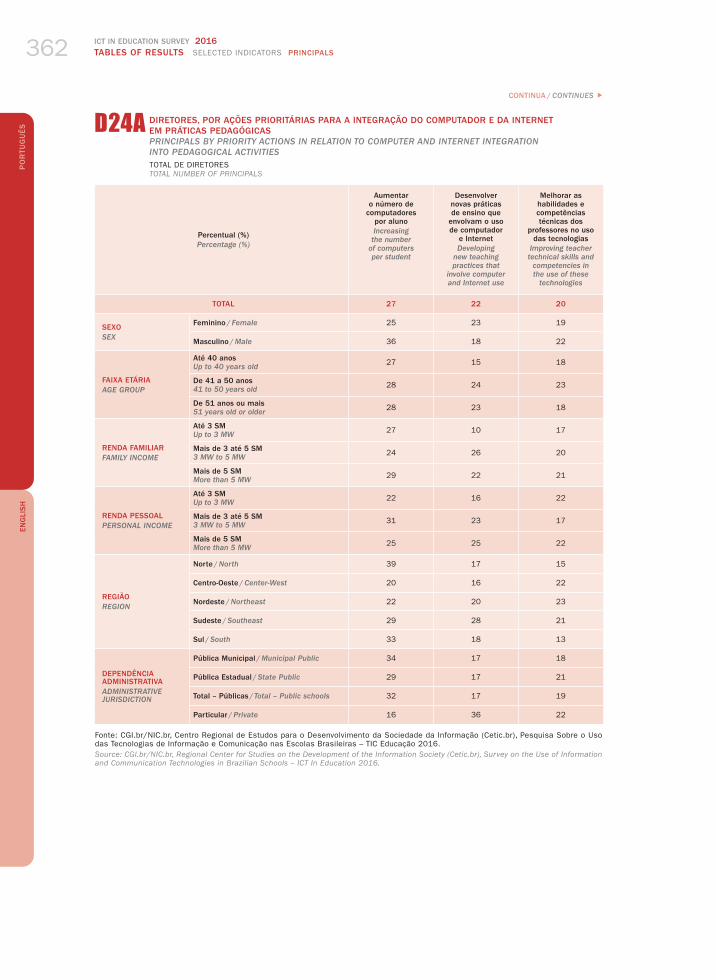
ICT IN EDUCATION SURVEY 2016TABLES OF RESULTS SELECTED INDICATORS PRINCIPALS362
EN
GLI
SH P
OR
TUG
UÊS D24A DIRETORES, POR AÇÕES PRIORITÁRIAS PARA A INTEGRAÇÃO DO COMPUTADOR E DA INTERNET
EM PRÁTICAS PEDAGÓGICASPRINCIPALS BY PRIORITY ACTIONS IN RELATION TO COMPUTER AND INTERNET INTEGRATION INTO PEDAGOGICAL ACTIVITIESTOTAL DE DIRETORESTOTAL NUMBER OF PRINCIPALS
Percentual (%)Percentage (%)
Aumentar o número de
computadores por alunoIncreasing the number
of computers per student
Desenvolver novas práticas de ensino que
envolvam o uso de computador
e InternetDeveloping
new teaching practices that
involve computer and Internet use
Melhorar as habilidades e competências técnicas dos
professores no uso das tecnologias
Improving teacher technical skills and
competencies in the use of these
technologies
TOTAL 27 22 20
SEXOSEX
Feminino / Female 25 23 19
Masculino / Male 36 18 22
FAIXA ETÁRIAAGE GROUP
Até 40 anosUp to 40 years old 27 15 18
De 41 a 50 anos41 to 50 years old 28 24 23
De 51 anos ou mais51 years old or older 28 23 18
RENDA FAMILIARFAMILY INCOME
Até 3 SMUp to 3 MW 27 10 17
Mais de 3 até 5 SM3 MW to 5 MW 24 26 20
Mais de 5 SMMore than 5 MW 29 22 21
RENDA PESSOALPERSONAL INCOME
Até 3 SMUp to 3 MW 22 16 22
Mais de 3 até 5 SM3 MW to 5 MW 31 23 17
Mais de 5 SMMore than 5 MW 25 25 22
REGIÃOREGION
Norte / North 39 17 15
Centro-Oeste / Center-West 20 16 22
Nordeste / Northeast 22 20 23
Sudeste / Southeast 29 28 21
Sul / South 33 18 13
DEPENDÊNCIA ADMINISTRATIVAADMINISTRATIVE JURISDICTION
Pública Municipal / Municipal Public 34 17 18
Pública Estadual / State Public 29 17 21
Total – Públicas / Total – Public schools 32 17 19
Particular / Private 16 36 22
Fonte: CGI.br/NIC.br, Centro Regional de Estudos para o Desenvolvimento da Sociedade da Informação (Cetic.br), Pesquisa Sobre o Uso das Tecnologias de Informação e Comunicação nas Escolas Brasileiras – TIC Educação 2016.Source: CGI.br/NIC.br, Regional Center for Studies on the Development of the Information Society (Cetic.br), Survey on the Use of Information and Communication Technologies in Brazilian Schools – ICT In Education 2016.
CONTINUA / CONTINUES �

2016 PESQUISA TIC EDUCAÇÃODIRETORES INDICADORES SELECIONADOS TABELAS DE RESULTADOS 363
EN
GLI
SH P
OR
TUG
UÊSD24A DIRETORES, POR AÇÕES PRIORITÁRIAS PARA A INTEGRAÇÃO DO COMPUTADOR E DA INTERNET
EM PRÁTICAS PEDAGÓGICASPRINCIPALS BY PRIORITY ACTIONS IN RELATION TO COMPUTER AND INTERNET INTEGRATION INTO PEDAGOGICAL ACTIVITIESTOTAL DE DIRETORESTOTAL NUMBER OF PRINCIPALS
Percentual (%)Percentage (%)
Aumentar a velocidade de acesso à InternetIncreasing
the Internet access speed
Aumentar o número de
computadores conectados à InternetIncreasing the number
of computers connected to the Internet
Melhorar as habilidades e competências técnicas dos
alunos no uso das tecnologias
Improving student technical skills and
competencies in the use of these
technologies
TOTAL 12 11 4
SEXOSEX
Feminino / Female 12 12 4
Masculino / Male 12 7 2
FAIXA ETÁRIAAGE GROUP
Até 40 anosUp to 40 years old 17 14 5
De 41 a 50 anos41 to 50 years old 11 9 2
De 51 anos ou mais51 years old or older 9 12 4
RENDA FAMILIARFAMILY INCOME
Até 3 SMUp to 3 MW 24 14 8
Mais de 3 até 5 SM3 MW to 5 MW 12 10 4
Mais de 5 SMMore than 5 MW 10 11 1
RENDA PESSOALPERSONAL INCOME
Até 3 SMUp to 3 MW 15 11 7
Mais de 3 até 5 SM3 MW to 5 MW 13 10 3
Mais de 5 SMMore than 5 MW 10 12 2
REGIÃOREGION
Norte / North 9 14 1
Centro-Oeste / Center-West 18 17 7
Nordeste / Northeast 13 14 3
Sudeste / Southeast 8 7 3
Sul / South 18 10 6
DEPENDÊNCIA ADMINISTRATIVAADMINISTRATIVE JURISDICTION
Pública Municipal / Municipal Public 11 14 3
Pública Estadual / State Public 15 12 4
Total – Públicas / Total – Public schools 13 13 3
Particular / Private 10 6 5
Fonte: CGI.br/NIC.br, Centro Regional de Estudos para o Desenvolvimento da Sociedade da Informação (Cetic.br), Pesquisa Sobre o Uso das Tecnologias de Informação e Comunicação nas Escolas Brasileiras – TIC Educação 2016.Source: CGI.br/NIC.br, Regional Center for Studies on the Development of the Information Society (Cetic.br), Survey on the Use of Information and Communication Technologies in Brazilian Schools – ICT In Education 2016.
� CONTINUAÇÃO / CONTINUATION

ICT IN EDUCATION SURVEY 2016TABLES OF RESULTS SELECTED INDICATORS PRINCIPALS364
EN
GLI
SH P
OR
TUG
UÊS D24A DIRETORES, POR AÇÕES PRIORITÁRIAS PARA A INTEGRAÇÃO DO COMPUTADOR E DA INTERNET
EM PRÁTICAS PEDAGÓGICASPRINCIPALS BY PRIORITY ACTIONS IN RELATION TO COMPUTER AND INTERNET INTEGRATION INTO PEDAGOGICAL ACTIVITIESTOTAL DE DIRETORESTOTAL NUMBER OF PRINCIPALS
Percentual (%)Percentage (%)
OutraOther
Nenhuma dessasNone
of these
Não sabeDoes not
know
Não respondeu
Did not answer
TOTAL 2 2 0 0
SEXOSEX
Feminino / Female 2 2 0 0
Masculino / Male 1 2 0 0
FAIXA ETÁRIAAGE GROUP
Até 40 anosUp to 40 years old 3 3 0 0
De 41 a 50 anos41 to 50 years old 1 1 0 0
De 51 anos ou mais51 years old or older 2 3 0 0
RENDA FAMILIARFAMILY INCOME
Até 3 SMUp to 3 MW 0 0 0 0
Mais de 3 até 5 SM3 MW to 5 MW 2 2 0 0
Mais de 5 SMMore than 5 MW 2 3 0 0
RENDA PESSOALPERSONAL INCOME
Até 3 SMUp to 3 MW 1 6 0 0
Mais de 3 até 5 SM3 MW to 5 MW 2 1 0 0
Mais de 5 SMMore than 5 MW 3 1 0 0
REGIÃOREGION
Norte / North 5 1 0 0
Centro-Oeste / Center-West 0 0 0 0
Nordeste / Northeast 1 5 0 0
Sudeste / Southeast 2 2 0 0
Sul / South 1 0 0 0
DEPENDÊNCIA ADMINISTRATIVAADMINISTRATIVE JURISDICTION
Pública Municipal / Municipal Public 2 1 0 0
Pública Estadual / State Public 3 0 0 0
Total – Públicas / Total – Public schools 3 1 0 0
Particular / Private 0 6 0 0
Fonte: CGI.br/NIC.br, Centro Regional de Estudos para o Desenvolvimento da Sociedade da Informação (Cetic.br), Pesquisa Sobre o Uso das Tecnologias de Informação e Comunicação nas Escolas Brasileiras – TIC Educação 2016.Source: CGI.br/NIC.br, Regional Center for Studies on the Development of the Information Society (Cetic.br), Survey on the Use of Information and Communication Technologies in Brazilian Schools – ICT In Education 2016.
� CONCLUSÃO / CONCLUSION

2016 PESQUISA TIC EDUCAÇÃODIRETORES INDICADORES SELECIONADOS TABELAS DE RESULTADOS 365
EN
GLI
SH P
OR
TUG
UÊSE2 DIRETORES, POR PERCEPÇÃO SOBRE BARREIRAS PARA O USO DAS TIC NA ESCOLA
PRINCIPALS BY PERCEPTIONS OF BARRIERS TO ICT USE IN SCHOOLSTOTAL DE DIRETORESTOTAL NUMBER OF PRINCIPALS
Percentual (%)Percentage (%)
Número insuficiente de computadores por alunoInsufficient number of computers per student
Dificulta muito
Strongly hinders
Dificulta um poucoHinders
Não dificulta
nadaDoes not hinder
Nessa escola
isso não aconteceThis does not apply
to this school
Não sabe
Does not know
Não respondeu
Did not answer
TOTAL 69 19 9 2 0 1
SEXOSEX
Feminino / Female 67 19 10 2 0 1
Masculino / Male 76 17 5 2 0 0
FAIXA ETÁRIAAGE GROUP
Até 40 anosUp to 40 years old 74 17 7 0 0 2
De 41 a 50 anos41 to 50 years old 70 20 8 2 0 0
De 51 anos ou mais51 years old or older 65 19 10 4 0 2
RENDA FAMILIARFAMILY INCOME
Até 3 SMUp to 3 MW 78 17 5 0 0 0
Mais de 3 até 5 SM3 MW to 5 MW 76 12 10 1 0 1
Mais de 5 SMMore than 5 MW 62 24 10 3 0 1
RENDA PESSOALPERSONAL INCOME
Até 3 SMUp to 3 MW 71 19 7 0 0 2
Mais de 3 até 5 SM3 MW to 5 MW 73 17 9 2 0 0
Mais de 5 SMMore than 5 MW 60 23 11 4 0 2
REGIÃOREGION
Norte / North 76 13 8 3 0 0
Centro-Oeste / Center-West 68 13 16 2 0 0
Nordeste / Northeast 76 14 8 2 0 0
Sudeste / Southeast 63 23 8 3 0 3
Sul / South 64 24 11 1 0 0
DEPENDÊNCIA ADMINISTRATIVAADMINISTRATIVE JURISDICTION
Pública Municipal / Municipal Public 75 15 7 1 0 3
Pública Estadual / State Public 80 17 2 1 0 0
Total – Públicas / Total – Public schools 77 16 5 1 0 2
Particular / Private 47 28 20 6 0 0
Fonte: CGI.br/NIC.br, Centro Regional de Estudos para o Desenvolvimento da Sociedade da Informação (Cetic.br), Pesquisa Sobre o Uso das Tecnologias de Informação e Comunicação nas Escolas Brasileiras – TIC Educação 2016.Source: CGI.br/NIC.br, Regional Center for Studies on the Development of the Information Society (Cetic.br), Survey on the Use of Information and Communication Technologies in Brazilian Schools – ICT In Education 2016.
CONTINUA / CONTINUES �

ICT IN EDUCATION SURVEY 2016TABLES OF RESULTS SELECTED INDICATORS PRINCIPALS366
EN
GLI
SH P
OR
TUG
UÊS E2 DIRETORES, POR PERCEPÇÃO SOBRE BARREIRAS PARA O USO DAS TIC NA ESCOLA
PRINCIPALS BY PERCEPTIONS OF BARRIERS TO ICT USE IN SCHOOLSTOTAL DE DIRETORESTOTAL NUMBER OF PRINCIPALS
Percentual (%)Percentage (%)
Equipamentos obsoletos ou ultrapassadosObsolete or outdated equipment
Dificulta muito
Strongly hinders
Dificulta um poucoHinders
Não dificulta
nadaDoes not hinder
Nessa escola
isso não aconteceThis does not apply
to this school
Não sabe
Does not know
Não respondeu
Did not answer
TOTAL 68 16 11 4 0 0
SEXOSEX
Feminino / Female 67 16 12 4 1 1
Masculino / Male 74 16 6 3 0 0
FAIXA ETÁRIAAGE GROUP
Até 40 anosUp to 40 years old 60 26 11 1 0 2
De 41 a 50 anos41 to 50 years old 75 14 8 2 1 0
De 51 anos ou mais51 years old or older 67 10 15 8 0 0
RENDA FAMILIARFAMILY INCOME
Até 3 SMUp to 3 MW 64 24 9 3 0 0
Mais de 3 até 5 SM3 MW to 5 MW 71 14 10 2 1 1
Mais de 5 SMMore than 5 MW 68 15 12 5 0 0
RENDA PESSOALPERSONAL INCOME
Até 3 SMUp to 3 MW 60 20 16 2 1 2
Mais de 3 até 5 SM3 MW to 5 MW 74 15 8 3 0 0
Mais de 5 SMMore than 5 MW 67 15 10 7 0 0
REGIÃOREGION
Norte / North 74 19 3 3 0 0
Centro-Oeste / Center-West 68 16 14 3 0 0
Nordeste / Northeast 65 18 13 3 1 0
Sudeste / Southeast 70 14 9 6 0 1
Sul / South 68 16 14 2 0 0
DEPENDÊNCIA ADMINISTRATIVAADMINISTRATIVE JURISDICTION
Pública Municipal / Municipal Public 70 16 9 2 1 1
Pública Estadual / State Public 82 11 4 2 0 0
Total – Públicas / Total – Public schools 76 14 7 2 1 1
Particular / Private 49 20 22 9 0 0
Fonte: CGI.br/NIC.br, Centro Regional de Estudos para o Desenvolvimento da Sociedade da Informação (Cetic.br), Pesquisa Sobre o Uso das Tecnologias de Informação e Comunicação nas Escolas Brasileiras – TIC Educação 2016.Source: CGI.br/NIC.br, Regional Center for Studies on the Development of the Information Society (Cetic.br), Survey on the Use of Information and Communication Technologies in Brazilian Schools – ICT In Education 2016.
� CONTINUAÇÃO / CONTINUATION

2016 PESQUISA TIC EDUCAÇÃODIRETORES INDICADORES SELECIONADOS TABELAS DE RESULTADOS 367
EN
GLI
SH P
OR
TUG
UÊSE2 DIRETORES, POR PERCEPÇÃO SOBRE BARREIRAS PARA O USO DAS TIC NA ESCOLA
PRINCIPALS BY PERCEPTIONS OF BARRIERS TO ICT USE IN SCHOOLSTOTAL DE DIRETORESTOTAL NUMBER OF PRINCIPALS
Percentual (%)Percentage (%)
Baixa velocidade de conexão à InternetLow speed of connection to the Internet
Dificulta muito
Strongly hinders
Dificulta um poucoHinders
Não dificulta
nadaDoes not hinder
Nessa escola
isso não aconteceThis does not apply
to this school
Não sabe
Does not know
Não respondeu
Did not answer
TOTAL 66 21 10 2 0 0
SEXOSEX
Feminino / Female 66 20 11 2 0 1
Masculino / Male 68 22 6 4 0 0
FAIXA ETÁRIAAGE GROUP
Até 40 anosUp to 40 years old 72 15 7 4 0 2
De 41 a 50 anos41 to 50 years old 69 19 12 1 0 0
De 51 anos ou mais51 years old or older 59 28 10 3 0 0
RENDA FAMILIARFAMILY INCOME
Até 3 SMUp to 3 MW 65 24 11 0 0 0
Mais de 3 até 5 SM3 MW to 5 MW 72 17 8 1 0 1
Mais de 5 SMMore than 5 MW 63 22 11 4 0 0
RENDA PESSOALPERSONAL INCOME
Até 3 SMUp to 3 MW 61 20 17 0 0 2
Mais de 3 até 5 SM3 MW to 5 MW 72 19 6 2 0 0
Mais de 5 SMMore than 5 MW 61 25 10 4 0 0
REGIÃOREGION
Norte / North 83 12 5 0 0 0
Centro-Oeste / Center-West 75 13 10 2 0 0
Nordeste / Northeast 67 21 10 3 0 0
Sudeste / Southeast 58 25 13 3 0 1
Sul / South 74 18 5 2 0 0
DEPENDÊNCIA ADMINISTRATIVAADMINISTRATIVE JURISDICTION
Pública Municipal / Municipal Public 69 17 11 2 0 1
Pública Estadual / State Public 78 16 4 2 0 0
Total – Públicas / Total – Public schools 73 17 8 2 0 1
Particular / Private 49 31 16 4 0 0
Fonte: CGI.br/NIC.br, Centro Regional de Estudos para o Desenvolvimento da Sociedade da Informação (Cetic.br), Pesquisa Sobre o Uso das Tecnologias de Informação e Comunicação nas Escolas Brasileiras – TIC Educação 2016.Source: CGI.br/NIC.br, Regional Center for Studies on the Development of the Information Society (Cetic.br), Survey on the Use of Information and Communication Technologies in Brazilian Schools – ICT In Education 2016.
� CONTINUAÇÃO / CONTINUATION

ICT IN EDUCATION SURVEY 2016TABLES OF RESULTS SELECTED INDICATORS PRINCIPALS368
EN
GLI
SH P
OR
TUG
UÊS E2 DIRETORES, POR PERCEPÇÃO SOBRE BARREIRAS PARA O USO DAS TIC NA ESCOLA
PRINCIPALS BY PERCEPTIONS OF BARRIERS TO ICT USE IN SCHOOLSTOTAL DE DIRETORESTOTAL NUMBER OF PRINCIPALS
Percentual (%)Percentage (%)
Ausência de suporte técnico e manutenção dos equipamentosLack of technical support or equipment maintenance
Dificulta muito
Strongly hinders
Dificulta um poucoHinders
Não dificulta
nadaDoes not hinder
Nessa escola
isso não aconteceThis does not apply
to this school
Não sabe
Does not know
Não respondeu
Did not answer
TOTAL 64 19 13 3 0 1
SEXOSEX
Feminino / Female 62 20 14 3 0 1
Masculino / Male 70 16 11 3 0 0
FAIXA ETÁRIAAGE GROUP
Até 40 anosUp to 40 years old 68 21 7 3 0 2
De 41 a 50 anos41 to 50 years old 64 20 13 2 0 0
De 51 anos ou mais51 years old or older 59 17 17 4 0 2
RENDA FAMILIARFAMILY INCOME
Até 3 SMUp to 3 MW 60 22 18 0 0 0
Mais de 3 até 5 SM3 MW to 5 MW 68 18 11 2 0 1
Mais de 5 SMMore than 5 MW 63 18 13 4 0 1
RENDA PESSOALPERSONAL INCOME
Até 3 SMUp to 3 MW 60 20 16 1 1 2
Mais de 3 até 5 SM3 MW to 5 MW 65 22 10 2 0 0
Mais de 5 SMMore than 5 MW 65 14 14 5 0 2
REGIÃOREGION
Norte / North 66 26 4 3 1 0
Centro-Oeste / Center-West 61 18 16 5 0 0
Nordeste / Northeast 65 21 12 3 0 0
Sudeste / Southeast 63 15 15 3 0 3
Sul / South 61 23 13 2 0 0
DEPENDÊNCIA ADMINISTRATIVAADMINISTRATIVE JURISDICTION
Pública Municipal / Municipal Public 60 23 12 1 0 3
Pública Estadual / State Public 83 12 3 2 0 0
Total – Públicas / Total – Public schools 70 18 8 1 0 2
Particular / Private 46 21 25 7 0 0
Fonte: CGI.br/NIC.br, Centro Regional de Estudos para o Desenvolvimento da Sociedade da Informação (Cetic.br), Pesquisa Sobre o Uso das Tecnologias de Informação e Comunicação nas Escolas Brasileiras – TIC Educação 2016.Source: CGI.br/NIC.br, Regional Center for Studies on the Development of the Information Society (Cetic.br), Survey on the Use of Information and Communication Technologies in Brazilian Schools – ICT In Education 2016.
� CONTINUAÇÃO / CONTINUATION

2016 PESQUISA TIC EDUCAÇÃODIRETORES INDICADORES SELECIONADOS TABELAS DE RESULTADOS 369
EN
GLI
SH P
OR
TUG
UÊSE2 DIRETORES, POR PERCEPÇÃO SOBRE BARREIRAS PARA O USO DAS TIC NA ESCOLA
PRINCIPALS BY PERCEPTIONS OF BARRIERS TO ICT USE IN SCHOOLSTOTAL DE DIRETORESTOTAL NUMBER OF PRINCIPALS
Percentual (%)Percentage (%)
Número insuficiente de computadores conectados à InternetInsufficient number of computers connected to the Internet
Dificulta muito
Strongly hinders
Dificulta um poucoHinders
Não dificulta
nadaDoes not hinder
Nessa escola
isso não aconteceThis does not apply
to this school
Não sabe
Does not know
Não respondeu
Did not answer
TOTAL 63 23 11 3 0 0
SEXOSEX
Feminino / Female 64 21 11 4 0 1
Masculino / Male 59 28 11 2 0 0
FAIXA ETÁRIAAGE GROUP
Até 40 anosUp to 40 years old 64 23 11 1 0 2
De 41 a 50 anos41 to 50 years old 68 20 11 2 0 0
De 51 anos ou mais51 years old or older 56 26 11 7 0 0
RENDA FAMILIARFAMILY INCOME
Até 3 SMUp to 3 MW 60 35 5 0 0 0
Mais de 3 até 5 SM3 MW to 5 MW 69 17 11 1 0 1
Mais de 5 SMMore than 5 MW 60 23 12 5 0 0
RENDA PESSOALPERSONAL INCOME
Até 3 SMUp to 3 MW 64 26 9 0 0 2
Mais de 3 até 5 SM3 MW to 5 MW 69 17 12 2 0 0
Mais de 5 SMMore than 5 MW 54 29 11 7 0 0
REGIÃOREGION
Norte / North 80 13 6 1 0 0
Centro-Oeste / Center-West 64 17 15 4 0 0
Nordeste / Northeast 70 18 10 2 0 0
Sudeste / Southeast 53 30 11 5 0 1
Sul / South 64 22 12 2 0 0
DEPENDÊNCIA ADMINISTRATIVAADMINISTRATIVE JURISDICTION
Pública Municipal / Municipal Public 72 15 10 2 0 1
Pública Estadual / State Public 69 27 4 1 0 0
Total – Públicas / Total – Public schools 71 20 7 2 0 1
Particular / Private 42 29 20 8 0 0
Fonte: CGI.br/NIC.br, Centro Regional de Estudos para o Desenvolvimento da Sociedade da Informação (Cetic.br), Pesquisa Sobre o Uso das Tecnologias de Informação e Comunicação nas Escolas Brasileiras – TIC Educação 2016.Source: CGI.br/NIC.br, Regional Center for Studies on the Development of the Information Society (Cetic.br), Survey on the Use of Information and Communication Technologies in Brazilian Schools – ICT In Education 2016.
� CONTINUAÇÃO / CONTINUATION

ICT IN EDUCATION SURVEY 2016TABLES OF RESULTS SELECTED INDICATORS PRINCIPALS370
EN
GLI
SH P
OR
TUG
UÊS E2 DIRETORES, POR PERCEPÇÃO SOBRE BARREIRAS PARA O USO DAS TIC NA ESCOLA
PRINCIPALS BY PERCEPTIONS OF BARRIERS TO ICT USE IN SCHOOLSTOTAL DE DIRETORESTOTAL NUMBER OF PRINCIPALS
Percentual (%)Percentage (%)
Falta de apoio pedagógico aos professores para o uso da InternetLack of pedagogical support for teachers to Internet use
Dificulta muito
Strongly hinders
Dificulta um poucoHinders
Não dificulta
nadaDoes not hinder
Nessa escola
isso não aconteceThis does not apply
to this school
Não sabe
Does not know
Não respondeu
Did not answer
TOTAL 46 29 20 4 0 1
SEXOSEX
Feminino / Female 44 29 23 4 0 1
Masculino / Male 56 28 11 5 0 0
FAIXA ETÁRIAAGE GROUP
Até 40 anosUp to 40 years old 43 39 15 1 0 2
De 41 a 50 anos41 to 50 years old 47 31 19 3 0 0
De 51 anos ou mais51 years old or older 49 20 24 7 0 0
RENDA FAMILIARFAMILY INCOME
Até 3 SMUp to 3 MW 46 33 18 3 0 0
Mais de 3 até 5 SM3 MW to 5 MW 45 30 18 4 0 2
Mais de 5 SMMore than 5 MW 47 26 22 4 0 0
RENDA PESSOALPERSONAL INCOME
Até 3 SMUp to 3 MW 48 31 17 2 0 2
Mais de 3 até 5 SM3 MW to 5 MW 46 29 20 5 0 0
Mais de 5 SMMore than 5 MW 45 28 24 4 0 0
REGIÃOREGION
Norte / North 51 41 6 2 0 0
Centro-Oeste / Center-West 39 31 25 6 0 0
Nordeste / Northeast 56 23 16 4 0 0
Sudeste / Southeast 41 29 25 3 0 2
Sul / South 40 32 22 5 0 0
DEPENDÊNCIA ADMINISTRATIVAADMINISTRATIVE JURISDICTION
Pública Municipal / Municipal Public 50 33 14 2 0 1
Pública Estadual / State Public 58 24 13 4 0 1
Total – Públicas / Total – Public schools 54 29 14 3 0 1
Particular / Private 27 29 37 7 0 0
Fonte: CGI.br/NIC.br, Centro Regional de Estudos para o Desenvolvimento da Sociedade da Informação (Cetic.br), Pesquisa Sobre o Uso das Tecnologias de Informação e Comunicação nas Escolas Brasileiras – TIC Educação 2016.Source: CGI.br/NIC.br, Regional Center for Studies on the Development of the Information Society (Cetic.br), Survey on the Use of Information and Communication Technologies in Brazilian Schools – ICT In Education 2016.
� CONTINUAÇÃO / CONTINUATION

2016 PESQUISA TIC EDUCAÇÃODIRETORES INDICADORES SELECIONADOS TABELAS DE RESULTADOS 371
EN
GLI
SH P
OR
TUG
UÊSE2 DIRETORES, POR PERCEPÇÃO SOBRE BARREIRAS PARA O USO DAS TIC NA ESCOLA
PRINCIPALS BY PERCEPTIONS OF BARRIERS TO ICT USE IN SCHOOLSTOTAL DE DIRETORESTOTAL NUMBER OF PRINCIPALS
Percentual (%)Percentage (%)
Pressão ou falta de tempo para cumprir com o conteúdo previstoPressure or lack of time to cover the curricula
Dificulta muito
Strongly hinders
Dificulta um poucoHinders
Não dificulta
nadaDoes not hinder
Nessa escola
isso não aconteceThis does not apply
to this school
Não sabe
Does not know
Não respondeu
Did not answer
TOTAL 37 32 30 2 0 0
SEXOSEX
Feminino / Female 37 28 33 2 0 0
Masculino / Male 34 45 20 1 0 0
FAIXA ETÁRIAAGE GROUP
Até 40 anosUp to 40 years old 37 36 26 1 0 0
De 41 a 50 anos41 to 50 years old 36 32 31 2 0 0
De 51 anos ou mais51 years old or older 36 30 32 2 0 0
RENDA FAMILIARFAMILY INCOME
Até 3 SMUp to 3 MW 54 26 17 3 0 0
Mais de 3 até 5 SM3 MW to 5 MW 35 40 24 2 0 0
Mais de 5 SMMore than 5 MW 34 30 34 1 0 0
RENDA PESSOALPERSONAL INCOME
Até 3 SMUp to 3 MW 45 29 23 3 0 0
Mais de 3 até 5 SM3 MW to 5 MW 38 32 29 1 0 0
Mais de 5 SMMore than 5 MW 29 36 34 1 0 0
REGIÃOREGION
Norte / North 41 37 21 1 0 0
Centro-Oeste / Center-West 25 35 38 3 0 0
Nordeste / Northeast 45 32 21 3 0 0
Sudeste / Southeast 34 32 34 1 0 0
Sul / South 31 30 38 1 0 0
DEPENDÊNCIA ADMINISTRATIVAADMINISTRATIVE JURISDICTION
Pública Municipal / Municipal Public 46 29 24 1 0 0
Pública Estadual / State Public 38 40 21 0 0 0
Total – Públicas / Total – Public schools 42 34 23 1 0 0
Particular / Private 21 27 48 4 0 0
Fonte: CGI.br/NIC.br, Centro Regional de Estudos para o Desenvolvimento da Sociedade da Informação (Cetic.br), Pesquisa Sobre o Uso das Tecnologias de Informação e Comunicação nas Escolas Brasileiras – TIC Educação 2016.Source: CGI.br/NIC.br, Regional Center for Studies on the Development of the Information Society (Cetic.br), Survey on the Use of Information and Communication Technologies in Brazilian Schools – ICT In Education 2016.
� CONTINUAÇÃO / CONTINUATION

ICT IN EDUCATION SURVEY 2016TABLES OF RESULTS SELECTED INDICATORS PRINCIPALS372
EN
GLI
SH P
OR
TUG
UÊS E2 DIRETORES, POR PERCEPÇÃO SOBRE BARREIRAS PARA O USO DAS TIC NA ESCOLA
PRINCIPALS BY PERCEPTIONS OF BARRIERS TO ICT USE IN SCHOOLSTOTAL DE DIRETORESTOTAL NUMBER OF PRINCIPALS
Percentual (%)Percentage (%)
Pressão para conseguir boas notas nas avaliações de desempenhoPressure to achieve good performance appraisals
Dificulta muito
Strongly hinders
Dificulta um poucoHinders
Não dificulta
nadaDoes not hinder
Nessa escola
isso não aconteceThis does not apply
to this school
Não sabe
Does not know
Não respondeu
Did not answer
TOTAL 26 30 43 2 0 0
SEXOSEX
Feminino / Female 28 28 43 1 0 0
Masculino / Male 20 35 42 2 0 0
FAIXA ETÁRIAAGE GROUP
Até 40 anosUp to 40 years old 18 45 35 1 0 0
De 41 a 50 anos41 to 50 years old 32 25 42 1 0 0
De 51 anos ou mais51 years old or older 25 25 48 2 0 0
RENDA FAMILIARFAMILY INCOME
Até 3 SMUp to 3 MW 33 40 26 0 1 0
Mais de 3 até 5 SM3 MW to 5 MW 35 31 33 1 0 0
Mais de 5 SMMore than 5 MW 18 28 52 2 0 0
RENDA PESSOALPERSONAL INCOME
Até 3 SMUp to 3 MW 32 34 33 0 0 0
Mais de 3 até 5 SM3 MW to 5 MW 28 30 40 2 0 0
Mais de 5 SMMore than 5 MW 15 29 54 2 0 0
REGIÃOREGION
Norte / North 33 38 27 3 0 0
Centro-Oeste / Center-West 24 30 44 2 0 0
Nordeste / Northeast 29 30 38 2 0 0
Sudeste / Southeast 24 27 49 0 0 0
Sul / South 22 34 42 2 0 0
DEPENDÊNCIA ADMINISTRATIVAADMINISTRATIVE JURISDICTION
Pública Municipal / Municipal Public 26 33 40 1 0 0
Pública Estadual / State Public 28 30 40 2 0 0
Total – Públicas / Total – Public schools 27 32 40 1 0 0
Particular / Private 23 25 49 2 0 0
Fonte: CGI.br/NIC.br, Centro Regional de Estudos para o Desenvolvimento da Sociedade da Informação (Cetic.br), Pesquisa Sobre o Uso das Tecnologias de Informação e Comunicação nas Escolas Brasileiras – TIC Educação 2016.Source: CGI.br/NIC.br, Regional Center for Studies on the Development of the Information Society (Cetic.br), Survey on the Use of Information and Communication Technologies in Brazilian Schools – ICT In Education 2016.
� CONCLUSÃO / CONCLUSION

2016 PESQUISA TIC EDUCAÇÃOESCOLAS INDICADORES SELECIONADOS TABELAS DE RESULTADOS 373
EN
GLI
SH P
OR
TUG
UÊSD9 ESCOLAS, POR LOCAL DE INSTALAÇÃO DOS COMPUTADORES DE MESA
SCHOOLS BY LOCATION OF INSTALLED DESKTOP COMPUTERSTOTAL DE ESCOLAS URBANASTOTAL NUMBER OF URBAN SCHOOLS
Percentual (%)Percentage (%)
Sala do(a) coordenador(a) pedagógico(a) ou do(a) diretor(a)Office of the director of studies or principal
SimYes
NãoNo
Não sabeDoes not
know
Não possui computador
de mesaDoes not
have desktop computers
TOTAL 80 18 0 2
REGIÃOREGION
Norte / North 82 16 0 2
Centro-Oeste / Center-West 80 16 0 3
Nordeste / Northeast 68 27 0 4
Sudeste / Southeast 85 14 0 1
Sul / South 88 12 0 0
DEPENDÊNCIA ADMINISTRATIVAADMINISTRATIVE JURISDICTION
Pública Municipal / Municipal Public 73 25 0 2
Pública Estadual / State Public 90 9 0 1
Total – Públicas / Total – Public schools 80 18 0 2
Particular / Private 78 18 0 4
Fonte: CGI.br/NIC.br, Centro Regional de Estudos para o Desenvolvimento da Sociedade da Informação (Cetic.br), Pesquisa Sobre o Uso das Tecnologias de Informação e Comunicação nas Escolas Brasileiras – TIC Educação 2016.Source: CGI.br/NIC.br, Regional Center for Studies on the Development of the Information Society (Cetic.br), Survey on the Use of Information and Communication Technologies in Brazilian Schools – ICT In Education 2016.
CONTINUA / CONTINUES �

ICT IN EDUCATION SURVEY 2016TABLES OF RESULTS SELECTED INDICATORS SCHOOLS374
EN
GLI
SH P
OR
TUG
UÊS D9 ESCOLAS, POR LOCAL DE INSTALAÇÃO DOS COMPUTADORES DE MESA
SCHOOLS BY LOCATION OF INSTALLED DESKTOP COMPUTERSTOTAL DE ESCOLAS URBANASTOTAL NUMBER OF URBAN SCHOOLS
Percentual (%)Percentage (%)
Laboratório de informáticaComputer lab
SimYes
NãoNo
Não sabeDoes not
know
Não possui computador de mesa e nem
laboratório de informática
Does not have desktop computers or
a computer lab
TOTAL 70 1 1 28
REGIÃOREGION
Norte / North 74 3 0 24
Centro-Oeste / Center-West 74 1 0 25
Nordeste / Northeast 50 3 0 47
Sudeste / Southeast 78 0 1 21
Sul / South 87 1 0 13
DEPENDÊNCIA ADMINISTRATIVAADMINISTRATIVE JURISDICTION
Pública Municipal / Municipal Public 71 1 0 28
Pública Estadual / State Public 91 2 0 7
Total – Públicas / Total – Public schools 80 2 0 19
Particular / Private 44 0 2 54
Fonte: CGI.br/NIC.br, Centro Regional de Estudos para o Desenvolvimento da Sociedade da Informação (Cetic.br), Pesquisa Sobre o Uso das Tecnologias de Informação e Comunicação nas Escolas Brasileiras – TIC Educação 2016.Source: CGI.br/NIC.br, Regional Center for Studies on the Development of the Information Society (Cetic.br), Survey on the Use of Information and Communication Technologies in Brazilian Schools – ICT In Education 2016.
� CONTINUAÇÃO / CONTINUATION

2016 PESQUISA TIC EDUCAÇÃOESCOLAS INDICADORES SELECIONADOS TABELAS DE RESULTADOS 375
EN
GLI
SH P
OR
TUG
UÊSD9 ESCOLAS, POR LOCAL DE INSTALAÇÃO DOS COMPUTADORES DE MESA
SCHOOLS BY LOCATION OF INSTALLED DESKTOP COMPUTERSTOTAL DE ESCOLAS URBANASTOTAL NUMBER OF URBAN SCHOOLS
Percentual (%)Percentage (%)
Sala dos professores ou sala de reunião Teachers’ room or meeting room
SimYes
NãoNo
Não sabeDoes not
know
Não possui computador
de mesaDoes not
have desktop computers
TOTAL 55 42 1 2
REGIÃOREGION
Norte / North 48 50 0 2
Centro-Oeste / Center-West 59 37 0 3
Nordeste / Northeast 37 55 3 4
Sudeste / Southeast 66 33 0 1
Sul / South 65 35 0 0
DEPENDÊNCIA ADMINISTRATIVAADMINISTRATIVE JURISDICTION
Pública Municipal / Municipal Public 50 48 0 2
Pública Estadual / State Public 73 26 0 1
Total – Públicas / Total – Public schools 60 39 0 2
Particular / Private 42 50 4 4
Fonte: CGI.br/NIC.br, Centro Regional de Estudos para o Desenvolvimento da Sociedade da Informação (Cetic.br), Pesquisa Sobre o Uso das Tecnologias de Informação e Comunicação nas Escolas Brasileiras – TIC Educação 2016.Source: CGI.br/NIC.br, Regional Center for Studies on the Development of the Information Society (Cetic.br), Survey on the Use of Information and Communication Technologies in Brazilian Schools – ICT In Education 2016.
� CONTINUAÇÃO / CONTINUATION

ICT IN EDUCATION SURVEY 2016TABLES OF RESULTS SELECTED INDICATORS SCHOOLS376
EN
GLI
SH P
OR
TUG
UÊS D9 ESCOLAS, POR LOCAL DE INSTALAÇÃO DOS COMPUTADORES DE MESA
SCHOOLS BY LOCATION OF INSTALLED DESKTOP COMPUTERSTOTAL DE ESCOLAS URBANASTOTAL NUMBER OF URBAN SCHOOLS
Percentual (%)Percentage (%)
Biblioteca ou sala de estudos para os alunosLibrary or study room
SimYes
NãoNo
Não respondeu
Did not answer
Não possui computador
de mesaDoes not
have desktop computers
TOTAL 37 61 0 2
REGIÃOREGION
Norte / North 28 70 0 2
Centro-Oeste / Center-West 26 70 0 3
Nordeste / Northeast 24 72 0 4
Sudeste / Southeast 48 51 0 1
Sul / South 48 52 0 0
DEPENDÊNCIA ADMINISTRATIVAADMINISTRATIVE JURISDICTION
Pública Municipal / Municipal Public 26 72 0 2
Pública Estadual / State Public 39 61 0 1
Total – Públicas / Total – Public schools 31 67 0 2
Particular / Private 53 43 0 4
Fonte: CGI.br/NIC.br, Centro Regional de Estudos para o Desenvolvimento da Sociedade da Informação (Cetic.br), Pesquisa Sobre o Uso das Tecnologias de Informação e Comunicação nas Escolas Brasileiras – TIC Educação 2016.Source: CGI.br/NIC.br, Regional Center for Studies on the Development of the Information Society (Cetic.br), Survey on the Use of Information and Communication Technologies in Brazilian Schools – ICT In Education 2016.
� CONTINUAÇÃO / CONTINUATION

2016 PESQUISA TIC EDUCAÇÃOESCOLAS INDICADORES SELECIONADOS TABELAS DE RESULTADOS 377
EN
GLI
SH P
OR
TUG
UÊSD9 ESCOLAS, POR LOCAL DE INSTALAÇÃO DOS COMPUTADORES DE MESA
SCHOOLS BY LOCATION OF INSTALLED DESKTOP COMPUTERSTOTAL DE ESCOLAS URBANASTOTAL NUMBER OF URBAN SCHOOLS
Percentual (%)Percentage (%)
Sala de aulaClassroom
SimYes
NãoNo
Não respondeu
Did not answer
Não possui computador
de mesaDoes not
have desktop computers
TOTAL 4 93 0 2
REGIÃOREGION
Norte / North 1 97 0 2
Centro-Oeste / Center-West 4 93 0 3
Nordeste / Northeast 2 93 0 4
Sudeste / Southeast 6 92 0 1
Sul / South 5 95 0 0
DEPENDÊNCIA ADMINISTRATIVAADMINISTRATIVE JURISDICTION
Pública Municipal / Municipal Public 1 97 0 2
Pública Estadual / State Public 1 98 0 1
Total – Públicas / Total – Public schools 1 98 0 2
Particular / Private 13 82 0 4
Fonte: CGI.br/NIC.br, Centro Regional de Estudos para o Desenvolvimento da Sociedade da Informação (Cetic.br), Pesquisa Sobre o Uso das Tecnologias de Informação e Comunicação nas Escolas Brasileiras – TIC Educação 2016.Source: CGI.br/NIC.br, Regional Center for Studies on the Development of the Information Society (Cetic.br), Survey on the Use of Information and Communication Technologies in Brazilian Schools – ICT In Education 2016.
� CONCLUSÃO / CONCLUSION

ICT IN EDUCATION SURVEY 2016TABLES OF RESULTS SELECTED INDICATORS SCHOOLS378
EN
GLI
SH P
OR
TUG
UÊS D15A ESCOLAS, POR PRINCIPAL TIPO DE CONEXÃO À INTERNET
SCHOOLS BY MAIN TYPE OF INTERNET CONNECTIONTOTAL DE ESCOLAS URBANASTOTAL NUMBER OF URBAN SCHOOLS
Percentual (%)Percentage (%)
Conexão discadaDial-up
connection
Banda larga fixaFixed broadband
Cone
xão
via
linha
tel
efôn
ica
(DSL
)Co
nnec
tion
via
tele
phon
e lin
e (D
SL)
Cone
xão
via
cabo
Cabl
e co
nnec
tion
Cone
xão
via
rádi
oR
adio
con
nect
ion
Cone
xão
via
saté
lite
Sate
llite
con
nect
ion
Cone
xão
via
fibra
ótic
aO
ptic
al f
iber
con
nect
ion
TOTAL 1 25 44 5 4 11
REGIÃOREGION
Norte / North 0 8 37 14 18 7
Centro-Oeste / Center-West 1 45 29 5 3 8
Nordeste / Northeast 1 16 54 5 4 4
Sudeste / Southeast 1 23 50 2 2 13
Sul / South 0 44 17 9 5 20
DEPENDÊNCIA ADMINISTRATIVAADMINISTRATIVE JURISDICTION
Pública Municipal / Municipal Public 0 27 42 7 5 6
Pública Estadual / State Public 2 25 45 3 5 11
Total – Públicas / Total – Public schools 1 26 43 5 5 9
Particular / Private 0 23 44 6 1 16
Fonte: CGI.br/NIC.br, Centro Regional de Estudos para o Desenvolvimento da Sociedade da Informação (Cetic.br), Pesquisa Sobre o Uso das Tecnologias de Informação e Comunicação nas Escolas Brasileiras – TIC Educação 2016.Source: CGI.br/NIC.br, Regional Center for Studies on the Development of the Information Society (Cetic.br), Survey on the Use of Information and Communication Technologies in Brazilian Schools – ICT In Education 2016.
CONTINUA / CONTINUES �

2016 PESQUISA TIC EDUCAÇÃOESCOLAS INDICADORES SELECIONADOS TABELAS DE RESULTADOS 379
EN
GLI
SH P
OR
TUG
UÊSD15A ESCOLAS, POR PRINCIPAL TIPO DE CONEXÃO À INTERNET
SCHOOLS BY MAIN TYPE OF INTERNET CONNECTIONTOTAL DE ESCOLAS URBANASTOTAL NUMBER OF URBAN SCHOOLS
Percentual (%)Percentage (%)
Modem 3G ou 4G3G or 4G modem
Não sabeDoes not know
Não respondeu Did not answer
TOTAL 7 3 0
REGIÃOREGION
Norte / North 9 5 0
Centro-Oeste / Center-West 7 2 0
Nordeste / Northeast 13 3 0
Sudeste / Southeast 5 3 0
Sul / South 0 3 2
DEPENDÊNCIA ADMINISTRATIVAADMINISTRATIVE JURISDICTION
Pública Municipal / Municipal Public 7 4 1
Pública Estadual / State Public 7 2 0
Total – Públicas / Total – Public schools 7 3 0
Particular / Private 7 3 0
Fonte: CGI.br/NIC.br, Centro Regional de Estudos para o Desenvolvimento da Sociedade da Informação (Cetic.br), Pesquisa Sobre o Uso das Tecnologias de Informação e Comunicação nas Escolas Brasileiras – TIC Educação 2016.Source: CGI.br/NIC.br, Regional Center for Studies on the Development of the Information Society (Cetic.br), Survey on the Use of Information and Communication Technologies in Brazilian Schools – ICT In Education 2016.
� CONCLUSÃO / CONCLUSION

ICT IN EDUCATION SURVEY 2016TABLES OF RESULTS SELECTED INDICATORS SCHOOLS380
EN
GLI
SH P
OR
TUG
UÊS D25A ESCOLAS, POR VELOCIDADE DA PRINCIPAL CONEXÃO À INTERNET
SCHOOLS BY MAIN INTERNET CONNECTION SPEEDTOTAL DE ESCOLAS URBANASTOTAL NUMBER OF URBAN SCHOOLS
Percentual (%)Percentage (%)
Até 256 Kbps
Up to 256 Kbps
De 257 Kbps até 999 Kbps
257 Kbps to 999 Kbps
1 Mbps1 Mbps
2 Mbps2 Mbps
TOTAL 3 2 9 16
REGIÃOREGION
Norte / North 3 2 18 21
Centro-Oeste / Center-West 1 0 10 22
Nordeste / Northeast 3 3 14 22
Sudeste / Southeast 3 0 4 7
Sul / South 2 3 10 21
DEPENDÊNCIA ADMINISTRATIVAADMINISTRATIVE JURISDICTION
Pública Municipal / Municipal Public 3 1 12 15
Pública Estadual / State Public 4 3 10 17
Total – Públicas / Total – Public schools 4 2 11 16
Particular / Private 0 0 5 15
Fonte: CGI.br/NIC.br, Centro Regional de Estudos para o Desenvolvimento da Sociedade da Informação (Cetic.br), Pesquisa Sobre o Uso das Tecnologias de Informação e Comunicação nas Escolas Brasileiras – TIC Educação 2016.Source: CGI.br/NIC.br, Regional Center for Studies on the Development of the Information Society (Cetic.br), Survey on the Use of Information and Communication Technologies in Brazilian Schools – ICT In Education 2016.
CONTINUA / CONTINUES �

2016 PESQUISA TIC EDUCAÇÃOESCOLAS INDICADORES SELECIONADOS TABELAS DE RESULTADOS 381
EN
GLI
SH P
OR
TUG
UÊSD25A ESCOLAS, POR VELOCIDADE DA PRINCIPAL CONEXÃO À INTERNET
SCHOOLS BY MAIN INTERNET CONNECTION SPEEDTOTAL DE ESCOLAS URBANASTOTAL NUMBER OF URBAN SCHOOLS
Percentual (%)Percentage (%)
De 3 Mbps até 4 Mbps
3 Mbps to 4 Mbps
De 5 Mbps até 8 Mbps
5 Mbps to 8 Mbps
De 9 Mbps até 10 Mbps
9 Mbps to 10 Mbps
De 11 Mbps até 20 Mbps
11 Mbps to 20 Mbps
TOTAL 12 9 13 4
REGIÃOREGION
Norte / North 6 10 7 4
Centro-Oeste / Center-West 7 12 8 5
Nordeste / Northeast 10 9 7 7
Sudeste / Southeast 16 8 19 2
Sul / South 11 11 10 5
DEPENDÊNCIA ADMINISTRATIVAADMINISTRATIVE JURISDICTION
Pública Municipal / Municipal Public 15 8 7 2
Pública Estadual / State Public 9 10 14 5
Total – Públicas / Total – Public schools 12 9 10 3
Particular / Private 11 11 20 7
Fonte: CGI.br/NIC.br, Centro Regional de Estudos para o Desenvolvimento da Sociedade da Informação (Cetic.br), Pesquisa Sobre o Uso das Tecnologias de Informação e Comunicação nas Escolas Brasileiras – TIC Educação 2016.Source: CGI.br/NIC.br, Regional Center for Studies on the Development of the Information Society (Cetic.br), Survey on the Use of Information and Communication Technologies in Brazilian Schools – ICT In Education 2016.
� CONTINUAÇÃO / CONTINUATION

ICT IN EDUCATION SURVEY 2016TABLES OF RESULTS SELECTED INDICATORS SCHOOLS382
EN
GLI
SH P
OR
TUG
UÊS D25A ESCOLAS, POR VELOCIDADE DA PRINCIPAL CONEXÃO À INTERNET
SCHOOLS BY MAIN INTERNET CONNECTION SPEEDTOTAL DE ESCOLAS URBANASTOTAL NUMBER OF URBAN SCHOOLS
Percentual (%)Percentage (%)
De 21 Mbps até 50 Mbps
21 Mbps to 50 Mbps
51 Mbps ou mais51 Mbps or more
Não sabeDoes not
know
Não respondeu
Did not answer
TOTAL 4 3 24 0
REGIÃOREGION
Norte / North 0 1 25 1
Centro-Oeste / Center-West 7 4 23 0
Nordeste / Northeast 4 2 18 0
Sudeste / Southeast 5 5 31 0
Sul / South 5 3 20 0
DEPENDÊNCIA ADMINISTRATIVAADMINISTRATIVE JURISDICTION
Pública Municipal / Municipal Public 1 2 34 0
Pública Estadual / State Public 2 1 25 0
Total – Públicas / Total – Public schools 1 2 30 0
Particular / Private 13 8 11 0
Fonte: CGI.br/NIC.br, Centro Regional de Estudos para o Desenvolvimento da Sociedade da Informação (Cetic.br), Pesquisa Sobre o Uso das Tecnologias de Informação e Comunicação nas Escolas Brasileiras – TIC Educação 2016.Source: CGI.br/NIC.br, Regional Center for Studies on the Development of the Information Society (Cetic.br), Survey on the Use of Information and Communication Technologies in Brazilian Schools – ICT In Education 2016.
� CONCLUSÃO / CONCLUSION

PARTE 4—
APÊNDICES
PART 4—
APPENDICES

2016 PESQUISA TIC EDUCAÇÃOAPÊNDICES 385
PO
RTU
GU
ÊS
GLOSSÁRIO
Antispam.br – Site mantido pelo CGI.br, que constitui uma fonte de referência imparcial sobre o spam. Foi concebido no âmbito da Comissão de Trabalho Anti-Spam (CT-Spam), do CGI.br. Mais informações em: <http://www.antispam.com.br>.
App – Sigla para aplicativos móveis, que são software desenvolvidos para dispositivos eletrônicos móveis, como celulares ou tablets. Gratuitos ou pagos, os aplicativos podem vir instalados no equipamento ou ser baixados em lojas específicas dos sistemas operacionais, como Google Play, App Store ou Windows Phone Store.
Baixar software VER DOWNLOAD
Banda larga – Conexão à rede com capacidade acima daquela usualmente conseguida em conexão discada via sistema telefônico. Não há uma definição de métrica de banda larga que seja aceita por todos, mas é comum que conexões em banda larga sejam permanentes e não comutadas como as conexões discadas. Mede-se a banda em bps (bits por segundo) ou seus múltiplos, Kbps e Mbps. Banda larga, usualmente, compreende conexões com mais de 100 Kbps, porém esse limite é muito variável de país para país e de serviço para serviço. No caso desta pesquisa, banda larga se refere às conexões diferentes da conexão discada. VER CONEXÃO DISCADA
Blog – É uma contração das palavras web log, usada para descrever uma forma de “diário” na Internet. A maior parte dos blogs é mantida por indivíduos (como os diários no papel), que escrevem suas ideias sobre os acontecimentos diários ou outros assuntos de interesse.
Browser (web browser) – Programas que permitem aos usuários interagirem com documentos da Internet. Entre eles estão software como Internet Explorer, Mozilla Firefox, Safari e Google Chrome.
Celular com Internet (WAP, GPRS, UMTS, etc.) – Telefone celular que oferece como uma de suas funcionalidades a possibilidade de acesso à Internet. Por meio desses aparelhos é possível ler e-mails, navegar por páginas da Internet, fazer compras e acessar informações de forma geral. Cada uma das siglas (WAP, GPRS, UMTS) indica uma tecnologia diferente para acessar a Internet pelo celular ou computador de mão.
Ceptro.br – Centro de Estudos e Pesquisas em Tecnologia de Redes e Operações, responsável por projetos que visam melhorar a qualidade da Internet no Brasil e disseminar seu uso, com especial atenção para seus aspectos técnicos e de infra-estrutura. O Ceptro.br gerencia, entre outros projetos, o PTT.br, NTP.br, e IPv6.br. Mais informações em: <http://www.ceptro.br/>.

PESQUISA TIC EDUCAÇÃO 2016APÊNDICES386
PO
RTU
GU
ÊS
CERT.br – Centro de Estudos, Resposta e Tratamento de Incidentes de Segurança no Brasil, responsável por tratar incidentes de segurança envolvendo redes conectadas à Internet no Brasil. O Centro também desenvolve atividades de análise de tendências, treinamento e conscientização, com o objetivo de aumentar os níveis de segurança e de capacidade de tratamento de incidentes no Brasil. Mais informações em: <http://www.cert.br/>.
Cetic.br – O Centro Regional de Estudos para o Desenvolvimento da Sociedade da Informação (Cetic.br) é responsável pela produção de indicadores e estatísticas sobre a disponibilidade e o uso da Internet no Brasil, divulgando análises e informações periódicas sobre o desenvolvimento da rede no país. Mais informações em: <http://www.cetic.br/>.
CGI.br – Comitê Gestor da Internet no Brasil. Criado pela Portaria Interministerial nº 147, de 31 de maio de 1995, alterada pelo Decreto Presidencial nº 4.829, de 3 de setembro de 2003, para coordenar e integrar todas as iniciativas de serviços Internet do país, promovendo a qualidade técnica, a inovação e a disseminação dos serviços ofertados. Mais informações em: <http://www.cgi.br>.
Compressão de arquivos – Tarefa realizada por software que reduz o tamanho de um arquivo digital para facilitar o envio e o recebimento via Internet. Um exemplo de programa que realiza esta tarefa é o WinZip.
Computador de mesa (desktop / PC) – Desktop literalmente significa “sobre a mesa” e é o termo usado para designar o computador pessoal em inglês. Geralmente o computador é composto de uma tela, que lembra um televisor, com um teclado à frente, um mouse para movimentar o ponteiro na tela e uma caixa metálica onde ficam os principais componentes eletrônicos do computador de mesa.
Computador portátil – É um computador compacto e fácil de transportar. Laptop, notebook e netbook são nomes em inglês geralmente utilizados para os tipos de computador portátil. O uso do computador portátil vem aumentando pela sua facilidade de transporte.
Conexão discada – Conexão comutada à Internet, realizada por meio de um modem analógico e uma linha da rede de telefonia fixa, que requer que o modem disque um número telefônico para realizar o acesso.
Conexão via cabo – Acesso à Internet que utiliza outro modelo de cabeamento que não o da estrutura das linhas telefônicas, mas sim os da TV a cabo.
Conexão via celular – Acesso à Internet, de longo alcance, que utiliza a transmissão sem fio das redes de telefonia móvel tais como HSCSD, GPRS, CDMA, GSM, entre outras.
Conexão via fibra ótica – Acesso à Internet que utiliza modelo similar ao de acesso via cabo. No entanto, em vez de cabo de par trançado comum àquele modelo, seu núcleo consiste de fibra ótica que permite transmissão em alto rendimento.
Conexão via linha telefônica – Acesso à Internet a partir de uma linha telefônica com uso de um modem xDSL que permite a navegação ao mesmo tempo em que haja conversa por telefone.
Conexão via modem 3G ou 4G – Acesso à Internet com tecnologia móvel, oferecido pelas empresas de telefonia celular. Os modems são conectados a computadores e permitem o uso de banda larga para usuários em movimento.
Conexão via rádio – Conexão à Internet sem fio, de longo alcance, que utiliza radiofrequências para transmitir sinais de dados (e prover o acesso à Internet) entre pontos fixos.

2016 PESQUISA TIC EDUCAÇÃOAPÊNDICES 387
PO
RTU
GU
ÊS
Conexão via satélite – Conexão à Internet sem fio, de longo alcance, que utiliza satélites para transmitir sinais de dados (e prover o acesso à Internet) entre pontos fixos distantes entre si.
Cursos on-line – Método de ensino que conta com o suporte da Internet para educação a distância.
Datashow – Projetor de vídeo; processa um sinal de vídeo e projeta a imagem correspondente em uma tela da projeção usando um sistema de lentes.
Desktop / PC VER COMPUTADOR DE MESA
Download – É a transferência de arquivos de um computador remoto/site para o computador “local” do usuário. No Brasil, é comum usar o termo “baixar” arquivos com o mesmo sentido que fazer download. No sentido contrário, ou seja, do computador do usuário ao computador remoto, a transferência de arquivos é conhecida como upload.
DVD – Sigla de Digital Video Disc. É um disco óptico utilizado para armazenamento de dados, com alta capacidade de armazenamento, muito superior à do CD.
e-learning – Ensino a distância. Cursos, de nível técnico, graduação e especialização que podem ser realizados por meio da Internet.
e-mail – É o equivalente a correio eletrônico. Refere-se a um endereço eletrônico, ou seja, a uma caixa postal para trocar mensagens pela Internet. Normalmente, a fórmula de um endereço de e-mail é “nome” + @ + “nome do domínio”. Para enviar mensagens para um determinado usuário, é necessário escrever o endereço eletrônico dele.
Excel (Microsoft Excel) – Software editor de planilhas desenvolvido pela empresa Microsoft.
Facebook – É uma rede social na Internet, que tem como objetivo estimular seus membros a criar novas amizades e manter relacionamentos. VER PARTICIPAR DE SITES DE COMUNIDADES E RELACIONAMENTOS
Filtro – Configuração na conta de e-mail que bloqueia mensagens indesejadas ou não solicitadas.
Firewall – Software ou programa utilizado para proteger um computador contra acessos não autorizados vindos da Internet.
Fórum – Página em que grupos de usuários trocam opiniões, comentam e discutem assuntos pertinentes a temas em comum ao grupo.
Internet banking – Conjunto de operações bancárias que podem ser feitas pela Internet, como ver saldo, fazer transferências, pagar contas, entre outras.
Internet Café VER LANHOUSE
Internet Explorer, Mozilla Firefox – São programas para navegação na Internet.
Kbps – Abreviatura de kilobits por segundo. É uma unidade de medida de transmissão de dados equivalente a mil bits por segundo.
Lanhouse – Estabelecimento comercial em que é possível pagar para utilizar um computador com acesso à Internet. É comum que esse estabelecimento ofereça também uma série de serviços, como impressão,

PESQUISA TIC EDUCAÇÃO 2016APÊNDICES388
PO
RTU
GU
ÊS
xerox, digitação, entre outros. No Brasil, a denominação lanhouse é a mais corrente, mas também podem ser chamados de cybercafé ou Internet café.
Laptop VER COMPUTADOR PORTÁTIL
Linux – Sistema operacional da família Unix, de código aberto, desenvolvido inicialmente por Linus Torvalds e que hoje conta com milhares de desenvolvedores em colaboração. VER SISTEMA OPERACIONAL
Mac OS – Sistema operacional padrão dos computadores Macintosh, produzidos pela Apple. VER SISTEMA
OPERACIONAL
Material on-line – Documentação ou conteúdo de curso ou atividade disponível para download pela Internet.
Mbps – Abreviatura de megabits por segundo. É uma unidade de medida de transmissão de dados equivalente a mil kilobits por segundo.
Mecanismo de busca – Uma ferramenta na Internet que serve para a procura de informações na Internet.
Mensagem instantânea – Programa de computador que permite o envio e o recebimento de mensagens de texto imediatamente. Normalmente, esses programas incorporam diversos outros recursos, como envio de figuras ou imagens animadas, conversação por áudio utilizando as caixas de som e o microfone do sistema, além de videoconferência (por meio de uma webcam).
Microsoft – Empresa multinacional de software, criadora do sistema operacional Windows.
Mouse – Equipamento para mover o ponteiro do computador.
NIC.br – Núcleo de Informação e Coordenação do Ponto BR. Entidade civil, sem fins lucrativos, que desde dezembro de 2005 implementa as decisões e projetos do Comitê Gestor da Internet no Brasil. Mais informações em: <http://www.nic.br>.
Notebook VER COMPUTADOR PORTÁTIL
On-line – Literalmente, “em linha”. On-line significa eletronicamente “disponível” no momento, ligado.
Pacote Office – Pacote de aplicativos produzidos pela empresa Microsoft para realizar diversas tarefas no computador. Entre eles estão o Word (editor de textos), o Excel (planilhas de cálculos), o PowerPoint (apresentações de slides) e o Outlook (gerenciamento de e-mails e contatos).
Página na Internet (webpage) – A web funciona como uma grande coleção de locais de informação agrupada. Cada página de informação de um agrupamento é uma webpage. Ao agrupamento dessas páginas denomina-se website, que significa literalmente “local na rede”.
Participar de sites de comunidades e relacionamentos – Em certas páginas da Internet é possível se cadastrar para entrar em contato com outras pessoas. Nessas páginas fazem-se novos amigos, reencontram-se os antigos e discutem-se assuntos de interesse. Essas são as páginas de comunidades e relacionamentos. VER REDE SOCIAL
Podcast – Junção de Personal on Demand (POD) e broadcast (Cast). Significa arquivos de áudio digital veiculados e compartilhados via Internet, frequentemente usados em série de episódios.

2016 PESQUISA TIC EDUCAÇÃOAPÊNDICES 389
PO
RTU
GU
ÊS
Registro.br – O Registro.br é o executor de algumas das atribuições do Comitê Gestor da Internet no Brasil, entre as quais as atividades de registro de nomes de domínio, a administração e a publicação do DNS para o domínio.br. Realiza ainda os serviços de distribuição e manutenção de endereços Internet. Mais informações em: <http://www.registro.br/>.
Rede Social – Na Internet, as redes sociais são comunidades virtuais em que os usuários criam perfis para interagir e compartilhar informações. Entre as mais utilizadas no Brasil estão Facebook e Twitter. VER PARTICIPAR DE SITES DE COMUNIDADES E RELACIONAMENTOS
Sistema operacional – Programa ou conjunto de programas e aplicativos que servem de interface entre o usuário e o computador. O sistema operacional gerencia os recursos de hardware do computador via software. VER LINUX, MAC OS E WINDOWS
Site – Página ou conjunto de páginas na Internet que está identificada por um nome de domínio. O site pode ser formado por uma ou mais páginas de hipertexto, que podem conter textos, imagens, gráficos, vídeos e áudios.
Skype – Software que permite comunicação de voz pela Internet através de conexões sobre VoIP (Voz sobre IP) e pode substituir a linha telefônica tradicional.
Software – Qualquer programa de computador. O computador se divide em duas partes: a parte física, palpável, que é chamada de hardware, e a parte não-física, os programas, que são as instruções para qualquer computador funcionar, chamadas de software.
Tablet – É um dispositivo móvel em forma de prancheta, que não possui teclado, mas é sensível ao toque. Assim como um computador portátil, os tablets permitem o acesso à Internet, bem como o download de aplicativos em lojas específicas na Internet.
Tecnologia assistiva – Nome da área que estuda formas de buscar acesso pleno a produtos e recursos pelas pessoas, incluindo aquelas com deficiências.
TI (Tecnologias da Informação) – O termo designa o conjunto de recursos tecnológicos e computacionais para geração e uso da informação.
TIC – Sigla de Tecnologias de Informação e Comunicação.
Videoconferência – Comunicação de imagem (vídeo) e voz via Internet.
W3C (World Wide Web Consortium) – O W3C é um consórcio internacional que tem como missão conduzir a Web ao seu potencial máximo, criando padrões e diretrizes que garantam sua evolução permanente. O W3C no Brasil reforça os objetivos globais de uma Web para todos, em qualquer dispositivo, baseada no conhecimento, com segurança e responsabilidade. Mais informações em: <http://www.w3c.br/>.
WAP – Sigla de Wireless Application Protocol ou Protocolo de Aplicação sem Fio. É um padrão aberto que permite que dispositivos móveis, como celulares ou PDAs, acessem na Internet informações ou serviços projetados especialmente para seu uso.
Webcam – Câmera de vídeo de baixo custo que capta e transfere imagens de modo quase instantâneo para o computador.

PESQUISA TIC EDUCAÇÃO 2016APÊNDICES390
PO
RTU
GU
ÊS
Website – Website significa literalmente um “local na rede”. Pode-se dizer que é um conjunto de páginas na Internet sobre determinado tema identificado por um endereço web. VER PÁGINA NA INTERNET
WiFi – Abreviatura de Wireless Fidelity. Marca licenciada originalmente pela Wi-Fi Alliance para descrever a tecnologia de redes sem fios embarcadas (WLAN) baseadas no padrão IEEE 802.11.
Windows – Nome comercial do sistema operacional desenvolvido pela empresa Microsoft. VER SISTEMA
OPERACIONAL
WinZip VER COMPRESSÃO DE ARQUIVOS
Word (Microsoft Word) – Software editor de texto desenvolvido pela empresa Microsoft.
WWW – Sigla de World Wide Web.
YouTube – Website que permite aos usuários carregar, assistir e compartilhar vídeos em formato digital na Internet, sem a necessidade de download do arquivo de vídeo para o computador.
2016 PESQUISA TIC EDUCAÇÃOAPÊNDICES 391
PO
RTU
GU
ÊS
LISTA DE ABREVIATURAS
AMI – Alfabetização Midiática e Informacional
Cepal – Comissão Econômica para a América Latina e Caribe das Nações Unidas
Cetic.br – Centro Regional de Estudos para o Desenvolvimento da Sociedade da Informação
CGI.br – Comitê Gestor da Internet no Brasil
CLT - Consolidação das Leis do Trabalho
EaD - Educação a distância
EF – Ensino Fundamental
EM – Ensino Médio
Enem – Exame Nacional do Ensino Médio
Eurostat – Instituto de Estatísticas da Comissão Europeia
FNDE – Fundo Nacional de Desenvolvimento da Educação
IBGE – Instituto Brasileiro de Geografia e Estatística
Ideb – Índice de Desenvolvimento da Educação Básica
Inep – Instituto Nacional de Estudos e Pesquisas Educacionais Anísio Teixeira
Ipea – Instituto de Pesquisa Econômica Aplicada
LSE – London School of Economics
MCTI – Ministério de Ciência, Tecnologia e Inovação
MEC – Ministério da Educação
NIC.br – Núcleo de Informação e Coordenação do Ponto BR
OCDE – Organização para a Cooperação e Desenvolvimento Econômico
OIT – Organização Internacional do Trabalho

PESQUISA TIC EDUCAÇÃO 2016APÊNDICES392
PO
RTU
GU
ÊS
OLPC – One Laptop per Child
ONU – Organização das Nações Unidas
Osilac – Observatório para a Sociedade da Informação na América Latina e Caribe
Pisa – Programa Internacional de Avaliação dos Alunos
Pnad – Pesquisa Nacional por Amostra de Domicílios
PNBL – Plano Nacional de Banda Larga
PBLE – Programa Banda Larga nas Escolas
PNE – Plano Nacional de Educação
Pnud – Programa das Nações Unidas para o Desenvolvimento
ProInfo – Programa Nacional de Informática na Educação
Prouca – Programa Um Computador por Aluno
ProUni – Programa Universidade para Todos
PUC-SP – Pontifícia Universidade Católica de São Paulo
REA – Recursos Educacionais Abertos
Saeb – Sistema Nacional de Avaliação da Educação Básica
SM – Salário mínimo
SEED – Secretaria de Educação a Distância, órgão do Ministério da Educação
Sisu – Sistema de Seleção Unificada
TAI – Testes Adaptativos Informatizados
TIC – Tecnologia de Informação e Comunicação
UCA – Um Computador por Aluno
UFRGS – Universidade Federal do Rio Grande do Sul
UFMG – Universidade Federal de Minas Gerais
UIT – União Internacional de Telecomunicações
UIS – Unesco Institute for Statistics
Unesco – Organização das Nações Unidas para a Educação, a Ciência e a Cultura
Unicef – Fundo das Nações Unidas para a Infância
USP – Universidade de São Paulo

2016 ICT IN EDUCATION SURVEYAPPENDICES 393
EN
GLI
SH
GLOSSARY
3G or 4G modem connection – Internet access via mobile technology provided by mobile phone enterprises. Modems are connected to computers and allow for the use of broadband for users on the move.
Antispam.br – Website maintained by the CGI.br, which is a reference on impartial spam. It was designed within the scope Anti-Spam Working Commission (CT-Spam), of the CGI.br. More information at: <http://www.antispam.com.br>.
App – abbreviation used to refer to computer programs designed to run on mobile devices, such as smartphones and tablets. Many devices are often sold with several apps included as pre-installed software, but they can also be downloaded, free or not, at their specific platforms such as Google Play, App Store or Windows Phone Store.
Assistive technology – Field that studies ways to provide full access to products and resources to people, including those with disabilities.
Blog – It is a contraction of the words web log which is used to describe an online “journal”. The majority of these blogs, similarly to paper journals, is maintained by individuals who write their ideas about daily events and other topics of interest.
Broadband – Internet access that offers higher capacity than that usually supplied by dial-up connections. There is no metric definition of broadband that is universally accepted. However, it is common for broadband connections to be permanent and not commuted as the dial-up ones. Bandwidth is measured in bps (bits per second) or its multiples, kbps and Mbps. Broadband usually comprises connections that supply download speeds of more than 256 Kbps; but this is highly variable from country to country and service to service. For the purpose of this survey, broadband comprises any connection that differs from dial-up connections. SEE DIAL-UP CONNECTION
Browser (web browser) – Programs that enable users to interact with Internet documents. These include software such as Internet Explorer, Mozilla Firefox, Safari and Google Chrome.
Cable connection – Internet access via a TV cable connection rather than landline infrastructure.
Ceptro.br – The Center of Studies and Research on Network Technologies and Operations (Ceptro.br) is responsible designing projects to enhance the Brazilian Internet and disseminating its use, especially regarding its technical and infrastructural aspects. Ceptro.br manages, among other projects, the PTT.br, the NTP.br, and the IPv6.br. More information available at: <http://www.ceptro.br/>.
CERT.br – The Brazilian Computer Emergency Response Team is in charge of handling security incidents involving networks connected to the Brazilian Internet. The activities carried out by the team also include
ICT IN EDUCATION SURVEY 2016APPENDICES394
EN
GLI
SH
trend analysis, training and promoting awareness to increase security levels and incident treatment capacity in Brazil. More information available at: <http://www.cert.br/>.
Cetic.br – Regional Center for Studies on the Development of the Information Society (Cetic.br) is responsible for the production of indicators and statistics on the availability and use of the Internet in Brazil; periodically publishing analyzes and information on the development of the network across the country. More information available at: <http://www.cetic.br/>.
CGI.br – Brazilian Internet Steering Committee. The Brazilian Internet Steering Committee (CGI.br) was created by the Interministerial Ordinance number 147, from May 31, 1995, which was amended by Presidential Decree number 4,829, from September 3, 2003, to coordinate and integrate all Internet service initiatives in Brazil; promoting technical quality, innovation and advertising the services on offer. More information available at: <http://www.cgi.br>.
Datashow – Video projector, which processes a video signal and projects the image in a screen using a lens system.
Desktop computer (PC) – Generally the computer comprises a monitor, which resembles a TV set, with a keyboard in front of it, a mouse to move the arrow on the screen, and a metal box where the main electronic components of a desktop are.
Dial-up connection – A temporary connection to the Internet via an analogue modem and standard telephone line, which requires the modem to dial a phone number to access the Internet.
Download – It is the transfer of files from a remote computer/website to user´s “local” computer. In Brazil, we use the term “baixar” (“lower”) to mean download. When you transfer a file in the other direction, that is, from a user to a remote computer, the file transfer is referred to as upload.
Download software SEE DOWNLOAD
DVD – Acronym for Digital Video Disc. Optical disc with high data storage capacity, far superior to the CD.
e-learning – Distance learning. Long distance technical, undergraduate and specialization courses that can be taken on the Internet.
e-mail – Stands for electronic mail. Type of PO Box, which enables message exchange through the Internet. The usual configuration of an e-mail is “name” + @ + “domain name”. In order to send messages to a certain user it is necessary to type in his/her e-mail.
Excel (Microsoft Excel) – Software developed by Microsoft to edit spreadsheets.
Facebook – Social network on the Internet, which allows its members to create new friendships and maintain relationships. SEE TAKING PART IN SOCIAL NETWORKS
Fiber-optic connection – Internet access that uses a model similar to cable access. However, instead of twisted-pair cable, its core consists of fiber optics that allow for data transmission at the speed of light.
File compacting – Task carried out by specific software that reduces the size of digital files in order to facilitate sending and receiving them via the Internet. The most used software of this kind is WinZip.

2016 ICT IN EDUCATION SURVEYAPPENDICES 395
EN
GLI
SH
Filter – E-mail account configuration that blocks unwanted or unsolicited messages.
Firewall – Program or software used to protect a computer of unauthorized access from other Internet users.
Forum – Lists in which groups of users exchange opinions, comment and discuss several issues that are relevant to common themes.
ICT – Acronym for Information and Communication Technology.
Instant messaging – Computer program that enables users to send and receive text messages in real time. Typically, these programs incorporate several other tools such as transmission of pictures or animated images, audio conversations using sound boxes and microphone system, and videoconferencing (via a webcam).
Internet banking – Set of bank transactions that can be done on the Internet, such as balance checks, money transfers, bill payments among others.
Internet Café SEE LAN HOUSE
Internet Explorer, Mozilla Firefox – Internet browsers.
Internet Mobile Phone (WAP, GPRS, UMTS, etc.) – Mobile phone that enables connection to the Internet. Through these devices it is possible to read e-mails, browse through websites, shop and access information in general. Each acronym (WAP, GPRS, UMTS) indicates a different type of technology used to access the Internet via mobile phones and handheld computers.
IT – Acronym for Information Technology.
Kbps – Stands for kilobits per second. A unit of measuring data transmission equivalent to a thousand bits per second.
LAN house – A commercial establishment where people can pay to use a computer with access to the Internet. This establishment usually offers many services, as printing, photocopying, typing, among others. In Brazil, LAN house is the most used term, but it can also be called cybercafé or Internet café.
Landline connection – Internet access from a telephone landline with a modem that allows for simultaneous Internet browsing and phone use.
Laptop SEE PORTABLE COMPUTER
Linux – Open source operating system from the Unix family, initially developed by Linus Torvalds and which currently has thousands of developers working in collaboration. SEE OPERATING SYSTEM
Mac OS – Standard operating system for Macintosh computers produced by Apple. SEE OPERATING SYSTEM
Mbps – Abbreviation of megabits per second. It is a unit of measurement for data transmission equivalent to a thousand kilobits per second.
Microsoft – Multinational software manufacturer, which developed the Windows operating system.
Mobile phone connection – Wireless, long range Internet connection, which uses a long range wireless transmission from mobile network technologies such as HSCSD, GPRS, CDMA, GSM, etc.

ICT IN EDUCATION SURVEY 2016APPENDICES396
EN
GLI
SH
Mouse – Device used to move a computer’s pointer.
NIC.br – Brazilian Network Information Center. Civil non-profit entity that, since December 2005, implements the decisions and projects of the Brazilian Internet Steering Committee. More information available at: <http://www.nic.br>.
Notebook SEE PORTABLE COMPUTER
Office Package – Applications package produced by Microsoft to enable several tasks in a computer. The software comprised include Microsoft Word (text editor), Excel (spreadsheets), Powerpoint (slide presentations) and Outlook (e-mail and contacts management).
Online – Literally “in line”. Online means electronically available at the moment, turned on.
Online courses – Teaching method that relies on Internet support for distance education (e-learning).
Online material – Documents or content from a course or activity available for download on the Internet.
Operating system – Set of computer programs and applications that works as the interface between the user and the computer. The operating system manages the computer hardware resources through software. SEE LINUX, MAC OS AND WINDOWS
Podcast – Combination of the two words: Personal on Demand (POD) and broadcast (Cast). Podcasts are digital audio files streamed and shared online, via the Internet, often available in the form of episodes.
Portable computer – It is a compact computer, easy to transport. Its performance may be below that of a desktop computer. Laptops, notebooks and netbooks are names of portable computers English. Portable computers are becoming increasingly more popular for being easy to transport.
Radio connection – Wireless, long range Internet connection, which uses radio frequencies to transmit data signals (and provide access to the Internet) between fixed points.
Registro.br – Registro.br is in charge of some of the Brazilian Internet Steering Committee’s attributions; such as domain name registration activities, and the administration and publication of the DNS for the .br domain. It also accounts for the distribution and maintenance of Internet addresses. More information available at: <http://www.registro.br/>.
Satellite connection – Wireless, long range Internet connection, which uses satellites to transmit data signals (and provide access to the Internet) between fixed points.
Search engines – Internet tool to search for information online.
Site – Page or set of pages on the Internet registered under a domain name. A website may be comprised of one or more hypertext pages or it may contain text, images, charts, video and audio.
Skype – Software that enables voice communication on the Internet using VoIP (Voice over IP) technology, which may replace the traditional landline phones.

2016 ICT IN EDUCATION SURVEYAPPENDICES 397
EN
GLI
SH
Social Network – Social networks on the Internet are virtual communities where users create profiles to interact and share information. Among the most popular networks in Brazil are Facebook and Twitter. SEE TAKING PART IN SOCIAL NETWORKS
Software – Any computer program. A computer is divided into two parts: the physical, tangible part hardware, and the non-physical part, the programs, which are the instructions for any computer to work (software).
Tablet – Mobile devices in the shape of a clipboard. They do not have a keyboard, but are sensitive to touch. Hence, as portable computers, tablets enable access to the Internet, as well as to downloading applications from different online stores.
Taking part in social networks – It is possible to register on certain websites where you can get in touch with other people. On these pages you are able to make new friends, meet old friends and discuss themes of common interest. These are referred to as social network pages. SEE SOCIAL NETWORK
Videoconference – Image (video) and voice communication over the Internet.
W3C (World Wide Web Consortium) – The W3C is an international consortium whose mission is to promote the realization of the Web’s full potential, by creating standards and guidelines to ensure its ongoing development. The W3C in Brazil supports global goals for a Web for all, from any device, based on knowledge, security and responsibility. More information available at: <http://www.w3c.br/>.
WAP – Acronym for Wireless Application Protocol. An open standard that enables mobile devices, such as mobile phones or PDAs, to access information and services, designed specifically for its use, over the Internet.
Webcam – Low cost video camera that captures and transfers images almost instantly to a computer.
Webpage – A Web page corresponds to a Web address, which one can see and browse through a browser. The web functions as a great collection of websites where information, images and objects related to particular content available online are grouped.
Website – Website literally means a “place in the network”. It can be said that it is a set of pages on a particular topic identified by a web address. SEE WEBPAGE
Wi-Fi – Acronym for Wireless Fidelity. Trademark of Wi-Fi Alliance, created to describe a type of wireless network technology (WLAN) based on the IEEE 802.11 standard.
Windows – Commercial name of the operating system developed by Microsoft. SEE OPERATING SYSTEM
WinZip SEE FILE COMPACTING
Word (Microsoft Word) – Text editor developed by Microsoft.
WWW – Acronym for World Wide Web.
YouTube – Website that allows users to load, watch and share videos in digital format over the Internet, without having to download the video file in their computer.


2016 ICT IN EDUCATION SURVEYAPPENDICES 399
EN
GLI
SH
LIST OF ABBREVIATIONS
CAT – Computerized Adaptive Testing
Cetic.br – Centro Regional de Estudos para o Desenvolvimento da Sociedade da Informação (Regional
Center for Studies on the Development of the Information Society)
CGI.br – Comitê Gestor da Internet no Brasil (Brazilian Internet Steering Committee)
CLT – Consolidação das Leis do Trabalho (Employment contract)
EaD – Educação a distância (e-learning)
ECLAC – Economic Commission for Latin America and the Caribbean
EF – Ensino Fundamental (Elementary Education)
EM – Ensino Médio (Secondary Education)
Enem – Exame Nacional do Ensino Médio (Brazilian High School National Exam)
Eurostat – Statistical Office of the European Commission
FNDE – Fundo Nacional de Desenvolvimento da Educação (National Fund for Education Development)
IBGE – Instituto Brasileiro de Geografia e Estatística (Brazilian Institute of Geography and Statistics)
ICT – Information and Communication Technologies
Ideb – Índice de Desenvolvimento da Educação Básica (Index of Basic Education Development)
ILO – International Labor Organization
Inep – Instituto Nacional de Estudos e Pesquisas Educacionais Anísio Teixeira (Anisio Teixeira National
Institute of Education Study and Research)
Ipea – Instituto de Pesquisa Econômica Aplicada (Institute for Applied Economic Research)
ITU – International Telecommunication Union
LSE – London School of Economics
MCTI – Ministério de Ciência, Tecnologia e Inovação (Ministry of Science and Technology)

ICT IN EDUCATION SURVEY 2016APPENDICES400
EN
GLI
SH
MEC – Ministério da Educação (Ministry of Education)
MIL – Media and Informational Literacy
MW – Minimum wage
NIC.br – Núcleo de Informação e Coordenação do Ponto BR (Brazilian Network Information Center)
OECD – Organization for Economic Cooperation and Development
OER – Open Educational Resource
OLPC – One Laptop per Child
Osilac – Observatory for the Information Society in Latin America and the Caribbean
Pisa – Programa Internacional de Avaliação dos Alunos (Program for International Student Assessment)
Pnad – Pesquisa Nacional por Amostra de Domicílios (National Households Sample Survey)
PNBL – Plano Nacional de Banda Larga (National Broadband Plan)
PBLE – Programa Banda Larga nas Escolas (Broadband in Schools Programme)
PNE – Plano Nacional de Educação (National Plan of Education)
ProInfo – Programa Nacional de Informática na Educação (National Program for IT in Education)
Prouca – Programa Um Computador por Aluno (One Laptop per Student Program)
ProUni – Programa Universidade para Todos (University for All Program)
PUC-SP – Pontifícia Universidade Católica de São Paulo (Pontifical Catholic University of São Paulo)
Saeb – Sistema Nacional de Avaliação da Educação Básica (National System of Basic Education Evaluation)
SEED – Secretaria de Ensino a Distância (E-Learning Office), a body of the Ministry of Education
Sisu – Sistema de Seleção Unificada (Unified Selection System)
UCA – Um Computador por Aluno (One Computer per Child)
UFRGS – Universidade Federal do Rio Grande do Sul (Federal University of Rio Grande do Sul)
UFMG – Universidade Federal de Minas Gerais (Federal University of Minas Gerais)
UIS – Unesco Institute for Statistics
UN – United Nations
UNDP – United Nations Development Programme
Unesco – United Nations Educational, Scientific and Cultural Organization
Unicef – United Nations Children’s Fund
USP – Universidade de São Paulo (University of São Paulo)


Tel 55 11 5509 3511 Fax 55 11 5509 3512
www.cgi.br www.nic.br
www. cetic .br


![Fiemg Interacao Ict Empresa[1]](https://static.fdocumentos.com/doc/165x107/546bb49fb4af9f6b2c8b4d48/fiemg-interacao-ict-empresa1.jpg)