Indicadores Comite Gestor - Uso da internet na Educação
452
PESQUISA SOBRE O USO DAS TECNOLOGIAS DE INFORMAÇÃO E COMUNICAÇÃO NAS ESCOLAS BRASILEIRAS ICT EDUCATION 2010 SURVEY ON THE USE OF INFORMATION AND COMMUNICATION TECHNOLOGIES IN BRAZILIAN SCHOOLS EDUCAÇÃO 2010 TIC Comitê Gestor da Internet no Brasil Brazilian Internet Steering Committee www.cgi.br
-
Upload
onthe-class -
Category
Education
-
view
7.278 -
download
0
description
Pesquisa do Comite Gestor internet Brasil sobre uso da Internet na Educação.
Transcript of Indicadores Comite Gestor - Uso da internet na Educação
Pesquisa sobre o uso das Tecnologias de informação e comunicação nas escolas brasileiras
ICT EDUCATION 2010 Survey on the uSe of InformatIon and
CommunICatIon teChnologIeS In BrazIlIan SChoolS
EDUCAçãO2010TIC
Comitê Gestor da Internet no BrasilBrazilian Internet Steering Committee
www.cgi.br
Atribuição uso Não ComerCiAl VedAdA A CriAção de obrAs deriVAdAs 2.5 brAsil
Attribution noncommerciAl no DerivAtive Works 2.5 brAzil
VoCÊ Pode:You Are Free:
copiar, distribuir, exibir e executar a obra sob as seguintes condições:to copy, distribute and transmit the work under the following conditions:
Atribuição: Você deve dar crédito ao autor original, da forma especificada pelo autor ou licenciante.Attribution: You must attribute the work in the manner specified by the author or licensor (but not in any way that suggests that they endorse you or your use of the work).
uso Não ComerCiAl: Você não pode utilizar esta obra com finalidades comerciais.noncommerciAl: You may not use this work for commercial purposes.
VedAdA A CriAção de obrAs deriVAdAs: Você não pode alterar, transformar ou criar outra obra com base nesta.no DerivAte Works: You may not alter, transform, or build upon this work.

Comitê Gestor da Internet no BrasilBrazilian Internet Steering Committee
Núcleo de Informação e Coordenação do Ponto BRBrazilian Network Information Center
São Paulo2011
Pesquisa sobre o uso das Tecnologias de informação e comunicação nas escolas brasileiras
ICT EDUCATION 2010 Survey oN the uSe of INformatIoN aNd
CommuNICatIoN teChNologIeS IN BrazIlIaN SChoolS
EDUCAçãO2010TIC

Núcleo de Informação e Coordenação do Ponto BRBrazilian Network Information Center
Diretor Presidente / CEODemi Getschko
Diretor Administrativo / CFORicardo Narchi
Diretor de Serviços e Tecnologia / CTOFrederico Neves
Diretor de Projetos Especiais e de Desenvolvimento / Director of Special Projects and DevelopmentMilton Kaoru Kashiwakura
Centro de Estudos sobre as Tecnologias da Informação e da Comunicação – Cetic.br Center of Studies on Information and Communication Technologies (Cetic.br)
Coordenação Executiva e Editorial / Executive and Editorial CoordinationAlexandre F. Barbosa
Coordenação Técnica / Technical Coordination Juliano Cappi e Emerson Santos
Equipe técnica / Technical TeamCamila Garroux, Isabela Coelho, Suzana Alves, Tatiana Jereissati e Winston Oyadomari
Edição / Editing : Comunicação NIC.br: Caroline D’Avo, Everton Teles Rodrigues, Fabiana Araújo
Apoio Editorial / Editorial Support Projeto gráfico / Graphic Design : Suzana De Bonis / DB ComunicaçãoPreparação de texto / Proof reading : Pedro BarrosTradução para o inglês / Translation into English : Karen Brito-Sexton Revisão / Revision : Anthony Sean Cleaver e Leandro RodriguesComposição / Desktop publishing : Alvaro T. De Bonis
Esta publicação está disponível também em formato digital em www.cetic.brThis publication is also available in digital format at www.cetic.br
Dados Internacionais de Catalogação na Publicação (CIP)
(Câmara Brasileira do Livro, SP, Brasil)
Pesquisa sobre o uso das tecnologias de informação e comunicação no Brasil : TIC Edu-cação 2010 = Survey on the use of information and communication technologies in Brazil : ICT Education 2010 / [coordenação executiva e editorial/ executive and editorial coordination, Alexandre F. Barbosa ; tradução/ translation Karen Brito Sexton]. -- São Paulo : Comitê Gestor da Internet no Brasil, 2011.
Edição bilíngue: português/inglês.
ISBN 978-85-60062-45-4
1. Internet (Rede de computadores) – Brasil 2. Tecnologia da informação e da comunicação – Brasil – Pesquisa I. Barbosa, Alexandre F.. II. Título: Survey on the use of information and communication technologies in Brazil : ICT Education 2010.
11-0823 CDD- 004.6072081
Índices para catálogo sistemático:
1. Brasil : Tecnologias de informação e comunicação : Uso : Pesquisa 004.60720812. Pesquisa : Tecnologia da informação e comunicação : Uso : Brasil 004.6072081
TIC Educação 2010Pesquisa sobre o Uso das Tecnologias de Informação
e Comunicação nas Escolas Brasileiras
ICt education 2010 Survey on the use of Information and Communication technologies in Brazilian Schools
COMITÊ GESTOR DA INTERNET NO BRASIL – CGI.brBrazIlIaN INterNet SteerINg CommIttee (CgI.br)
(em dezembro de 2010 / in december 2010)
Augusto Cesar Gadelha Vieira Coordenador / Coordinator
Conselheiros / Counselors
Adriano Silva MotaAlexandre Annenberg Netto
André Barbosa FilhoCarlos Alberto Afonso
Demi GetschkoErnesto Costa de Paula
Flávio Rech WagnerFrancelino José Lamy de Miranda Grando
Gustavo Gindre Monteiro SoaresHenrique Faulhaber
Jaime Barreiro WagnerJorge Santana de Oliveira
Lisandro Zambenedetti GranvilleMarcelo Bechara de Souza Hobaika
Marcelo Fernandes CostaMario Luis Teza
Nelson Simões da SilvaNivaldo Cleto
Rogério Santanna dos SantosRonaldo Mota Sardenberg
Diretor executivo / Executive Director
Hartmut Richard Glaser

55
AGRAdECImENToS
Em seu primeiro ano de realização, a Pesquisa sobre o Uso das Tecnologias de Informação e Comunicação nas Escolas Brasileiras – TIC Educação 2010 contou com o apoio e a colaboração de pessoas renomadas pelo conhecimento em educação e tecnologias de informação e comunicação.
A importância da educação para a inclusão digital impulsionou o CGI.br a incluir esse tema fun-damental em suas pesquisas. A compreensão dos desafios sobre a apropriação das TIC em âmbito educacional serviu como fonte de motivação e estímulos para que um grupo de especialistas par-ticipasse ativamente desse trabalho, colaborando voluntariamente em meio a um esforço coletivo com críticas e contribuições.
Nesta edição, o Cetic.br agradece especialmente a:
Abril Educação
Ana Ralston e Roberta Camparini
Fundação Padre Anchieta
Neyza Furgler
Instituto Paulo Montenegro
Ana Lucia Lima
Fundação Victor Civita
Angela Cristina Dannemann e Mauro Morellato
Instituto Ayrton Senna
Adriana Martinelli
Ministério da Educação (MEC)
Demerval Bruzzi e Wellington Maciel
Organização dos Estados Ibero-americanos / Instituto para o Desenvolvimento e a Inovação Educativa (OEI/IDIE)
Katya Garabetti, Marcia Padilha Lotito e Solange Aguirre
Pontifícia Universidade Católica do Paraná (PUC-PR)
Dilmeire Vosgerau
Pontifícia Universidade Católica de São Paulo (PUC-SP)
Maria da Graça Moreira da Silva e Maria Elizabeth Bianconcini de Almeida
Safernet
Rodrigo Nejm
Universidade Federal de Minas Gerais (UFMG)
Marisa Duarte
Universidade Federal do Rio Grande do Sul (UFRGS)
Léa da Cruz Fagundes
Organização das Nações Unidas para a Educação, a Ciência e a Cultura (Unesco)
Claude Akpabie, Guilherme Canela e Maria Inês Bastos
Universidade de São Paulo (USP)
Ocimar Munhoz Alavarse

66
ACKNoWLEdGEmENTS
In its first year, the Survey on the Use of Information and Communication Technologies in Brazilian Schools – ICT Education 2010 has had the support and collaboration of people who are renowned for their knowledge in education and information and communication technologies.
The importance of education for digital inclusion has prompted the CGI.br to address this key theme in its surveys. Awareness of the challenges of embedding ICT in the educational environments has been the motivation and stimulus for the active involvement of a group of experts in this project, who voluntarily collaborated by reviewing and contributing in a collective effort.
In this edition the CGI.br gives special thanks to:
Abril Educação
Ana Ralston and Roberta Camparini
Padre Anchieta Foundation
Neyza Furgler
Paulo Montenegro Institute
Ana Lucia Lima
Victor Civita Foundation
Angela Cristina Dannemann and Mauro Morellato
Ayrton Senna Institute
Adriana Martinelli
Ministry of Education (MEC)
Demerval Bruzzi and Wellington Maciel
Organization of Iberian-American States / Institute for Development and Educational Innovation (OEI/IDIE)
Katya Garabetti, Marcia Padilha Lotito and Solange Aguirre
Pontific Catholic University of Paraná (PUC-PR)
Dilmeire Vosgerau
Pontific Catholic University of São Paulo (PUC-SP)
Maria da Graça Moreira da Silva and Maria Elizabeth Bianconcini de Almeida
Safernet
Rodrigo Nejm
Federal University of Minas Gerais (UFMG)
Marisa Duarte
Federal University of Rio Grande do Sul (UFRGS)
Léa da Cruz Fagundes
United Nations Educational, Scientific and Cultural Organization (Unesco)
Claude Akpabie, Guilherme Canela and Maria Inês Bastos
University of São Paulo (USP)
Ocimar Munhoz Alavarse

77
PO
RTu
Gu
ÊS
En
gli
sh
SUmÁRIo / CoNteNtS
5 AGRADECIMENTOS / AcknowledgementS, 6
17 PREFáCIO / Foreword, 135
19 APRESENTAçãO / PreSentAtion, 137
21 INTRODUçãO / introduction, 139
PARTE 1: ARTIGOS / Part 1: artICleS
27 O CENáRIO ATUAL DO USO DE TECNOLOGIAS DIGITAIS DA INFORMAçãO E COMUNICAçãO
overview oF the uSe oF digitAl inFormAtion And communicAtion technologieS, 145MARIA DA GRAçA MOREIRA DA SILVA E MARIA ELIzABETh BIANCONCINI DE ALMEIDA
35 DESAFIOS DA EDUCAçãO PARA PROMOçãO DO USO éTICO E SEGURO DA INTERNET NO BRASIL
the chAllengeS oF educAtion in Promoting ethicAl And SAFe uSe oF the internet in
BrAzil, 153RODRIGO NEjM
43 FORMAçãO DE DOCENTES PARA O USO DAS TIC NO ENSINO/APRENDIZAGEM NA AMéRICA LATINA
teAcher trAining For the uSe oF ict in educAtion in lAtin AmericA, 161MARIA INêS BASTOS
51 NATIVOS DIGITAIS: A NUVEM DOS “SEM FIO”
digitAl nAtiveS: the cloud oF the “wireleSS”, 167ROGéRIO DA COSTA
57 O PAPEL DA INFORMAçãO NO DESENVOLVIMENTO SOCIAL
the role oF inFormAtion in SociAl develoPment, 173LADISLAU DOWBOR
65 EDUCAçãO E DESENVOLVIMENTO: MODOS DE REGULAçãO DOS SISTEMAS DE ENSINO
educAtion And develoPment: regulAtion modeS in educAtionAl SyStemS, 181MARISA DUARTE
77 DESAFIOS DA PESqUISA EDUCACIONAL E AS AVALIAçõES ExTERNAS: ALGUMAS RELAçõES COM O
CONHECIMENTO E A POLíTICA
chAllengeS For the Study oF educAtion And externAl evAluAtionS: PArAllelS with
knowledge And PoliticS, 193OCIMAR MUNhOz ALAVARSE

Survey on ICT Education 2010CONTENTS
PO
RTu
Gu
ÊS
En
gli
sh
8
PARTE 2: TIC EDuCAÇÃO / Part 2: ICt eduCatIoN
89 RELATóRIO METODOLóGICO TIC EDUCAçãO 2010
methodologicAl rePort ict educAtion 2010, 205
97 PERFIL DA AMOSTRA TIC EDUCAçãO 2010
SAmPle ProFile ict educAtion 2010, 213
101 ANáLISE DOS RESULTADOS TIC EDUCAçãO 2010
AnAlySiS oF reSultS ict educAtion 2010, 217
PARTE 3: TABELAS DE RESuLTADOS / Part 2: taBle of reSultS
251 PROFESSORES
teAcherS
397 INDICADORES SELECIONADOS PARA ALUNOS, COORDENADORES PEDAGóGICOS E DIRETORES
Selected indicAtorS For StudentS, directorS oF StudieS, And PrinciPAlS
PARTE 4: APÊNDICES / Part 4: aPPeNdIXeS
435 GLOSSáRIO
gloSSAry, 443
441 LISTA DE ABREVIATURAS
liSt oF ABBreviAtionS, 447

2010 Pesquisa TIC EducaçãoSuMÁRIO
PO
RTu
Gu
ÊS
En
gli
sh
9
LISTA dE GRÁFICoS / Chart lISt
PERFIL DA AMOSTRA / SamPle ProfIle 97 PERFIL DA AMOSTRA – SExO
SAmPle ProFile – gender, 213
98 PERFIL DA AMOSTRA DE ALUNOS – FAIxA ETáRIA
StudentS SAmPle ProFile – Age grouP, 214
98 PERFIL DA AMOSTRA DE EDUCADORES – FAIxA ETáRIA
educAtorS SAmPle ProFile – Age grouP, 214
98 PERFIL DA AMOSTRA – DEPENDÊNCIA ADMINISTRATIVA
School PlAyerS SAmPle ProFile – AdminiStrAtive juriSdiction, 214
99 PERFIL DA AMOSTRA – SéRIE
School PlAyerS SAmPle ProFile – grAde, 215
99 PERFIL DA AMOSTRA – REGIãO
School PlAyerS SAmPle ProFile – region, 215
100 PERFIL DA AMOSTRA DE EDUCADORES – RENDA FAMILIAR
educAtorS SAmPle ProFile – FAmily income, 216
100 PERFIL DA AMOSTRA DE EDUCADORES – RENDA PESSOAL
educAtorS SAmPle ProFile – individuAl income, 216
ANÁLISE DOS RESuLTADOS / aNalySIS of reSultS
107 DISPONIBILIDADE DE EqUIPAMENTOS TIC NA ESCOLA
AvAilABility oF ict equiPment in SchoolS, 223
107 NúMERO DE COMPUTADORES NA ESCOLA
numBer oF comPuterS in the School, 223
109 CONTEúDOS PRESENTES NO wEBSITE DA ESCOLA
content in School weBSiteS, 225
110 LOCAL DE INSTALAçãO DOS COMPUTADORES NA ESCOLA
locAtion where comPuterS Are inStAlled in the School, 226
112 PERFIL DOS PROFESSORES, POR SExO
teAcherS’ ProFile, Per gender, 228
112 PERFIL DOS PROFESSORES, POR FAIxA ETáRIA
teAcherS’ ProFile, Per Age grouP, 228
Survey on ICT Education 2010CONTENTS
PO
RTu
Gu
ÊS
En
gli
sh
10
113 PERFIL DOS PROFESSORES, POR GRAU DE FORMAçãO
teAcherS’ ProFile, Per level oF educAtion, 229
113 PROPORçãO DE PROFESSORES qUE REALIZARAM PóS-GRADUAçãO OU ESPECIALIZAçãO
ProPortion oF teAcherS who hAve A grAduAte or SPeciAlizAtion degree, 229
114 PROPORçãO DE PROFESSORES qUE PARTICIPARAM DE CURSOS DE FORMAçãO CONTINUADA
NOS úLTIMOS DOIS ANOS
ProPortion oF teAcherS who took continued educAtion courSeS in the lASt two
yeArS, 230
114 ANOS DE ExPERIÊNCIA DO PROFESSOR
teAcherS’ work exPerience (in yeArS), 230
115 HORAS DE TRABALHO SEMANAIS DO PROFESSOR
teAcherS’ working hourS Per week, 231
115 DEPENDÊNCIA ADMINISTRATIVA EM qUE O PROFESSOR ATUA
teAcherS’ AdminiStrAtive juriSdiction, 231
116 PERFIL DOS PROFESSORES, POR RENDA PESSOAL
teAcherS’ ProFile, Per individuAl income, 232
116 PERFIL DOS PROFESSORES, POR RENDA FAMILIAR
teAcherS’ ProFile, Per FAmily income, 232
117 PROPORçãO DE PROFESSORES qUE TÊM COMPUTADOR NO DOMICíLIO
ProPortion oF teAcherS who hAve comPuterS At home, 233
118 FREqUÊNCIA DE USO DO COMPUTADOR E DA INTERNET PELOS PROFESSORES, POR LOCAL
Frequency oF comPuter And internet uSe By teAcherS, By locAtion, 234
118 RECURSOS UTILIZADOS PELOS PROFESSORES PARA A AqUISIçãO DO COMPUTADOR
reSourceS For comPuter AcquiSition By the teAcher, 234
119 HABILIDADES DO PROFESSOR PARA AS ATIVIDADES REALIZADAS NO COMPUTADOR
teAcherS’ SkillS For ActivitieS cArried out on the comPuter, 235
120 HABILIDADES DO PROFESSOR PARA AS ATIVIDADES REALIZADAS NA INTERNET
teAcherS’ SkillS involved in internet ActivitieS, 236
121 PERCEPçãO DOS COORDENADORES PEDAGóGICOS SOBRE AS HABILIDADES DO PROFESSOR
directorS oF StudieS’ PercePtionS oF teAcherS’ SkillS, 237
121 FORMA DE APRENDIZADO DO ALUNO PARA O USO DE COMPUTADOR E INTERNET
how StudentS leArn comPuter And ict SkillS, 237
122 ESTíMULOS E ExIGÊNCIAS DO PROJETO PEDAGóGICO DA ESCOLA
ActionS encourAged And requeSted By the SchoolS’ PedAgogic PlAn, 238
123 APOIO AO PROFESSOR NO DESENVOLVIMENTO DE HABILIDADES PARA O USO DE COMPUTADOR
E INTERNET
SuPPort to teAcherS’ comPuter And internet SkillS develoPment, 239
124 ExISTÊNCIA NA ESCOLA DE PROGRAMAS DE CAPACITAçãO DE PROFESSORES PARA O USO DAS TIC
AvAilABility oF ict SkillS trAining ProgrAmS For teAcherS, 240
124 FREqUÊNCIA DE USO DA INTERNET PELOS PROFESSORES, SEGUNDO A ATIVIDADE
Frequency oF internet uSe By teAcherS, Per Activity, 240
2010 Pesquisa TIC EducaçãoSuMÁRIO
PO
RTu
Gu
ÊS
En
gli
sh
11
126 ATIVIDADES COM OS ALUNOS – FREqUÊNCIA DE USO DO COMPUTADOR E DA INTERNET PELO
PROFESSOR
ActivitieS with StudentS – Frequency oF uSe By teAcherS oF comPuterS And the
internet, 242
127 USO DO COMPUTADOR E DA INTERNET PELO PROFESSOR EM ATIVIDADES COM OS ALUNOS
uSe oF comPuterS And the internet By teAcherS in ActivitieS with StudentS, 243
128 MéTODOS DE AVALIAçãO UTILIZADOS PELOS PROFESSORES COM OS ALUNOS
evAluAtion methodS uSed By teAcherS with StudentS, 244
129 MéTODOS DE AVALIAçãO PELO PROFESSOR UTILIZANDO O COMPUTADOR
comPuterized evAluAtion methodS uSed By teAcherS, 245
130 BARREIRAS PERCEBIDAS PELO PROFESSOR PARA MAIOR USO DA TECNOLOGIA NA ESCOLA
BArrierS Preventing wider uSe oF technologieS in SchoolS According to teAcherS, 246

Survey on ICT Education 2010CONTENTS
PO
RTu
Gu
ÊS
En
gli
sh
12
LISTA dE TABELAS / taBle lISt
93 FATOR DE PONDERAçãO – REGIãO
weighting FActor – region, 209
94 MARGEM DE ERRO – DEPENDÊNCIA ADMINISTRATIVA
mArgin oF error – AdminiStrAtive juriSdiction, 210
94 MARGEM DE ERRO – REGIãO
mArgin oF error – region, 210
94 MARGEM DE ERRO – SéRIE
mArgin oF error – grAde, 210
95 NãO-RESPOSTA à UNIDADE – REGIãO non-reSPonSe unitS – region, 211

2010 Pesquisa TIC EducaçãoSuMÁRIO
PO
RTu
Gu
ÊS
En
gli
sh
13
LISTA dE TABELAS dE RESULTAdoS taBle of reSultS lISt
PROFESSORES / teaCherS
MÓDuLO A – PERFIL DEMOGRÁFICO E PROFISSIONAL
module a – demograPhIC aNd ProfeSSIoNal ProfIle
251 A1 - GRAU DE ESCOLARIDADE DOS PROFESSORES
level oF educAtion oF teAcherS
253 A2 - MODALIDADES DE PóS-GRADUAçãO DOS PROFESSORES
PoSt-grAduAte quAliFicAtionS oF teAcherS
254 A3 - áREA DE FORMAçãO NA GRADUAçãO DOS PROFESSORES
Field oF undergrAduAte StudieS oF teAcherS
258 A4 - FORMAçãO CONTINUADA DOS PROFESSORES
ongoing educAtion oF teAcherS
259 A5 - ANOS DE ExPERIÊNCIA COMO PROFESSOR
yeArS oF teAching exPerience
260 A6 - HORAS DE TRABALHO SEMANAIS
working hourS Per week
261 A7 - REDES DE ENSINO EM qUE O PROFESSOR ATUA
educAtion SectorS in which the teAcher workS
MÓDuLO B – PERFIL DO uSuÁRIO DE COMPuTADOR E INTERNET
module B – ComPuter aNd INterNet uSer ProfIle
262 B1 - PROPORçãO DE PROFESSORES qUE Já UTILIZARAM UM COMPUTADOR
ProPortion oF teAcherS who hAve uSed comPuterS
263 B2 - PROPORçãO DE PROFESSORES qUE Já UTILIZARAM A INTERNET
ProPortion oF teAcherS who hAve uSed the internet
264 B3 - PROPORçãO DE PROFESSORES qUE POSSUEM COMPUTADOR EM SEU DOMICíLIO
ProPortion oF teAcherS who hAve comPuterS At houSehold
265 B4 - TIPO DE COMPUTADOR ExISTENTE NO DOMICíLIO DO PROFESSOR
tyPe oF comPuter in the teAcher’S houSehold

Survey on ICT Education 2010CONTENTS
PO
RTu
Gu
ÊS
En
gli
sh
14
266 B5A - FORMA DE AqUISIçãO DO COMPUTADOR ExISTENTE NO DOMICíLIO DO PROFESSOR
how the houSehold comPuter wAS Acquired By the teAcher
267 B5B - FORMA DE AqUISIçãO DO COMPUTADOR ExISTENTE NO DOMICíLIO DO PROFESSOR
how the houSehold comPuter wAS Acquired By the teAcher
268 B6 - DESLOCAMENTO DO COMPUTADOR PORTáTIL DO PROFESSOR à ESCOLA
tAking the teAcher’S PortABle comPuter to School
269 B7 - PROPORçãO DE PROFESSORES COM ACESSO à INTERNET NO DOMICíLIO
ProPortion oF teAcherS who hAve internet AcceSS At home
270 B8 - FREqUÊNCIA DE USO DO COMPUTADOR E DA INTERNET EM LOCAIS ESPECíFICOS PELOS
PROFESSORES
Frequency oF internet And comPuter uSe By teAcherS At SPeciFic locAtionS
276 B9 - ACESSO DO PROFESSOR à INTERNET POR MEIO DE TELEFONE CELULAR
teAcher’S AcceSS to the internet viA moBile PhoneS
MÓDuLO C – HABILIDADES RELACIONADAS COM O COMPuTADOR E A INTERNET
module C – ComPuter aNd INterNet SkIllS
277 C1 – PERCEPçãO DO PROFESSOR SOBRE AS ATIVIDADES REALIZADAS NO COMPUTADOR
teAcher’S PercePtion on the ActivitieS cArried out on the comPuter
283 C2 - PERCEPçãO DO PROFESSOR SOBRE AS ATIVIDADES REALIZADAS NA INTERNET
teAcher’S PercePtion on the ActivitieS cArried out on the internet
MÓDuLO D – CAPACITAÇÃO ESPECíFICA
module d – SPeCIfIC learNINg
296 D1 - FORMA DE APRENDIZADO DO USO DE COMPUTADOR E INTERNET PELO PROFESSOR
how comPuter And internet SkillS Are leArned By the teAcher
297 D2 - MODO DE ACESSO DO PROFESSOR AO CURSO DE CAPACITAçãO
teAcher’S AcceSS to trAining
298 D3 - PERCEPçãO DO PROFESSOR SOBRE AS HABILIDADES RELACIONADAS A COMPUTADOR OU
INTERNET
teAcher’S PercePtion on comPuter And internet SkillS
MÓDuLO E – ATIvIDADES EM âMBITO EDuCACIONAL E ESCOLAR
module e – eduCatIoNal aNd SChool aCtIvItIeS
300 E1 - PERCEPçãO DO PROFESSOR SOBRE OS OBJETIVOS PEDAGóGICOS
teAcher’S PercePtion on PedAgogic oBjectiveS
310 E2 - PRáTICA DOCENTE – FREqUÊNCIA
teAching PrActice – Frequency
325 E3 - PRáTICA DOCENTE – USO DO COMPUTADOR E INTERNET
teAching PrActice – uSe oF comPuterS And the internet

2010 Pesquisa TIC EducaçãoSuMÁRIO
PO
RTu
Gu
ÊS
En
gli
sh
15
329 E4 - PRáTICA DOCENTE – LOCAL
teAching PrActice – locAtion
331 E5 - PRáTICA DOCENTE – LOCAL MAIS FREqUENTE
teAching PrActice – moSt Frequent locAtion
333 E6 - MéTODOS DE AVALIAçãO
ASSeSSment methodS
334 E7 - MéTODOS DE AVALIAçãO – USO DO COMPUTADOR E DA INTERNET
ASSeSSment methodS – uSe oF comPuterS And the internet
335 E8 - APOIO AO PROFESSOR NO USO DE COMPUTADOR E INTERNET
SuPPort For teAcherS in comPuter And internet uSe
339 E9 - PERCEPçãO DO PROFESSOR SOBRE AS CONDIçõES DE USO DAS TIC NAS ESCOLAS
teAcher’S PercePtion on the uSe oF ict reSourceS in SchoolS
348 E10 - ATIVIDADES GERAIS DO PROFESSOR – USO DA INTERNET
teAcherS’ generAl ActivitieS – uSe oF the internet
362 E11 - PERCEPçãO DO PROFESSOR SOBRE O PROJETO PEDAGóGICO DA ESCOLA
teAcher’S PercePtion on the School’S PedAgogic PlAn
MÓDuLO F – BARREIRAS PARA O uSO
module f – BarrIerS for the uSe
364 F1 - PERCEPçãO DO PROFESSOR SOBRE POSSíVEIS OBSTáCULOS
teAcher’S PercePtion on PotentiAl oBStAcleS
372 F2 - PERCEPçãO DO PROFESSOR SOBRE O NíVEL DE OBSTáCULO NO USO DE COMPUTADOR E
INTERNET
teAcher’S PercePtion on oBStAcleS to the uSe oF comPuterS And the internet
385 F3 - PERCEPçãO DO PROFESSOR SOBRE CONTRIBUIçãO DAS TIC
teAcher’S PercePtion on the contriBution oF ict
INDICADORES SELECIONADOS PARA ALuNOS, COORDENADORES PEDAGÓGICOS E DIRETORESSeleCted INdICatorS for StudeNtS, dIreCtor of StudIeS, aNd PrINCIPalS
ALuNOS / StudeNtS
MÓDuLO E – ATIvIDADES EM âMBITO EDuCACIONAL E ESCOLAR
module e – eduCatIoNal aNd SChool aCtIvItIeS
397 E1 - ATIVIDADES REALIZADAS PELO ALUNO – USO DO COMPUTADOR E INTERNET
ActivitieS cArried out By StudentS – comPuter And internet uSe

Survey on ICT Education 2010CONTENTS
PO
RTu
Gu
ÊS
En
gli
sh
16
403 E4 - ATIVIDADES REALIZADAS PELO ALUNO – LOCAL DE USO DO COMPUTADOR E INTERNET: ESCOLA
ActivitieS cArried out By StudentS – comPuter And internet uSe locAtion: School
COORDENADORES PEDAGÓGICOS / dIreCtor of StudIeS
MÓDuLO C – HABILIDADES RELACIONADAS COM O COMPuTADOR E A INTERNET
module C – ComPuter aNd INterNet SkIllS
406 C3 - PERCEPçãO DOS COORDENADORES PEDAGóGICOS SOBRE O USO DO COMPUTADOR E DA
INTERNET NA ESCOLA
director oF StudieS’ PercePtion on the uSe oF comPuterS And the internet At School
411 C9 - PERCEPçãO DOS COORDENADORES PEDAGóGICOS SOBRE O PROJETO PEDAGóGICO
director oF StudieS’ PercePtion on the PedAgogicAl PlAn
DIRETORES / PrINCIPalS
MÓDuLO C – HABILIDADES RELACIONADAS COM O COMPuTADOR E A INTERNET
module C – ComPuter aNd INterNet SkIllS
416 C1 - USO DO COMPUTADOR E DA INTERNET PELOS DIRETORES PARA AS ATIVIDADES DE GESTãO
ESCOLAR
PrinciPAl’S comPuter And internet uSe in School mAnAgement ActivitieS
MÓDuLO E – ATIvIDADES EM âMBITO EDuCACIONAL E ESCOLAR
module e – eduCatIoNal aNd SChool aCtIvItIeS
423 E1 - PERCEPçãO DO DIRETOR SOBRE POSSíVEIS OBSTáCULOS PARA INOVAçãO
PrinciPAl’S PercePtion on PotentiAl oBStAcleS to innovAtion

2010 Pesquisa TIC EducaçãoPREFÁCIO 17
PO
RTu
Gu
ÊSPREFÁCIo
Quando começares a tua viagem para Ítaca,
reza para que o caminho seja longo,
cheio de aventura e de conhecimento.
(...)
Será melhor que ela dure muitos anos
para que sejas velho quando chegares à ilha,
rico com tudo o que encontraste no caminho,
sem esperares que Ítaca te traga riquezas.
Ítaca deu-te a tua bela viagem.
Sem ela não terias sequer partido.
Não tem mais nada a dar-te.
(Konstantínos Kaváfis, viagem a Ítaca)
Com o início formal das operações do NIC.br, em 2005, os recursos arrecadados pelo Registro.br, responsável pelas atividades de registro de nomes de domínio e pela distribuição de endereços Ipv4 e IPv6 no Brasil, permitiram que o CGI.br expandisse o leque de iniciativas em prol da comunida-de da Internet brasileira. Nesse contexto, o Cetic.br foi criado, dentro do NIC.br, para cuidar do mapeamento da posse e do uso das TIC, bem como para delinear os contornos da Internet no país. O Cetic.br é um dos mais significativos e impactantes resultados do aproveitamento dos recursos do CGI.br em favor da sociedade.
Outras iniciativas fundamentais foram reforçadas, como o estabelecimento de mais pontos de tro-ca de tráfego (PTTs) no país, a distribuição gratuita da hora oficial brasileira via NTP (network time Protocol), o desenvolvimento do Sistema de Medição de Tráfego de Última Milha (Simet), a dissemi-nação e “evangelização” do uso do IPv6 por meio de eventos e cursos, todos sob responsabilidade do Ceptro.br, também um órgão do NIC.br. Quanto a projetos voltados à segurança da Internet bra-sileira, entre os conduzidos pelo Cert.br destacaram-se a cartilha de segurança, cursos especializa-dos e em padrão internacional e o projeto de mapeamento do spam no país: os honeypots. Além disso, a conscientização a respeito da importância do uso de padrões abertos, visando ao cresci-mento da web com base em diretrizes voltadas a uma Internet inclusiva e democrática, é importan-te atuação do W3C.br, escritório brasileiro do W3C.

Pesquisa TIC Educação 2010PREFÁCIO 18
PO
RTu
Gu
ÊS
A perenização das atividades do NIC.br é objetivo primário do CGI.br, para reforçar seu compro-misso de devolver à comunidade da Internet brasileira os recursos advindos do registro de nomes sob o domínio .br. E o constante crescimento desse número de registros, que alcançou, em junho de 2011, a marca de 2,5 milhões, possibilita que o NIC.br se fortaleça como referência no país e no exterior e possa conduzir com sucesso uma série crescente de projetos que visam ao apoio a um melhor desenvolvimento da Internet no país. A pesquisa sobre o uso das TIC no Brasil, que nesse ano alcança sua sexta edição, e a pesquisa inédita sobre TIC na educação brasileira, ambas condu-zidas pelo Cetic.br, ilustram a busca do NIC.br por desenvolver e disseminar conhecimento sobre a rede brasileira e prover subsídios para que políticas públicas possam ser geradas e orientadas a par-tir do mapeamento cada vez mais profundo e completo da Internet no Brasil.
Bons ventos!
Demi GetschkoNúcleo de Informação e Coordenação do Ponto BR – NIC.br

2010 Survey on ICT EducationAPRESENTAÇÃO 19
En
gli
sh
APRESENTAÇÃo
Desde a sua criação, em 1995, o Comitê Gestor da Internet no Brasil (CGI.br) coordena projetos de importância fundamental para o funcionamento e o desenvolvimento da Internet no país. Entre suas diversas atribuições e responsabilidades, o CGI.br fomenta a coleta, a organização e a disse-minação de informações, análises, indicadores e estatísticas sobre as tecnologias de informação e comunicação (TIC) no Brasil, em particular a Internet. Por meio do seu Centro de Estudos sobre as Tecnologias da Informação e da Comunicação (Cetic.br), são conduzidos diversos projetos de pes-quisa especializados nesse tema, visando à medição e ao acompanhamento da expansão das TIC no país.
As estatísticas produzidas por meio destes projetos têm como objetivo contribuir para o debate sobre as TIC no Brasil. E, felizmente, as pesquisas vêm ganhando cada vez mais destaque pelo rigor metodológico e pela capacidade de gerar importantes insumos para os setores público e privado, para organizações não governamentais e para a comunidade científica e acadêmica.
é com satisfação que comprovamos a utilização dos resultados da pesquisa do CGI.br por gesto-res públicos na construção de estratégias governamentais e na elaboração de políticas públicas que atendam às necessidades da população brasileira em temas críticos, como a inclusão digital, o uso das TIC para a educação, a universalização da banda larga, a regulamentação das lanhouses, entre outros. Os resultados também são utilizados amplamente pela academia na elaboração de pesqui-sas acadêmicas, e por organizações privadas na identificação de tendências no cenário tecnológi-co brasileiro.
Empenhado na missão de estabelecer um centro de referências na produção de estatísticas e indi-cadores sobre a posse e o uso das TIC no país, o CGI.br apresenta a sexta edição da Pesquisa sobre o uso das tecnologias de informação e comunicação no Brasil – tic domicílios e tic empresas e, também, a primeira edição da Pesquisa sobre o uso das tecnologias de informação e comunicação nas escolas brasileiras – tic educação.
Hartmut Richard GlaserComitê Gestor da Internet no Brasil – CGI.br


2010 Pesquisa TIC EducaçãoINTRODuÇÃO 21
PO
RTu
Gu
ÊSINTRodUÇÃo
As novas tecnologias de informação e comunicação (TIC) têm criado, de forma cada vez mais inten-sa e rápida, novas possibilidades para diferentes setores da sociedade, nas áreas econômica, social, política e cultural, ao mesmo tempo que produzem revoluções significativas nos aspectos centrais da vida cotidiana de indivíduos, organizações e governo. Avaliar os impactos dessas tecnologias na sociedade tornou-se uma necessidade no processo de monitoramento da construção e do desen-volvimento da sociedade da informação e do conhecimento. Organizações internacionais como a Organização das Nações Unidas (ONU), Organização para a Cooperação e Desenvolvimento Econômico (OCDE), Banco Mundial, entre outras, trabalham de forma colaborativa na definição de metodologias, indicadores e métricas que sejam capazes de medir o acesso, o uso e a apropriação das novas tecnologias, base para o desenvolvimento da sociedade da informação.
Garantir a universalização do acesso à educação é uma das metas do programa Objetivos de Desenvolvimento do Milênio da ONU, e as TIC desempenham um papel fundamental para possibi-litá-la. Dessa forma, é importante que sejam conhecidos os desafios para a apropriação das novas tecnologias na educação e os impactos causados pelo uso das TIC nas salas de aula.
Embora o governo tenha empenhado recursos a fim de garantir o uso ampliado das TIC para a edu-cação, ainda existe um desconhecimento das consequências desse uso na realização dos objetivos e no alcance das metas dos programas educacionais. Assim, a criação de uma base de conhecimen-tos relevante e que tenha credibilidade é fator essencial para ajudar no processo de decisão para o desenvolvimento de políticas públicas sobre o uso das TIC voltadas aos programas de educação. E essa foi a motivação inicial da Pesquisa sobre o Uso das Tecnologias de Informação e Comunicação nas Escolas Brasileiras – TIC Educação 2010.
Para lidar com esse desafio, a pesquisa foi planejada a partir de duas abordagens. A primeira é representada por um módulo qualitativo longitudinal, no qual doze escolas serão acompanhadas durante quatro anos, com início em 2010 e término em 2013, com duas visitas anuais para obser-vação, acompanhamento das mudanças na infraestrutura de acesso via banda larga e seu impacto no ensino. Os resultados desse estudo serão analisados e publicados futuramente.
A segunda etapa, quantitativa e amostral, tem seus resultados apresentados nesta publicação. Assim, mais um projeto de pesquisa passa a compor o portfólio do Cetic.br, juntamente com as já consagradas pesquisas anuais sobre o uso das tecnologias de informação e comunicação: TIC Domicílios e TIC Empresas, do Comitê Gestor da Internet no Brasil (CGI.br). As pesquisas do Cetic vêm contribuindo com os setores público, privado e acadêmico ao fornecer subsídios para a dis-cussão sobre o desenvolvimento das TIC no país. Inspiradas no conceito ICT4DEV (Information and Comunnication Technologies for the Development), essas pesquisas buscam oferecer não somente

Pesquisa TIC Educação 2010INTRODuÇÃO 22
PO
RTu
Gu
ÊS
um cenário sobre a apropriação das TIC, mas também uma série histórica de indicadores relevantes que permitem uma análise aprofundada sobre o acesso e o uso das novas tecnologias, em particular a Internet, contribuindo assim para uma melhor compreensão sobre as várias dimensões do impacto das TIC na sociedade brasileira – nesse caso específico, na área de educação.
No âmbito do setor público, as estatísticas produzidas pelas pesquisas do Cetic.br contribuem para as discussões sobre políticas públicas, principalmente aquelas voltadas a inclusão digital, como, por exemplo, o Plano Nacional de Banda Larga, os programas Banda Larga nas Escolas e Telecentros Comunitários, etc. O Brasil apresenta um quadro socioeconômico com enormes disparidades, o que impõe grande desafio para a definição de políticas que consigam reduzir tal problema. As políticas públicas nesse campo privilegiaram o acesso às TIC e o desenvolvimento da infraestrutura, mas pou-co se discutiu sobre a participação ativa, o desenvolvimento de habilidades, a alfabetização digital dos cidadãos e, agora também, de professores, coordenadores pedagógicos e diretores.
Os dados da pesquisa TIC Educação são uma importante contribuição para o debate acerca da apropriação das TIC por parte dos atores escolares e para a discussão a respeito dos desafios cen-trais para possibilitar seu uso efetivo no processo de ensino e aprendizagem.
No setor privado, as pesquisas do Cetic.br têm sido cada vez mais utilizadas por empresas que ope-ram nos segmentos de telecomunicações, mídia e Internet para monitoramento de tendências, princi-palmente de uso e aplicações da Internet, como redes sociais, comércio eletrônico, lazer, educação, entre outros temas monitorados pelas pesquisas. No âmbito acadêmico, o número de publicações, dissertações de mestrado, teses de doutorado e artigos científicos que utilizam os dados das pesqui-sas também vem crescendo nos últimos anos. Percebe-se, portanto, que os dados do CGI.br são legi-timados por agentes sociais do governo, do setor privado, do terceiro setor e da academia.
Seguindo a tradição das publicações do Cetic.br, será apresentada uma análise dos principais indi-cadores da TIC Educação, com o intuito de oferecer um panorama completo do uso das novas tec-nologias nas escolas públicas do país. Esperamos que esta leitura seja um convite para que o leitor reflita sobre os desafios para a efetiva apropriação das TIC na escola e sobre as implicações decor-rentes da sua introdução.
Em 2010, o Cetic.br ampliou ainda mais sua participação em debates nacionais e internacionais sobre a definição de indicadores-chave para as TIC. Aumentou também a integração de especialistas aca-dêmicos, instituições governamentais, organizações do terceiro setor, mantendo sempre o alinha-mento com os padrões metodológicos da OCDE e da Eurostat (Instituto de Estatísticas da Comissão Europeia), bem como as referências internacionais estabelecidas pelo Partnership on Measuring ICT for Development, iniciativa que reúne entidades internacionais como, além das citadas OCDE e Eurostat, a UIT, a UNCTAD, o Instituto de Estatísticas da Unesco, as agências regionais das Nações Unidas e o Banco Mundial. Dessa forma, os resultados apresentados pelas nossas pesquisas oferecem consis-tência e credibilidade, permitindo a comparabilidade entre a realidade brasileira e a de outros países.
Países de todos os continentes têm investido no uso das TIC nas escolas e na inovação de processos pedagógicos. Infraestrutura de equipamentos TIC, acesso à Internet, desenvolvimento profissional e criação de conteúdos digitais de aprendizagem são alguns exemplos desses investimentos.
A fim de concretizar esse objetivo, a pesquisa TIC Educação contou com uma amostra de 500 esco-las públicas, entrevistando diretores, coordenadores pedagógicos, professores e alunos, busca ndo--se representar o cenário brasileiro sobre educação e uso das tecnologias. Seguindo essa pr oposta,

2010 Pesquisa TIC EducaçãoINTRODuÇÃO 23
PO
RTu
Gu
ÊS
o trabalho foi embasado em referências internacionais como o InfoDev (Banco Mundial), a IEA (International Association for the Evaluation of Educational Achievement) e Sites 2006 (Second Information Technology in Education Study).
Em sua primeira edição, a Pesquisa sobre o Uso das Tecnologias de Informação e Comunicação nas Escolas Brasileiras – TIC Educação 2010 está estruturada da seguinte forma:
Parte 1 – Artigos: textos escritos por acadêmicos convidados, abordando, sob diferentes perspecti-vas, temas pertinentes. Os artigos discutem, entre outros, nativos digitais, o papel da educação no desenvolvimento social, formação inicial de docentes, desafios, cenário atual, ética e segurança.
Parte 2 – tic educação: o relatório metodológico, a descrição do plano amostral aplicado na pes-quisa e uma análise dos principais resultados.
Parte 3 – tabelas da tic educação: todos os indicadores referentes aos professores, atores esco-lares centrais da pesquisa, com suas respectivas tabelas de resultados e quebras por variáveis de cruzamento.
Parte 4 – Apêndice: o glossário de termos utilizados na pesquisa, para facilitar a leitura.
A realização dessa pesquisa representa um grande esforço de tempo e recursos, porém é motivo de muita satisfação e entusiasmo para toda a equipe do Cetic.br. Assim, esperamos que os dados e aná-lises dessa publicação promovam importantes reflexões e debates, que sejam amplamente utiliza-dos pelos gestores públicos para desenhar o futuro da sociedade da informação e do conhecimento no Brasil, que possam continuar sendo insumo para trabalhos científicos e acadêmicos e que pos-sam continuar ajudando escolas públicas e privadas e organizações do terceiro setor no monitora-mento da educação brasileira.
Alexandre F. Barbosa
Centro de Estudos sobre as Tecnologias da Informação e da Comunicação – Cetic.br


1
arTigos


2010 Pesquisa TIC EducaçãoARTIGOS 27
PO
RTu
Gu
ÊSo CENÁRIo ATUAL do USo dE TECNoLoGIAS dIGITAIS
dA INFoRmAÇÃo E ComUNICAÇÃo
Maria da Graça Moreira da Silva1 e Maria Elizabeth Bianconcini de Almeida2
APRESENTAÇÃo
As vertiginosas mudanças nas organizações sociais provocadas pelos avanços da ciência e da tecnologia transformaram a comunicação, as relações sociais, o trabalho, a economia e o lazer. Encurtaram-se as distâncias, expandiram-se fronteiras, o mundo ficou globalizado. E, por sua vez, as mídias e tecnologias estão relacionadas a todas essas transformações.
A sociedade, que no início do século XX caracterizava-se como rural, migrou para os espaços urba-nos nos anos 1970, tendo passado durante essa mudança por profundas transformações. Entre o final do século XX e o início do século XXI, a disseminação do uso das tecnologias digitais de infor-mação e comunicação (TDIC) transformou as relações espaço-temporais, potencializou a mobilida-de funcional e acentuou as mudanças já em curso nos modos de trabalho, na produção de conhe-cimento e na aprendizagem, o que evidenciou a necessidade de preparar profissionais para viver e trabalhar na sociedade tecnológica.
A inserção da população na sociedade tecnológica tornou-se estratégia prioritária de países que têm o propósito de participar do mundo globalizado e combater o fosso digital (Castells, 2003) decorrente das desigualdades sociais, levando-os à definição de políticas públicas de inclusão digi-tal, entre as quais as ações de uso de tecnologias nas escolas.
Desse modo, a cibercultura abre novas possibilidades para os indivíduos realizarem suas ações em contextos distintos, com mídias diferenciadas, favorecendo a constituição de uma teia entre o ambiente onde se aprende e o cotidiano no qual cada pessoa atua, configurando novos caminhos para que ela interaja e desenvolva suas constantes compreensões sobre o mundo e a cultura.
1 Doutora em educação pela PUC-SP. é docente do Departamento de Computação e docente participante do Programa de Pós-Graduação em Educação na PUC-SP. Atua em pesquisa, coordenação de projetos e cursos sobre uso de tecnologias e mídias na educação e na formação docente.
2 Doutora em educação pela PUC-SP, com pós-doutorado na Universidade do Minho, Portugal. é docente e coordenadora do Programa de Pós-Graduação em Educação na PUC-SP. Coordena projetos de desenvolvimento e pesquisa envolvendo a inte-gração de tecnologias na educação e na formação docente.

Pesquisa TIC Educação 2010ARTIGOS 28
PO
RTu
Gu
ÊS
Vivemos sob conexão e em conexão com outros, vivemos a partir do mundo digital, e este, sempre acompanhado de mídias e dispositivos em formatos diversos, nos acrescenta novas funções de comu-nicação. Servimo-nos, em nosso cotidiano, dos recursos possíveis à comunicação e à informação, e é principalmente da tecnologia da Internet que nos valemos para realizar transações, ouvir música, assis-tir a vídeos, acessar notícias, comunicar, conversar, compartilhar, informar e produzir informações.
De fato, o advento da Internet favoreceu o desenvolvimento de uma cultura de uso das mídias e, por conseguinte, de uma configuração social pautada num modelo digital de pensar, criar, produ-zir, comunicar, aprender, enfim, viver. Isso já nos permite afirmar que os dias atuais são pautados pela comunicação e pelo gerenciamento da informação e que isso se estabelece de forma totalmen-te diferenciada daquela dos tempos iniciais da Internet, nos anos 1990, e da utilização dos compu-tadores pessoais até a mesma época.
Ao considerarmos o contexto da evolução histórica das mídias – na qual o rádio, a televisão, o computador e, principalmente, a Internet têm uma importância de destaque para a vida midiática e midiatizada pela informação –, sem dúvida a evolução tecnológica, o computador e pontualmente a Internet são os principais responsáveis por vivermos imersos num modelo social totalmente ino-vador do ponto de vista da comunicação: a “cultura das mídias”, como conceitua Santaella (2004). Para se compreender o cenário atual do uso das tecnologias na educação, é necessário, num pri-meiro momento, refletir sobre como isso evoluiu no Brasil.
BREvE hISTóRICo do USo dE TECNoLoGIAS NA EdUCAÇÃo
A utilização de computadores na educação teve início com a invenção, em 1924, de uma máqui-na para apresentar conteúdos, aplicar e corrigir testes de múltipla escolha – a Máquina de Pressey (Leigh, 1998).
A década de 1950 foi próspera no desenvolvimento de teorias e tecnologias instrucionais. Benjamin Bloom desenvolveu teorias municiando professores com meios para transmitir, eficazmente, con-teúdos instrucionais. E, impulsionado pelos estudos do psicólogo Skinner, foram construídas e tes-tadas diversas versões de “máquinas para ensinar”, cujo uso se baseava na ideia da aprendizagem individualizada e no reforço (positivo ou negativo) imediatamente após o acerto ou erro em forma de sons, de progresso nas lições ou de estímulos visuais.
O modelo de instrução programada por computador, ou CAI (computer Assisted instruction), teve grande desenvolvimento a partir dos anos 1960, com o investimento de empresas norte-americanas, como a IBM, e de universidades, como Stanford e a Universidade de Illinois.3 Acreditava-se que o uso dos computadores fosse revolucionar a educação. Naquele momento, os esforços convergiam para a conversão dos conteúdos das aulas em softwares – concepção que traduzia o enfraqueci-mento do papel do professor.
3 Esta última, em parceria com uma fábrica de computadores, desenvolveu o sistema Plato, que consistia em um computador de grande porte que chegou a armazenar e distribuir cerca de 8 mil horas de materiais instrucionais, por meio de 950 termi-nais de computadores distribuídos em 140 locais. O Plato caracteriza uma das principais etapas da história da utilização de computadores na educação (Leigh, 1998).

2010 Pesquisa TIC EducaçãoARTIGOS 29
PO
RTu
Gu
ÊS
Com o tempo, os computadores foram sendo incorporados de diferentes maneiras pelos professores e pelas instituições de ensino, e isso originou novas propostas, segundo novas abordagens de uso, e não apenas a instrução programada.
Além da diversidade de CAIs, a ideia de ensino pelo computador permitiu a elaboração de outras abordagens, em que o computador é usado como ferramenta para auxiliar a resolução de proble-mas, a produção de textos, a manipulação de banco de dados e o controle de processos em tempo real (Valente & Almeida, 1997). Dessa forma, foi recontextualizada a utilização dos computadores na educação, passando de “máquina de ensinar” para “ferramenta educacional”, de uma aborda-gem instrucionista para a construcionista. No Brasil, a prática pedagógica baseada nesta última abor-dagem passou a ser utilizada a partir da metade dos anos 1980, inspirada pelas ideias de Seymour Papert (1985), que associou o uso do computador com a construção de conhecimento por meio da linguagem de programação Logo, abordagem que posteriormente se expandiu e foi aproveitada em outros programas computacionais que permitiam o exercício da autoria (Almeida, 2008).
A última metade da década de 1990 foi marcada pelo início da revolução digital e da emergência da sociedade da informação, fruto do desenvolvimento tecnológico, que, por sua vez, teve suas ori-gens e trajetória marcadas pelas pesquisas e pelo desenvolvimento propulsionados ora pelo cenário corporativo, ora pelo cenário militar, ora pelo cenário científico e educacional.
A utilização da rede mundial de computadores foi disseminada no mercado corporativo, nas esco-las e universidades, e surgiram em universidades vários grupos de estudos e projetos pioneiros de pesquisas.
Com a popularização da Internet, o uso de tecnologias na educação sofreu um grande impulso e, em poucos anos, assistiu-se a uma multiplicação de projetos, nos diversos segmentos educacionais, relacionados à utilização das tecnologias digitais de informação e comunicação (TDIC) em ativida-des de ensino e aprendizagem. Os educadores passaram a discutir e a pesquisar as novas possibili-dades que a Internet e as mídias digitais podiam exercer na educação. Como consequência, a utili-zação das TDIC se disseminou com mais intensidade no cotidiano da educação, e, pouco a pouco, elas começaram a ser apreendidas pelos professores, o que não ocorreu com as gerações anterio-res, cujas tecnologias de educação envolviam o uso de rádio ou TV. O cenário atual de uso das tec-nologias na educação indica novas possibilidade e tendências, conforme apresentamos a seguir.
CENÁRIo ATUAL dE USo dAS TECNoLoGIAS NA EdUCAÇÃo
Embora, desde o final dos anos 1980, tenham sido implantados diversos projetos voltados à inser-ção de tecnologias na educação (Almeida, 2008), ainda não se chegou à universalização do uso das TDIC nas escolas. Além disso, a observação das práticas com o uso das TDIC nas escolas e a literatura disponível sobre esse tema mostram que tais aproveitamentos (Valente & Almeida, 1997; Almeida, 2008) caracterizam-se por atividades pontuais sem uma real integração ao currículo.
Como a tecnologia é compreendida como um instrumento estruturante do pensamento – desde sua concepção como projeto e antes mesmo de se fazer artefato –, para que ela possa ser integrada cri-ticamente ao currículo e ao fazer pedagógico, é preciso apoderar-se de suas propriedades intrínse-cas, utilizá-la na própria aprendizagem e na prática pedagógica e refletir sobre por que e para que

Pesquisa TIC Educação 2010ARTIGOS 30
PO
RTu
Gu
ÊS
usar a tecnologia, como se dá esse uso e que contribuições ela pode trazer à aprendizagem e ao desenvolvimento do currículo (Almeida, 2010a, p. 68).
As inovações que essas tecnologias trazem para a educação refletem no repensar sobre concei-tos fundamentais da educação e em sua reconstrução. Os novos ambientes de aprendizagem e os ambientes virtuais viabilizados pelos sistemas tecnológicos na rede mundial de computadores reú-nem professores e alunos no ciberespaço e possuem características inéditas, evidenciando as “poten-cialidades pedagógicas das tecnologias de informação e comunicação – TIC” (Almeida, 2010b, p. 5).
Além de inserir as TDIC nas escolas, é necessária sua integração com a cultura digital, ou seja, oportunizar a todos que atuam na escola a participação na cibercultura, que é constituída como o “conjunto de técnicas (materiais e intelectuais), de práticas, de atitudes, de modos de pensamen-to e de valores” (Lévy, 2000, p. 17). Isso deve ocorrer por meio da exploração das funcionalidades e serviços oferecidos pelas TDIC, em especial pela Internet, como: a comunicação todos-todos a qualquer momento e de qualquer lugar em que se tenha conexão disponível; os distintos caminhos de navegação alinear através de nós e ligações que compõem as redes hipermidiáticas, a autoria; a expressão e publicação de ideias que incorporam diferentes linguagens; e o desenvolvimento de produções em coautoria.
A participação na construção confere aos professores e alunos a autoria coletiva, e não mais a auto-ria solitária da sala de aula. As produções em construção podem ser adensadas por diversas contri-buições e pelas participações de diferentes autores, sugerindo formas de organizar o pensamento multidimensional e não hierarquizado.
Nascem novos autores, cujas obras podem ter o alcance multiplicado pela rede. A ideia de rede é expandida, e o que era considerado apenas uma interconexão entre computadores passa a ser enten-dido também como uma metáfora de organização do ciberespaço (Ramal, 2003), onde todas as vozes podem ser ouvidas, onde flui a intersubjetividade e os conhecimentos se constroem coletivamente.
Com todas essas possibilidades, muitas iniciativas ainda centram seus esforços e olhares no uso das TDIC com a mesma abordagem das máquinas de ensinar. Daí a emergência de compreender como as mídias e tecnologias se articulam no contexto atual e na “vida mesma da escola”, conforme pon-tuava Paulo Freire.
No cenário atual, o uso das tecnologias na educação não pode ser confundido com o aproveita-mento de máquinas, estratégias ou ferramentas para tornar as aulas mais atraentes ou dinâmicas, ou mesmo para motivar os jovens alunos (Silva, 2010). Também não podem ser utilizadas, como as antigas máquinas para ensinar, apenas para provimento de conteúdos organizados e testes.
Uma breve investigação revela que os estudantes chegam às escolas trazendo um vasto repertó-rio de contato com as mídias e tecnologias, pois, como salienta Gadotti (2005), a primeira cultura do aluno é a midiática. Independentemente do contexto em que vivem, os estudantes trazem para a escola suas experiências cotidianas com uma multiplicidade de mídias e tecnologias; porém as entendem como meios e instrumentos de comunicação, e não as identificam como recursos, ferra-mentas ou interfaces para a aprendizagem.
Do mesmo modo, os educadores entram em contato com as mídias e tecnologias no seu dia a dia. Porém, na maioria das vezes, elas não chegam às salas de aula como instrumentos de midiatização dos processos de ensino, aprendizagem e desenvolvimento do currículo. A integração das tecnolo-gias ao currículo depende de diversos componentes: a implantação de infraestrutura tecnológica; o
2010 Pesquisa TIC EducaçãoARTIGOS 31
PO
RTu
Gu
ÊS
provimento de acesso às tecnologias; o letramento digital dos sujeitos da educação; políticas con-sistentes de uso; a inserção dos envolvidos no mundo das tecnologias; entre outros. Assim, para a efetiva integração das mídias e tecnologias aos processos educativos, é necessária, principalmente, a formação dos professores, gestores e demais educadores (Prado & Silva, 2009).
Assim, podemos imaginar uma conjugação de esforços das iniciativas da educação pública e da privada no país no seguinte sentido: implantação gradual de acesso à Internet e de banda larga nas escolas, provimento de laboratórios e computadores móveis, aumento dos processos de formação de professores e gestores, entre outras ações.
Desponta no cenário educativo atual, e como promessa para o futuro, o uso mais intensivo e inte-grado ao currículo das tecnologias de informação e comunicação. O uso de computadores tende a passar de poucas horas semanais em laboratórios de informática a algo mais frequente, em diver-sas situações e ambientes de aprendizagem e por meio de dispositivos móveis conectados. Esse uso mais frequente é também motivado pelas novas possibilidades de autoria, produção colaborativa de conteúdos com a integração de diversas mídias, publicação, compartilhamento e disseminação, propiciadas pelas ferramentas da Web 2.0, como analisaremos a seguir.
WEB 2.0 E mídIAS SoCIAIS: weB SoCIAL
A Web 2.0 representa mais do que uma nova tecnologia; é uma mudança na forma de utilização da própria web, em que os usuários expandem seu papel na navegação ou na pesquisa de conteú-dos para também produzi-los e compartilhá-los. Significa, também, que as ferramentas tecnológi-cas ficaram mais acessíveis e simples de serem utilizadas, oportunizando que usuários, como pro-fessores e alunos, postem conteúdos com facilidade. Para muitos autores e pesquisadores, a Web 2.0 nada mais é do que uma segunda geração de uso da Internet.
O poder de criação propiciado pelo uso das tecnologias potencializa a abertura do currículo iden-tificada na primeira geração da Internet (chamada de Web 1.0, com foco na oferta de informações), uma vez que a Web 2.0 amplia o potencial de interação multidirecional e participação de pessoas situadas em distintos lugares com acesso às TDIC, permitindo-lhes compartilhar informações, resol-ver problemas e produzir conhecimentos em colaboração, exercitando a coautoria com pessoas de todas as partes do mundo.
Isso intensifica a participação de professores e alunos como autores e produtores de conhecimen-tos, divulgadores de pesquisas e projetos. A interação e a coautoria possuem um caráter de des-taque quando se fala em Web 2.0, e delas derivam muitas tecnologias de fácil uso, gratuitas ou de baixo custo, que impulsionam a produção colaborativa, tais como blogs, Wiki, Youtube, entre outras, as mídias sociais.
Os recursos e interfaces disponíveis na Web 2.0 podem ser considerados mais do que simples fer-ramentas, pela facilidade e plasticidade com que podem ser utilizados para exercer as ações de autoria coletiva e compartilhar conhecimento por meio de diferentes mídias (texto, som, imagem, podcast, vídeo, etc.). Oferecem também serviços para a formação de redes sociais, que hoje consti-tuem espaços abertos de compartilhamento de ideias e informações e ponto de encontro de comu-nidades e realização de estudos sobre temas de interesse comum.

Pesquisa TIC Educação 2010ARTIGOS 32
PO
RTu
Gu
ÊS
A Web 2.0 também pode ser chamada de web social (Isotani et al., 2008), já que seu uso poten-cializa a formação de redes sociais – que surgiram a partir da sociologia, que estuda as interações complexas da vida social e os desafios epistemológicos da integração da complexidade e da diver-sidade nos processos sociais.
Na esfera educacional, dispomos de alguns ambientes para a criação de redes sociais voltadas para o contato com alunos, ou ex-alunos, e para colocá-los em contato uns com os outros. Alguns exem-plos são as comunidades de relacionamento, como Facebook e Orkut, e outras de cunho profissio-nal, como hi5 e LinkedIn; as ferramentas para comunicação e interação, como Twitter; ferramentas para comunidades de prática, como o Ning, que também se propõe a integrar o mundo acadêmico numa ferramenta metassocial; ferramentas para apresentação e trocas de vídeos e imagens, como Youtube; ferramentas para edição colaborativa na Internet, como Wiki e GoogleDocs; ferramentas para comunicação instantânea, como MSN e Skype; ambientes de jogos em rede; mundos virtuais imersivos... entre inúmeras outras opções que, integradas à educação, possibilitam criar solitaria-mente, criar colaborativamente e compartilhar.
USo dE dISPoSITIvoS móvEIS NA EdUCAÇÃo: APRENdIzAGEm Com moBILIdAdE
A associação da Web 2.0 com as tecnologias móveis, como computadores portáteis de diferentes modelos (netbook, iPad e celulares), propicia o desenvolvimento de um currículo aberto, dinâmico e flexível (Almeida, 2010b), promovendo a articulação com distintas áreas de conhecimento e com as experiências de professores e alunos e as relações que se estabelecem no ato educativo.
A mobilidade traz outra lógica ao como e quando aprender. O sentido de estar aqui para aprender ou de aprender estando em qualquer lugar tornou-se o referente na sociedade digital. A mobilida-de não tem duplo sentido, mas tem dupla capacidade: a tecnológica, que nos permite utilizar um dispositivo em qualquer lugar, e a do conteúdo, que diz respeito à informação, ao lugar onde ela se encontra, não importando o fato em si, mas a capacidade de ser acessada (Basso, 2003), produ-zida e compartilhada.
Marçal, Andrade & Rios (2005, p. 3) defendem o uso de dispositivos móveis na educação citando seus principais objetivos:
•melhorar os recursos para o aprendizado, que poderá contar com um dispositivo para execu-ção de tarefas, anotação de ideias, consulta de informações via Internet, registros digitais e outras funcionalidades;
•prover acesso aos conteúdos em qualquer lugar e a qualquer momento;
•aumentar as possibilidades de acesso a conteúdos, incrementando e incentivando a utilização dos serviços providos pela instituição;
•expandir as estratégias de aprendizado disponíveis, por meio de novas tecnologias que dão suporte tanto à aprendizagem formal como à informal;
• fornecer meios para o desenvolvimento de métodos inovadores de ensino, utilizando os recur-sos de computação e de mobilidade.

2010 Pesquisa TIC EducaçãoARTIGOS 33
PO
RTu
Gu
ÊS
O uso de dispositivos móveis na educação, além dessas possibilidades e dada sua característica e relevância para a inclusão digital, é conceituado como mobile-learning, ou aprendizagem com mobilidade (Silva & Consolo, 2008).
há experiências importantes em desenvolvimento voltadas à aprendizagem com mobilidade. Uma delas, protagonizada pelo governo federal brasileiro, intitulada Um Computador por Aluno (UCA), promove o uso de um computador portátil por aluno, professor e gestor da escola. Nesse projeto, alunos e professores podem fazer uso de laptops conectados à Internet, e isso não fica restrito a laboratórios de informática ou à sala de aula. O projeto está em desenvolvimento em escolas públi-cas selecionadas como piloto, objetivando, principalmente, a inclusão digital e social da comuni-dade escolar e o uso dessa tecnologia nos processos de ensinar e aprender no desenvolvimento do currículo. Diversas outras iniciativas de uso de computadores portáteis podem ser encontradas em sistemas públicos e privados de ensino.
CoNCLUSõES E CoNSIdERAÇõES
O cenário atual acena para a concretização de inovações pedagógicas possibilitadas pela integra-ção das tecnologias com a educação, em especial com a exploração de alguns conceitos e caracte-rísticas propiciados pela presença de inovações como a Web 2.0, a conectividade sem fio, a mobili-dade e o uso do laptop na proporção de um computador por aluno. é possível que outros ambientes virtuais e ferramentas também estejam presentes e sejam explorados na educação, como os ambien-tes imersivos tridimensionais (metaversos) e os games, entre outros já existentes ou emergentes.
A coexistência e a integração dessas inovações tecnológicas podem, inclusive, conviver com as tecnologias já em uso, convergindo para potencializar a inovação educativa, que se concretiza por meio da interação multidirecional, da criação de redes de construção de significados, da coautoria, da expansão dos espaços e tempos de aprender e ensinar, e do trabalho pedagógico com o uso de diferentes letramentos e linguagens.
Como tendência, essas ferramentas e atividades estarão, também, na essência da Web 3.0 (web semântica), favorecendo os chamados sistemas de conhecimento coletivo, “capazes de auxiliar na produção de conhecimento coletivo através da análise da contribuição colaborativa humana” (Isotani et al., 2008, p. 6).
Finalmente, o uso de determinada tecnologia provoca mudanças nos modos de aprender, ensinar, pensar, relacionar-se com as demais pessoas e, também, de conceber e desenvolver o currículo. Como ressalta Kenski (2007):
A presença de uma determinada tecnologia pode induzir profundas mudanças na maneira de
organizar o ensino [...] existe uma relação direta entre educação e tecnologia. Usamos muitos
tipos de tecnologias para aprender e saber mais e precisamos da educação para aprender e saber
mais sobre as tecnologias. (p. 44)
é, assim, importante considerar que a incorporação de novas tecnologias aos modos de aprender e ensinar torna necessário repensar o desenvolvimento do currículo.
Pesquisa TIC Educação 2010ARTIGOS 34
PO
RTu
Gu
ÊS
REFERêNCIAS BIBLIoGRÁFICAS
ALMEIDA, Maria Elizabeth Bianconcini. Tecnologias na educação: dos caminhos trilhados aos atuais desafios. BolemA – Boletim de Educação Matemática, 29(21), 2008.
. Transformações no trabalho e na formação docente na educação a distância on-line. em Aberto, Brasília, 23(84), pp. 67-77, nov. 2010a.
. web Currículo, caminhos e narrativas. In: Anais do ii Seminário web currículo. Publicação em CD-ROM. São Paulo: PUC-SP, 2010b.
BASSO, Maria Aparecida josé. Pedagogia digital na convergência do suporte “e” da educação: uma propos-ta de modelo para logística de negócios sob demanda. Doutorado em engenharia de produção. Florianópolis: Programa de Pós-Graduação em Engenharia de Produção da Universidade Federal de Santa Catarina, 2003.
CASTELLS, Manoel. Internet e sociedade em rede. In Moraes, D. (org.). Por uma outra comunicação. Rio de janeiro: Record, 2003.
GADOTTI, Moacir. A escola frente à cultura midiática. In: OROFINO, Maria Izabel. mídias e mediação esco-lar: pedagogia dos meios, participação e visibilidade. Guia da Escola Cidadã, v. 12. São Paulo: Cortez / Instituto Paulo Freire, 2005. pp. 15-94.
ISOTANI, Seiji et al. Web 3.0: os rumos da web semântica e da Web 2.0 nos ambientes educacionais. In: Anais do xix Simpósio Brasileiro de informática na educação. SBIE, 2008.
KENSKI, Vani Moreira. educação e tecnologias: o novo ritmo da informação. Campinas: Papirus, 2007.
LEIGh, Douglas. A Brief history of Instructional Design. In: iSPi global network chapter. 1998. Disponível em: http://www.pignc-ispi.com/articles/education/brief%20history.htm.
LéVY, Pierre. cibercultura. Trad. Carlos Irineu da Costa. 2. ed. São Paulo: Editora 34, 2000.
MARçAL, Edgar; ANDRADE, Rossana; RIOS, Riverson. Aprendizagem utilizando dispositivos móveis com siste-mas de realidade virtual. In: renote – revista novas tecnologias na educação, 3(1), Porto Alegre: UFRGS, Centro Interdisciplinar de Novas Tecnologias na Educação, maio de 2005.
PAPERT, Seymour. logo: computadores e educação. São Paulo: Brasiliense, 1985.
PRADO, Maria Elisabette Brisola Brito; SILVA, Maria da Graça Moreira. Formação de educadores em ambientes virtuais de aprendizagem. em Aberto, Brasília, 22(79), pp. 61-74, jan. 2009.
RAMAL, Andréa Cecília. Educação com tecnologias digitais: uma revolução epistemológica em mãos do dese-nho instrucional. In: SILVA, Marco (org.). educação on-line. São Paulo: Loyola, 2003.
SANTAELLA, Lucia. navegar no ciberespaço: o perfil cognitivo do leitor imersivo. São Paulo: Paulus, 2004.
SILVA, Marco. Sala de aula interativa. 3. ed. Rio de janeiro: Quartet, 2002.
SILVA, Maria da Graça Moreira da; CONSOLO, Adriane Treitero. Mobile learning: uso de dispositivos móveis como auxiliar na mediação pedagógica de cursos a distância. In: OSÓRIO, Antonio josé; DIAS, Paulo. Ambientes educativos emergentes. Minho: Universidade do Minho, 2008.
SILVA, Maria da Graça Moreira. De navegadores a autores: a construção do currículo no mundo digital. In: Anais do endiPe. Belo horizonte: 2010.
VALENTE, josé Armando; ALMEIDA, Fernando j. Visão analítica da informática na educação no Brasil: a questão da formação do professor. revista Brasileira de informática na educação, v. 1, 1997. Educação e desenvolvimento: modos de regulação dos sistemas de ensino.

2010 Pesquisa TIC EducaçãoARTIGOS 35
PO
RTu
Gu
ÊSdESAFIoS dA EdUCAÇÃo PARA PRomoÇÃo
do USo éTICo E SEGURo dA INTERNET No BRASIL
Rodrigo Nejm1
INTRodUÇÃo
A democratização do acesso à Internet está em destaque na agenda de muitas políticas públicas no país, precisamente no Plano Nacional de Banda Larga e no Projeto de Banda Larga nas Escolas. Essas duas ações estão trazendo milhões de novos internautas para a Internet brasileira, potenciali-zando com muita velocidade as novas possibilidades de relacionamento social, científico, cultural e político na sociedade contemporânea. Essas políticas, somadas aos projetos de ampliação de tele-centros públicos e formalização de milhares de lanhouses no Brasil, estão construindo uma nova realidade social ao permitir a criação de novas linguagens, novos sentidos e o crescimento da cultu-ra digital. Além de mudarem com muita velocidade, as tecnologias são incorporadas à vida dos bra-sileiros com muita rapidez, surpreendendo constantemente nas estatísticas. Apesar da pesquisa TIC Domicílios 2009, do Cetic.br, apontar que 55% da população brasileira nunca acessou a Internet, a mesma pesquisa mostra que o acesso à rede é uma realidade para 69% dos brasileiros na faixa etária entre 10 e 15 anos de idade e para 78% dos jovens entre 16 e 24 anos. Entre as crianças de 5 a 9 anos, o acesso é comum para 29% delas, segundo a pesquisa TIC Crianças 2009, do Cetic.br.
Presenciamos profundas mudanças psicossociais na infância, na adolescência e na juventude con-temporâneas, produzidas por muitos fatores, como, entre outros, o uso intenso e diverso das tec-nologias de informação e comunicação (TIC). Certamente as TIC desempenham um papel de des-taque na transformação do lazer, do estudo, do comunicar e do brincar das novas gerações, mas as mudanças também são radicais no âmbito do universo de consumo, no conflito entre gerações, no mundo do trabalho, na conquista de direitos civis e mesmo políticos em algumas sociedades. Como aponta a pesquisadora Sonia Livingstone (2009), não podemos centrar a reflexão nas tecnologias
1 Psicólogo pela Unesp (Assis-SP) e mestre em gestão e desenvolvimento social pelo CIAGS/UFBA. Diretor de Prevenção da ONG Safernet, responsável pela criação de materiais pedagógicos, cursos e pesquisas para prevenção aos cibercrimes contra direitos humanos no Brasil. Pesquisador na área de psicologia e novas mídias, participa de pesquisas nacionais e internacio-nais sobre as subjetividades na era da informação.
Pesquisa TIC Educação 2010ARTIGOS 36
PO
RTu
Gu
ÊS
sem levar em conta outras transformações no mundo do trabalho, da estruturação da família e do universo de consumo infanto juvenil.
Os recursos tecnológicos têm sido incorporados intensamente no cotidiano das novas gerações de crianças e adolescentes, e de forma muito acelerada. Mesmo as classes sociais menos favoreci-das possuem cada vez mais acesso a Internet, celulares e equipamentos eletrônicos para comuni-cação, estudo, trabalho e entretenimento. Quando pensamos nos desafios para uma apropriação ética e segura da Internet na vida das crianças e adolescentes, não podemos deixar de conside-rar que o ciberespaço é um espaço social de relacionamento. Ainda hoje, muitos internautas com-preendem a Internet como uma “terra sem lei e da impunidade absoluta”, como se tudo fosse per-mitido pelo anonimato. Um dos primeiros desafios para promover o uso ético e seguro da rede é justamente conscientizar os usuários sobre a dimensão pública do ciberespaço, espaço no qual as pessoas, e não apenas computadores, se relacionam socialmente. Nesse novo tipo de espaço públi-co, precisamos também nos comportar como cidadãos e adotar medidas de segurança tanto quan-to em outros espaços. Certamente há espaços privados no ciberespaço, mas o uso intenso das redes sociais, blogs, câmeras e celulares está cada vez mais diluindo os limites entre o público e privado (Livingstone, 2009). Mesmo nos espaços privados, a dimensão de direitos e deveres dos cidadãos e internautas deveria ser apropriada desde o primeiro clique de navegação.
As políticas de inclusão digital não podem ficar restritas ao simples acesso à tecnologia. é vital que a inclusão digital seja compreendida como um processo educativo mais amplo, que habilite a for-mação crítica e cidadã dos internautas, para que estes tenham condições de exercer plenamente sua cidadania também nos espaços de relacionamento possibilitados pelas TIC. “A Internet, de certo modo, reproduz o mundo da rua” (Amadeu, 2010). O educar no mundo contemporâneo exige edu-car para estas novas ruas e praças cibernéticas nas quais as novas gerações passam boa parte de seu tempo. Ao usar a Internet, uma criança acessa um espaço público planetário e imensurável que pos-sui todo tipo de informação e pessoas, com todos os benefícios e perigos que outros espaços públi-cos podem oferecer. Logicamente, há muito mais oportunidades do que riscos, mas, como em todo espaço público amplo e movimentado, no ciberespaço também há crimes, golpes e violações aos direitos humanos em diferentes graus. Crianças e adolescentes, que passam a usar a Internet cada vez mais cedo, precisam ser educados para compreender a dimensão ética, seus direitos e deveres quando estão on-line, não apenas na perspectiva da proteção, mas especialmente na perspectiva da emancipação para uma navegação autônoma, responsável e segura.
Os desafios da educação no Brasil são enormes em diferentes áreas, mas não podemos nos furtar de incorporar as questões relativas à educação para uso ético e seguro da Internet. A pequena pro-porção de crianças e adolescentes que usam a Internet da escola (27% das crianças de 5 a 9 anos – TIC Crianças 2009; 25% das crianças entre 10 e 15 anos e 17% entre 16 e 24 anos – TIC Domicílios 2009) ilustra parcialmente o lugar ocupado pela escola nesse processo. Apesar de todos os esfor-ços para ampliar os acessos nas escolas públicas, o uso da Internet extrapola e muito os muros da escola. Ainda na pesquisa TIC Domicílios 2009, as lanhouses aparecem como local de acesso para 61% das crianças entre 10 e 15 anos de idade. São espaços importantes não apenas de aces-so, mas também de socialização, e precisam ser vistos antes como potenciais agentes de proteção e educação do que como espaços perigosos. Quando pensamos em uma educação para o uso éti-co e seguro, o mais importante não é o local de acesso, mas os locais que oferecem as condições de aprendizado para qualificar o uso que as crianças e adolescentes fazem da Internet e demais TIC. Crianças e adolescentes podem aprender muito rapidamente a usar os novos recursos digitais,

2010 Pesquisa TIC EducaçãoARTIGOS 37
PO
RTu
Gu
ÊS
sejam equipamentos ou serviços on-line, porém a educação para o uso ético depende de um pro-cesso mais amplo de educação cidadã, um compromisso da escola compartilhado com a família e com toda a sociedade. O desafio geracional na familiaridade com as novas tecnologias não será um obstáculo tão grande nesse processo se o foco estiver na educação cidadã, e não na educação pragmática do uso das TIC. Educar para a cidadania é uma meta transversal das políticas educacio-nais, e as TIC precisam urgentemente ser incorporadas nos projetos pedagógicos não apenas como recursos técnicos, mas como produtoras de novos espaços de socialização, novas expressões cultu-rais e como mediadoras na formação da personalidade.
O Plano Nacional de Educação em Direitos humanos (PNEDh, 2007) e o Programa ética e Cidadania, criados pelo Ministério da Educação (MEC) e pela Secretaria Nacional de Direitos humanos (SDh), oferecem oportunidades de discussão a respeito dessa temática como política pública. No PNEDh, há um eixo dedicado à mídia, que pode orientar a incorporação das TIC no trabalho pedagógico dos educadores brasileiros. As ações do e-Proinfo, projeto integrado do MEC, estão avançando muito na apropriação pedagógica, e podem ser complementadas com essa dimensão de uso ético para efeti-var a escola como espaço de formação cidadã também no que diz respeito às TIC. Usar essas referên-cias e fortalecer a criação de recursos educacionais abertos são caminhos disponíveis para sensibili-zar e orientar nossos pequenos internautas nas escolas, na lanhouse, em casa e na própria Internet, adaptando os conteúdos pedagógicos a cada contexto sociocultural e com foco no interesse públi-co da educação. Parece vital conscientizar os educadores e pais para que possam estimular o uso da Internet pelas crianças e adolescentes numa perspectiva de promoção de direitos, e não apenas de proteção. Quando pensamos no uso ético da Internet, estamos justamente considerando que cada usuário precisa ter plena consciência de seus direitos e deveres e que possa estabelecer on-line rela-ções sociais baseadas na pluralidade e no respeito à diversidade. Os princípios de uma ciberdemo-cracia (Lemos & Levy, 2010) estão alinhados aos princípios fundamentais dos direitos humanos, e não podemos pensar a cultura digital sem essa consciência dos internautas.
A Constituição Federal garante (art. 227) a promoção e a proteção dos direitos das crianças e ado-lescentes como prioridade absoluta. é fácil perceber que, mesmo off-line, essa prioridade ainda não foi efetivamente concretizada, apesar dos significativos avanços nos vinte anos de existência do Estatuto da Criança e do Adolescente (ECA, 1990). Atualmente, são intensas as medidas de com-bate aos crimes sexuais contra crianças e adolescentes na Internet, mas é preciso ir muito além do previsto no art. 227 da CF. Precisamos sempre ter em mente que crianças e adolescentes são, antes de tudo, sujeitos de direitos, e não apenas objetos de ações de proteção. Ou seja, devemos evi-denciar também as leis que garantem às crianças e adolescentes os direitos sexuais, o direito à pri-vacidade, à liberdade, o direito de acesso ao lazer e à cultura. Como outros internautas, crianças e adolescentes precisam ter seus direitos preservados também no âmbito de uma navegação autô-noma. Uma navegação segura para elas não precisa ser sinônimo de uma Internet vigiada e com as liberdades restritas quando consideramos a segurança como um dos direitos humanos – direi-tos que são indissociáveis. Essa observação é vital em toda e qualquer ação que tenha como obje-tivo o melhor interesse das crianças e adolescentes, pois, como sujeitos de direitos, não deveriam ser apenas recepto res passivos de “ajudas”, assistencialismos ou protecionismos de adultos ou polí-ticas públicas. Proteger, dentro ou fora da Internet, traz à tona o desafio de equilibrar o exercício dos direitos à privacidade, à liberdade e ao acesso à informação com os limites previstos para res-peitar a singularidade de cada fase do desenvolvimento de crianças e adolescentes. Na Internet, esse desafio torna-se ainda mais complexo, com fronteiras, limites e representações cada vez mais fluidas e dinâmicas.

Pesquisa TIC Educação 2010ARTIGOS 38
PO
RTu
Gu
ÊS
Considerando essas observações, acreditamos ser importante uma reflexão que possa antecipar medidas de prevenção aos riscos e vulnerabilidades de crianças e adolescentes na Internet no Brasil.
ENTRE RISCoS E oPoRTUNIdAdES No CIBERESPAÇo
Crimes e violações de diretos aumentam progressivamente conforme aumenta o número e a inten-sidade de usuários da Internet no Brasil, trazendo mais um grande desafio à educação e ao siste-ma de garantia dos direitos das crianças e adolescentes no presente e no futuro próximo. Como outros espaços públicos de relacionamento, a Internet brasileira também é palco para a prática de crimes e/ou violações aos direitos humanos, como a exploração sexual de crianças e adolescen-tes nas redes de pornografia infantil, a humilhação pública na Internet (ciberbullying, difamação e calúnia), apologia a crimes contra a vida, manifestação de intolerância religiosa, étnica e de orien-tação sexual. Mesmo vítimas que não chegam a ser presencialmente violentadas são seriamente afetadas pela violência da chantagem, dos conteúdos impróprios, da exposição e da autoculpabili-zação produzida após experiências traumáticas vivenciadas na Internet. As situações de violência são reproduzidas também na Internet, não por ser um ambiente mais perigoso ou inseguro, mas por ser ela reflexo da sociedade e fruto do comportamento dos usuários. Enquanto for percebida como espaço paralelo às normas sociais válidas nas relações presenciais, as violações de direitos on-line tenderão a crescer. O desafio para a sociedade é minimizar os riscos e potencializar as oportunida-des da Internet e demais TIC para todas as faixas etárias da população por meio de esforços conju-gados de educação.
No Brasil, no que diz respeito a violência sexual, várias práticas foram potencializadas com o uso das tecnologias, aumentando a necessidade de ações preventivas e de enfrentamento para preser-var a dignidade de vítimas reais e potenciais. Com os serviços da Internet, a troca e difusão desse tipo de conteúdo ilegal foram facilitados, ganhando dimensões cada vez mais globais, seja na pro-paganda e venda de viagens para turismo envolvendo redes de exploração sexual comercial ou no uso das TIC para aliciar sexualmente crianças e adolescentes. é importante salientar que todas essas práticas mediadas pelas TIC já estão contempladas como crime na nova versão do ECA, nos arti-gos 240 e 241. As TIC também podem ser usadas para promover a incitação a crimes contra a vida, ao uso de drogas ilícitas, à tortura e diferentes formas de violência, com dicas e guias práticos para “iniciantes”. Destaca-se a incidência de muitos conteúdos racistas e homofóbicos. A facilidade para trocar informações e se comunicar pela Internet potencializa as diferentes práticas sociais já exis-tentes, tanto aquelas que fortalecem a cidadania quanto aquelas que agridem as leis e os direitos fundamentais dos cidadãos.
A possibilidade de forjar identidades virtuais favorece comportamentos de risco, ampliando a potência de antigas práticas de agressão e intimidação entre crianças, como o bullying. Essa vio-lência ganha força quando mensagens ofensivas passam a chegar a milhares de espectadores por meio de sites de compartilhamento de vídeos, fotos e textos. Crianças e adolescentes humilham e são humilhados diante de um enorme público, que envolve familiares, amigos, vizinhos e um uni-verso quase ilimitado de internautas que podem ter acesso a cenas vexatórias, configurando o cha-mado ciberbullying. Isso, que parece apenas uma brincadeirinha aos olhos dos que praticam, divul-gam e consomem, pode produzir graves consequências psicossociais às vítimas, comprometendo um desenvolvimento saudável. Outro fenômeno recente e preocupante é o sexting, nome dado à
2010 Pesquisa TIC EducaçãoARTIGOS 39
PO
RTu
Gu
ÊS
prática de adolescentes de tirar fotos do próprio corpo nu ou seminu e enviar para amigos e preten-dentes por meio de mensagens de celular e/ou pela Internet. Em muitos casos, o(a) adolescente víti-ma perde o controle sobre a imagem que ganha a rede e pode cair em sites de pornografia infanto--juvenil. Essa prática viola os artigos 241-A, B e E do ECA, mas traz à tona a carência de educação sobre sexualidade e a gravidade dos riscos quando não há orientações adequadas sobre os perigos da exposição on-line.
SINAIS dE vULNERABILIdAdE E INdICAdoRES dE vIoLAÇõES dE dIREIToS NA INTERNET
Na pesquisa EU Kids Online, sobre riscos e segurança na Internet, realizada em 23 países da União Europeia pela London School of Economics, com mais de 23 mil crianças entre 9 e 16 anos de ida-de (Livingstone & haddon, 2010), podemos perceber a dimensão global de algumas situações de vulnerabilidade on-line. Mesmo com alto índice de penetração da Internet nos países europeus (chegando a mais de 90% em alguns casos) e com 85% dos entrevistados tendo acesso domésti-co, as crianças e adolescentes europeias possuem carências de conhecimentos básicos de seguran-ça on-line. Na faixa etária entre 11 e 12 anos, apenas 43% sabem bloquear mensagens indesejadas e 48% sabem encontrar orientações sobre uso seguro. No grupo entre 11 e 16 anos, apenas 54% sabem mudar as configurações de privacidade de seu perfil nas redes sociais. Sobre as situações de risco, 24% afirmaram já ter sido vítima de ciberbullying, 15% já praticaram sexting, e 8% já saíram de casa para encontrar pessoalmente um amigo virtual (que conheceu primeiramente pela Internet).
No Brasil, apesar de a penetração da Internet ainda ser bastante inferior (69% na faixa etária entre 10 e 15 anos de idade, e 78% entre 16 e 24 anos), 58% das crianças entre 10 e 15 anos gastam entre uma e cinco horas por semana na Internet, e 15% gastam de seis a dez horas semanais, sendo que 74% participam de sites de relacionamento (TIC Domicílios 2009). Na pesquisa sobre hábitos de segurança on-line (Safernet, 2009), 69% dos alunos têm ao menos um amigo virtual (que conhe-ceu pela Internet), sendo que 32% têm mais de 30 amigos do tipo. 12% dos alunos já namoraram ao menos uma vez pela Internet, e 11% já publicaram na rede fotos íntimas e/ou sensuais. No que diz respeito a ciberbullying, 33% afirmam que algum amigo seu já foi vítima desse tipo de humi-lhação. Para 90% dos educadores, a Internet e demais TIC têm efeitos positivos na vida de seus alu-nos. Para 77% dos educadores, é comum os alunos comentarem em sala de aula o que fazem na Internet, sendo que para 65% dos educadores isso ocorre constantemente. Em relação aos perigos vivenciados pelos alunos, 6% souberam de casos em que alunos de sua escola foram vítimas de aliciamento sexual pela Internet. já em relação ao ciberbullying, 26% dos educadores sabiam de casos entre alunos de sua escola. Quanto ao compromisso da escola com a discussão das medi-das de segurança on-line, 99% consideram isso um dever da escola, sendo que 67% a consideram uma temática urgente que merece trabalhos permanentes de orientação. No entanto é preocupante o fato de que 50% dos educadores consideram que não há informações suficientes para trabalhar o tema nas escolas, e 24% não conhecem nenhum programa que trate do tema. Quando indagados sobre os recursos que têm para levar o tema à sala de aula, 29% dizem que não têm nenhum recur-so e gostariam muito de ter, e outros 9% não têm e nem sabem como buscar esse tipo de recurso.
Considerando-se esse cenário complexo, é vital que as organizações da sociedade civil, famí-lias, empresas e governos somem esforços para maximizar a promoção dos direitos das crianças

Pesquisa TIC Educação 2010ARTIGOS 40
PO
RTu
Gu
ÊS
e a dolescentes dentro e fora da Internet. é necessário articular as diferentes políticas e iniciativas, e ampliar os serviços de utilidade pública, com o objetivo de aproveitar a própria tecnologia para potencializar as oportunidades, minimizar os riscos e fazer da Internet no Brasil uma porta de entra-da segura para que nossas crianças e demais internautas criem e desenvolvam relações sociais éti-cas, seguras e saudáveis.
EdUCAÇÃo PARA PRomoÇÃo dE dIREIToS E PREvENÇÃo
Sabendo que as novas gerações estão crescendo habituadas ao uso contínuo dos novos dispositivos tecnológicos, é fundamental que estes mesmos dispositivos sejam utilizados para educar, prevenir e orientar. Muitas crianças e adolescentes não encontram espaços suficientes para acolher suas dúvi-das, inquietações, angústias e problemas relacionados ao uso da Internet e a possíveis violações de seus diretos cometidas on-line e/ou off-line. Salienta-se a enorme lacuna nas habilidades tecno-lógicas entre as gerações atuais de educadores, conselheiros e pais e as gerações de alunos/filhos. é urgente que, desde o primeiro clique, para evitar o aumento de vitimizações, os pequenos inter-nautas brasileiros saibam manter sua segurança e seus direitos garantidos. Não só as crianças, mas também pais, educadores e agentes do sistema de garantia dos direitos precisam aprender a evitar os riscos on-line, atualizando-se sobre as novas formas de violações de direitos facilitadas pela mas-sificação do uso das TIC. Como sugerido no início do artigo, é preciso olhar para a Internet como para uma praça pública e, a partir daí, pensar nas orientações, cautelas e limites necessários para crianças e adolescentes, de acordo com cada faixa etária e cada contexto. Não podemos aguardar que os casos de aliciamento sexual pela Internet, chantagem virtual, apologia ao suicídio ou ciber-bullying aumentem em proporções assustadoras para, só então, reagir.
Crianças e adolescentes têm direito de informar-se, divertir-se, interagir e brincar no ciberespaço com privacidade e liberdade, devendo toda sua singularidade de pessoa em desenvolvimento tam-bém ser preservada na Internet (artigos 15, 16, 17 e 71 do ECA). Por isso, precisamos orientá-las para um uso da rede responsável, cidadão e seguro, oferecendo condições suficientes para prevenir e garantir a proteção integral. As ações devem estar além da simples proteção, já que, como sujei-tos de direitos, crianças e adolescentes podem participar ativamente da definição do seu próprio “melhor interesse” (Melo, 2008). Fenômenos como o sexting trazem à tona um complexo cenário no qual a Internet dá um poder aos adolescentes surpreende familiares, instituições e os adultos em geral. Ele evidencia uma condição da sexualidade reificada, espetacularizada e midiatizada ou apenas a livre expressão da sexualidade? Em tempos de hiperconexão, quais critérios para descre-ver a condição peculiar de uma pessoa em desenvolvimento devem ser respeitados para delimitar os direitos de acesso a informação, cultura, lazer e privacidade na Internet por parte das crianças? Questões como essa precisam ser debatidas para podermos antecipar situações de risco, minimi-zando-as o quanto antes e com pleno respeito às liberdades dos milhões de novos usuários que o Brasil ganhará nos próximos anos.
Nem sempre crianças e adolescentes conseguem avaliar as consequências de seus comportamen-tos “atrás da tela”, evidenciando quão amplo é, por exemplo, o tema dos direitos sexuais na ado-lescência. Para garantir uma educação que promova a afirmação de direitos e a emancipação, pre-cisamos rever reducionismos que desqualificam a voz e a vontade de crianças e adolescentes em nome de uma suposta proteção. A Internet permite um fantástico empoderamento dos usuários,

2010 Pesquisa TIC EducaçãoARTIGOS 41
PO
RTu
Gu
ÊS
e este em poderamento só será cidadão quando for desmistificada a noção de Internet como ter-ra de ninguém e espaço de impunidade absoluta. O caminho mais efetivo está muito além da res-trição de liberdades ou da criminalização; ele depende de processos educativos que criem condi-ções para uma navegação consciente e responsável. Considerar a dimensão pública da Internet e reconhecer os deveres que acompanham os direitos nas relações mediadas são ações que favore-cem o desenvolvimento de uma Internet cada vez mais livre e democrática. Se pais e educadores não se apropriarem imediatamente desse processo educativo, também on-line, pode estar ameaça-do o futuro tanto dos diretos humanos de crianças e adolescentes quanto da própria Internet. As relações sociais mediadas pelas TIC são cada vez mais intensas no processo de formação da sub-jetividade na contemporaneidade. Nesse contexto, nosso maior desafio diante das TIC permanece tão antigo quanto a própria civilização: como promover a educação para que tenhamos condições dignas para desenvolver projetos de vida que respeitem os direitos humanos e favoreçam relações sociais justas e éticas?
REFERêNCIAS BIBLIoGRÁFICAS
AMADEU, S. A. Vigiar e punir: comunicação e controle na Internet. In: CGI.br. Pesquisa sobre o uso das tec-nologias da informação e da comunicação no Brasil: 2005-2009. São Paulo: Comitê Gestor da Internet, 2010.
BRASIL. Comitê Nacional de Educação em Direitos humanos. Plano nacional de educação em direitos humanos. Brasília: Secretaria Especial dos Direitos humanos, 2007a.
BRASIL. estatuto da criança e do Adolescente, Lei no 8.069, de 13 de julho de 1990. Disponível em: http://www.planalto.gov.br/ccivil_03/leis/l8069compilado.htm.
BRASIL. Ministério da Educação. Secretaria de Educação Básica. Programa Ética e cidadania: construindo valores na escola e na sociedade: inclusão e exclusão social. Brasília, 2007b.
CGI.br. Pesquisa sobre o uso das tecnologias da informação e da comunicação no Brasil – tic crianças 2009. São Paulo: Comitê Gestor da Internet, 2010.
. Pesquisa sobre o uso das tecnologias da informação e da comunicação no Brasil 2009 – tic domicílios e tic empresas. São Paulo: Comitê Gestor da Internet, 2010.
LEMOS, A. & LEVY, P. o futuro da internet: em direção a uma ciberdemocracia planetária. São Paulo: Paulus, 2010.
LIVINGSTONE, S. children and internet: great expectations, challenging realities. Cambridge: Polity, 2009.
LIVINGSTONE, S.; hADDON, L. (orgs.). risks and Safety on the internet: the Perspective of european children. Londres: EU Kids Online, 2010.
MARTÍN-BARBERO, j. dos meios às mediações. Rio de janeiro: Editora da UFRj, 2001.
MELO, Eduardo Rezende. Direito e norma no campo da sexualidade na infância e na adolescência. In: ABMP. criança e adolescente: direitos e sexualidades. São Paulo: ABMP, 2008.
SAFERNET BRASIL. cartilha Saferdic@s. Disponível em: www.safernet.org.br/cartilha.
. Pesquisa hábitos de navegação e vulnerabilidades on-line 2009. Disponível em: http://www.safernet.org.br/site/prevencao/pesquisas, 2009.
SILVEIRA, R. M. G. et al. (org.). educação em direitos humanos: fundamentos teórico-metodológicos. joão Pessoa: Editora da UFPB, 2007.


2010 Pesquisa TIC EducaçãoARTIGOS 43
PO
RTu
Gu
ÊSFoRmAÇÃo dE doCENTES PARA o USo dAS TIC
No ENSINo/APRENdIzAGEm NA AméRICA LATINA
Maria Inês Bastos 1
A formação de docentes para o uso das TIC no processo de ensino / aprendizagem é uma questão recente na América Latina e ocorre com o amadurecimento dos processos de modernização tecno-lógica das escolas. Grande parte dos formadores de docentes na região sequer está no grupo dos chamados “imigrantes digitais”, isto é, não tiveram a oportunidade de se habilitar à adoção das novas tecnologias anos após sua própria formação docente e no exercício profissional em escolas desprovidas dessa tecnologia. Muitos continuam, de fato, à margem das inovações. Grande parte – talvez a maioria – dos docentes em exercício nas escolas primárias e secundárias não aprendeu os rudimentos do uso das novas tecnologias e muito menos suas aplicações educacionais durante a formação inicial. Alguns “migraram” por iniciativa própria, incentivados pelos avanços tecnológicos na sociedade circundante ou pelos cursos de capacitação em serviço. Esses docentes se veem na situação de ter de liderar grupos de alunos “nativos digitais” em escolas providas com equipamen-tos muito inferiores ao que parte dos alunos dispõe em seus lares ou em centros públicos de acesso.
PERFIL CURRICULAR dA FoRmAÇÃo INICIAL do doCENTE
Os estudos sobre a formação de docentes no Brasil (Gatti & Sá Barreto, 2009) e na Colômbia, Equador e Venezuela (Fabara, 2004) apontam situação muito similar à que o Ministério da Educação do Chile encontrou antes da execução do Projeto de Fortalecimento da Formação Inicial Docente (FFID). Fabara encontra nos três países um currículo tradicional sem campos de estudo nem prática em pesquisa e inovações educativas, em que não se elaboram recursos didáticos para favorecer a educação ativa, nem há processos de desenvolvimento do pensamento e da criatividade.
O Projeto FFID, do Chile, foi elaborado para enfrentar a queda de qualidade dos cursos superio-res de formação docente, acompanhada de diminuição do número de candidatos e consequen-te redução dos padrões de admissão. A queda da qualidade dos cursos era resultado de uma fraca
1 Mestre em ciência política pela UFMG e doutora em estudos do desenvolvimento pela Universidade de Sussex, Inglaterra. Foi docente na UnB, assessora do Senado Federal, pesquisadora no Instituto para Novas Tecnologias, em Maastricht (holanda), e funcionária da Unesco no Brasil.

Pesquisa TIC Educação 2010ARTIGOS 44
PO
RTu
Gu
ÊS
estrutura curricular (conteúdo heterogêneo e fragmentado, muitas aulas expositivas e poucas práticas), ca racterísticas e comportamento dos formadores (de idade avançada, com baixa qualificação, mínima atualização e pouco contato com escolas), baixo nível de desempenho acadêmico dos alunos no cur-so secundário e escassez de apoio docente e recursos de aprendizagem disponíveis nas instituições.
No Brasil, o currículo dos cursos superiores de pedagogia – que formam professores para os pri-meiros anos da educação básica – tem uma característica fragmentária e apresenta um conjunto disciplinar bastante disperso. O tempo dedicado a disciplinas de formação profissional específica corresponde a apenas 30% do total. Uma análise das ementas das disciplinas mostra que, nas de formação específica, predominam os referenciais teóricos – sejam de natureza sociológica, psico-lógica ou outros –, com associação em poucos casos às práticas educacionais.
Assim, as disciplinas referentes à formação profissional específica apresentam ementas que
registram preocupação com as justificativas sobre o porquê de ensinar, o que, de certa forma,
contribuiria para evitar que essas matérias se transformassem em meros receituários; entretanto
só de forma muito incipiente registram o quê e como ensinar. (Gatti & Sá Barreto, 2009, p. 152).
O tema das tecnologias (que não se reduz às TIC, mas que as inclui) está coberto tanto como um dos “saberes relacionados a tecnologia” – que constituem uma parte dos “conhecimentos relativos à formação profissional específica” – quanto como “outros saberes”, mas representam uma propor-ção ínfima do tempo total dedicado à formação dos futuros docentes.
A experiência do FFID, do Chile, embora auspiciosa em relação ao conteúdo curricular, não atin-giu os níveis desejados. Rodríguez Méndez e Silva Quiroz (2008) estudam, em profundidade, como dezenove programas universitários de formação inicial docente, beneficiários do FFID, apresen-tam as TIC como recurso pedagógico. Sua análise mostra que o tema é tratado em aulas expositivas complementadas com trabalho nos laboratórios de informática, e, em menor grau, envolve trabalho colaborativo e a elaboração de projetos. As disciplinas são geralmente denominadas “informática educativa” ou “computação educativa” e tratam de tópicos referentes a arquitetura e funcionamen-to dos computadores, manejo de sistema operacional e das ferramentas de produtividade (proces-sador de texto, planilha de cálculo e software de apresentação), além da Internet como recurso de comunicação e busca de dados. Com essas disciplinas, os programas analisados mostram uma cla-ra definição pelo domínio operativo das ferramentas. Não apresentam as TIC como elementos que podem contribuir para o desenvolvimento profissional docente, não exploram o compartilhamen-to de experiências e produtos validados pelos pares em exercício, não articulam os benefícios das TIC para a gestão escolar e muito menos conduzem ao conhecimento e à reflexão sobre o papel das TIC na sociedade, o que poderia levar a discussões sobre seus aspectos éticos, legais e sociais.
Infelizmente, são poucos os estudos que trazem análises detalhadas do conteúdo curricular e das ementas de disciplinas efetivamente ministradas aos futuros docentes na América Latina, impedin-do que se possa estudar com maior clareza o desenvolvimento de habilidades para a condução do processo de ensino e aprendizagem. Na ausência dessa informação, não se pode verificar como as potencialidades das TIC para o ensino e aprendizagem estão sendo, de fato, apresentadas aos futu-ros professores.

2010 Pesquisa TIC EducaçãoARTIGOS 45
PO
RTu
Gu
ÊS
Pode-se dizer, portanto, que “TIC e educação” é um tema praticamente ausente da reforma educa-cional e da reforma da formação de docentes na América Latina. Até mesmo em Cuba, cujos cur-rículos de formação inicial já incluíam a disciplina “computação” na década de 1990, e no Chile, onde as TIC estavam presentes no conjunto dos “conhecimentos instrumentais para o ensino”, as indicações apontavam para que a formação se limitasse, de fato, à familiaridade com equipamentos e aplicativos básicos, e, às vezes, o acesso aos equipamentos restringia-se aos formadores.
O caso do Brasil pode ser ilustrativo. A preocupação com a inclusão do tema “TIC e educação” na formação inicial docente ficou clara nas intenções das autoridades educacionais em 2009, quando foi instituída a Política Nacional de Formação de Profissionais do Magistério da Educação Básica (Decreto no 6.755, de 29 de janeiro de 2009) e, em seguida, o Plano Nacional de Formação dos Professores da Educação Básica (Portaria Normativa no 9, de 1o de julho de 2009). O Decreto no
6.755/2009 estabelece como um de seus dez objetivos: “IX – promover a atualização teórico-meto-dológica nos processos de formação dos profissionais do magistério, inclusive no que se refere ao uso das tecnologias de comunicação e informação nos processos educativos”.
A formação de formadores no uso pedagógico das TIC é uma das questões a serem enfrentadas no Brasil e nos outros países da América Latina que têm a intenção de incorporar as novas TIC em sua prática educacional. Não é uma questão trivial, considerando-se o tamanho da demanda a ser aten-dida, mas as atividades de pesquisa em muitas faculdades de educação ou departamentos de psico-logia das melhores universidades da região já podem contribuir com um razoável número de forma-dores. Nesse caso, a questão passará a ser como atraí-los e mantê-los nas instituições de formação inicial de professores.
A limitada incorporação do tema “TIC e educação” no currículo da formação inicial de docentes na América Latina ocorre num contexto de tardia e desigual difusão dessas tecnologias na região. Somente em tempos bastante recentes as TIC assumiram nível significativo na economia e socieda-de da América Latina. A “informatização” das escolas públicas representou um papel importante na redução do hiato digital, sem, no entanto, representar estímulo à introdução do tema na formação inicial, nem resultar em pressão suficiente sobre os docentes em exercício para utilizá-las de modo a dinamizar o processo de ensino/aprendizagem.
TIC NAS ESCoLAS dA AméRICA LATINA
Preocupações com maior eficiência e qualidade da educação orientaram as iniciativas públicas de informatizar escolas. Usualmente, a literatura identifica como primeiras iniciativas de TIC na edu-cação aquelas que se destinaram a introduzir nas escolas computadores e, depois, conectivida-de. Na América Latina, as primeiras ações nessa direção foram tomadas na Costa Rica (Programa Nacional de Informática Educativa), em 1988, e no Chile (Red Enlaces), em 1992, seguidos pelo Brasil (Proinfo), em 1997.
Paulatinamente e motivados pelo impulso que a Internet mostrava ter nos países desenvolvidos, em meados da década de 1990, grande parte dos países da América Latina lançou iniciativas ou pro-gramas de TIC para escolas. Essas iniciativas visavam a melhorar a qualidade da educação por meio da criação de ambientes de aprendizagem com alta densidade tecnológica – incluindo o uso de softwares multimídia e computadores em redes – que estimulassem a criatividade, o pensamento

Pesquisa TIC Educação 2010ARTIGOS 46
PO
RTu
Gu
ÊS
lógico e a capacidade de resolver problemas. No final da década, o RIVED – uma iniciativa colabo-rativa regional envolvendo Brasil, Peru e Venezuela – buscou explorar as potencialidades no desen-volvimento de software educativo de universidades da região para elaborar “objetos educacionais” que pudessem ser utilizados pelos diversos países, com adaptações às exigências curriculares espe-cíficas. A iniciativa resultou em um Banco Internacional de Objetos Educacionais, disponibilizado no portal do Ministério da Educação do Brasil.2
Os resultados dessas iniciativas são visíveis na base de computadores instalados nas escolas (algu-mas vezes sem recursos para manutenção e atualização dos equipamentos). Como adverte Valdivia (2008), em alguns países, as políticas são muito recentes e resultaram em pouco mais do que um sítio com conteúdos educativos, com uma baixa cobertura de escolas conectadas e professores capacitados. Mas existem outros cujas políticas são executadas sustentavelmente há décadas, a cobertura é alta, os portais educativos dispõem de acervo relevante e existe processo sistemáti-co de capacitação em serviço. Em alguns, começa-se a avançar para uma nova geração de políti-cas explorando os avanços da conexão de banda larga e sem fio. O México desenvolve o projeto Enciclomedia,3 o Chile fez planos de reduzir a taxa de alunos por computador de trinta para dez até o final da década, e a Argentina, o Brasil e o Uruguai participam do projeto One Laptop per Child (Um laptop por criança). A Red Latinoamericana de Portales Educativos foi lançada em 2004, criando a possibilidade de enriquecimento de conteúdo pelo compartilhamento de informações.
Observada de um ponto de vista tecnológico-educativo, a informatização das escolas na América Latina é sintetizada por Valdivia (2008) como seguindo pelos menos três modelos: o laboratório de informática, as redes de escolas e o computador dentro da sala de aula.
O laboratório de informática é o modelo mais difundido e criticado. é uma solução conveniente em termos de flexibilidade e custos para as escolas, mas é também capaz de produzir efeitos colaterais indesejáveis. Entre os maiores estão a intimidação do professor, a separação das “aulas de informá-tica” do restante do processo de ensino/aprendizagem e do docente do “professor de informática educativa” ou do técnico de informática responsável pelo laboratório. Os laboratórios de informáti-ca são mais utilizados por professores e alunos fora do horário das aulas, para a realização de traba-lhos, pesquisas ou outras atividades – como correio eletrônico, jogos e navegação na Internet. Um ponto positivo é que eles também são utilizados para o acesso à Internet por membros da comuni-dade, usualmente em fins de semana.
As redes de escolas promovem o uso da Internet como base para a promoção do intercâmbio de projetos e experiências e a colaboração entre escolas participantes. Elas ampliam as oportunida-des de pesquisa e conhecimento de professores e alunos ao criarem as bases para o trabalho coo-perativo e a troca de experiências no dia a dia da sala de aula. Alguns exemplos de redes escolares
2 Os objetos estão apresentados por nível educacional (educação infantil, ensino fundamental, ensino médio, educação pro-fissional e educação superior) em http://objetoseducacionais2.mec.gov.br/.
3 A Enciclomedia é uma iniciativa que integra várias mídias em uma base de dados especial para utilização por alunos e pro-fessores na sala de aula. Por meio de um computador, professores e alunos podem ter, na sala de aula e de forma digitaliza-da, o plano e o programa de estudos, livros para o professor, avanços programáticos, notas de cursos e oficinas para docen-tes, livros-texto das diferentes matérias, atlas geográfico do México e universal, etc. Cada aula com a Enciclomedia é uma oportunidade de ter acesso a imagens de cinema, teatro, museus, bibliotecas, zonas arqueológicas, jogos interativos e livros. Disponível em: http://www.enciclomedia.edu.mx.

2010 Pesquisa TIC EducaçãoARTIGOS 47
PO
RTu
Gu
ÊS
na América Latina são a RedEscolar (México), a Red Telemática Educativa (Costa Rica), a Red Telar (Argentina) e a Conexiones (Colômbia).
No terceiro modelo, os professores organizam as atividades de ensino com base em trabalho indivi-dual ou de grupo apoiado em recursos digitais, mas, à diferença do primeiro modelo, não se requer um espaço especial fora da sala de aula. Esse modelo desenvolve-se num contexto de redução do preço de computadores portáteis e da difusão de redes sem fio (ou wireless). Um carrinho com os computadores portáteis se desloca para a sala que os solicita, e, em alguns casos, esses recursos são complementados por lousa eletrônica ou projetor que mostram a tela do computador do professor para toda a classe. Uma variante desse modelo – ou o alvorecer de um novo modelo – são as expe-riências de uso individual de computadores pelos alunos, dentro ou fora da sala de aula, conecta-dos à rede por modo wireless, e que envolvem adaptações da prática escolar a esse novo cenário. Nessa variante, inscrevem-se as propostas One Laptop per Child, que estão em desenvolvimento na Argentina, no Brasil e no Uruguai.
Os resultados das políticas de TIC nas escolas são difíceis de avaliar, já que há falta de metodologia, indicadores específicos e dados sistemáticos e confiáveis. Como aponta Valdivia (2008), o resulta-do mais ansiado – significativos impactos na aprendizagem – não está devidamente documentado, e há consenso entre analistas sobre a dificuldade de se observarem resultados acadêmicos consis-tentes em diversas matérias do currículo. O que a evidência acumulada permite ver são os resulta-dos positivos sobre a motivação dos estudantes. Emerge dos estudos a noção de que os resultados na aprendizagem estão fortemente condicionados pelas características da escola, sua liderança e seus docentes, características dos alunos e do acesso às TIC na escola e nos domicílios. Mas, entre todos, os professores são os fatores-chave.
é oportuno referir às esperanças depositadas nas TIC como elemento provocador de mudanças na escola e na educação. Como apontam Peres e hilbert (2009, p. 239), nos anos 1980 supunha-se que os computadores atuariam como uma semente da mudança e da inovação no ensino e apren-dizagem. Na década de 1990, acreditou-se no papel das TIC como catalisadoras do processo de mudança e inovação da educação. Após duas décadas de esperanças e frustrações, o determinismo tecnológico que as fundamentava passa, gradualmente, a ser substituído, nesse início de novo sécu-lo, por uma visão mais equilibrada, que considera as TIC ferramentas úteis para se atingirem metas preestabelecidas. Caminha-se para um consenso de que o impacto das tecnologias não depende simplesmente de se ter acesso a elas, mas sim de como elas são utilizadas pelos estudantes.
ComENTÁRIoS FINAIS
Entre os pontos pendentes na reforma da educação em que se envolveram os países da América Latina, a reforma da formação inicial docente e os processos de seu desenvolvimento profissional estão entre os mais urgentes. há consenso entre os analistas de que pouco se poderá conseguir com a reforma da educação sem um consistente e decisivo cuidado com esses pontos. Assim, tanto para o exercício docente quanto para o desenvolvimento profissional do professor, é indispensável um satisfatório nível de utilização de novas ferramentas tecnológicas para a produtividade, a pesquisa e o compartilhamento de soluções.

Pesquisa TIC Educação 2010ARTIGOS 48
PO
RTu
Gu
ÊS
Infelizmente, muito do debate sobre o tema decorre menos de diferenças de opinião sobre os even-tuais resultados educacionais das tecnologias e mais da resistência dos que temem inovações ou se recusam a ver avanços alcançados desde a época em que as escolas recebiam equipamentos para deixá-los entregues à poeira. Outros ainda creem que as TIC substituirão os professores, que, por-tanto, não resistirão ao desaparecimento de seus ofícios. Os argumentos que combatem essas visões negativas são abundantes, e não podemos adiantar aqui nada de novo. O que importa mencionar é que a situação dos países da América Latina exige de seus docentes da educação básica (primária e secundária) atualização constante e preparação para tornar melhores e mais proveitosos os proces-sos de ensino e aprendizagem. Onde as TIC estiverem disponíveis, melhor será que os docentes este-jam em condições de integrá-las ao ensino. Onde não existirem, melhor será que os docentes sejam preparados para incorporá-las quando chegarem e, ainda, para utilizar o que estiver disponível em benefício de seus alunos.
Como os docentes não estão preparados para um melhor aproveitamento curricular das TIC, as escolas públicas cumprem principalmente um papel de redução do hiato digital, oferecendo a oportunidade de alunos – e comunidades circundantes à escola – se familiarizarem com as novas tecnologias. Esse é um resultado positivo, mas pobre do ponto de vista educacional. As TIC na escola podem e devem ser um apoio útil para o ensino e a aprendizagem, desenvolvendo o racio-cínio, apresentando variedades de fontes de informação, facilitando o desenvolvimento do pensa-mento abstrato por meio de simulações e modelos e estimulando a troca de informação no traba-lho colaborativo.
O desenvolvimento de competências em TIC na formação inicial de docentes é muito limitado nos países da região, e, quando existe, atinge níveis mais básicos, não chegando a preparar os futuros docentes para a incorporação dessas tecnologias ao ensino e à aprendizagem.
Como as TIC se desenvolveram fora da área de educação, a questão sobre o seu uso pelos profes-sores resultou da pressão que seu desenvolvimento realizou sobre a escola e possíveis práticas de ensino/aprendizagem aliadas a décadas de pesquisa e desenvolvimento no campo da educação, mas longe das escolas de formação de docentes. é preciso que a formação inicial docente em TIC deixe de ser responsabilidade do professor de informática, no laboratório de informática, para tor-nar-se tarefa de todos os formadores e da instituição formadora como um todo. Somente dessa for-ma os futuros docentes serão capazes de ultrapassar o nível técnico propriamente dito e integrar aspectos técnicos e pedagógicos no desenvolvimento do currículo com seus futuros alunos.
As instituições formadoras, bem como aquelas responsáveis por avaliação e certificação, ganharão muito com a definição das competências em TIC consideradas desejáveis para os futuros docentes. há inúmeras propostas que definem padrões de competência para formação continuada e forma-ção inicial, entendendo-as como elementos de um itinerário único de desenvolvimento de compe-tências docentes.
REFERêNCIAS BIBLIoGRÁFICAS
BARRIOS, Óscar. hacia un nuevo enfoque de la formación inicial. In: ARéVOLO, Isabel Flores (org.). ¿cómo estamos formando a los maestros en América latina?. Encontro internacional “El desarrollo profesional de los docentes en América Latina”, Lima, novembro de 2003. Lima: Proeduca GTz, OREALC/Unesco Santiago, 2004.

2010 Pesquisa TIC EducaçãoARTIGOS 49
PO
RTu
Gu
ÊS
BASTOS, Maria Inês. o desenvolvimento de competências em “tic para a educação” na formação de docentes na América latina. Brasília: Unesco, 2010.
FABARA, Eduardo. Colombia, Ecuador y Venezuela. In: ARéVALO, Isabel Flores (org.). ¿cómo estamos for-mando a los maestros en América latina?. Encontro internacional “El desarrollo profesional de los docentes en América Latina”, Lima, novembro de 2003. Lima: Proeduca GTz, OREALC/Unesco Santiago, 2004.
GATTI, Bernardete Angelina; SÁ BARRETO, Elba Siqueira. Professores do Brasil: impasses e desafios. Brasília: Unesco, 2009.
PERES, Wilson; hILBERT, Martin (orgs.). la sociedad de la información en América latina y el caribe: desarrollo de las tecnologías y tecnologías para el desarrollo, Santiago: Cepal, 2009.
RODRÍGUEz MéNDEz, jaime; SILVA QUIROz, juan. El desarrollo profesional docente en informática educati-va en Chile. In: ENLACES; OREALC/UNESCO. estándares tic para la Formación inicial docente: una Propuesta en el contexto chileno. Santiago: Orealc / Unesco, 2008.
SUNKEL, Guillermo. las tecnologías de la información y comunicación (tic) en la educación en América latina: una exploración de indicadores. Serie Políticas Sociales 126. Santiago: Cepal, División de Desarrollo Social, 2006.
VALDIVIA, Ignacio jara. las políticas de tecnología para escuelas en América latina y el mundo: visiones y lec-ciones. Santiago: ONU, 2008.

2010 Pesquisa TIC EducaçãoARTIGOS 51
PO
RTu
Gu
ÊSNATIvoS dIGITAIS: A NUvEm doS “SEm FIo”
Rogério da Costa1
INTELIGêNCIA CoLETIvA: WIKIPédIA E YoUTUBE
Quando observamos com cuidado os eventos que marcaram a evolução da Internet, sem dúvida uma das tendências que mais se afirmaram foi a da inteligência coletiva. Na verdade, o trabalho colaborativo tornou-se um marco da cultura ocidental deste início de século XXI, e sua essência passou a ser a troca de conhecimentos, informação e comunicação. Um dos maiores fenômenos de inteligência coletiva na web é, sem dúvida, a Wikipédia, a proposta de uma grande enciclopédia digital aberta produzida com a colaboração de usuários de todo o mundo. Desde seu lançamento, em 2001, a Wikipédia cresceu e ganhou versões em muitas línguas. hoje, é uma referência que ser-ve a todos aqueles que buscam informações sobre qualquer assunto.
Mas, com o aumento da banda de acesso à Internet, e na esteira do barateamento e da populari-zação dos vídeos digitais, uma verdadeira explosão de publicação de vídeos chegou à web. E o grande promotor e catalisador dessa onda foi o Youtube, uma plataforma criada em 2005 para a publicação de vídeos, aberta a qualquer usuário de Internet. Pouco mais de um ano depois, ele se tornaria o centro de uma revolução nos hábitos dos internautas. O Youtube passou a contar cada vez mais com vídeos de toda a natureza, vídeos produzidos por profissionais ou amadores, pela televisão, por empresas, por veículos oficiais de notícias, vídeos recuperados de arquivos e digita-lizados e, atualmente, vídeos produzidos por jovens de todas as idades. Reunindo propriedades de redes sociais, como o sistema de comunidades, e outras características de televisão on-line, as telas do Youtube passaram a estar presentes em milhares de sites por todo o mundo. E como está muito mais fácil produzir imagens em movimento, cada vez mais o conteúdo do Youtube amplia-se e tor-na-se variado. Trata-se de uma verdadeira enciclopédia universal audiovisual produzida pela inte-ligência coletiva dos internautas.
Mas, se o Youtube representa tanto atualmente para a Internet, fora dela são os celulares que ditam as mais significativas mudanças em nossa cultura. O enxame dos telefones sem-fio propaga-se pelos
1 Professor do Programa de Estudos Pós-Graduados em Comunicação e Semiótica da PUC-SP (linha de pesquisa: Cultura e ambientes midiáticos). Coordenador do Laboratório de Inteligência Coletiva (LInC). Doutor em filosofia pela Universidade de Paris IV-Sorbonne, mestre em filosofia pela USP, engenheiro de sistemas e computação pela UERj.

Pesquisa TIC Educação 2010ARTIGOS 52
PO
RTu
Gu
ÊS
quatro cantos do planeta. Praticamente todo o mundo está coberto por alguma operadora de celu-lar. Atualmente, já são mais de 3 bilhões e meio de aparelhos em uso, e, com o lançamento de uma nova geração de aparelhos móveis, confirmou-se de vez aquilo que em 2002 era apenas uma ten-dência: a web está se prolongando nos celulares, e vice-versa. Iniciativas que se apoiam na sinergia entre Internet e celular começam a proliferar, e o enxame de imagens do Youtube já está ao alcan-ce das mãos de todos.
REdES SoCIAIS móvEIS
A essência da nova mutação social tem um nome: mobilidade. O essencial agora é poder estar “sempre ligado” em qualquer lugar. Com isso, o que se pode observar é que a revolução real na computação sem fio não é apenas comercial ou tecnológica, mas também social. Conectadas a todo momento e em qualquer lugar, as pessoas podem se comunicar e cooperar de novas maneiras. hoje, em qualquer canto do mundo, os serviços de dados para dispositivos móveis tornaram-se uma plataforma importante não apenas para receber ou enviar conteúdos em áudio e vídeo, mas sobre-tudo para a interação de grupos. À comunicação por voz e texto, que já nos era familiar no início dos anos 2000, vem se juntar o envio de imagens e vídeos como parte habitual das trocas de mensa-gens entre indivíduos e grupos de usuários de aparelhos portáteis. E não podemos esquecer os jogos para multiusuários via celulares, algo que também vem se notabilizando entre usuários no Brasil.
A revolução da mobilidade já havia sido anunciada por howard Rheingold (2002). Como um pri-meiro aspecto, cabe lembrar que, enquanto o universo dos desktops suscitava questões sobre a pre-cariedade das relações presenciais entre os seres humanos, os dispositivos móveis começaram a propor que o virtual seria um meio poderoso para promover encontros reais. Isso já era um fato em relação aos telefones fixos, que permitiram às pessoas ampliar consideravelmente seus encontros presenciais. hoje, após tantos eventos coletivos, políticos e artísticos disparados pelo uso em rede dos celulares, não há mais dúvidas sobre seu potencial de reorganização da dinâmica dos movi-mentos sociais. Como segundo aspecto, destaca-se a próxima evolução desses aparelhos, que já incorporam os recursos de GPS, possibilitando assim uma gama de usos que associa a comunica-ção com o georeferenciamento. é preciso assinalar, igualmente, que muito em breve não teremos mais a distinção entre celulares convencionais e smartphones. Todos os dispositivos móveis serão inteligentes. Note-se que a ubiquidade proporcionada por esses aparelhos abriu um campo, ain-da sem fronteiras nítidas, de veiculação de informações e entretenimento de toda espécie. Tanto do ponto de vista da urgência (obter informações em qualquer lugar e a qualquer momento) quan-to da perspectiva da ocupação do tempo ocioso (assistir a um filme, jogar em rede ou sozinho), os smartphones apresentam-se como uma tecnologia que reúne várias mídias num só aparelho (tele-fone, Internet, televisão, console de jogos, recursos de desktop). Isso aponta para uma evolução já prevista no final do século XX: a inteligência dos chips deve se disseminar por todos os tipos de apa-relhos a nossa volta, e todos devem muito em breve se interconectar por de redes sem fio.
Com isso, uma das manifestações que mais chamam a atenção atualmente é a emergência de comu-nidades móveis que se apoiam no uso dos portáteis para se articular. Parece difícil pensar numa comunidade virtual móvel de forma similar aos grupos que se formam na Internet. Como será que elas funcionam por meio de aparelhos como celulares, palms e tablets, por exemplo? Será que nos-sas definições de comunidade ainda se aplicam nesses casos?

2010 Pesquisa TIC EducaçãoARTIGOS 53
PO
RTu
Gu
ÊS
As comunidades virtuais que se formam em torno de celulares, palmtops e outros dispositivos sem fio têm funcionado, cada vez mais, como apoio a ações coordenadas de grupos num espaço geográfico. Por isso, pode-se afirmar que a essência dessas comunidades é o movimento, a reu-nião dos grupos em espaços físicos. é conhecido o exemplo de grupos de adolescentes na cidade de helsinque, Finlândia, conectados em seus celulares por todo canto, que combinam numa fra-ção de segundos um encontro num shopping. Eles chegam como enxames! Outro exemplo são os chamados flashmobs, em que grupos se reúnem para um ato político instantâneo e se dispersam em questão de minutos. Mas o exemplo ainda mais famoso é o da deposição do presidente das Filipinas, joseph Estrada, que ocorreu depois que milhares de manifestantes se reuniram em fren-te ao Palácio do Governo para protestar. Eles se mobilizaram via mensagens de texto por celular em menos de uma hora! – e sem nenhuma coordenação central. howard Rheingold nomeou esse fenômeno de smartmobs – grupos inteligentes.
O fato é que essas comunidades servem, literalmente, para muitas pessoas se acharem umas às outras, e se conhecerem em grupo. Isso também é experimentado em raras ocasiões por comunidades que evoluem na Internet. Mas aqui, entre os sem-fio, encontrar-se presencialmente parece ser o que há de mais interessante. Rheingold fala de ativistas que se mobilizam nas ruas e de jovens que se encontram em clubes. há inclusive sites no japão que oferecem um serviço original: criando seu perfil e indican-do um perfil de afinidade, o usuário pode receber um chamado em seu celular no momento em que outra pessoa com o perfil escolhido estiver dentro de um raio de 50 metros. O telefone dos dois toca ao mesmo tempo indicando que há alguém com seu perfil na proximidade. Aqui, parece que um poten-cial de revolução permanente encontra-se nas mãos dos jovens.
Outro exemplo surpreendente é a proposta do “ativista ciborgue” Steve Mann, que propõe o uso dos portáteis como instrumento de contravigilância nos espaços públicos (ver http://genesis.eecg.toronto.edu/). Qualquer pessoa pode perceber que os espaços públicos foram literalmente invadi-dos por câmaras de vídeo que gravam suas imagens ininterruptamente. Mann iniciou um experi-mento em que ele trazia no peito, sobre sua camisa, um domo (como esses que escondem câma-ras nos elevadores) com uma webcam ativada e conectada à Internet por meio de um portátil. Na camisa, os dizeres: “Sorria, você está sendo filmado!”. Ele fez diversas experiências em lojas onde, no momento da compra, os usuários são filmados. Mas Steve também filmava o vendedor. No mes-mo instante, as imagens eram compartilhadas com uma comunidade virtual móvel, que dessa forma funcionava como contravigilância do sistema da loja. Esse exemplo ilustra quanto o ativismo polí-tico pode ser inventivo dispondo dos meios portáteis de comunicação.
Em Nova York, um exemplo também já conhecido é o das magic bikes, bicicletas que carregam hotspots para conexão WiFi, oferecendo acesso aberto à Internet por onde ela passar (ver http://www.magicbike.net/). Essa iniciativa explora uma nova estratégia de oferta de Internet no espaço urbano. As bicicletas wireless conseguem levar conexão à Internet para espaços e comunidades de excluídos. Os protagonistas do projeto afirmam que se trata de um misto de arte pública com t écnico-ativismo, servindo como ponto de rede ad hoc nos lugares e momentos onde ocorrem uma performance artística, eventos culturais, manifestações públicas, ou simplesmente para colocar em rede comunidades vítimas da exclusão digital.
Essas experiências parecem mostrar que já está em curso mais uma revolução de hábitos e costu-mes, que se forja junto a uma geração de jovens e adolescentes que estão bem longe dos desktops. A própria metáfora da rede parece se modificar aqui. O que vemos emergir é uma geração que
Pesquisa TIC Educação 2010ARTIGOS 54
PO
RTu
Gu
ÊS
vi verá imersa na “nuvem de sem-fios”. Em qualquer lugar e a qualquer momento, o que conta é se você está ou não na nuvem.
REdES SoCIAIS E ComUNIdAdES vIRTUAIS dE APRENdIzAGEm
Qual seria o papel das redes sociais nas escolas? Essa pergunta ainda é colocada por inúmeros ges-tores, que mostram preocupação ou insegurança em relação ao uso de ferramentas colaborativas em seus programas pedagógicos. Acontece que o foco das redes sociais e das comunidades virtuais que elas promovem está tanto no conteúdo quanto nas pessoas, tanto no que alguém disse como em quem disse o quê. Afinal são as pessoas que levam consigo as informações sobre os conteúdos ou sobre como se chegar até eles. São elas que incentivam, sugerem, inclinam, influenciam os alu-nos na investigação sobre conteúdos.
Mas, no caso dos alunos, quem são essas pessoas? São os professores, os amigos de classe, os pro-fessores de outra classe indicados por colegas que viram e gostaram de seu curso, os amigos dos amigos, os pais e parentes, os colegas de clube, etc.
Essas pessoas constituem a rede pessoal de cada aluno e, acreditem, elas são a coisa mais interes-sante na vida de cada um, aquilo que mais mobiliza sua atenção voluntária. Essa atenção voluntá-ria é uma espécie de energia preciosa que não podemos desperdiçar; ao contrário, devemos esti-mulá-la, alimentá-la de forma a capitalizá-la para a produção de conhecimento. As redes sociais, formadas com o auxílio da rede de computadores e celulares, é uma das experiências atuais mais consistentes de consolidação, expansão e capitalização das redes pessoais. E as comunidades vir-tuais, que as precederam, já existiam há mais de vinte anos, mas apenas recentemente tornaram-se um fenômeno que chamou a atenção da investigação científica e, também, do mundo da pedago-gia. Esse fenômeno revela que é essencial organizar a possibilidade de relação entre as pessoas, as diversas formas pelas quais elas entrarão em sinergia e, como consequência, transmitirão informa-ções e construirão conhecimentos.
A produção e organização de conteúdos, desse ponto de vista, deveriam depender fundamental-mente da forma como é estabelecida a relação entre as pessoas. As redes sociais organizam de for-ma transversal a comunicação entre usuários, e conseguem fazer os conteúdos circularem. Circular significa estar vivo. Conteúdo organizado que não circula é conteúdo desvitalizado!
O fato é que, de alguma maneira, começamos a perceber que as pessoas desempenham, em boa parte de seu tempo, o papel de índices de informação para outras pessoas, e isso não é diferente no âmbito da escola. Um dos exemplos mais interessantes dessa abordagem foi, sem dúvida, a inicia-tiva do jornal the new york times. Em 1999, o periódico lançou uma comunidade virtual, Abuzz, que funcionava exclusivamente na base de perguntas e respostas. houve um grande planejamento por trás dessa iniciativa, não apenas tecnológico, mas sobretudo de gestão e estímulo à participação das pessoas. O funcionamento era simples: as perguntas eram feitas pelos membros da comunida-de, e o sistema direcionava as questões para aqueles com perfil de interesse mais próximo. As pes-soas interessadas respondiam diretamente por e-mail. Em apenas seis meses, mais de meio milhão de pessoas já participavam da comunidade. Ela se encerrou por volta de 2004, momento em que se consolidava outra iniciativa de partilha de conhecimentos: a Wikipédia.

2010 Pesquisa TIC EducaçãoARTIGOS 55
PO
RTu
Gu
ÊS
Outro movimento interessante foram as ágoras virtuais, sites exclusivamente dedicados a discussão política. Um bom exemplo é o SpeakOut (www.speakout.com), iniciativa apartidária que promo-ve discussões sobre problemas que abrangem desde comunidades locais até questões nacionais. A técnica utilizada pelos promotores no fórum do site é interessante: há sempre uma questão polêmi-ca, que recebe duas considerações opostas (a favor e contra). Os participantes comentam a questão até a exaustão, sendo que o objetivo não é simplesmente encontrar a resposta certa, mas mostrar que bons argumentos podem ser construídos para defender ambas as posições. Trata-se, no fundo, de um exercício profundo de cidadania, pois nesse caso o mais importante não é apenas chegar a uma posição definida, qualquer que seja ela, mas aprender a difícil arte de problematizar, perce-bendo, a partir das muitas argumentações, os muitos pontos de vista que podem ser construídos a partir de um único problema. A favor e contra perdem sua importância ao final, pois percebemos que os problemas são muito mais complexos do que acreditávamos no início.
o dESAFIo doS dISPoSITIvoS móvEIS NA EdUCAÇÃo
é comum os jovens ouvirem de seus professores que devem manter seus telefones celulares desli-gados enquanto estiverem na sala de aula. Afinal celular serve para conversar, para distrair o aluno, não podendo, assim, estar ligado durante as atividades na classe. Depois de anos procurando incor-porar os computadores nas atividades de ensino – e ainda sem se ter exatamente um resultado que possa ser considerado satisfatório –, os professores e educadores se veem diante de um novo desa-fio: os celulares tornaram-se a paixão dos jovens. Recente pesquisa da Universidade de Navarra, Espanha, patrocinada pela Fundação Telefónica, apresenta resultados muito claros em relação ao uso dos celulares por crianças e adolescentes. Nada menos que 82% dos entrevistados afirmaram possuir um telefone celular. Entre as crianças, 45% conseguiram um aparelho como presente.
Caso esse dispositivo servisse apenas para se comunicar – e ainda é assim visto por muitos edu-cadores –, seria difícil imaginar para ele um uso pedagógico interessante. Mas o fato é que esses pequenos aparelhos estão sendo usados para tantas outras coisas, que o difícil é não imaginar mui-tos usos pedagógicos que poderiam ser propostos não apenas em sala de aula, mas sobretudo em atividades extracurriculares.
Assim, fazer fotos e gravar vídeos, enviar e receber arquivos via bluetooth ou praticar jogos educati-vos mereceriam espaço em qualquer atividade educacional. Mas talvez seja mais interessante men-cionar as recentes inovações que em breve devem estar ao alcance de qualquer aparelho. Pesquisas realizadas pelo Mobile Experience Laboratory, do MIT (http://mobile.mit.edu), apontam para uma sinergia cada vez maior entre pessoas, lugares e informações. O aspecto urbano aqui é de grande importância. De fato, as tecnologias de comunicação ainda são vistas como meios que vencem dis-tâncias e, portanto, como meios que fazem a economia (ou abstração) do espaço. O virtual sempre foi denunciado como o “lugar” que afasta as pessoas do convívio, do relacionamento, que mantém os jovens isolados, portanto que nos distancia dos relacionamentos no espaço físico. Pois as recen-tes experiências com dispositivos móveis revelam justamente outras possibilidades, apontando para o sentido oposto dessa preocupação: como integrar as pessoas em seu espaço urbano, fazendo jus-tamente uso das tecnologias móveis? Nas pesquisas do Mobile Lab, o importante não é apenas o tipo de projeto realizado, mas o esforço em estabelecer um novo paradigma para as t ecnologias da comunicação: elas podem servir para que as pessoas façam uso inteligente do es paço que habitam,

Pesquisa TIC Educação 2010ARTIGOS 56
PO
RTu
Gu
ÊS
que possam integrar seus hábitos e atitudes num coletivo inteligente, pensando a favor do lugar em que vivem.
As redes sociais, tão famosas entre os jovens, são utilizadas para que as pessoas se organizem, podendo, por exemplo, compartilhar seus automóveis para ir ao trabalho. São também utilizadas para que, com o uso do celular, se possa consultar os amigos a respeito de uma tarefa que se este-ja realizando. De exemplos que vão da redefinição dos pontos de ônibus, como terminais digitais inteligentes, até o tagueamento de lugares históricos, abre-se um número enorme de possibilidades com o uso dos dispositivos móveis para a educação.
Enquanto nos preocupamos em dar acesso à Internet aos nossos jovens, essas pesquisas apontam para como reinserir os jovens nos problemas do espaço urbano via redes de comunicação.
REFERêNCIAS BIBLIoGRÁFICAS
MANN, S.; NIEDzVIECKI, h. cyborg: digital destiny and human Possibility in the Age of the wearable computer. Toronto: Doubleday Canada, 2001.
RhEINGOLD, h. Smartmobs: the next Social revolution. Cambridge, MA: Perseus, 2002.
SALA, X. B.; ChALEzQUER, C. S. A geração interativa na ibero-América. Madri: Coleção Fundación Telefónica / Ariel, 2008.
2010 Pesquisa TIC EducaçãoARTIGOS 57
PO
RTu
Gu
ÊSo PAPEL dA INFoRmAÇÃo
No dESENvoLvImENTo SoCIAL
Ladislau Dowbor1
“com informações, somos todos iguais.”
(Dando, Favela de Antares, Rio de janeiro)
O grande vetor de transformação da sociedade – o elefante no meio da sala, por assim dizer – é a explosão do ritmo de transformações tecnológicas. houve grandes momentos, sem dúvida: os gre-gos na Antiguidade, a Renascença na Europa e a expansão de conhecimentos científicos na virada do século XIX para o XX – a eletricidade, o telégrafo, o transporte ferroviário, o avião, o automóvel, a teoria da relatividade, e assim por diante.
Nada se compara, no entanto, à fantástica progressão após a Segunda Guerra Mundial: do muito amplo, com o telescópio em órbita e o homem na Lua, ao muito pequeno, com o DNA e a nano-tecnologia, passando pela química fina, a bioengenharia, os avanços nos meios de transporte e a generalização da educação que hoje atinge quase a totalidade do planeta. O conhecimento tornou--se central no processo de mudança econômica, social, política e cultural. é a sociedade do conhe-cimento em marcha – o conhecimento, sim, mas acompanhado de longe, e com impressionantes atrasos, pela organização política e social.
Dentro desse processo, adquiriu particular importância a revolução potencializadora de todas as pesquisas, resultante das tecnologias de informação e comunicação. Ao passar dos sinais “dese-nhados”, como a letra “a” ou o número “2”, para uma notação digital em 0 e 1, o conjunto do conhecimento humano passou a ser passível de ser anotado em variações de partículas subatômicas e transmitido em ondas eletromagnéticas. Com isso, a dimensão criativa da humanidade adquire papel preponderante: as tecnologias de informação e comunicação se generalizam na mesma era em que o conjunto das atividades econômicas torna-se mais denso em conhecimento. Imagine-se o sequenciamento da dupla hélice da vida sem o computador...
1 Ladislau Dowbor é doutor em ciências econômicas pela Escola Central de Planejamento e Estatística de Varsóvia, profes-sor titular da PUC de São Paulo e consultor de diversas agências das Nações Unidas. é autor de diversos livros e artigos. Seus numerosos trabalhos sobre planejamento econômico e social estão disponíveis, gratuitamente e na íntegra, em regime creative commons, no site http://dowbor.org. e-mail: [email protected].

Pesquisa TIC Educação 2010ARTIGOS 58
PO
RTu
Gu
ÊS
As TIC vêm, dessa maneira, potencializar todo o processo, pois, além de novas tecnologias, cons-tituem um instrumento de multiplicação e disseminação do conhecimento em todas as áreas, uma revolução na revolução. O conhecimento se desmaterializa, passa a banhar o planeta, acessível hoje a partir de um simples telefone celular em qualquer parte, navegando na velocidade da luz. Entramos de forma acelerada na economia da informação.
As tecnologias, permitindo fazer mais com menos esforço, sem dúvida geram possibilidades de progresso. Foi calculado que o homem, ao utilizar eletricidade, o combustível do seu carro e ou-tras fontes, utiliza 156 vezes mais energia do que permite sua massa muscular. Temos poderosas alavancas. Mas dispor de meios mais poderosos, quando os utilizamos de maneira negativa, apenas potencializa a desgraça. hoje podemos fabricar drogas muito baratas, sintetizadas quimicamente, sem precisar depender do ciclo de produção da coca e da papoula, e estamos destruindo centenas de milhões de pessoas. Andar rápido, mas sem saber para onde, constitui um problema maior. E a isto as tecnologias não respondem.
As novas tecnologias permitem gerar sistemas especulativos planetários que elevam artificialmente o preço dos alimentos; formas avançadas de extração de águas subterrâneas que estão levando ao es-gotamento reservas multiseculares de lençóis freáticos; a generalização do automóvel está levando ao colapso urbano; o consumo irresponsável e generalizado dos combustíveis fósseis está levando à maior ameaça planetária, que é a mudança climática; as tecnologias modernas de pesca estão permitindo localizar e liquidar com facilidade a vida nos oceanos; a expansão da monocultura e o desmatamen-to estão gerando a esterilização dos solos e reforçando a mudança climática. Assistimos como que anestesiados e impotentes ao desenrolar deste drama que se acelera, com as suas dimensões positivas – levamos com orgulho o último celular no bolso – e ameaçadoras. O problema não está nas tecnolo-gias, está no seu uso, nos processos pelos quais a humanidade passa a dispor de tecnologias podero-sas, enquanto a capacidade política continua no limbo. Esta disritmia entre os tempos acelerados da t ecnologia e o tempo impressionantemente lento do amadurecimento cultural, social e político gera uma tensão perigosa, constituindo a principal ameaça.
No centro dos dilemas, portanto, está o processo decisório de como se utilizam os novos poten-ciais, quem os controla, quem a eles tem acesso e com que fins. As tecnologias multiplicam-se numa sociedade que herdamos, com os seus trágicos desequilíbrios. Os desequilíbrios manifestam--se em dois eixos articulados: a tragédia ambiental, diretamente ligada ao potencial expandido de destruição do planeta – mas sem a governança correspondente –, e a tragédia social, que resulta dos novos mecanismos de aprofundamento da desigualdade que essas mesmas tecnologias permitem, como, por exemplo, por meio dos sistemas financeiros globalizados.
é importante lembrar que os avanços tecnológicos são fruto de inúmeras iniciativas de pesquisa, dominantemente públicas na área de pesquisa fundamental, dominantemente privadas na área de desenvolvimento e aproveitamento econômico. Trata-se de um processo social generalizado, com uns aproveitando os avanços dos outros, como tão bem analisaram Lawrence Lessig (2008) e Toffler (2006). Mas, se o processo científico em si, com a imagem simpática do inventor em seu laboratório, nos parece boa coisa, a realidade é que poucos cientistas têm qualquer controle sobre o que desenvolveram, pois não é deles que depende se uma nova molécula vai ser utilizada como medicamento ou como agrotóxico, se um coquetel capaz de conter o hIV vai se generalizar no pla-neta ou vai ter seu acesso restringido para assegurar maiores preços, e assim por diante. O uso das tecnologias está nas mãos de corporações, e estas estão nas mãos de especialistas em marketing, finanças e leis. Aos cientistas se recomenda que cuidem dos seus laboratórios.
2010 Pesquisa TIC EducaçãoARTIGOS 59
PO
RTu
Gu
ÊS
Assim, o bem e o mal estão sempre misturados. Desenvolver antibióticos é bom, generalizar seu uso na criação de gado – com o que se contamina a carne que comemos – não é nada bom. Ou melhor, é bom para a empresa que vende os antibióticos e para pecuaristas de poucos escrúpulos, mas ruim em termos de impacto final para a população. Arrancar trilhos de transporte coletivo urbano eletrificado para vender mais automóveis parece absurdo, mas a culpa não é dos técnicos que desenvolvem motores: está no processo decisório, no poder corporativo. Este evidentemente centra, de forma prioritária, as suas decisões no interesse próprio – administradores e acionistas. Só irão utilizar e ampliar o uso de tecnologias mais limpas, como motores de melhor desempenho, híbridos ou elétricos, se houver pressão externa. E isso é contido pelo mecanismo de financiamen-to de campanhas políticas, que assegura o acesso ao poder aos que irão defender seus interesses. Torna-se profundo o divórcio entre a motivação da pesquisa – a excitante dinâmica criativa – e a dos que decidem o uso dos seus resultados – o lucro a qualquer custo.
O que sugerimos aqui é que o aproveitamento da fantástica revolução tecnológica que vivemos, no sentido dos interesses prosaicos da humanidade, depende da democratização dos processos econômicos, tese que desenvolvemos mais amplamente no ensaio democracia econômica, em particular no capítulo “A economia do conhecimento”. Somente com a apropriação pela sociedade de informações sobre os processos decisórios na corporação e nos governos, a pressão passa a gerar outras dinâmicas, mais condizentes com os interesses gerais.
Antes de tudo, é essencial entender que a economia do conhecimento desloca radicalmente o con-ceito de escassez, base da ciência econômica herdada do século passado. Um relógio que entrego a outra pessoa deixa de me pertencer. Uma ideia que passo para outra pessoa continua comigo. No jargão econômico, o conhecimento é um bem não rival – o seu consumo não reduz o estoque. hoje, o essencial do valor de grande parte dos bens depende muito menos dos insumos materiais e da mão de obra física; o essencial é o conhecimento incorporado. Assim, em termos macroeconô-micos, o conhecimento gera riqueza quando se multiplica e se dissemina, não quando é trancado.
O conhecimento, uma vez gerado, pode ser multiplicado indefinidamente, e sua circulação é vir-tualmente gratuita, permitindo o acesso segundo os interesses do usuário. Representa um poderoso fator de democratização. Mas as corporações, na visão microeconômica, buscam não o enriqueci-mento social, mas o valor que pode ser auferido para elas, e o caminho que aparece naturalmente é monopolizar o conhecimento, gerando portanto escassez. Dificultam artificialmente o acesso, a fim de assegurar seus lucros. Gera-se a economia do pedágio.
Ignacy Sachs (2010) exprime isso de maneira simples e direta: no século passado, o poder eco-nômico passava pelo controle privado dos bens de produção, das máquinas, das fábricas; hoje, o poder resulta do controle da informação, do conhecimento. Onde antes havia a portaria, hoje há as proibições de uso, os copyrights, as patentes, os royalties. A luta da corporação atualmente se concentra na restrição do acesso, para forçar o pagamento do pedágio. A imagem publicitária é sempre a da defesa do pobre autor, simpática e legítima, mas na realidade trata-se de lucro dos grandes intermediários. Os direitos quase sempre pertencem aos que produzem o suporte material, não aos criadores.
Os resultados são práticos: nas universidades de ponta do país, proíbe-se o acesso a conteúdo de livros, podendo-se apenas xerocar um capítulo. Segundo pesquisas do GPOPAI, 30% dos livros recomendados estão esgotados, mas não podem ser copiados. Assim, de um lado se gastam imen-sos recursos para educar a nova geração, por outro torna-se difícil o acesso ao conhecimento.

Pesquisa TIC Educação 2010ARTIGOS 60
PO
RTu
Gu
ÊS
Naturalmente, a empresa que editou o livro e o autor que o escreveu buscam remuneração – e é legítimo. Mas por que travar o acesso, ou torná-lo tão caro que se torna acessível apenas aos mais ricos? O MIT, nos Estados Unidos, criou o conceito de opencourseware, curso aberto, tal como o Linux criou a fonte aberta.2 Todos os trabalhos de todos os professores são disponibilizados on-line gratuitamente, a partir do portal www.ocw.mit.edu. Em poucos anos, mais de 50 milhões de textos científicos foram baixados no planeta só do MIT. Imagine-se a contribuição para o conhecimento, para o avanço científico geral.
Como isso se compara com o interesse da editora e do autor? é legítima sua remuneração, mas não impedir o acesso e a comunicação científica sem fins lucrativos. E a pessoa que gostar de um livro poderá comprá-lo. Inclusive livros bons cujo uso se generaliza por meio do fácil acesso, terminam sendo também mais comprados. Diziam que a televisão ia acabar com o cinema. Era uma boba-gem, mas sobretudo seria absurdo proibir a televisão pelo risco de prejudicar o cinema.
O que acontece é que, com a generalização do conhecimento como fator principal de produção de riqueza, com a facilidade da sua circulação planetária on-line e praticamente sem custos e com seu caráter de bem não rival, as regras do jogo precisam ser adaptadas. A maioria das pessoas i gnora que os advogados corporativos foram estendendo o copyright até ele travar o livre acesso por setenta anos depois da morte do autor. Patentes de vinte anos sobre medicamentos, numa era de transformações extremamente aceleradas, não têm sentido. Os livros de Paulo Freire têm seu livre acesso travado até 2050, ele que tanto batalhou pela democratização do conhecimento.
O absurdo gerado está levando ao surgimento de inúmeras alternativas que buscam contornar os que tentam travar o acesso ao conhecimento e o pleno uso das novas tecnologias. O livro wiki-nomics mostra como numerosas empresas que pararam de proibir e buscam, ao contrário, a cola-boração em massa dos clientes, abrindo suas informações e solicitando contribuições, estão sim-plesmente se dando melhor. O estudo Apropriação indébita mostra como funcionam os pedágios corporativos sobre os conhecimentos, e como eles dificultam o progresso para gerar grandes lucros sem as contribuições produtivas correspondentes. cognitive Surplus [Excedente cognitivo] mostra que a humanidade dispõe de um imenso capital de conhecimentos armazenado na cabeça das pessoas, tragicamente subutilizado: quando a wikipédia faz a sua aposta, e gera a impressionante fonte planetária de informações, está simplesmente disponibilizando para todos a possibilidade de contribuir com o conhecimento de que dispõem, que estaria parado ou disponível apenas para si. Interessante também é o fato de inúmeras pessoas contribuírem financeiramente para a wikipédia, sem obrigação, pagando o que acham que valem os serviços recebidos. O detalhamento dessas questões pode ser encontrado no nosso artigo mais amplo, da propriedade intelectual à sociedade do conhecimento.
O ser humano é dotado de inteligência, e ser rico não significa ser mais inteligente. Numa era em que o desenvolvimento econômico depende cada vez mais do conhecimento incorporado aos processos produtivos, liberar o acesso aos conhecimentos por parte dos dois terços esmagados da humanidade pode constituir um eixo privilegiado para se enfrentar simultaneamente a desigual-dade e, por meio de processos produtivos mais inteligentes, os desafios ambientais. Na realidade, deveríamos não apenas não dificultar este acesso: deveríamos fomentá-lo.
2 Mais informações em http://web.mit.edu/newsoffice/2009/open-access-0320.html.

2010 Pesquisa TIC EducaçãoARTIGOS 61
PO
RTu
Gu
ÊS
Uma ilustração simples mas significativa nos vem da experiência da favela de Antares, no Rio de janeiro, premiada pelo Trip Transformadores.3 Ao organizar o acesso à banda larga na favela, Dan-do e seus companheiros descobriram, como diz Claudio Prado, que pode não haver emprego, mas trabalho sempre há. E, com o acesso à Internet, a favela passou a prestar os mais variados serviços, como design, produção cultural, apoio informático on-line, entre outros. Na era da economia “ima-terial”, do “intangível”, não é preciso ter acesso à fábrica, basta ter acesso ao sistema planetário de produção de conhecimento. “Com informações, somos todos iguais”, declarou Dando, com simplicidade, ao receber o prêmio.
Em escala mundial, uma avaliação recente das dinâmicas de aplicação de tecnologias ao mundo rural levou a um excelente estudo (IAASTD, 2008). A visão geral é que as mesmas tecnologias que vêm sendo aplicadas para a monocultura (mais agrotóxicos), baixo emprego (duzentos hectares para um emprego na monocultura da soja), esgotamento de reservas de água e apropriação do produto pelo seleto grupo de multinacionais (Cargill, Monsanto, Bunge, etc.) podem assegurar uma dinâmica superior, com cultivos consorciados, sistemas inteligentes de irrigação, tecnologias de primeira transformação no nível do pequeno produtor, policultura que aumenta o emprego, locali-zação da produção mais próxima do consumidor final, e assim por diante.
Na área educacional, como já mencionado, mais do que progresso, trata-se de uma revolução: a educação tende a ser vista menos como instituição no sentido de “instalações”, onde crianças e jovens passam parte da sua vida – liberando-nos assim para o trabalho profissional –, e mais como um sistema permanente de gestão do conhecimento. Iniciativas como “Minha Escola Meu Lugar” em Santa Catarina, ou os “Arranjos Educativos Locais” no Paraná, ou ainda a referência que hoje é a iniciativa “Piraí Digital”, no estado do Rio de janeiro, constituem as “andorinhas” de uma trans-formação profunda em curso.
Os exemplos de sucesso são inúmeros. Os ataques também: basta ligar o rádio para ouvir sisudas declarações de oligopólios nos chamando a sermos éticos. Vêm com sérios argumentos, em que a ética é virada de cabeça para baixo. Em frente a numerosos cinemas, universidades ou pontos de aglomeração cultural, descobrimos na calçada, vendidos clandestinamente, filmes de Antonioni, Kurosawa, Fellini, jean Renoir, centenas dos gigantes que criaram a riqueza cultural do mundo do cinema. E, vendidos ou alugados em lugares legais e cheios de propaganda, encontramos essencial-mente um monte de lixo, com pérolas raras e escondidas. é interessante ver que a cultura se tornou clandestina, e a indústria cultural domina. Se não fossem os homens da rua, não haveria como trazer para casa as joias da criatividade humana que passo para os meus filhos. Onde está a lógica?
O argumento da ética é falso, como é falso o argumento do direito, da lei. O jurista americano j ames Boyle explicita que uma ideia não constitui propriedade natural, como o seria meu relógio (que posso usar ou não). As próprias patentes ou copyrights foram criados para proteger um produ-tor de outro produtor comercial, não para dificultar o acesso ao usuário. Tanto não é direito natural, que foi fixado para vigorar por tempo determinado e, depois, cair em uso comum. Só que, de tanto estender o “tempo determinado”, os assessores jurídicos das corporações tornaram o acesso virtual-mente inútil, ultrapassado quando liberado.
3 Ver vídeo em http://bit.ly/fuKOVh.

Pesquisa TIC Educação 2010ARTIGOS 62
PO
RTu
Gu
ÊS
é importante lembrar também que o conceito de propriedade intelectual foi desenhado não por-que a ideia deva ser apropriada, mas porque se pensou que um tempo de apropriação exclusiva estimularia as pessoas a desenvolver mais ideias. Ou seja, se o sistema está travando o acesso ao conhecimento novo, na realidade está-se gerando o efeito inverso do pretendido. Aqui também temos misturados o bem e o mal: é bom assegurar um curto tempo de direitos exclusivos, para es-timular o criador, mas é ruim ver esse tempo ser estendido durante as últimas décadas até o ponto de travar o progresso.
À plateia que assistia a sua conferência em harvard, Lessig perguntou quantos adotavam, para acessar conhecimento on-line, práticas ilegais: a contagem mostrou mais de 70%. O progresso, conclui Lessig, resulta de um processo permanente de articulação inovadora de avanços anteriores, uns copiando aos outros, mas acrescentando o seu (Lessig, 2008). No plano internacional, Chang mostrou de maneira magistral como os países hoje desenvolvidos copiaram uns dos outros, inclusi-ve com amplos sistemas de espionagem econômica que até hoje perduram, mas decidiram, a partir de certo momento, travar o acesso aos países pobres. chutando a escada (2003) trata justamente da história de países que se apropriaram dos conhecimentos de outros, mas que agora querem travar o processo, e “puxam a escada”. E falam naturalmente de ética, mesmo quando tentam patentear um arroz indiano ou o cupuaçu brasileiro.
O verdadeiro eixo de ação está na liberação do acesso e, em particular, na generalização do acesso à banda larga. Poucas pessoas sabem que o tão cômodo “www”, que nos permite acessar conheci-mento em todo o planeta, foi desenvolvido por Tim Berners-Lee, no centro de pesquisa nuclear em Genebra (CERN), e que Tim se recusou a patentear o sistema, pois se trata de um aporte à humani-dade, hoje administrado por um consórcio sem fins lucrativos. Toda a humanidade lucra, inclusive Google, Microsoft. Todos navegam alegremente nos “www”, que nos permitem intercambiar ideias gratuitamente ao redor do planeta. Propostas de colocar pedágios aqui também não faltaram.
Uma comparação ajuda a materializar a ideia: ninguém paga para andar na rua. No entanto a rua tem custos, e pagamos esses custos por meio dos impostos. Não seria nada prático encher as ruas de pedágios, ainda que comecemos a sentir isso em qualquer estacionamento ou estrada. O fato de todos poderem transitar livremente pelas ruas e avenidas é simplesmente mais prático. E a conta fecha, pois o livre trânsito permite que nas ruas se tornem economicamente viáveis comércios, postos de gasolina, etc., que pagam impostos, o que, por sua vez, paga a manutenção das ruas. Nada é de graça. Mas a Internet, ao viajar em ondas eletromagnéticas, não precisa construir ruas e calçadas – as ondas são públicas e gratuitas, dom da natureza. é natural que o conhecimento nelas circule, no planeta todo, gratuitamente como serviço público. Em compensação, a livre circulação e o livre acesso permitirão o surgimento de inúmeras aplicações econômicas, as quais, sim, pode-rão ser remuneradas.
Toda essa área está dominada por fundamentalismos ideológicos, apelos hipócritas à ética, perse-guições inúteis. Os jovens sofrem em particular: não têm dinheiro para pagar os pedágios exigidos pelas corporações. Na realidade, jovens têm pouco dinheiro e muito tempo: usarão seu tempo, legitimamente, para ter o acesso ao conhecimento de qualquer maneira, coisa que na escola seria até considerado obrigação, e não pirataria. Em contraste, como nos explica Alperovitz, o adulto tem dinheiro e pouco tempo: para eles, basta desenvolver produtos diferenciados, estes, sim, cobrados.
O objetivo central que devemos ter em mente é o que vimos acima: assegurar que o conhecimento se generalize, pois a sociedade no conjunto se tornará mais próspera, os produtores poderão ter
2010 Pesquisa TIC EducaçãoARTIGOS 63
PO
RTu
Gu
ÊS
mais acesso a tecnologias limpas, protegendo o planeta, e as contribuições à economia do conheci-mento poderão se generalizar até nas sociedades mais pobres, reduzindo a dramática desigualdade que hoje atinge quatro bilhões de excluídos econômicos, os que o Banco Mundial qualifica delica-damente de pessoas que “não têm acesso aos benefícios da globalização”.
Estando claros os objetivos, o caminho que temos pela frente é deixar os ódios e ideologias de lado e buscar o que funciona. As regras do jogo que estamos utilizando, de reduzir tudo à propriedade privada, constituem uma aplicação desajeitada de regras que foram desenvolvidas para uma eco-nomia de bens físicos – no século XX – a uma nova sociedade que nasce no século XXI. Travar o progresso, ou monopolizar a apropriação dos avanços, simplesmente não funciona.
REFERêNCIAS BIBLIoGRÁFICAS
ALPEROVITz, Gar; DALY, Lew. Apropriação indébita: como os ricos estão se apropriando da nossa herança comum. São Paulo: Editora Senac São Paulo, 2010.
ANDERSON, Chris. grátis, o futuro dos preços. São Paulo: Campus, 2010.
BOYLE, james. the Public domain: enclosing the commons of the mind. New haven e Londres: Yale University Press, 2008.
CASTELLS, Manuel. the rise of the network Society. Oxford: Blackwell, 1996.
CEPAL. A hora da igualdade. Brasília, 2010. Disponível em: http://bit.ly/bqwYAh. Documento completo em espanhol: la hora de la igualdad: brechas por cerrar, caminos por abrir. Santiago, maio de 2010. Disponível em: http://bit.ly/bA9yrl.
ChANG, ha-joon. chutando a escada: a estratégia do desenvolvimento em perspectiva histórica. São Paulo: Editora da Unesp, 2003.
DAVIDSON, Cathy N.; GOLDBERG, David. the Future of learning institutions in the digital Age. Boston: MIT Press, 2009.
DOWBOR, Ladislau. da propriedade intelectual à sociedade do conhecimento. 2009. Disponível em: http://bit.ly/ 8nlK61.
. democracia econômica: alternativas de gestão social. Disponível em http://dowbor.org/10demoecovozes3.doc. Atualizado em dezembro de 2010.
GPOPAI. direitos autorais e livros didáticos. Seminário “Direitos autorais e educação”. Ação Educativa, 24.3.2009. Disponível em http://www.gpopai.usp.br/wiki/images/5/53/Seminario_ae.pdf.
IAASTD – Evaluación Internacional del Papel del Conocimiento, la Ciencia y la Tecnología en el Desarrollo Agrícola. resumen del informe de síntesis. Disponível em http://dowbor.org/ar/08iaastdesp.pdf.
LESSIG, Lawrence. the Future of ideas: the Fate of the commons in an connected world. Nova York: Random house, 2001.
. remix: making Art and commerce thrive in the hybrid economy. Nova York: Penguin, 2008.
ORTELLADO, Pablo. A educação e os livros didáticos. Universidade de São Paulo, 2009. Disponível em: http://www.gpopai.usp.br/wiki/images/5/53/Seminario_ae.pdf.
RIFKIN, jeremy. A era do acesso. São Paulo: Makron Books, 2001.
SAChS, Ignacy; LOPES, Carlos; DOWBOR, Ladislau. riscos e oportunidades em tempos de mudanças. Fortaleza e São Paulo: BNB/IPF, 2010. Disponível em: http://dowbor.org/riscos_e_oportunidades.pdf.

Pesquisa TIC Educação 2010ARTIGOS 64
PO
RTu
Gu
ÊS
ShIRKY, Clay. cognitive Surplus. Nova York: Penguin, 2010.
TAPSCOTT, Don; WILLIAMS, Anthony. wikinomics: como a colaboração em massa pode mudar o seu negócio. Rio de janeiro: Nova Fronteira, 2007.
TOFFLER, Alvin; TOFFLER, heidi. revolutionary wealth. Nova York: Doubleday, 2006.
2010 Pesquisa TIC EducaçãoARTIGOS 65
PO
RTu
Gu
ÊSEdUCAÇÃo E dESENvoLvImENTo:
modoS dE REGULAÇÃo doS SISTEmAS dE ENSINo
Marisa Duarte1
Este artigo expõe os resultados dos primeiros estudos efetuados no âmbito do projeto apresenta-do para a cátedra Anísio Teixeira, do programa “Cátedras IPEA/CAPES para o Desenvolvimento”. A investigação em curso objetiva interrogar a sociologia da educação no Brasil a partir do binômio “educação e desenvolvimento”, mas tem por pressupostos as novas formas de sociabilidade forja-das ao longo de vinte anos de eleições regulares e de reinserção do país na economia capitalista mundializada. Não se trata de um texto homogêneo e coerente ou de uma teoria harmoniosa dessa relação, mas a questão que o orienta interroga a fragilidade dos sistemas de regulações que contri-buem na governação de novos atores presentes no sistema educacional brasileiro.
O estudo tem uma dupla origem. Por um lado, é uma interpretação livre do artigo de Ball (2008) para a compreensão das mudanças em curso no sistema educacional brasileiro. Para esse pesqui-sador, em tempos diferenciados, um redirecionamento das perspectivas de análise sociológica – concomitantemente ao desenvolvimento de um conjunto de conhecimentos especializados sobre a formação de docentes e administração educacional – contribuiu para criar “condições de possibili-dade” favoráveis à implantação de novos dispositivos de governação sistêmicos. Se a inspiração em Foucault é central no argumento construído a partir de Ball (2008), em que mudanças sistêmicas promovem o desenvolvimento de novas formas de governação, para a apreensão das tensões e con-flitos presentes no processo de desenvolvimento uma segunda perspectiva analítica é incorporada. O recurso ao conceito de esfera pública (habermas, 1984) possibilita articular a tensão presente no sistema educacional entre a emergência de novos sujeitos no cenário social brasileiro – com novas perspectivas sobre educação escolar – e aquelas que a reconhecem e reivindicam como direito a ser assegurado pela prestação estatal dos serviços.
1 Professora adjunta da Faculdade de Educação da UFMG. Bolsista de pesquisa do IPEA, Cátedra Anísio Teixeira, pesquisa na área de políticas públicas em educação do Programa de Pós-Graduação em Educação da Faculdade de Educação da UFMG.

Pesquisa TIC Educação 2010ARTIGOS 66
PO
RTu
Gu
ÊS
EdUCAÇÃo E dESENvoLvImENTo: o LUGAR do PLANEjAmENTo ESTATAL
Na sociologia da educação brasileira, a associação entre educação e desenvolvimento social rela-ciona, inicialmente, o aumento do número de instituições, cursos, estudantes e profissionais com o crescimento do sistema educacional. Ampliar a oferta e o atendimento consistiria em desenvol-vimento da educação e, por consequência, “do social”. Este termo seria a expressão de melho-rias na distribuição de renda, patamares de escolarização da população, de saneamento bási-co, em contraposição ao econômico, aferido por indicadores de produção de bens, serviços, etc. Desenvolvimento social importava em crescimento e diferenciação do sistema educacional, vistos teleologicamente como modernização societária. Nessa perspectiva, o sistema educacional cum-priria uma função de desenvolvimento da população pela massiva e abrangente socialização dos indivíduos e sua possível alocação meritocrática. Entretanto esse desenvolvimento não se fazia na mesma dimensão e intensidade por todo o país. Internamente, existiriam regiões brasileiras subde-senvolvidas e outras com elevados padrões educacionais.
A obra de Cunha (1988) constitui um dos principais referentes para a crítica às concepções mais economicistas, centradas na formação individual do capital humano. O sociólogo da educação bra-sileira argumentava contra a suposição corrente de que a educação permitiria aos indivíduos, por-tadores de qualidade/quantidade de conhecimentos, seja qual fosse sua extração social de origem, ascenderem socialmente de acordo com seu mérito individual. A educação escolar desempenha-ria a função ideológica de dissimular os mecanismos de discriminação da própria educação, bem como os da ordem econômica. A crítica empreendida à função da educação como fator de desen-volvimento foi acompanhada da crítica ao modelo nacional desenvolvimentista, em que o cresci-mento econômico era visto como capaz de resolver per si problemas como desigualdade excluden-te e marginalização.
Entretanto Cunha manteve, e provavelmente ainda mantém, uma perspectiva sociológica em que as possibilidades de desenvolvimento acham-se associadas ao planejamento estatal. A esse respei-to, analisa o crescimento do ensino superior no período posterior à aprovação da Constituição de 1988: “O fato é que o desenvolvimento do ensino superior tem sido feito à base da improvisação docente, no âmbito do patrimonialismo prevalecente nas instituições públicas e privadas” (Cunha, 2007, p. 797).
A estratégia política implícita é a destacada por Domingues (1999), quando ele afirma que o Estado parece ser o agente – a “subjetividade coletiva” – fundamental para deslanchar o processo de desenvolvimento. Ao analisar a obra de Costa Pinto, Domingues observa que o sociólogo brasilei-ro nomeava desenvolvimento como “um processo contínuo de mudança social, deliberado e glo-bal, não somente econômico ou técnico, com uma mobilização intensa da sociedade, inclusive do poder” (p. 84). Ele acrescenta a esse respeito:
Desenvolvimento seria, então, uma forma particular de modernização, caracterizada por uma
mudança profunda das estruturas produtivas do país, de sua estrutura de classes, e pela demo-
cratização política e social, com a incorporação das massas à nação, acompanhada de transfor-
mações no próprio cenário internacional da dependência brasileira. (Domingues, 1999, p. 85)
2010 Pesquisa TIC EducaçãoARTIGOS 67
PO
RTu
Gu
ÊS
Na perspectiva proveniente desde a obra de Costa Pinto, para o desenvolvimento do país importava atribuir ao Estado uma função protagonista da ação política, pela via do planejamento. Nessa tradi-ção sociológica, o desenvolvimento da sociedade brasileira é mediado pela ação intencional e arti-culada do Estado – a via do planejamento –, ator capaz de mobilizar a sociedade para a produção de mudanças mais profundas no país. Atualmente, trata-se de uma perspectiva sociológica implíci-ta nas proposições hegemônicas da Conferência Brasileira de Educação:
Na medida em que a CONAE visa à mobilização social em prol da educação, o documento-
-referência inspira-se na necessidade de enfrentamento de, pelo menos, cinco grandes desafios
para o Estado e para a sociedade brasileira [...]. Portanto, a construção de um Sistema Nacional
de Educação requer o redimensionamento da ação dos entes federados, garantindo diretrizes
educacionais comuns a serem implementadas em todo o território nacional, tendo como pers-
pectiva a superação das desigualdades regionais. Dessa forma, objetiva-se o desenvolvimento
de políticas públicas educacionais nacionais universalizáveis, por meio da regulamentação das
atribuições específicas de cada ente federado no regime de colaboração e da educação privada
pelos órgãos de Estado [...]. No cenário educacional brasileiro, marcado pela edição de planos
e projetos educacionais, torna-se necessário empreender ações articuladas entre a proposição e
a materialização de políticas, bem como ações de planejamento sistemático. Por sua vez, todas
precisam se articular com uma política nacional para a educação, com vistas ao seu acompa-
nhamento, monitoramento e avaliação. (Brasil, 2010)
A ação do Estado e a mobilização social em prol da educação importam na construção de um siste-ma educacional – entendido como produção de mudanças estruturais, especialmente na construção de direitos sociais universais – que garanta diretrizes educacionais comuns superadoras de desigual-dades, mediante a regulamentação das atribuições dos entes federados. A Conferência Nacional em 2010 declara, também, que para tais objetivos são necessários recursos fiscais e operacionais. No entanto, para as mudanças desejáveis, a mobilização social articula-se com a ação estatal.
Por essa razão, as transformações operadas na sociedade brasileira pelo vetor da expansão da governança democrática e da maior inserção na economia capitalista mundializada devem ser ana-lisadas. Essas transformações produziram novos sujeitos e formas de sociabilidade, que por sua vez confrontam com a atuação burocrático-corporativa ou de matriz clientelista ainda presentes.
EdUCAÇÃo E dESENvoLvImENTo: A EmERGêNCIA dE NovAS FoRmAS dE SoCIABILIdAdE
Ao aproximar modernização e desenvolvimento, cuja apreensão se dá a partir dos projetos e dos movimentos das diversas subjetividades coletivas que para ela contribuem, Domingues observa que:
A modernidade brasileira, em seus desenvolvimentos recentes, tem sido impulsionada por
processos poderosos de “desencaixe” dos sujeitos de laços mais firmes e estáveis, inclusive,
hoje, em termos da estruturação subjetiva de indivíduos e coletividades como trabalhadores;

Pesquisa TIC Educação 2010ARTIGOS 68
PO
RTu
Gu
ÊS
p rocessos de individualização se acentuam, a família muda, a posição da mulher se altera; uma
“democratização” social, ligada a essa individualização, e ao menos a reivindicação de cidada-
nia avançam; a economia sente a demanda de um funcionamento mais flexível e eficiente nos
próprios processos produtivos; a multiplicação do consumo coloca para os sujeitos uma mul-
tiplicidade crescente de opções, desde, é claro, que façam parte daqueles em condições míni-
mas de a elas terem acesso. Ou seja, a existência individual se faz potencialmente mais aberta.
(Domingues, 1999, pp. 86-7)
As análises de Domingues sobre os processos modernos de individualização a localizam na difusão da cidadania, apreendida como “abstração real” na qual os indivíduos buscam guarita. Desencaixes-reencaixes-novos desencaixes constituem processos de desenvolvimento societário em contextos em que o “ajuste neoliberal” dos Estados latino-americanos obstaculizou a universalização de ser-viços que assegurem os direitos de cidadania.
Autores como Souza (2010) apontam como um dos resultantes desses processos de desencaixe e produção de novas identidades a formação no país de uma classe trabalhadora de “batalhadores”, ou empreendedores, em que o substrato político-ideológico do self-made-man está presente. Para esses sujeitos, a educação escolar configura-se como um valor a ser preservado,2 embora sua inser-ção e inclusão no mercado e nas novas formas de sociabilidade provenham em grande parte do tra-balho intensivo e/ou da fortuna. Como participa a educação escolar do(s) projeto(s) individual(is)/coletivo(s) de desenvolvimento dessa classe social?
Nossa pesquisa mostrou que essa classe conseguiu seu lugar ao sol à custa de extraordiná-
rio esforço: a sua capacidade de resistir ao cansaço de vários empregos e turnos de trabalho, à
dupla jornada na escola e no trabalho, à extraordinária capacidade de poupança e de resistên-
cia ao consumo imediato e, tão ou mais importante que tudo que foi dito, a uma extraordiná-
ria crença em si mesmo e no próprio trabalho [...]. Como inexiste o privilégio das classes domi-
nantes da dedicação ao estudo como atividade principal e muitas vezes única, a apropriação
do capital escolar e cultural vai ser, tendencialmente, menor que na verdadeira classe média.
(Souza, 2010, pp. 50-2)
As respostas possíveis apreendidas dos depoimentos colhidos por Souza (2010) revelam que as valorizações do acesso, permanência e aprendizagens escolares podem ser vistas como reações subjetivas individuais a situações de desencaixe, de vivências de injustiças e, também, revelam que
2 As modificações do capitalismo contemporâneo não foram automáticas nem óbvias para ninguém. Ao contrário, durante toda essa década, os filhos da “revolução expressiva” dos anos 1960 passaram em vários países a ocupar postos-chaves como for-madores de opinião e como figuras centrais da vida pública dessas sociedades. Essa geração, a primeira a ser produzida no contexto da educação pública de qualidade para amplos setores sociais – princípio que se consolidou depois da Segunda Guerra Mundial como subproduto do próprio compromisso fordista –, foi, ela própria, o suporte de uma crítica virulenta à heteronímia típica do trabalho fordista, assim como ao corte hierárquico de todas as instituições capitalistas e burguesas dominantes nesse período (Souza, 2010, p. 38).

2010 Pesquisa TIC EducaçãoARTIGOS 69
PO
RTu
Gu
ÊS
as instituições escolares cumprem, em muitos casos, a função sociopolítica de assegurar serviços que permitam futuras individualizações.
[...] é muito comum investir em alternativas, sobretudo nos estudos, na esperança de um empre-
go que traga um pouco mais de estabilidade [...] ele sabe que o telemarketing não é para a vida
toda, mas o fato de ter completado o ensino médio não corresponde automaticamente ao aces-
so irrestrito às instituições superiores de ensino, principalmente às mais prestigiadas e concorri-
das [...] sua mãe, insistentemente, cobra emprenho e dedicação pessoal nos estudos na esperan-
ça de que ele [...] Ele experimenta a sensação de insegurança devido à produção sócio-escolar,
nos últimos anos, de um verdadeiro exército de reserva minimamente escolarizado para o tra-
balho precário. (Souza, 2010: 71-8)
A função de desenvolvimento pela via meritocrática da educação escolar é, simultaneamente, valo-rizada e/ou desconsiderada. A escolarização inscreve-se na construção de projetos de futuro e/ou constitui-se como ex-ante da situação atual.
O entrevistado já tem filho que estudou mais que os pais e que terá, segundo ele, um futuro
melhor do que o de pequeno comerciante [...] um traço comum destes batalhadores é a posse
de alguma capacidade de trabalho cuja origem não é o ensino formal da escola [...] a filha, de
onze anos, tem computador e Internet em casa [...] já pensa em como poderá trabalhar para sus-
tentar a futura faculdade da filha. (Souza, 2010)
Com Foucault, a análise atenta do conjunto de depoimentos colhidos por Souza (2010) revela como o capitalismo penetrou em nossa existência e, também, como as instituições educacionais articu-lam-se às novas formas de sociabilidade. Uma leitura foucaultiana dos depoimentos colhidos jun-to aos “batalhadores brasileiros” é reveladora dos diversos dispositivos de governação/educação sobre os indivíduos. A presença/ausência da educação escolar responde pela configuração de uma nova ratio governamentale capaz de justificar a(s) situação(ões) de desenvolvimento no capitalis-mo como associada(s) ao progresso individual. As formas mais contemporâneas de sociabilidade – desveladas em Souza (2004) – sugerem contraditoriamente que a apropriação, da educação escolar pelos indivíduos se faz tanto por sua ausência quanto por sua presença. A interveniência dessa ins-tituição pode ser desejável e ter sido relevante, porém não é imprescindível.
é um pouco na escola, ao desenvolver um raciocínio matemático que já conhecia na prática ao
vender os produtos agrícolas do pai desde bem pequeno, mas muito mais nas suas experiências
de trabalho, que Pedro desenvolve as disposições requisitadas para a subsistência econômica no
seio do capitalismo contemporâneo. (Souza, 2010, p. 102)

Pesquisa TIC Educação 2010ARTIGOS 70
PO
RTu
Gu
ÊS
dESENvoLvImENTo doS SISTEmAS EdUCACIoNAIS: A EmERGêNCIA dE NovoS modoS dE REGULAÇÃo
Em simbiose com essas novas formas de sociabilidade, tem-se difundido globalmente o movimento conhecido como New Public Manegement3 (NPM), que vem estruturando toda uma discussão con-temporânea sobre mudanças organizacionais e administrativas no setor estatal, com influência na administração dos sistemas de ensino. (Power, 1997)
Defino NPM abstratamente como um campo de discussão política – conduzida internacional-
mente – sobre assuntos relacionados a administração pública, incluindo políticas de administra-
ção pública, liderança executiva, projetos de organizações programáticas e operações governa-
mentais. (Barzelay, 2000, p. 23)
Os programas no campo da NPM têm por pressupostos estudos relacionados à teoria da escolha racional e a teorias organizacionais de cunho empresarial (Barzelay, 2000). Tanto as reformas edu-cativas (inglesa e americana) da década de 1990 quanto os programas inspirados na NPM privile-giaram a livre oferta de serviços públicos (educacionais incluídos), para a “livre” escolha dos cida-dãos-consumidores, mediadas pela introdução de formas mais competitivas de financiamento, para a consecução de objetivos de maior eficiência e eficácia e monitorados quanto a resultados.
Nesse corpus ideológico, as ideias que orientaram perspectivas “modernizantes de reforma do Estado” configuraram, também, o imaginário social. Por um lado, há o reconhecimento das orga-nizações da sociedade civil4 como uma instância positiva de realização de democracia versus um aparato de Estado como instrumento de dominação burocrática. Desse modo, a desconcentração da prestação de serviços, especialmente na área social, é considerada como capaz de potenciar respostas à diversidade e possibilidades existentes na sociedade. Essa perspectiva se fundamenta na clivagem entre fins/objetivos e meios/procedimentos. A burocracia é questionada por sua ineficá-cia, rigidez e pouca visibilidade na formulação de alternativas.
é extensa e diversificada a literatura na área educacional sobre temas como diversidade curricular, modalidades de ensino específicas para jovens, povos indígenas, alternância de métodos e proces-sos educativos, etc. Subjaz a essa literatura o reconhecimento da diversidade de grupos e setores da sociedade que demandariam rupturas com o padrão uniforme de atendimento proveniente de um modo de regulação do sistema educacional de matriz burocrática (Maroy, 2008).
Proposições político-administrativas de ênfase gerencialista passam a destacar resultados e produ-tividade, obnubilando a crítica às relações sociais que as construíram. Nessa perspectiva, a ênfa-se em mecanismos de controle ex post pelos poderes centrais dos resultados obtidos – avaliação sistêmica, por exemplo – é combinada com apelos à iniciativa local com o objetivo de validação
3 “NPM é uma filosofia da administração […] que emergiu na década de 1980. [...] h & j afirmam que a NPM influenciou a agenda de governos ao estabelecer um ambiente de opinião em favor de suas doutrinas” (Barzelay, 2000, p. 235).
4 O termo, nesta perspectiva, designava uma instância positiva de realização plena e democrática das diferenças, uma suposta esfera de autenticidade e de liberdade em face de interesses e da cultura (Moraes, 2001, pp. 14-16).

2010 Pesquisa TIC EducaçãoARTIGOS 71
PO
RTu
Gu
ÊS
co nsequencial. A padronização do atendimento é questionada, e medidas de desempenho, as mais diversas, emergem como formas de legitimar as ações empreendidas.
No entanto, podemos afirmar que essas diretrizes político-administrativas (NPM) contêm compo-nentes de modernização5 dos sistemas educacionais construídos nos regimes autoritários no Brasil. Elas apontam uma preocupação de diversificação na oferta de bens e serviços, com o intuito de favorecer a expressão de necessidades socioculturais diferenciadas presentes na sociedade (Durut-Bellat, 2001), e também apontam para o monitoramento dos resultados (accountability) obtidos pelo poder público. Ao advogarem maior diversidade na oferta de serviços para o atendimento a identidades e interesses plurais de cidadãos-consumidores, contrapõem-se à tendência de unifor-mização burocrática presente nos períodos autoritários e fordista. Enfatizam, também, maior trans-parência na definição de metas e na alocação de recursos públicos como prerrequisito de com-petitividade (Pereira, 1996). O trato patrimonialista da res publica é criticado por não favorecer a expansão competitiva dos mercados.6
Para os “batalhadores brasileiros”, se a existência individual se fez mais aberta, com comportamen-tos e valores diferenciados convivendo de modo instável, o tratamento diferenciado – “personali-zado” – de suas necessidades é visto como requisito de qualidade e reconhecimento. Alternância no horário de atendimento e opções de escolha em um leque de possibilidades e períodos de atividade(s) individual(is) mais autônomas tornam-se requisitos de consumo dos mais diversos ser-viços, neles incluídos os educacionais. A oferta de opções em um mesmo serviço orienta e seduz como reconhecimento da singularidade e da diferença. A administração educacional é eficaz ao ofertar um atendimento diferenciado, que produz reconhecimento de necessidades mais específi-cas de pessoas ou grupos.
é no mesmo contexto de emergência dessas novas formas de sociabilidade, de difusão da NPM, que são também divulgados os resultados de pesquisas (Rutter, 1999; Brookover, 1979) sobre a in fluência da escola na evolução dos alunos. Se as condições socioeconômicas e culturais das famí-lias têm influência sobre o desempenho escolar, esses estudos comprovaram, igualmente, a existên-cia do que os franceses chamam de “efeito estabelecimento” (Cousin, 1998). Esse foco de pesquisa demonstrava que tipos de escolas têm efeitos importantes sobre o desempenho dos alunos. Ou seja, os modos de funcionamento das escolas podem, ou não, permitir que se reduzam os efeitos nega-tivos da situação socioeconômica das famílias (Lavinas & Barbosa, 2000). A escola, desse modo, é vista como o locus privilegiado da gestão educacional (Oliveira, 2000), e reformá-las é torná-las funcionais ao atendimento de um padrão mínimo de qualidade de ensino (art. 4o da LDBEN), qua-lidade aferida por testes nacionais de aprendizagem.
Expressão dessa ratio governamentale é a divulgação do Índice de Desenvolvimento da Educação Básica (IDEB) pelo Ministério da Educação. O desenvolvimento da educação passou a ser aferi-do pelo desempenho do estudante em testes de língua portuguesa e de matemática, associado ao
5 O termo “modernização” expressa, neste caso, a adoção de padrões de consumo, de comportamento, de instituições, valo-res e ideias das sociedades ditas mais avançadas, sem importar necessariamente em transformações reais da estrutura econô-mica e social.
6 Parte do sucesso político dessas diretrizes pode ser atribuída, também, ao fato de que elas se apresentaram e foram divulga-das como instrumento de luta contra a corrupção e a cooptação partidária dos serviços públicos.

Pesquisa TIC Educação 2010ARTIGOS 72
PO
RTu
Gu
ÊS
f luxo escolar (frequência e repetência). Esses índices informariam metas de qualidade da educação a serem perseguidas comparáveis às de países desenvolvidos.
Esses três processos sociais – emergência de novos sujeitos, difusão dos princípios do NPM e pro-jetos de reforma dos serviços prestados no âmago de cada uma e de todas as unidades educacio-nais – refuncionalizam a educação escolar, articulando-a agora ao termo “desenvolvimento social”. A crítica à educação escolar vista como “burocrática” e promotora de “meritocracias” é superada ao se comprovar a dissociação entre escolaridade e ascensão social, mas especialmente ao se pro-por reformá-la, na atualidade, como instituição promotora do desenvolvimento social. Nesse caso, a administração (gestão) das unidades escolares e sistemas de ensino foi reconfigurada pela nova tessitura das relações sociais e da cultura político-administrativa gestada ao longo dos últimos vin-te anos. Esses três processos sociais desenvolveram os sistemas educacionais e produziram efeitos na vida social, influenciando a relação entre educação e sociedade, no sentido de restringi-la aos padrões mínimos aferidos de modo mais uniforme e universalizado.
Entretanto outra dimensão do desenvolvimento societário, também afeta aos sistemas educacio-nais, envolve a emergência de uma esfera pública diversificada, incluindo meios de comunicação de massa e alternativos.
ESFERAS PúBLICAS: A TESSITURA dA RELAÇÃo ENTRE EdUCAÇÃo E dESENvoLvImENTo SoCIAL
Ao apontar os elementos que promoveram a gênese da esfera pública, habermas (1984) constituiu como a primeira fonte do conceito a separação entre a capacidade reflexiva dos indivíduos e a esfe-ra da realização de seus interesses materiais. De acordo com o pensamento habermasiano, inter-põe-se entre o interesse privado e a ação estatal um espaço/tempo caracterizado pela discussão livre e racional do exercício da autoridade política (Avritzer & Costa, 2004, p. 704).
habermas acrescenta, ainda, no contexto de surgimento da sociedade burguesa o papel da ciência das finanças e da doutrina da administração, subordinando a esfera privada aos órgãos do poder público.
A economia moderna não se orienta mais pelo oikos, pois no lugar da casa colocou-se o mer-
cado: transforma-se em “economia comercial”. Na Cameralística do século XVIII (que deriva o
seu nome de câmera, a câmara do tesouro do senhor feudal), esta precursora da economia polí-
tica se coloca, por um lado, no mesmo nível da ciência das finanças e, por outro, da doutrina
que se destacava da técnica agrária sintomaticamente como uma parte da “policy”, a doutrina
da administração propriamente dita: tão estreitamente a esfera privada da sociedade burguesa é
subordinada aos órgãos do poder público. [...]
Ainda que isso seja dito por um preconceito muito espalhado, o mercantilismo não favorece de
jeito nenhum a empresa estatal; a política empresarial exige, pelo contrário, ainda que por vias
burocráticas, montar e desmontar empresas privadas que trabalhem capitalistamente. Por isso, a
relação entre autoridades e súditos acaba redundando na peculiar ambivalência de regulamen-
tação pública e iniciativa privada. Assim, é problematizada aquela zona em que o poder públi-
co, mediante atos administrativos contínuos, mantém ligações com as pessoas privadas. [...] já

2010 Pesquisa TIC EducaçãoARTIGOS 73
PO
RTu
Gu
ÊS
que, por um lado, um setor privado delimita nitidamente a sociedade em relação ao poder públi-
co, mas, por outro, eleva a reprodução da vida acima dos limites do poder doméstico privado,
fazendo dela algo de interesse público, a referida zona de contato administrativo contínuo tor-
na-se uma zona “critica” também no sentido de que exige a crítica de um público pensante.
(habermas, 1984, pp. 34-39)
Na perspectiva habermasiana, a instituição da “ciência da administração” se fez como um instru-mento de intervenção ambígua do poder na esfera da vida privada e constituiu-se como proce-dimento de uma progressiva estatização do mundo da vida (habermas, 1984, p. 45). Nesse sentido, efetuamos uma aproximação entre a perspectiva analítica foucautiana sobre o poder, que recusa uma apreensão do Estado na condição de esfera jurídico-política apartada do social, e a imbrica-ção habermasiana entre o poder administrativo e a configuração da esfera pública política, para a construção de outro olhar sobre a emergência de novas formas de regulação da relação entre edu-cação e desenvolvimento.
Inicialmente, habermas (1984) considerou que a esfera pública política provinha da literária, como um espaço de intermediação, por meio da opinião pública entre o Estado e as necessidades da sociedade (sociedade civil burguesa em sentido estrito).
O processo ao longo do qual o público constituído pelos indivíduos conscientizados se apro-
pria da esfera pública controlada pela autoridade e a transforma numa esfera em que a crítica se
exerce contra o poder do Estado realiza-se com a refuncionalização da esfera pública literária,
que já era dotada de um público possuidor de suas próprias instituições e plataformas de dis-
cussão. (habermas, 1984, p. 68).
Na análise habermasiana, para a constituição de uma esfera pública em que a crítica se exer-ce contra o poder7, requereu-se a institucionalização de uma privacidade simultânea a espaço(s) institucional(is) de informação e expressão de indivíduos livres. Essa contradição se retroalimen-tava produzindo indivíduos críticos ao poder e, pari passu, dotando a administração do Estado de impessoabilidade capaz de intervir em assuntos privados (empreendimentos mercantis, incluída a cultura) em nome de um interesse geral.
Posteriormente, habermas introduz uma substancial reformulação de seu conceito de esfera públi-ca. Ele abandona uma concepção mais unitária em favor de uma concepção multiforme, ainda que linguisticamente unida. habermas fala de uma “rede altamente diferenciada de esferas públicas locais e suprarregionais, literárias, científicas e políticas, interpartidárias ou específicas de asso-ciações dependentes dos media ou subculturais, em que ocorrem processos discursivos de forma-ção de opinião cujo principal objetivo é a difusão do conhecimento e da informação” (Silva, 2001, p. 449). Nesse sentido, Ball (2008), com suporte em Foucault, indaga sobre aqueles momentos em que a linguagem, o olhar e novas formas de sociabilidade são unificados, diríamos, de forma con-traditoriamente articulada.
7 Formas de comunicação pública discursivas caracterizadas por seu conteúdo argumentativo (Costa, 2002, p.187)
Pesquisa TIC Educação 2010ARTIGOS 74
PO
RTu
Gu
ÊS
A reformulação apresentada por habermas mantém, no entanto, da concepção original de esfera pública seu poder emancipatório de proteção e recuperação do mundo da vida, que sofre os efeitos de uma colonização sistêmica e o descaracteriza; mais concretamente, onde a economia e o apare-lho burocrático do Estado destroem os processos comunicativos, em áreas como cultura, educação ou socialização (Silva, 2001, p. 443). é nesse sentido que a formulação habermasiana sobre esfe-ra pública pode contribuir para a compreensão e a crítica da relação entre educação e desenvolvi-mento social, sem um retorno à teoria do capital humano.
“mudança estrutural da esfera pública” permite uma interpretação da constituição de espaços-tem-po, em que a generalização da forma mercantil produziu a superveniência da abstração dos ele-mentos imediatos da atividade concreta de trabalho (labor) e a extensão entre os indivíduos da per-cepção das relações abstratas constitutivas da forma capitalista de produção. Nessa perspectiva, a obra de habermas possibilita inferir que a generalização da forma mercadoria na produção e repro-dução da vida social pela mediação do poder administrativo estatal contribuiu, contraditoriamente, para o fortalecimento da esfera pública política, ou seja, para a reunião de indivíduos privados com o objetivo de submeter ao crivo da crítica as decisões da autoridade pública.
habermas (1984) funda a constituição da esfera pública política na existência prévia de interações não colonizadas por relações mercantis, mas sua obra traz indicações do fortalecimento de rela-ções no sistema de poder (esfera estatal) que contraditoriamente também reforçariam uma esfera pública política. A possível tensão entre setor privado (sociedade civil) e poder público (adminis-trativo) como necessária para a constituição de uma esfera pública política remete a indagações sobre o crescimento de expressões de diversidade político-educativas no país, ou seja, a efetivação de um sistema educacional capaz de compor com essa diversidade. Em outros termos, políticas de administração educacional são capazes de “colonizar” rupturas provenientes de desigualdades por intermédio de intervenções reguladoras, mas colonizam espaços de expressão das diversidades.
Para Ball (2008), uma sociologia que permitiu “linkar” as desigualdades sociais com as escolas e as famílias demonstrou como essas instituições são multidimensionais e interligadas e, embora por configurações sobrepostas em diferentes momentos, possibilitaram novos dispositivos de poder (governação). Para habermas, por sua vez, o desenvolvimento das esferas públicas políticas, pen-sadas como possibilidades concretas, conecta-se ao problema da cidadania como uma subjetivida-de coletiva instituinte (chamada também de “cidadania ativa”, por Domingues, 2009, p. 58). São esses movimentos societários contraditórios que subjazem à distribuição/concentração do poder no desenvolvimento dos sistemas educacionais e fatores-chave nas dinâmicas sociais que os modificam.
Diferenças de opinião, de demandas, de públicos (jovens, étnicos, de orientação sexual) fragmen-tam-se em direções próprias, e sua articulação mediante princípios hierárquicos e burocráticos encontra fortes resistências. Uma sociedade mais complexa e diversificada aumenta e torna disfun-cionais arranjos institucionais por meio das quais demandas são canalizadas para o Estado – sistema educacional incluso – e novas subjetividades coletivas (identidades) são mediadas por outros modos de regulação da vida social. Nesse sentido, educação e desenvolvimento se articulariam na medida em que a primeira participasse dos processos de individualização contemporâneos pela prestação de serviços de base universal com qualidade, e a institucionalização de um outro sistema educacio-nal, mais diversificado, produzisse fissuras significativas nas práticas e no imaginário meritocrático.
2010 Pesquisa TIC EducaçãoARTIGOS 75
PO
RTu
Gu
ÊS
CoNCLUSõES PARCIAIS: dESENvoLvER o SISTEmA EdUCACIoNAL
A concepção originária de desenvolvimento e educação associada à ampliação do sistema como mecanismo de desenvolvimento teria por fundamento uma atuação protagonista de Estado pela via do planejamento. Este, mediante políticas sociais, enfrentaria o subdesenvolvimento social e, com políticas de ciência e tecnologia, os entraves ao desenvolvimento técnico-produtivo.
Entretanto dois autores contemporâneos chamam nossa atenção para os movimentos societários em cursos na contemporaneidade, em que são gestadas, por um lado, novas formas de governa-ção das subjetividades e, por outro, formas de individualização mediante a prestação de servi-ços que asseguram direitos sociais. Para essa sociologia, a noção de desenvolvimento expressa-ria ciclos de transformação social, cujos efeitos de médio e longo prazo não são vislumbrados. Desenvolvimento, desse modo, acha-se dissociado da noção de progresso e aproximar-se-ia da configuração de alternativas societárias.
REFERêNCIAS BIBLIoGRÁFICAS
AVRITzER, Leonardo; COSTA, Sérgio. Teoria crítica, democracia e esfera pública: concepções e usos na América Latina. dados, Rio de janeiro, v. 47, no 4, pp. 703-728, 2004.
BALL, Stephen. Some Sociologies of Education: a history of Problems and Places, and Segments and Gazes. the Sociological review, v. 56, no 4, 2008.
BARzELAY, Michael. The New Public Management: a Bibliografical Essay for Latin America (and Other) Scholars. international Public management journal, no 3, pp. 229-265, 2000.
BRASIL. Conae. construindo o sistema nacional articulado de educação: o plano nacional de educação, diretri-zes e estratégias de ação. Documento-base, v. 1. Brasília: Conferência Nacional de Educação, 2010.
BROOKOVER, Wilbur C. et al. School Social Systems and Student Achievement: Schools can make of difference. Nova York: Praeger, 1979.
COSTA, Sérgio. As cores de ercília: esfera pública, democracia e configurações pós-nacionais. Belo horizonte: Editora da UFMG, 2002.
CUNhA, Luiz Antonio. educação e desenvolvimento social no Brasil. 10. ed. Rio de janeiro: Francisco Alves, 1988.
COUSIN, Olivier. l’efficacité des collèges: sociologie de l’effet établissement. Paris: PUF, 1998.
DOMINGUES, josé Maurício. Desenvolvimento, modernidade e subjetividade. rBcS, v. 14, no 40, junho de 1999.
. A América latina e a modernidade contemporânea: uma interpretação sociológica. Belo horizonte: Editora da UFMG, 2009.
DURUT-BELLAT, Marie. Politiques éducatives et analyse des inégalites: de quelques vertus heuristiques des com-paraisons franco-britanniques. revue française de pédagogie, no 135, pp. 19-28. abril-junho de 2001.
hABERMAS, jürgen. mudança estrutural da esfera pública. Rio de janeiro: Tempo Brasileiro, 1984.
LAVINAS, Lena; BARBOSA, Maria Ligia O. Combater a pobreza estimulando a frequência escolar: o estudo de caso do Programa Bolsa-Escola do Recife. dados, v. 43, no 3, Rio de janeiro, 2000.

Pesquisa TIC Educação 2010ARTIGOS 76
PO
RTu
Gu
ÊS
MAROY, Christian. Régulation des systèmes éducatives. In: VAN zANTEN, Agnès. dictionnaire de l’éducation. Paris: Presse Universitaire de France, 2008.
MORAES, Maria Célia M. Recuo da teoria: dilemas na pesquisa em educação. revista Portuguesa de educação, v. 14, no 1, pp. 97-65, 2001.
OLIVEIRA, Dalila Andrade (org.). gestão democrática da educação: desafios contemporâneos, v. 1. 3. ed. Petrópolis: Vozes, 2000.
PEREIRA, Luis Carlos Bresser. Da administração pública burocrática à gerencial. revista do Serviço Público, 47(1), janeiro de 1996.
POWER, Sally. Managing the State and the Market: “New” Education Management in Five Countries. British journal of educational Studies, v. 45, no 4, pp. 342-362, 1997.
RUTTER, Michael et al. Fifteen thousand hours: Secondary Schools and their effects on children. Somerset: Open Book. 1999
SILVA, Felipe C. Espaço público e democracia: o papel da esfera pública no pensamento político de habermas. Análise social, v. XXXVI (158-159), 2001, pp. 435-459.
SOUzA, jessé de. A gramática social da desigualdade brasileira. rBcS, 19(54), fevereiro de 2004.
. os batalhadores brasileiros: nova classe média ou classe trabalhadora? Belo horizonte: Editora da UFMG, 2010.

2010 Pesquisa TIC EducaçãoARTIGOS 77
PO
RTu
Gu
ÊSdESAFIoS dA PESqUISA EdUCACIoNAL
E AS AvALIAÇõES ExTERNAS: ALGUmAS RELAÇõES Com o CoNhECImENTo E A PoLíTICA
Ocimar Munhoz Alavarse1
O título encerra, para a completude de sua delimitação e seu desdobramento, uma miríade de aspectos que, diacrônica e sincronicamente, seria impossível abarcar nos marcos deste trabalho. Uma vasta literatura já foi consagrada tanto para recensear e problematizar a produção no âmbi-to da pesquisa educacional, no Brasil e no exterior, quanto para demarcar as alternativas e polêmi-cas metodológicas para o efetivo desenvolvimento dessas pesquisas. Como exemplário dessa pro-dução, e pela excelência de suas contribuições, podemos indicar Azanha (1992), Cohen, Manion & Morrison (2007), Ferrare (2011) e Gatti (2007).
Especialmente para a apreensão de um importante quadro da produção científica educacional, incluindo seus desafios, deve-se destacar a Associação Nacional de Pesquisa e Pós-Graduação em Educação (Anped) como referência favorecida em virtude da disponibilização de materiais em seu portal. A Anped, ademais, é a entidade que congrega todos os programas de pós-graduação em edu-cação do Brasil, sendo suas reuniões anuais um dos principais eventos científicos, e sua revista – a revista Brasileira de educação –, um dos mais destacados periódicos de divulgação científica na área.
De qualquer modo, para abordar o tema, ainda que num tom ensaístico, problematizo desafios da pesquisa educacional procurando articular um aspecto de conteúdo epistemológico, relativo à delimitação de objetos de pesquisa, com outro referente a um traço que se avulta no campo edu-cacional brasileiro. Quanto ao primeiro, procuro explorar a própria condição de produção de conhecimento, razão essencial de toda e qualquer pesquisa, demarcando alguns obstáculos e pro-blematizações do fazer científico. Quanto ao segundo, desenvolvo-o a partir da disseminação e do destaque que a avaliação externa às escolas de educação básica passou a ocupar nas políticas públicas em educação. Tais avaliações se caracterizam, na maioria das vezes, como avaliação de sistemas, sendo realizadas como avaliações em larga escala ou avaliações padronizadas, por conta dos instrumentos e procedimentos que nelas são adotados em suas fases de concretização.
1 Professor da Faculdade de Educação da Universidade de São Paulo e pesquisador sobre ciclos, progressão continuada e ava-liação educacional.
Pesquisa TIC Educação 2010ARTIGOS 78
PO
RTu
Gu
ÊS
No Brasil, esse quadro avaliativo ganhou densidade notadamente após o desdobramento, em 2005, do Sistema Nacional de Avaliação da Educação Básica (Saeb), no qual um de seus ramos, a Avaliação Nacional do Rendimento Escolar (Anresc) – mais conhecida pelo nome de Prova Brasil –, teve seus resultados de língua portuguesa (leitura) e matemática (resolução de problemas) incor-porados, juntamente com as taxas de aprovação, ao cálculo do Índice de Desenvolvimento da Educação Básica (Ideb)2, estimulando ações similares em várias redes públicas de ensino, com des-taque para o Índice de Desenvolvimento da Educação no Estado de São Paulo (Idesp). No caso do Ideb, uma característica é a divulgação dos dados de todas as escolas públicas que participaram da Prova Brasil, aumentando o envolvimento de vários segmentos no debate e na investigação sobre seus significados e possíveis explicações. Textualmente, a formulação do Ideb apresenta uma visão extremamente objetivista sobre seu potencial para indicar a qualidade da escola, embora, histórica e politicamente, essa concepção encontre, antes e depois de sua edição, outras manifestações na literatura e nas políticas educacionais.
Com efeito, nesse cenário, os resultados da avaliação externa passaram a compor, tanto em políti-cas públicas quanto em pesquisa, neste caso ainda de modo incipiente, um nexo explicativo para o que se designa genericamente como qualidade da educação. E aqui reside precisamente o centro do problema deste trabalho para fins de apreciar possíveis desafios de pesquisa educacional: seriam tais resultados capazes de indicar a qualidade da escola? Isso abre o debate, então, para pelo menos duas outras questões: uma referente ao próprio objeto dessas avaliações – a escola como um todo ou apenas face, mesmo que importante, do trabalho aí desencadeado – e outra sobre a maneira de investigar tal objeto.
oS dESAFIoS dA dELImITAÇÃo dE oBjEToS E PRoBLEmAS NA PESqUISA EdUCACIoNAL
Burke (2003, p. 183), passando em revista o processo social de produção do conhecimento, indica que, com variações no tempo e nas culturas:
[...] só há quatro razões para aceitar proposições como verdadeiras: sentimento, autoridade,
razão e percepção sensorial [...] No início do período moderno esse equilíbrio se inclinava para
uma combinação de razão e percepção sensorial [...] O que era novo era uma consciência cada
vez mais aguda do método, ligada ao uso de instrumentos científicos, à coleta cada vez mais
sistemática de fatos particulares e ao surgimento dos manuais práticos.
2 O Ideb, oficializado pelo Decreto no 6.074/2007 e fundamentado em Fernandes (2007), é calculado e divulgado, entre outros estratos, para todas as escolas públicas com pelo menos trinta alunos na 4a e 8a séries do ensino fundamental. Para maiores informações, deve-se consultar o sítio do Inep, autarquia do Ministério da Educação, responsável pela operacionalização do Saeb (www.inep.gov.br).

2010 Pesquisa TIC EducaçãoARTIGOS 79
PO
RTu
Gu
ÊS
Mesmo que desprovidos da esperança, propalada por Leibniz, de uma matemática universal para o cálculo da verdade, mas provavelmente tomados por esse “espírito” que condensou a pretensão de fazer a razão controlar os sentidos na busca de evidências, não houve ramo da investigação cientí-fica que não tenha sido assolado por tal perspectiva empírica como seu leitmotiv. No afã de encon-trar leis e regularidades, ainda que potenciais, o método indutivo foi, em decorrência de favorecer à primeira vista – pelos olhos que veem os dados objetivos –, revestido de uma aura de autoprote-ção por garantir, pela tentativa de levá-la quase à exaustão, a busca das evidências, e daí favorecer o encontro com os nexos causais. Uma implicação para as pesquisas foi a tentação de buscar a ver-dade na quase-exaustão de experimentações e testagens. A indução é admitida, entre outras justifi-cativas, por sua face operativa, mesmo quando estamos diante de “alvos móveis” – como é o caso de políticas sociais, nos dizeres de Palumbo (1994) –, particularmente quando nos propomos com-preender fenômenos como a avaliação de escolas.
Se é possível aditar que esse quadro indutivo tenha esmaecido, no sentido de que tais crenças foram cedendo espaço a novas metodologias que procuram problematizar o caminho para a verdade, é possível a fortiori afirmar que suas influências não cessaram ou retornam com vigor restaurado e transfigurado. Como uma indicação de tais ressurgimentos, há os riscos do operacionalismo, ou seja, a ânsia de encontrar e manipular conceitos que se revelem operativos no enfrentamento de determi-nados objetos, incorrendo-se, contudo, numa postura acrítica diante de tais conceitos, como parece ser o caso da divulgação de resultados de avaliação em larga escala, mediante utilização de provas padronizadas, como se isso fosse mecânica e automaticamente associado às aprendizagens escola-res e, por conseguinte, uma decorrência do trabalho desencadeado no interior das escolas. Aliás, em muitos casos, rompe o limite que distingue a correlação causa-efeito, como se uma balança pudesse dimensionar a massa de alguma matéria e, também, informar se ela é ouro ou prata.
Mas, antes de avançar sobre as consequências de tais inferências, entre desempenho em provas e trabalho pedagógico nas escolas – fator primordial da qualidade da instituição –, destaque-se que a essência de qualquer pesquisa científica – e acrescentaria: sua conditio sine qua non – está no deli-neamento de problemas de pesquisa, o que, por sua vez, nos remete, inexoravelmente, ao desafio relativo a seus objetos de pesquisa. Isso, na área da educação, parece agregar desafios adicionais, pois poderia até mesmo nos remeter a questões atinentes ao fato de se considerar se há uma ciên-cia da educação; em outras palavras, saber se a pedagogia teria alcançado um estatuto de modo que pudesse apresentar-se, entre outros atributos, com objetos bem delineados, mesmo consideran-do a possibilidades de subáreas.
A disseminação, em anos recentes, de grandes quantidades de dados provenientes de avaliações externas, contrariamente ao que se pretende pelo seu uso em muitas políticas públicas, não resol-ve a delimitação de problemas e de objetos de investigação no campo da pesquisa educacional. A fixação de tais resultados, eivada de força política, com variáveis dependentes e indicadores, par excellence, a respeito da qualidade da educação escolar acaba por configurar de modo reducionis-ta e exacerbante importantes elementos no escopo das pesquisas educacionais. há um privilégio desses resultados como objetos de estudo e do recurso de provas padronizadas como metodologia de pesquisa. E, mesmo quando se recorre ao estudo de supostas variáveis independentes no interior da escola, isso parece ser concebido dentro de um equacionamento em que tais variáveis perdem a condição de serem elas próprias dependentes, na verdade, de outros fatores que acabam negli-genciados ou desconsiderados. Uma consequência desse tipo de enquadramento, já clássica nos Estados Unidos, conforme vários apontamentos na literatura e destacado por Madaus (1988), seria o

Pesquisa TIC Educação 2010ARTIGOS 80
PO
RTu
Gu
ÊS
“ensinar para o teste”, com profundas restrições curriculares, pedagógicas e didáticas. Outra conse-quência seria a responsabilização de participantes do processo educacional, destacadamente pro-fessores e gestores de escola, que não corresponderia ao efetivo peso que estes teriam na condução de tal processo. Contudo a mais grave consequência seriam, no escopo deste trabalho, implicações para a pesquisa educacional, pois esta estaria sendo levada a delimitações de problemas e objetos que abstrairiam a realidade da educação escolar.
Isso em hipótese alguma pode nos conduzir a negar a pertinência de se levantar como proble-mas de pesquisa os seguintes exemplos: o que aprendem as crianças na escola? Quanto aprendem do que aprendem na escola? A ressalva, no entanto, é que tais perguntas parecem ser perfeita-mente evidenciáveis, empírica, fidedigna e indutivamente respondidas pelas provas padronizadas. Entretanto o desafio ainda estaria na delimitação do que é a própria escola, sua qualidade no sen-tido de constituição histórica e social. E daí subjazem perguntas mais essenciais: por que as crian-ças aprendem o que aprendem na escola? Por que aprendem o quanto aprendem na escola? Para que aprendem o que aprendem na escola? A esse rol, do ponto de vista metodológico, devemos acrescentar a seguinte indagação: como saber sobre tais questões? E isso nos remete aos procedi-mentos das provas padronizadas, na elaboração e no tratamento dos dados, aspecto ainda sem a precisão que os usuários de seus resultados supõem possuírem. Tal aspecto deveria merecer maior atenção quando se trata de traçar políticas públicas.
Supondo, então, algumas ”simplificações” diante desses resultados – o que, ressalvo, não tira o méri-to de sua produção –, é imperioso destacar a permanente tarefa investigativa de localizar a educa-ção escolar no interior das práticas sociais. Isso, por um lado, faculta que outras vertentes da ciên-cia a abordem, mas, por outro, impõe aos cientistas da educação a necessidade de sempre levar em conta um conjunto de liames a influenciar, a condicionar, a impor restrições e potencialidades para a atividade educativa escolar e que operam como se fossem um traço latente. Aprendê-lo, em sua imensidão de variáveis, não necessariamente deve ser sempre o objeto de investigação, tampou-co deva ser sempre recuperado no quadro de explicações, mas supô-lo inexistente ou sem impacto pode comprometer todo o esforço explicativo da missão investigativa, inclusive porque é desse reco-nhecimento que se poderá empreender a busca por melhores opções, alternativas para a superação de impasses didático-pedagógicos, para a otimização de processos, e assim por diante. Trata-se, sim, no âmbito da pesquisa educacional, de confirmar que as evidências nem confirmam, nem refutam, como tão facilmente se supõe, o encadeamento que os resultados dessas avaliações parecem indicar.
Se a interconexão de fenômenos é marca de qualquer ciência, na educação isso assume propor-ções peculiares que dificultam a apreensão de objetos de investigação, de modo que o recorte pode levar, muitas vezes, o pesquisador a uma “ilusão de ótica”.
Na pesquisa educacional, seu objeto está impregnado de uma gama quase incalculável de influên-cias, por se configurar como uma prática social. Adiciona desafios no plano gnosiológico, pela natureza e à validade desse conhecimento. Tais assertivas, longe de retirar-lhe o mérito heurístico, operam muito mais como uma ressalva, tanto para as generalizações imperativas – e impotentes nos próprios termos em que se anunciam –, quanto para as hiperespecializações enfeudadas por pou-quíssimos praticantes.
Orlandi (1969, p. 16-17), preocupado com a complexidade estrutural do objeto nas pesquisas edu-cacionais e face às dificuldades enfrentadas pela “consciência pedagógica” para evitar as flutua-ções de ênfases teóricas buscadas fora de seu campo próprio, demarcava uma possível razão para
2010 Pesquisa TIC EducaçãoARTIGOS 81
PO
RTu
Gu
ÊS
essas flutuações na “natureza dispersiva do objeto de pesquisa educacional [que] condiciona a fun-ção das hipóteses operadas para estudá-lo”, pois essa natureza “reclama a construção prévia de uma estrutura teórica suficientemente ampla e maleável em face do objeto de estudo”. No entanto, inescapavelmente, a construção de um marco teórico sólido o suficiente para dar conta dos proble-mas que precisam ser enfrentados passa pela necessidade de abertura a outras ciências, inclusive pela própria formação do pesquisador. Mas reitera Orlandi (1969, p. 17):
O caráter flutuante dessas aberturas só pode ser controlado, não pela negação da própria aber-
tura [...] mas pela dinamização crescente de outras teorizações e práticas humanas em função
da própria mobilidade do objeto de pesquisa em educação.
Isso recolocaria a relevância da perspectiva de se admitir com maior indulgência a hipótese de ado-tar a grounded theory, como apontam Gibson e Brown (2009), na condição de recurso de funda-mentação e, mesmo, de metodologia de investigação, como estratégia de estudar, por exemplo, os números com mais vagar, sem a pressa que outros modelos exortariam, na linha de encontrar mui-to facilmente a relação causa-efeito.
é preciso, nessa altura, realçar que – a despeito de usos e generalizações equivocadas e para se evi-tar questionamentos simplistas que afirmam que tais recursos quantitativos seriam um ressurgimen-to de vertentes “positivistas” – a existência de resultados de avaliações externas traz para a pesquisa educacional o debate sobre os métodos quantitativos, os quais, como demarca Ferrare (2011), acen-tuadamente pelo que se denominou pensamento crítico na educação, foram quase abandonados em função de que a tradição que os alicerçou não levava em conta os fatores sociais mais amplos que condicionam a educação e reforçam os mecanismos conservadores desta.
Assim, o aparecimento ou a retomada de metodologias que se concentram nas medidas educacio-nais – abarcando instrumentos, procedimentos de aplicação e de coleta, dados, constituição de bases de dados, informação, argumentos, conhecimento, juízos, ações, consequências, im pactos, etc. – podem infundir novos horizontes – e desafios à pesquisa educacional, sem nada a obstar as preocupações mais amplas, sociais e políticas, sobre a natureza política da escola, o que não dispensa tais aportes metodológicos, nem o fazem os únicos na investigação científica, como se encontra em Pearl (2009) ou em Shadish, Cook & Campbell (2002).
AvALIAÇõES ExTERNAS Como ExPRESSÃo dE PoLíTICA EdUCACIoNAL
Diante da potencial polarização entre usar ou não resultados de avaliações externas como indica-dores, podemos recorrer a josé Paulo Paes, que indica que “é entre a recusa e o entusiasmo que corre a estrada da compreensão crítica” (1985, p. 10). Essa indicação parece adequada para tratar-mos de um tema que, sem nunca ter perdido sua componente política, ganha maior densidade nas políticas educacionais e, portanto, é mais propenso a ser abordado com recusas e entusiasmo, o que pode turvar sua análise.
Com licença poética e alicerçando o dimensionamento político das avaliações externas, podemos nos apoiar em Secchin (1993, p. 216-217), quando este indaga e responde:

Pesquisa TIC Educação 2010ARTIGOS 82
PO
RTu
Gu
ÊS
Para que serve um poema? Talvez para insistir que há sempre restos, equívocos, lapsos, fraturas
na sintonia do homem com o real. Ignorá-los é acreditar na adequação entre palavras e coisas,
na vigência de um discurso homogêneo que nega a cada um a possibilidade de negociar com as
palavras as frestas de perturbação e mudança de que elas e nós necessitamos para continuarmos
vivos [...] O recorte entre o prosaico e o poético é administrado por inúmeros vetores culturais, por
mais que isso desagrade aos caçadores da essência perdida, e perdida por nunca ter existido [...]
[...] a poesia não precisa lamuriar-se diante da ordem tecnológica e nela acusar o inimigo obs-
trutor de seu alcance. [...] ela pode vigorar sem outro compromisso que não seja a afirmação de
que nossa liberdade passa não apenas pelas palavras em que nos reconhecemos, mas, sobretu-
do, pelas palavras com as quais aprendemos a nos transformar.
Ou seja, os números não dão precisão per se ao entendimento da realidade, mas introduzem uma outra maneira de inquirir essa realidade, cujo entendimento – supondo-o possível – se fará median-te os recortes que nela fazemos, expressos nos objetos e perguntas aos quais endereçamos. Ainda que avaliação não se confunda com pesquisa, pois aquela é revestida de preocupações mais ime-diatas e tem em seus julgamentos um dos traços mais salientes, como destaca Nevo (2006) – e que daí derivem resultados com a mais elevada consistência, face às condições em que se realiza –, ela pode ser considerada um forte ponto de apoio.
A educação diz respeito ao processo formativo, ou endocultural, nas acepções de Brandão (2010), da espécie humana, processo do qual não pode ser privado sob pena de não tornar-se humano. Não obstante, na maioria das sociedades, a formação dos seres humanos associou-se à ideia de que isso deve, em algum grau e em alguma quantidade, associar-se à escola. Tal configuração cultural dá a entender, em muitos contextos, que falar de educação supõe, intrinsecamente, falar de educação escolar. Mesmo quando se reconhece que esta está subsumida àquela, a força simbólica da educa-ção escolar avulta, quer pelo horizonte da conservação social, quer pelo da contestação, mas nun-ca apartada da política, como recuperou, entre muitos outros autores, Fernandes (2010).
Os valores liberais da igualdade de oportunidades, entendidos, via de regra, como igualdade de oportunidades escolares, salientam o lugar especial da escola na sociedade, locus privilegiado na instrumentação para a disputa por posições na estrutura hierárquica social. Mesmo por outros ângu-los ideológicos, a defesa da escola, na perspectiva de emancipação humana e de integração lin-guística ou noutros vislumbres orientados pela igualdade social final, converteu-se, provavelmente, num dos principais direitos humanos, a ponto de ser estabelecida como uma imposição. Nas pala-vras de Marshall (1967), trata-se de um direito que é condição para usufruto de outros direitos, o que justificaria a violência – simbólica, mas quiçá física – sobre crianças a ela compelidas.
E, nesses termos do processo formativo, a avaliação expõe-se potencialmente como um objeto de investigação. Inclusive para se aquilatar, na via da meta-avaliação, se não foram violadas certas regras do processo avaliativo, o que, por sua vez, comprometeria o juízo avaliativo e suas consequências.
Além do mais, dado seu caráter concentrador, pode-se afirmar que a avaliação configura-se como uma categoria dos processos educativos que merecem atenção especial, particularmente por ser concreta, ou seja, porque é a síntese de múltiplas determinações, considerando-se as observações de Marx (1970, p. 206):

2010 Pesquisa TIC EducaçãoARTIGOS 83
PO
RTu
Gu
ÊS
[...] é concreto porque é síntese de muitas definições, representando, então, a unidade de diver-
sos aspectos. Ele aparece, portanto, no pensamento como um resumo, um resultado, não como
um ponto de partida, embora seja verdadeiro ponto de origem, e, assim, também como ponto
de origem da percepção e da imaginação.
Adicionalmente, para fundamentar a avaliação como categoria, Cury (1985, p. 21) aponta:
As categorias são conceitos básicos que pretendem refletir os aspectos gerais e essenciais do
real, suas conexões e relações. Elas surgem da análise da multiplicidade dos fenômenos e pre-
tendem um alto grau de generalidade.
Desde logo observe-se que as categorias devem corresponder às condições concretas de cada
tempo e lugar. Elas não são algo definidas de uma vez por todas e não possuem um fim em si
mesmas. Elas ganham sentido enquanto instrumento de compreensão de uma realidade social
concreta, compreensão esta que, por sua vez, só ganha sentido quando assumida pelos grupos
e agentes que participam de uma prática educativa.
As categorias possuem simultaneamente a função de intérpretes do real e de indicadores de
uma estratégia política. Portanto, a exposição formal que se segue só tem sentido enquanto ins-
trumento metodológico de análise, ligado à prática educativa e no contexto de um tempo e um
lugar determinados.
As categorias, assim, só adquirem real consistência quando elaboradas a partir de um contex-
to econômico-social e político historicamente determinado, pois a realidade não é uma petri-
ficação de modelos ou um congelamento de movimentos. Pelo contrário, síntese de múltiplas
determinações, está em constante movimento de expansão. Por isso é importante considerar o
contexto, porque é ele que possibilita que as categorias não se isolem em estruturas conceituais
puras, mas se mesclem de realidade e movimento.
Isso implica, portanto, tentar descobrir a quais fatores sociais, evidentemente articulados em uma expressão propriamente pedagógica, sua existência corresponde, até para que se possa compreen-der como se desenvolveu como ideia, que parece presidir todo o processo de escolarização e que, como concreto, condensa uma articulação sócio-histórica.
Marx (2005, p. 151) alertou que “[é] certo que a arma da crítica não pode substituir a crítica das armas”, o que, mutatis mutandis, coloca como um grande desafio apoiar-se, eventualmente, nos resultados das avaliações externas para apreensão da escola, entretanto sem deixar de considerar a hipótese de que esses resultados, talvez, não resultem da escola, e sim de outros elementos da rea-lidade, incluindo interesses que não querem “revelar” a escola, mas “produzir” uma escola. Isso é legítimo como luta política, mas não como apresentação pura e simples da realidade/verdade pela precisão dos números. Nem sempre eles são precisos, nem sempre deles precisamos. E nesse sen-tido são dignas de nota as contribuições de Sousa (1997a e 1997b) e Weiss (1982, 1991 e 1997).
Pesquisa TIC Educação 2010ARTIGOS 84
PO
RTu
Gu
ÊS
CoNSIdERAÇõES FINAIS
Em suma, pode-se fixar os fundamentos de um verdadeiro programa de pesquisa educacional, no quadro atual das políticas educacionais, na investigação que recoloca como objeto, simultanea-mente, a escola e sua avaliação como unidades que, sem transformá-las em práticas autônomas ou subsumidas, sejam tomadas em sua concretude. Isso, ademais de contribuir no enfrentamento e superação de impasses da pesquisa educacional, permitiria que avançássemos para estabelecimen-tos referenciais nas análises da prática escolar, pela incorporação de resultados de avaliações exter-nas e, ao mesmo tempo, desprovendo essas avaliações de sua aura mistificadora de tudo explicar. Desse modo, preserva-se o caráter inferencial, e portanto aproximativo, dos conhecimentos advin-dos desses resultados, e os mesmos não são tomados como adversos ou desconectados dos proces-sos nos quais se ancoram.
Restituir ou reafirmar a busca da concretude dos fenômenos, no caso a escola e sua avaliação, é dar um sentido investigativo que realça o conjunto de variáveis que as perpassa. Mais do que sustentar que “à política o que é da política” e em defesa de uma ciência suficientemente autocrítica, trata--se de sublinhar que simplificações no terreno da ciência costumam irmaná-la, empobrecida, com o senso comum, e no terreno da política, pela via da ingenuidade ou do apoliticismo, condená-la à impotência, explicativa e efetiva, frente à realidade que elege como objeto.
REFERêNCIAS BIBLIoGRÁFICAS
AzANhA, josé Mário Pires. uma idéia de pesquisa educacional. Campi, 6. São Paulo: Edusp, 1992.
BRANDÃO, Carlos Rodrigues. o que é educação. 53. reimpr. Primeiros Passos, 20. São Paulo: Brasiliense, 2010.
BURKE, Peter. uma história social do conhecimento: de gutenberg a diderot. Trad. Plínio Dentzien. Rio de janeiro: jorge zahar, 2003.
COhEN, Louis; MANION, Lawrence; MORRISON, Keith. research methods in education. 6. ed. Londres: Routledge, 2007.
CURY, Carlos Roberto jamil. educação e contradição: elementos metodológicos para uma teoria crítica do fenô-meno educativo. São Paulo: Cortez / Autores Associados, 1985.
FERNANDES, Florestan. A educação como problema social. In: . Florestan Fernandes: leituras e legados. Apres. Maria Arminda do Nascimento Arruda. São Paulo: Global, 2010. pp. 243-254.
FERNANDES, Reynaldo. Índice de desenvolvimento da educação Básica (ideb). Série Documental. Textos para Discussão, 26. Brasília: Instituto Nacional de Estudos e Pesquisas Educacionais Anísio Teixeira (Inep), 2007.
FERRARE, joseph j. A pesquisa educacional crítica pode ser ‘quantitativa’? In: APPLE, Michael W.; AU, Wayne; GANDIN, Luís Armando. educação crítica: análise internacional. Trad. Vinicius Figueira. Porto Alegre: Artmed, 2011. pp. 512-529.
GATTI, Bernardete Angelina. A construção da pesquisa em educação no Brasil. Série Pesquisa, v. 1. Brasília: Líber Livro, 2007.
GIBSON, Will; BROWN, Andrew. Teoria, grounded theory e análise qualitativa. Trad. Verônica van Wilpe. In: BOURGUIGNON, jussara Ayres (org.). Pesquisa social: reflexões teóricas e metodológicas. Ponta Grossa: Todapalavra, 2009. pp. 35-62.

2010 Pesquisa TIC EducaçãoARTIGOS 85
PO
RTu
Gu
ÊS
MADAUS, G. F. The Influence of Testing on the Curriculum. In: TANNER, L. N. (org.). critical issues in curriculum. Eighty-seventh Yearbook of the National Society for the Study of Education. Chicago: University of Chicago Press, 1988. pp. 83-121.
MARShALL, Thomas humphrey. cidadania, classe social e status. Biblioteca de Ciências Sociais. Trad. Meton Porto Gadelha. Rio de janeiro: zahar, 1967.
MARX, Karl. A contribution to the critique of Political economy. Trad. S. W. Ryazanskaya. Org. e intr. Maurice Dobb. Moscou: Progress, 1970.
. crítica da filosofia do direito de hegel. Trad. Rubens Enderle e Leonardo de Deus. São Paulo: Boitempo, 2005.
NEVO, David. Evaluation in Education. In: ShAW, Ian F.; GREENE, jennifer C.; MARK, Malvin M. (org.). handbook of evaluation. Londres: Sage, 2006. pp. 441-460.
ORLANDI, Luiz Benedicto Lacerda. O problema da pesquisa em educação e algumas de suas implicações. educação hoje, São Paulo, no 2, pp. 7-25, 1969.
PAES, josé Paulo. gregos & baianos: ensaios. São Paulo: Brasiliense, 1985.
PALUMBO, Dennis j. Public Policy in America: government in Action. 2. ed. Fort Worth: harcourt Brace College, 1994.
PEARL, judea. causality: models, reasoning and inference. 2. ed. Nova Iorque: Cambridge University Press, 2009.
ShADISh, William R.; COOK, Thomas D.; CAMPBELL, Donald T. experimental and quasi-experimental designs for generalized causal inference. Belmont: Wadsworth / Cengage Learning, 2002.
SECChIN, Antônio Carlos. Poesia e desordem. Poesia Sempre, Rio de janeiro, 1(1), pp. 215-217, jan. 1993.
SOUSA, Sandra Maria zákia Lian. Avaliação escolar e democratização: o direito de errar. In: AQUINO, julio Groppa (org.). erro e fracasso na escola: alternativas teóricas e práticas. São Paulo: Summus, 1997a. pp. 125-139.
. Avaliação do rendimento escolar como instrumento de gestão educacional. In: OLIVEIRA, Dalila Andrade (org.). gestão democrática da educação: desafios contemporâneos. Petrópolis: Vozes, 1997b. pp. 264-283.
WEISS, Carol hirschon. Pesquisa avaliativa no contexto político. Trad. Yara Marques. In: GOLDBERG, Maria Amélia Azevedo; SOUzA, Clarilza Prado de (org.). Avaliação de programas educacionais: vicissitudes, contro-vérsias e desafios. São Paulo: EPU, 1982. pp. 23-27.
. Evaluation Research in the Political Context: Sixteen Years and Four Administrations Later. In: MCLAUGhLIN, Milbrey W.; PhILLIPS, D. C. (org.). evaluation and education: at quarter century. Ninetieth Yearbook of the National Society for the Study of Education. Part II. Chicago: National Society for the Study of Education, 1991. pp. 211-231.
. evaluation: methods for Studying Programs and Policies. 2. ed. Upper Saddle River: Prentice-hall, 1997.

2Tic educação

2010 Pesquisa TIC EducaçãoTIC EDuCAÇÃO – RELATÓRIO METODOLÓGICO 89
PO
RTu
Gu
ÊSRELATóRIo mETodoLóGICo
TIC EdUCAÇÃo 2010
INTRodUÇÃo
O Centro de Estudos sobre as Tecnologias da Informação e da Comunicação (Cetic.br), do Núcleo de Informação e Coordenação do Ponto BR (NIC.br) – braço executivo do Comitê Gestor da Internet no Brasil (CGI.br) –, inclui, a partir de 2010, a pesquisa TIC Educação entre seus projetos sobre o uso das tecnologias de informação e comunicação (TIC) no país.
A metodologia da pesquisa utilizou referências internacionais e contou com o suporte de órgãos renomados como a IEA (International Association for the Evaluation of Educational Achievement).
A pesquisa buscou identificar os usos e apropriações das TIC nas escolas públicas por meio da prá-tica pedagógica e da gestão escolar, e assim acompanhar possíveis mudanças na dinâmica escolar provenientes desses usos.
ASPECToS mETodoLóGICoS
dATA dE REFERêNCIA
A pesquisa foi realizada entre os meses de agosto e novembro de 2010.
PoPULAÇÃo-ALvo E UNIdAdE AmoSTRAL
A população-alvo do estudo são professores, alunos, coordenadores pedagógicos e diretores de escolas públicas do Brasil, estaduais ou municipais, de áreas metropolitanas, que oferecem as seguintes modalidades de educação: Ensino Fundamental I, Ensino Fundamental II e Ensino Médio.
Cada escola é tratada como um conglomerado composto de professores, alunos, diretores e coor-denadores pedagógicos, os atores considerados relevantes para a pesquisa. Dessa forma, conside-ra-se como unidade amostral primária o estabelecimento escolar.

Pesquisa TIC Educação 2010TIC EDuCAÇÃO – RELATÓRIO METODOLÓGICO 90
PO
RTu
Gu
ÊS
CAdASTRoS UTILIzAdoS E UNIdAdES INFoRmANTES
O cadastro utilizado para a seleção das escolas foi o Censo Escolar da Educação Básica 2007, rea-lizado pelo Inep (Instituto Nacional de Estudos e Pesquisas Educacionais Anísio Teixeira). Em cada estabelecimento escolar, buscou-se selecionar um diretor, um coordenador pedagógico, dois pro-fessores de português, dois de matemática e dez alunos. Tanto os estudantes quanto os professo-res selecionados são pertencentes aos seguintes níveis de ensino: 5o ano do Ensino Fundamental I (antiga 4a série), 9o ano do Ensino Fundamental II (antiga 8a série) e 2o ano do Ensino Médio. Considerando os respondentes da pesquisa, a TIC Educação teve seu foco voltado para o professor.
PERFIS dE ANÁLISE
Para atingir os objetivos, a pesquisa abordou os seguintes temas com focos específicos:
A. Escolas: perfil em termos de infraestrutura e práticas com TIC nos estabelecimentos públi-cos de ensino;
B. Professores: perfil, estágio da carreira e dedicação ao ensino; habilidade e capacitação no uso de TIC; emprego de TIC nas atividades escolares e barreiras para seu avanço;
C. Alunos: perfil e habilidades no uso de TIC; capacitação no uso de TIC; atividades com Internet realizadas na escola;
D. Diretores: perfil; uso de TIC nas atividades administrativas e de gestão, inclusive na intera-ção com a comunidade.
E. Coordenadores pedagógicos: perfil; uso de TIC nas atividades administrativas e de gestão, inclusive na interação com a comunidade.
Para esses temas, os resultados permitem leitura para as seguintes variáveis:
Região: referente à divisão regional do Brasil em macrorregiões, segundo critérios do IBGE. Para fins de representatividade, as regiões Centro-Oeste e Norte foram agrupadas para amostragem e análise.
Dependência administrativa: referente ao âmbito de subordinação administrativa, que pode ser municipal ou estadual.
Série: trata-se da classificação dos diferentes níveis do processo educacional. Três séries foram investigadas nesta pesquisa, e cada uma retrata um nível de ensino a ser abordado pela pesquisa: Ensino Fundamental I (4a série/5o ano), Ensino Fundamental II (8a série / 9o ano) e Ensino Médio (2o ano).
Computador instalado no laboratório de informática: presença de computador no laboratório de informática de cada escola, variável coletada por meio da resposta do diretor da escola.
Internet instalada no laboratório de informática: acesso à Internet no computador instalado no labo-ratório de informática de cada escola, variável coletada por meio da resposta do diretor do colégio.

2010 Pesquisa TIC EducaçãoTIC EDuCAÇÃO – RELATÓRIO METODOLÓGICO 91
PO
RTu
Gu
ÊS
Renda familiar: referente à renda domiciliar, ou seja, a soma da renda mensal de todos os membros do domicílio do respondente.
Renda individual: referente ao salário mensal total do respondente.
Para fins de divulgação, foram estabelecidas três faixas de renda. Vale ressaltar que não foram inves-tigadas as rendas, familiar e individual, dos alunos.
INFoRmAÇõES SoBRE o qUESTIoNÁRIo
Foram conduzidas entrevistas com questionários estruturados para cada um dos quatro públicos.
O instrumento de coleta de dados para professores e alunos teve duração de aproximadamente vin-te minutos. Para diretores e coordenadores pedagógicos durou cerca de trinta minutos. Cada ques-tionário é composto pelos módulos detalhados a seguir.
O módulo A apresenta perguntas referentes aos aspectos pessoais de cada um dos atores. Com exceção do aluno, para os outros perfis são levantados aspectos profissionais e acadêmicos. Além disso, para o diretor são feitas perguntas sobre aspectos gerais da infraestrutura escolar. Dessa for-ma, obtêm-se os dados básicos da escola.
O módulo B traça o perfil dos atores escolares como usuários de TIC, buscando identificar as con-dições de posse e uso do computador e da Internet. Observando o tipo de computador, a mobili-dade, a portabilidade e a periodicidade de uso, indaga-se sobre a posição do aluno, do professor, do coordenador e do diretor na inclusão digital. Exceto para os alunos, investigam-se as fontes de recursos para aquisição de computadores, com o propósito de identificar a existência e a utilização dos programas oferecidos pelo governo.
Para alunos e professores, o módulo C capta a percepção sobre habilidades pessoais em realizar atividades por meio do computador e da Internet. já para coordenadores pedagógicos e diretores, esse módulo refere-se à utilização das TIC para atividades administrativas e planejamento organi-zacional e pedagógico da escola.
As barreiras de uso foram investigadas nos módulos D para coordenador pedagógico, E para diretor e F para professor, com o intuito de compreender fatores que se configuram como limitações para a integração das TIC na escola.
O módulo D para aluno e professor trata da capacitação específica, buscando compreender a origem do aprendizado, principalmente do uso de computador e Internet, além de identificar a existência e a utilização dos programas do governo. No caso dos diretores, esse módulo investiga a existência e as condições dos equipamentos e recursos das TIC nas escolas.
As atividades em âmbito educacional e escolar são levantadas no módulo E para aluno e professor. Em relação ao aluno, explora-se o universo das atividades realizadas em sala de aula e in vestiga-se se o aluno utiliza os recursos tecnológicos oferecidos pela escola como recurso de aprendizagem. já em relação aos professores, busca-se compreender o universo das atividades escolares e sua per-cepção em relação aos objetivos pedagógicos, prática docente, método de avaliação e o suporte ao uso das TIC.

Pesquisa TIC Educação 2010TIC EDuCAÇÃO – RELATÓRIO METODOLÓGICO 92
PO
RTu
Gu
ÊS
PLANo AmoSTRAL
Com o objetivo de levantar informações sobre o uso das TIC na educação pública brasileira, a pes-quisa TIC Educação 2010 considerou os dados do Censo Escolar 2007 (Inep / Ideb) para o plano amostral. Uma amostra de 500 escolas foi desenhada pelo Ibope Inteligência, que também teve a responsabilidade de coletar dados e calcular os resultados.
A amostra é probabilística, estratificada por conglomerados e selecionada por estágios. A seleção foi realizada pelo método PPT (probabilidade proporcional ao tamanho), com base no número de matrículas do Censo Escolar 2007. Foram respeitadas as proporções das escolas por dependência administrativa (municipal e estadual) e nível de ensino (Fundamental, Médio e ambos). No caso de regiões (Nordeste, Sudeste, Sul e Norte / Centro-Oeste), a amostra é desproporcional, mas foi pos-teriormente ponderada.
Desta forma, o plano amostral permite um levantamento de informações das escolas públicas muni-cipais e estaduais brasileiras. As escolas federais foram desconsideradas por terem comportamen-to singular.
Cada unidade amostral sorteada (estabelecimento escolar) foi considerada um conglomerado, e nessas unidades até duas turmas foram sorteadas com base no número de matrículas por escola e por série. A seleção dos alunos foi realizada no momento da entrevista. Em geral, para cada turma foram entrevistados 5 alunos, exceto quando na escola havia apenas uma turma para a série defini-da, caso em que 10 alunos foram selecionados para entrevista.
A principal diferença da amostra da TIC Educação em relação à amostra utilizada pelo Saeb (Sistema Nacional de Avaliação da Educação Básica) é o critério de definição do porte das escolas. Para o Saeb, o porte da escola é definido pelo número de turmas existentes, enquanto a TIC Educação uti-liza como critério o número de matrículas na escola.
Foram gerados 24 estratos a partir do cruzamento entre região, dependência administrativa e nível de ensino, sendo criada uma lista de escolas para cada um desses estratos. Nas listas, as escolas foram ordenadas de forma decrescente pelo total de matrículas, de modo a garantir uma boa distri-buição entre os variados tamanhos de estabelecimento. A primeira escola de cada estrato foi selecio-nada por meio de um salto inicial aleatório, multiplicado por um intervalo com base na razão entre o número total de alunos e o número de escolas a serem sorteadas no estrato. Para as demais esco-las, foi utilizado sistematicamente o intervalo. A quantidade de escolas sorteadas em cada estrato foi proporcional ao tamanho do universo.
Em um segundo estágio, foram selecionadas as turmas a partir da definição de uma série para cada unidade amostral sorteada (estabelecimento escolar).
Caso a escola tenha sido selecionada para entrevistas em uma única série, poderia ocorrer a seleção de uma ou duas turmas. Dessa forma, nas escolas que continham apenas uma turma da série sele-cionada, as dez entrevistas foram realizadas com alunos dessa turma. Em escolas com duas turmas da série selecionada, entrevistaram-se cinco alunos de cada turma. No caso de escolas com mais de duas turmas na referida série, foram entrevistados alunos do período que concentra o maior núme-ro de turmas, sendo cinco entrevistas na primeira (turma A ou a primeira letra do período) e outras cinco na última turma listada pela escola.
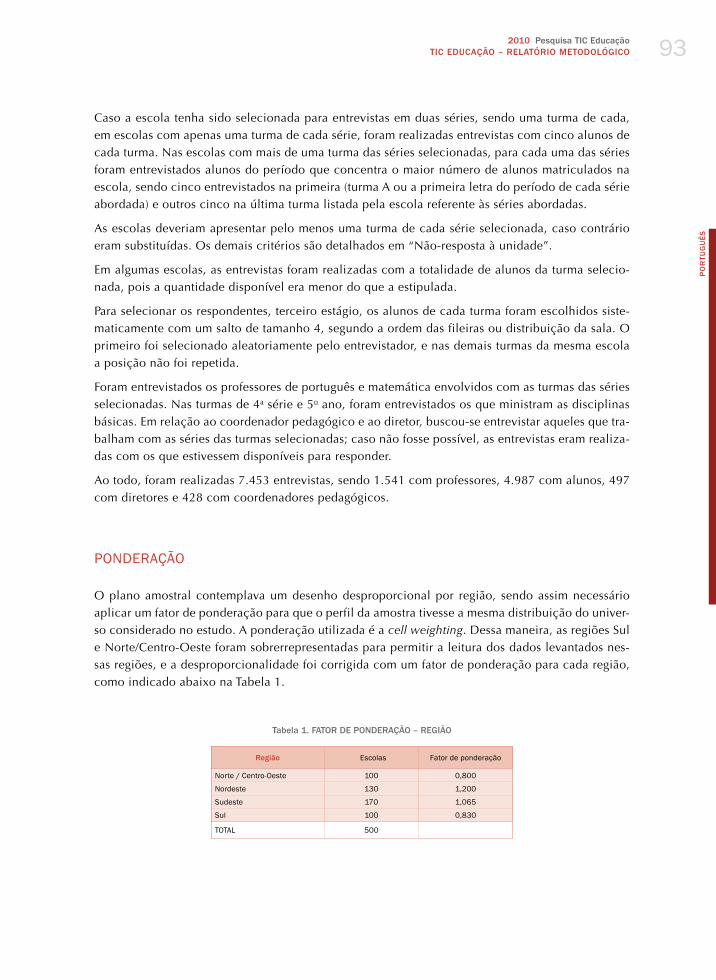
2010 Pesquisa TIC EducaçãoTIC EDuCAÇÃO – RELATÓRIO METODOLÓGICO 93
PO
RTu
Gu
ÊS
Caso a escola tenha sido selecionada para entrevistas em duas séries, sendo uma turma de cada, em escolas com apenas uma turma de cada série, foram realizadas entrevistas com cinco alunos de cada turma. Nas escolas com mais de uma turma das séries selecionadas, para cada uma das séries foram entrevistados alunos do período que concentra o maior número de alunos matriculados na escola, sendo cinco entrevistados na primeira (turma A ou a primeira letra do período de cada série abordada) e outros cinco na última turma listada pela escola referente às séries abordadas.
As escolas deveriam apresentar pelo menos uma turma de cada série selecionada, caso contrário eram substituídas. Os demais critérios são detalhados em “Não-resposta à unidade”.
Em algumas escolas, as entrevistas foram realizadas com a totalidade de alunos da turma selecio-nada, pois a quantidade disponível era menor do que a estipulada.
Para selecionar os respondentes, terceiro estágio, os alunos de cada turma foram escolhidos siste-maticamente com um salto de tamanho 4, segundo a ordem das fileiras ou distribuição da sala. O primeiro foi selecionado aleatoriamente pelo entrevistador, e nas demais turmas da mesma escola a posição não foi repetida.
Foram entrevistados os professores de português e matemática envolvidos com as turmas das séries selecionadas. Nas turmas de 4a série e 5o ano, foram entrevistados os que ministram as disciplinas básicas. Em relação ao coordenador pedagógico e ao diretor, buscou-se entrevistar aqueles que tra-balham com as séries das turmas selecionadas; caso não fosse possível, as entrevistas eram realiza-das com os que estivessem disponíveis para responder.
Ao todo, foram realizadas 7.453 entrevistas, sendo 1.541 com professores, 4.987 com alunos, 497 com diretores e 428 com coordenadores pedagógicos.
PoNdERAÇÃo
O plano amostral contemplava um desenho desproporcional por região, sendo assim necessário aplicar um fator de ponderação para que o perfil da amostra tivesse a mesma distribuição do univer-so considerado no estudo. A ponderação utilizada é a cell weighting. Dessa maneira, as re giões Sul e Norte/Centro-Oeste foram sobrerrepresentadas para permitir a leitura dos dados levantados nes-sas regiões, e a desproporcionalidade foi corrigida com um fator de ponderação para cada região, como indicado abaixo na Tabela 1.
Tabela 1. FATOR DE PONDERAÇÃO – REGIÃO
Região Escolas Fator de ponderação
Norte / Centro-oeste 100 0,800
Nordeste 130 1,200
Sudeste 170 1,065
Sul 100 0,830
ToTAL 500

Pesquisa TIC Educação 2010TIC EDuCAÇÃO – RELATÓRIO METODOLÓGICO 94
PO
RTu
Gu
ÊS
PRECISÃo dA AmoSTRA
As medidas de erro amostral relativas à mensuração dos indicadores da pesquisa TIC Educação foram planejadas considerando-se um intervalo de confiança estimado de 95%. A margem de erro máxima estipulada é de 2 pontos percentuais para mais ou para menos sobre os resultados encon-trados no total da amostra.
As margens de erro apresentadas nas Tabelas 2, 3 e 4 foram calculadas sobre um nível de 95% de confiança, supondo a ocorrência de cenários de maior variabilidade para as variáveis de cruzamen-to. A título de informação, a maior variabilidade ocorre quando uma dada proporção populacional assume o valor de 50% (P = 0,5).
Tabela 2. MARGEM DE ERRO – DEPENDÊNCIA ADMINISTRATIvA
Dependência administrativa Escolas margem de erro
Estadual 221 7
municipal 279 6
ToTAL 500 4
Tabela 3. MARGEM DE ERRO – REGIÃO
Região Escolas margem de erro
Norte / Centro-oeste 100 10
Nordeste 130 9
Sudeste 170 8
Sul 100 10
ToTAL 500 4
Tabela 4. MARGEM DE ERRO – SéRIE
Série Turmas margem de erro
Ensino Fundamental I – 4a série e 5o ano 376 5
Ensino Fundamental II – 8a série e 9o ano 328 5
Ensino médio – 2a série 296 6
ToTAL 1000 3
Arredondamentos fazem com que, em alguns resultados, a soma das categorias parciais supere 100% em questões de resposta única. O somatório de frequências em questões de resposta múlti-pla usualmente ultrapassa 100%.
TRATAmENTo dA NÃo-RESPoSTA
Na pesquisa TIC Educação, o tratamento da não-reposta é feito em dois níveis: a não-resposta à uni-dade e a não-resposta ao item, conforme é detalhado a seguir.
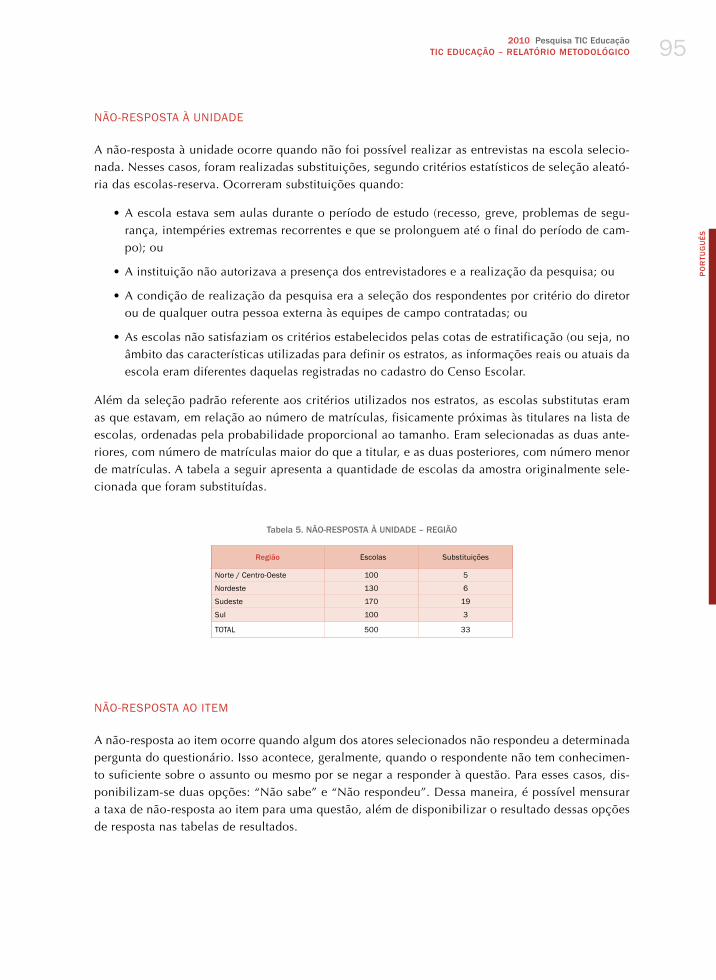
2010 Pesquisa TIC EducaçãoTIC EDuCAÇÃO – RELATÓRIO METODOLÓGICO 95
PO
RTu
Gu
ÊS
NÃo-RESPoSTA à UNIdAdE
A não-resposta à unidade ocorre quando não foi possível realizar as entrevistas na escola selecio-nada. Nesses casos, foram realizadas substituições, segundo critérios estatísticos de seleção aleató-ria das escolas-reserva. Ocorreram substituições quando:
•A escola estava sem aulas durante o período de estudo (recesso, greve, problemas de segu-rança, intempéries extremas recorrentes e que se prolonguem até o final do período de cam-po); ou
•A instituição não autorizava a presença dos entrevistadores e a realização da pesquisa; ou
•A condição de realização da pesquisa era a seleção dos respondentes por critério do diretor ou de qualquer outra pessoa externa às equipes de campo contratadas; ou
•As escolas não satisfaziam os critérios estabelecidos pelas cotas de estratificação (ou seja, no âmbito das características utilizadas para definir os estratos, as informações reais ou atuais da escola eram diferentes daquelas registradas no cadastro do Censo Escolar.
Além da seleção padrão referente aos critérios utilizados nos estratos, as escolas substitutas eram as que estavam, em relação ao número de matrículas, fisicamente próximas às titulares na lista de escolas, ordenadas pela probabilidade proporcional ao tamanho. Eram selecionadas as duas ante-riores, com número de matrículas maior do que a titular, e as duas posteriores, com número menor de matrículas. A tabela a seguir apresenta a quantidade de escolas da amostra originalmente sele-cionada que foram substituídas.
Tabela 5. NÃO-RESPOSTA à uNIDADE – REGIÃO
Região Escolas Substituições
Norte / Centro-oeste 100 5
Nordeste 130 6
Sudeste 170 19
Sul 100 3
ToTAL 500 33
NÃo-RESPoSTA Ao ITEm
A não-resposta ao item ocorre quando algum dos atores selecionados não respondeu a determinada pergunta do questionário. Isso acontece, geralmente, quando o respondente não tem conhecimen-to suficiente sobre o assunto ou mesmo por se negar a responder à questão. Para esses casos, dis-ponibilizam-se duas opções: “Não sabe” e “Não respondeu”. Dessa maneira, é possível mensurar a taxa de não-resposta ao item para uma questão, além de disponibilizar o resultado dessas opções de resposta nas tabelas de resultados.

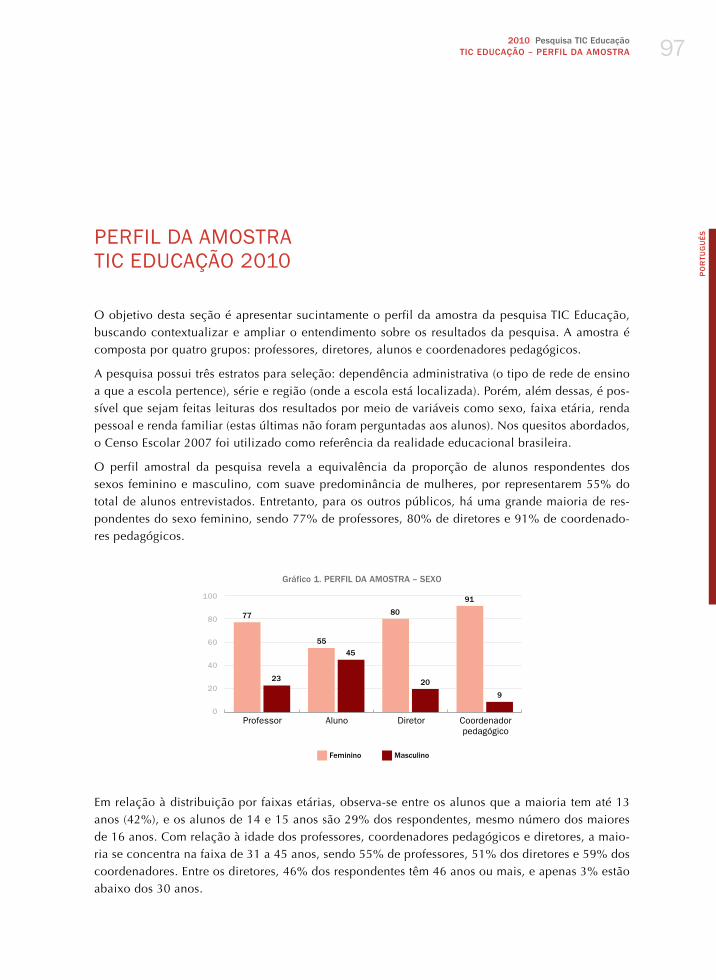
2010 Pesquisa TIC EducaçãoTIC EDuCAÇÃO – PERFIL DA AMOSTRA 97
PO
RTu
Gu
ÊSPERFIL dA AmoSTRA
TIC EdUCAÇÃo 2010
O objetivo desta seção é apresentar sucintamente o perfil da amostra da pesquisa TIC Educação, buscando contextualizar e ampliar o entendimento sobre os resultados da pesquisa. A amostra é composta por quatro grupos: professores, diretores, alunos e coordenadores pedagógicos.
A pesquisa possui três estratos para seleção: dependência administrativa (o tipo de rede de ensino a que a escola pertence), série e região (onde a escola está localizada). Porém, além dessas, é pos-sível que sejam feitas leituras dos resultados por meio de variáveis como sexo, faixa etária, renda pessoal e renda familiar (estas últimas não foram perguntadas aos alunos). Nos quesitos abordados, o Censo Escolar 2007 foi utilizado como referência da realidade educacional brasileira.
O perfil amostral da pesquisa revela a equivalência da proporção de alunos respondentes dos sexos feminino e masculino, com suave predominância de mulheres, por representarem 55% do total de alunos entrevistados. Entretanto, para os outros públicos, há uma grande maioria de res-pondentes do sexo feminino, sendo 77% de professores, 80% de diretores e 91% de coordenado-res pedagógicos.
Gráfico 1. PERFIL DA AMOSTRA – SExO
Professor Aluno Diretor Coordenadorpedagógico
77
23
45
80
20
91
9
Feminino Masculino
55
0
20
40
60
80
100
Em relação à distribuição por faixas etárias, observa-se entre os alunos que a maioria tem até 13 anos (42%), e os alunos de 14 e 15 anos são 29% dos respondentes, mesmo número dos maiores de 16 anos. Com relação à idade dos professores, coordenadores pedagógicos e diretores, a maio-ria se concentra na faixa de 31 a 45 anos, sendo 55% de professores, 51% dos diretores e 59% dos coordenadores. Entre os diretores, 46% dos respondentes têm 46 anos ou mais, e apenas 3% estão abaixo dos 30 anos.
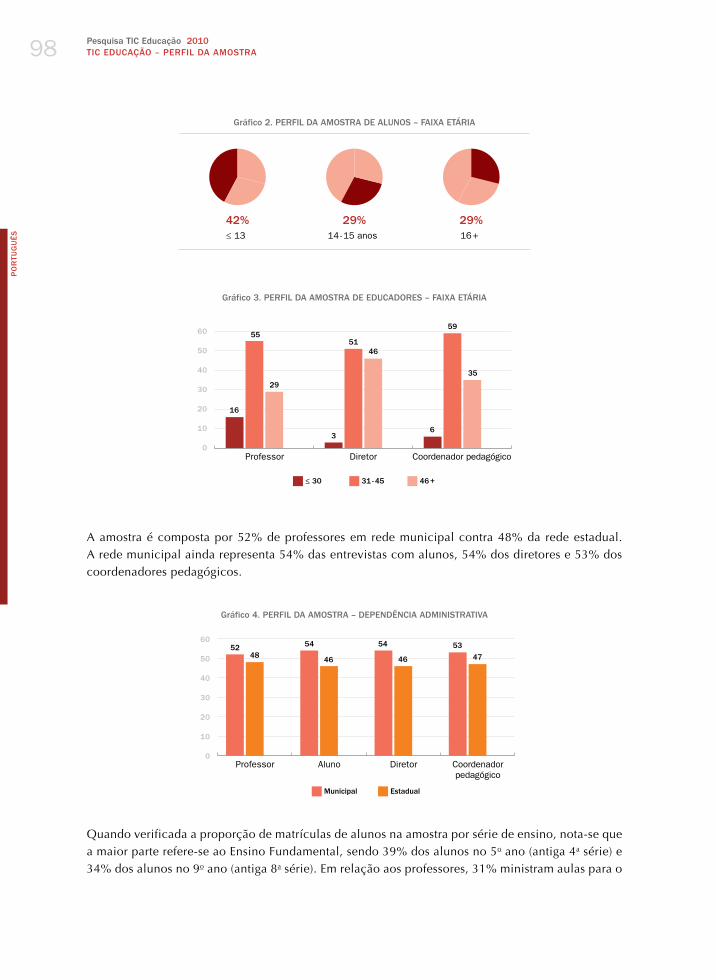
Pesquisa TIC Educação 2010TIC EDuCAÇÃO – PERFIL DA AMOSTRA 98
PO
RTu
Gu
ÊS
Gráfico 2. PERFIL DA AMOSTRA DE ALuNOS – FAIxA ETÁRIA
42% 29% 29%≤ 13 14 - 15 anos 16 +
Gráfico 3. PERFIL DA AMOSTRA DE EDuCADORES – FAIxA ETÁRIA
0
10
20
30
40
50
60
Professor Diretor Coordenador pedagógico
≤ 30 31 - 45 46 +
16
55
29
51
3
46
59
35
6
A amostra é composta por 52% de professores em rede municipal contra 48% da rede estadual. A rede municipal ainda representa 54% das entrevistas com alunos, 54% dos diretores e 53% dos coordenadores pedagógicos.
Gráfico 4. PERFIL DA AMOSTRA – DEPENDÊNCIA ADMINISTRATIvA
Professor Aluno Diretor Coordenador pedagógico
52 54 54 53
Municipal Estadual
0
10
20
30
40
50
60
48 46 46 47
Quando verificada a proporção de matrículas de alunos na amostra por série de ensino, nota-se que a maior parte refere-se ao Ensino Fundamental, sendo 39% dos alunos no 5o ano (antiga 4a série) e 34% dos alunos no 9o ano (antiga 8a série). Em relação aos professores, 31% ministram aulas para o

2010 Pesquisa TIC EducaçãoTIC EDuCAÇÃO – PERFIL DA AMOSTRA 99
PO
RTu
Gu
ÊS
Ensino Médio, 42% para o 5o ano e 40% para o 9o ano do Ensino Fundamental. As somas ultrapas-sam 100%, porque há escolas com mais de uma série.
Gráfico 5. PERFIL DA AMOSTRA – SéRIE
Professor Aluno Diretor Coordenador pedagógico
4239
42 42
5o ano do EF 9
o ano do EF 2o ano do EM
0
10
20
30
40
50
40
3134
39
30
39
3027
Devido à extensão territorial e à diversidade cultural do Brasil, fez-se necessária a leitura dos indi-cadores por região. Dessa forma, em relação à distribuição das escolas, a maior concentração da amostra se dá na região Sudeste, sendo 39% dos coordenadores pedagógicos e 36% dos demais atores, e a menor participação na região Sul, com parcela entre 15 % e 18 %, que condiz com os resultados obtidos no Censo Escolar de 2007.
Gráfico 6. PERFIL DA AMOSTRA – REGIÃO
Professor Aluno Diretor Coordenador pedagógico
18
31
36
15 16
31
36
17 16
31
36
17 18
25
39
18
Norte / Centro-Oeste Nordeste Sudeste Sul
0
10
20
30
40
A renda familiar predominante é de mais de 5 SM para os públicos entrevistados, sendo 75% dos dire-tores, 64% dos coordenadores pedagógicos e 52% dos professores, seguida pela faixa de mais de 3 até 5 SM. Destaca-se que, na renda pessoal, 41% dos diretores permanecem na faixa de mais de 5 SM, e 40% na faixa de mais de 3 até 5 SM, enquanto, entre os professores, apenas 20% estão na faixa de mais de 5 SM, e 42% recebem até 3 SM.

Pesquisa TIC Educação 2010TIC EDuCAÇÃO – PERFIL DA AMOSTRA 100
PO
RTu
Gu
ÊS
Gráfico 7. PERFIL DA AMOSTRA DE EDuCADORES – RENDA FAMILIAR
Professor Diretor Coordenadorpedagógico
30
52
26
75
1
8
28
64
Até 3 SM Mais de 3 até 5 SM Mais de 5 SM Recusa
0
20
40
60
80
1816
Gráfico 8. PERFIL DA AMOSTRA DE EDuCADORES – RENDA PESSOAL
Professor Diretor Coordenador
37
20
1
18
41
1
33
40
27
Até 3 SM Mais de 3 até 5 SM Mais de 5 SM Recusa
0
10
20
30
50
4040
42

2010 Pesquisa TIC EducaçãoTIC EDuCAÇÃO – ANÁLISE DOS RESuLTADOS 101
PO
RTu
Gu
ÊSANÁLISE doS RESULTAdoS
TIC EdUCAÇÃo 2010
APRESENTAÇÃo
O Centro de Estudos sobre as Tecnologias da Informação e da Comunicação (Cetic.br), do Núcleo de Informação e Coordenação do Ponto BR (NIC.br) – braço executivo do Comitê Gestor da Internet no Brasil (CGI.br) –, coordena a realização da pesquisa sobre o uso das tecnologias de informação e comunicação no Brasil, sendo que TIC Domicílios e Empresas ocorre desde 2005. Em 2010, foi lan-çada a pesquisa TIC Educação, que, em seus componentes de levantamento quantitativo junto a esco-las públicas e análise em profundidade de um conjunto de algumas delas, contribui para consolidar o Cetic.br como referência na produção de estatísticas e análise sobre posse e uso das TIC no país.
A pesquisa TIC Educação tem como objetivo principal identificar usos e apropriações da Internet de banda larga na rotina de escolas públicas, tanto na gestão administrativa quanto, principalmen-te, na prática pedagógica. A coleta de dados do levantamento quantitativo da pesquisa ocorreu no período compreendido entre os meses de agosto e novembro, cobrindo uma amostra de 500 esco-las públicas de áreas urbanas em todo o território nacional, onde foram entrevistados 1.541 profes-sores, 4.987 alunos, 497 diretores e 428 coordenadores pedagógicos.
A TIC Educação 2010 adapta alguns dos indicadores do estudo “SITES 2006: Second Information Technology in Education Study 2006”, da IEA (International Association for the Evaluation of Educational Achievement – Associação Internacional para a Avaliação das Conquistas Educacionais). Além disso, a pesquisa possui indicadores desenvolvidos para atender a temas específicos da reali-dade brasileira. A amostra da pesquisa foi desenhada pelo Ibope Inteligência, responsável também pela coleta dos dados e o cálculo dos resultados.
As medidas de erro amostral relativas à mensuração dos indicadores da pesquisa TIC Educação 2010 foram planejadas considerando-se um intervalo de confiança estimado de 95%. A margem de erro máxima estipulada é de 2 pontos percentuais para mais ou para menos sobre os resultados encontrados no total da amostra.
INTRodUÇÃo
Quando os primeiros computadores começaram a ser instalados nas escolas de vários países, na década de 1970, começou-se a fazer referência a eles e a seus usos como “computadores na educa-ção”. Acompanhando os computadores, chegaram às escolas os periféricos, ou seja, as impressoras,
Pesquisa TIC Educação 2010TIC EDuCAÇÃO – ANÁLISE DOS RESuLTADOS102
PO
RTu
Gu
ÊS
drivers externos, scanners e as primeiras câmeras fotográficas digitais. O conjunto composto por todos esses equipamentos passou a ser identificado como tecnologia de informação, ou TI. Quando a Internet chegou às escolas, junto com computadores em rede, a World Wide Web, o e-mail e as ferramentas de busca, uma nova expressão foi cunhada: TIC, as iniciais de “tecnologias de informa-ção e comunicação”, referente à pluralidade de tecnologias (equipamentos e funções) que permi-tem criar, capturar, interpretar, armazenar, receber e transmitir informações.1
Em todo o mundo, a inserção das TIC nas escolas tem provocado, em pouco tempo, efeitos marcan-tes no ensino e na aprendizagem. No nível institucional, as escolas têm utilizado computadores e softwares para tarefas administrativas de caráter mais geral, como contabilidade, controle de mate-rial, comunicação, preparação de documentos e sua impressão, além de programas específicos à gestão escolar, como elaboração de horários, relatórios eletrônicos, monitoramento de frequência, registro de avaliações, gestão de bibliotecas e elaboração de perfil de alunos.
No nível instrucional, o uso das TIC em atividades de sala de aula, auditórios e laboratórios em vários países está sendo acompanhado por mudanças no modo como os professores ensinam e os alunos aprendem. já se pode observar que as inovações tecnológicas na escola e na sala de aula estão sendo acompanhadas pela transformação do papel do professor, que passa de transmissor de conhecimento, fonte primária de informação, controlador e direcionador de todos os aspectos da aprendizagem para facilitador da aprendizagem, colaborador, coach, orientador do conhecimento e coaprendiz, propiciando aos alunos maiores opções e responsabilidades em seu próprio proces-so de aprendizagem.
Essa mudança no papel do professor é muito bem resumida da seguinte forma: ele deixa de ser “o sábio no palco” para tornar-se “o guia ao lado”, ou o maestro que procura trazer à tona o melhor desempenho de cada um dos membros da orquestra.
Complementarmente às mudanças no papel do professor, a literatura já registra que as TIC estão também provocando mudanças nos papéis dos estudantes, que passam de recipientes passivos de informação, reprodutores de conhecimento e aprendizes solitários para participantes ativos no pro-cesso de aprendizagem, produtores de conhecimento e aprendizes em colaboração com outros.
Como mostra a evidência de países em estágio mais avançado da integração das TIC no ensino/aprendizagem, estudantes em salas equipadas com as tecnologias são geralmente pesquisadores ativos, buscando na web informações para completar projetos individuais ou em grupo, comuni-cando-se por e-mail, blogs e redes sociais com estudantes de outras escolas e tirando conclusões com base na evidência obtida.2
A adoção das TIC nas escolas é vista, portanto, como capaz de criar as oportunidades – tão espera-das por estudiosos da educação – de transformar as organizações escolares em comunidades capa-zes de aprender, o que requer que docentes, gestores e alunos desenvolvam essa habilidade.
As experiências com uso das TIC nas escolas mostram que o potencial educativo dessas tecno-logias não tem uma orientação pedagógica intrínseca para o construtivismo, podendo também apoiar o desenvolvimento de pedagogias tradicionais. Ao final da década de 2000, parece haver o
1 ANDERSON, jonathan. ict transforming education: a regional guide. Bangkok: Unesco, 2010.2 idem.

2010 Pesquisa TIC EducaçãoTIC EDuCAÇÃO – ANÁLISE DOS RESuLTADOS 103
PO
RTu
Gu
ÊS
re conhecimento na América Latina de inúmeros benefícios que as TIC podem trazer à educação, qualquer que seja o modelo pedagógico dominante.3
A questão central para as políticas públicas de estímulo às inovações tecnológicas na educação é, portanto, saber quando e como essa potencialidade se realiza, isto é, que impacto efetivo as TIC produzem nos resultados educacionais e em que condições isso ocorre. A literatura não é conclu-siva a esse respeito, e tal situação é atribuída, em grande parte, à ausência de indicadores específi-cos e consistentes e de observações sistemáticas sobre a realidade das escolas e de seus processos de ensino/aprendizagem.
A formulação de indicadores nessa área é tarefa espinhosa, dada sua própria complexidade, e com-parações internacionais esbarram na adicional diversidade curricular e de sistemas educacionais. A Unesco está atualmente determinada a contribuir para reduzir essas dificuldades e se empenha no processo de formulação de indicadores internacionalmente comparáveis sobre TIC na educação.4
Confiante em reforçar a contribuição do Brasil para esse esforço global e em consonância com as iniciativas internacionais relativas ao tema, a pesquisa TIC Educação desenvolve seu trabalho tendo como principal objetivo identificar usos e apropriações das tecnologias de informação e comunica-ção em escolas públicas brasileiras focando a gestão escolar e, principalmente, a prática pedagógica.
CoNTExTo dA EdUCAÇÃo BRASILEIRA
Atualmente, de acordo com o Censo Escolar de 2010, há 51,5 milhões de alunos matriculados nas escolas do país. Desses, apenas 15% cursam a Educação Básica em escolas privadas, enquanto a grande maioria, 85%, está matriculada em colégios públicos. Ainda considerando o Ensino Básico, segundo a Sinopse do Professor 2009, do Ministério da Educação, conta-se com quase 2 milhões de docentes empregados. O aluno de escolas públicas e os professores em exercício no Ensino Básico devem ser os atores centrais do desenvolvimento das políticas públicas para a educação no país. E nesse contexto inserem-se as políticas de modernização tecnológica das escolas públicas brasileiras.
já está consolidado o conceito de que a educação é fundamental para a construção e o desenvol-vimento da sociedade. O cenário atual do país demonstra que, embora exista um avanço com rela-ção ao acesso à escola, ainda há um grande desafio para aprimorar a educação.
Desde os anos 1990, praticamente todas as crianças de 6 a 14 anos vêm tendo acesso à esco-la. Em 2009, 97,6% das crianças dessa faixa etária estavam frequentando escolas da Educação Básica. Em relação à faixa etária seguinte, ou seja, crianças de 15 a 17 anos, a proporção de acesso à escola é menor do que o desejado: em 2009, segundo a “Síntese de indicadores sociais 2010”, do IBGE, 85,2% desses jovens frequentavam a escola. Os dados apontam também que,
3 VALDIVIA, Ignacio jara. las políticas de tecnología para escuelas en América latina y el mundo: visiones y lecciones. Santiago: ONU, 2008. p. 18.
4 UNESCO. guide to measuring information and communication technologies (ict) in education. Nova York: Instituto de Estatística da Unesco, 2009

Pesquisa TIC Educação 2010TIC EDuCAÇÃO – ANÁLISE DOS RESuLTADOS104
PO
RTu
Gu
ÊS
para esses adolescentes, há uma alta defasagem em relação à taxa de escolarização líquida, isto é, a proporção de uma população em determinada faixa etária que se encontra no nível de ensi-no adequado a sua idade, embora os índices tenham melhorado entre o fim da década de 1990 e os dias atuais. Em 2009, somente 39,2% dos adolescentes estavam no nível médio, não chegando nem a atingir a proporção de 42,1% da região Sudeste em 1999. Em um nível mais aprofundado desse desafio se encontra a qualidade do ensino e da aprendizagem. A complexidade da questão pode ser avaliada pela meta a ser alcançada pelo Índice de Desenvolvimento da Educação Básica (Ideb)5 em 2021, ano em que as escolas deverão atingir a nota 6,0, comparável a resultados obtidos em países mais desenvolvidos. Pode-se estimar o esforço necessário verificando-se que, em 2009, a média do Ideb para as séries iniciais no país foi de 4,6. Além disso, o índice salienta a disparida-de entre a rede pública e a rede particular de ensino, uma vez que os estabelecimentos particulares atingiram nota 5,9 já em 2005, enquanto nesse mesmo ano a nota para as escolas públicas foi 3,6.
Em comparação com outros países, o Brasil ainda se encontra em posição desvantajosa quanto ao conhecimento atingido por crianças e jovens em idade escolar. Nos levantamentos que o Pisa (Programa Internacional de Avaliação dos Alunos) realizou em 65 países em 2009,6 o país colocou--se na 54a posição em proficiência em leitura dos alunos de 15 anos, índice abaixo da média da OCDE.
Em relação à taxa de abandono, o Brasil apresenta índices altos, tanto no Ensino Fundamental quanto no Ensino Médio, mesmo quando comparado com alguns países da América Latina, como Argentina, Chile, Paraguai, Uruguai e Venezuela.7
Outra dimensão educacional em que o país deverá buscar melhores resultados se refere aos anos de estudo concluídos. Comparado com países do mesmo nível de desenvolvimento econômico e social, o brasileiro de 15 anos apresentava, em 2009, uma média de 7,5 anos de estudo, ou seja, não havia sequer concluído o ensino fundamental obrigatório, direito garantido pela Constituição. Segundo o Eurostat, a proporção de pessoas na faixa etária de 18 a 24 anos com onze anos de estu-do é um indicador essencial para avaliar tanto a eficiência do sistema educacional de um país como sua capacidade de combater a pobreza e diminuir as desigualdades socioeconômicas. Em 2009, a Pnad registrou que apenas 37,9% da população dessa faixa etária tinha completado onze anos de instrução.
A luta pela melhoria da educação no Brasil envolve, necessariamente, a batalha pela redução das disparidades regionais. As estatísticas educacionais do país sugerem intensa desigualdade entre as regiões. Muito já se fez, como apontado acima, mas novos e velhos desafios se desdobram no futuro.
5 O Ideb é calculado a partir de dois componentes: taxa de rendimento escolar (aprovação), obtido a partir do Censo Escolar, e médias de desempenho nos exames padronizados Prova Brasil (para Ideb de escolas municipais) e do Saeb (Ideb dos estabelecimentos estaduais e federais). O índice se baseia nos resultados dos estudantes ao final de cada etapa do Ensino Fundamental (antiga 4a série/atual 5o ano e antiga 8a série/atual 9o ano) e do 3o ano do Ensino Médio, por meio de exames padronizados e da taxa de aprovação correspondente aos estudantes de cada etapa de ensino (investigado pelo Censo Escolar).
6 Disponível em http://browse.oecdbookshop.org/oecd/pdfs/free/9810071e.pdf.7 Indicadores Estadísticos del Sistema Educativo del Mercosur 2008.
2010 Pesquisa TIC EducaçãoTIC EDuCAÇÃO – ANÁLISE DOS RESuLTADOS 105
PO
RTu
Gu
ÊS
EdUCAÇÃo E TECNoLoGIA: PoLíTICAS PúBLICAS No BRASIL
As iniciativas governamentais de incentivo ao uso de tecnologias de informação e comunicação nas escolas públicas brasileiras datam aproximadamente de 1996. Atualmente, as principais ações do governo voltadas para a integração das TIC na educação são as relacionadas a seguir.
Programa Nacional de Informática na Educação (Proinfo)
Desde 1997, o Programa Nacional de Informática na Educação volta-se para a rede pública de ensi-no, tanto no nível fundamental quanto no médio, de todas as unidades da federação. A princípio, as diretrizes do programa desenvolvidas pela Secretaria de Ensino a Distância (SEED), do Ministério da Educação, previam a aquisição de 100 mil computadores e sua instalação nas escolas de acordo com critérios preestabelecidos e em regime de colaboração com os governos estaduais e municipais.
De acordo com o MEC, o programa está em funcionamento em 5.100 municípios e já atingiu, des-de 2004, 64,6 mil estabelecimentos educacionais, 28,3 milhões de alunos e 1,2 milhão de profes-sores. Pelo balanço oficial, nesse período foram adquiridos mais de 100 mil laboratórios de infor-mática, segundo as Diretrizes do Proinfo.
Programa Banda Larga nas Escolas (PNBLE)
O Programa Banda Larga nas Escolas foi lançado em abril de 2008 pelo governo federal e tem como objetivo conectar todas as escolas públicas urbanas à Internet.
O projeto é resultado de uma parceria entre o governo e empresas de telefonia como Oi (Telemar), Telefônica (Telesp), SERCOMTEL e CTBC. O PNBLE estabeleceu como meta levar conexão igual ou superior a 1 Mbps a todas as escolas públicas urbanas (estaduais, municipais e federais) que cons-tam no Censo Escolar.
O programa exige que a instalação seja realizada no laboratório de informática ou outro espaço pedagógico indicado pelos diretores das escolas. O serviço de conexão será mantido de forma gra-tuita até o ano de 2025.
Programa Um Computador Por Aluno (Prouca)
O Programa Um Computador por Aluno tem como objetivo promover a inclusão digital por meio da distribuição de um computador portátil (laptop) para cada estudante e professor de Educação Básica em escolas públicas.
O programa surgiu com base no projeto One Laptop per Child (OLPC), proposto originalmente do MIT, e foi apresentado ao governo brasileiro no Fórum Econômico Mundial, em janeiro de 2005.
A parceria com a FacTI (Fundação de Apoio à Capacitação em Tecnologia da Informação), da Finep (Financiadora de Estudos e Projetos), para validar a solução da OLPC foi formalizada após reu-niões com especialistas brasileiros para debates sobre a utilização pedagógica intensiva das TIC nas escolas.

Pesquisa TIC Educação 2010TIC EDuCAÇÃO – ANÁLISE DOS RESuLTADOS106
PO
RTu
Gu
ÊS
Durante o ano de 2007, foram selecionadas cinco escolas como experimentos iniciais, em cinco cidades, de cinco estados: São Paulo/SP, Porto Alegre/RS, Palmas/TO, Piraí/Rj e Brasília/DF. Cada escola recebeu laptops para alunos e professores, infraestrutura para acesso à Internet e capacita-ção de gestores e professores no uso da tecnologia.
Em sua execução, o projeto conta com o Grupo de Trabalho do Programa UCA (GTUCA), formado por especialistas no uso de TIC na educação.
RESULTAdoS
Para investigar o cenário da inclusão digital na escola brasileira, a pesquisa TIC Educação traz resul-tados relevantes, que permitem direcionar o olhar da sociedade e fomentar as políticas públicas voltadas para a educação.
ESTRUTURA dA ESCoLA
Em média, as escolas mantêm 14 turmas no Ensino Fundamental I, 13 no Ensino Fundamental II e 15 turmas no Ensino Médio. A relação de número de alunos por turma cresce com o nível de ensi-no: 29 alunos por turma no Ensino Fundamental I, 33 no Ensino Fundamental II e 36 alunos no Ensino Médio.
Grande parte das escolas que oferecem Educação Infantil distribui de maneira semelhante o núme-ro de turmas nos turnos matutino e vespertino. O mesmo ocorre nas escolas que oferecem o Ensino Fundamental I. No Ensino Médio, o período vespertino apresenta a menor incidência de turmas, e o turno de maior incidência é o noturno.
Em relação ao quadro de funcionários, coordenadores pedagógicos estão presentes em 85% das escolas, e monitores prestam apoio técnico nos laboratórios de informática de 52% dos estabeleci-mentos. A figura do coordenador pedagógico surge principalmente nas regiões Sul e Sudeste, com percentuais 92% e 90% respectivamente; por outro lado, a região Nordeste apresenta a maior defa-sagem desse profissional, já que apenas 76% das escolas contam com esse educador, proporção significativamente abaixo do total do país.
INFRAESTRUTURA TECNoLóGICA
Praticamente todas as escolas dispõem de televisor, impressora e leitor de videocassete/DVD. A cobertura de telefone fixo é a infraestrutura tecnológica que apresenta a maior disparidade regio-nal: 81% das escolas brasileiras estão cobertas por essa tecnologia, sendo que essa proporção na região Norte/Centro-Oeste é de 73%, e no Nordeste, 55%.
Por outro lado, as escolas começam a se aparelhar para ações voltadas à produção de conteúdo multimídia. Câmeras fotográficas digitais e filmadoras, que poderão estimular a produção desse tipo de conteúdo, estão presentes em 78% e 42% das escolas, respectivamente (Gráfico 1).

2010 Pesquisa TIC EducaçãoTIC EDuCAÇÃO – ANÁLISE DOS RESuLTADOS 107
PO
RTu
Gu
ÊS
Gráfico 1. DISPONIBILIDADE DE EquIPAMENTOS TIC NA ESCOLAPercentual sobre o total de escolas
99
99
83
83
81
81
0 80 100604020
Televisão
Impressora
Videocassete / DVD
Rádio
Retroprojetor
Telefone fixo
Mimeógrafo
Câmera digital
Datashow
CD player
Antena parabólica
Filmadora
Telefone celular
75
69
54
42
8
96
78
A infraestrutura tecnológica das escolas públicas é relativamente diversificada, mas o número de equipamentos disponíveis pode restringir seu uso pela comunidade escolar, ainda mais quando se considera que há em média 800 alunos por escola.
As escolas que possuem tais equipamentos contam, em média, com quatro unidades de equipa-mentos, como rádio, televisor, impressora e cd player. Equipamentos mais sofisticados estão dis-poníveis em pouco mais que uma unidade por escola. Isso ocorre com filmadoras, câmeras foto-gráficas digitais e datashow.
Gráfico 2. NúMERO DE COMPuTADORES NA ESCOLAPercentual sobre o total de escolas
0 20 25 3015105
até 5
de 6 a 15
de 16 a 20
de 21 a 30
de 31 a 40
41 ou mais
9
21
20
29
13
8
Cada estabelecimento de ensino público conta, em média, com 23 computadores; no Nordeste, a média cai para 19; já o Sul apresenta um número superior à média brasileira, 27 computadores por escola. A quantidade de equipamentos é mais confortável nas escolas que oferecem o Ensino Médio,

Pesquisa TIC Educação 2010TIC EDuCAÇÃO – ANÁLISE DOS RESuLTADOS108
PO
RTu
Gu
ÊS
onde há, em média, 27 computadores. Escolas que oferecem somente o Ensino Fundamental I dis-põem, em média, de 20 computadores, e as que oferecem o Ensino Fundamental II, 23.
Um aspecto importante a ressaltar é que há significativa diferença entre o número de computado-res que a escola possui e o número dos que estão efetivamente instalados, em uso. A média de 23 computadores por escola reduz-se a apenas 18 em funcionamento, uma perda de cerca de 22% dos equipamentos. Nesse caso, a disparidade regional aumenta: enquanto há, em média, 24 computa-dores em funcionamento nas escolas situadas na região Sul e 19 no Sudeste, no Nordeste apenas 13 dos computadores estão ligados, uma perda significativa de 32%.
Uma possível explicação para essa perda funcional tem a ver com manutenção. A maior parte dos estabelecimentos escolares (68%) conta com prestadores de serviço fornecidos pela Secretaria da Educação para a manutenção dos computadores. Em 24% das escolas, o serviço de manutenção cabe a prestadores de serviço terceirizados, e 5% dos colégios não têm responsável por manter as máquinas funcionando.
O sistema operacional Windows é utilizado em 84% das escolas, e o Linux – software de código aberto, ou seja, qualquer pessoa pode utilizá-lo sem ter de pagar pela licença – está presente em 52%, o que indica que em algumas escolas coexistem os dois sistemas operacionais. Vale ressaltar que a região Sul apresenta o maior índice de escolas utilizando o Linux (74%); o Sudeste, em con-trapartida, tem o menor percentual (35%).
Pouco mais de um terço das escolas públicas (36%) tem sua própria página na Internet. Mais uma vez, a região Sul está à frente, com pouco mais da metade (52%) das escolas com site próprio. Considerando a dependência administrativa, a maioria das escolas municipais (68%) não possui página.
Outros recursos foram investigados: 74% das escolas têm e-mail institucional, e quase um quarto das escolas (24%) já conta com a produção de um website pelos alunos.
O conteúdo dos websites escolares é composto, principalmente, por uma galeria de fotos, a pro-posta pedagógica da escola, dados de localização, calendário dos eventos e espaço para conta-to com a escola. Os conteúdos menos encontrados são: o cardápio oferecido pela lanchonete da escola, exercícios para serem feitos on-line e consulta a notas dos alunos/avaliação de desempe-nho. Os websites das escolas apresentam uma lacuna no que se refere a atendimento e comuni-cação com o aluno, o que demonstra que essas páginas carecem de interação (Gráfico 3).
A banda larga é a forma de conexão da grande maioria das escolas públicas brasileiras, presente em 87% das escolas que possuem conexão. O acesso discado responde por apenas 5%, e o aces-so móvel, 4%.
As maiores deficiências na cobertura da banda larga emergem no Norte/Centro-Oeste, onde 14% das escolas relatam o acesso discado como tipo de conexão. No geral, 35% das escolas receberam acesso à Internet nos últimos dois anos, mas essa proporção é muito maior no Nordeste: 60% das escolas se conectaram à rede nesse período. No Sudeste, esse índice corresponde a 16%.

2010 Pesquisa TIC EducaçãoTIC EDuCAÇÃO – ANÁLISE DOS RESuLTADOS 109
PO
RTu
Gu
ÊS
Gráfico 3. CONTEúDOS PRESENTES NO website DA ESCOLAPercentual sobre o total de escolas
54
52
48
44
43
34
20
14
13
11
3
0 40 50 60302010
Galeria de fotos
A proposta pedagógica da escola
Localização
Calendário dos eventos
Espaço para contato com a escola
Sugestões de atividades e exercícios
O conteúdo das matérias por período letivo
Orientações diversas para pais ou alunos
Agendamento de reuniões de pais
Consulta a notas dos alunos
Exercicios para serem feitos on-line
Alimentação / cardápio oferecido pela escola
Outros
Nenhum site em construção
28
17
28
ENGAjAmENTo dA ESCoLA NoS PRoGRAmAS dE INTEGRAÇÃo TECNoLóGICA
A pesquisa investigou como as iniciativas governamentais em favor das TIC na educação atingem as escolas públicas. A proporção de escolas que não participam de nenhum programa de governo é 40%, segundo os diretores.
O Proinfo aparece como relevante para a difusão das TIC na educação: 47% das escolas relataram participar do programa. A penetração do programa é menor no Sudeste, onde foi citado por apenas 32% das escolas, mas nas demais regiões foi mencionado por 54%, 55% e 57% dos estabelecimen-tos de ensino nas regiões Sul, Nordeste e Norte/Centro-Oeste respectivamente. já o Programa Banda Larga nas Escolas, o segundo mais citado, ainda parece estar em fase inicial e, em contraposição ao Proinfo, mais presente em escolas do Sudeste. No Brasil como um todo, 12% das escolas mencio-naram o programa. Enquanto no Sudeste 17% citaram o programa em sua escola, no Nordeste ape-nas 7% das escolas mencionaram o PBLE.
De forma geral, os programas de governo estão principalmente direcionados a questões de infraes-trutura, já que 66% das escolas participantes apontam compra e instalação de computadores como itens oferecidos pelo programa. Em segundo lugar, 17 pontos percentuais a menos, surge a capaci-tação de professores (49%). No que se refere a atividades de manutenção, essencial para a conti-nuidade do projeto, 47% dos programas mantêm computadores, e 34%, laboratórios. há ainda pro-gramas que incluem contratação de monitores (26%) e oferecem treinamento para os alunos (23%).
37% das escolas que se integram em algum programa de capacitação de professores têm a iniciativa implementada pela esfera estadual, e 34% pela municipal. O governo federal aparece em seguida, participando em 23% das escolas por meio de projetos específicos. As próprias escolas respondem por 14%, e a iniciativa privada e ONGs têm participação residual, de 5% e 1% respectivamente.

Pesquisa TIC Educação 2010TIC EDuCAÇÃO – ANÁLISE DOS RESuLTADOS110
PO
RTu
Gu
ÊS
Nesse quesito, há diferenças regionais bem marcadas. No Sul, 48% das escolas se inserem em pro-gramas mantidos pelo governo municipal. Nas outras regiões, a participação do governo munici-pal é menos relevante: no Sudeste, esse índice corresponde a 33%, e no Norte/Centro--Oeste, a 20%. Os governos estaduais têm pouca participação no Nordeste, onde respondem por 30% das escolas que integram os programas governamentais; em outras regiões, essa proporção se aproxi-ma dos 40% ou os ultrapassa. Programas do governo federal são mais comuns no Norte/Centro-Oeste e no Nordeste, onde respondem por mais de 30% das escolas com projetos para capacita-ção de professores.
A alocação de recursos na escola, entre eles os tecnológicos, é responsabilidade do diretor (52%), seguido pela secretaria municipal ou estadual de educação (31%) e professores/conselho (15%).
moBILIdAdE
O modelo utilizado pelas iniciativas governamentais de informática na educação enfoca a imple-mentação tecnológica nos laboratórios de informática (Gráfico 4). Embora esse modelo se justifi-que em termos econômicos, especialistas em educação apontam a necessidade de superá-lo como forma de elevar a utilização pedagógica da tecnologia, uma vez que o cotidiano do ensino-apren-dizagem se desenvolve dentro da sala de aula.
Gráfico 4. LOCAL DE INSTALAÇÃO DOS COMPuTADORES NA ESCOLAPercentual sobre o total de escolas
88 12
81 19
58 42
38 62
964
100
Na sala do coordenador pedagógico ou do diretor
No laboratório de informática
Na sala dos professores ou sala de reunião
Na biblioteca ou sala de estudos para os alunos
Na sala de aula
No pátio coberto
Sim Não
O principal local de instalação dos computadores é a sala do coordenador pedagógico ou do diretor. Isso pode indicar ainda um predomínio de uso mais voltado para a gestão escolar do que para a prá-tica pedagógica (que significaria um aproveitamento maior em atividades com os alunos). O labo-ratório de informática é o segundo local mais citado para a instalação de computadores na escola.
Quanto ao acesso ao computador nesse espaço, podem utilizar o laboratório: os alunos em 93% das escolas, os professores em 88%, os funcionários em 54%, o coordenador pedagógico em 45% e a comunidade em apenas 25%. A sala de aula praticamente inexiste como local de instalação de computadores (4%).

2010 Pesquisa TIC EducaçãoTIC EDuCAÇÃO – ANÁLISE DOS RESuLTADOS 111
PO
RTu
Gu
ÊS
O acesso à Internet dá-se principalmente a partir dos laboratórios de informática (86% das esco-las), mas gestores, coordenadores e professores também têm acesso a partir da sala do coordenador/diretor (85%), sala dos professores ou de reunião (81%), biblioteca ou sala de estudos para alunos (76%). O acesso nas salas de aula não chega a 1% das escolas.
O modelo de informatização das escolas por meio de laboratórios de informática tem, de fato, esti-mulado o acesso dos alunos à tecnologia: nas escolas que contam com laboratório, 31% dos estu-dantes usam computador e Internet ao menos uma vez por semana; nas que não o têm, apenas 6% dos alunos o fazem.
Quase metade das escolas possui computadores portáteis (média de 2 equipamentos). há sinais de que os laptops sejam mais comuns nas regiões em que os laboratórios de informática foram cria-dos e consolidados mais recentemente. Entre as escolas que possuem esse tipo de computador, no Nordeste há em média 4 por escola, enquanto no Norte/ Centro-Oeste existem 3, no Sudeste, 1, e no Sul, 2. A quantidade de laptops também é maior nas escolas com projeto específico para uso pedagógico da informática – média de 3,5 máquinas por estabelecimento, contra 1,7 entre as esco-las que não têm este tipo de projeto.
o PERFIL do PRoFESSoR, APRENdIzAdo E hABILIdAdES TECNoLóGICAS
Este módulo contém informações básicas sobre o docente, incluindo sua capacitação para o uso das TIC e as habilidades para uso das tecnologias em ambiente escolar.
Perfil demográfico e profissional do educador
O professor desempenha papel central no processo de integração das TIC ao ensino-aprendizagem. Na presença da necessária infraestrutura tecnológica, é ele quem traz para a sala de aula as diretri-zes do projeto político-pedagógico da escola e a visão dos gestores escolares (diretor e coordena-dor pedagógico) com relação ao uso educacional das tecnologias. Ele também pode explorar pouco – ou até mesmo desconsiderar – a infraestrutura disponível na escola, de acordo com suas crenças ou perspectivas quanto a tecnologias e seu papel na educação. Mas a mobilização que o professor pode fazer dos recursos tecnológicos disponíveis na escola depende do nível de habilidades tecno-lógicas e pedagógicas que ele desenvolveu para tal.
Do ponto de vista demográfico, a maioria dos docentes das escolas públicas são mulheres (77%) (Gráfico 5). Isso se altera entre professores mais jovens: na faixa etária de até 30 anos, homens representam 36% do total de docentes. O gênero feminino predomina também entre diretores e, principalmente, coordenadores pedagógicos.

Pesquisa TIC Educação 2010TIC EDuCAÇÃO – ANÁLISE DOS RESuLTADOS112
PO
RTu
Gu
ÊS
Gráfico 5. PERFIL DOS PROFESSORES, POR SExOPercentual sobre o total de professores
77% 23%Feminino Masculino
A idade dos professores é um indicador relevante para a integração das TIC, pois outras pesquisas, como a TIC Domicílios 2010, indicam que cidadãos mais jovens têm mais facilidade no uso do computador e Internet.
Gráfico 6. PERFIL DOS PROFESSORES, POR FAIxA ETÁRIAPercentual sobre o total de professores
0 604020
≤ 30
31 - 45
46 +
16
55
29
16% dos professores têm até 30 anos de idade. O grupo etário com maior participação é o de 31 a 45 anos (55%). Professores com mais de 45 anos representam 29% do total. A média de idade dos professores de escolas públicas pesquisadas é de 41 anos (Gráfico 6). Os professores do Nordeste são mais jovens: 23% dos docentes têm até 30 anos. O Sudeste apresenta maior proporção de pro-fessores na faixa etária de 46 anos ou mais (35%).
A relação entre renda e a idade indica que, quanto mais jovem é o professor, menor é sua renda familiar em salários mínimos.

2010 Pesquisa TIC EducaçãoTIC EDuCAÇÃO – ANÁLISE DOS RESuLTADOS 113
PO
RTu
Gu
ÊS
Gráfico 7. PERFIL DOS PROFESSORES, POR GRAu DE FORMAÇÃOPercentual sobre o total de professores
0 15 20 25 30105
Ensino Médio – magistério
Ensino Médio – Outros
Ensino Superior – pedagogia
Ensino Superior – licenciatura em matemática
Ensino Superior – licenciatura em letras
Magistério Superior
Ensino Superior – Outros
3
1
21
25
22
3
24
Os dados revelam que as exigências por parte do governo sobre a formação do professor para o exer-cício do magistério na Educação Básica têm surtido efeito. Somente 4% dos professores revelaram ter apenas o Ensino Médio. Todos os demais são portadores de certificados de Ensino Superior: licen-ciatura em letras (25%) e em matemática (24%), são os mais frequentados pelos professores, além do curso de pedagogia (21%) e outros cursos de nível superior (22%). Esse indicador aponta que o Ensino Superior é praticamente universalizado em meio aos docentes (Gráfico 7).
Ademais, mais da metade (56%) dos professores foi além em sua formação inicial e realizaram algum curso de especialização com mais de 360 horas, e 4% desses professores se formaram com mestres a partir da pós-graduação stricto sensu. Entretanto, grande parcela (40%) não foi além da formação inicial (Gráfico 8).
Gráfico 8. PROPORÇÃO DE PROFESSORES quE REALIzARAM PÓS-GRADuAÇÃO Ou ESPECIALIzAÇÃOPercentual sobre o total de professores
0 604020
Não fiz ou ainda não completei nenhum curso de pós-graduação
Especialização (mínimo de 360 horas)
Mestrado
Doutorado
40
56
4
Sem os requisitos formais de uma pós-graduação ou especialização, cursos de capacitação consti-tuem oportunidades de desenvolvimento profissional para os docentes na forma de educação con-tinuada. Para 73% dos professores, essa foi uma oportunidade aproveitada nos dois anos anterio-

Pesquisa TIC Educação 2010TIC EDuCAÇÃO – ANÁLISE DOS RESuLTADOS114
PO
RTu
Gu
ÊS
res à pesquisa: 51% participaram de alguma atividade presencial de formação continuada, 7% de capacitação a distância e 15% dos professores realizaram atividades dos dois tipos. Nesse período, 27% não realizaram algum curso de formação continuada (Gráfico 9).
Gráfico 9. PROPORÇÃO DE PROFESSORES quE PARTICIPARAM DE CuRSOS DE FORMAÇÃO CONTINuADA NOS úLTIMOS DOIS ANOS
Percentual sobre o total de professores
51% 7% 15% 27%Sim, apenas presencial Sim, apenas a distância Sim, ambos Não
O professor da rede pública é um profissional experiente, já que, em média, exerce a docência há 15 anos. Isso significa que iniciou a docência na metade da década de 1990, quando os computa-dores pessoais ainda não haviam penetrado de forma significativa a sociedade brasileira e os res-ponsáveis pelas políticas públicas de educação básica não tinham proposto medidas que pusessem o equipamento à disposição dos alunos.
Vale ressaltar também que a Internet comercial chegou ao Brasil nesse mesmo período. Os indica-dores de atividades apontam mais à frente, em “Uso da tecnologia na escola”, o nível de integração dessas tecnologias à educação, e é bem possível que o pouco conhecimento sobre computadores e Internet durante a formação inicial dos professores tenha influenciado a integração das TIC à práti-ca pedagógica dos tempos atuais.
Embora as universidades brasileiras já contassem com a tecnologia, possivelmente poucos forman-dos da época teriam desenvolvido familiaridade com ela, e muito menos com seus possíveis usos pedagógicos. Em percentuais, 34% dos entrevistados estão na profissão há 10 anos ou menos. Atuam como professor entre 11 e 15 anos 18% dos entrevistados, e 21% entre 16 e 20 anos. Ainda estão ativos com 21 anos ou mais de atividade profissional 27% dos professores (Gráfico 10).
Gráfico 10. ANOS DE ExPERIÊNCIA DO PROFESSORPercentual sobre o total de professores
0 20 3010
até 5
6 - 10
11 - 15
16 - 20
21 +
14
20
21
27
18
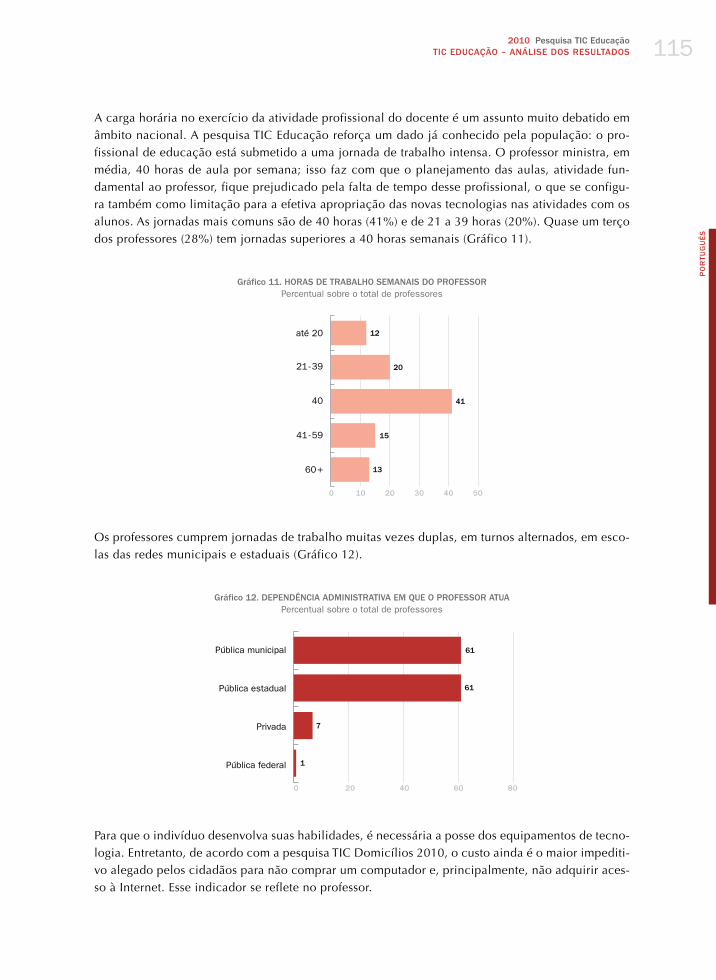
2010 Pesquisa TIC EducaçãoTIC EDuCAÇÃO – ANÁLISE DOS RESuLTADOS 115
PO
RTu
Gu
ÊS
A carga horária no exercício da atividade profissional do docente é um assunto muito debatido em âmbito nacional. A pesquisa TIC Educação reforça um dado já conhecido pela população: o pro-fissional de educação está submetido a uma jornada de trabalho intensa. O professor ministra, em média, 40 horas de aula por semana; isso faz com que o planejamento das aulas, atividade fun-damental ao professor, fique prejudicado pela falta de tempo desse profissional, o que se configu-ra também como limitação para a efetiva apropriação das novas tecnologias nas atividades com os alunos. As jornadas mais comuns são de 40 horas (41%) e de 21 a 39 horas (20%). Quase um terço dos professores (28%) tem jornadas superiores a 40 horas semanais (Gráfico 11).
Gráfico 11. HORAS DE TRABALHO SEMANAIS DO PROFESSORPercentual sobre o total de professores
0 20 4030 5010
até 20
21 - 39
40
41 - 59
60 +
12
20
41
15
13
Os professores cumprem jornadas de trabalho muitas vezes duplas, em turnos alternados, em esco-las das redes municipais e estaduais (Gráfico 12).
Gráfico 12. DEPENDÊNCIA ADMINISTRATIvA EM quE O PROFESSOR ATuAPercentual sobre o total de professores
0 40 60 8020
Pública municipal
Pública estadual
Privada
Pública federal
61
61
7
1
Para que o indivíduo desenvolva suas habilidades, é necessária a posse dos equipamentos de tecno-logia. Entretanto, de acordo com a pesquisa TIC Domicílios 2010, o custo ainda é o maior impediti-vo alegado pelos cidadãos para não comprar um computador e, principalmente, não adquirir aces-so à Internet. Esse indicador se reflete no professor.

Pesquisa TIC Educação 2010TIC EDuCAÇÃO – ANÁLISE DOS RESuLTADOS116
PO
RTu
Gu
ÊS
A pesquisa TIC Educação 2010 buscou captar esse importante componente econômico da inclusão digital do professor. Além de informação sobre a renda pessoal, a pesquisa também levantou sua renda familiar ou domiciliar.
O nível salarial do professor constitui tema de debate nacional. A pesquisa revela que, embora o docente tenha se desenvolvido academicamente – o que atestam os altos índices de professores com ensino superior (96%) e o de educadores com curso de pós-graduação –, apresente em média 15 anos de atuação profissional, exerça uma carga intensa de trabalho, sua renda pessoal não cor-responde à de outros empregos com o mesmo perfil.
Foi estimado que 79% dos professores têm renda pessoal de, no máximo, 5 salários mínimos (SM), e para isso acumulam jornadas de trabalho duplas em escolas das redes municipais e estaduais. Apenas 18% ganham até 10 SM, e 2% têm renda pessoal superior a isso (Gráfico 13).
Considerando a renda familiar desse profissional, há alguma diferença: quase metade (46%) dos professores tem renda familiar de até 5 SM. Outros 40% estão em famílias com renda entre 5 e 10 SM. São 12% os que têm renda familiar acima desse valor (Gráfico 14). Isso sugere que o professor possui um papel complementar na renda do domicílio.
Gráfico 13. PERFIL DOS PROFESSORES, POR RENDA PESSOALPercentual sobre o total de professores
0 20 30 40 5010
Até 3 SM
Mais de 3 até 5 SM
Mais de 5 até 10 SM
Mais de 10 SM
Recusou responder
42
37
2
1
18
Gráfico 14. PERFIL DOS PROFESSORES, POR RENDA FAMILIARPercentual sobre o total de professores
0 20 30 4010
Até 3 SM
Mais de 3 até 5 SM
Mais de 5 até 10 SM
Mais de 10 SM
Recusou responder
16
30
40
12
2

2010 Pesquisa TIC EducaçãoTIC EDuCAÇÃO – ANÁLISE DOS RESuLTADOS 117
PO
RTu
Gu
ÊS
Uso de computador e Internet pelo professor
Apesar de sua situação econômica perante o mercado de trabalho, o professor tem mais acesso às tecnologias do que o total da população. Praticamente todos os professores já utilizaram o compu-tador (98%) e acessaram a Internet (97%) alguma vez na vida, enquanto, de acordo com a pesquisa TIC Domicílios 2010, aproximadamente metade dos cidadãos brasileiros nunca utilizou um com-putador ou acessou a Internet.
O Nordeste é a região em que o contato dos professores com as TIC é um pouco menos difundi-do, pois 5% dos educadores nunca usaram computador e 7% nunca se conectaram à rede mundial. Entre os profissionais com idade acima de 45 anos, 3% nunca usaram computador e 6% não acessa-ram a Internet – as maiores proporções por faixa etária, o que pode indicar que, também diferente-mente da população total, professores com idade mais avançada não são excluídos do contato com as tecnologias.
A maioria dos professores já desfruta das tecnologias para uso pessoal e/ou familiar: 90% têm máquina em seu domicílio – quase sempre um computador de mesa – e 81% têm conexão à Internet. A renda familiar é um determinante da posse das tecnologias: entre os que ganham até 3 mínimos, 72% têm computador; a proporção aumenta a cada faixa superior de renda, até chegar aos 97% entre os que ganham mais de 10 SM (Gráfico 15).
Gráfico 15. PROPORÇÃO DE PROFESSORES quE TÊM COMPuTADOR NO DOMICíLIOPercentual sobre o total de professores
90% 10%Sim Não
De fato, é em sua residência que o educador usa as TIC com mais frequência, mas, enquanto 90% dispõem do equipamento no domicílio, apenas 62% os utilizam quase diariamente e 18% ao menos uma vez por semana (Gráfico 16).
Pouco mais da metade dos docentes (54%) utiliza o computador e a Internet na escola quase diaria-mente ou pelo menos uma vez por semana. Considerando o percentual de professores que não uti-lizam as tecnologias em âmbito escolar, essa proporção é maior nas escolas municipais: 34%; nas escolas estaduais, a proporção é de 19%.
Os coordenadores pedagógicos, por sua vez, têm a escola como local de uso mais frequente da tecno logia, já que 69% deles as utilizam praticamente todos os dias nesse local. Esse fato reflete o local onde estão os computadores e o acesso à Internet – em grande parte, na sala do coordena-dor – o que facilita o uso das tecnologias para atividades de gestão escolar.

Pesquisa TIC Educação 2010TIC EDuCAÇÃO – ANÁLISE DOS RESuLTADOS118
PO
RTu
Gu
ÊS
Gráfico 16. FREquÊNCIA DE uSO DO COMPuTADOR E DA INTERNET PELOS PROFESSORES, POR LOCALPercentual sobre o total de professores que já utilizaram computador ou Internet alguma vez na vida
Em casa
Na escola
Em outro estabelecimento de ensino
Na casa de outra pessoa
Em local público de acesso gratuito
Em local de acesso pago
62
20 34 13 7 26
191118
7 10 3 782
2
2 4 3 3 89
1 5 5 5
689
84
76
Todos os dias ou quase Pelo menos uma vez por semana Pelo menos uma vez por mês
Menos de uma vez por mês Não costuma utilizar
A frequência de uso das TIC pelos professores diminui entre os que se encontram nas faixas etárias mais elevadas. Entre os profissionais que já utilizaram computador ou Internet alguma vez na vida, 69% daqueles com até 30 anos de idade usam computador ou Internet em casa praticamente todos os dias; com mais de 45 anos, apenas 57% o fazem. No ambiente escolar, 61% dos mais jovens usam computador até uma vez por semana, contra 46% dos acima de 45 anos.
Dentre os professores que possuem computador no domicílio, pouco menos da metade dos profes-sores (48%) tem computador portátil. A pesquisa revela que iniciativas de incentivo à aquisição des-se tipo de máquina têm beneficiado os educadores: 26% deles informaram ter adquirido seu com-putador portátil com recursos subsidiados por programas direcionados ao professor. Os maiores percentuais apareceram nos segmentos com mais de 45 anos de idade, na rede estadual de ensino e no nível médio de ensino: 35%, 35% e 36% respectivamente fizeram uso desses programas para adquirir seu laptop. Ainda assim, grande parte dos professores utiliza recursos próprios para a com-pra do equipamento (65%) ou até auxílio de membros da família (7%) (Gráfico 17).
Gráfico 17. RECuRSOS uTILIzADOS PELOS PROFESSORES PARA A AquISIÇÃO DO COMPuTADORPercentual sobre o total de professores que possuem computador em casa
Computador de mesa
Computador portátil
Recursos pessoais próprios
Recursos de algum membro da família
Recursos subsidiados por programas direcionados exclusivamente a professores
Outros
1
1
5
26
8
7
85
65

2010 Pesquisa TIC EducaçãoTIC EDuCAÇÃO – ANÁLISE DOS RESuLTADOS 119
PO
RTu
Gu
ÊS
Apesar de muitos professores possuírem computador portátil, a maioria (59%) não o desloca à esco-la. As maiores proporções dos que não levam os laptops para a escola estão entre o sexo femini-no, da região Sudeste, de renda pessoal mais baixa (3 salários mínimos) e com idade de 46 anos ou mais. De cada 10 professores que têm laptop, 6 não o levam para a escola. No ambiente escolar, 18% dos professores utilizam o computador e a Internet para a realização de atividades em sala de aula, mas essa proporção reduz-se quando se trata do local de uso mais frequente (7%). Na região Sudeste, é maior o percentual de professores que utilizam a tecnologia em sala de aula; estes são também do gênero masculino (23%). Apenas 15% dos professores com idade superior a 46 anos demonstram aproveitar a tecnologia para tanto.
Habilidade no uso de computador e Internet
A grande maioria dos professores domina algumas habilidades básicas para o uso das ferramentas de produtividade, encontrando-se no estágio identificado pela Unesco como de “alfabetização digi-tal”. Isso se revela pela proporção de professores capazes de utilizar um editor de texto com nenhu-ma dificuldade (70%) e mover ou copiar um arquivo (57%). Os docentes declararam ter menos habilidades para a realização de tarefas mais complexas, como aplicações de multimídia, planilhas de cálculo e apresentações (Gráfico 18).
Gráfico 18. HABILIDADES DO PROFESSOR PARA AS ATIvIDADES REALIzADAS NO COMPuTADOR Percentual sobre o total de professores que já utilizaram computador alguma vez na vida
6
7
13
22
25
31
16
22
23
23
13
19
17
16
57
34
32
26
8 14 70
7 12 74Acessar e navegar na Internet
Escrever utilizando um editor de texto
Copiar ou mover um arquivo ou pasta
Usar programas multimídia de som e imagem
Preparar apresentações ou slides usando um editor de apresentações
Usar planilha de cálculo
Muita dificuldade Dificuldade Pouca dificuldade
Nenhuma dificuldade Não conhece a atividade
1
1
1
3
3
4
A idade do professor está associada ao nível de desenvolvimento de suas habilidades tecnológi-cas, sendo que os mais velhos declaram ter mais dificuldades com a tecnologia. Entre os professo-res com até 30 anos, 84% não têm nenhuma dificuldade para copiar arquivos e 88% para escrever utilizando um editor de texto. Na faixa etária dos 31 aos 45 anos, essas proporções caem para 56% e 71% respectivamente. Entre os mais velhos, apenas 42% copiam arquivo com facilidade, e 58% não têm dificuldade para escrever utilizando um editor de texto.
A atividade que apresenta maior dificuldade para o professor é utilizar planilha de cálculo: 69% dizem ter problemas com a tarefa, sendo que 31% afirmam ter muita dificuldade.

Pesquisa TIC Educação 2010TIC EDuCAÇÃO – ANÁLISE DOS RESuLTADOS120
PO
RTu
Gu
ÊS
A segunda atividade mais desafiadora é preparar apresentações ou slides com um editor de apre-sentações. Apresentam alguma dificuldade em relação a essa tarefa 65% dos professores, sendo que aproximadamente um em cada quatro professores relata ter muita dificuldade.
A navegação na Internet não representa dificuldade para 74% dos professores que possuem mestra-do, que, no entanto, demonstram atuar mais como espectadores e não como produtores de conteú-do, já que sua principal habilidade é usar um buscador de informações. 79% dos professores que já usaram a Internet disseram não ter nenhuma dificuldade para isso. Enviar e-mails é a segunda tarefa mais fácil, ainda que um em cada quatro usuários da Internet revele problemas para execu-tá-la. Nas regiões Norte/Centro-Oeste e Nordeste, um terço dos usuários da Internet envia e-mails com alguma dificuldade.
De forma geral, as mulheres relatam maior dificuldade em diferentes atividades. No uso do compu-tador, a maior distância entre homens e mulheres aparece nas planilhas de cálculo: 35% das pro-fessoras relatam grande dificuldade, enquanto apenas 18% dos homens afirmaram possuir grande dificuldade nessa tarefa.
Participar de fórum está entre as atividades que representam grande desafio para os professores. Mas a atividade que sobressai nesse sentido é fazer ligações usando VoIP: 40% dos professores têm muita dificuldade com isso, e 25% nem conhecem esse recurso on-line (Gráfico 19).
Gráfico 19. HABILIDADES DO PROFESSOR PARA AS ATIvIDADES REALIzADAS NA INTERNETPercentual sobre o total de professores que já utilizaram a Internet alguma vez na vida
1
6
9
15
11
13
13
16
12
17
16
25
42
40
40
37
30
27
22
19
19
58
10
1111
11 11
10
14
11
13
9
13
12
11
7
10
13
11
14
16
16
16
19
9
23
22
25
22
29
33
34
36
40
49
14
19
88
4 5 11 79
73
Muita dificuldade Dificuldade Pouca dificuldade
Nenhuma dificuldade Não conhece a atividade
Fazer busca de informações usando Google, Yahoo!, etc.
Enviar e-mails
Usar MSN, G-Talk, etc.
Participar de sites de relacionamento
Participar de cursos a distância
Assistir a filmes ou videos pela Internet
Fazer compras pela Internet
Participar de fóruns de discussão on-line
Jogar on-line
Baixar e instalar softwares / programas de computador
Postar filmes ou videos na Internet
Criar ou atualizar blogs e páginas da Internet
Usar a Internet para fazer ligações telefônicas
O professor apresenta muita dificuldade em postar vídeos e criar/atualizar blogs, atividades de cria-ção de conteúdo, o que sugere uma baixa participação do professor na construção da web.
Os dados sugerem que ter um computador em casa contribui para capacitar o professor para o uso da tecnologia. Entre os proprietários de um computador, 79% relatam facilidade em fazer buscas

2010 Pesquisa TIC EducaçãoTIC EDuCAÇÃO – ANÁLISE DOS RESuLTADOS 121
PO
RTu
Gu
ÊS
usando um buscador de informações. 42 % dos professores declararam que não têm dificuldade em participar de cursos a distância.
O retrato que os coordenadores apresentam das habilidades dos professores no uso das TIC é pessi-mista. Quando questionados sobre o número de professores da sua escola que teriam domínio sobre onze ferramentas, indicaram habilidade em apenas quatro tarefas: escrever utilizando um editor de texto, utilizar o correio eletrônico, utilizar programas de navegação na Internet e participar de redes sociais. Apenas uma minoria de professores foi apontada pelos coordenadores como capaz de utili-zar ferramentas com grande potencial para uso no ensino e aprendizagem, como planilhas eletrôni-cas, programas para apresentações ou que trabalham com som e imagem (Gráfico 20).
Gráfico 20. PERCEPÇÃO DOS COORDENADORES PEDAGÓGICOS SOBRE AS HABILIDADES DO PROFESSORPercentual sobre o total de coordenadores pedagógicos
41
32
31
27
18
9
7
6
5
5
3
40
38
36
44
28
28
19
19
13
13
8
16
25
28
26
42
52
63
61
58
58
60
1
1
1
1
4
1
2
2
5
8
3
2
3
4
2
8
10
9
12
20
20
26
Todos / quase todos A maioria Alguns
Nenhum / quase nenhum Não sabe
Programas para navegar na Internet
Programas para participar de redes sociais
Editor de textos
Agendas / calendários
Programas que trabalham com som ou imagens
Programas para fazer apresentações
Planilhas eletrônicas
Bancos de dados
Administrar contas e pagamentos via Internet
Construir blogs ou sites
há segmentos em que é ainda mais aguda a percepção de habilidade insuficiente. Nas escolas loca-lizadas na região Nordeste, 47% dos professores consideram ter habilidade insuficiente para o uso profissional da Internet, o maior índice regional. Na faixa etária acima de 45 anos de idade, 47% acham que sua habilidade deixa a desejar, contra 16% dos professores com até 30 anos. Entre as mulheres, são 39%, enquanto 29% dos homens que declararam ter habilidade insuficiente.
Gráfico 21. FORMA DE APRENDIzADO DO ALuNO PARA O uSO DE COMPuTADOR E INTERNETPercentual sobre o total de alunos que já utilizaram computador ou Internet alguma vez na vida
Com outras pessoas
Sozinho
Fez um curso específico
Com um professor ou educador da escola
Com os alunos / com um aluno
43
40
26
11
3
0 20 30 40 5010

Pesquisa TIC Educação 2010TIC EDuCAÇÃO – ANÁLISE DOS RESuLTADOS122
PO
RTu
Gu
ÊS
Apenas 11% dos alunos dizem que aprendem a usar computador e Internet com um professor ou educador da escola. Aprender com parentes, amigos ou outras pessoas com quem o estudante tem relação pessoal foi a forma mais citada: 43%. Em seguida, apareceu o aprendizado solitário, feito pelo estudante por conta própria, com 40%. Cursos específicos são a forma de aprendizado relata-da por 26% (Gráfico 21).
Em compensação, alunos de séries iniciais, que provavelmente ainda não tiveram uma introdução à tecnologia por outros meios, beneficiam-se da alfabetização digital de seus professores. Esses alu-nos são os que mais relatam estar aprendendo com os educadores, confirmando o relato dos pro-fessores. De acordo com os docentes, está entre os professores do 5o ano do Ensino Fundamental a maior proporção daqueles que ensinam os alunos a usar as tecnologias. Em contraste, entre alu-nos do 2o ano do Ensino Médio, 5% aprenderam com educadores e 44% fizeram curso específico.
o PRojETo PoLíTICo-PEdAGóGICo E o USo dAS TIC
A pesquisa levantou a percepção dos coordenadores sobre a forma como as TIC estão sendo intro-duzidas nas escolas, se por meio de estímulo ou de exigência de seu projeto pedagógico.
Gráfico 22. ESTíMuLOS E ExIGÊNCIAS DO PROjETO PEDAGÓGICO DA ESCOLAPercentual sobre o total de coordenadores pedagógicos
Adoção de novas formas de avaliação
Atualização quanto ao uso das TIC no processo de ensino-aprendizagem
Integração do uso da Internet em suas práticas
Utilização dos computadores para monitorar o desempenho dos alunos
Utilização de programas de computador (softwares) específicos para o ensino de determinados conteúdos
68 23
20
18
21
19 32
20
18
13
9
66
64
59
49
Estimula Requer Não estimula nem requer
De forma geral, o uso das novas tecnologias é percebido como incentivado bem mais do que cobra-do pelo projeto pedagógico. A maioria dos coordenadores considera que a escola estimula mais do que requer a adoção de novas formas de avaliação (68% contra 23%), a atualização quanto ao uso das TIC no processo de ensino - aprendizagem (66% contra 20%) e a integração da Internet às prá-ticas do professor (64% contra 18%).
Quanto à indiferença do projeto político - pedagógico das escolas, dois aspectos sobressaem: a uti-lização de softwares específicos para o ensino de determinados conteúdos e o uso dos computado-res para monitorar o desempenho dos alunos.

2010 Pesquisa TIC EducaçãoTIC EDuCAÇÃO – ANÁLISE DOS RESuLTADOS 123
PO
RTu
Gu
ÊS
SUPoRTE E CAPACITAÇÃo PARA o dESENvoLvImENTo dE hABILIdAdES TECNoLóGICAS
Para a maioria dos professores (75%), a principal fonte de apoio para o desenvolvimento de suas habilidades tecnológicas são os contatos informais com outros educadores. Em seguida, vêm as revistas e textos especializados, para 64% dos professores. O resultado indica que, na perspectiva do docente, ele depende principalmente de sua própria motivação pessoal e da ajuda dos colegas para desenvolver habilidades no uso de computador e da Internet. O coordenador pedagógico ocu-pa terceiro lugar como fonte de aprendizagem dos professores, com 58% das menções (Gráfico 23).
Gráfico 23. APOIO AO PROFESSOR NO DESENvOLvIMENTO DE HABILIDADES PARA O uSO DE COMPuTADOR E INTERNETPercentual sobre o total de professores
Contatos informais com outros educadores
Leitura em revistas e outros textos especializados
Coordenador pedagógico / pedagogo
Diretor da escola
Nas reuniões coletivas entre professores na escola em que esse tema surge com frequência
Responsável pelos computadores / pela sala de informática da escola
Formadores da Secretaria de Ensino
Grupo de trabalho formado na própria escola com essa finalidade
Técnicos de fora da escola
Formadores de outras organizações externas à escola
Sim Não Não se aplica
75
64
58
55
55
48
35
32
31
24 71
63
61
60
43
40
41
38
32
22 3
4
5
4
5
9
4
7
6
5
Em termos de faixa etária, os profissionais com até 30 anos são os que mais relatam (67%) terem feito curso específico para o desenvolvimento de suas habilidades tecnológicas, contra cerca de 45% dos professores nas outras faixas etárias. Quando se aprofunda a questão sobre curso específi-co, para investigar de que modo o docente teve acesso a ele, 71% dos docentes declaram ter pago um curso especializado, e apenas 22% desses cursos foram oferecidos pelo governo, o que indi-ca si tuação semelhante à da compra de laptops (73% dos professores dependem dos seus próprios recursos). 13% dos professores realizaram o curso por intermédio da própria escola, e 4% se refe-rem a curso oferecido por alguma outra entidade como empresas, ONGs, etc. Está também entre professores do grupo etário mais jovem a maior frequência dos que arcaram com o ônus financeiro de um curso para o desenvolvimento de habilidades tecnológicas, o que contrasta com a minoria entre os professores com 46 anos de idade ou mais.
Pela entrevista com os diretores das escolas, a pesquisa procurou identificar a existência de algum programa de capacitação direcionado a professores visando ao uso pedagógico das tecnologias. Metade das escolas (53%) não oferece esse recurso, enquanto outra metade declara ter por inicia-tiva orientar o professor para o uso das TIC (Gráfico 24).

Pesquisa TIC Educação 2010TIC EDuCAÇÃO – ANÁLISE DOS RESuLTADOS124
PO
RTu
Gu
ÊS
Gráfico 24. ExISTÊNCIA NA ESCOLA DE PROGRAMAS DE CAPACITAÇÃO DE PROFESSORES PARA O uSO DAS TICPercentual sobre o total de coordenadores pedagógicos
47% 53%Sim Não / Ainda não
PREPARAÇÃo dE AULAS
No cotidiano dos professores, a Internet é mais empregada para preparar aulas. Pelo menos uma vez por semana, a maioria usa a ferramenta para buscar conteúdos, exercícios e exemplos a serem utilizados em sala. Poucos utilizam a Internet para comunicar-se com colegas e outros membros da comunidade ou baixar conteúdos disponíveis na rede – ou seja, os professores exploram pouco o grande potencial da Internet para a comunicação.
Os professores mais jovens usam a Internet de forma mais frequente: entre os profissionais de até 30 anos de idade, 74% recorrem à rede ao menos uma vez por semana para preparar aulas; na fai-xa etária acima de 45 anos, esse índice cai para 58% (Gráfico 25).
Gráfico 25. FREquÊNCIA DE uSO DA INTERNET PELOS PROFESSORES, SEGuNDO A ATIvIDADEPercentual sobre o total de professores
15
9
7 87
55
62
66
63
31
26Preparar as aulas
Buscar textos / conteúdo a ser trabalhado em sala de aula
Buscar exemplos de exercícios para os alunos
Buscar exemplos de planos de aula
Comunicar-se com os professores da escola
Realizar tarefas administrativas da escola
Comunicar-se com outros membros da comunidade
Pesquisar ou fazer download de livros e trabalhos disponíveis na Internet
Pesquisar ou fazer download de conteúdos audiovisuais
Participar de curso a distância (e-learning)
Enviar vídeos educativos pela Internet
Participar de grupos de discussão de professores
Fazer download de programas educativos da TV para mostrar em sala de aula
Criar projetos de colaboração e comunicar-se com alunos de outros países
24
23
16
16
11
10
7
6
6
4
4
3
1
12
16
17
19
11
19
11
23
24
8
11
12
18
32
6
5
8
12
9
12
13
15
11
12
14
15
13
16
22
42
42
54
33
37
41
42
36
22
16
16
24
18
7
8
10
10
Todos os dias ou quase Pelo menos uma vez por semana Pelo menos uma vez por mês
Menos de uma vez por mês Não costuma realizar esta atividade

2010 Pesquisa TIC EducaçãoTIC EDuCAÇÃO – ANÁLISE DOS RESuLTADOS 125
PO
RTu
Gu
ÊS
Múltiplas fontes encontradas na rede são usadas na preparação de aulas. Os professores costumam consultar o projeto pedagógico da escola (72%), o MEC (45%), material de apoio de outras fontes (39%) e materiais de apoio da Secretaria da Educação municipal ou estadual (37%). Os portais espe-cializados para professores, como o do MEC, são acessados com relativa regularidade.
Uma faceta ainda pouco explorada das TIC são os conteúdos audiovisuais. Apenas uma minoria de professores baixa programas educativos da TV ou conteúdos audiovisuais (som, imagens, fotos, fil-mes, músicas) voltados para a prática pedagógica (apenas 31% e 48%, respectivamente, fazem isso ao menos uma vez por mês). O e-learning também é pouco explorado, como já mencionado: apro-ximadamente um em cada cinco disse participar pelo menos uma vez por mês de cursos a distân-cia. Da mesma forma, apenas um quarto participa de grupos de discussão de professores na Internet ao menos uma vez ao mês.
ATIvIdAdES dE APRENdIzAGEm
A rotina diária das salas de aula fundamenta-se principalmente em práticas que mantêm o profes-sor como figura central da dinâmica de aprendizagem, como o transmissor de conhecimento, fonte primária de informação, controlador e direcionador de todos os aspectos da aprendizagem. As ati-vidades mais frequentes, que definem o cotidiano escolar nas escolas públicas, são exercícios de prática do conteúdo, aula expositiva e interpretação de texto.
Em geral, essas atividades não se alteram em função de fatores como renda pessoal do professor, série e região. Contudo a aula expositiva apresenta um índice maior na região Sudeste, onde 65% dos professores de escolas públicas realizam essa atividade praticamente todos os dias ou quase. A região Sul é a que apresenta um percentual maior de atividades de interação com os alunos: 45% dos professores realizam pesquisa de informações em livros, revistas e Internet pelo menos uma vez por semana, 8 pontos percentuais de diferença (Gráfico 26).
Atividades que inserem o aluno como agente na dinâmica de aprendizagem em sala de aula, como debates, jogos educativos e produção de materiais pelos alunos, apresentam uma frequência s ignificativamente menor que aquelas centradas no professor e que, muitas vezes, sequer são rea-lizadas em sala.
Ensinar os alunos a usar o computador e Internet é a atividade menos frequente. Apesar disso, 40% dos professores se dispõem a contribuir para desenvolver o conhecimento dos alunos em relação às tecnologias, mesmo que em uma frequência baixa como “menos de uma vez por mês”.

Pesquisa TIC Educação 2010TIC EDuCAÇÃO – ANÁLISE DOS RESuLTADOS126
PO
RTu
Gu
ÊS
Gráfico 26. ATIvIDADES COM OS ALuNOS – FREquÊNCIA DE uSO DO COMPuTADOR E DA INTERNET PELO PROFESSORPercentual sobre o total de professores que costumam realizar a atividade
Todos os dias ou quase uma vez por semana Pelo menos uma vez por mês
Menos de uma vez por mês Não utiliza
Exercícios para prática e fixação do conteúdo
Aula expositiva
Interpretação de textos
Apoio individualizado a alguns alunos para que possam alcançar o restante do grupo
Organizar, acompanhar e apoiar atividades em grupo e trabalho colaborativo entre os alunos
Pesquisa de informações em livros, revistas e/ou Internet
Produção de materiais pelos alunos
Projetos ou trabalhos sobre um tema
Realização de debates e apresentações feitas pelos alunos para toda a turma
Conversar com pais sobre como eles podem apoiar e moni-torar a aprendizagem dos filhos e oferecer aconselhamento
Realizar jogos educativos
Experiências de ciências
Organizar e / ou mediar a comunicação entre alunos e especialistas e orientadores externos
Contribuir com a comunidade por meio de projetos temáticos
Ensinar os alunos a usar computador e Internet
74
55
54
42
19
15
15
10
8
6
5
5
5
3
2 17 9 12
10 26 29
25
16
18
20
21 22
12353612
24 40 18 10
7
7
7
8
11
10
5
33516
14
13
11
13
7
5
6
3534
36
37
34
28
25
20
28
30
26
12
7
13
3022
11
17
32
41
42
59
USo dA TECNoLoGIA NA ESCoLA
Para o aluno, a escola é o local menos frequente de acesso à tecnologia: apenas 2% dos alunos o fazem todos os dias. Mesmo assim, para 25% dos alunos, a escola é uma oportunidade de acesso à Internet, onde utilizam computador e Internet pelo menos uma vez por semana.
A frequência de uso da tecnologia na escola é maior entre alunos de escolas municipais (30% o fazem ao menos uma vez por semana, contra 18% das estaduais) e no 5o ano do Ensino Fundamental (31% utilizam tecnologia ao menos uma vez por semana, 24% do 9o ano do Fundamental e 17% do 2o ano do Ensino Médio).
Observa-se que, de acordo com as respostas dos professores, nas atividades mais presentes no dia a dia com os alunos, como aula expositiva, interpretação de texto e exercícios de prática e de fixa-ção do conteúdo, a incidência de uso do computador e da Internet é ainda bastante baixa. Ademais, o potencial de comunicação da Internet é pouco explorado, uma vez que conversar com os pais e organizar / mediar a comunicação entre alunos e orientadores externos estão entre as atividades em que os professores menos utilizam tecnologias (23% e 20%, respectivamente).
Em geral, são os professores mais jovens que mais usam computador e Internet nas atividades rea-lizadas com os alunos. Outro fator que influencia o uso de tecnologias pelos professores em ativi-dades com os alunos é sua renda – pessoal e familiar.
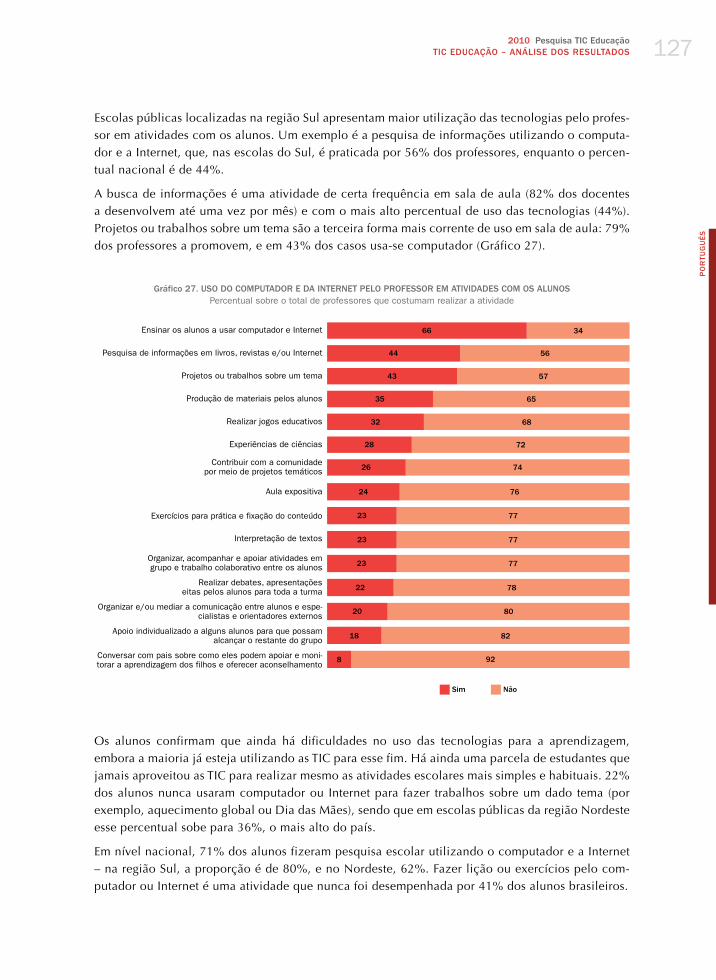
2010 Pesquisa TIC EducaçãoTIC EDuCAÇÃO – ANÁLISE DOS RESuLTADOS 127
PO
RTu
Gu
ÊS
Escolas públicas localizadas na região Sul apresentam maior utilização das tecnologias pelo profes-sor em atividades com os alunos. Um exemplo é a pesquisa de informações utilizando o computa-dor e a Internet, que, nas escolas do Sul, é praticada por 56% dos professores, enquanto o percen-tual nacional é de 44%.
A busca de informações é uma atividade de certa frequência em sala de aula (82% dos docentes a desenvolvem até uma vez por mês) e com o mais alto percentual de uso das tecnologias (44%). Projetos ou trabalhos sobre um tema são a terceira forma mais corrente de uso em sala de aula: 79% dos professores a promovem, e em 43% dos casos usa-se computador (Gráfico 27).
Gráfico 27. uSO DO COMPuTADOR E DA INTERNET PELO PROFESSOR EM ATIvIDADES COM OS ALuNOSPercentual sobre o total de professores que costumam realizar a atividade
Ensinar os alunos a usar computador e Internet
Pesquisa de informações em livros, revistas e/ou Internet
Projetos ou trabalhos sobre um tema
Produção de materiais pelos alunos
Realizar jogos educativos
Experiências de ciências
Contribuir com a comunidade por meio de projetos temáticos
Aula expositiva
Exercícios para prática e fixação do conteúdo
Interpretação de textos
Organizar, acompanhar e apoiar atividades em grupo e trabalho colaborativo entre os alunos
Realizar debates, apresentações eitas pelos alunos para toda a turma
Organizar e/ou mediar a comunicação entre alunos e espe-cialistas e orientadores externos
Apoio individualizado a alguns alunos para que possam alcançar o restante do grupo
Conversar com pais sobre como eles podem apoiar e moni-torar a aprendizagem dos filhos e oferecer aconselhamento
66 34
44 56
43 57
35 65
32 68
28 72
26 74
24 76
23 77
22 78
20 80
18 82
8 92
23 77
23 77
Sim Não
Os alunos confirmam que ainda há dificuldades no uso das tecnologias para a aprendizagem, embora a maioria já esteja utilizando as TIC para esse fim. há ainda uma parcela de estudantes que jamais aproveitou as TIC para realizar mesmo as atividades escolares mais simples e habituais. 22% dos alunos nunca usaram computador ou Internet para fazer trabalhos sobre um dado tema (por exemplo, aquecimento global ou Dia das Mães), sendo que em escolas públicas da região Nordeste esse percentual sobe para 36%, o mais alto do país.
Em nível nacional, 71% dos alunos fizeram pesquisa escolar utilizando o computador e a Internet – na região Sul, a proporção é de 80%, e no Nordeste, 62%. Fazer lição ou exercícios pelo com-putador ou Internet é uma atividade que nunca foi desempenhada por 41% dos alunos brasileiros.

Pesquisa TIC Educação 2010TIC EDuCAÇÃO – ANÁLISE DOS RESuLTADOS128
PO
RTu
Gu
ÊS
A proporção de alunos que nunca utilizaram o computador ou a Internet para outras atividades escolares é reveladora do uso limitado que as tecnologias têm na prática diária das atividades de ensino/aprendizagem na escola pública brasileira. Cerca de 69% dos alunos nunca fizeram uma experiência de ciências com auxílio das TIC; 55% nunca as empregaram para fazer apresentações para a classe; 42% jamais jogaram jogos educativos; e nada menos que 82% nunca se comunica-ram com o professor pela rede. Esses indicadores ilustram que, apesar de as políticas públicas vol-tadas para a integração das TIC nas escolas públicas estarem em vigor há cerca de quatorze anos, o alcance de seus objetivos maiores ainda encontra-se em fase inicial.
méTodoS dE AvALIAÇÃo
Provas, exames escritos, tarefas, exercícios e apresentação de trabalhos para a classe são menciona-dos como métodos de avaliação pela quase totalidade dos professores. Muitos devem utilizar uma combinação dessas formas de avaliação. é interessante observar que mais da metade dos professo-res valoriza o uso, pelos alunos, de vídeos, imagens e sons em trabalhos ou apresentações que con-duzem a avaliações (Gráfico 28).
Gráfico 28. MéTODOS DE AvALIAÇÃO uTILIzADOS PELOS PROFESSORES COM OS ALuNOSPercentual sobre o total de professores
Provas e exames escritos
Tarefas e exercícios escritos
Apresentação de trabalhos para a classe
Uso de vídeos, imagens e sons em trabalhos e apresentações
99
94
64 36
6
99
1
1
Sim Não
O computador ainda está longe de constituir ferramenta para a realização de atividades de avalia-ção nas escolas públicas brasileiras, mas já se podem observar tentativas nessa direção. Chega a 10% a proporção de professores que utilizam o computador para aplicar provas e exames escritos, e 22% avaliam seus alunos por meio de tarefas e exercícios escritos com o auxílio do computador. Entre os professores que adotam apresentação de trabalhos para a classe como método de avalia-ção, 47% indicam o uso de tecnologia para integrar recursos multimídia como vídeos, imagens e sons em trabalhos ou apresentações para a classe.
Professores do Ensino Médio valorizam mais o computador, tanto para a apresentação de trabalhos para a turma (41%) quanto para a integração de vídeos, imagens e sons em trabalhos ou apresen-tações. Nesse nível de ensino, 59% dos professores valorizam a utilização de tecnologia na ava-liação. O mesmo ocorre com os professores de escolas públicas localizadas na região Sul: 44% valorizam o uso do computador para apresentação de trabalhos para a classe, e 59% dão valor à integração de vídeos, imagens e sons em trabalhos ou apresentações (Gráfico 29).

2010 Pesquisa TIC EducaçãoTIC EDuCAÇÃO – ANÁLISE DOS RESuLTADOS 129
PO
RTu
Gu
ÊS
Gráfico 29. MéTODOS DE AvALIAÇÃO PELO PROFESSOR uTILIzANDO O COMPuTADORPercentual sobre o total de professores
Provas e exames escritos
Tarefas e exercícios escritos
Apresentação de trabalhos para a classe
Uso de vídeos, imagens e sons em trabalhos e apresentações
10
22
31
47 53
69
78
90
Sim Não
A atividade menos tradicional de avaliação – isto é, valorizar a integração de vídeos, imagens e sons em trabalhos e apresentações – recebe certa influência dos fatores gênero e faixa etária dos pro-fessores. Enquanto 44% das professoras fazem uso dessa ferramenta, mais da metade dos professo-res (56%) a utiliza. Além disso, 56% dos educadores com até 30 anos de idade adotam, com fre-quência maior, formas de avaliação mais intensivas em tecnologia. Professores do 5o ano do Ensino Fundamental e aqueles de escolas públicas localizadas na região Nordeste são os que menos utili-zam métodos de avaliação com maior componente tecnológico.
LImITAÇõES PERCEBIdAS PARA o USo dAS TECNoLoGIAS NA ESCoLA
Da perspectiva do professor, a principal limitação percebida para maior uso das TIC na escola é seu nível de habilidade tecnológica mais baixo quando comparado ao do aluno. Grande parte dos professores (64%) concorda totalmente que os alunos da escola sabem mais sobre computador e Internet do que o docente.
Essa opinião surgiu com intensidade inclusive entre professores de faixa etária mais jovem, e foi maior no segmento dos que lecionam no 2o ano do Ensino Médio (70%). No total, perto de um em cada quatro mestres acredita não entender o suficiente para usar as novas tecnologias na escola – no caso do Nordeste, chega a um terço.
O professor também rejeita a ideia de que desconheça os usos da tecnologia em atividades de ensi-no/aprendizagem. 80% discordam totalmente da afirmação de que não sabem de que forma ou para quais atividades podem usar o computador e a Internet na escola.
Pouco mais de um terço dos professores considera que o uso mais intenso das TIC na escola pode produzir uma sobrecarga de informação para os alunos – informação essa, muitas vezes, de nature-za duvidosa –, o que consideram um fator que reduz um maior aproveitamento das TIC no ambien-te escolar (Gráfico 30).

Pesquisa TIC Educação 2010TIC EDuCAÇÃO – ANÁLISE DOS RESuLTADOS130
PO
RTu
Gu
ÊS
Gráfico 30. BARREIRAS PERCEBIDAS PELO PROFESSOR PARA MAIOR uSO DA TECNOLOGIA NA ESCOLAPercentual sobre o total de professores
Os alunos sabem mais sobre computador e Internet do que o professor
Com a Internet, os alunos acabam ficando sobrecarregados de informação
Não confio nas informações contidas na Internet
Com a Internet, os alunos acabam perdendo contato com a realidade
Acredito mais nos métodos tradicionais de ensino
Não entendo de computador e Internet o suficiente para usar na escola
De modo geral, tenho receio de usar a Internet
Não sei de que forma ou para que atividades posso usar computador ou Internet na escola
Concorda totalmente Concorda em parte Não concorda nem discorda
Discorda em parte Discorda totalmente Não Sabe
25
8
2
7
6
9
3
3
39
27
29
24
22
15
12
9
8
9
11
9
13
7
7
7
13
24
29
25
27
16
16
18
14
31
28
35
33
53
62
62
1
1
Os docentes revelam confiança em sua capacidade para o uso de computador e Internet. Mais da metade (58%) dos professores acredita que seu nível de habilidade com o computador é suficien-te para suas necessidades pessoais, e 63% acham ser suficiente ou mais do que suficiente para as necessidades relacionadas ao trabalho. Essa segurança encontra respaldo na descrição das princi-pais atividades que o professor realiza em sala de aula, como visto anteriormente. é possível que a maior parte das atividades diárias do professor exija um domínio mínimo de equipamentos infor-máticos, o que pode levar os docentes de escolas públicas no Brasil a pensar que seu nível de alfa-betização digital é certamente suficiente para atender às necessidades da prática em sala de aula.
Não chegou a um terço a proporção de professores que acreditam mais nos métodos tradicionais de ensino, que desconfiam das informações contidas na Internet e que têm receio generalizado de usá-la. Apenas 12% disseram não saber como ou para que usar as TIC na escola.
As opiniões dos diretores seguem a mesma direção, sugerindo que é pequena a parcela de educa-dores que manifestam abertamente resistência ao avanço das novas tecnologias na educação. Maior proporção de diretores, comparada à de professores, sente-se capaz de usar computador e Internet na escola. Enquanto 24% dos mestres consideram não entender o suficiente para usar as TIC na escola, somente 14% dos diretores têm essa percepção. Eles acreditam menos nos métodos tradi-cionais de ensino do que os professores (17% dos diretores e 27% dos professores); e, tanto quanto o professor, consideram saber de que forma usar o computador e a Internet na escola.
Na opinião de diretores, professores e coordenadores pedagógicos, um aspecto limitador do uso das TIC na escola refere-se à infraestrutura. A principal queixa é quanto ao número insuficiente de com-putadores por aluno, que, para 57% dos educadores, limita muito o uso das TIC. A falta de equipa-mento apropriado ao aluno com necessidades especiais é um grande limitador na avaliação de 52% educadores, e equipamentos obsoletos são uma questão limitante para 45% deles.

2010 Pesquisa TIC EducaçãoTIC EDuCAÇÃO – ANÁLISE DOS RESuLTADOS 131
PO
RTu
Gu
ÊS
Ainda encontra-se entre os fatores limitantes ao maior uso das TIC na escola o número insuficiente de computadores conectados à Internet (para 53% dos educadores, esse fator atrapalha muito). A baixa velocidade na conexão à Internet é outro limitante (49%). Essas queixas aparecem com inten-sidade semelhante em todas as regiões do país, independentemente do tipo de dependência admi-nistrativa da escola e da série em que atua o professor.
Problemas propriamente pedagógicos ou de organização do trabalho aparecem com menor des-taque. Para 37%, é um grande fator limitante a falta tempo para preparar aulas com maior incor-poração do computador e da Internet. Para 36% dos professores, o que limita maior intensidade t ecnológica na escola é a falta de tempo para cumprir o conteúdo previsto. Por fim, as reclamações incluem falta de apoio pedagógico (33%), pressão para conseguir boa avaliação de desempenho (33%) e currículos muito rígidos (24%).
PERCEPÇÃo doS BENEFíCIoS qUE PodEm AdvIR do USo dAS TIC NA ESCoLA
Embora ainda haja um desafio para o avanço das tecnologias nas escolas públicas brasileiras, os professores já observam ganhos com o uso dessas ferramentas. O mais mencionado é a adoção de materiais mais diversificados e de melhor qualidade, relatada por 81% dos professores. Também para coordenadores pedagógicos e diretores, essa tem sido a principal contribuição das TIC para a prática dos educadores.
Em segundo lugar, destaca-se a adoção de novos métodos de ensino, observada por 80% dos docentes. Em terceiro, aparece o reconhecimento dos professores de se tornarem educadores mais eficazes: 74% dos professores apontam esta afirmativa. A avaliação não é afetada pela faixa etária do professor, mas apresenta variações regionais: 88% dos professores de escolas públicas localiza-das na região Sul percebem essa evolução, enquanto nas demais regiões o percentual varia de 68% (Nordeste) a 74% (Sudeste).
Apesar de o professor se sentir preparado para o uso das tecnologias na prática pedagógica, o uso de computador e Internet nas atividades escolares mostra-se em estágio inicial nas escolas públi-cas. Isso porque as atividades mais frequentes no cotidiano pedagógico apresentam baixa intensi-dade de uso das TIC.
CoNSIdERAÇõES FINAIS
O estudo encontrou evidências que sugerem, nessa primeira década do século XXI, a existência de grandes desafios para integrar as TIC à educação, apesar dos esforços em disponibilizar a infraes-trutura de computador e Internet às escolas públicas no Brasil. O desafio se divide em duas verten-tes: garantir que a comunidade escolar tenha acesso a infraestrutura tecnológica de boa qualidade e desenvolver o uso pedagógico dessas ferramentas.
A pesquisa identificou que a o ambiente escolar como um todo e a liderança da escola são fato-res fundamentais para a integração das tecnologias à educação. A postura dos diretores em face às
Pesquisa TIC Educação 2010TIC EDuCAÇÃO – ANÁLISE DOS RESuLTADOS132
PO
RTu
Gu
ÊS
t ecnologias é elemento central para se compreender limitações e lacunas no diálogo entre as TIC e a prática pedagógica.
Os atores escolares foram convidados a definir o grau de prioridade que atribuem a várias iniciati-vas relacionadas a inovações tecnológicas na escola. Na visão dos diretores, desenvolver as com-petências tecnológicas de professores e alunos é ação mais importante do que aumentar o número de computadores ou aprimorar o acesso à Internet. Para coordenadores pedagógicos e professores, a prioridade é resolver questões de infraestrutura, que, para eles, constituem a principal limitação ao uso das TIC no processo pedagógico.
Na visão dos gestores, falta apoio pedagógico para aprimorar o uso de computador e Internet nas atividades escolares. Na visão de professores e coordenadores pedagógicos, o que falta é suporte técnico, aspecto de infraestrutura.
Na visão dos diretores, questões relacionadas a organização do trabalho, como tempo insuficiente para preparação de aulas, pressão para cumprir a grade curricular e para conseguir bons resultados nas avaliações, atrapalham com mais intensidade a integração tecnológica às atividades escolares.
A pesquisa mostra que acesso ampliado de alunos e professores a computadores é visto como fun-damental para aumentar as chances de eles desenvolverem suas habilidades tecnológicas. é pre-ciso, portanto, atenção especial para as restrições de acesso aos computadores nas escolas. Nesse sentido, verificou-se que, nas escolas em que os alunos não têm acesso a computadores, aumen-tar o número de equipamentos por aluno é citado como alta prioridade mais frequentemente que naquelas em que há acesso dos alunos aos equipamentos. Outra queixa frequente é o número insu-ficiente de computadores conectados à Internet – uma possível justificativa para restringir o acesso dos alunos –, que é mais frequente em escolas com limitação de acesso do que naquelas em que isso não ocorre.
Em suma, a figura central da pesquisa, o professor, surge como um profissional que, embora tenha conquistado seu espaço, ou seja, consolidado sua atividade como profissão e se desenvolvido aca-demicamente, ainda enfrenta condições precárias de trabalho, expressas em sua jornada, em seu salário, no tipo de apoio para a aquisição de equipamentos e, sobretudo, para o desenvolvimen-to profissional. Essas características impactam a incorporação das tecnologias ao processo de ensi-no/aprendizagem. A formação inicial dos docentes aparece como um tema relevante, uma vez que esses professores, estando em exercício há mais de quinze anos, entraram no magistério em épo-ca anterior à difusão das TIC na sociedade e, certamente, não tiveram, em seus cursos superiores, a oportunidade de serem formados no uso das tecnologias para a prática docente. Além disso, as con-dições de trabalho impedem que professores se atualizem ou se especializem.
Dessa perspectiva, não se pode esperar que o professor, sozinho, promova possíveis mudanças no paradigma da educação, incluindo a escola na cultura digital.

english


2010 Survey on ICT EducationFOREWORD 135
En
gli
sh
FoREWoRd
As you set out for Ithaka
hope your road is a long one,
full of adventure, full of discovery.
(...)
Better if it lasts for years,
so you’re old by the time you reach the island,
wealthy with all you’ve gained on the way,
not expecting Ithaka to make you rich.
Ithaka gave you the marvelous journey.
Without her you wouldn’t have set out.
She has nothing left to give you now.
(Konstantínos Kaváfis, Ithaca)
Translation by Edmund Keeley & Philip Sherrard
When the NIC.br officially began its operations in 2005, the resources collected by the Registro.br – the body in charge of domain name registry activities and distribution of IPv4 and IPv6 in Brazil – enabled the CGI.br to expand its initiatives for the Brazilian Internet community. In this scenario, the Cetic.br was created, within the NIC.br, to map out the ownership and the use of ICT, as well as to produce a picture of the Internet in the country. The Cetic.br is one of the most significant and consequential results of the use of CGI.br’s resources for the benefit of society.
Other key initiatives have been strengthened, such as the creation of Internet exchange points (IXPs) in the country, free distribution of the official time in Brazil via NTP (Network Time Protocol), the Last Mile Traffic Measurement System (Simet), the dissemination and “preaching” of the use of the IPv6 protocol, through events and courses managed by the Ceptro.br, another body of the NIC.br. Concerning Internet security projects, between those conducted by the Cert.br we highlight the security booklet, specialized international standard courses, and the project to map out spam in the country, namely honeypots. Furthermore, fostering the awareness of the importance of open standards to ensure the growth of the Web, based on guidelines to create an inclusive and democratic Internet, is an important role of the W3C.br, the Brazilian branch of the W3C.
One of CGI.br’s main roles is to ensure continuity of the activities of the NIC.br, as a means of reinstating its commitment to reinvest in the Brazilian Internet community the resources generated by domain name registry under the .br domain. Furthermore, the ongoing growth of the number
Survey on ICT Education 2010FOREWORD 136
En
gli
sh
of registry names, which has reached 2.5 million in june 2011, enables the NIC.br to become more prominent as a reference in the country and abroad, through the expansion of a series of projects aimed at supporting the development of the Internet in the country. The survey on the use of ICT in Brazil, in its sixth edition this year, and the new survey on ICT in the Brazilian education system, both conducted by the Cetic.br, are examples of the NIC.br’s commitment to produce and share knowledge on the Brazilian network and to produce supporting data for the design of public policies based on a more detailed and thorough understanding of the Internet in Brazil.
Fair winds!
Demi GetschkoBrazilian Network Information Center – NIC.br

2010 Survey on ICT EducationPRESENTATION 137
En
gli
sh
PRESENTATIoN
Since its inception in 1995, the Brazilian Internet Steering Committee (CGI.br) coordinates key projects for the development and operation of the Internet in the country. Among its numerous roles and responsibilities, the CGI.br promotes the collection, compilation and sharing of information, analyses, indicators and statistics on information and communication technologies (ICT) in Brazil, particularly the Internet. Several research projects are conducted through its Center of Studies on Information and Communication Technologies (Cetic.br), and are aimed at measuring and monitoring the progress of ICT in the country.
Statistics produced by these projects aim to contribute to the debate about ICT in the country. Also, the surveys are becoming increasingly more popular due to their methodological rigour and their valuable contributions to the public and private sectors, to non-governmental organizations and to the scientific and academic community.
We are glad to verify that public managers use the results of CGI.br’s surveys to design governmental strategies and public policies that meet the needs of the Brazilian population regarding critical aspects of society, such as digital inclusion, the use of ICT in education, universalization of broadband connections, regulation of LAN houses, among others. These results are also broadly used by scholars to design academic research projects, and by private organizations to identify trends in the Brazilian technological scenario.
Committed to the goal of creating a reference center for statistics and indicators on the ownership and use of ICT in the country, the CGI.br presents the sixth edition of the Survey on the use of information and communication technologies in Brazil – ict households and ict enterprises, as well as the first edition of the Survey on the use of information and communication technologies in Brazilian schools – ict education.
Hartmut Richard GlaserBrazilian Internet Steering Committee – CGI.br


2010 Survey on ICT EducationINTRODuCTION 139
En
gli
sh
INTRodUCTIoN
The new information and communication technologies (ICT) have lately created, with increasing intensity and speed, new possibilities for different sectors of society, in the economic, social, political and cultural fields. Furthermore, they are revolutionizing key aspects of the routine of individuals, organizations and governments. Assessing how these technologies affect society is a requirement for monitoring the progress and development of the information and knowledge society. International organizations, such as the United Nations (UN), the Organization for Economic Cooperation and Development (OECD), and the World Bank, among others, work collaboratively to produce methodologies, indicators and metrics to measure access, use and appropriation of new technologies, essential for the development of the information society.
Granting universal access to education is one of the aims of the UN Millennium Development Goals program, and ICT play a key role in this process. hence, the challenges to ensuring the appropriation of new technologies in education must be known, as well as the impacts caused by the use of ICT in classrooms.
Although the government has invested resources in ensuring the broad use of ICT in education, the results of this use in meeting the goals and targets of educational programs are, however, virtually unknown. hence, creating a database of relevant and credible knowledge is paramount to the decision making and design of public policies for the use of ICT in educational programs. This was the primary driver for this Survey on the Use of Information and Communication Technologies by Brazilian Schools - ICT Education 2010.
Two approaches have been adopted in the survey in order to address this challenge. The first approach is comprised of a longitudinal qualitative module, in which 12 schools will be monitored over four years, starting in 2010 and finishing in 2013, with two annual visits for observation, monitoring the changes in broadband access and its impacts on teaching practices. Results of this study will be analyzed and published in the future.
The second stage comprises a quantitative sample, which is presented in this publication. Thus, another research project is added to the Cetic.br portfolio, along with the widely known annual surveys on the use of information and communication technologies – ICT households and ICT Enterprises, of the Brazilian Internet Steering Committee (CGI.br). Cetic’s surveys have been contributing to the public, private and academic sectors by substantiating the debate on the development of ICT in the country. Inspired by the concept of ICT4DEV (Information and Communication Technologies for the Development), these surveys are not only aimed at outlining ICT appropriation, but also at creating a historic series of relevant indicators, which enable in-depth analysis of access and use of new technologies, particularly the Internet. This produces valuable contribution to a better

Survey on ICT Education 2010INTRODuCTION 140
En
gli
sh
understanding of the several ways in which the ICT impact Brazilian society, specifically education, in this case.
In the public sector, the statistics produced by the Cetic.br surveys contribute to the debate about public policies, particularly those related to digital inclusion, such as the National Broadband Plan, the Broadband in Schools and the Community Telecenters programs, etc. There are several inequalities in the Brazilian socioeconomic scenario, and solving these issues is a great challenge to the design of public policies. Public policies in this field have focused on access to ICT and infrastructural development, but little has been discussed about active participation, skills development, digital literacy of citizens, and now also of teachers, directors of studies and principals.
Data from the ICT Education survey are an important contribution to the debate on appropriation of ICT by school players, and to the debate about key challenges to enabling its effective use in the educational process.
In the private sector, Cetic.br’s surveys have been increasingly used by companies operating in the telecommunications, media and Internet industries to monitor trends, particularly in Internet usage and applications, such as social networks, electronic commerce, entertainment, education, among other themes monitored by the surveys. In the academic sector, the number of publications, master’s and doctorate dissertations and scientific articles using data from the surveys has also increased in recent years. hence, the CGI.br’s data is notably legitimated by social players from the government, the private sector, the third sector and the academia.
In line with the tradition of Cetic.br’s publications, an analysis of the main indicators of the ICT Education is presented, in order to create a comprehensive scenario of the use of new technologies in public schools of the country. We hope this reading prompts its readers to reflect upon the challenges to the effective appropriation of ICT in schools and the implications of their introduction.
In 2010, the Cetic.br further extended its role in national and international debates on the design of key indicators for ICT. It also increased the involvement of academic experts, governmental institutions, and third sector organizations, always complying with the methodological standards set forth by the OCDE and the Eurostat (Statistical Office of the European Union), as well as the international references of the Partnership on Measuring ICT for Development, an initiative that brings together, in addition to the aforementioned OCDE and Eurostat, international entities such as the UIT, the UNCTAD, UNESCO’s Institute of Statistics, regional UN agencies and the World Bank. Thus, the results presented by our surveys are consistent and credible, enabling comparability between the Brazilian reality and the reality of other countries.
Countries on every continent have been investing in the use of ICT in schools and innovation in pedagogical processes; ICT equipment infrastructure, Internet access, professional development and the creation of digital learning content are a few examples of these investments.
In order to achieve its goals, the ICT Education Survey interviewed a sample of 500 public schools, interviewing principals, directors of studies, teachers and students, seeking to represent the Brazilian scenario of education and the use of technologies. According to this proposal, the work was based on international references, such as InfoDev (World Bank), the IEA (International Association for the Evaluation of Educational Achievement) and Sites 2006 (Second Information Technology in Education Study).

2010 Survey on ICT EducationINTRODuCTION 141
En
gli
sh
In its first edition, the Survey on the Use of Information and Communication Technologies in Brazilian Schools – ICT Education 2010 has been structured as follows:
Part 1 – Articles: texts written by guest scholars, approaching relevant themes from different perspectives. The articles cover, among other themes, digital natives, the role of education in social development, initial teacher formation, challenges, the current scenario, ethics and security.
Part 2 – ict education: methodological report, outline of the sample plan and analysis of the main results of the survey.
Part 4 – ict education tables: all indicators for teachers, central players in the school survey, with their respective tables of results, divided by independent variables.
Part 5 – Appendixes: glossary of terms used in the survey, to facilitate reading.
Undertaking this survey demands a lot of time and resources, but the effort is a source of great enthusiasm and satisfaction for the entire Cetic.br team. hence, we hope that the data and analyzes of this publication prompt important reflections and debate, and are broadly used by public managers in charge of designing the future of the information and knowledge society in Brazil. We furthermore hope they continue to function as a basis for scientific and academic works, helping public and private schools and organizations in the third sector in the monitoring of Brazilian education.
Alexandre F. Barbosa
Center of Studies on Information and Communication Technologies – Cetic.br


2010 Survey on ICT Education ARTICLES 143
En
gli
sh
1ARTiCles

Survey on ICT Education 2010ARTICLES 144
En
gli
sh

2010 Survey on ICT Education ARTICLES 145
En
gli
sh
ovERvIEW oF ThE USE oF dIGITAL INFoRmATIoN ANd CommUNICATIoN TEChNoLoGIES
Maria da Graça Moreira da Silva 1 and Maria Elizabeth Bianconcini de Almeida 2
FoREWoRd
Massive changes in social structures caused by advances in science and technology have transformed communication, social relations, labor, economy and entertainment. Distances have been shortened, boundaries have been pushed and the world has become globalized. Media and technologies are in turn related to all of these transformations.
Society, typically rural at the start of the 20th century, migrated to urban spaces in the 1970s and was profoundly transformed during this movement. At the end of the 20th century and beginning of the 21st century the spread of the use of digital information and communication technologies (DICT) transformed space and time relationships, boosting functional mobility and increasing the momentum of changes in work structures, knowledge production and education, uncovering the need to prepare individuals to live and work in the technology society.
Inclusion of the population in the technology society became key to countries willing to be part of the globalized world and to overcome the digital gap (Castells, 2003) due to social inequalities, which led to the design of public policies for digital inclusion, including initiatives to use technologies in schools.
hence, the cyberculture creates new possibilities for individuals to operate in different contexts, with different media, enabling a network of connections between the environment where they learn and the context in which they operate, creating new means of interaction and development for their views on the world and their culture.
1 Doctor in Education from the Pontific Catholic University of São Paulo (PUC/SP). Professor at the Department of Computing and one of the professors involved in the Postgraduate Program in Education at PUC-SP. The author works as a researcher, overseeing projects and courses on the use of technologies and media in education and teacher training.
2 Doctor in Education from the Pontific Catholic University of São Paulo (PUC/SP), and post-graduate from the University of Minho, Portugal. The author is a professor and coordinator of the Graduate Program in Education at PUC/SP. She oversees research and development projects on the use of technologies in education and teacher training.

Survey on ICT Education 2010ARTICLES 146
En
gli
sh
We are under connection and interconnected to others; our lives are based on a digital world – with media and devices in various formats – that creates new applications for communication. We resort to communication and information resources on a daily basis; we particularly use Internet technology for our transactions, listening to music, watching videos, accessing news, communicating, chatting, sharing, and disclosing and producing information.
In fact, the rise of the Internet promoted the development of a culture of media use, and therefore a social configuration based on a digital model of thinking, creating, producing, communicating, learning, and even living. In view of this, we can ascertain that these modern times are steered by communication and information management. Furthermore, this context is not like that of the early days of the Internet in the 1990s, and the use of personal computers at the time.
In the context of the historical development of media – in which the prominence of radio, television, computers and, more importantly, the Internet is marked in our mediatic and information-based lives – technological developments, computers and more specifically the Internet are undoubtedly the main promoters of our current social structure with an innovative approach to communication – the “media culture”, as defined by Santaella (2004). In order to shed light on the current scenario of the use of technologies in education, we must first analyze its historical development in Brazil.
BRIEF hISToRY oF ThE USE oF TEChNoLoGIES IN EdUCATIoN
The use of computers in education began in 1924 with the invention of a machine that presented contents and applied and corrected multiple choice tests – the Pressey Machine (Leigh, 1998).
In the 1950s educational theories and technologies flourished. Benjamin Bloom created theories that prepared teachers to effectively share educational content. Also, prompted by studies by the psychologist Skinner, several versions of “teaching machines” were constructed and tested. They were based on the concept of individual learning and (positive or negative) sound reinforcement immediately after a correct or wrong result, progressive lessons and visual stimulation.
The Computer Assisted Instruction (CAI) model enjoyed great progress as of the 1960s, propelled by investments from American companies, such as IBM, and universities, such as Stanford University and the University of Illinois.3 It was believed then that the use of computers would revolutionize education. At the time, efforts were aimed at converting the content of lessons into software – a concept that weakened the role of teachers.
Over time, computers were used by teachers and educational institutions in different ways, creating new proposals based on new approaches to their use, not only programmed teaching.
In addition to a range of CAIs, the concept of using computers in education originated other approaches in which computers were used as tools in problem solving, text production, data base manipulation and real-time process control (Valente & Almeida, 1997). Thus, the use of computers
3 The latter, in partnership with a computer manufacturer, created the Plato system, which was a large computer that, at one point, stored and distributed nearly 8 thousand hours of educational materials, through 950 computer terminals spread across 140 locations. Plato marked one of the main stages in the history of the use of computers in education (Leigh, 1998).

2010 Survey on ICT Education ARTICLES 147
En
gli
sh
in education was reviewed, and these devices, former “teaching machines”, became “educational tools”, i.e. the informative approach became a constructive one. In Brazil, teaching methods based on this approach were introduced in the second half of the 1980s, inspired by Seymour Papert’s (1985) ideas, who associated the use of computers with knowledge production through the Logo programming language, an approach later expanded and adopted in other software that promoted authorship (Almeida, 2008).
The second half of the 1990s was marked by the beginning of the digital revolution and the rise of the information society, resulting from technological development which, in turn, was marked by research and development funded by corporations, the military or the science and education community.
Use of the worldwide computer web spread across the corporate market, schools and universities, and pioneering study groups and research projects were created in universities.
The use of technologies in education was largely driven by the popularization of the Internet, and within a few years there were several projects from different areas of education on the use of digital information and communication technologies (DICT) for teaching and education. Educators began to debate and research the new potential impacts of the Internet and digital media in education. As a consequence, the use of DICTs was intensified in education, and gradually teachers began to embrace it, which hadn’t happened in previous generations when educational technologies included the use of radio and TV. We’ll now discuss the new possibilities and trends for the use of technologies in education in the current scenario.
CURRENT SCENARIo oF ThE USE oF TEChNoLoGIES IN EdUCATIoN
Although a number of projects for the use of technologies in education have been implemented (Almeida, 2008) from the late 1980s to this day, not all of today’s schools have access to DICTs. Furthermore, practical observations of the use of DICTs in schools and the literature available on the subject reveal that such uses (Valente & Almeida, 1997; Almeida, 2008) are characterized by isolated activities, not really integrated to the syllabus.
Since technology is viewed as a thought structuring element – from its very conception, even before it is materialized – integrating it in a significant way to the school syllabus and to educational practices requires dominating its intrinsic properties, using it in education and teaching practices and reflecting on when and why to use it, how it is used and how it can contribute to the learning process and to the school syllabus (Almeida, 2010a, p. 68).
The innovations enabled by these technologies in education require rethinking the fundamental premises of education and revising them. New learning and virtual environments enabled by technology systems on the worldwide Web of computers bring teachers and students together in the cyberspace, and include unprecedented features, which evidences the “educational potential of information and communication technologies – ICT” (Almeida, 2010b, p. 5).
In addition to being introduced in schools, DICTs must also be integrated in the digital culture, i.e. all the players involved in the school must be engaged in the cyberculture, which consists in a “set of techniques (material and intellectual), practices, attitudes, ways of thinking and values” (Lévy,
Survey on ICT Education 2010ARTICLES 148
En
gli
sh
2000, p. 17). This must be promoted by the discovery of applications and services provided by DICTs, particularly the Internet, such as: Communication with anyone, at any time, from anywhere where there is a connection; the many non-linear pathways that can be browsed, through the nodes and connections that comprise hypermedia networks; the creation, sharing and publication of ideas incorporating different languages; and the production of content in collaboration with others.
Collaborative production allows teachers and students to have collective authorship, rather than solitary classroom production. Content under development may benefit from several contributions and the involvement of different authors, evoking new ways of structuring multidimensional, non-hierarchical thinking.
New authors are born, whose work may reach a much wider audience through the network. The concept of network is expanded, a simple interconnection between computers becomes a metaphor for the organization of the cyberspace (Ramal, 2003), where all voices may be heard, where intersubjectivity flows and knowledge is produced collectively.
With all these possibilities, several initiatives still approach the use of DICTs as teaching machines. hence the urgent need to understand how media and technologies articulate in the present contexts and in the “actual life of the school”, as asserted by Paulo Freire.
In the current scenario, the use of technologies in education must not be confused with using devices, strategies and tools to make lessons more interesting or dynamic, or even to motivate young students (Silva, 2010). Additionally, they must not be used as the former teaching machines, solely to provide preset content and tests.
A quick study reveals that when students come to school, they have already had extensive exposure to media and technology, because, as emphasized by Gadotti (2005), students’ first culture is the media culture. Regardless of the context in which they live, students bring their everyday experiences with different media and technology to school, but they tend to view these as means and devices for communication, not as learning resources, tools or interfaces.
Similarly, educators are in touch with media and technologies on a daily basis, but these are usually not introduced in the classroom as tools for the mediatization of teaching, learning and syllabus enhancement processes. The integration of technologies in the school syllabus depends on a number of factors: Implementation of technological infrastructure; access to technologies; digital literacy of educators; consistent use policies; integration of all players involved in the universe of technologies; among others. hence, for effective integration of media and technologies into educational processes, training teachers, managers and other educators is key (Prado & Silva, 2009).
Thus, we envisage a combination of efforts from public and private education initiatives towards gradually implementing access to the Internet and broadband in schools, supplying computer labs and mobile computers, increasing the number of teacher and manager training courses, amongst other initiatives.
The increasing and integrated use of information and communication technologies is currently prominent in the education scenario, and viewed as a future trend. The use of computers tends to increase from few hours in computer labs to something more frequent, in different situations and learning environments and through connected mobile devices. This more frequent use is also motivated by new possibilities of authorship, collaborative content production with the integration of several media, publication, sharing and distribution enabled by Web 2.0 tools, as analyzed below.
2010 Survey on ICT Education ARTICLES 149
En
gli
sh
WEB 2.0 ANd SoCIAL mEdIA: SoCIAL WEB
Web 2.0 is more than a new technology; it represents a change in how the web itself is used, where users expand their role of browsing or searching content to also producing and sharing it. It also means that technological tools will become more accessible and simpler to use, enabling users, such as teachers and students, to easily post content. According to several authors and researchers, Web 2.0 is only a second generation of Internet use.
The production potential brought about by the use of technologies enhances the syllabus broadening process identified in the first generation of the Internet (known as Web 1.0, and focused on providing information), as Web 2.0 increases the potential for multidirectional interaction and the involvement of people located in different places with access to DICTs, who are thus able to share information, solve problems and produce knowledge collaboratively, being co-authors with people from all over the world.
This increases the involvement of teachers and students as authors and knowledge producers, and promoters of studies and projects. Interaction and co-authorship are prominent characteristics of Web 2.0, and are the drivers of several easy-to-use, free or low cost technologies that enable collaborative production, such as blogs, Wiki, YouTube, among others – the social media.
Resources and interfaces available on Web 2.0 may be viewed as more than mere tools, due to how easily and flexibly they can be used for collective production and knowledge sharing through different media (text, sound, image, podcast, video, and etc.), providing services for the creation of social networks, which are open spaces for ideas and information exchange and meeting points for communities and studies on topics of interest.
Web 2.0 may also be referred to as Social Web (Isotani et al., 2008), as its use promotes the creation of social networks – which have emerged from sociology, a science that studies the complex interactions in social life and epistemological challenges of integrating complexity and diversity into social processes.
In education, there may be environments where social networks can be created to keep in touch with students, former students, and to put them in touch with each other. A few examples are relationship networks, such as Facebook and Orkut, and other professional networks, such as hi5 and LinkedIn; communication and interaction tools, such as Twitter; tools for communities for specific practices, such as Ning, which also aims to integrate the academic community in a metassocial tool; tools for sharing and exchanging images and videos, such as YouTube; tools for collaborative editing on the Internet, such as Wiki and GoogleDocs; tools for instant communication, such as MSN and Skype; network gaming environments; virtual worlds... among numerous other options that, associated with education, enable authoring, collaborative creation and sharing.
USE oF moBILE dEvICES IN EdUCATIoN: moBILE LEARNING
The combination of Web 2.0 with mobile technologies, such as different types of portable computers (netbooks, iPads and mobile phones), enables the design of a broad, dynamic and flexible syllabus

Survey on ICT Education 2010ARTICLES 150
En
gli
sh
(Almeida, 2010b), fostering connections between different areas of knowledge, the experiences of teachers and students and the relationships forged in education.
Mobility transforms the logics of how and when to learn. The idea of being somewhere to learn or learning being anywhere has become the reference in the digital society. There is only one meaning to the word mobility, but its potential is twofold – technological, which enables us to use a device anywhere, and in terms of content, which relates to information, to where it is located, in which being able to access, produce and share it is more important than the facts themselves (Basso, 2003).
Marçal, Andrade & Rios (2005, p. 3) argue in favor of the use of mobile devices in education for the following main purposes:
• Improving teaching resources, using such devices to execute tasks, take notes, look up information online, keep records and other functions;
•Providing access to content anywhere and anytime;
• Increasing access to content, enhancing and promoting the use of the services provided by the institution;
•Broadening the scope of existing teaching strategies through new technologies that support both formal and informal learning;
•Providing means for the development of innovative teaching methods, using computing and mobility resources.
The use of mobile devices in education, given their possibilities, features and relevance to digital inclusion, is known as a mobile-learning (Silva & Consolo, 2008).
There are important experiences in the development of mobile learning. One of them, led by the Brazilian federal government, is known as One Laptop per Student (UCA), which aims to provide a laptop per student, teacher and school manager. In this project, students and teachers can use laptops connected to the Internet, and this use is not restricted to computer labs or classrooms. The project is under way in selected public schools as a trial phase, and is aimed at promoting the digital and social inclusion of the school community, as well as the use of this technology in teaching processes and syllabus enhancement. There are several other initiatives for the use of portable computers in public and private education systems.
FINAL ThoUGhTS ANd CoNCLUSIoNS
The current scenario points towards the implementation of pedagogical innovations enabled by the use of technologies in education, particularly the application of certain concepts and features available through innovations, such as Web 2.0, wireless connectivity, mobility and use of individual laptops by students. Other virtual environments and tools are also potentially being used and explored in education, such as three-dimensional immersive environments (metaverses) and games, among other existing or emerging environments.
The coexistence and integration of these innovations may even be compatible with technologies already in use, all converging to enhance innovation in education, which is realized through
2010 Survey on ICT Education ARTICLES 151
En
gli
sh
multidirectional interactions, the creation of networks of knowledge production and co-authorship, the expansion of teaching spaces and times, and educational techniques using different forms of writing and languages.
As an ongoing trend, these tools and activities shall also be ingrained in Web 3.0 (Semantics Web), favoring the so-called collective knowledge systems, “able to support collective knowledge production through the analysis of collaborative human efforts” (Isotani et al., 2008, p. 6).
Finally, the use of a technology in particular affects how we teach, think and relate to other people, as well as how the syllabus is conceived and enhanced. Kenski (2007) emphasizes:
The availability of a particular technology may induce profound changes in how teaching is
structured [...] there is a direct relationship between education and technology. We use many
types of technologies to learn and to know more and we need education to learn and to know
more about technology. (p. 44)
hence, introducing new technologies to teaching methods requires reviewing how the syllabus is structured.
REFERENCES
ALMEIDA, Maria Elizabeth Bianconcini. “Tecnologias na educação: dos caminhos trilhados aos atuais desafios”. BolemA – Boletim de Educação Matemática, 29(21), 2008.
______. “Transformações no trabalho e na formação docente na educação a distância on-line”. em Aberto, Brasília, 23(84), pp. 67-77, Nov. 2010a.
______. Web Currículo, caminhos e narrativas. In: Proceedings of the Second Seminar curriculum web. Published in CD-ROM. São Paulo: PUC-SP, 2010b.
BASSO, Maria Aparecida josé. Pedagogia digital na convergência do suporte “e” da educação: uma proposta de modelo para logística de negócios sob demanda. Doctorate in production engineering. Florianópolis: Graduate Program in Production Engineering of the Federal University of Santa Catarina, 2003.
CASTELLS, Manoel. “Internet e sociedade em rede”. In Moraes, D. (org.). Por uma outra comunicação. Rio de janeiro: Record, 2003.
GADOTTI, Moacir. A escola frente à cultura midiática. In: OROFINO, Maria Izabel. mídias e mediação escolar: pedagogia dos meios, participação e visibilidade. Guia da Escola Cidadã, v. 12. São Paulo: Cortez / Instituto Paulo Freire, 2005. pp. 15-94.
ISOTANI, Seiji et al. Web 3.0: os rumos da web semântica e da Web 2.0 nos ambientes educacionais. In: Proceedings of the xix the Brazilian Symposium on computer in education. SBIE, 2008.
KENSKI, Vani Moreira educação e tecnologias: o novo ritmo da informação. Campinas: Papirus, 2007.
LEIGh, Douglas. A Brief history of Instructional Design. In: iSPi global network chapter. 1998. Available at: http://www.pignc-ispi.com/articles/education/brief%20history.htm.
LéVY, Pierre. cibercultura. Trad. Carlos Irineu da Costa. 2. ed. São Paulo: Editora 34, 2000.

Survey on ICT Education 2010ARTICLES 152
En
gli
sh
MARçAL, Edgar; ANDRADE, Rossana; RIOS, Riverson. “Aprendizagem utilizando dispositivos móveis com sistemas de realidade virtual”. In renote – revista novas tecnologias na educação, 3(1), Porto Alegre, UFRGS, Centro Interdisciplinar de Novas Tecnologias na Educação, May 2005.
PAPERT, Seymour. logo: computadores e educação. São Paulo: Brasiliense, 1985.
PRADO, Maria Elisabette Brisola Brito; SILVA, Maria da Graça Moreira. “Formação de educadores em ambientes virtuais de aprendizagem”. em Aberto, Brasília, 22(79), pp. 61-74, jan. 2009.
RAMAL, Andréa Cecília. “Educação com tecnologias digitais: uma revolução epistemológica em mãos do desenho instrucional”. In: SILVA, Marco (org.). educação on-line. São Paulo: Loyola, 2003.
SANTAELLA, Lucia. navegar no ciberespaço: o perfil cognitivo do leitor imersivo. São Paulo: Paulus, 2004.
SILVA, Marco. Sala de aula interativa. 3. ed. Rio de janeiro: Quartet, 2002.
SilvA, maria da graça moreira da; conSolo, Adriane treitero. “mobile learning: uso de dispositivos móveis como auxiliar na mediação pedagógica de cursos a distância”. in: OSÓRIO, Antonio josé; DIAS, Paulo. Ambientes educativos emergentes. Minho: University of Minho, 2008.
SILVA, Maria da Graça Moreira da. “De navegadores a autores: a construção do currículo no mundo digital”. In: Proceedings of the endiPe. Belo horizonte: 2010.
VALENTE, josé Armando; ALMEIDA, Fernando j. “Visão analítica da informática na educação no Brasil: a questão da formação do professor”. revista Brasileira de informática na educação, v. 1, 1997.
2010 Survey on ICT Education ARTICLES 153
En
gli
sh
ThE ChALLENGES oF EdUCATIoN IN PRomoTING EThICAL ANd SAFE USE oF ThE INTERNET IN BRAzIL
Rodrigo Nejm1
INTRodUCTIoN
The democratization of Internet access is a hot topic on the agenda of several public policies in the country, namely the National Broadband Plan and the Broadband in Schools Project. These two initiatives are attracting millions of new Internet users to the Brazilian Internet, thus quickly creating an array of new types of cultural, scientific, social and political relationships in our contemporary society. These policies -in addition to projects to expand public telecenters and to regularize thousands of LAN houses in Brazil- are forging a new social reality by enabling the creation of new languages, new meanings and the development of the digital culture. In addition to their fast rate of development, technologies are incorporated into the lives of Brazilian citizens very quickly, constantly producing astonishing statistics. Despite data from the ICT households 2009 Survey, by the Cetic.br, showing that 55% of the Brazilian population has never accessed the Internet, the aforementioned survey has shown that 69% of the Brazilian population aged between ten and fifteen years old and 78% of youngsters aged sixteen to twenty-four years old have access to the network. Internet access is a reality for 29% of the children aged five to nine years old, according to Cetic.br’s ICT Kids 2009 Survey.
We have witnessed profound psychosocial changes in contemporary childhood, adolescence and youth, driven by several contemporary trends, such as the intense and diverse use of information and communication technologies (ICT). Undoubtedly, ICT play an important role in transforming how new generations socialize, learn, communicate and play. Nonetheless, they also drive radical changes in fields such as consumption, the conflict between generations, labor relations, civil rights and even politics in some societies. As formerly stated by researcher Sonia Livingstone (2009), we
1 Psychology graduate from Unesp (Assis-SP) and Master in Social Management and Development from CIAGS/UFBA. Director of Prevention at the NGO Safernet, in charge of creating educational materials, courses and research for the prevention of Internet crimes against human rights in Brazil. A researcher in the fields of psychology and new media, the author is engaged nationally and internationally in research on subjectivities in the age of information.

Survey on ICT Education 2010ARTICLES 154
En
gli
sh
cannot base our understanding of society on technologies alone, and overlook other changes in work relations, family structure and consumerism amongst children and youngsters.
Technological resources have been massively and rapidly incorporated into the daily lives of new generations of children and teenagers. Even lower social classes have increasingly greater access to the Internet, mobile phones and electronic devices for communication, study, work and entertainment. When we think about the challenges of ethically and safely introducing the Internet into the lives of children and teenagers, we cannot overlook the fact that the cyberspace is a social networking space. To this day, several Internet users still view the Internet as a “no man’s land, devoid of accountability”, believing that anonymity grants them the freedom to do anything. One of the primary challenges in promoting the ethical and safe use of the network is making users aware of the public dimension of the cyberspace; a space where people, not just computers, socially interact. In this new environment, as well as in any other public spaces, we also need to behave as citizens and adopt security measures. There certainly are private spaces in the cyberspace, but the massive use of social networks, blogs, cameras and mobile phones is increasingly blurring the boundaries between public and private (Livingstone, 2009). Even in private spaces, the approach to the rights and duties of citizens/netizens should be appropriate from the first click.
Digital inclusion policies cannot be restricted to access to technology. Digital inclusion must be viewed as a broader educational process that prepares Internet users to approach the network critically and to view themselves as citizens, thus enabling internauts to play their role as citizens in ICT-enabled social environments. “In a way, the Internet emulates the real world” (Amadeu, 2010). Education in the contemporary world requires preparing individuals to dwell in these new cyber streets and squares, where younger generations spend a lot of their time. When on the Internet, a child accesses a global public space with countless types of information and people, including all the benefits and dangers enabled by any public space. There are naturally many more opportunities than risks, but similarly to any large and busy public space, there are also different levels of crimes, scams and human rights violations in the cyberspace. Children and teenagers, who start using the Internet at an increasingly early age, need to be educated to understand its ethical dimension, i.e. their rights and duties online, not only for protection, but, more importantly, for emancipation, enabling them to browse the network autonomously, responsibly and safely.
Education in Brazil faces enormous challenges in a number of areas, but this should not prevent us from incorporating issues related to education for safe and ethical use of the Internet. The small proportion of children and teenagers who access the Internet from school – 27% of the children aged five to nine years old – ICT Kids 2009; 25% of the children aged ten to fifteen years old and 17% of the youngsters aged sixteen to twenty-four years old – ICT households 2009 – reveals, in part, the role of schools in this process. Despite all the efforts to increase access from public schools, Internet use reaches far beyond school walls. The ICT households 2009 has also shown that 61% of the children aged between ten and fifteen years old access the Internet from LAN houses. The latter play an important role, not only in granting access, but also in promoting socialization, and must be viewed as potential protection and education agents, rather than intrinsically dangerous. Regarding education for ethical and safe use of the Internet, the actual places of access are not the most important factors in the equation, but whether these places provide the conditions to educate children and teenagers on how to use the Internet and other ICT. Children and teenagers can learn very quickly how to use new digital resources, both devices and online services, but education on how to use them ethically requires a broader process of education for citizenship,

2010 Survey on ICT Education ARTICLES 155
En
gli
sh
involving schools, families and society as a whole. The generation gap will not be so prominent in this process if its approach is centered on education for citizenship, rather than on pragmatic education for the use of ICT. Educating for citizenship is a collateral goal of educational policies, and ICT must be urgently incorporated into educational projects, not only as technical resources, but also as producers of new spaces for socialization, new cultural expressions and mediators in character-building.
The National Plan for human Rights Education (PNEDh, 2007) and the Ethics and Citizenship Program, created by the Ministry of Education (MEC) and the National Secretariat for human Rights (SDh), create opportunities to discuss the issue as a public policy. There is a branch of the PNEDh dedicated to media, which could steer the incorporation of ICT in the pedagogical approach of Brazilian educators. Initiatives by the e-Proinfo program, implemented by MEC, are progressing on educational appropriation, and may be complemented by incorporating the issue of the ethical use of the Internet, thus empowering schools as citizenship educators for ICT as well. Using these references and promoting the creation of open educational resources are means by which our young Internet users can be educated and oriented in schools, LAN houses, at home and on the Internet itself, by adapting educational content to each socio-cultural context and focusing on the public aspect of education. Raising educators’ and parents’ awareness seems vital to ensure they are able to encourage Internet use by children and teenagers based on the perspective of promoting rights, not just for protection. Ethical use of the Internet foresees that citizens must be fully aware of their rights and responsibilities, and are able to engage in online relationships respecting multiculturalism and diversity. The principles of ciberdemocracy (Lemos & Levy, 2010) are in line with the fundamental principles of human rights, and we cannot conceive a digital culture in which Internet users are not aware of these.
The Brazilian Constitution prescribes (art. 227) the promotion and protection of the rights of children and teenagers as an absolute priority. It is evident that, even offline, this priority is not yet fully enforced, despite significant advances since the Children and Teenager’s Act came into effect twenty years ago (ECA 1990). Currently, there are intensive measures in force to combat sexual Internet crimes against children and teenagers, but the issue requires more than what is prescribed in art. 227 of the Brazilian Constitution. We must always bear in mind that children and teenagers are, above all, individuals who have individual rights, not mere targets of security measures. That is, we must also promote the laws that guarantee their sexual rights, their right to privacy, freedom, and their right to access the network for entertainment and culture. Not unlike other Internet users, children and teenagers also need to have their right to autonomous access ensured. Safe browsing for them need not be a synonym of Internet surveillance and restricted freedom, when security is viewed as a human right – an inalienable right. This awareness is key to initiatives focused on the best interests of children and teenagers, because, as individuals with rights, they should not be passive recipients of ‘aid’, welfare or protectionism from adults and policies. Protection, inside or outside the Internet, involves balancing the exercise of rights and privacy, freedom and access to information within limits foreseen to respect the uniqueness of each phase of the development of children and teenagers. This challenge is even more complex on the Internet, with its increasingly fluid and dynamic boundaries, restrictions and symbolisms.
Regarding the discussion above, we believe it is paramount to employ efforts to bring forward measures which can prevent the risks and vulnerabilities of children and teenagers on the Internet in Brazil.

Survey on ICT Education 2010ARTICLES 156
En
gli
sh
RISKS ANd oPPoRTUNITIES IN ThE CYBERSPACE
The increasing Internet user and usage rates in Brazil are directly proportional to the increasing rate of crimes and rights violations, which poses another enormous challenge to education and to the system safeguarding children and teenagers today and in the near future. Similarly to other public spaces, the Brazilian Internet also hosts crimes and/or violations of human rights, including the sexual exploitation of children and teenagers in child pornography networks, public humiliation on the Internet (cyberbullying, defamation and libel), promotion of crimes against life, and expressions of intolerance towards religious, ethnic and sexual orientation. Even victims who are not physically injured are seriously affected by the violence of blackmailing, inappropriate content, exposure and self-blaming after traumatic experiences on the Internet. Violent situations are also emulated on the Internet, not because it is a more dangerous or unsafe environment, but because it mirrors society and it is a product of its users’ behavior. For as long as it is viewed as a parallel environment to valid social norms, online rights violations will tend to increase. Society’s challenge is to minimize Internet and ICT risks and to maximize their opportunities for all age groups, through combined education efforts.
The use of technologies has maximized several practices of sexual violence in Brazil, increasing the need for preventive and effective actions to preserve the dignity of actual and potential victims. Internet services have enabled easier exchange and disclosure of illegal content, which have escalated to global proportions, such as advertising and selling sex tourism packages and using ICT to sexually entice children and teenagers. It is noteworthy that all of these practices enabled by ICT are regarded as crimes under the ECA, as per articles 240 and 241. ICT may also be used to promote crimes against life, use of illegal drugs, torture and different types of violence, through tips and manuals for “beginners”. The volume of racist and homophobic content available is noteworthy. The ease with which information is exchanged and people communicate through the Internet promotes existing social practices, both those which encourage citizenship and those which violate laws and citizens’ inalienable rights.
The ability to forge virtual identities promotes risk behaviors, maximizing aggressive practices and bullying amongst children. Violence is magnified when offensive messages reach thousands through video, photo and text share websites. Children and teenagers humiliate and are humiliated in front of a much wider audience, which includes family members, neighbors and an almost unlimited universe of Internet users who can access embarrassing scenes; this is referred to as cyberbullying. What is seemingly just a joke for those who initiate, forward and view such material may have serious psychosocial consequences to its victims, compromising healthy development. Another recent and worrying phenomenon is the so-called sexting, which consists in teenagers sending photos of themselves naked or semi-naked to friends and love interests via text messages or the Internet. Often the victimized teenager loses control over the image, which spreads through the network and may be featured in child pornography websites. Such practice violates articles 241-A, B and E of the ECA, and evidences the need for education on sexuality and the severity of the risks incurred when children and teenagers are not adequately oriented about the dangers of online exposure.

2010 Survey on ICT Education ARTICLES 157
En
gli
sh
SIGNS oF vULNERABILITY ANd INdICAToRS oF hUmAN RIGhTS vIoLATIoNS oN ThE INTERNET
The EU Kids Online survey on Internet risks and safety, conducted in 23 European Union countries by the London School of Economics, with over 23 thousand children between nine and sixteen years old (Livingstone & haddon, 2010), reveals the dimension of certain online vulnerability situations. Despite the high rate of Internet dissemination in European countries (over 90% in some cases) and 85% of respondents having home access to the network, European children and teenagers are unaware of basic concepts of online security. In the age group between eleven and twelve years old, only 43% of the respondents knew how to block unwanted messages and 48% knew how to find guidance on safe use. In the group between eleven and sixteen years old, only 54% knew how to change the privacy settings of their profiles on social networks. Regarding risk situations, 24% declared that they had been victims of cyberbullying, 15% had practiced sexting, and 8% had left home to meet an online friend (first met online) in person.
In Brazil, although the Internet is significantly less widespread (69% of the children aged between ten and fifteen, and 78% of the youngsters aged sixteen to twenty-four years old), 58% of the children aged between ten and fifteen years old spend one to five hours per week online, 15% spend six to ten hours a week, and 74% take part in social networking websites (ICT household Survey 2009). In a survey on online security habits (Safernet, 2009), 69% of the students had at least one online friend (first met on the Internet), and 32% had over thirty such friends. 12% of students had dated at least once over the Internet, and 11% had already published intimate and/or sensual photos online. Regarding cyberbullying, 33% declared having a friend who had already fallen victim to this kind of humiliation. According to 90% of the educators, the Internet and other ICT have positive effects on the lives of their students. For 77% of the educators, it is not unusual to have students commenting on the Internet in the classroom, while 65% of the educators believe it to be a constant practice. Regarding the dangers experienced by students, 6% were aware that students in their schools had been victims of sexual grooming on the Internet. Regarding cyberbullying, 26% of the educators were aware of such cases between students in their schools. As for the school’s commitment to discuss online security measures, 99% regarded it as the school’s duty, and 67% regarded it as an urgent issue which should be addressed through ongoing guidance initiatives. Nonetheless, worryingly, 50% of the educators believe that there is not enough information to address the subject in schools, and 24% were not aware of any programs which dealt with the subject. When asked about the resources they have to address the matter in the classroom, 29% stated that they did not have any resources, but wished they did, and a further 9% did not have and did not know how to find this type of resources.
In view of this complex scenario, it is paramount that civil society organizations, families, companies and governments join efforts to maximize the promotion of the rights of children and teenagers on and off the Internet. Different policies and initiatives must be coordinated, and public services must be expanded to use technology itself to maximize opportunities, to minimize risks and to render the Brazilian Internet a safe gateway for our children and other Internet users to establish and develop ethical, safe and healthy social relationships.

Survey on ICT Education 2010ARTICLES 158
En
gli
sh
EdUCATIoN FoR RIGhTS ANd PREvENTIoN
Knowing that new generations are growing up accustomed to the continuous use of new technological devices, it is essential that these same devices are used to educate, to protect and to guide them. Many children and teenagers do not find enough spaces to vent their doubts, anxieties, worries and issues related to the use of the Internet and potential online or offline violations of their rights. It is worth noting that there is a huge gap in technological skills among the current generation of educators, counselors and parents and the generations of students/children. To prevent the increase of victimization, young Brazilian internauts must, from the first click, know how to ensure their safety and have their rights enforced. Not only children, but also parents, educators and agents in the system that enforces rights must learn how to avoid online risks, and to be up-to-date with the new types of rights violations enabled by the widespread use of ICT. As suggested in the beginning of the present article, the Internet must be viewed as a public square and, based on this concept, guidelines, precautions and restrictions must be designed for children and teenagers, according to their specific age groups and contexts. We cannot wait for sexual grooming, virtual blackmailing, suicide incitement or cyberbullying over the Internet to increase to alarming proportions before we react.
Children and teenagers have the right to learn, to enjoy, to interact and to play in the cyberspace freely and privately, and their uniqueness as developing individuals must also be preserved on the Internet (articles 15, 16, 17 and 71 of the ECA). hence, we need to guide them towards responsible, citizen-oriented and secure use of the network, providing adequate conditions to ensure their full protection. Initiatives must aim higher than protection alone, because, as citizens with individual rights, children and teenagers are able to actively participate in determining their own “best interests” (Melo, 2008). Phenomena such as sexting reveal a complex scenario in which the Internet empowers teenagers to astonish relatives, institutions and adults in general. Does it expose a scenario of objectified, mediated sexuality, or just the free expression of sexuality? In times of hyper connection, which criteria based on the unique nature of developing individuals should be taken into account in granting them access to information, culture, entertainment and Internet privacy? These and related issues must be debated in order to foresee risk situations, and to minimize their consequences as quickly as possible, fully granting the freedom of the millions of new users which Brazil will have in the forthcoming years.
Children and teenagers aren’t always able to foresee the consequences of their behavior “behind the screen”, which reveals the large scope of issues such as sexual rights in adolescence. In order to ensure that education will promote the enforcement of rights and emancipation, we must readdress reductionisms, which undermine the voice and will of children and teenagers in the name of, supposedly, protection. The Internet greatly empowers its users, and this empowerment will only be ethical and citizenship-oriented when the notion of the Internet as a “no man’s land of absolute impunity” is demystified. The most effective approach is far from restricting freedoms or criminalization; it relies on educational processes that create the conditions for responsible and conscious use of the Internet. Accounting for the extent of the public dimension of the Internet and recognizing the responsibilities that follow the rights in the relationships it enables will promote the development of an increasingly freer and more democratic Internet. If parents and educators do not immediately take the reigns of this educational process, online as well as offline, the future of children’s and teenagers’ human rights and of the Internet itself may be threatened. Relationships
2010 Survey on ICT Education ARTICLES 159
En
gli
sh
enabled by ICT are having a more prominent role in the contemporary process of creation of subjectivity. In this context, our greatest challenge regarding ICT is as old as civilization itself: how to promote education that enables humane living conditions for the development of life projects that respect human rights and promote fair and ethical social relations?
REFERENCES
AMADEU, S. A. “MONITORING AND PUNIShMENT: COMMUNICATION AND CONTROL ON ThE INTERNET”. In: CGI.br. Survey on the use of information and communication technologies in Brazil: 2005-2009. São Paulo: Brazilian Internet Steering Committee, 2010.
BRAzIL. Comitê Nacional de Educação em Direitos humanos. Plano nacional de educação em direitos humanos. Brasília: Secretaria Especial dos Direitos humanos, 2007a.
BRAzIL. estatuto da criança e do Adolescente, Law no 8,069, from july 13, 1990. Available at: http://www.planalto.gov.br/ccivil_03/leis/l8069compilado.htm.
BRAzIL. Ministry of Education. Secretariat for Basic Education. Programa Ética e cidadania: construindo valores na escola e na sociedade: inclusão e exclusão social. Brasília, 2007b.
CGI.br. Survey on the use of information and communciation technologies in Brazil – ict kids 2009. São Paulo: Brazilian Internet Steering Committee, 2010.
. Survey on the use of information and communciation technologies in Brazil 2009 – ict households and ict enterprises. São Paulo: Brazilian Internet Steering Committee, 2010.
LEMOS, A. & LEVY, P. o futuro da internet: em direção a uma ciberdemocracia planetária. São Paulo: Paulus, 2010.
LIVINGSTONE, S. children and internet: great expectations, challenging realities. Cambridge: Polity, 2009.
LIVINGSTONE, S.; hADDON, L. (orgs.). risks and Safety on the internet: the Perspective of european children. London: EU Kids Online, 2010.
MARTÍN-BARBERO, j. dos meios às mediações. Rio de janeiro: Editora da UFRj, 2001.
MELO, Eduardo Rezende. “Direito e norma no campo da sexualidade na infância e na adolescência”. In: ABMP. criança e adolescente: direitos e sexualidades. São Paulo: ABMP, 2008.
SAFERNET BRASIL. Saferdic@s Booklet. Available at: www.safernet.org.br/cartilha.
. Pesquisa hábitos de navegação e vulnerabilidades on-line 2009. Available at: http://www.safernet.org.br/site/prevencao/pesquisas, 2009.
SILVEIRA, R. M. G. et al. (org.). educação em direitos humanos: fundamentos teórico-metodológicos. joão Pessoa: Editora da UFPB, 2007.


2010 Survey on ICT Education ARTICLES 161
En
gli
sh
TEAChER TRAINING FoR ThE USE oF ICT IN EdUCATIoN IN LATIN AmERICA
Maria Inês Bastos 1
Teacher training for the use of ICT in education is a recent theme in Latin America which has resulted from the maturity of the process of technological modernization of schools. Most teacher trainers in this region are not even part of the group of the so-called “digital immigrants”, i.e. they have not yet had the opportunity to familiarize themselves with the use of new technologies long after their own teaching qualification, and after years of professional practice in schools lacking such technologies. Many actually remain excluded from innovations. A large number, perhaps most, of the teachers currently working in primary and secondary schools have not learned the basics of using new technologies, much less their educational applications in early education. Some have “migrated” on their own initiative, encouraged by technological advances in society or by training courses provided by employers. These teachers find themselves in the position of having to lead groups of students who are “digital natives” in schools equipped with devices far inferior to what these students have at home or in public access centers.
CURRICULAR PRoFILE oF INITIAL TEAChING qUALIFICATIoNS
Studies on teacher training in Brazil (Gatti & Sá Barreto, 2009) and in Colombia, Ecuador and Venezuela (Fabara, 2004) indicate very similar situations to what the Chilean Ministry of Education found before implementing the Project for Strengthening Initial Teacher Training (FFID). In the three countries surveyed, Fabara found traditional curricula, with no research or experience in research and innovative practices, in which educational resources are not created to promote active education, and there are no processes for the development of thinking and creativity.
The FFID Project, from Chile, was prepared to tackle the declining quality of resources in tertiary teaching qualification courses, which is accompanied by a reduced number of applicants and consequent lower admission standards. The decreasing quality of courses resulted from a weak
1 Master’s in Political Science from the Federal University of Minas Gerais (UFMG), and doctorate in Development Studies from the University of Sussex, England. Former professor at the University of Brasília (UnB), adviser to the federal senate, researcher at the Institute for New Technologies in Maastricht (holland), and Unesco employee in Brazil.

Survey on ICT Education 2010ARTICLES 162
En
gli
sh
curricular structure – heterogeneous and fragmented content, too many lectures and few practical activities – the characteristics and approach of trainers – older, unqualified, outdated and with limited access to actual schools – a poor history of achievements in high school and little support available from teachers and learning resources.
In Brazil, the curricula of university courses in pedagogy – which train teachers to work in the first years of primary education – are fragmented, with an uneven choice of subjects. The time assigned to subjects specifically related to professional qualification amounts to only 30% of the overall course duration. An analysis of the syllabuses of the subjects specifically related to training reveals the prevalence of a theoretical framework – whether sociological, psychological or otherwise – with only occasional association to educational practices.
Thus, the syllabuses of subjects specifically related to professional training seem to aim to shed
light on the reasons for teaching, which, to some extent, prevents these subjects from becoming
mere recipes; however, their concern with what and how to teach seems incipient. (Gatti & Sá
Barreto, 2009, p. 152)
Technology as a theme (which is not limited to ICT, but includes them) is addressed both in “knowledge related to technology” – which is part of what is viewed as “knowledge related specifically to professional training” – and “other knowledge”, but represents a very small share of the overall time devoted to training future teachers.
The experience of the FFID, from Chile, although auspicious regarding curriculum content, failed to reach the desired standards. Rodríguez Méndez and Sival Quiroz (2008) have conducted an in-depth study of how 19 university programs for initial teacher training, which had been the beneficiaries of the FFID, used ICT as a pedagogical resource. Their analysis shows that the issue is addressed in lectures and complemented by practical activities in computer labs, and, to a lesser degree, also involves collaborative work and project design. The subjects are commonly denominated educational IT and educational computing and cover topics related to the design and operation of computers, use of operating systems and productivity tools (word processor, spreadsheets and presentation software), and use of the Internet as a resource for communication and data search. These subjects reveal clearly an operating approach to ICT tools in the programs analyzed. They do not present ICT as elements that can contribute to the professional development of teachers, they do not emphasize the opportunity to share experiences and products validated by their peers, they do not account for the benefits of ICT in school management, let alone lead to knowledge and reflection on the role of ICT in society, which could lead to debate about their ethical, legal and social issues.
Unfortunately, there are few studies that provide detailed analyses of the content of curricula and the syllabuses of subjects being taught to the future teachers of Latin America, which prevents drawing a clearer picture of how the skills required in education are developed. In the absence of such information, it is impossible to verify how the potential of ICT for teaching and learning is, in fact, presented to prospective teachers.
One can therefore say that “ICT and education” is a topic largely absent from the educational reform and the reform of teacher training in Latin America. Even in Cuba, where initial teacher training curricula already included the subject “computing” since the 1990s, and Chile, where ICT have
2010 Survey on ICT Education ARTICLES 163
En
gli
sh
been part of the set “instrumental knowledge for teaching”, there were indications that training was to be limited to familiarizing teachers with devices and basic applications, and, sometimes, access to equipment was limited to trainers.
Brazil’s situation may be used as an example. The educational authorities’ intention to include the theme of “ICT and education” in initial teacher training became clear in 2009, when the National Policy on Education of Teaching Professionals for Basic Education (Decree no. 6,755 from january 29, 2009) and then the National Teacher Training Plan for Basic Education (Normative Decree no. 9, from july 1, 2009) were implemented. Decree no. 6,755/2009 sets forth the following as one of its objectives: “IX – to promote theoretical and methodological updates on teacher training processes for basic education, including practices related to the use of information and communication technologies in educational processes”.
Preparing trainers in the pedagogical use of ICT is one of the issues to be faced in Brazil and other Latin American countries that intend to incorporate the new ICT in their educational practices. This is not a simple task, considering the large demand to be met, but research activities in many teaching tertiary courses or psychology departments in the finest universities in the region are already able to contribute with a significant number of trainers. In this case, the challenge is how to attract and keep these people in teacher education institutions.
The limited inclusion of the theme “ICT and education” in the curriculum of initial teacher education in Latin America is part of a context of the late and uneven diffusion of these technologies in the region. Only recently have ICT acquired a prominent status in Latin American economy and society. The “computerization” of public schools played an important role in bridging the digital divide; however, it did not seem to prompt the introduction of the theme in initial training, nor result in sufficient pressure on working teachers to use ICT to make the teaching / learning processes more dynamic.
ICT IN LATIN AmERICAN SChooLS
The aim of improving the effectiveness and quality of education has steered public initiatives towards implementing computing in schools. Overall, literature finds the first initiatives of introducing ICT in education as those intended to introduce computers in schools, and later connectivity. In Latin America, the first steps in this direction were taken in Costa Rica (National Program of Educational Computing), in 1988, in Chile (Red Enlaces), in 1992, and in Brazil (Proinfo), in 1997.
Gradually, and encouraged by the apparent surge of the Internet in developed countries, most countries in Latin America, by mid the 1990s, had created ICT initiatives or programs for schools. These initiatives aimed at improving the quality of education through the creation of learning environments with high technological content – including the use of multimedia software and computer networks – to stimulate creativity, logical thinking and problem-solving skills. At the end of the decade, the RIVED – a regional collaborative initiative involving Brazil, Peru and Venezuela – aimed to unlock the potential of the development of educational software in universities around the region to create “learning objects” that could be used by several countries, with adjustments to

Survey on ICT Education 2010ARTICLES 164
En
gli
sh
specific curricular requirements. The initiative resulted in the International Database of Educational Objects, available through the website of the Brazilian Ministry of Education.2
The results of these initiatives are evident in the number of computers installed in schools – sometimes without resources for maintenance and equipment upgrading. As emphasized by Valdivia (2008), in some countries policies are very recent and have resulted in little more than a single website with educational content, with low coverage of connected schools and qualified teachers. however, there are countries where sustainable policies have been implemented for decades, coverage is widespread, education portals have the relevant content and there is a systematic process of on-the-job training. In some of them, a new generation of policies is dawning, exploring advances in broadband and wireless connection. Mexico has been developing the Enciclomedia3 project, Chile has plans to reduce the rate of students per computer from 30 to 10 by the end of the decade, and Argentina, Brazil and Uruguay are involved in the One Laptop per Child project (um laptop por criança). The Latin American Network of Education Portals was launched in 2004, creating potential to enrich content by sharing information.
From a technological and educational standpoint, Valdivia (2008) synthesizes computerization of schools in Latin America as based on at least three models – computer labs, school networks and computers in classrooms.
The computer lab is the most widely spread and criticized model. It is a convenient solution in terms of flexibility and costs for schools, but it may also produce undesirable side effects. Among the most prominent effects there is the intimidation of teachers, the separation of “computer classes” from the rest of the teaching / learning process and separation of teachers from “computing teachers” or computer technicians responsible for the computer lab. Computer labs are more often used by teachers and students out of class time for studies, research or other activities, such as email, games and browsing the Internet. A positive aspect is that they are also used for Internet access by community members, usually on weekends.
School networks promote Internet use as a basis for promoting exchange of experiences and projects and collaboration among participating schools. They widen the opportunities for research and knowledge for teachers and students to create the basis for collaborative work and exchange of experiences in everyday classroom. Examples of school networks in Latin America are RedEscolar (Mexico), Red Telemática Educativa (Costa Rica), Red Telar (Argentina) and Conexiones (Colombia).
In the third model, teachers organize teaching activities based on individual or group work supported by digital resources, but, unlike the first model, it does not require a special place outside the classroom. This model is implemented in a context where the price of laptops is reduced and wireless networks are widespread. A cart with laptops is taken to the room where they are needed,
2 Objects are presented by educational level (primary school, elementary school, secondary education, professional qualifications and tertiary education) at http://objetoseducacionais2.mec.gov.br/.
3 Enciclomedia is an initiative that integrates several media in a special database to be used by students and teachers in the classroom. Through computers, teachers and students have access to the syllabus and the study schedule, books for teachers, program upgrades, course notes and workshops for teachers, text books from different subjects, geographic atlases showing Mexico and the world, and etc., all digitally and all in the classroom. Every class with Enciclomedia is an opportunity to have access to cinema, theater, museums, libraries, archeological sites, interactive games and books. Available at: http://www.enciclomedia.edu.mx.

2010 Survey on ICT Education ARTICLES 165
En
gli
sh
and, in some cases, these resources are complemented by an electronic whiteboard or a projector screen showing the teacher’s computer to the whole class. A variant of this model – or the seed for a new model – are experiences in which students use computers individually, within or outside the classroom, connected via wireless networks; these require the adaptation of school practices to this new scenario. Proposals such as the One Laptop per Child, which are underway in Argentina, Brazil and Uruguay, are part of this context.
Results of ICT policies in schools are difficult to assess, since there is lack of methodology, specific indicators, and systematic and reliable data. As pointed out by Valdivia (2008), the most longed-for results – i.e. significant impacts on learning – are not properly documented, and there is a consensus among analysts about the difficulty of monitoring consistent academic results in different subjects of the curriculum. What the amassed evidence has shown is the positive results on student motivation. Studies reveal that learning outcomes are highly conditioned by the characteristics of the school, its leadership and faculty, student characteristics and access to ICT at schools and at home. Nonetheless, teachers are key factors in this equation.
Expectations placed on ICT as drivers of change in schools and education are noteworthy. As indicated by Peres and hilbert (2009, p. 239), in the 1980s computers were viewed as seeds of change and innovation in teaching and learning. In the 1990s ICT were viewed as catalysts of change and innovation in education. After two decades of hopes and frustrations, the underlying technological determinism is gradually being replaced at the beginning of this new century by a more balanced view that regards ICT as useful tools to achieve pre-set goals. A consensus is being reached that the impact of technology is not simply dependent on having access to it, but how it is used by students.
FINAL ThoUGhTS
Among pending issues in the reform of education in which Latin American countries have been involved, the reform of initial teacher training and professional development processes are among the most urgent. There is a consensus among analysts that little could be achieved with education reforms without consistent and careful attention to these fundamental issues. Thus, both teaching practices and professional development require satisfactory use of new technological tools for productivity, research and to share solutions.
Unfortunately, much of the debate on the subject stems less from differences of opinion about the possible results of educational technologies and more from resistance to innovation or fear or refusal to see progress made since the time when schools received equipment and just let it gather dust. Others still believe that ICT will replace teachers, who will therefore be unable to resist the extinction of their trade. Arguments against these negative views are plentiful, and we cannot anticipate new data here. Nonetheless, it is worth mentioning that the situation of Latin America requires its teachers of basic education – primary and secondary – to be constantly updated and ready to make better and more efficient use of teaching and learning processes. Where ICT are available, teachers will benefit from knowing how to integrate them into teaching. Where they are not available, teachers must nonetheless be prepared to incorporate them when they arrive, and to use what is available for the benefit of their students.

Survey on ICT Education 2010ARTICLES 166
En
gli
sh
Since teachers are not prepared to make better use of ICT in the curriculum, public schools mainly fulfill the role of reducing the digital divide, offering the opportunity for students – and communities surrounding schools – to familiarize themselves with new technologies. This is a positive result, but poor from an educational perspective. ICT in schools can and should be a useful aid for teaching and learning, developing thinking, offering a variety of information sources, facilitating the development of abstract thinking through simulations and models, and encouraging the exchange of information in collaborative work.
The development of ICT skills in the initial training of teachers is very limited in countries of the region, and, if anything, only taps the surface, not preparing future teachers to incorporate these technologies into teaching and learning.
As ICT have developed in areas other than education, the issue of their use by teachers resulted from the pressure that their development exerted upon schools and teaching / learning, combined with decades of research and development in education, though distant from teacher training schools. This requires initial teacher training in ICT no longer to be the responsibility of computing teachers, in computer labs, but to become the role of all trainers and educators in the institution as a whole. In no other way will teachers be able to overcome the technical level itself and integrate technical and educational aspects in the design of the curriculum with their future students.
Training institutions, as well as those responsible for evaluation and certification, will gain much from determining the ICT skills regarded as desirable for future teachers. There are many proposals that define competence standards for ongoing education and training, regarding them as elements of a single path for the development of teaching skills.
REFERENCES
BARRIOS, Óscar. “hacia un nuevo enfoque de la formación inicial”. In: ARéVOLO, Isabel Flores (org.). ¿cómo estamos formando a los maestros en América latina? International Meeting “El desarrollo profesional de los decentes en America Latina, Lima, November 2003. Lima: Proeduca GTz, OREALC/Unesco Santiago, 2004.
BASTOS, Maria Inês. o desenvolvimento de competências em “tic para a educação” na formação de docentes na América latina. Brasília: Unesco, 2010.
FABARA, Eduardo. “Colombia, Ecuador y Venezuela.” In: ARéVALO, Isabel Flores (org.). ¿cómo estamos formando a los maestros en América latina? International meeting “El desarrollo profesional de los docentes en América Latina”, Lima, novembro de 2003. Lima: Proeduca GTz, OREALC/Unesco Santiago, 2004.
GATTI, Bernardete Angelina; SÁ BARRETO, Elba Siqueira. Professores do Brasil: impasses e desafios. Brasília: Unesco, 2009.
PERES, Wilson; hILBERT, Martin (orgs.). la sociedad de la información en América latina y el caribe: desarrollo de las tecnologías y tecnologías para el desarrollo, Santiago: Cepal, 2009.
RODRÍGUEz MéNDEz, jaime; SILVA QUIROz, juan. “El desarrollo profesional docente en informática educativa en Chile”. In: ENLACES; OREALC/UNESCO. estándares tic para la Formación inicial docente: una Propuesta en el contexto chileno. Santiago: Orealc/Unesco, 2008.
SUNKEL, Guillermo. las tecnologías de la información y comunicación (tic) en la educación en América latina: una exploración de indicadores. Serie Políticas Sociales 126. Santiago: Cepal, División de Desarrollo Social, 2006.
VALDIVIA, Ignacio jara. las políticas de tecnología para escuelas en América latina y el mundo: visiones y lecciones. Santiago: UN, 2008.

2010 Survey on ICT Education ARTICLES 167
En
gli
sh
dIGITAL NATIvES: ThE CLoUd oF ThE “WIRELESS”
Rogério da Costa 1
CoLLECTIvE INTELLIGENCE: WIKIPEdIA ANd YoUTUBE
A close look at the events that marked the evolution of the Internet reveals without a shadow of a doubt that one of its most prominent trends is collective intelligence. In fact, collaborative work has become a landmark of Western culture in the wake of the 21st century, and its essence is the exchange of knowledge, information and communication. Wikipedia is unquestionably one of the biggest phenomena of collective intelligence; its concept was to create a large digital encyclopedia produced in collaboration with users from around the world. Since its launch in 2001, Wikipedia has grown and there are now versions in several languages. Nowadays, it has become a reference for anyone seeking information on any subject.
Also, due to increased bandwidth for Internet access and the fast pace at which digital videos have become increasingly cheaper and more popular, there has been a marked explosion of videos posted on the Web. And the great promoter and catalyst of this wave has been Youtube, a platform created in 2005, where videos can be posted by any Internet user. just over a year later, it became the driver of a revolution in the habits of Internet users. Youtube has an increasing number of videos of all kinds, e.g. videos produced by professionals, amateurs, television networks, businesses, official news vehicles, videos retrieved from files and digitalized, and, currently, videos produced by youngsters of all ages. Combining elements of social networks, such as the communities system, and other characteristics from online television, YouTube screens are now on thousands of websites around the world. Moreover, as it is much easier to produce moving images, the content available on YouTube is expanding and becoming more diverse. It is a true universal audiovisual encyclopedia produced by the collective intelligence of Internet users.
Nonetheless, while YouTube is such a driving force on the Internet, outside the Web mobile phones are the main trendsetters in today’s culture. The wireless swarm spreads to the four corners of the
1 Professor of Post Graduate Studies in Communication and Semiotics at the Pontific Catholic University of São Paulo (PUC-SP) – research field: Culture and Media Environments). Coordinator of the Lab of Collective Intelligence (LInC). Doctor in Philosophy from the University of Paris IV-Sorbonne, master in Philosophy from the University of São Paulo (USP), and graduate in Systems and Computing Engineering from the State University of Rio de janeiro (UERj).

Survey on ICT Education 2010ARTICLES 168
En
gli
sh
planet. Virtually everyone is under the coverage area of a mobile operator. Currently there are over three and a half billion devices in use, and the launch of a new generation of mobile devices has confirmed what used to be viewed only as a trend in 2002; i.e. the Web is extending itself to mobile phones, and vice-versa. Initiatives that rely on the synergy between mobile phones and the Internet are springing up, and the massive archive of images from YouTube is already accessible in the palm of their hands.
moBILE SoCIAL NETWoRKS
The new essence of social change has a name – mobility. Being “always connected” anywhere is now critical. This reveals that the actual revolution in wireless computing is not just commercial or technical, but social. Connected at all times and everywhere, people can communicate and cooperate in new ways. Nowadays, data services for mobile devices have become an important platform worldwide, not only for receiving or sending audio and video content, but also for group interaction. Voice and text communication, which were no strangers to us in the early 2000s, are joined by images and videos in regular message exchanges among individuals and groups of users of portable devices. And let’s not forget multiplayer games for mobile phones, which are also becoming increasingly more popular among Brazilian users.
The mobility revolution had already been foreseen by howard Rheingold (2002). First of all, it is worth remembering that while the world of desktops raised questions about the deterioration of physical relationships among human beings, mobile devices started indicating that virtual communication would become a powerful medium to promote real encounters. Landline phones had long been enabling people to significantly increase their face-to-face meetings. Nowadays, with so many collective, political and artistic events being enabled by the mobile phone network, its potential for transforming the dynamics of social movements is indisputable. Second of all, there is the next generation of these devices, which have already incorporated GPS functions, enabling a range of uses that combine communication and georeferencing. It is equally noteworthy that very soon we will no longer distinguish between conventional mobile phones and smartphones. All mobile devices will be “smart” devices. The ubiquity enabled by these devices has created a vast unbound universe of possibilities for all kinds of exchange of information and entertainment. Both from the perspective of urgency (accessing information anywhere, anytime) and entertainment (watching movies, playing group games or alone), smartphones are embedded with technology that combines multiple media in one device (phone, Internet, television, game console, and desktop features). This corroborates a trend foreseen in the late twentieth century – the smart technology of chips should spread to all kinds of devices available, and they will all very soon be interconnected via wireless networks.
Thus, one of the most prominent trends is mobile communities, which rely on the use of portable devices to operate. It may be hard to imagine mobile virtual communities as something similar to social groups. For example, how do they work through devices such as mobile phones, palmtops and tablets? Do our definitions of community still apply in this case?
Virtual communities based on mobile phones, PDAs and other wireless devices have been increasingly used to support the coordination of group actions in localized geographic space. Thus,
2010 Survey on ICT Education ARTICLES 169
En
gli
sh
we can rightly assume that the essence of these communities is movement, gathering groups in physical spaces. There are groups of teenagers connected through their mobile phones in helsinki, Finland, for example, who are widely known for being able to arrange meetings at malls in a split second. They arrive in swarms! Another example is the so-called flashmobs, in which groups gather for instant political acts and disperse in minutes. Nonetheless, the most famous example is the overthrow of the president of the Philippines, joseph Estrada, who fled when thousands of protesters gathered outside the Government Palace to protest. They arranged the gathering via text messages in less than an hour! – and without central management. howard Rheingold has named this phenomenon smartmobs.
The fact is that these communities literally enable many people to find each other and meet as groups. This is rarely the case of Internet-based communities. however, meeting in person seems to be the be-all and end-all of these wireless groups. Rheingold lists activists who come together on the streets and youngsters who meet at clubs. There are even websites in japan offering a unique service – by creating a profile and indicating an affinity profile, users may get calls on their mobiles when other people matching their chosen profile are within a radius of 50 meters. Both phones ring at the same time indicating that there is someone with the chosen profile in the vicinity. Young people seem to have an endless potential for transformation in their hands.
Another striking example is a proposal by “cyborg activist” Steve Mann, who proposes the use of portable devices as a counter surveillance tool in public spaces (see http://genesis.eecg.toronto.edu/). It is no secret to anyone that public spaces have been literally invaded by video cameras continuously recording images of us. Mann began an experiment in which he carried on his chest, over his shirt, a dome (such as those used to hide cameras in elevators) with a webcam turned on and connected to the Internet via portable device. his shirt read: “Smile, you’re on camera!” he conducted several experiments in stores where customers were filmed at the time of purchase. Steve would also film the seller. Images were instantly shared with a mobile virtual community, which thus functioned as counter surveillance to the store system. This example illustrates how political activism may be creative when using portable means of communication.
In New York, another well-known example are magic bikes, bicycles carrying WiFi hotspots, providing open access to the Internet wherever they go (see http://www.magicbike.net/). This initiative explores a new strategy to provide Internet access in urban spaces. Wireless bikes can take wireless Internet access to remote areas and communities. The protagonists of this project say that it is a mixture of public art and techno-activism, as they provide an ad hoc network at places and times where art performances, cultural events, and public events are taking place, or simply enable communities that are digitally excluded to network.
These experiences seem to show that a revolution of habits and customs is already underway, forged by a generation of young people and teenagers who are very far away from their desktops. The very metaphor of networks seems to have been transformed. What we see emerging is a generation that will live immersed in the “cloud of the wireless”. Anywhere and anytime, what matters is whether you are in or out of the cloud.

Survey on ICT Education 2010ARTICLES 170
En
gli
sh
SoCIAL NETWoRKS ANd vIRTUAL LEARNING CommUNITIES
What would be the role of social networks in schools? This question is still widely asked by countless educators who show concern or uncertainty regarding the use of collaborative tools in their teaching programs. Social networks and virtual communities, as it turns out, promote both content and people, both what has been said and who has said what. After all, people are the sources of information on contents or on how to reach them. People encourage, suggest, and influence students to research specific contents.
Nonetheless, in the specific case of students, who are these people? They are teachers, fellow classmates, teachers of other classes recommended by classmates who attended and enjoyed their courses, friends of friends, parents and relatives, club mates, and etc.
These people are the personal network of each student and, believe it or not, they are the most interesting thing in their lives, significantly mobilizing their voluntary attention. This voluntary attention is precious energy that must not go to waste; instead, we should encourage and nurture it, capitalizing on it for the production of knowledge. Social networks, created through computer and mobile phone networks, currently represent one of the most consistent experiences of consolidation, expansion and capitalization of personal networks. The virtual communities that preceded them have been around for over twenty years, but only recently have become a phenomenon deemed worthy of scientific and pedagogical investigation. This phenomenon shows that it is essential to enable relationships between people, the various ways in which they will enter into synergy and, consequently, transmit information and create knowledge.
From this perspective, content production and organization fundamentally depend on how relationships among people are established. Social networks enable cross communication among users, circulating content and keeping it alive. Organized content that is stagnant becomes lifeless!
In fact, somehow we began to realize that people act most of their time as content indexes for other people, and this is no different in schools. One of the most interesting examples of this approach was, undoubtedly, the initiative of the new york times. In 1999, it launched a virtual community called Abuzz, which functioned exclusively as a Q&A platform. This initiative involved a lot of planning, not only from the technological standpoint, but also on how to manage and encourage people to get involved. Its operation was simple: questions were posted by community members, and the system would direct the questions to those who had closer profiles. Interested persons would reply directly via email. In just six months, more than half a million people had already joined the community. It was terminated around 2004, when another initiative for sharing knowledge was being consolidated – Wikipedia.
Another interesting movement is the so-called virtual agoras, which are websites created exclusively for political debate. A good example is Speakout (www.speakout.com), a non-partisan initiative that encourages discussions on topics ranging from local community problems to national issues. The technique used by the promoters on the website’s forum is interesting: there is always a controversial issue, which is given two opposing arguments (pro and con). Participants exhaust the issue, and their goal is not only to find the right answer, but to show that good arguments can be created to defend both sides. Essentially, it is an in-depth exercise of citizenship, because the key issue is not just agreeing on a specific position, whatever it is, but to learn the difficult art of questioning, perceiving through various arguments the multiple views that can be construed from a single problem. Pros and

2010 Survey on ICT Education ARTICLES 171
En
gli
sh
cons are ultimately not so important, because we realize that the problems are much more complex than we originally thought.
ThE ChALLENGE oF moBILE dEvICES IN EdUCATIoN
Not infrequently, teachers tell youngsters to keep their phones off in the classroom. After all, mobile phones are for talking, distracting students, and cannot thus be switched on during class activities. After years trying to incorporate computers into teaching – and without achieving results that can be regarded as satisfactory – teachers and educators find themselves facing a new challenge: mobile phones have become youngsters’ passion. Recent research from the University of Navarra, Spain, sponsored by the Telefónica Foundation, yielded clear results on the use of mobile phones by children and teenagers. No less than 82% of the respondents reported owning a mobile phone. Among children, 45% had managed to get a mobile phone as a gift.
If these devices were only for communication – as they are still viewed by many educators – it would be hard to imagine an interesting educational use for them. But, in fact, these small devices are being used for so many other things, that it is hard not to imagine educational uses for them, not only in the classroom, but especially for extracurricular activities.
Thus, any educational activity should include taking pictures and recording videos, sending and receiving files via Bluetooth or playing educational games. Recent innovations soon to be available on any device are perhaps even more interesting. Research conducted by the Mobile Experience Laboratory, of the MIT (http://mobile.mit.edu), indicates an increasing synergy among people, places and information. The urban aspect is of great importance in these cases. In fact, communication technologies are still viewed as a means of overcoming distances and, therefore, of saving (or abstracting) space. The virtual environment has always been censured as the “place” which alienates people from socializing and relating to each other, which isolates young people, thus moving us further away from relationships in physical spaces. Recent experiences with mobile devices have shown other possibilities that indicate otherwise: how can we integrate people into their urban space by using mobile technologies? According to studies by Mobile Lab, what matters is not only the type of project implemented, but the effort to create a new paradigm for communication technologies. They may allow people to use the space where they live in a smart way, so that they are able integrate their habits and attitudes into the collective intelligence, thinking for benefit of the place where they live.
Social networks, so popular among youngsters, are used to enable people to organize themselves, e.g. to organize a car pool scheme to go to work. They are also used, for example, to consult with friends, via mobile phone, about tasks being performing. From examples that range from reinventing bus stops, such as smart digital terminals, to tagging historic places, they create a vast number of possibilities for the use of mobile devices in education.
While we worry about whether to allow our youngsters to have Internet access, these studies indicate how to reintroduce young people in urban space issues through communication networks.

Survey on ICT Education 2010ARTICLES 172
En
gli
sh
REFERENCES
MANN, S.; NIEDzVIECKI, h. cyborg: digital destiny and human Possibility in the Age of the wearable computer. Toronto: Doubleday Canada, 2001.
RhEINGOLD, h. Smartmobs: the next Social revolution. Cambridge, MA: Perseus, 2002.
SALA, X. B.; ChALEzQUER, C. S. A geração interativa na ibero-América. Madri: Coleção Fundación Telefónica / Ariel, 2008.

2010 Survey on ICT Education ARTICLES 173
En
gli
sh
ThE RoLE oF INFoRmATIoN IN SoCIAL dEvELoPmENT
Ladislau Dowbor1
“information makes us all equal.”
(Dando, Antares Slum, Rio de janeiro)
The great driver of society’s transformation – the elephant in the room, so to speak – has been the increasing momentum of technological transformations. Undoubtedly, there have been other epic moments, e.g. the Ancient Greeks, the European Renaissance and the explosion of scientific knowledge in the wake of the twentieth century – electricity, the telegraph, railway transport, airplanes, cars, the theory of the relativity, and etc.
however, nothing compares to the unparalleled development that followed World War II – from large scale events, such as telescopes in orbit and man’s landing on the moon, to the realm of small molecules, such as the DNA and nanotechnology, fine chemicals, bioengineering, advancements in means of transportation and the spread of education, which has currently reached almost every corner of the planet. Knowledge has become the center of the process of cultural, political, social, and economic change. We are beholding the knowledge society – which, indeed, has knowledge, though not followed closely by social and political structure.
As part of this process, the revolution enabled by the information and communication technologies, which drives the potential of all fields of research, has become particularly important. By progressing from “drawn” signs, such as the letter “a” or the number “2”, to digital notation in “0s” and “1s”, it has become feasible to record human knowledge in different subatomic particles and to transmit it on electromagnetic waves. This advance has enabled mankind’s creative side to flourish – information and communication technologies become widespread at the same moment in time as economic
1 Ladislau Dowbor is a doctor in Economic Sciences from the Warsaw Central School of Planning and Statistics, a professor at the Pontific Catholic University of São Paulo and a consultant for several United Nations agencies. he is the author of several books and articles. his numerous publications on social and economic planning are available, in full and free of charge, as Creative Commons, at the website http://dowbor.org. Email: [email protected].

Survey on ICT Education 2010ARTICLES 174
En
gli
sh
activities acquire more in-depth knowledge. how could the sequencing of the double helix of life have been possible without computers?
In this context, the role of ICT is to drive the entire process forward, because, in addition to being new technologies themselves, they act as instruments of multiplication and dissemination of knowledge in all fields, i.e. a revolution within the revolution. Knowledge dematerializes, spreads across the planet, traveling at the speed of light, and is accessible today from a simple mobile phone anywhere.
Technologies enable us to achieve more with less effort, and undoubtedly create opportunities for progress. It has been calculated that a man using electricity, fuel and other sources of energy uses 156 times more energy than his muscular strength would allow. We have powerful levers. Nonetheless, availability of more powerful means, when the latter are used negatively, only drives adversity. Nowadays, we are able to chemically synthesize very cheap drugs, without necessarily relying on the production cycle of coke and poppy, and this is destroying hundreds of millions of people’s lives. Moving fast with no direction creates even bigger problems, and technologies do not have the answer for that.
New technologies enable the design of speculative global systems, which artificially increase the prices of food; advanced means of groundwater exploitation are leading to the depletion of centennial groundwater reserves; the massive use of automotive vehicles is leading to urban collapse; widespread and irresponsible consumption of fossil fuels is leading to climate change, i.e. the greatest global threat; modern fishing technologies have enabled us to easily track down and exploit life in our oceans; and the expansion of monoculture and deforestation are leading to soil sterilization and boosting climate change. We have been watching in a state of numbness and powerlessness as this dramatic sequence of events unravels quickly before us, with its positive – we proudly carry the latest mobile phone in our pockets – and threatening aspects. Technology in itself is not the problem; the problem is how it is used, the processes by which powerful technologies are produced, while our political structures remain archaic. This imbalance between the accelerated pace of technology and the remarkably slow pace of cultural, social and political maturity is the cause of dangerous tension, i.e. our biggest threat.
Central to the dilemma, therefore, is the decision making process of how to use new potential, who controls it, who has access to it and for what purposes. Technologies multiply in our inherited society and are accompanied by their tragic imbalances. The latter can be divided into two articulated axis: environmental tragedy, directly linked to the increased potential for global destruction – devoid of corresponding governance – and social tragedy, which results from new mechanisms by which these very technologies create inequalities, e.g. through global financial systems.
It is noteworthy that technological advances are the result of numerous research initiatives in basic research and in economic development, predominantly led by the public sector and the private sector, respectively. They consist in a widespread social process, in which different sectors benefit from the advances in others, as thoroughly analyzed by Lawrence Lessig (2008) and Toffler (2006). however, although the scientific process itself, which evokes friendly images of an inventor in his lab, is perceived as positive, the reality is that few scientists have any control over what they develop. They do not get to decide whether a new molecule will be used as a medicine or as a pesticide, or whether drugs capable of restricting the hIV will become widespread across the planet, or will be restricted to ensure higher prices, and etc. The use of technology is controlled by
2010 Survey on ICT Education ARTICLES 175
En
gli
sh
corporations, and these, in turn, are controlled by marketing, finance and law experts. Scientists are urged to stick to their labs.
Thus, good and evil are always hand in hand. Developing antibiotics is good, but its widespread use in livestock – which contaminates the meat we eat – is not. Better still, it is good for the company that sells antibiotics and unscrupulous breeders, but bad in terms of final impact on the population. Removing railway tracks in order to sell more cars seems preposterous, but engine designers are not to blame; the problem is in the decision making process, i.e. in corporate power. The latter evidently prioritizes decisions that promote its own – directors’ and shareholders’ – interests. They will only use and expand the use of cleaner technologies, such as more efficient hybrid or electric engines, if under external pressure. however, this pressure is contained when corporations finance political campaigns, and elect those who will defend their interests. The gap between what motivates research, i.e. the exciting creative dynamics, and those who decide how its results are used, i.e. to generate profits at any cost, becomes huge.
What we are hereby suggesting, regarding humanity’s prosaic interests, is that making the most of the fantastic technological revolution that we live in is dependant upon the democratization of economic processes. This theory is discussed in more detail in the essay “Democracia econômica” (Economic Democracy), particularly in the chapter “A economia do conhecimento” (The Economy of Knowledge). Only when society takes ownership of information on decision making processes in corporations and governments will its pressure begin to create other dynamics, more closely in line with general interests. First and foremost, understanding that the economy of knowledge radically shifts the concept of scarcity – one of the pillars of economic sciences in the last century – is paramount. A watch given to someone else is no longer mine. An idea given to someone else is still mine. In the economic jargon, knowledge is a non-rivalrous asset, i.e. its consumption does not reduce stocks. Nowadays, the primary value of most goods is less related to materials and labor; it is based on the knowledge embedded in them. Thus, in macroeconomic terms, knowledge creates wealth when it multiplies and spreads, not when it is locked.
Knowledge produced can be multiplied endlessly, and it costs virtually nothing to spread it, enabling users to access it at their will. Therefore, it may be viewed as a powerful driver of democratization. Nonetheless, from the microeconomic perspective, corporations are not seeking social development; instead, they are interested in making profits, and for that it seems only natural to monopolize knowledge, thus creating scarcity. They artificially create obstacles to access in order to ensure profits, and create the economy of tolls.
Ignacy Sachs (2010) puts it simply and clearly: in the last century, economic power relied on the private control of production assets, machinery, factories, and etc.; nowadays, power results from controlling information and knowledge. Where before there was a gate, now there are use restrictions, copyrights, patents and royalties. Today’s corporations employ efforts to restrict access, in order to demand toll payments. The legitimate and well intended concept advertised is always one of protecting the defenseless author, but in fact, it is about ensuring the profits of large intermediaries. Rights often belong to those who provide material support, not to the creators.
Results are straightforward: in the top universities in the country access to book content is denied, and researchers only have authorization to photocopy one chapter. According to surveys by the GPOPAI, 30% of the recommended literature is sold out, but cannot be copied. hence, on one hand, significant resources are spent to educate new generations; whereas, on the other hand,

Survey on ICT Education 2010ARTICLES 176
En
gli
sh
access to knowledge is impaired. Naturally, a company that has published a book and its author will seek compensation – and that is legitimate. But why deny access, or make it so expensive that it becomes accessible only to the wealthy? The MIT, in the U.S., has created the concept of OpenCourseWare, open course, such as Linux created open source.2 All publications from all professors are available online, free of charge, at the portal www.ocw.mit.edu. In a few years, more than 50 million scientific texts have been downloaded worldwide from the MIT alone. One can only but wonder at the significance of its contribution to knowledge, and to scientific progress in general.
how does this compare with the interests of the publisher and the author? They are entitled to payment, but not to prevent access for non-profit scientific communication. And whoever likes a book may buy it. Even renowned books are bought more often when widespread access to them is gained easily. It used to be said that television would mean the end of cinemas. That was clearly nonsense, and banning television to prevent the demise of cinemas would have been absurd.
Knowledge spreads as the primary driver of wealth production, is easily and freely transported online across the globe, and has a non-rivalrous nature, so the rules of the game must change. Most people are unaware that corporate lawyers have managed to extend copyrights to prevent open access for seventy years after the death of the author. Twenty-year patents on medicines, in an era of extremely accelerated transformations, are unacceptable. Books by Paulo Freire, who campaigned for the democratization of knowledge, are denied free access until 2050.
The absurdity of the situation is leading to the creation of numerous alternatives that seek to circumvent attempts to deny access to knowledge and full use of new technologies. The book wikinomics shows how many companies have stopped denying access and, instead, are now seeking mass collaboration from clients. By enabling access to their information and requesting contributions they are actually doing better. A survey called “Embezzlement” reveals how corporative tolls on knowledge work, and how they prevent progress and larger profits, by preventing productive contributions. Cognitive Surplus shows that humanity has a vast host of knowledge capital stored in people’s minds, tragically underused. By taking a chance, and creating an impressive global source of information, wikipedia granted everyone a chance to contribute with their own knowledge, which would otherwise be stationary or available only to them. It is also curious that many people contribute financially to wikipedia, despite there being no obligation, by paying what they think the services received are worth. These issues are discussed in detail in our article “Da propriedade intelectual à sociedade do conhecimento” (From Intellectual Property to the Knowledge Society).
human beings are gifted with intelligence, and wealth is not a synonym of intelligence. In an era when economic development is increasingly more dependent on the knowledge embedded in production processes, enabling the two thirds of the underprivileged global population to access knowledge may be a promising way of simultaneously tackling inequality and, through smarter processes, environmental challenges. As a matter of fact, we should not allow access, but promote it.
2 More information available at http://web.mit.edu/newsoffice/2009/open-access-0320.html.

2010 Survey on ICT Education ARTICLES 177
En
gli
sh
A simple but powerful image comes from an experience in the Antares slum in Rio de janeiro, experience awarded by Trip Transformadores.3 When implementing broadband access in the slum, Dando and his companions discovered, according to Claudio Prado, that there may be no jobs, but there is always work to be done. And enabled by Internet access, a wide range of services became available from the slum, such as design, cultural production, and online computer support, among others. In the age of “immaterial” economy, of the “intangible”, access to factories is no longer a requirement; all that is needed is access to the global system of knowledge production. “Information makes us all equal,” declared Dando when presented with the award.
Globally, a recent evaluation of the dynamics of the use of technologies in rural settings produced an excellent study (IAASTD, 2008). Overall, the same technologies being used in monocultures (more pesticides) to create low employment levels (two hundred hectares per job in soybean monocultures), to deplete water reserves and to control production by a select group of multinational companies (Cargill, Monsanto, Bunge, etc..) can be used to create a better dynamics, with intercropping systems, smart irrigation, first transformation technologies for small producers, mixed farming that increases employment, production closer to end consumers, and etc.
In education, as previously stated, rather than progress, what is required is a revolution: education is viewed less as an institution, providing facilities where children and young people spend most of their lives – thus allowing adults to work – than as a permanent system for knowledge management. Initiatives such as “Minha Escola, Meu Lugar” (“My School, my Place”) in Santa Catarina, or “Arranjos Educativos Locais” (“Local Educational Settings”) in Parana, or the reference initiative, “Piraí Digital” (“Digital Piraí”), in the state of Rio de janeiro, are the first signs of a profound transformation.
There are countless successful experiences. There are countless attacks too – it does not take more than turning the radio on to hear grim statements by oligopolies pleading for us to be ethical. They make serious claims that our ethics is upside down. just outside several cinemas, universities or cultural spaces, there are people illegally selling Antonioni’s, Kurozawa’s, Fellini’s, and jean Renoir’s films, hundreds of the giants who created the cultural wealth of the film industry. Whereas, at official stores, which are full of advertising materials, we are able to rent or buy essentially a pile of rubbish, with rare hidden gems. It is curious to note that our culture has become clandestine, and the culture industry prevails. If it were not for the men who sell pirate films on the sidewalks, I would not be able to bring home the gems of human creativity that I play for my children. Where is the logic in that?
Claiming it to be about ethics, rights or laws is bogus. The American lawyer james Boyle states that an idea is not a natural property, such as my watch would be (which I may choose to wear or not). Patents and copyrights themselves were created to protect a commercial producer from another commercial producer, not to prevent user access. It is so clearly not a natural right, that it has been set to expire after a certain period of time and become public. however, by endlessly extending the validity of such rights, corporations’ legal advisors have made access virtually useless and outdated when finally allowed.
It is also noteworthy that the concept of intellectual property was not designed because an idea had to be owned, but because it was thought that a period of exclusive access would encourage people
3 Watch video available at http://bit.ly/fuKOVh.

Survey on ICT Education 2010ARTICLES 178
En
gli
sh
to come up with more ideas. That is, if the system is preventing access to new knowledge, it is, in fact, producing an opposite effect to the intended. In this case we also have a mixture of good and evil: Granting a short period of exclusive rights is good to stimulate creators, but if this period is extended over decades to the point of halting progress, it is bad.
When Lessig asked the audience attending his lecture at harvard whether they adopted illegal practices to access knowledge online, more than 70% of them admitted to doing so. Lessig concludes that progress results from an ongoing process of innovative articulation of previous innovations; we copy each other, and add our own new twists (Lessig, 2008). Internationally, Chang has masterfully demonstrated how developed countries have copied each other, including through large systems of economic espionage still in use, and, at a certain moment in time, decided to deny access to poor countries. Chang’s “Chutando a escada” (Kicking the Ladder / 2003) is about the history of countries who took ownership of the knowledge of others, but now want to prevent others from accessing it, and “kick their ladder”. They speak naturally of ethics, even when trying to patent an Indian rice species or the Brazilian cupuaçu.
Initiatives must focus on enabling access, particularly widespread access to broadband. Few people know that the common “www”, which allows us to access knowledge across the planet, was developed by Tim Berners-Lee at the Geneva nuclear research center (CERN), and that Tim refused to patent the system because he viewed it as a contribution to mankind, which nowadays is managed by a non-profit consortium. Mankind as a whole benefits from this, including Google and Microsoft. We all browse happily through “www”s, which enable us to exchange ideas freely across the planet. There was no shortage of proposals to set up tolls for this as well.
The idea is clearer when compared to walking on the streets – no one pays to walk on the streets. however, there are costs involved in maintaining the streets, and we pay for these through taxes. It would not be practical to set up tolls all over the streets, although it seems to be happening on most parking lots or highways. The fact that everyone can walk freely on the streets and avenues is simply more practical. And it makes sense, because free traffic enables the streets to be economically attractive for businesses, gas stations, and etc., which pay taxes that, in turn, pay for street maintenance. Nothing is free. But the Internet, by traveling on electromagnetic waves, does not need to build streets and sidewalks – waves are public and free, a gift of nature. It is only natural that knowledge is transported on them across the globe, freely, as a public service. In contrast, free movement and free access enable the creation of several economic applications, which, in turn, may be paid for.
This whole field is controlled by ideological fundamentalisms, hypocritical claims to ethics, and useless persecutions. Youngsters, in particular, struggle – they cannot afford the toll charges charged by corporations. As a matter of fact, youngsters have little money and lots of time – they may use their time, rightfully, to have access to knowledge anyway, which in schools would be regarded as an obligation, not piracy. In contrast, as explained by Alperovitz, adults have money and little time: differentiated products that are paid for cater for their needs.
We must bear the objective mentioned above in mind: i.e. to ensure that knowledge is widespread, because society as a whole will become more prosperous; e.g. producers will have more access to clean technologies, thus protecting the planet, contributions to the economy of knowledge may spread, even to poorer societies, and this may reduce the significant inequality that now
2010 Survey on ICT Education ARTICLES 179
En
gli
sh
economically isolates the four billion people gently classified by the World Bank as people who “do not have access to the benefits of globalization.”
With clear goals, the path ahead leads to leaving hatred and ideologies behind and pursuing what actually works. We are currently clumsily playing the game by rules that were developed for an economy of physical assets – in the twentieth century – which aim to reduce everything to private property, not by the rules of a new society, born in the twenty-first century. Impairing progress or monopolizing the appropriation of innovations simply does not work.
REFERENCES
Alperovitz, Gar Daly, Lew. Apropriação indébita: como os ricos estão se apropriando da nossa herança comum. São Paulo: Editora Senac São Paulo, 2010
ANDERSON, Chris. grátis, o futuro dos preços. São Paulo: Campus, 2010.
BOYLE, james. the Public domain: enclosing the commons of the mind. New haven and London: Yale University Press, 2008.
CASTELLS, Manuel. the rise of the network Society. Oxford: Blackwell, 1996.
CEPAL. A hora da igualdade. Brasília, 2010. Available at: http://bit.ly/bqwYAh. Full manuscript in Spanish: la hora de la igualdad: brechas por cerrar, caminos por abrir. Santiago, maio de 2010. Available at: http://bit.ly/bA9yrl.
ChANG, ha-joon. chutando a escada: a estratégia do desenvolvimento em perspectiva histórica. São Paulo: Editora da Unesp, 2003.
DAVIDSON, Cathy N.; GOLDBERG, David. the Future of learning institutions in the digital Age. Boston: MIT Press, 2009.
DOWBOR, Ladislau. da propriedade intelectual à sociedade do conhecimento. 2009. Available at: http://bit.ly/8nlK61.
. democracia econômica: alternativas de gestão social. Available at http://dowbor.org/10demoecovozes3.doc. Updated in December, 2010.
GPOPAI. direitos autorais e livros didáticos. Seminário “Direitos autorais e educação”. Ação Educativa, 24.3.2009. Available at: http://www.gpopai.usp.br/wiki/images/5/53/Seminario_ae.pdf.
IAASTD – Evaluación Internacional del Papel del Conocimiento, la Ciencia y la Tecnología en el Desarrollo Agrícola. resumen del informe de síntesis. Available at http://dowbor.org/ar/08iaastdesp.pdf.
LESSIG, Lawrence. the Future of ideas: the Fate of the commons in a connected world. New York: Random house, 2001.
. remix: making Art and commerce thrive in the hybrid economy. New York: Penguin, 2008.
ORTELLADO, Pablo. A educação e os livros didáticos. Universidade de São Paulo, 2009. Available at: http://www.gpopai.usp.br/wiki/images/5/53/Seminario_ae.pdf.
RIFKIN, jeremy. A era do acesso. São Paulo: Makron Books, 2001.
SAChS, Ignacy; LOPES, Carlos; DOWBOR, Ladislau. riscos e oportunidades em tempos de mudanças. Fortaleza e São Paulo: BNB/IPF, 2010. Available at: http://dowbor.org/riscos_e_oportunidades.pdf.
ShIRKY, Clay. cognitive Surplus. New York: Penguin, 2010.

Survey on ICT Education 2010ARTICLES 180
En
gli
sh
TAPSCOTT, Don; WILLIAMS, Anthony. wikinomics: como a colaboração em massa pode mudar o seu negócio. Rio de janeiro: Nova Fronteira, 2007.
TOFFLER, Alvin; TOFFLER, heidi. revolutionary wealth. New York: Doubleday, 2006.

2010 Survey on ICT Education ARTICLES 181
En
gli
sh
EdUCATIoN ANd dEvELoPmENT: REGULATIoN modES IN EdUCATIoNAL SYSTEmS
Marisa Duarte 1
This article presents the results of the first studies conducted under the project submitted to the Anísio Teixeira Chair, of the Program “IPEA/CAPES Chairs for Development”. The ongoing research aims to examine the sociology of education in Brazil based on the binomial “education and development”, and its premises include new forms of sociability forged over twenty years of regular elections and the reintegration of the country in the globalized capitalist economy. This article does not intend to be a homogeneous and coherent text, or a harmonious theory about this relationship. Nonetheless, its underlying question explores the fragility of the regulation systems contributing to the governance of new players in the Brazilian educational system.
There are two separate origins to this study. On the one hand, it is a free interpretation of the article by Ball (2008), aimed at dissecting the changes underway in the Brazilian educational system. According to Ball, there have been moments when the course of perspectives on sociological analysis was rerouted – concurrently with the production of expert knowledge on teacher training and education management – contributing to the creation of “conditions favorable” to the implementation of new systemic governance instruments. If Foucault’s inspiration is central to the construction of the argument based on Ball’s (2008) perspective, in which systemic changes promote the development of new governance modes, a second analytical perspective is introduced to shed light on the tensions and conflicts in the development process. Resorting to the concept of public sphere (habermas, 1984), we are able to relate the tension in the educational system between new players in the Brazilian social scene – with new perspectives on schooling – and those who believe and claim education to be a right that should be provided by the government.
1 Associate professor at the School of Education of the Federal University of Minas Gerais (UFMG). Grant researcher at IPEA, Anísio Teixeira Chair – research on public policies in education as part of the Graduate Program of the School of Education of the UFMG.

Survey on ICT Education 2010ARTICLES 182
En
gli
sh
EdUCATIoN ANd dEvELoPmENT: ThE RoLE oF GovERNmENTAL PLANNING
In the field of sociology of education in Brazil, the initial association between the concepts of education and social development relates the increasing number of institutions, courses, students and professionals with the growth of the educational system. Increasing availability and services are viewed as educational and, consequently, social development. In this approach, the latter results from improvements in income distribution, level of education of the population, basic sanitation, instead of economic aspects, measured by production, services and etc. Social development is viewed as a product of the expansion and differentiation of the educational system, teleologically regarded as societal modernization. In this perspective, the educational system would promote the development of the population by enabling individuals to socialize massively and comprehensively; social segregation would then be potentially based on merit. however, this development is not the same in dimension and intensity across the country. Internally, there are underdeveloped regions, as well as regions with high educational standards in Brazil.
The work of Cunha (1988) is a key reference for the criticism of economistic conceptions, focused on the individual training of human resources. The Brazilian education sociologist argued against the current assumption that education would enable individuals, bearers of types/amounts of knowledge, whatever their social background, to ascend socially based on their individual merit. The ideological role of schooling was to disguise education’s inherent mechanisms of discrimination, as well as those inherent to the economic structure. The criticism against the role of education as a promoter of development was accompanied by a criticism against the national development model, in which economic growth per se was believed to solve problems, such as non-inclusive inequalities and marginalization.
however, Cunha upheld, and probably still does, a sociological perspective in which potential development is related to governmental planning. In this respect, he analyzes the expansion of tertiary education in the wake of the 1988 Constitution: “It is clear that the development of tertiary education has been based on “teaching improvisation”, in the context of the patronage that prevails in public and private institutions” (Cunha, 2007, p. 797).
The implicit political strategy is highlighted by Domingues (1999), who states that the government seems to be the agent – the “collective subjectivity” – whose role is crucial in promoting the development process. Analyzing the work of Costa Pinto, Domingues reveals that the Brazilian sociologist defined development as “an ongoing, intentional and global process of social change, not just economic or technical, which intensely mobilizes society, including the government” (p. 84). On this subject, he also added:
Development would then be a particular form of modernization, typically and profoundly affecting
the country’s productive structures, its class structure, and political and social democratization,
by incorporating masses into the nation, followed by changes in Brazil’s dependence pattern in
the international scenario. (Domingues, 1999, p. 85)
2010 Survey on ICT Education ARTICLES 183
En
gli
sh
In the perspective derived from Costa Pinto’s work, the country’s development requires the government to take on a leading political role, specifically in planning. In this sociological tradition, the development of Brazilian society is mediated by the government’s intentional and structured action – i.e. through planning – as it is the one player capable of mobilizing society towards more profound changes. Currently, this sociological perspective is implicit in the hegemonic propositions of the Brazilian Conference on Education:
In view of CONAE’s purpose to mobilize society in favor of education, the reference document is
based on the need for the government and Brazilian society to face at least five major challenges
[...]. Therefore, the construction of a National Educational System requires reassessing the
role of federal agencies, ensuring the implementation of common educational guidelines
throughout the national territory, in an attempt to overcome regional inequalities. Thus, the
goal is to design national public policies on education that can be implemented nationwide by
regulating the specific role of each federal entity in a collaborative system, as well as the role of
private education by governmental agencies [...]. In the Brazilian education scenario, marked
by educational plans and projects, the proposition and implementation of policies must be
coordinated, as well as systematic planning initiatives. In turn, all of these must be articulated by
a national education policy aimed at following up, monitoring and assessing them. (Brazil, 2010)
Governmental initiatives and social mobilization are key to the creation of an educational system – i.e. the promotion of structural changes, especially towards granting universal social rights – that will entail common educational guidelines aimed at overcoming inequalities, by regulating the power of federal entities. The 2010 National Conference also states that such goals require fiscal and operational resources. however, the desired changes require social mobilization combined with governmental action.
hence, the transformations in Brazilian society promoted by the expansion of democratic governance and greater participation in the globalized capitalist economy must be analyzed. These transformations have created new subjects and forms of sociability, which clash with the current bureaucratic and corporate role or patronage system.
EdUCATIoN ANd dEvELoPmENT: ThE EmERGENCE oF NEW FoRmS oF SoCIABILITY
By closely relating modernization and development, perceived in the projects and movements of various collective subjectivities contributing to it, Domingues observes:
The recent developments of modernity in Brazil have been driven by powerful processes of
“detaching” subjects from more ingrained and stable relationships. Nowadays, even in terms
of the subjective structure of individuals and collectives, such as the workforce, processes of
individualization are more marked, the family structure changes, the role of women changes;
social “democratization” related to this individualization progresses, at least in terms of citizens

Survey on ICT Education 2010ARTICLES 184
En
gli
sh
claiming their rightful position within society; the economy is affected by a demand for more
flexible and efficient processes; the expansion of consumption makes increasing options
available to individuals, as long as, naturally, they possess the minimum conditions to gain
access to them. Thus, individual existence is potentially broader. (Domingues, 1999, pp. 86-7)
Domingues’ analysis on modern processes of individualization relates them with the diffusion of citizenship, viewed as a “real abstraction” in which individuals seek shelter. Detachment-reattachment-further detachment processes are social development processes in contexts in which the “neoliberal adjustment” of Latin American countries created obstacles to the universalization of services that promote the rights of citizenship.
Authors such as Souza (2010) observe that one of results of these processes of detachment and production of new identities is the emergence in the country of a working class of “fighters”, or entrepreneurs, who have absorbed the concept of the “self-made man”. For these individuals, formal education is an essential asset,2 despite the fact that their integration and inclusion in the workforce is due to new forms of sociability, largely resulting from hard work and/or money. how does formal education contribute to this social class’ individual/collective development project(s)?
Our research has shown that this class has found its place in the sun through extraordinary efforts:
Its ability to withstand fatigue from multiple jobs and work shifts, and double shifts studying and
working, its extraordinary capacity to save money and resist to immediate consumption and,
equally or even more importantly, its extraordinary belief in itself and in its own efforts [...].
Because this class is unable, unlike the dominant classes, to dedicate its time exclusively to
studying, overall its appropriation of educational and cultural knowledge is lower than in the
true middle class. (Souza, 2010, pp. 50-2)
The personal statements collected by Souza (2010) reveal that the appreciation of educational access, attendance and learning may be viewed as subjective reactions to detachment situations, experiences of injustice, as well as to the fact that schools have a socio-political role in providing services that enable future individualization.
[...] investments in alternatives, especially in education, are very common from those hoping to
get a job that will bring them a little more stability [...] the individual knows that telemarketing
is not for life, but the fact that he/she has graduated from high school does not automatically
grant unrestricted access to tertiary education, especially not to the most prestigious and sought
2 Transformations in contemporary capitalism have not been automatic or obvious to anyone. Instead, throughout this decade, the offspring of the “expressive revolution” of the 60s took over key positions in several countries, as opinion leaders and central public figures in their societies. This generation, the first born in the context of quality public education for large social sectors – a principle consolidated after the Second World War, as a byproduct of the Fordist commitment – was in itself a supporting element to the virulent critique against the typical heteronomy of Fordist labor, as well as the hierarchical structure of all leading capitalist and bourgeois institutions of the period (Souza, 2010, p. 38).

2010 Survey on ICT Education ARTICLES 185
En
gli
sh
after institutions [...] his/her mother will, repeatedly, demand dedication and commitment to
his/her education in the hope that he/she [...] This individual experiences uncertainty, in view
of the recent poorly educated army of individuals prepared to occupy lower positions. (Souza,
2010: 71-8)
The role of development through the meritocratic pathway of education is both valued and/or disregarded. Formal education is part of the design of projects for the future and/or the driver behind the current scenario.
The respondent will have a child who has already studied for longer than the parents and will
have, according to him/her, a better future than that of a small retailer [...] there is a common
work-enabling element among these entrepreneurs that does not result from formal education
[...] the eleven-year-old daughter has a computer and Internet at home [...] is already thinking
about what to do in terms of work to fund his/her daughter’s tertiary education. (Souza, 2010)
Based on Foucault, the careful analysis of all statements collected by Souza (2010) reveals how capitalism has penetrated our lives, as well as how educational institutions articulate in view of the new forms of sociability. A Foucaultian reading of the statements collected from “Brazilian fighters” reveals various government/education instruments available to individuals. The presence/absence of formal education leads to the creation of a new rationale behind development in capitalism, which is associated with individual progress. The most contemporary forms of sociability – unveiled in Souza 2004 – paradoxically suggest that individuals take charge of formal education both by their absence and their presence. The role of this institution may have been desirable and relevant, but is not essential.
Partly through school, when the mathematical thinking he’d already been familiar with since
childhood – from selling his father’s agricultural produce – is developed, but more importantly
through his work experiences, Pedro develops the skills required for his economic survival in
contemporary capitalism. (Souza, 2010, p. 102)
dEvELoPmENT oF EdUCATIoNAL SYSTEmS: ThE EmERGENCE oF NEW REGULATIoN modES
In line with these new forms of sociability, a movement known as New Public Management3 (NPM) has been spreading globally, and it has laid out the foundation for the contemporary debate on
3 “The NPM is an administrative philosophy [] that emerged in the 1980s. [...] h&j asserted that the NPM influenced governments’ agendas by establishing a climate of opinion in favor of its doctrines” (Barzelay, 2000, p. 235).

Survey on ICT Education 2010ARTICLES 186
En
gli
sh
organizational and administrative changes in the governmental sector, thus affecting the management of education systems (Power, 1997).
I define the NPM abstractly as a field of professional and political debate – conducted
internationally – about subjects concerning public management, including public management
policies, executive leadership, design of programmatic organizations, and government
operations. (Barzelay, 2000, p. 23)
The working assumptions for research programs on NPM are the theory of rational choice and business-related organizational theories (Barzelay, 2000). Both the education reforms (English and American) of the 1990s and NPM-based programs have viewed favorably free public services (education included), which citizens/consumers are “free” to choose, enabled by more competitive funding options, for greater efficiency and effectiveness and monitored results.
In this ideological body, ideas behind the “modernizing perspectives on government reform” have also shaped the social imaginary. On the one hand there is the acknowledgement of civil society organizations4 as potential promoters of democracy versus the government as an instrument of bureaucratic domination. Thus, decentralization in the provision of services, especially social services, is regarded as capable of enhancing responses to diversity and to society’s existing alternatives. This perspective is based on the separation between purposes/objectives and means/procedures. The inefficiency, rigidity and poor visibility of bureaucracy are questioned in the formulation of alternatives.
The scientific literature on education is extensive and diverse, including themes such as curricular diversity, specific teaching methods for youngsters, indigenous peoples, alternating methods and educational processes, and etc. Underlying this literary production is the acknowledgment of the diversity of groups and sectors of society, which requires breaking away from the standardized services model that results from the bureaucratic regulation mode of the educational system (Maroy, 2008).
Management-based political and administrative propositions emphasize results and productivity, clouding the arguments against the social relations that produced them. In this approach, leading authorities’ emphasis on ex post mechanisms to control results – e.g. systemic evaluation – is combined with appeals to local initiative to validate outcomes. The standardization of services is questioned, and diverse performance measures emerge as a means of legitimating the actions undertaken.
however, it can be said that these political and administrative guidelines (NPM) include, to some extent, the modernization5 of educational systems created in the authoritarian regimes of Brazil. They are aimed at diversifying products and services on offer in order to promote the manifestation of the
4 In this context, the term referred to a positive sphere where differences could comprehensively and democratically flourish, a space of supposed authenticity and freedom of interests and culture (Moraes, 2001, pp. 14-16).
5 The term “modernization” here means the adoption of consumption, behavioral and institutional patterns, values and ideas of the so-called advanced societies, not necessarily focusing on actually transforming the economic and social structure.

2010 Survey on ICT Education ARTICLES 187
En
gli
sh
various socio-cultural needs in society (Durut-Bellat, 2001), and at monitoring the results obtained by governments (accountability). By promoting a greater diversity of services on offer to provide for the many interests and needs of citizens/consumers, they stand in opposition to the authoritarian and Fordist trend of bureaucratic homogenization. They also emphasize greater transparency in the setting of targets and allocation of public resources as a prerequisite for competitiveness (Pereira, 1996). The patrimonialist approach of the res publica is criticized because it does not promote the competitive expansion of markets.6
For the “Brazilian fighters,” if individual existence has become freer – different values and behaviors coexist unstably – customized treatment of their needs is a prerequisite for quality and recognition. Flexible opening hours and more options in a range of possibilities and periods of independent activity become requisites for the use of various services, including education. A wider range of options for a single service is both instructive and alluring in its recognition of uniqueness and difference. Education management is effective in providing customized services, revealing awareness of the more specific needs of individuals or groups.
It is also in the context of emerging new forms of sociability and the spread of the NPM that the results of surveys (Rutter, 1999; Brookover, 1979) on the influence of schools on students’ progress are disclosed. If, on one hand, the socioeconomic and cultural status of families affects kids’ school performance, on the other, these studies have demonstrated what the French referred to as the “establishment effect” (Cousin, 1998). This line of research proposed that different types of schools affect students’ performance. That is, the different modus operandi of schools may reduce or not the negative effects of the socioeconomic status of families (Lavinas & Barbosa, 2000). Schools are thus viewed as the loci of education management (Oliveira, 2000), and restructuring them is bringing them to the minimum required standards for quality in education (art. 4 from the LDBEN), which is measured by national learning tests.
Disclosure of the Basic Education Development Index by the Ministry of Education is evidence of this approach to government. The progress of education is now measured based on students’ performance in Portuguese and Math tests, and student flows (attendance and failure). These indexes would yield goals to be pursued by education and are comparable with those of developed countries.
These three social processes – emergence of new subjects, spread of NPM principles and reform plans for the services provided by each and every educational unit – have repositioned formal education, linking it to “social development”. Criticism of formal education, viewed as “bureaucratic” and “meritocratic”, is counter argued by the dissociation between schooling and social mobility, especially when reforms are foreseen to transform formal education into a promoter of social development. In this case, the administration (management) of school units and school systems has been reconfigured by the new fabric of social relations and the political and administrative culture brewed over the last twenty years. These three social processes have promoted the development of educational systems and had an impact on social life, affecting the relationship between education and society, restricting it to minimum standards assessed by more uniform and universal means.
6 The political success of these guidelines may be partially attributed to the fact that they were initially introduced as tools against corruption and party cooptation in the public sector.
Survey on ICT Education 2010ARTICLES 188
En
gli
sh
Nonetheless, another aspect of social development that also affects educational systems is the emergence of a diverse public sphere, one that includes mass media and alternative means of communication.
PUBLIC SPhERES: ThE FABRIC oF ThE RELATIoNShIP BETWEEN EdUCATIoN ANd SoCIAL dEvELoPmENT
When describing the origin of the public sphere, habermas (1984) identified the divide between individuals’ ability to think and the dimension where their material interests are fulfilled as the first origin of the concept. According to the habermasian approach, between private interests and governmental actions there is a space/time marked by an open and rational debate on the exercise of political authority (Avritzer & Costa, 2004, p. 704).
habermas also highlights, in the context of the emergence of the bourgeois society, the role of the science of finance and the administration doctrine in subjecting the private sphere to the public sector.
Modern economy is no longer steered by the oikos, as markets have taken over the role of
people’s homes: the economy is transformed into a “commercial economy”. The Camerilistics of
the 18th century (its name comes from the term kamara, the treasury chamber of feudal lords),
the predecessor of the political economy, is, on one hand, partially at the same level as the
science of finance, and, on the other, as the agricultural doctrine, symptomatically known as part
of the “policy”, the management doctrine per se: so closely subordinated is the private sphere of
the bourgeois society to public bodies. [...]
Although this is mostly said due to a widespread prejudice, mercantilism in no way favors
governmental enterprises; on the contrary, the business policy requires, even if via bureaucratic
processes, the setting up and dissolution of private companies working capitalistically. Therefore,
the relationship between authorities and subjects eventually results in the peculiar ambivalence
of public regulation and private initiative. Thus, issues arise in the space where the government,
through ongoing administrative actions, keeps ties with private persons. [...] As, on one hand,
the private sector clearly shapes society in relation to the government, but, on the other hand, it
elevates the play of life beyond the confines of the domestic private power, making it something
of public interest, the zone of continuous administrative contact area becomes “critical” in that
it also requires the critical thinking of an audience (habermas, 1984, pp. 34-39)
In habermas’ perspective, the creation of the “management science” was a means for the government to interfere with private life and consisted in a process of progressive nationalization of the living world (habermas, 1984, p. 45). In this respect, Foucault’s analytical perspective on power, which refuses to regard the government as a legal/political dimension detached from the social dimension, and habermas’ overlapping of powers between the administrative power and the configuration of the political public sphere, are combined in a different approach on the emergence of new ways of regulating the relationship between education and development.
2010 Survey on ICT Education ARTICLES 189
En
gli
sh
Initially, habermas (1984) believed that the political public sphere resulted from the literary sphere, functioning as an intermediate, through public opinion, between the government and society’s – a burgeoning civil society in the strict sense – needs.
The process by which the public, comprising critical individuals, appropriates the public sphere
controlled by authorities, and transforms it into a sphere where criticism is exercised against the
Government, involves restructuring the role of the literary public sphere, previously comprising
its own public with its own institutions and spheres of debate. (habermas, 1984, p. 68).
In habermas’ analysis, creating a public sphere in which criticism is exerted against the dominant power7 required the institutionalization of privacy both in spaces of institutional information and of expression of free individuals. This contradiction retro feeds itself, elevating critical individuals to power and, pari passu, rendering the government impersonal to intervene in private matters (commercial ventures, including culture) on behalf of a general interest.
Later, habermas substantially reviews his concept of public sphere. he parts with a more unified view in favor of a linguistically united, but multifaceted concept. habermas speaks of a “highly differentiated network of public spheres which are local and suprarregional, literary, scientific and political, interparty or specific to media-related associations or subcultural, in which discursive processes of opinion formation take place, primarily aimed at spreading knowledge and information “(Siva, 2001, p. 449). In this context, Ball (2008), based on Foucault, explores those moments when language, attitudes and new forms of sociability are unified, or we should say, paradoxically articulated.
The revision proposed by habermas preserves, however, from the original conception of public sphere, its emancipatory power to protect and restore the living world, which is affected and uncharacterized by systemic colonization; more specifically, the economy and the state bureaucracy destroy communication processes in areas such as culture, education or socialization (Silva, 2001, p. 443). In this context, the habermasian concept of public sphere may contribute to the understanding and assessment of the relationship between education and social development, without resorting to the human capital theory.
“Structural transformation of the public sphere” enables viewing the constitution of space-time, in which the generalization of the mercantile mode has created the supervenience of immediate abstract products of labor and heightened individual perceptions of abstract relations, characteristic of the capitalist mode of production. From this perspective, habermas’ work allows us to infer that the generalization of the mercantile mode in the production and reproduction of social life mediated by the administrative power of the State, paradoxically, has contributed to strengthen the political public sphere; i.e. private individuals are brought together under the scope of critical decisions by public authorities.
7 Discursive forms of public communication characterized by their argumentative content (Costa, 2002, p.187)
Survey on ICT Education 2010ARTICLES 190
En
gli
sh
According to habermas (1984), the foundation of the political public sphere lies in the previous existence of interactions not colonized by mercantile relations, but his work indicates that relationships are strengthened in the power system (state sphere), which paradoxically also strengthens the political public sphere. The potential tension between the private sector (civil society) and the public power (government), a requirement for the construction of a political public sphere, creates a need for increasing forms of political and educational diversity in the country, namely the design of an educational system capable of creating this diversity. In other words, education management policies are able to “fill” the gaps created by inequalities, but they fill the spaces where diversity is expressed.
According to Ball (2008), sociological studies relating social inequalities with schools and families have shown how these institutions are multidimensional and interconnected and, although due to configurations that overlap at different points, have enabled new power mechanisms (governance). habermas, in turn, claims that the development of political public spheres, viewed as real opportunities, is related to the issue of citizenship viewed as a formative collective subjectivity (also referred to as “active citizenship” by Domingues, 2009, p. 58). These contradictory social movements underlie power distribution/concentration in the development of educational systems and key factors in social dynamics that affect them.
Different opinions, needs, publics (youth, ethnic, sexual orientation) have different focuses, and their articulation through hierarchical and bureaucratic principles meets strong resistance. A more complex and diverse society grows and renders institutional arrangements through which demands are channeled to the government dysfunctional – including the educational system – and new collective subjectivities (identities) are mediated by other modes of regulation of social life. In this context, education and development are related in that the former is involved in contemporary individualization processes by providing quality universally basic services, and the institutionalization of a different, more diverse education system significantly shakes the core of meritocratic practices and imagery.
PARTIAL CoNCLUSIoNS: dEvELoPING ThE EdUCATIoNAL SYSTEm
The original concept of development and education views the expansion of the system as a means of developing it, and requires the government to take on a leading role through planning. The latter, through social policies, works to overcome social underdevelopment, and uses science and technology policies to overcome obstacle to technical/production progress.
however, two contemporary authors draw our attention to current ongoing social movements in which, on one hand, new forms of governing subjectivity are forged and, on the other, new forms of individualization are created by the provision of services that grant social rights. In this sociological perspective, the concept of development refers to cycles of social transformation whose medium and long term effects cannot be foreseen. Thus, development is dissociated from the concept of progress and more closely related to the structuring of new societal alternatives.

2010 Survey on ICT Education ARTICLES 191
En
gli
sh
REFERENCES
AVRITzER, Leonardo; COSTA, Sérgio. Teoria crítica, democracia e esfera pública: concepções e usos na América Latina. dados, Rio de janeiro, v. 47, n. 4, pp. 703-728, 2004.
BALL, Stephen. Some Sociologies of Education: a history of Problems and Places, and Segments and Gazes. the Sociological review, v. 56, n. 4, 2008.
BARzELAY, Michael. The New Public Management: a Bibliographical Essay for Latin America (and Other) Scholars. international Public management journal, n. 3, pp. 229-265, 2000.
BRASIL. Conae. construindo o sistema nacional articulado de educação: o plano nacional de educação, diretrizes e estratégias de ação. Documento-base, v. 1. Brasília: Conferência Nacional de Educação, 2010.
BROOKOVER, Wilbur C. et al. School Social Systems and Student Achievement: Schools can make of difference. New York: Praeger, 1979.
COSTA, Sérgio. As cores de ercília: esfera pública, democracia e configurações pós-nacionais. Belo horizonte: Editora da UFMG, 2002.
CUNhA, Luiz Antonio. educação e desenvolvimento social no Brasil. 10. ed. Rio de janeiro: Francisco Alves, 1988.
COUSIN, Olivier. l’efficacité des collèges: sociologie de l’effet établissement. Paris: PUF, 1998.
DOMINGUES, josé Maurício. Desenvolvimento, modernidade e subjetividade. rBcS, v. 14, n. 40, june, 1999.
_____. A América latina e a modernidade contemporânea: uma interpretação sociológica. Belo horizonte: Editora da UFMG, 2009.
DURUT-BELLAT, Marie. Politiques éducatives et analyse des inégalites: de quelques vertus heuristiques des comparaisons franco-britanniques. revue française de pédagogie, n. 135, pp. 19-28. April-june, 2001.
hABERMAS, jürgen. mudança estrutural da esfera pública. Rio de janeiro: Tempo Brasileiro, 1984.
LAVINAS, Lena; BARBOSA, Maria Ligia O. Combater a pobreza estimulando a frequência escolar: o estudo de caso do Programa Bolsa-Escola do Recife. dados, v. 43, n. 3, Rio de janeiro, 2000.
MAROY, Christian. “Régulation des systèmes éducatives”. In: VAN zANTEN, Agnès. dictionnaire de l’éducation. Paris: Presse Universitaire de France, 2008.
MORAES, Maria Célia M. Recuo da teoria: dilemas na pesquisa em educação. revista Portuguesa de educação, v. 14, n. 1, pp. 97-65, 2001.
OLIVEIRA, Dalila Andrade (org.). gestão democrática da educação: desafios contemporâneos, v. 1. 3. ed. Petrópolis: Vozes, 2000.
PEREIRA, Luis Carlos Bresser. “Da administração pública burocrática à gerencial”. revista do Serviço Público, 47(1), january, 1996.
POWER, Sally. Managing the State and the Market: “New” Education Management in Five Countries. British journal of educational Studies, v. 45, n. 4, pp. 342-362, 1997.
RUTTER, Michael et al. Fifteen thousand hours: Secondary Schools and their effects on children. Somerset: Open Book. 1999
SILVA, Felipe C. Espaço público e democracia: o papel da esfera pública no pensamento político de habermas. Análise social, v. XXXVI (158-159), 2001, pp. 435-459.
SOUzA, jessé de. “A gramática social da desigualdade brasileira”. rBcS, 19(54), February, 2004.
_______. os batalhadores brasileiros: nova classe média ou classe trabalhadora?. Belo horizonte: Editora da UFMG, 2010.


2010 Survey on ICT Education ARTICLES 193
En
gli
sh
ChALLENGES FoR ThE STUdY oF EdUCATIoN ANd ExTERNAL EvALUATIoNS: PARALLELS WITh KNoWLEdGE ANd PoLITICS
Ocimar Munhoz Alavarse 1
A comprehensive analysis of the numerous issues comprising the subject of this essay, as well as their unfolding, would be impossible within the context of this work. A vast literature has been devoted both to identify and discuss the body of research on education in Brazil and abroad, and to establish methodological options and controversies that contribute to the effective development of such research. Examples of this production and the excellence of its contributions include Azanha (1992), Cohen, Manion & Morrison (2007), Ferrare (2011) and Gatti (2007).
The National Association for Research and Graduate Studies on Education (Anped) is a noteworthy reference in scientific research on education in Brazil and its challenges, thanks to the relevant material made available through its portal. Furthermore, Anped, whose annual meetings are one of the main scientific events in the country, brings together all graduate programs in education in Brazil, and its journal – the Brazilian journal of education – is one of the leading scientific publications in its field.
In any case, in order to address the issue, albeit within the limitations of an essay, I have explored the challenges of educational research, aiming to relate the epistemological issue of determining research objects with an aspect that stands out in education in Brazil. Regarding the first issue, I have aimed to discuss the state of knowledge production, the essential reason for any research, exploring some of the obstacles and concerns of scientific production. Regarding the second aspect analyzed, I have explored the widespread use and prominent role played by external evaluations of basic education schools in public policies for education. Most of the time, such evaluations take the form of evaluation systems conducted as large-scale evaluations or standardized evaluations due to the instruments and procedures adopted in their implementation.
In Brazil, this evaluation framework became prominent after the implementation, in 2005, of the National Evaluation System for Basic Education (Saeb). The Portuguese (reading) and Math (problem solving) results and pass rates of one of its instruments, namely the National Evaluation
1 Professor at the School of Education of the University of São Paulo and researcher on education cycles, progression and evaluation.

Survey on ICT Education 2010ARTICLES 194
En
gli
sh
of Educational Performance (Anresc) – widely known as Prova Brazil – have been incorporated into computing the Basic Education Development Index (Ideb)2, promoting similar initiatives in various public education networks, particularly the Education Development Index in the State of São Paulo (Idesp). One of Ideb’s aims is to disclose data from all public schools taking part in Prova Brasil, thus enabling several sectors to be involved in the debate and research on their meanings and potential explanations. Textually, Ideb’s proposal is extremely objective regarding its potential to reveal the quality of schools, although, historically and politically, this concept, before and after its publication, has revealed other manifestations in literature and educational policies.
Indeed, in this scenario, the results of external evaluations have been included in both public policies and research, and represent the initial stages of defining what is broadly known as quality of education. The very heart of the challenge for this study in understanding the potential setbacks of research on education lies in the question: Would such results be able to assess the quality of schools? hence, at least two new questions arise, one concerning the very object of these evaluations – the school as a whole or just a facet, however important, of the work being done – and the other related to how this object is investigated.
ChALLENGES IN dETERmINING STUdY oBjECTS ANd ISSUES RELATEd To RESEARCh oN EdUCATIoN
Burke (2003, p. 183), analyzing the social process of knowledge production, indicates that, with variations in time and cultures:
[...] there are only four reasons to accept propositions as true – sentiment, authority, reason and
sensory perception [...] In the early modern period, this balance tipped towards a combination of
reason and sensory perception [...] There was a new increasingly acute awareness of the method,
connected with the use of scientific instruments, the more systematic collection of particular
facts and the emergence of practical guides.
Although devoid of the hope heralded by Leibniz, namely of a universal mathematics to calculate truth, but probably propelled by the very “spirit” that embodied the claim of reason to control the senses in the search for evidence, no field of scientific research remained immune to adopting this empirical approach as its leitmotiv. In the quest to uncover laws and patterns, albeit potential, the inductive method, due to apparently favoring the search for evidence – in the eyes of those who seek objective data – was invested with an “aura” of self protection for its relentless efforts to exhaust the quest for evidence, thus uncovering causal relationships. One of the implications for research was introducing near exhaustive trial and testing efforts in the search for truth. Induction is acceptable,
2 Ideb was instituted by Decree no. 6,074/2007 and is based on Fernandes (2007); it is calculated and disclosed to all public schools with at least thirty students in years 4th to 8th of basic education, as well as other segments. For more information see the Inep website, a body of the Ministry of Education in charge of implementing the Saeb (www.inep.gov.br).

2010 Survey on ICT Education ARTICLES 195
En
gli
sh
among other reasons related to its practical aspects, even when addressing “moving targets” – such as social policies, in the words of Palumbo (1994) – particularly when we set out to understand phenomena such as the evaluation of schools.
Whereas it is reasonable to say that the authority of this inductive approach has waned, in the sense that such beliefs are being replaced by new methodologies that seek to investigate the path to truth, a fortiori it is reasonable to state that its influence has not ceased, or has resurged with renewed and transformed vigor. As an indication of such renewed vigor, there are the risks of operationalism, i.e. the desire to find and manipulate seemingly operative concepts in the study of certain objects, incurring, however, in an uncritical stance towards such concepts, as seems to be the case of the disclosure of large scale evaluation results, through the use of standardized tests, as if they were mechanically and automatically related to school learning and, therefore, a consequence of the work carried out in schools. Indeed, in many cases, it oversteps the boundary that distinguishes cause from effect, as if a set of scales could determine the mass of any matter and, at the same time, determine if it is gold or silver.
Nonetheless, before discussing the consequences of such inferences, relating performance in tests to the educational efforts of schools – a primary driver of the quality of institutions – we emphasize that the essence of any scientific research – its conditio sine qua non even – is the determination of research problems, which, in turn, leads us inexorably back to the challenge of determining study objects. In education, this seems to add further challenges, as we could even question issues such as whether there is a science of education; i.e. whether pedagogy has reached a status in which it is defined, among other attributes, with clear objects, even when potential sub areas are accounted for.
The recent disclosure of vast amounts of data from external evaluations, contrary to their proposed use in several public policies, does not solve the issue of determining research problems and objects in educational research. The acceptance of such politically contaminated results, with dependent variables and indicators, par excellence, on the quality of formal education ultimately reduces or aggravates the significance of important factors in the scope of research on education. These results become the research object of choice, and the use of standardized tests becomes the preferred research methodology. And even studies on independent variables within schools seem to be conceived within a context in which these variables are actually no longer dependent on other factors that are neglected or overlooked. A consequence of this type of approach, extensively verified in the United States – as shown in the literature by Madaus (1988) – is “teaching for tests”, with profound curricular, pedagogical and didactic restrictions. Another consequence is that players in the education process, particularly teachers and superintendents, would be held accountable to an extent that does not correspond to the actual weight of their role in such a process. Nonetheless, the most serious consequences of this approach are, within the scope of this study, implications to research on education, as it would lead to defining problems and objects that are distant from the reality of formal education.
This does not mean denying the relevance of research problems such as the following examples: what do kids learn in school? how much of what they learn is learnt at school? The caveat, however, is that such questions seem to be perfectly provable, empirically, reliably and inductively answered by standardized tests. however, the challenge would still lie in defining school itself, its quality regarding its historical and social constitution. This implies more essential questions, e.g. why do kids learn what they learn in school? why do they learn as much as they do in school? what is the purpose of learning what they learn in school? From a methodological perspective, the following

Survey on ICT Education 2010ARTICLES 196
En
gli
sh
question must be added to this list: how can we learn the answers to such questions? This refers us to the procedures of standardized tests, to the preparation and processing of data which is still not as precise as believed by users of its results. This aspect should be taken into greater consideration in conceiving public policies.
hence, assuming that “simplifications” apply to some extent to these results – which, I stress, does not take away the merit of their production – it is imperative to emphasize the ongoing investigative task of positioning formal education within social practices. This, on one hand, creates room for other fields of science to address it, but, on the other hand, requires education scientists to always account for a set of issues that affect, limit, and impose restrictions and potentialities on school educational activities, functioning as latent traits. Understanding this, in its multitude of variables, does not always necessarily have to be the object of investigation, nor does it always have to be discussed within the set of explanations, but overlooking its existence or impact may undermine the elucidative effort of the investigative mission, especially because it is this acknowledgement that will lead to the search for better options, alternatives to overcome didactic and pedagogical impasses, to optimize processes, and etc. In the context of research on education, it is important to confirm that evidence neither confirms nor refutes, as it may easily be assumed, the connections that the results of these evaluations seem to indicate.
If the relationship among phenomena is characteristic of any science, in education this feature takes on proportions that make it more difficult to determine research objects. Thus, the partial view enabled by the object may, often, create “optical illusions” for researchers.
In educational research, its object is suffused with an almost incalculable range of influences, as it is constituted as a social practice. Epistemological challenges arise in the gnosiologic sphere, due to the nature and validity of such knowledge. Such assertions, far from undermining its heuristic merit, function more as a caveat both for imperative generalizations – and powerless in the very terms they refer to – and for hyper specializations approached by very few researchers.
Orlandi (1969, p. 16-17), concerned with the structural complexity of the research object of studies on education, as well as the challenging role of “pedagogical awareness” in preventing theoretical emphasis from fluctuating and venturing outside its own field, defined a potential reason for these fluctuations in the “dispersive nature of the object of research on education [that] affects the role of the hypothesis employed to study it”, because this nature “requires the previous construction of a sufficiently broad and flexible theoretical structure to address the study object”. however, inexorably, constructing a sufficiently solid theoretical framework to address issues requires opening up to other sciences, including researcher training, but Orlandi (1969, p. 17) reiterates:
The fluctuating character of this expansion can only be controlled, not by denying the expansion,
[...] but by the increasing dynamism of other theories and human practices prompted by the
mobility of the research object itself in the study of education.
This attests the relevance of being more open to the possibility of adopting the grounded theory, as suggested by Gibson and Brown (2009), as a baseline reference, and even as a research methodology – a strategy to study figures more carefully, for example, avoiding the haste required by other models to easily uncover cause-effect relationship.

2010 Survey on ICT Education ARTICLES 197
En
gli
sh
At this stage, it is noteworthy that – despite misguided uses and generalizations and to avoid simplistic criticisms claiming such resources to be a resurgence of “positivist” theories – results from external evaluations elicit a debate on the study of education regarding quantitative methods, which, as established by Ferrare (2011), were markedly refuted and almost abandoned due to what was referred to as critical thinking in education, because their underlying tradition did not take into account the broader social factors affecting education and reinforcing conservative mechanisms.
hence, the onset or resurgence of methodologies targeting education metrics – including instruments, application and collection procedures, data, creation of databases, information, arguments, knowledge, judgments, actions, consequences, impacts, and etc. – may lead to new perspectives and challenges to educational research, notwithstanding broader social and political concerns regarding the political nature of schools, which does not dismiss such methodological contributions, nor render them unique in scientific research, as found in Pearl (2009) or in Shadish, Cook & Campbell (2002).
ExTERNAL EvALUATIoNS vIEWEd AS ExPRESSIoNS oF EdUCATIoNAL PoLICIES
In view of the dilemma of whether or not to use the results of external evaluations as indicators, we may resort to the words of josé Paulo Paes, who claims that “the road of critical understanding runs between refusal and enthusiasm” (1985, p. 10). This proposition seems appropriate to approach a subject that, having always had a political streak, becomes more prominent in educational policies and, therefore, more likely to be approached with refusal and enthusiasm, which could potentially cloud its analysis.
With poetic license and consolidating the political dimension of external evaluations, we may borrow Secchin’s (1993, p. 216-217) words when he asks and answers:
What is the purpose of a poem? Perhaps to emphasize that there are always remnants, mistakes,
gaps, fractures in man’s perception of reality. To ignore them is to believe that words accurately
reflect things, to believe the validity of a homogeneous view that prevents individuals from
negotiating the meaning of gaps resulting from uncertainty and change that both words and we
need to stay alive [...] The divide between what is prosaic and what is poetic is managed by
several cultural vectors, however upsetting this is to hunters of the lost essence, and lost is the
essence for never having existed [...]
[...] poetry does not need to wail when confronted by the technological order, and accuse it of
being the enemy preventing its reach. [...] it remains with no other purpose than to attest that our
freedom is not only substantiated on the words we define ourselves in, but, more importantly, on
the words with which we learn to transform ourselves.
That is, figures per se do not yield an accurate understanding of reality, but they introduce another means of exploring this reality, whose understanding – assuming it is feasible – will depend on how we investigate it through the objects and questions we address. Although evaluations are different from research, which is based on more immediate concerns and has bias as one its most prominent

Survey on ICT Education 2010ARTICLES 198
En
gli
sh
features, as highlighted by Nevo (2006) – resulting in highly consistent results, given the conditions under which they are employed – they may be viewed as strong footholds.
According to Brandão (2010), education is the formative or endocultural process of the human species, a process our species cannot do without, lest it forgo its humanity. Nevertheless, in most societies, the education of human beings has been connected with the idea that, to some degree and extent, it must be related to schooling. Such a cultural setting suggests, in many contexts, that speaking of education is inexorably speaking of schooling. Even when it is acknowledged that the latter is subsumed to the former, the symbolic significance of schooling prevails, whether from the perspective of social conservation or criticism, but never dissociated from politics, as uncovered by Fernandes (2010), among many other authors.
The liberal values of equal opportunities, generally viewed as equal schooling opportunities, emphasize the high prominence of schools in society; schools are the main arena where the competition for positions in the hierarchical social structure takes place. Even in other ideological perspectives, the notion of schooling as a promoter of human emancipation and linguistic integration, or other objectives related to social equality, has probably become one of the key points in the human rights agenda, to the extent that it is now mandatory. In the words of Marshall (1967), it is a right which is also a prerequisite for the fulfillment of other rights, thereby justifying the – symbolic, but perhaps physical – violence with which children are compelled to it.
Furthermore, in this context of the formative process, evaluation potentially figures as an object of investigation. It may even assess, via meta-evaluation, if certain rules of the evaluation process have not been violated, which, in turn, would jeopardize evaluative judgments and their consequences.
Moreover, given its congregational character, we can safely say that evaluation features as a category of educational processes, requiring special attention, particularly for being concrete, that is, because it synthesizes multiple determinations; In Marx’s words (1970, p. 206):
[...] it is concrete because it synthesizes several definitions, thus representing the unity of several
aspects. In our minds, therefore, it is viewed as a summary, a result, not as a starting point,
despite being the true origin, thus the origin of observation and imagination.
Additionally, to substantiate evaluation as a category, Cury (1985, p. 21) points out:
Categories are basic concepts aimed at reflecting general and essential aspects of reality, its
connections and relationships. They emerge from the analysis of multiple phenomena and are
highly general.
From the outset, it is notable that categories must correspond to the actual conditions of each
place and time. They cannot be defined as one and they do not have a purpose themselves. They
play a role as tools for the understanding of a concrete social reality, and this understanding is
only significant if embraced by the groups and agents involved in educational practice.

2010 Survey on ICT Education ARTICLES 199
En
gli
sh
Categories are simultaneously interpreters of reality and indicators of political strategies.
Therefore, the only valid purpose for disclosing them is as methodological analytical instruments,
related to the educational practice in the context of a specific time and place.
Thus, categories are only truly consistent when constructed from an economic, social and
political context that is historically set, because reality is not comprised of stagnant models or
frozen movements. Instead, it is a synthesis of multiple determinants, it is constantly expanding.
hence, it is important to take the context into account, as it is what prevents categories from being
isolated as purely conceptual structures, enabling them to merge with reality and movement.
This entails, therefore, attempting to determine which social factors – evidently manifested as truly pedagogic – underlie them, in order to comprehend how they have been conceived as an idea, which seems to prevail in the schooling process, and how their concrete manifestation consolidates a socio-historical relationship.
Marx (2005, p. 151) warned that “the weapon of criticism cannot, of course, replace criticism of the weapon”, which, mutatis mutandis, uncovers the great challenge of eventually using the results of external evaluations as a basis for the understanding of formal education, without overlooking the hypothesis that these results are perhaps not a product of schools themselves, but of other elements of reality, including interests that do not aim to “reveal” schooling, but to “produce” it. The latter may be legitimate as a political artifact, but not as a pure and simple presentation of reality/truth based on the accuracy of figures. These are not always accurate, and we do not always need them. In this regard, the contributions of Sousa (1997a and 1997b) and Weiss (1982, 1991 and 1997) are noteworthy.
FINAL ThoUGhTS
In short, a true research programme on education, in the current framework of educational policies, may be based on a methodology that simultaneously reinstates schools and their evaluations as objects viewed in their concreteness, not as autonomous or subsumed practices. This, in addition to contributing to facing and overcoming impasses in studies on education, would enable us to establish references for the analysis of schooling, by incorporating results from external evaluations and, at the same time, refuting the mystifying status of these evaluations as being able to explain everything. Thus, these results are viewed as inherently inferential, and therefore approximative and not as adverse or disconnected from their underlying processes.
Restoring or reinstating the perspective of concrete phenomena, namely schools and their evaluation, is to adopt an investigative approach that emphasizes the set of variables that pervades them. In addition to arguing that politics should be left to politics, and defending a reasonably self-critical science, we emphasize that simplifications in the realm of science tend to level it, to lessen its strength with general beliefs, and, in the realm of politics, by innocence or apoliticism, to condemn it to explanatory and effective impotence in relation to its object reality.

Survey on ICT Education 2010ARTICLES 200
En
gli
sh
REFERENCES
AzANhA, josé Mário Pires. uma idéia de pesquisa educacional. Campi, 6. São Paulo: Edusp, 1992.
BRANDÃO, Carlos Rodrigues. o que é educação. 53. reimpr. Primeiros Passos, 20. São Paulo: Brasiliense, 2010.
BURKE, Peter. uma história social do conhecimento: de gutenberg a diderot. Translation Plínio Dentzien. Rio de janeiro: jorge zahar, 2003.
COhEN, Louis; MANION, Lawrence; MORRISON, Keith. research methods in education. 6. ed. London: Routledge, 2007.
CURY, Carlos Roberto jamil. educação e contradição: elementos metodológicos para uma teoria crítica do fenômeno educativo. São Paulo: Cortez / Autores Associados, 1985.
FERNANDES, Florestan. “A educação como problema social”. In: ______. Florestan Fernandes: leituras e legados. Apres. Maria Arminda do Nascimento Arruda. São Paulo: Global, 2010. pp. 243-254.
FERNANDES, Reynaldo. Índice de desenvolvimento da educação Básica (ideb). Série Documental. Textos para Discussão, 26.Brasília: Instituto Nacional de Estudos e Pesquisas Educacionais Anísio Teixeira (Inep), 2007.
FERRARE, joseph j. “A pesquisa educacional crítica pode ser ‘quantitativa’?”. In: APPLE, Michael W.; AU, Wayne; GANDIN, Luís Armando. educação crítica: análise internacional. Translation Vinicius Figueira. Porto Alegre: Artmed, 2011. pp. 512-529.
GATTI, Bernardete Angelina. A construção da pesquisa em educação no Brasil. Série Pesquisa, v. 1. Brasília: Líber Livro, 2007.
GIBSON, Will; BROWN, Andrew. “Teoria, grounded theory e análise qualitativa”. Translation Verônica van Wilpe. In: BOURGUIGNON, jussara Ayres (org.). Pesquisa social: reflexões teóricas e metodológicas. Ponta Grossa: Todapalavra, 2009. pp. 35-62.
MADAUS, G. F. “The Influence of Testing on the Curriculum”. In: TANNER, L. N. (org.). critical issues in curriculum. Eighty-seventh Yearbook of the National Society for the Study of Education. Chicago: University of Chicago Press, 1988. pp. 83-121.
MARShALL, Thomas humphrey. cidadania, classe social e status. Biblioteca de Ciências Sociais. Translation Meton Porto Gadelha. Rio de janeiro: zahar, 1967.
MARX, Karl. A contribution to the critique of Political economy. Translation S. W. Ryazanskaya. Org. e intr. Maurice Dobb. Moscow: Progress, 1970.
______. crítica da filosofia do direito de hegel. Translation Rubens Enderle e Leonardo de Deus. São Paulo: Boitempo, 2005.
NEVO, David. Evaluation in Education. In: ShAW, Ian F.; GREENE, jennifer C.; MARK, Malvin M. (org.). handbook of evaluation. London: Sage, 2006. pp. 441-460.
ORLANDI, Luiz Benedicto Lacerda. O problema da pesquisa em educação e algumas de suas implicações. educação hoje, São Paulo, n. 2, pp. 7-25, 1969.
PAES, josé Paulo. gregos & baianos: ensaios. São Paulo: Brasiliense, 1985.
PALUMBO, Dennis j. Public Policy in America: government in Action. 2. ed. Fort Worth: harcourt Brace College, 1994.
PEARL, judea. causality: models, reasoning and inference. 2. ed. New York: Cambridge University Press, 2009.
ShADISh, William R.; COOK, Thomas D.; CAMPBELL, Donald T. experimental and quasi-experimental designs for generalized causal inference. Belmont: Wadsworth / Cengage Learning, 2002.
SECChIN, Antônio Carlos. Poesia e desordem. Poesia Sempre, Rio de janeiro, 1(1), pp. 215-217, jan., 1993.

2010 Survey on ICT Education ARTICLES 201
En
gli
sh
SOUSA, Sandra Maria zákia Lian. “Avaliação escolar e democratização: o direito de errar”. In: AQUINO, julio Groppa (org.). erro e fracasso na escola: alternativas teóricas e práticas. São Paulo: Summus, 1997a. pp. 125-139.
______. “Avaliação do rendimento escolar como instrumento de gestão educacional”. In: OLIVEIRA, Dalila Andrade (org.). gestão democrática da educação: desafios contemporâneos. Petrópolis: Vozes, 1997b. pp. 264-283.
WEISS, Carol hirschon. “Pesquisa avaliativa no contexto político”. Translation Yara Marques. In: GOLDBERG, Maria Amélia Azevedo; SOUzA, Clarilza Prado de (org.). Avaliação de programas educacionais: vicissitudes, controvérsias e desafios. São Paulo: EPU, 1982. pp. 23-27.
______. Evaluation Research in the Political Context: Sixteen Years and Four Administrations Later. In: MCLAUGhLIN, Milbrey W.; PhILLIPS, D. C. (org.). evaluation and education: at quarter century. Ninetieth Yearbook of the National Society for the Study of Education. Part II. Chicago: National Society for the Study of Education, 1991. pp. 211-231.
______. evaluation: methods for Studying Programs and Policies. 2. ed. Upper Saddle River: Prentice-hall, 1997.


2iCT eDUCATiOn


2010 Survey on ICT Education ICT EDuCATION – METHODOLOGICAL REPORT 205
En
gli
sh
mEThodoLoGICAL REPoRT ICT EdUCATIoN 2010
INTRodUCTIoN
The Center of Studies on Information and Communication Technologies (Cetic.br), of the Brazilian Network Information Center (NIC.br) – the executive branch of the Brazilian Internet Steering Committee (CGI.br) – presents as of 2010 the ICT Education survey, which is one of its surveys on the use of information and communication technologies (ICT) in Brazil.
The survey methodology was based on international references and received the support of renowned bodies, such as the IEA (International Association for the Evaluation of Educational Achievement).
The survey aimed to determine how ICT are used and incorporated by public schools in teaching practices and school management, thus monitoring potential changes to school dynamics related to this use.
mEThodoLoGICAL ASPECTS
REFERENCE dATE
The survey was conducted between August and November 2010.
TARGET PoPULATIoN ANd SAmPLE UNIT
The target population of the study are teachers, directors of studies and principals from state or municipal public schools in Brazil, in metropolitan areas, who work in the following levels of the Brazilian education system: Elementary Education I (elementary school), Elementary Education II (middle school), Secondary Education (high school).
Each school is viewed as a conglomerate comprised of teachers, students, principals and directors of studies, who are the relevant actors in this survey. hence, a school is regarded as a primary sample unit.

Survey on ICT Education 2010ICT EDuCATION – METHODOLOGICAL REPORT206
En
gli
sh
REGISTRIES USEd ANd REPoRTING UNITS
The registry used to select schools was the Basic Education Census 2007, conducted by Inep (Anísio Teixeira National Institute for Studies and Research on Education). In every school, the aim was to select a principal, a director of studies, two Portuguese teachers, two math teachers and ten students. Students and teachers selected attended or worked in the following grades: 5th year of Elementary Education I (former 4th grade), 9th year of Elementary Education II (former 8th grade) and 2nd year of Secondary Education. ICT Education survey focused on teachers.
ANALYSIS PRoFILES
In order to reach its goals, the survey addressed the following subjects, based on specific approaches:
A. Schools: profile of ICT infrastructure and practices in public educational institutions.
B. Teachers: profile, career level and commitment to teaching; ICT skills; use of ICT in school activities and barriers preventing its progress.
C. Students: profile and ICT skills; ICT training; school activities carried out on the Internet.
D. Principals: profile; use of ICT in management and administrative activities, including interac-tion with the community.
E. Directors of studies: profile; use of ICT in management and administrative activities, inclu-ding interaction with the community.
Results for the subjects outlined above may be viewed segmented by the following variables:
Region: the macro regions of Brazil, as divided by the Brazilian Institute of Geography and Statistics (IBGE). In order to increase representativeness, samples from the Center-West and North regions were grouped in the analysis.
Administrative jurisdiction: administrative reporting level, i.e., municipal or state.
Grade: levels in the formal educational system. Three grades were investigated, each representing a level of education addressed in the survey: Elementary Education I (4th grade/5th year), Elementary Education II (8th grade/9th year) and Secondary Education (2nd year).
Computer installed in the IT lab: presence of computers in the IT lab of each school, which was recorded according to information provided by the school principal.
Internet available in the IT lab: access to the Internet from computers installed in the IT lab of each school, which was recorded based on information provided by the school principal.
Family income: household income, i.e., the total monthly income of all members living in the respondent’s household.
Individual income: total monthly wage of the respondent.

2010 Survey on ICT Education ICT EDuCATION – METHODOLOGICAL REPORT 207
En
gli
sh
For data publication, three income ranges were determined. It is worth noting that individual and family incomes were not surveyed among students.
INFoRmATIoN oN ThE qUESTIoNNAIRE
Interviews were conducted based on structured questionnaires for each target population.
Application of the data collection instrument took approximately 20 minutes for teachers and students and approximately 30 minutes for principals and directors of studies. Each questionnaire includes the modules below.
Module A has questions about the personal characteristics of each actor. Professional and academic profiles were surveyed with all actors, except for students. Furthermore, principals were asked about general aspects of the school infrastructure, thus obtaining basic school data.
Module B outlines the profile of school actors as ICT users; it aims to draw a picture of ownership and use of computers and the Internet. It accounts for the type of computer, mobility, portability and frequency of use, and investigates the digital inclusion status of students, teachers, directors of studies and principals. Except for students, it investigates the sources of resources for computer acquisition, in order to determine whether there are governmental programs and if these are being used.
Module C captures the perceptions of students and teachers regarding their individual skills when carrying out activities using computers and the Internet. It also investigates directors of studies’ and principals’ ICT skills in carrying out school administration and organizational and pedagogic planning activities.
Barriers preventing use were investigated in modules D for directors of studies, E for principals and F for teachers, in order to shed light on the barriers preventing ICT incorporation by schools.
Module D investigates specific training for teachers and students; it aims to outline where knowledge is obtained, particularly computer and Internet skills, as well as to determine whether there are governmental programs and if these are being used. This module also asked principals about the ICT equipment and resources available in the school and about their conditions.
School and educational activities are surveyed in module E for students and teachers. Regarding students, it explores the range of activities available in classrooms and investigates whether students use technological resources offered by the school as learning tools. With teachers, it seeks to outline the universe of school activities and their perceptions regarding pedagogic objectives, teaching practices, evaluation methods and support to the use of ICT.

Survey on ICT Education 2010ICT EDuCATION – METHODOLOGICAL REPORT208
En
gli
sh
SAmPLE PLAN
In order to gather information on the use of ICT in the Brazilian public education system, the ICT Education 2010 survey used data from the School Census 2007 (Inep/Ideb). A sample of 500 schools was designed by Ibope Inteligência, which was also in charge of data collection and result calculation.
It is a probability sample, cluster-stratified and selected in stages. Selection was performed by PPS (probability proportional to size), based on the number of enrollments in the School Census 2007. The proportion of schools per administrative jurisdiction (municipal and state) and level of education (Elementary, Secondary and both) was maintained. The sample is disproportional for regions (Northeast, Southeast, South and North / Center-West), but it was further weighted.
Thus, the sample plan enables data collection from Brazilian municipal and state public schools. Federal schools were not included due to their particularities.
Each sample unit drawn (school) was regarded as a conglomerate, and in these units, up to two classes were drawn based on the number of enrollments per school and grade. Students were selected at the time of the interview. Overall, 5 students were interviewed in every class, except when there was only one class for the set grade in the school, in which case 10 students were selected for the interview.
The main difference between the ICT Education survey sample and the one used by Saeb (National Basic Education Evaluation System) is the criterion that defines school size. For Saeb, school size is determined based on the number of existing classes, whereas in the ICT Education the criterion used is the number of enrollments.
The cross-section combining region, administrative jurisdiction and level of education produced 24 strata, and a list of schools was created for each of these strata. In this list, schools were organized in descending order of number of enrollments to ensure all school sizes were significantly represented. The first school from each registry was selected by an initial random jump, multiplied by an interval based on a ratio combining the total number of students over the number of schools to be selected in each stratum. The interval was used systematically to select the remaining schools. The number of schools drawn in each stratum was proportional to the size of the universe.
A second stage involved selecting classes, after selecting a grade in each sample unit drawn (school).
If the school was only selected for interviews with one grade, one or two classes could be selected. hence, in schools where there was only one class in the grade selected, ten interviews were carried out with students from that class. In schools where there were two classes for the grade selected, five students were interviewed in each class. For schools with more than two classes in a given grade, students attending school during the period when there were more classes were interviewed; five interviews were carried out with the first class (class A or first letter of the period) and other five interviews were carried out with the last class listed by the school.
If the school was selected for interviews with two different grades, one class was interviewed in each grade; in schools where there was only one class per grade, five students were interviewed in each of the classes. In schools with more than one class in the selected grades, students attending school during the period when there were more students enrolled were interviewed; five interviews

2010 Survey on ICT Education ICT EDuCATION – METHODOLOGICAL REPORT 209
En
gli
sh
were carried out with the first class (class A or first letter of the period for each grade selected) and other five interviews were carried out with the last class listed by the school for the grade selected.
Schools had to have at least one class in each grade selected, otherwise they would be replaced. The remaining criteria are described in detail under “Non-response to a unit”.
In certain schools, interviews were carried out with all students in a class, because the number of students available was lower than the desired quantity.
In order to select interviewees, the third stage of selection, students were chosen systematically by jumps of 4 students, following row distribution in the classroom. The first student was selected randomly by the interviewer, and that position was not repeated for the remaining classes in the same school.
Portuguese and math teachers involved with the classes from the selected grades were interviewed. In 4th grade/5th year classes, teachers teaching basic subjects were interviewed. Regarding directors of studies and principals, the survey aimed to interview those who worked with the grades of the classes selected. When this was not feasible, interviews were carried out with the subjects available for the interview.
In total, 7,453 interviews were carried out – 1,541 with teachers, 4,987 with students, 497 with principals and 428 with directors of studies.
WEIGhTING
The sample plan considered a disproportionate distribution per region, thus results had to be weighted to ensure the sample profile was representative of the universe of the study. The weighting method used was the so-called cell weighting. hence, the South and North/Center-West regions were over represented to ensure accurate reading of the data collected from these regions, and this disproportional distribution was corrected by applying weighting factors for each region, as shown below in Table 1.
Table 1. WEIGHTING FACTOR – REGION
Region Schools Weighting factor
North/Center-West 100 0,800
Northeast 130 1,200
Southeast 170 1,065
South 100 0,830
ToTAL 500
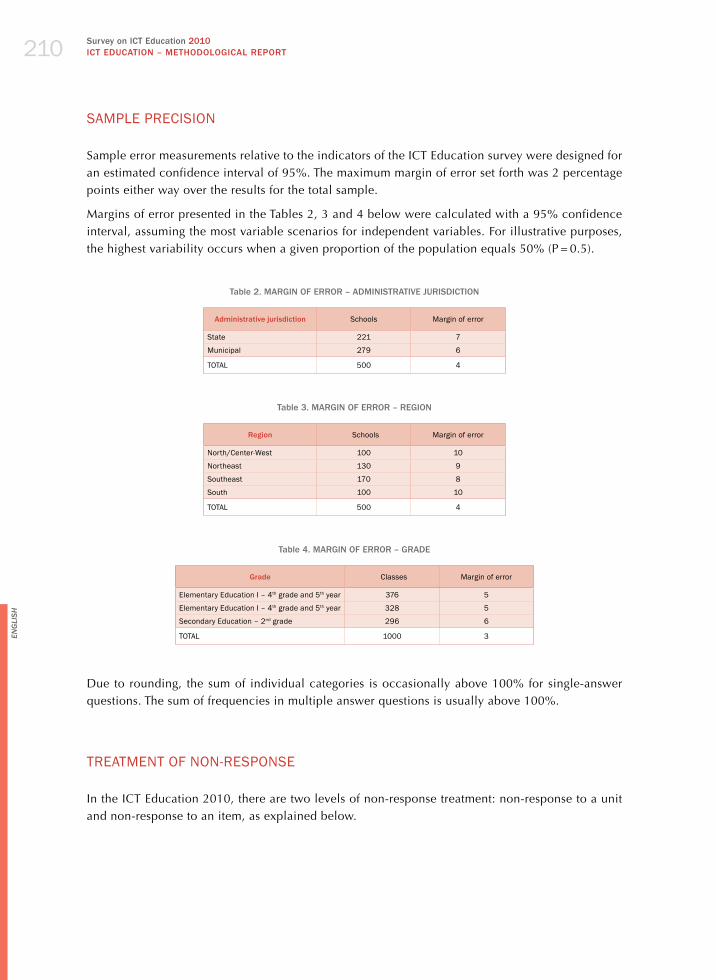
Survey on ICT Education 2010ICT EDuCATION – METHODOLOGICAL REPORT210
En
gli
sh
SAmPLE PRECISIoN
Sample error measurements relative to the indicators of the ICT Education survey were designed for an estimated confidence interval of 95%. The maximum margin of error set forth was 2 percentage points either way over the results for the total sample.
Margins of error presented in the Tables 2, 3 and 4 below were calculated with a 95% confidence interval, assuming the most variable scenarios for independent variables. For illustrative purposes, the highest variability occurs when a given proportion of the population equals 50% (P = 0.5).
Table 2. MARGIN OF ERROR – ADMINISTRATIvE juRISDICTION
Administrative jurisdiction Schools margin of error
State 221 7
municipal 279 6
ToTAL 500 4
Table 3. MARGIN OF ERROR – REGION
Region Schools margin of error
North/Center-West 100 10
Northeast 130 9
Southeast 170 8
South 100 10
ToTAL 500 4
Table 4. MARGIN OF ERROR – GRADE
Grade Classes margin of error
Elementary Education I – 4th grade and 5th year 376 5
Elementary Education I – 4th grade and 5th year 328 5
Secondary Education – 2nd grade 296 6
ToTAL 1000 3
Due to rounding, the sum of individual categories is occasionally above 100% for single-answer questions. The sum of frequencies in multiple answer questions is usually above 100%.
TREATmENT oF NoN-RESPoNSE
In the ICT Education 2010, there are two levels of non-response treatment: non-response to a unit and non-response to an item, as explained below.
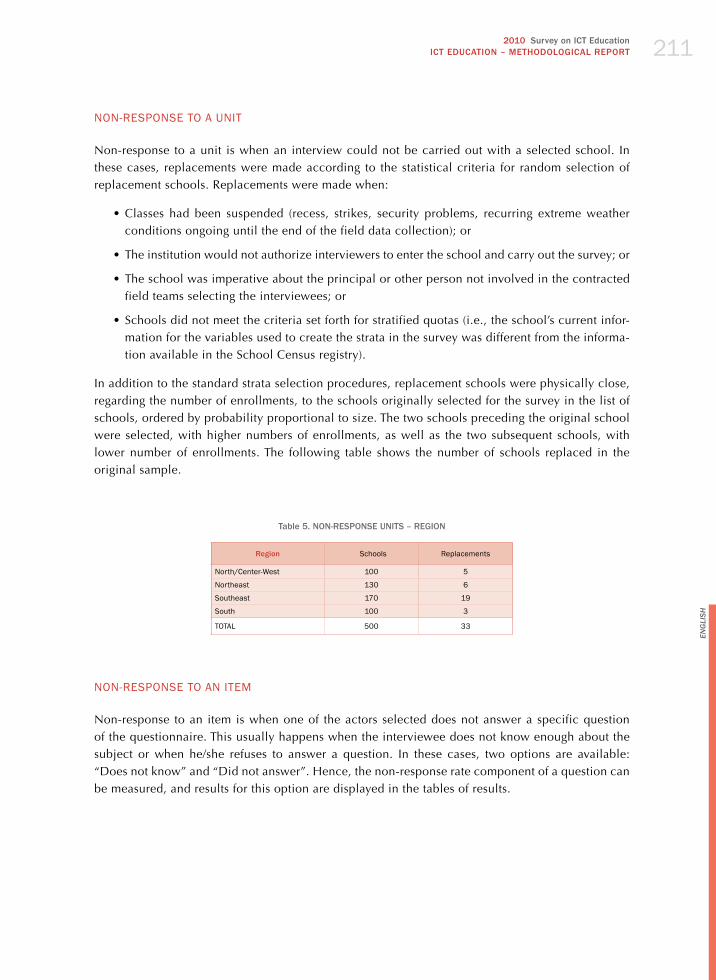
2010 Survey on ICT Education ICT EDuCATION – METHODOLOGICAL REPORT 211
En
gli
sh
NoN-RESPoNSE To A UNIT
Non-response to a unit is when an interview could not be carried out with a selected school. In these cases, replacements were made according to the statistical criteria for random selection of replacement schools. Replacements were made when:
•Classes had been suspended (recess, strikes, security problems, recurring extreme weather conditions ongoing until the end of the field data collection); or
•The institution would not authorize interviewers to enter the school and carry out the survey; or
•The school was imperative about the principal or other person not involved in the contracted field teams selecting the interviewees; or
•Schools did not meet the criteria set forth for stratified quotas (i.e., the school’s current infor-mation for the variables used to create the strata in the survey was different from the informa-tion available in the School Census registry).
In addition to the standard strata selection procedures, replacement schools were physically close, regarding the number of enrollments, to the schools originally selected for the survey in the list of schools, ordered by probability proportional to size. The two schools preceding the original school were selected, with higher numbers of enrollments, as well as the two subsequent schools, with lower number of enrollments. The following table shows the number of schools replaced in the original sample.
Table 5. NON-RESPONSE uNITS – REGION
Region Schools Replacements
North/Center-West 100 5
Northeast 130 6
Southeast 170 19
South 100 3
ToTAL 500 33
NoN-RESPoNSE To AN ITEm
Non-response to an item is when one of the actors selected does not answer a specific question of the questionnaire. This usually happens when the interviewee does not know enough about the subject or when he/she refuses to answer a question. In these cases, two options are available: “Does not know” and “Did not answer”. hence, the non-response rate component of a question can be measured, and results for this option are displayed in the tables of results.


2010 Survey on ICT Education ICT EDuCATION – SAMPLE PROFILE 213
En
gli
sh
SAmPLE PRoFILE ICT EdUCATIoN 2010
The objective of this section is to briefly present the sample profile of the ICT Education survey, contextualizing and promoting better understanding of the survey’s results. The sample is comprised of four groups: teachers, principals, students and directors of studies.
The survey has three strata for selection: administrative jurisdiction (the education sector of the school), grade and region (where the school is located). Nonetheless, in addition to these variables, results may be viewed separately for other variables such as gender, age group, individual income and family income for all target populations (except for students). Regarding the variables of the survey, the School Census 2007 was used as reference of the Brazilian educational scenario.
The sample profile has an equivalent proportion of male and female students, with slight predominance of women, who represent 55% of the students interviewed. however, in other target populations there is a notable predominance of women – 77% of the teachers, 80% of the principals and 91% of the directors of studies.
Chart 1. SAMPLE PROFILE – GENDER
Teacher Student Principal Director of studies
77
23
45
80
20
91
9
Female Male
55
0
20
40
60
80
100
Regarding distribution by age group, students in the survey are divided as follows: most of them are 13 years old (42%), and 14- and 15-year-olds represent 29% of the sample, which is the same proportion of students over 16 years old. Regarding the age of teachers, directors of studies and principals, most of the respondents were aged between 31 and 45 – 55% of the teachers, 51% of the principals and 59% of the directors of studies. Among principals, 46% of the interviewees were 46 years old or older, and only 3% were under 30 years old.
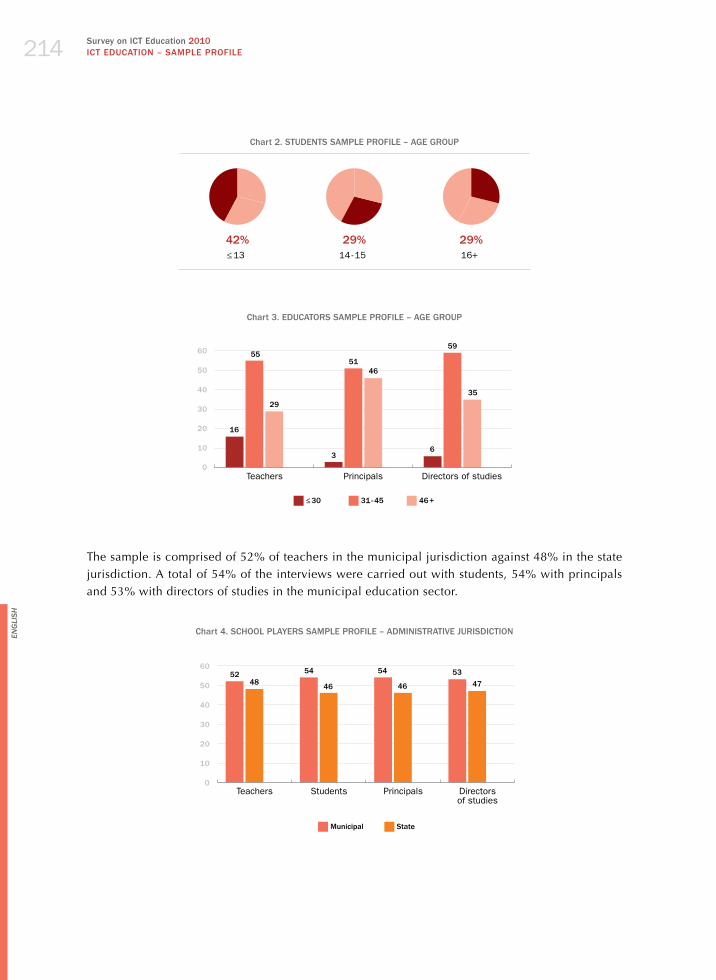
Survey on ICT Education 2010ICT EDuCATION – SAMPLE PROFILE214
En
gli
sh
Chart 2. STuDENTS SAMPLE PROFILE – AGE GROuP
42% 29% 29%≤ 13 14 - 15 16+
Chart 3. EDuCATORS SAMPLE PROFILE – AGE GROuP
0
10
20
30
40
50
60
Teachers Principals Directors of studies
≤ 30 31 - 45 46 +
16
55
29
51
3
46
59
35
6
The sample is comprised of 52% of teachers in the municipal jurisdiction against 48% in the state jurisdiction. A total of 54% of the interviews were carried out with students, 54% with principals and 53% with directors of studies in the municipal education sector.
Chart 4. SCHOOL PLAyERS SAMPLE PROFILE – ADMINISTRATIvE juRISDICTION
Teachers Students Principals Directors of studies
52 54 54 53
Municipal State
0
10
20
30
40
50
60
48 46 46 47
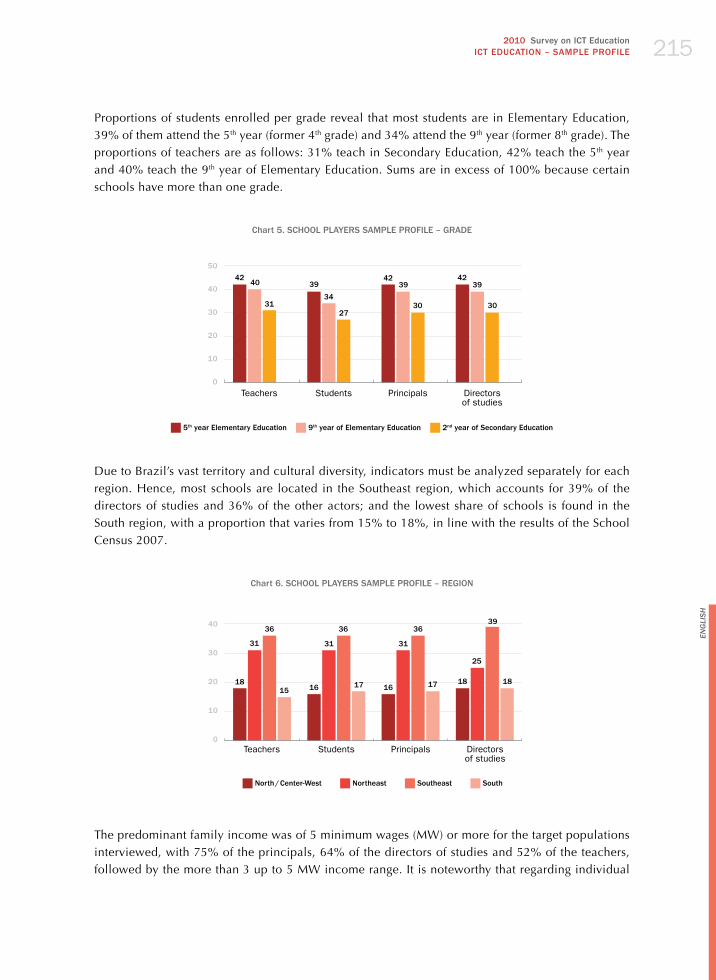
2010 Survey on ICT Education ICT EDuCATION – SAMPLE PROFILE 215
En
gli
sh
Proportions of students enrolled per grade reveal that most students are in Elementary Education, 39% of them attend the 5th year (former 4th grade) and 34% attend the 9th year (former 8th grade). The proportions of teachers are as follows: 31% teach in Secondary Education, 42% teach the 5th year and 40% teach the 9th year of Elementary Education. Sums are in excess of 100% because certain schools have more than one grade.
Chart 5. SCHOOL PLAyERS SAMPLE PROFILE – GRADE
Teachers Students Principals Directors of studies
4239
42 42
5th year Elementary Education 9
th year of Elementary Education 2nd year of Secondary Education
0
10
20
30
40
50
40
3134
39
30
39
3027
Due to Brazil’s vast territory and cultural diversity, indicators must be analyzed separately for each region. hence, most schools are located in the Southeast region, which accounts for 39% of the directors of studies and 36% of the other actors; and the lowest share of schools is found in the South region, with a proportion that varies from 15% to 18%, in line with the results of the School Census 2007.
Chart 6. SCHOOL PLAyERS SAMPLE PROFILE – REGION
Teachers Students Principals Directors of studies
18
31
36
15 16
31
36
17 16
31
36
17 18
25
39
18
North / Center-West Northeast Southeast South
0
10
20
30
40
The predominant family income was of 5 minimum wages (MW) or more for the target populations interviewed, with 75% of the principals, 64% of the directors of studies and 52% of the teachers, followed by the more than 3 up to 5 MW income range. It is noteworthy that regarding individual

Survey on ICT Education 2010ICT EDuCATION – SAMPLE PROFILE216
En
gli
sh
income, 41% of the principals earn more than 5 MW, and 40% of them earn between 3 and 5 MW; whereas amongst teachers, only 20% earn more than 5 MW, and 42% earn up to 3 MW.
Chart 7. EDuCATORS SAMPLE PROFILE – FAMILy INCOME
Teachers Principals Directors of studies
30
52
26
75
1
8
28
64
up to 3 MW More than 3 up to 5 MW More than 5 MW Refusal
0
20
40
60
80
1816
Chart 8. EDuCATORS SAMPLE PROFILE – INDIvIDuAL INCOME
Teachers Principals Directors of studies
37
20
1
18
41
1
33
40
27
up to 3 MW More than 3 up to 5 MW More than 5 MW Refusal
0
10
20
30
50
4040
42

2010 Survey on ICT Education ICT EDuCATION – ANALySIS OF RESuLTS 217
En
gli
sh
ANALYSIS oF RESULTS ICT EdUCATIoN 2010
PRESENTATIoN
The Center of Studies on Information and Communication Technologies (Cetic.br), of the Brazilian
Network Information Center (NIC.br) – the executive branch of the Brazilian Internet Steering
Committee (CGI.br) – coordinates the Survey on the Use of Information and Communication Technologies in Brazil, and since 2005 conducts the ICT households and Enterprises. In 2010, the ICT Education survey was launched, combining elements of a quantitative survey in public schools, as well as an in-depth analysis of some of them. This has contributed towards consolidating the
Cetic.br as a reference center in the production of statistics and analysis on ownership and use of ICT in the country.
The primary goal of the ICT Education survey is to determine how broadband Internet connections are used and incorporated into the routine of public schools, both in management and, more importantly, teaching practices. Data collection for the quantitative survey took place between August and November, covering a sample of 500 public schools in urban areas across the country, where 1,541 teachers, 4,987 students, 497 principals and 428 directors of study were interviewed.
The ICT Education 2010 adapts some of the indicators from the “SITES 2006 study: Second Information Technology in Education Study 2006”, of the IEA (International Association for the Evaluation of Educational Achievement). Furthermore, the survey includes indicators produced to address specific themes in the Brazilian scenario. The survey sample was designed by Ibope Inteligência, also in charge of data collection and results calculation.
Sample error measurements relative to the indicators of the ICT Education 2010 survey were designed estimating a confidence interval of 95%. The maximum error margin set forth is 2 percentage points either way over the results for the total sample.
INTRodUCTIoN
When the first computers were being installed in schools in several countries in the 1970s, we began to refer to them and to their use as “computers in education”. Following computers, peripheral devices were introduced in schools, i.e., printers, external drives, scanners and the first digital cameras. All of these devices together were then referred to as information technology, or IT. When the Internet arrived in schools, along with networked computers, the World Wide
Survey on ICT Education 2010ICT EDuCATION – ANALySIS OF RESuLTS218
En
gli
sh
Web, e-mail and search engines, a new term was coined: ICT, which stands for information and communication technologies. This refers to the technological diversity (equipment and features) that enables individuals to create, capture, interpret, store, receive and transfer information.1
Worldwide, the introduction of ICT in schools has quickly been responsible for marked effects on teaching and learning. At the institutional level, schools have been using computers and software for general administrative tasks, such as accounting, inventory, communications, document preparation and printing, as well as specific software for school management, i.e., schedule preparation, electronic reports, attendance tracking, assessment records, library management and creating student profiles.
At the instructional level, the use of ICT in classroom activities, lecture halls and laboratories in several countries has been accompanied by changes in the way teachers teach and students learn. It can be clearly seen that technological innovations in school and within the classroom are being accompanied by the transformation of the teacher’s role, from transmitter of knowledge, primary source of information, controller and manager of all aspects of learning to facilitator, collaborator, coach, knowledge mentor and co-learner in the learning process, providing students with more options and responsibilities in their own learning process.
This change in the teachers’ role is well summarized as follows: they are no longer the “sages on stage” but have become “the guides next you”, or the conductors who seek to bring out the best in each member of the orchestra.
In addition to changing the role of teachers, the literature shows that ICT are also transforming the role of students, who progress from being passive recipients of information, knowledge reproducers and lonely learners to active participants in the learning process, knowledge producers and learners in collaboration with others.
As shown in evidence from countries which are in a more advanced stage of ICT integration in teaching / learning, students in rooms equipped with technology are generally active researchers seeking information on the web to complete individual or group projects, communicating by e-mail, blogs and social networks with students from other schools and drawing conclusions based on collected evidence.2
The use of ICT in schools is seen therefore as being capable of creating opportunities – long awaited by education scholars – to transform school organizations into learning communities, which requires that teachers, administrators and students develop this skill.
Experiments with the use of ICT in schools show that the educational potential of these technologies is not intrinsically orientated towards constructivism, but can also support the development of traditional pedagogies. At the end of the 2000s, there seems to be recognition in Latin America of the numerous benefits of ICT to education, regardless of the predominant model of education.3
1 ANDERSON, jonathan. ict transforming education: a regional guide. Bangkok: Unesco, 2010.2 idem.3 VALDIVIA, Ignacio jara. las políticas de tecnología para escuelas en América latina y el mundo: visiones y lecciones.
Santiago: ONU, 2008. p. 18.

2010 Survey on ICT Education ICT EDuCATION – ANALySIS OF RESuLTS 219
En
gli
sh
The central issue for public policies designed to stimulate technological innovation in education is, therefore, knowing when and how this potential is realized, that is, the effective impact of ICT on educational outcomes and the conditions in which this occurs. The literature is inconclusive in this regard, and this situation is largely attributed to the absence of specific indicators and consistent and systematic observations on the realities of schools and their teaching / learning processes.
The formulation of indicators in this area is a tricky task, given its intrinsic complexity, and international comparisons are hindered by the additional diversity in curricula and educational systems. Unesco is currently determined to contribute to reducing these difficulties and is committed to the formulation of internationally comparable indicators on ICT in education.4
Confident in strengthening Brazil’s contribution to this global effort, and consistent with international efforts in this field, the ICT Education survey carries out its work with the main objective of identifying uses and appropriation of information and communication technologies in Brazilian public schools, focusing on school management and especially pedagogical practice.
CoNTExT oF BRAzILIAN EdUCATIoN
Currently, according to the 2010 School Census, there are 51.5 million students enrolled in schools nationwide. Of these, only 15% are getting their basic education in private schools, while the vast majority, 85%, is enrolled in public schools. According to the Teacher Synopsis 2009, of the Ministry of Education, there are almost 2 million teachers employed in basic education. Students from public schools and practicing teachers in basic education must be central players in the development of public policies for the education in the country. Included in this context are the policies for technological modernization in Brazilian public schools.
The concept that education is fundamental to the construction and development of society has already been established. The current scenario of the country shows that while there has been improvement in relation to school access, there is still a great challenge to improve education.
Since the 1990s, virtually all children from 6 to 14 years have access to schooling. In 2009, 97.6% of children in this age group were attending basic education schools. Regarding the age group of children from 15 to 17, the proportion of access to school is lower than desired: in 2009, according to the “Synthesis of Social Indicators 2010”, of IBGE, 85.2% of these young people were attending school. The data also indicate that, for these teenagers, there is a high discrepancy in relation to the net enrollment ratio, i.e., the proportion of the population in a particular age group that is in the level of education appropriate to their age, even though rates have improved since the end of the 1990s. In 2009 only 39.2% of adolescents were in secondary school, which does not even reach the 42.1% ratio of the Southeast region in 1999. An even greater challenge is the quality of teaching and learning. The complexity of this issue can be assessed by looking at the goal to be achieved by
4 UNESCO. guide to measuring information and communication technologies (ict) in educationnew york: Unesco Statistics Institute, 2009

Survey on ICT Education 2010ICT EDuCATION – ANALySIS OF RESuLTS220
En
gli
sh
the Development Index of Basic Education (Ideb)5 in 2021, the year when schools should achieve a grade of 6.0, comparable to results obtained in more developed countries. One can estimate the effort necessary to achieve that level seeing that, in 2009, the Ideb average for the early grades in the country was 4.6. Moreover, the index highlights the disparity between public and private schools, since private establishments reached 5.9 as early as 2005, while in that same year the level for public schools was 3.6.
Compared to other countries, Brazil is still in a position of disadvantage in terms of knowledge attained by school age children. In the surveys conducted by Pisa (Program for International Student Assessment) in 65 countries in 2009,6 the country was ranked in the 54th position in reading proficiency for 15-year-old students, a rate well below the OECD average.
Regarding the dropout rate, Brazil’s rates are high, both in elementary school and in secondary school, especially when compared to some Latin American countries like Argentina, Chile, Paraguay, Uruguay and Venezuela.7
Another dimension of education in which the country will try to get better results refers to the completed years of study. Comparing countries with the same level of economic and social development, a 15-year old Brazilian had in 2009 an average of 7.5 years of study, or had not even completed the mandatory elementary education, a right guaranteed by the Constitution. According to Eurostat, the proportion of people aged 18 to 24 with eleven years of study is a key indicator for assessing both the efficiency of the educational system of a country and its ability to fight poverty and reduce socioeconomic inequalities. In 2009, Pnad (National households Sample Survey) reported that only 37.9% of the population in this age group had completed eleven years of schooling.
The struggle for better education in Brazil involves the battle for reducing regional differences. The country’s educational statistics suggest great inequality between regions. Much has already been done, as noted above, but old and new challenges unfold in the future.
5 Ideb is calculated from two components: academic performance rate (approval), obtained from the school census, and average performance in standardized Prova Brazil tests (Ideb for municipal schools) and Saeb (Ideb for state and national establishments). The index is based on the students’ results at the end of each stage of Elementary Education (former 4th grade / current 5th year and former 8th grade / current 9th year) and the 3rd year of Secondary Education, through standardized tests, and the rate of corresponding approval of students of every stage of education (investigated by the school census).
6 Available at http://browse.oecdbookshop.org/oecd/pdfs/free/9810071e.pdf.7 Indicadores Estadísticos del Sistema Educativo del Mercosur 2008.

2010 Survey on ICT Education ICT EDuCATION – ANALySIS OF RESuLTS 221
En
gli
sh
EdUCATIoN ANd TEChNoLoGY: PUBLIC PoLICIES IN BRAzIL
Government initiatives to encourage the use of information and communication technology in Brazilian public schools date back to about 1996. The main current government actions aimed at integrating ICT in education are those listed below.
National Programme for IT Integration in Education (Proinfo)
Since 1997, the National Program for IT Integration in Education has addressed the public school system at both elementary and secondary level in all states in the federation. At first, the program guidelines developed by the Department of Distance Education (SEED), of the Ministry of Education, intended to purchase and install 100,000 computers in schools in accordance with predetermined criteria and in cooperation with the state and municipal governments.
According to MEC, the program is operating in 5,100 towns and has reached, since 2004, 64.6 thousand educational establishments, 28.3 million students and 1.2 million teachers. Official records point to the acquisition of more than 100,000 computer labs during this period, according to Proinfo Guidelines.
Broadband in School Program (PNBLE)
The Broadband in School Program was launched in April 2008 by the federal government and aims to connect all urban public schools to the Internet.
The project is the result of a partnership between the government and telecom operators companies such as Oi (Telemar), Telefônica (Telesp), Sercomtel and CTBC. The PNBLE set a goal of taking a connection of not less than 1 Mbps to all urban state, local and federal public schools listed in the school census. The program requires that the installation be done in the computer lab or other teaching space indicated by the school principals. The service connection will be maintained for free until the year 2025.
One Computer per Student Program (Prouca)
The One Computer per Student Program aims to promote digital inclusion through the distribution of a portable computer (laptop) for each student and teacher of basic education in public schools. The program came about based on the One Laptop per Child (OLPC) project, originally proposed by MIT, and was presented to the Brazilian government at the World Economic Forum in january 2005.
The partnership with FacTI (Foundation to Support Training in Information Technology), of Finep (Research and Projects Financing Agency), to validate the OLPC solution was formalized after meetings with Brazilian experts to discuss the intensive pedagogical use of ICT in schools.
During 2007, five schools were selected as initial experiments, in five cities in five states: São Paulo /SP, Porto Alegre/RS, Palmas/TO, Piraí/Rj and Brasilia / DF. Each school received laptops for students and teachers, infrastructure for Internet access and training of managers and teachers in the use of

Survey on ICT Education 2010ICT EDuCATION – ANALySIS OF RESuLTS222
En
gli
sh
technology. In its implementation, the project has also the support of the Work Group from the UCA program (GTUCA), composed of specialists in the use of ICT in education.
RESULTS
To investigate the scenario of digital inclusion in Brazilian schools, the ICT Education survey brings relevant results, making it possible to direct the eyes of society and foster public policies for education.
SChooL STRUCTURE
On average, schools have 14 classes in elementary school (first five years of elementary education), 13 in middle school (four last years of elementary education) and 15 classes in secondary school. The ratio of the number of students per class increases with the level of education: 29 students per class in elementary school, 33 in middle school and 36 students in secondary school.
A large part of the schools that offer pre-school distribute equally the number of classes in the morning and afternoon periods. The same occurs in schools offering elementary school. In secondary school, the afternoon period has the lowest incidence of classes, and the highest incidence occurs in the night period.
In relation to staff, directors of studies are present in 85% of Brazilian schools, and monitors provide technical support for computer labs at 52% of the schools. The role of the director of studies is more prominent in the South and Southeast regions, as seen by the percentage of 92% and 90% respectively; on the other hand, the Northeast is the region that most lacks this professional, since only 76% of schools have such an educator, a proportion significantly below the country’s total.
TEChNoLoGY INFRASTRUCTURE
Landline coverage is the technological infrastructure which presents more regional differences: 81% of Brazilian schools are covered by this technology, and this proportion in North/Center-West is of 73%, and in Northeast is of 55%.
On the other hand, the schools have started equipping themselves in preparation for action related to the production of multimedia content. Digital cameras and camcorders, which can stimulate this type of content, are present in 78% and 42% of schools, respectively (Chart 1).

2010 Survey on ICT Education ICT EDuCATION – ANALySIS OF RESuLTS 223
En
gli
sh
Chart 1. AvAILABILITy OF ICT EquIPMENT IN SCHOOLS Percentage of the total numbers of schools
99
99
83
83
81
81
0 80 100604020
TV
Printer
VCR / DVD
Radio
Overhead projector
Landline
Mimeograph
Digital camera
Datashow
CD player
Satellite dish
Camcorder
Mobile phone
75
69
54
42
8
96
78
The technological infrastructure of public schools is relatively diverse, but the amount of available equipment can restrict its use by the school community, especially when one considers that there are an average 800 students per school.
The schools which have these equipments have, on average, four units of equipment, such as radio, TV, printer and CD player. More sophisticated equipment is available at a little over one unit per school. This occurs with camcorders, digital cameras and data projectors.
Chart 2. NuMBER OF COMPuTERS IN THE SCHOOL Percentage of the total number of schools
0 20 25 3015105
up to 5
6 to 15
16 to 20
21 to 30
31 to 40
41 or more
9
21
20
29
13
8

Survey on ICT Education 2010ICT EDuCATION – ANALySIS OF RESuLTS224
En
gli
sh
Each public school has on average 23 computers (Chart 2). In the Northeast, the average falls to 19, whereas the South has a number higher than the national average, 27 computers per school. The amount of equipment is more comfortable in schools offering secondary school, where there is an average of 27 computers. Schools that offer only elementary school have, on average, 20 computers, and the ones offering middle school have 23.
An important aspect to note is that there is a significant difference between the number of computers in a school and the number that are actually installed and in use. The average of 23 computers per school is reduced to only 18 in operation, a loss of about 22% of the equipment. In this case, the regional disparity increases: while there is an average of 24 computers running in schools located in the South and 19 in the Southeast, in the Northeast only 13 computers are connected, a significant loss of 32%.
One possible explanation for this functional loss has relation to the maintenance. Most schools (68%) have computer maintenance provided by the Department of Education. In 24% of the schools, maintenance service is left to third-party providers, and 5% of the schools have no one responsible for keeping the machines running.
The Windows operating system is used in 84% of schools, and Linux – open source software, meaning anyone can use it without having to pay for the license – is present in 52%, indicating that in some schools the two operating systems coexist. It is noteworthy that the South has the highest rate of schools using Linux (74%); the Southeast, by contrast, has the lowest percentage (35%).
just over a third of schools (36%) have their own website. Again, the South region is ahead, with just over half (52%) of the schools having their own website. Considering the administrative jurisdiction, most municipal schools (68%) have no website.
Other resources were investigated: 74% of the schools have institutional e-mail, and almost a quarter of the schools (24%) already have a website produced by the students themselves.
The content of school websites includes mostly a photo gallery, the pedagogical purpose of the school, data concerning its location, an events calendar and a space to contact the school. The content least found is: the menu offered by the school cafeteria, exercises that can be done online and information on the students’ grades/performance evaluation. The school websites have an apparent gap in regards to service and communication with the students, which demonstrates a lack of online interaction (Chart 3).
Broadband is the method which connects the vast majority of Brazilian public schools. It is present in 87% of schools that have an Internet connection. Dial-up connections account for only 5% of the connections, and mobile access accounts for 4%.
The largest gaps in broadband coverage emerge in the North/Center-West, where 14% of schools report using dial-up connections. Overall, 35% of the schools have received Internet access over the past two years, but this proportion is much higher in the Northeast: 60% of the schools were connected to the Internet in that same time period. In the Southeast, this figure corresponds to 16%.
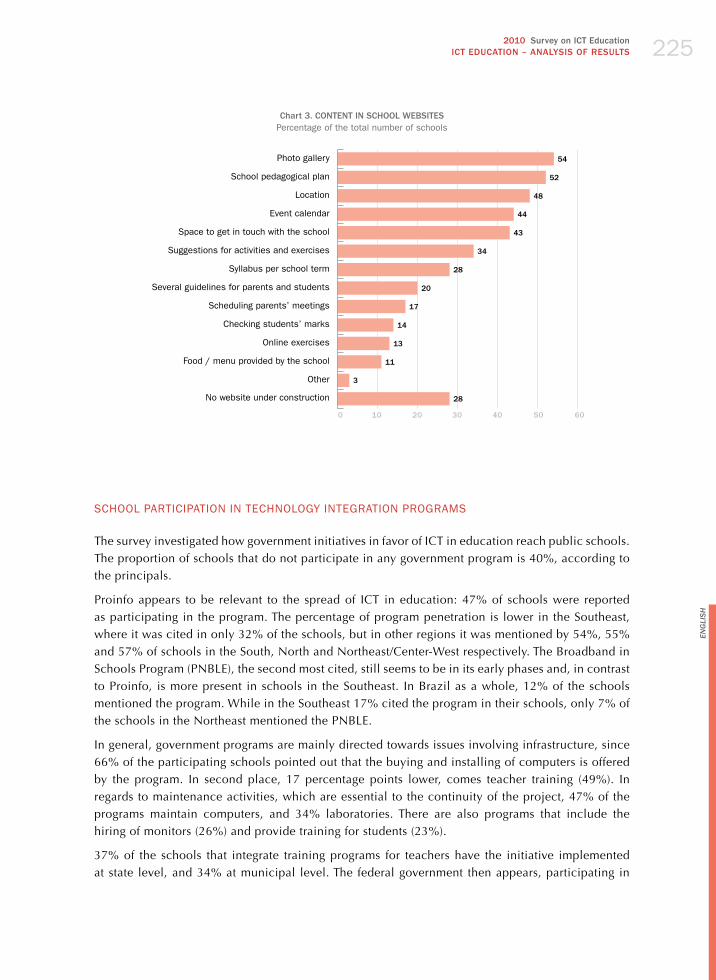
2010 Survey on ICT Education ICT EDuCATION – ANALySIS OF RESuLTS 225
En
gli
sh
Chart 3. CONTENT IN SCHOOL WEBSITES Percentage of the total number of schools
54
52
48
44
43
34
20
14
13
11
3
0 40 50 60302010
Photo gallery
School pedagogical plan
Location
Event calendar
Space to get in touch with the school
Suggestions for activities and exercises
Syllabus per school term
Several guidelines for parents and students
Scheduling parents’ meetings
Checking students’ marks
Online exercises
Food / menu provided by the school
Other
No website under construction
28
17
28
SChooL PARTICIPATIoN IN TEChNoLoGY INTEGRATIoN PRoGRAmS
The survey investigated how government initiatives in favor of ICT in education reach public schools. The proportion of schools that do not participate in any government program is 40%, according to the principals.
Proinfo appears to be relevant to the spread of ICT in education: 47% of schools were reported as participating in the program. The percentage of program penetration is lower in the Southeast, where it was cited in only 32% of the schools, but in other regions it was mentioned by 54%, 55% and 57% of schools in the South, North and Northeast/Center-West respectively. The Broadband in Schools Program (PNBLE), the second most cited, still seems to be in its early phases and, in contrast to Proinfo, is more present in schools in the Southeast. In Brazil as a whole, 12% of the schools mentioned the program. While in the Southeast 17% cited the program in their schools, only 7% of the schools in the Northeast mentioned the PNBLE.
In general, government programs are mainly directed towards issues involving infrastructure, since 66% of the participating schools pointed out that the buying and installing of computers is offered by the program. In second place, 17 percentage points lower, comes teacher training (49%). In regards to maintenance activities, which are essential to the continuity of the project, 47% of the programs maintain computers, and 34% laboratories. There are also programs that include the hiring of monitors (26%) and provide training for students (23%).
37% of the schools that integrate training programs for teachers have the initiative implemented at state level, and 34% at municipal level. The federal government then appears, participating in
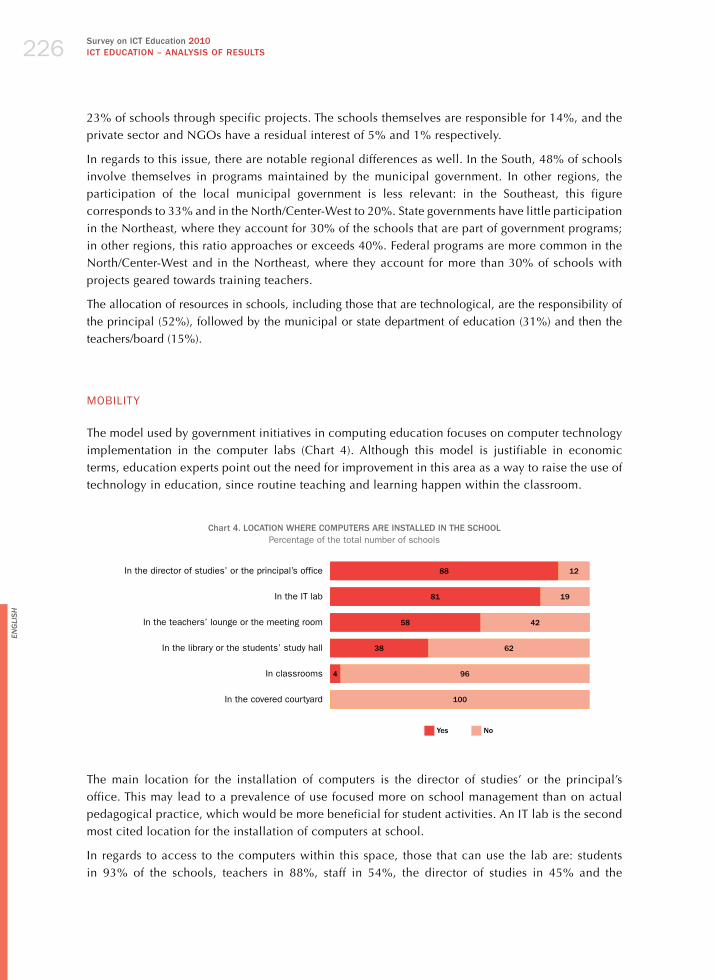
Survey on ICT Education 2010ICT EDuCATION – ANALySIS OF RESuLTS226
En
gli
sh
23% of schools through specific projects. The schools themselves are responsible for 14%, and the private sector and NGOs have a residual interest of 5% and 1% respectively.
In regards to this issue, there are notable regional differences as well. In the South, 48% of schools involve themselves in programs maintained by the municipal government. In other regions, the participation of the local municipal government is less relevant: in the Southeast, this figure corresponds to 33% and in the North/Center-West to 20%. State governments have little participation in the Northeast, where they account for 30% of the schools that are part of government programs; in other regions, this ratio approaches or exceeds 40%. Federal programs are more common in the North/Center-West and in the Northeast, where they account for more than 30% of schools with projects geared towards training teachers.
The allocation of resources in schools, including those that are technological, are the responsibility of the principal (52%), followed by the municipal or state department of education (31%) and then the teachers/board (15%).
moBILITY
The model used by government initiatives in computing education focuses on computer technology implementation in the computer labs (Chart 4). Although this model is justifiable in economic terms, education experts point out the need for improvement in this area as a way to raise the use of technology in education, since routine teaching and learning happen within the classroom.
Chart 4. LOCATION WHERE COMPuTERS ARE INSTALLED IN THE SCHOOLPercentage of the total number of schools
88 12
81 19
58 42
38 62
964
100
In the director of studies’ or the principal’s office
In the IT lab
In the teachers’ lounge or the meeting room
In the library or the students’ study hall
In classrooms
In the covered courtyard
yes No
The main location for the installation of computers is the director of studies’ or the principal’s office. This may lead to a prevalence of use focused more on school management than on actual pedagogical practice, which would be more beneficial for student activities. An IT lab is the second most cited location for the installation of computers at school.
In regards to access to the computers within this space, those that can use the lab are: students in 93% of the schools, teachers in 88%, staff in 54%, the director of studies in 45% and the

2010 Survey on ICT Education ICT EDuCATION – ANALySIS OF RESuLTS 227
En
gli
sh
community in only 25%. The classroom is practically nonexistent as a location for the installation of computers (4%).
Internet access takes place mainly in the IT labs (86% of schools), but managers, directors of studies and teachers are also able to have access in the director of studies’ or principal’s office (85%), in the teachers’ lounge or meeting room (81%), in the library or students’ study hall (76%). Access in classrooms is present in less than 1% of schools.
The model for IT implementation in schools through IT labs has, indeed, encouraged student access to technology: in schools that have these labs, 31% of students use computers and the Internet at least once a week; in those which do not have these labs, only 6% of students get access to this technology.
Almost half of all schools have laptops (an average of two equipments). There are signs that laptops are more common in regions where IT labs have been created and consolidated more recently. Amongst the schools that have these types of computers in the Northeast the average is 4 per school, whereas there is an average of 3 in the North/Center-West, of 1 in the Southeast and of 2 in the South. The number of laptops is also higher in schools that have specific projects directed towards the pedagogical use of information technology – they have an average of 3.5 machines per establishment, compared to the 1.7 in the schools that have not implemented this type of project.
ThE TEAChERS’ PRoFILE, LEARNING ANd TEChNoLoGY SKILLS
This module contains basic information about teachers, including training in ICT use and skills to use this technology in the school environment.
The demographic and professional profile of the educator
Teachers play a vital role in the process of integrating ICT in teaching and learning. In the presence of the necessary technological infrastructure, it is they who will bring to the classroom the guidelines of the political-educational program of the school as well as the vision of school administrators (the principal and the director of studies) in regards to the use of educational technology. They can also briefly explore – or even ignore – the infrastructure available at the school according to their beliefs or perspectives in regards to technology and its role in education. But the use teachers can make of the technology available within the school depends on the level of development of both their technological and pedagogical skills.
From the demographic point of view, most public school teachers are women (77%) (Chart 5). This percentage changes amongst teachers aged 30 or younger, where men represent 36% of all teachers. Females are also predominant amongst principals and, especially, amongst directors of studies.
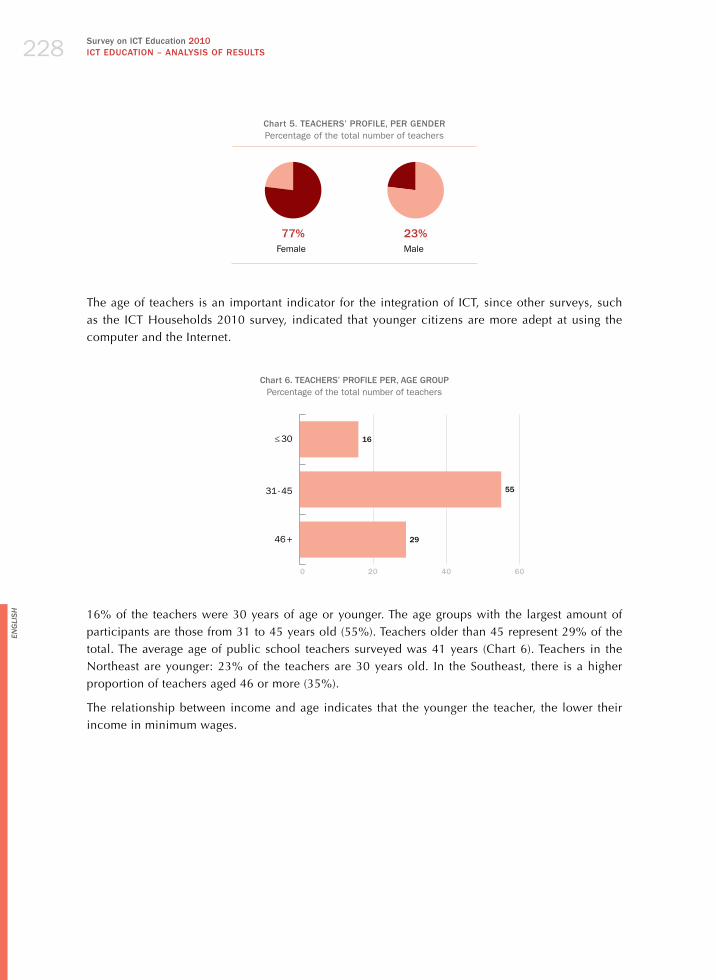
Survey on ICT Education 2010ICT EDuCATION – ANALySIS OF RESuLTS228
En
gli
sh
Chart 5. TEACHERS’ PROFILE, PER GENDERPercentage of the total number of teachers
77% 23%Female Male
The age of teachers is an important indicator for the integration of ICT, since other surveys, such as the ICT households 2010 survey, indicated that younger citizens are more adept at using the computer and the Internet.
Chart 6. TEACHERS’ PROFILE PER, AGE GROuPPercentage of the total number of teachers
0 604020
≤ 30
31 - 45
46 +
16
55
29
16% of the teachers were 30 years of age or younger. The age groups with the largest amount of participants are those from 31 to 45 years old (55%). Teachers older than 45 represent 29% of the total. The average age of public school teachers surveyed was 41 years (Chart 6). Teachers in the Northeast are younger: 23% of the teachers are 30 years old. In the Southeast, there is a higher proportion of teachers aged 46 or more (35%).
The relationship between income and age indicates that the younger the teacher, the lower their income in minimum wages.
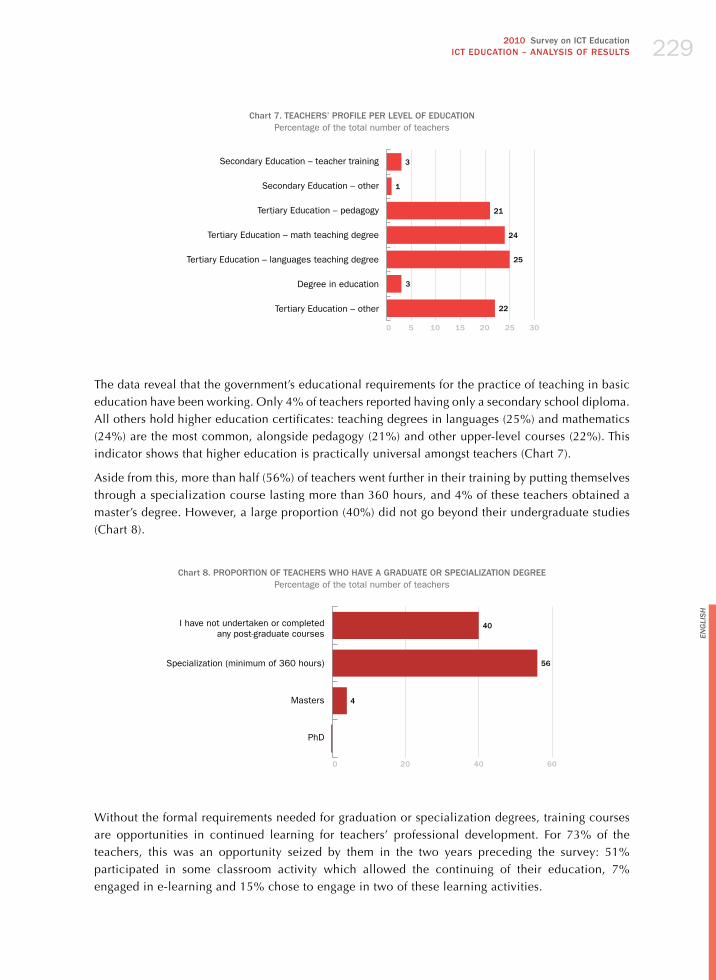
2010 Survey on ICT Education ICT EDuCATION – ANALySIS OF RESuLTS 229
En
gli
sh
Chart 7. TEACHERS’ PROFILE PER LEvEL OF EDuCATIONPercentage of the total number of teachers
0 15 20 25 30105
Secondary Education – teacher training
Secondary Education – other
Tertiary Education – pedagogy
Tertiary Education – math teaching degree
Tertiary Education – languages teaching degree
Degree in education
Tertiary Education – other
3
1
21
25
22
3
24
The data reveal that the government’s educational requirements for the practice of teaching in basic education have been working. Only 4% of teachers reported having only a secondary school diploma. All others hold higher education certificates: teaching degrees in languages (25%) and mathematics (24%) are the most common, alongside pedagogy (21%) and other upper-level courses (22%). This indicator shows that higher education is practically universal amongst teachers (Chart 7).
Aside from this, more than half (56%) of teachers went further in their training by putting themselves through a specialization course lasting more than 360 hours, and 4% of these teachers obtained a master’s degree. however, a large proportion (40%) did not go beyond their undergraduate studies (Chart 8).
Chart 8. PROPORTION OF TEACHERS WHO HAvE A GRADuATE OR SPECIALIzATION DEGREEPercentage of the total number of teachers
0 604020
I have not undertaken or completed any post-graduate courses
Specialization (minimum of 360 hours)
Masters
PhD
40
56
4
Without the formal requirements needed for graduation or specialization degrees, training courses are opportunities in continued learning for teachers’ professional development. For 73% of the teachers, this was an opportunity seized by them in the two years preceding the survey: 51% participated in some classroom activity which allowed the continuing of their education, 7% engaged in e-learning and 15% chose to engage in two of these learning activities.

Survey on ICT Education 2010ICT EDuCATION – ANALySIS OF RESuLTS230
En
gli
sh
During this same period, 27% did not undertake any continued learning course (Chart 9).
Chart 9. PROPORTION OF TEACHERS WHO TOOk CONTINuED EDuCATION COuRSES IN THE LAST TWO yEARS
Percentage of the total number of teachers
51% 7% 15% 27%Yes, in person only Yes, e-learning only Yes, both No
Public school teachers are experienced professionals, since, on average, they have been teaching for 15 years. This means that they began teaching in the mid-1990s, when personal computers had not yet significantly made their way into Brazilian society and the policy makers of basic education had not yet implemented measures through which to make this equipment available to students.
It is also worthy to note that commercial Internet came to Brazil in this same time period. The activity indicators (in “The use of technology in school”) point out the level of integration of these technologies in regards to education. It is quite possible that the little knowledge in regards to computers and the Internet during the teachers’ undergraduate studies has influenced the integration of ICT into teaching practices nowadays.
Although the Brazilian universities may have already had the technology, it is possible that at the time there were very few teachers who had developed familiarity with it, not to mention its possibilities in an educational sense. In percentages, 34% of respondents have been teaching for 10 years or less. 18% of respondents have been teachers for 11 to 15 years, 21% have been teachers for 16 to 20 years and 27% are still active after having been professionals in the area of teaching for 21 years or more (Chart 10).
Chart 10. TEACHERS’ WORk ExPERIENCE (IN yEARS)Percentage of the total number of teachers
0 20 3010
Up to 5
6 - 10
11 - 15
16 - 20
21+
14
20
21
27
18
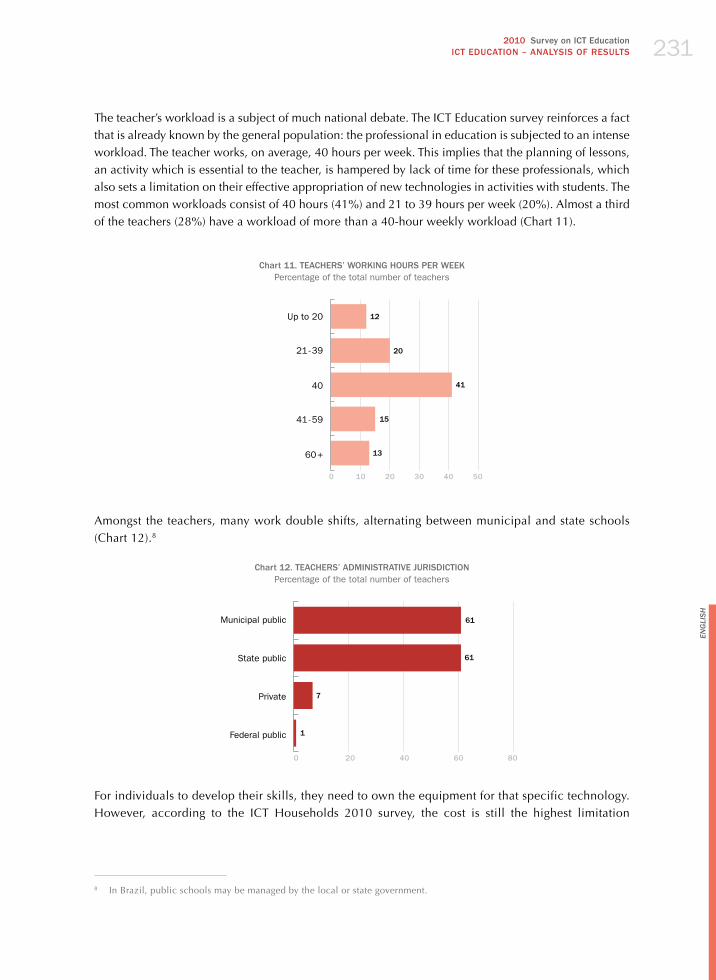
2010 Survey on ICT Education ICT EDuCATION – ANALySIS OF RESuLTS 231
En
gli
sh
The teacher’s workload is a subject of much national debate. The ICT Education survey reinforces a fact that is already known by the general population: the professional in education is subjected to an intense workload. The teacher works, on average, 40 hours per week. This implies that the planning of lessons, an activity which is essential to the teacher, is hampered by lack of time for these professionals, which also sets a limitation on their effective appropriation of new technologies in activities with students. The most common workloads consist of 40 hours (41%) and 21 to 39 hours per week (20%). Almost a third of the teachers (28%) have a workload of more than a 40-hour weekly workload (Chart 11).
Chart 11. TEACHERS’ WORkING HOuRS PER WEEkPercentage of the total number of teachers
0 20 4030 5010
Up to 20
21 - 39
40
41 - 59
60 +
12
20
41
15
13
Amongst the teachers, many work double shifts, alternating between municipal and state schools (Chart 12).8
Chart 12. TEACHERS’ ADMINISTRATIvE juRISDICTIONPercentage of the total number of teachers
0 40 60 8020
Municipal public
State public
Private
Federal public
61
61
7
1
For individuals to develop their skills, they need to own the equipment for that specific technology. however, according to the ICT households 2010 survey, the cost is still the highest limitation
8 In Brazil, public schools may be managed by the local or state government.

Survey on ICT Education 2010ICT EDuCATION – ANALySIS OF RESuLTS232
En
gli
sh
mentioned by citizens for buying a computer and, especially, for not paying for Internet access. This indicator also reflects in teachers.
The ICT Education 2010 survey sought to capture this important economic component of teachers’ digital inclusion. In addition to information on personal income, the survey also looked into their family or household income.
The wage level of a teacher is a subject of national debate. The survey reveals that although teachers have developed academically – a fact which is made clear by the large number of teachers with higher education qualification (96%) as well as educators with graduate degrees –, have an average of 15 years of professional activity and undergo a heavy workload, their personal income does not correspond to that of other professions with this same profile.
Is was estimated that 79% of teachers have a personal income of up to 5 minimum wages (MW), including the accumulated work of double shifts in both municipal and state schools. Only 18% earn up to 10 MW, and 2% have personal incomes higher than this (Chart 13).
When including the family income of such professionals, there is some difference: nearly half (46%) of teachers have a family income of up to 5 MW. The other 40% are in families with incomes between 5 and 10 MW. 12% have a family income above this amount (Chart 14). This suggests that the teacher has more of a complementary role in household income.
Chart 13. TEACHERS’ PROFILE, PER INDIvIDuAL INCOMEPercentage of the total number of teachers
0 20 30 40 5010
Up to 3 MW
More than 3 up to 5 MW
More than 5 up to 10 MW
More than 10 MW
Refused to answer
42
37
2
1
18
Chart 14. TEACHERS’ PROFILE, PER FAMILy INCOMEPercentage of the total number of teachers
0 20 30 4010
Up to 3 MW
More than 3 up to 5 MW
More than 5 up to 10 MW
More than 10 MW
Refused to answer
16
30
40
12
2
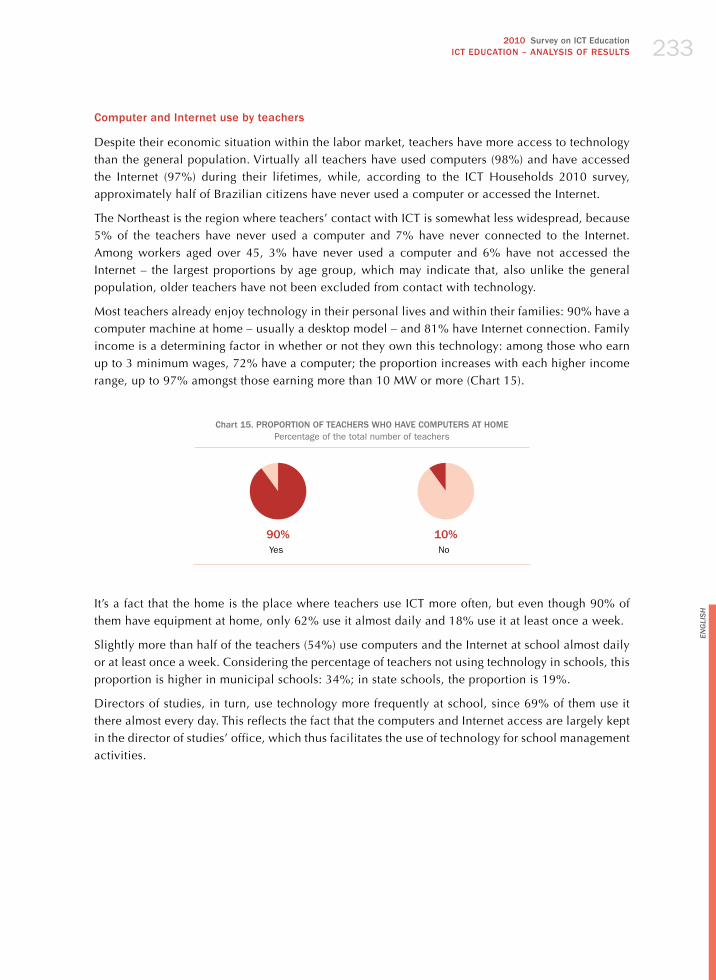
2010 Survey on ICT Education ICT EDuCATION – ANALySIS OF RESuLTS 233
En
gli
sh
Computer and Internet use by teachers
Despite their economic situation within the labor market, teachers have more access to technology than the general population. Virtually all teachers have used computers (98%) and have accessed the Internet (97%) during their lifetimes, while, according to the ICT households 2010 survey, approximately half of Brazilian citizens have never used a computer or accessed the Internet.
The Northeast is the region where teachers’ contact with ICT is somewhat less widespread, because 5% of the teachers have never used a computer and 7% have never connected to the Internet. Among workers aged over 45, 3% have never used a computer and 6% have not accessed the Internet – the largest proportions by age group, which may indicate that, also unlike the general population, older teachers have not been excluded from contact with technology.
Most teachers already enjoy technology in their personal lives and within their families: 90% have a computer machine at home – usually a desktop model – and 81% have Internet connection. Family income is a determining factor in whether or not they own this technology: among those who earn up to 3 minimum wages, 72% have a computer; the proportion increases with each higher income range, up to 97% amongst those earning more than 10 MW or more (Chart 15).
Chart 15. PROPORTION OF TEACHERS WHO HAvE COMPuTERS AT HOMEPercentage of the total number of teachers
90% 10%Yes No
It’s a fact that the home is the place where teachers use ICT more often, but even though 90% of them have equipment at home, only 62% use it almost daily and 18% use it at least once a week.
Slightly more than half of the teachers (54%) use computers and the Internet at school almost daily or at least once a week. Considering the percentage of teachers not using technology in schools, this proportion is higher in municipal schools: 34%; in state schools, the proportion is 19%.
Directors of studies, in turn, use technology more frequently at school, since 69% of them use it there almost every day. This reflects the fact that the computers and Internet access are largely kept in the director of studies’ office, which thus facilitates the use of technology for school management activities.

Survey on ICT Education 2010ICT EDuCATION – ANALySIS OF RESuLTS234
En
gli
sh
Chart 16. FREquENCy OF COMPuTER AND INTERNET uSE By TEACHERS, PER LOCATIONPercentage of the total number of teachers who have already used computers and the Internet at least once
At home
At school
At another educational institution
At someone else’s house
Free public access facility
Paid access facility
62
20 34 13 7 26
191118
7 10 3 782
2
2 4 3 3 89
1 5 5 5
689
84
76
Everyday or nearly At least once a week At least once a month
Less than once a month Does not usually use it
The frequency of ICT use by teachers decreases among those who are in the older age groups. Amongst the professionals who have used the computer or Internet at least once in their lives, 69% of those who are at least 30 years old use computers or the Internet at home almost every day; among those who are 45 years old or more, only 57% of them do so. In a school setting, 61% of those who are younger use the computer once a week, which is 46% more than those who are over 45 years old.
Amongst the teachers who have computers at home, just under half of them (48%) have laptops. The survey has shown that programs that encourage the acquisition of this type of machine have been of great benefit to educators: 26% of them reported having purchased laptops thanks to resources from programs aimed at teachers. The highest percentage appeared in the segment of those that were 45 years old or older, in state schools and in secondary education: 35%, 35% and 36% respectively had used these programs to acquire their laptops. Still, many teachers use their own resources to purchase their equipment (65%) or depend on the aid of family members (7%) (Chart 17).
Chart 17. RESOuRCES FOR COMPuTER ACquISITION By THE TEACHERPercentage of the total number of teachers who have computers at home
Desktop computer
Portable computer
Own resources
A family member’s resources
Subsidized by exclusive teacher programs
Other
1
1
5
26
8
7
85
65

2010 Survey on ICT Education ICT EDuCATION – ANALySIS OF RESuLTS 235
En
gli
sh
Although many teachers have laptops, most do not take them to school, 59%. The largest percentages of those who do not bring laptops to school are among females, from the Southeast, with a lower personal income (up to 3 minimum wages) and aged 46 or more. Out of every 10 teachers who have laptops, 6 do not take them to school. In a school setting, 18% of teachers use the computer and the Internet to carry out activities within the classroom, but this proportion is reduced when the classroom is the most frequent place of use (7%). The Southeast is the place where a greater percentage of teachers use technology in the classroom; they are also mostly male (23%). Only 15% of teachers who are aged over 46 demonstrate interest in taking advantage of the technology.
Computer and Internet skills
The vast majority of teachers master some basic skills in the use of productivity tools, thus being identified as in the stage that Unesco describes as “digital literacy”. This is revealed by the proportion of teachers able to use a text editor with no difficulty (70%) and move or copy a file or folder (57%). Teachers say they have less ability to perform more complex tasks such as multimedia applications, spreadsheets and presentations (Chart 18).
Chart 18. TEACHERS’ SkILLS FOR ACTIvITIES CARRIED OuT ON THE COMPuTER Percentage of the total number of teachers who have already used computers at least once
6
7
13
22
25
31
16
22
23
23
13
19
17
16
57
34
32
26
8 14 70
7 12 74Accessing and browsing the Internet
Writing using a text editor
Copying or moving a file or folder
Using multimedia software, with sound and image
Preparing presentations or slide shows using a presentation editor
Using a calculation spreadsheet
very difficult Difficult Not very difficult
Not difficult Is not familiar with the activity
1
1
1
3
3
4
Teachers’ age is associated with the level of development of their technological skills, with those who are older being reported as having more difficulty with technology. Amongst the teachers who are up to 30 years of age, 84% have no trouble copying files and 88% can write using a text editor. From the ages of 31 to 45, these proportions fall to 56% and 71% respectively. Amongst those who are older, only 42% copy files and folders with ease, and 58% have no trouble writing using a text editor.
The activity which was found to be more difficult for teachers was using a spreadsheet for calculations: 69% say they have trouble with this task, and 31% report having difficulty.
The second most difficult activity is preparing presentations or slides with a presentation editor. 65% of teachers report having some difficulty with this task and approximately 1 in every 4 teachers reports having great difficulty in this area.

Survey on ICT Education 2010ICT EDuCATION – ANALySIS OF RESuLTS236
En
gli
sh
Internet browsing is not difficult for 74% of the teachers who have a master’s degree. however, they show more interest in acting as spectators and not content producers, since their main skill is to use search engines for information. 79% of teachers who have used the Internet said they have no difficulty with it. Sending an e-mail is the second easiest task, even though one in every four Internet users has reported that they have problems in the final execution of this task. In the North/Center-West and Northeast, a third of Internet users send e-mails with some difficulty.
In general, women report greater difficulty in various activities. In computer use, the greater distance between men and women is in regards to spreadsheets: 35% of female teachers reported great difficulty with this task, while only 18% of the men reported having great difficulty in this task.
Taking part in online discussion forums is among the activities that represent a great challenge for teachers. But the activity that stands out in this area is that of making calls using VoIP: 40% of teachers have great difficulty with this and 25% were not even aware of this online resource (Chart 19).
Chart 19. TEACHERS’ SkILLS INvOLvED IN INTERNET ACTIvITIESPercentage of the total number of teachers who have already used the Internet at least once
1
6
9
15
11
13
13
16
12
17
16
25
42
40
40
37
30
27
22
19
19
58
10
1111
11 11
10
14
11
13
9
13
12
11
7
10
13
11
14
16
16
16
19
9
23
22
25
22
29
33
34
36
40
49
14
19
88
4 5 11 79
73
very difficult Difficult Not very difficult
Not difficult Is not familiar with the activity
Looking up information using Google, Yahoo!, etc.
Sending e-mails
Using MSN, G-Talk, etc.
Taking part in relationship websites
Participating in distance learning courses
Watching movies or videos on the Internet
Shopping online
Taking part in online discussion forums
Playing online games
Downloading and installing software/computer programs
Posting films or videos on the Internet
Creating or updating blogs and Internet pages
Using the Internet to make phone calls
Teachers also have a hard time with content creation activities such as posting videos and creating/updating blogs, which suggests a low participation of teachers in regards to building websites.
The data suggest that having a computer at home helps to train teachers in the use of technology. Amongst those who have their own computer, 79% reported ease in using search engines to search for information. 42% of teachers reported facing no difficulties to engage in e-learning.
The picture painted by directors of studies in regards to the skills of teachers in their ICT use was pessimistic. When asked about the number of teachers in their school who could master the use of eleven tools, they only indicated skills in four tasks: writing using a text editor, using e-mail, using browsers on the Internet and participating in social networks. Only a minority of teachers were identified by directors of studies as being able to use greater potential tools in teaching and

2010 Survey on ICT Education ICT EDuCATION – ANALySIS OF RESuLTS 237
En
gli
sh
learning, such as spreadsheets, presentations programs or programs that deal with sound and image (Chart 20).
Chart 20. DIRECTORS OF STuDIES’ PERCEPTIONS OF TEACHERS’ SkILLSPercentage of the total number of directors of studies
41
32
31
27
18
9
7
6
5
5
3
40
38
36
44
28
28
19
19
13
13
8
16
25
28
26
42
52
63
61
58
58
60
1
1
1
1
4
1
2
2
5
8
3
2
3
4
2
8
10
9
12
20
20
26
All / Nearly all Most Some
None / Hardly any Does not know
Internet browsers
Social network programs
Text editors
Diaries / calendars
Sound or image software
Presentation editors
Electronic spreadsheets
Databases
Mananging bills and payments over the Internet
Creating blogs or websites
In certain segments, the perception of skills insufficiency is even more acute. In schools in the Northeast, 47% of teachers believe to have sufficient skills for professional Internet use, which is the highest regional percentage. In the age group of those above 45 years, 47% think their ability is poor, compared with only 16% of teachers who are around 30 years old. Amongst women, the percentage is 39%, while 29% of men were reported as having insufficient skills.
Chart 21. HOW STuDENTS LEARN COMPuTER AND ICT SkILLSPercentage of the total number of students who have used computers or the Internet at least once
With other people
Self-taught
Specific courses
With a school teacher or educator
With students / a student
43
40
26
11
3
0 20 30 40 5010

Survey on ICT Education 2010ICT EDuCATION – ANALySIS OF RESuLTS238
En
gli
sh
Only 11% of students say they learned to use the computer and Internet with a school teacher or educator. Learning from relatives, friends or others with whom the student has a personal relationship was the most mentioned form of learning: 43%. Then came the case of those who learned on their own, with 40%. Specific courses in this area were the method of learning reported by 26% (Chart 21).
On the other hand, students in the early grades, which have probably not had an introduction to technology by other means, benefit from the digital literacy of their teachers. These students are the ones who report learning from their teachers, corroborating teachers’ perceptions. According to teachers, the highest proportion of those who teach students to use technology work in the 5th year of elementary education. In contrast, amongst students of the 2nd year of secondary school, 5% learned from their teachers and 44% went through a specific course in this area.
ThE PoLITICAL-PEdAGoGICAL PLAN ANd ThE USE oF ICT
The survey investigated the perception of directors of studies on how ICT are being introduced in schools, through encouragement or as a result of a requirement of the school’s educational project.
Chart 22. ACTIONS ENCOuRAGED AND REquESTED By THE SCHOOLS’ PEDAGOGIC PLANPercentage of the total number of directors of studies
Adopting new evaluation procedures
Updating on the use of ICT in the educational process
Integrating the use of Internet in teaching practices
Using computers to monitors students’ performance
Using specific software to teach specific content
68 23
20
18
21
19 32
20
18
13
9
66
64
59
49
Encourages Requires Neither encourages nor requires
In general, the use of new technology is perceived as being much more encouraged than demanded through educational projects. Most directors of studies consider that the school encourages rather than requires the use of new forms of assessment (68% vs. 23%), the update on the use of ICT in teaching and learning (66% vs. 20%), and the integration of the Internet in the teachers’ practice (64% vs. 18%) (Chart 22).
As for the school’s political-pedagogical plan, according to the respondents, two aspects seems to be not addressed: the use of specific software for teaching and the use of computers to monitor student performance.
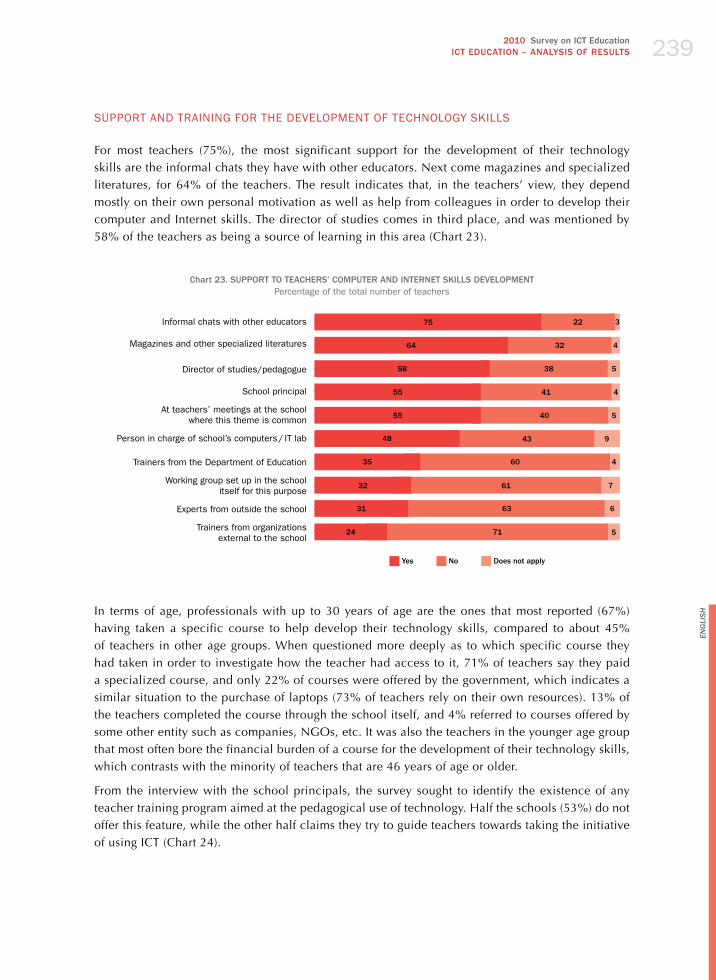
2010 Survey on ICT Education ICT EDuCATION – ANALySIS OF RESuLTS 239
En
gli
sh
SUPPoRT ANd TRAINING FoR ThE dEvELoPmENT oF TEChNoLoGY SKILLS
For most teachers (75%), the most significant support for the development of their technology skills are the informal chats they have with other educators. Next come magazines and specialized literatures, for 64% of the teachers. The result indicates that, in the teachers’ view, they depend mostly on their own personal motivation as well as help from colleagues in order to develop their computer and Internet skills. The director of studies comes in third place, and was mentioned by 58% of the teachers as being a source of learning in this area (Chart 23).
Chart 23. SuPPORT TO TEACHERS’ COMPuTER AND INTERNET SkILLS DEvELOPMENTPercentage of the total number of teachers
Informal chats with other educators
Magazines and other specialized literatures
Director of studies/pedagogue
School principal
At teachers’ meetings at the school where this theme is common
Person in charge of school’s computers / IT lab
Trainers from the Department of Education
Working group set up in the school itself for this purpose
Experts from outside the school
Trainers from organizations external to the school
yes No Does not apply
75
64
58
55
55
48
35
32
31
24 71
63
61
60
43
40
41
38
32
22 3
4
5
4
5
9
4
7
6
5
In terms of age, professionals with up to 30 years of age are the ones that most reported (67%) having taken a specific course to help develop their technology skills, compared to about 45% of teachers in other age groups. When questioned more deeply as to which specific course they had taken in order to investigate how the teacher had access to it, 71% of teachers say they paid a specialized course, and only 22% of courses were offered by the government, which indicates a similar situation to the purchase of laptops (73% of teachers rely on their own resources). 13% of the teachers completed the course through the school itself, and 4% referred to courses offered by some other entity such as companies, NGOs, etc. It was also the teachers in the younger age group that most often bore the financial burden of a course for the development of their technology skills, which contrasts with the minority of teachers that are 46 years of age or older.
From the interview with the school principals, the survey sought to identify the existence of any teacher training program aimed at the pedagogical use of technology. half the schools (53%) do not offer this feature, while the other half claims they try to guide teachers towards taking the initiative of using ICT (Chart 24).
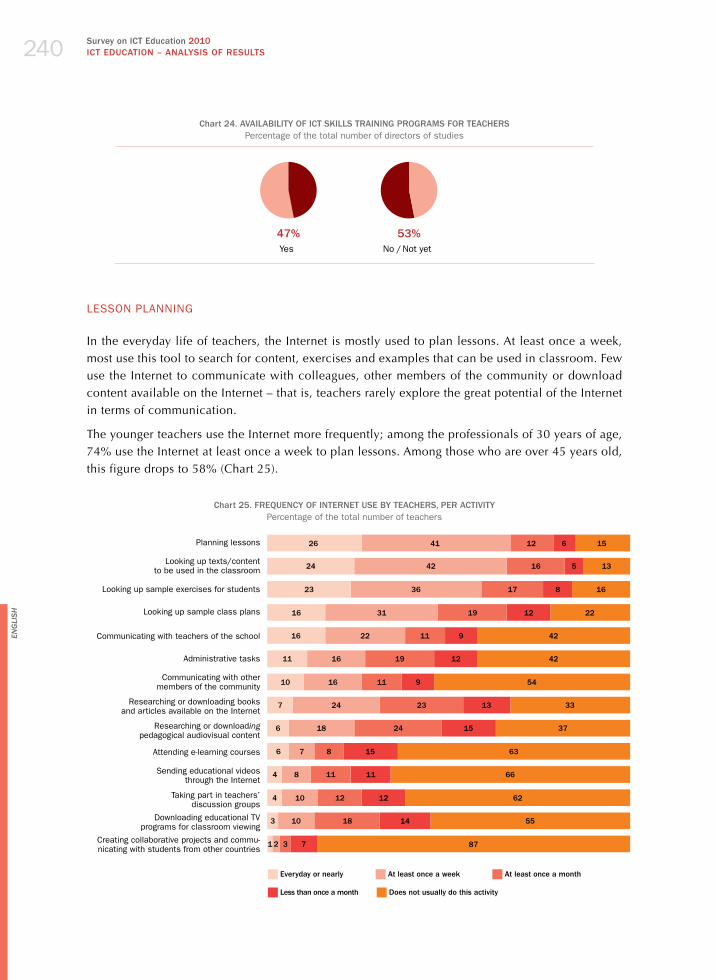
Survey on ICT Education 2010ICT EDuCATION – ANALySIS OF RESuLTS240
En
gli
sh
Chart 24. AvAILABILITy OF ICT SkILLS TRAINING PROGRAMS FOR TEACHERSPercentage of the total number of directors of studies
47% 53%Yes No / Not yet
LESSoN PLANNING
In the everyday life of teachers, the Internet is mostly used to plan lessons. At least once a week, most use this tool to search for content, exercises and examples that can be used in classroom. Few use the Internet to communicate with colleagues, other members of the community or download content available on the Internet – that is, teachers rarely explore the great potential of the Internet in terms of communication.
The younger teachers use the Internet more frequently; among the professionals of 30 years of age, 74% use the Internet at least once a week to plan lessons. Among those who are over 45 years old, this figure drops to 58% (Chart 25).
Chart 25. FREquENCy OF INTERNET uSE By TEACHERS, PER ACTIvITyPercentage of the total number of teachers
Planning lessons
Looking up texts/content to be used in the classroom
Looking up sample exercises for students
Looking up sample class plans
Communicating with teachers of the school
Administrative tasks
Communicating with other members of the community
Researching or downloading books and articles available on the Internet
Researching or downloading pedagogical audiovisual content
Attending e-learning courses
Sending educational videos through the Internet
Taking part in teachers’ discussion groups
Downloading educational TV programs for classroom viewing
Creating collaborative projects and commu-nicating with students from other countries
26
24
23
16
16
11
10
7
6
6
4
4
3
1
12
16
17
19
11
19
11
23
24
8
11
12
18
32
6
5
8
12
9
12
9
13
15
15
11
12
14
7
15
13
16
22
42
42
54
33
37
63
66
62
55
87
41
42
36
31
22
16
16
24
18
7
8
10
10
Everyday or nearly At least once a week At least once a month
Less than once a month Does not usually do this activity
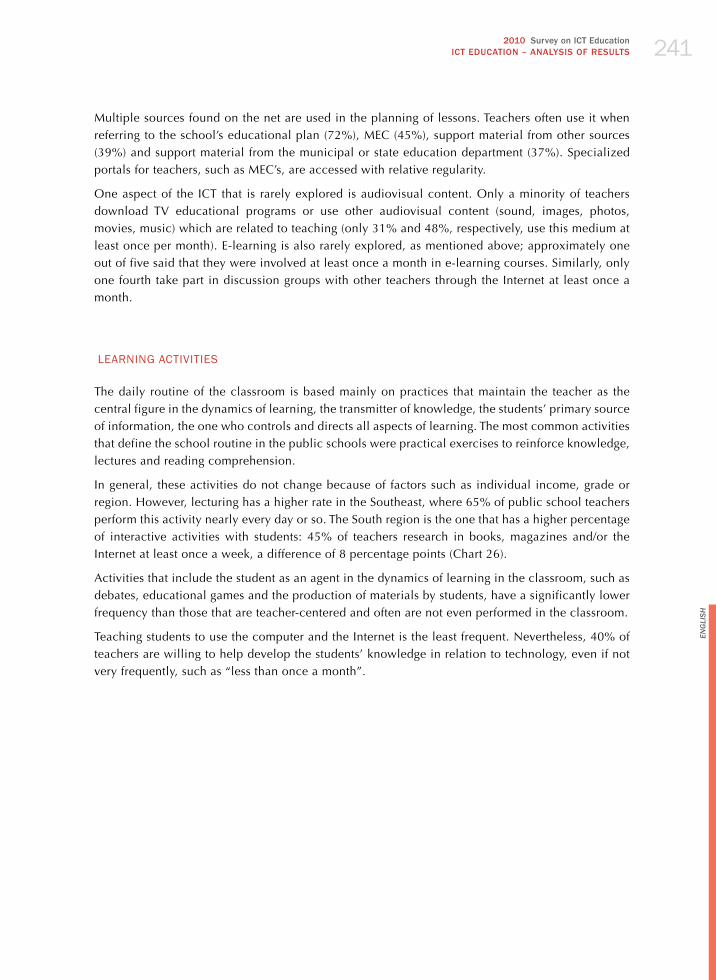
2010 Survey on ICT Education ICT EDuCATION – ANALySIS OF RESuLTS 241
En
gli
sh
Multiple sources found on the net are used in the planning of lessons. Teachers often use it when referring to the school’s educational plan (72%), MEC (45%), support material from other sources (39%) and support material from the municipal or state education department (37%). Specialized portals for teachers, such as MEC’s, are accessed with relative regularity.
One aspect of the ICT that is rarely explored is audiovisual content. Only a minority of teachers download TV educational programs or use other audiovisual content (sound, images, photos, movies, music) which are related to teaching (only 31% and 48%, respectively, use this medium at least once per month). E-learning is also rarely explored, as mentioned above; approximately one out of five said that they were involved at least once a month in e-learning courses. Similarly, only one fourth take part in discussion groups with other teachers through the Internet at least once a month.
LEARNING ACTIvITIES
The daily routine of the classroom is based mainly on practices that maintain the teacher as the central figure in the dynamics of learning, the transmitter of knowledge, the students’ primary source of information, the one who controls and directs all aspects of learning. The most common activities that define the school routine in the public schools were practical exercises to reinforce knowledge, lectures and reading comprehension.
In general, these activities do not change because of factors such as individual income, grade or region. however, lecturing has a higher rate in the Southeast, where 65% of public school teachers perform this activity nearly every day or so. The South region is the one that has a higher percentage of interactive activities with students: 45% of teachers research in books, magazines and/or the Internet at least once a week, a difference of 8 percentage points (Chart 26).
Activities that include the student as an agent in the dynamics of learning in the classroom, such as debates, educational games and the production of materials by students, have a significantly lower frequency than those that are teacher-centered and often are not even performed in the classroom.
Teaching students to use the computer and the Internet is the least frequent. Nevertheless, 40% of teachers are willing to help develop the students’ knowledge in relation to technology, even if not very frequently, such as “less than once a month”.

Survey on ICT Education 2010ICT EDuCATION – ANALySIS OF RESuLTS242
En
gli
sh
Chart 26. ACTIvITIES WITH STuDENTS – FREquENCy OF uSE By TEACHERS OF COMPuTERS AND THE INTERNETPercentage of the total number of teachers
Everyday or nearly At least once a week At least once a month
Less than once a month Does not usually do this activity
Practical exercises for content retention
Lectures
Reading comprehension
Customized support to ensure certain students are able to perform with the rest of the group
Organizing, monitoring and supporting of group activities and collaborative work among students
Researching in books, magazines and /or the Internet
Production of material by students
Theme projects or assignments
Debates and presentations made by students to the whole class
Talking to parents about how they can support /monitor their children’s learning and offering advice
Playing educational games
Science experiments
Organizing and /or intermediating communication between students and external experts /advisors
Contributing to the community through theme projects
Teaching students to use computers and the Internet
74
55
54
42
19
15
15
10
8
6
5
5
5
3
2 17 9 12
10 26 29
25
16
18
20
21 22
12353612
24 40 18 10
7
7
7
8
11
10
5
33516
14
13
11
13
7
5
6
3534
36
37
34
28
25
20
28
30
26
12
7
13
3022
11
17
32
41
42
59
ThE USE oF TEChNoLoGY IN SChooL
For students, the school is the location where access to technology is least frequent: only 2% of students have this access every day. Still, for 25% of students the school is an opportunity of access to the Internet, where they use computers and the Internet at least once a week.
The frequency of the use of technology in schools is higher amongst the students of municipal schools (30% use it at least once a week, compared with the 18% of those in state schools) and in the 5th year of elementary education (31% use computers and the Internet at least once a week, 24% of those in their 9th year of elementary education and 17% of those in their 2nd year of secondary school).
According to teachers’ response, it was observed that in the students’ daily activities such as lectures, reading comprehension and practical exercises, the habit of computer and Internet use is still quite low. Moreover, very little is used of the communication potential of the Internet, since activities like talkings to parents and organizing and/or intermediating communications between students and external experts / advisors are among those for which teachers do not use technologies (only 23% and 20% respectively).
In general, it is the younger teachers that are more computer and Internet oriented and who use them in their activities with the students. Another factor which influences teachers’ use of technology in their activities with students is their income – both individual and that of their family.
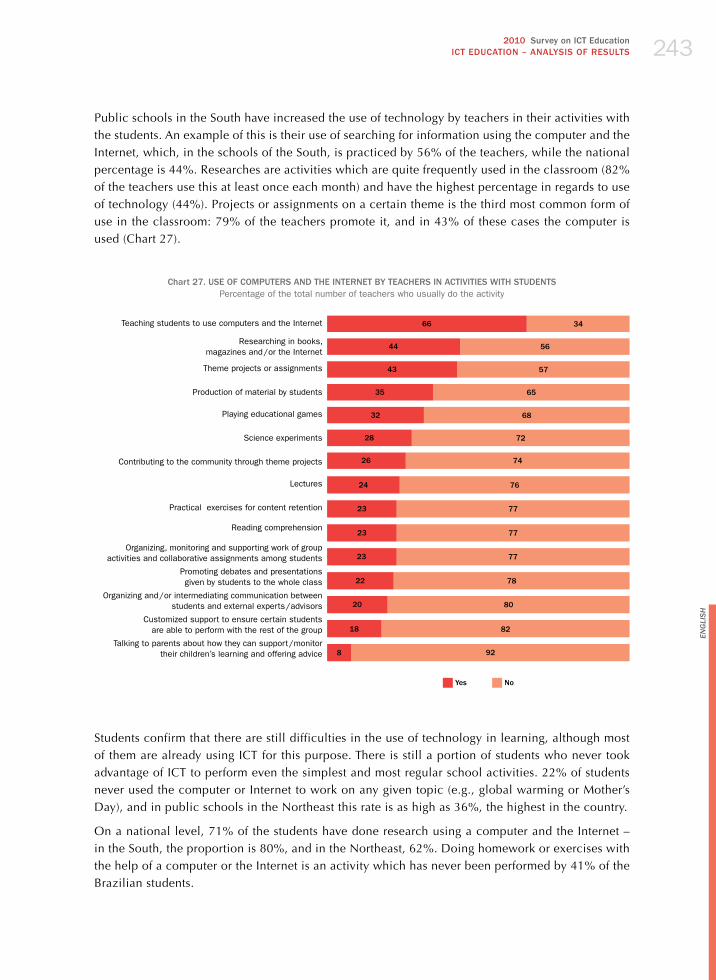
2010 Survey on ICT Education ICT EDuCATION – ANALySIS OF RESuLTS 243
En
gli
sh
Public schools in the South have increased the use of technology by teachers in their activities with the students. An example of this is their use of searching for information using the computer and the Internet, which, in the schools of the South, is practiced by 56% of the teachers, while the national percentage is 44%. Researches are activities which are quite frequently used in the classroom (82% of the teachers use this at least once each month) and have the highest percentage in regards to use of technology (44%). Projects or assignments on a certain theme is the third most common form of use in the classroom: 79% of the teachers promote it, and in 43% of these cases the computer is used (Chart 27).
Chart 27. uSE OF COMPuTERS AND THE INTERNET By TEACHERS IN ACTIvITIES WITH STuDENTSPercentage of the total number of teachers who usually do the activity
Teaching students to use computers and the Internet
Researching in books, magazines and /or the Internet
Theme projects or assignments
Production of material by students
Playing educational games
Science experiments
Contributing to the community through theme projects
Lectures
Practical exercises for content retention
Reading comprehension
Organizing, monitoring and supporting work of group activities and collaborative assignments among students
Promoting debates and presentations given by students to the whole class
Organizing and /or intermediating communication between students and external experts /advisors
Customized support to ensure certain students are able to perform with the rest of the group
Talking to parents about how they can support /monitor their children’s learning and offering advice
66 34
44 56
43 57
35 65
32 68
28 72
26 74
24 76
23 77
22 78
20 80
18 82
8 92
23 77
23 77
yes No
Students confirm that there are still difficulties in the use of technology in learning, although most of them are already using ICT for this purpose. There is still a portion of students who never took advantage of ICT to perform even the simplest and most regular school activities. 22% of students never used the computer or Internet to work on any given topic (e.g., global warming or Mother’s Day), and in public schools in the Northeast this rate is as high as 36%, the highest in the country.
On a national level, 71% of the students have done research using a computer and the Internet – in the South, the proportion is 80%, and in the Northeast, 62%. Doing homework or exercises with the help of a computer or the Internet is an activity which has never been performed by 41% of the Brazilian students.

Survey on ICT Education 2010ICT EDuCATION – ANALySIS OF RESuLTS244
En
gli
sh
The proportion of students who have never used the computer or the Internet for other school activities is indicative of the limited use that technology has had in the daily practice of teaching/learning in Brazilian public schools. About 69% of students have never done a science experiment with the help of an ICT, 55% have never used them to give a presentation to their class, 42% have never played educational games, and no less than 82% have never communicated with their teacher over the Internet. These indicators illustrate that, despite the fact that there have been public policies aimed at the integration of ICT in public schools and which have been in place for nearly 14 years, the scope of some of their major goals is still in its early stages.
EvALUATIoN mEThodS
Written tests and exams, assignments, exercises and presenting assignments and exercises are referred to as evaluation methods by almost all teachers. Many must use a combination of these forms of evaluation. Interestingly enough, more than half of all teachers appreciate it when their students use video, images and sounds in assessed presentations or assignments (Chart 28).
Chart 28. EvALuATION METHODS uSED By TEACHERS WITH STuDENTSPercentage of the total number of teachers
Written tests and exams
Written assignments and exercises
Presenting assignments to the class
Use of videos, images and sounds in assignments and presentations
99
94
64 36
6
99
1
1
yes No
The computer is still far from being a tool for carrying out evaluation activities within the Brazilian public schools, but we can already see attempts in this direction. Up to 10% of teachers now use the computer to apply written tests and exams, and 22% evaluate their students through written assignments and exercises with the help of computers.
Amongst the teachers who adopt class presentation as a method of evaluation, 47% perceive the use of technology in integrating multimedia features such as videos, images and sounds in their students’ assignments and presentations.
Secondary school teachers value the computer, both for presenting assignments to the class (41%) as well as for the integration of videos, images and sounds in their students’ assignments and presentations. At this level of education, 59% of the teachers value the use of technology in evaluations. The same applies to teachers in public schools in the South: 44% value using the computer for presenting assignments to the class, and 59% value the integration of videos, images and sounds in their students’ assignments and presentations (Chart 29).
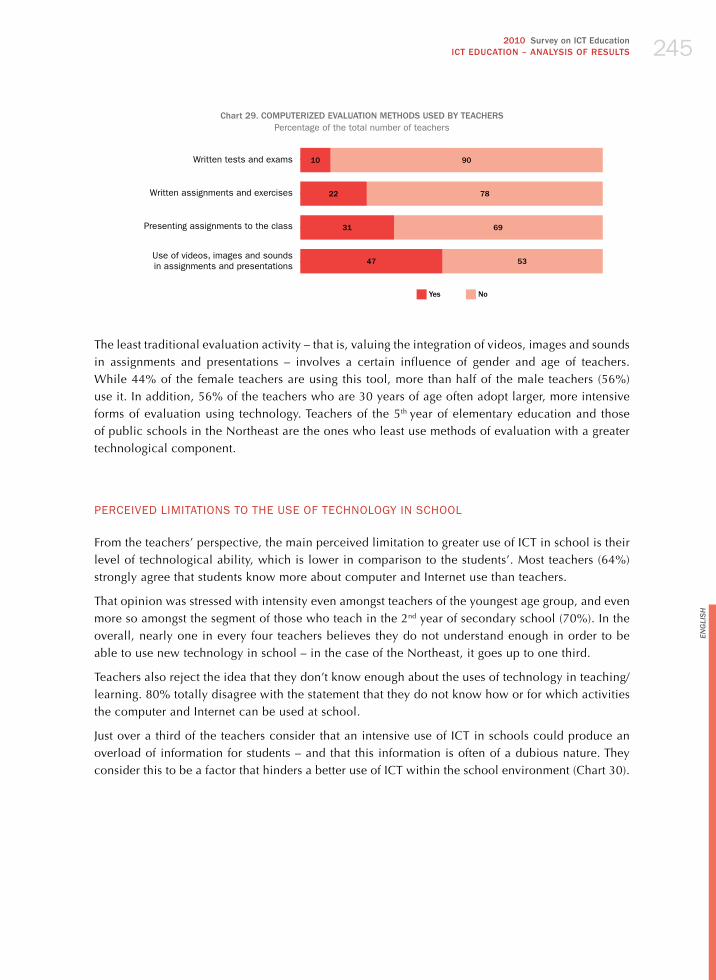
2010 Survey on ICT Education ICT EDuCATION – ANALySIS OF RESuLTS 245
En
gli
sh
Chart 29. COMPuTERIzED EvALuATION METHODS uSED By TEACHERSPercentage of the total number of teachers
Written tests and exams
Written assignments and exercises
Presenting assignments to the class
Use of videos, images and sounds in assignments and presentations
10
22
31
47 53
69
78
90
yes No
The least traditional evaluation activity – that is, valuing the integration of videos, images and sounds in assignments and presentations – involves a certain influence of gender and age of teachers. While 44% of the female teachers are using this tool, more than half of the male teachers (56%) use it. In addition, 56% of the teachers who are 30 years of age often adopt larger, more intensive forms of evaluation using technology. Teachers of the 5th year of elementary education and those of public schools in the Northeast are the ones who least use methods of evaluation with a greater technological component.
PERCEIvEd LImITATIoNS To ThE USE oF TEChNoLoGY IN SChooL
From the teachers’ perspective, the main perceived limitation to greater use of ICT in school is their level of technological ability, which is lower in comparison to the students’. Most teachers (64%) strongly agree that students know more about computer and Internet use than teachers.
That opinion was stressed with intensity even amongst teachers of the youngest age group, and even more so amongst the segment of those who teach in the 2nd year of secondary school (70%). In the overall, nearly one in every four teachers believes they do not understand enough in order to be able to use new technology in school – in the case of the Northeast, it goes up to one third.
Teachers also reject the idea that they don’t know enough about the uses of technology in teaching/learning. 80% totally disagree with the statement that they do not know how or for which activities the computer and Internet can be used at school.
just over a third of the teachers consider that an intensive use of ICT in schools could produce an overload of information for students – and that this information is often of a dubious nature. They consider this to be a factor that hinders a better use of ICT within the school environment (Chart 30).
Survey on ICT Education 2010ICT EDuCATION – ANALySIS OF RESuLTS246
En
gli
sh
Chart 30. BARRIERS PREvENTING WIDER uSE OF TECHNOLOGIES IN SCHOOLS ACCORDING TO TEACHERSPercentage of the total number of teachers
Students know more about computers and the Internet than teachers
The Internet overloads students with information
I do not trust the information available on the Internet
With the Internet, students end up losing touch with reality
I have greater faith in traditional teaching methods
I do not know enough about computers and the Internet to use these resources at school
I am generally afraid of using the Internet
I do not know how/for which activities I can use computers and the Internet in school
I totally agree (5)
I partly agree
(4)
I neither agree nor disagree
(3)
I partly disagree
(2)
I totally disagree
(1)
Does not know
25
8
2
7
6
9
3
3
39
27
29
24
22
15
12
9
8
9
11
9
13
7
7
7
13
24
29
25
27
16
16
18
14
31
28
35
33
53
62
62
1
1
Teachers show confidence in their ability to use the computer and the Internet. more than half (58%) of teachers believe that their level of computer skills is sufficient for their needs, and 63% feel that its enough or more than enough for their work-related needs. This confidence is supported by the description of the main activities that the teacher performs in the classroom, as was shown previously. It is possible that a minimal amount of computer knowledge is enough for most of the teachers’ daily activities, which can lead the teachers of public schools in Brazil to believe that their level of digital literacy is certainly sufficient to meet the needs of their classroom.
Less than a third of the teachers believe in more traditional teaching methods, are distrustful of the information contained on the Internet and have a widespread fear of using it. Only 12% said they did not know to use ICT in school.
The opinions of the principals followed in the same direction, suggesting that it is a small portion of educators who openly express resistance to the advancement of new technology in education. A higher proportion of principals, compared to teachers, feel that they are able to use the computer and Internet at school. While 24% of teachers consider themselves unable to understand enough to use ICT in school, only 14% of principals share this perception. They believe less in traditional teaching methods than teachers (17% of principals and 27% of teachers) and just like the teachers, they consider it important to know how to use the computer and the Internet at school.
In the opinion of principals, teachers and directors of study, one aspect limiting the use of ICT in school is infrastructure. The main complaint is about the insufficient number of computers per student, which for 57% of the educators severely limits the use of ICT. The lack of appropriate equipment for students with special needs is a major limitation according to the evaluation of 52% of the educators, and obsolete equipment is a limiting issue for 45% of them.

2010 Survey on ICT Education ICT EDuCATION – ANALySIS OF RESuLTS 247
En
gli
sh
Also among the factors which limit the greater use of ICT in school is the insufficient number of computers which are connected to the Internet (for 53% of educators this factor has been a great hindrance). Low speed Internet connection is another limiting factor (49%). These complaints appear with similar intensity in all regions of the country, regardless of the schools’ administrative jurisdiction or the grades which the teacher works with.
Actual pedagogical or work organization issues appeared as less prominent. For 37%, a major limiting factor is their lack of time to plan lessons with a greater incorporation of computers and Internet. For 36% of the teachers, what limits a more intense use of technology in schools is the lack of time to cover the syllabus content. Finally, the complaints include lack of educational support (33%), pressure to achieve good performance in evaluations (33%) and very rigid curricula (24%).
PERCEPTIoN oF ThE BENEFITS ThAT mAY ARISE FRom ThE USE oF ICT IN SChooL
Although there is still a challenge in regards to the advancement of technology in Brazilian public schools, teachers have noticed benefits in the use of these tools. The most frequently mentioned is the use of diversified materials and the improvement in quality, reported by 81% of the teachers. Also for directors of studies and principals, this has been the main contribution of ICT in regards to their work as educators.
Secondly, there is the use of new teaching methods, observed by 80% of the teachers. Thirdly comes the recognition of the fact that the teachers seem to become more effective educators: 74% of teachers mentioned this. The evaluation is not affected by the age of the teacher, but has regional variations: 88% of the teachers in public schools in the South perceive this evolution, while in other regions the percentage varies from 68% (Northeast) to 74% (Southeast).
Although teachers feel prepared for the use of technology in their teaching practice, the use of the computer and Internet activities within public schools is still in the early stages of development. This is because the most common activities of everyday teaching include a low intensity use of ICT.
FINAL ThoUGhTS
The study found evidence that suggests that, within the first decade of this century, there are a lot of challenges in regards to the integration of ICT into education, despite efforts to provide the infrastructure of computers and Internet use to public schools in Brazil. This challenge is divided into two parts: ensuring that the school community has access to a high quality technological infrastructure and developing the pedagogical use of these tools.
Results show that the school environment as a whole and school leadership are critical to the integration of technology in education. The position of the principals in the face of technology is central to understanding the limitations and gaps in the dialogue between the ICT and pedagogical practice.
The actors in education were asked to define the priority they attach to various initiatives related to technological innovations in school. In the principals’ view, the development of the technological

Survey on ICT Education 2010ICT EDuCATION – ANALySIS OF RESuLTS248
En
gli
sh
skills of the teachers and students is the most important action that needs to be taken in order to increase the number of computers and improve Internet access. For directors of studies and teachers, the priority is to address infrastructure issues, which for them constitute the main limitation to the use of ICT within the educational process.
In the administrators’ viewpoint, there is a lack of educational support to improve the use of computer and Internet in school activities. In the view of teachers and directors of studies, the technical support, an infrastructural aspect, is lacking more than the educational side.
In the principals’ viewpoint, issues related to work organization, such as insufficient time to prepare lessons, pressure to fulfill the curriculum and to achieve good assessment results, disrupt more strongly the integration of a higher level of technology in school activities.
The survey shows that increased access of students and teachers to computers is seen as essential in order to increase the chances to develop their technology skills. We must therefore pay special attention to the restrictions to access to computers in schools. In this sense, it was found that in schools where students do not have access to computers, increasing the number of equipment per student was quoted as high priority more often than in those where students have access to equipment. Another frequent complaint was in regards to the insufficient number of computers connected to the Internet – a possible justification for restricting students’ access –, which is more common in schools with limited access than in those where that does not occur.
In short, as the central figures in the survey, teachers appear to be professionals who, in spite of having conquered their space, that is, consolidated their practice as a profession and developed academically, still face poor working conditions, expressed in their workday, their wages and the type of support for the acquisition of equipment, and, especially, for professional development. These characteristics impact the incorporation of technology in the teaching/learning process. The initial training of teachers shows up as a relevant issue, since these teachers, being in their position for over fifteen years, entered the teaching profession at a time prior to the diffusion of ICT in society, and the opportunity to be trained in the use of technology for teaching was certainly not included in their courses. In addition to this, working conditions have prevented teachers from staying up to date or specializing.
When seen from this perspective, one cannot expect that teachers alone promote possible changes in the paradigm of education, including the integration of the digital culture into schooling.

2010 Survey on ICT Education ICT EDuCATION – ANALySIS OF RESuLTS 249
En
gli
sh
3Tabelas de resulTados
– Professores –
TABles OFResUlTs
– TeACheRs –


2010 Pesquisa TIC EducaçãoTABELAS DE RESuLTADOS – PROFESSORES
PO
RTu
Gu
ÊS
En
gli
sh
251
Percentual (%)Percentage (%)
Ensino Médio – magistério
(antigo 2o grau) secondary Education – teacher training
Ensino Médio – outros
(antigo 2o grau)secondary Education
– other
Ensino Superior – pedagogia
Tertiary Education
– pedagogy
Ensino Superior – licenciatura
em matemáticaTertiary
Education – maths
teaching degree
TOTAL 3 1 21 24
SEXOgEnDER
Feminino / female 4 1 24 17
masculino / male 1 1 11 50
FAIXA ETÁRIAAgE gROUP
≤ 30 2 2 18 30
31-45 3 - 22 25
46+ 4 1 22 21
RENDA FAMILIARFAMilY inCOME
Até 3 Sm up to 3 mw 7 2 26 21
mais de 3 até 5 Sm more than 3 up to 5 mw 3 1 22 24
mais de 5 Sm more than 5 mw 2 - 19 26
RENDA PESSOALinDiViDUAl inCOME
Até 3 Sm up to 3 mw 5 1 25 20
mais de 3 até 5 Sm more than 3 up to 5 mw 2 1 20 26
mais de 5 Sm more than 5 mw 1 - 15 30
REGIÃOREgiOn
Norte / Centro-oeste / North / Center-west 2 1 22 23
Nordeste / Northeast 4 1 22 25
Sudeste / Southeast 3 1 22 27
Sul / South 2 - 17 21
DEPENDêNCIA ADMINISTRATIvAADMinisTRATiVE
JURisDiCTiOn
municipal / municipal 4 1 29 18
Estadual / State 2 1 12 31
SÉRIEgRADE
4a série / 5o ano do Ensino Fundamental4th grade / 5th year elementary education 5 1 39 11
8a série / 9o ano do Ensino Fundamental8th grade / 9th year elementary education 2 1 14 28
2o ano do Ensino médio2nd year of Secondary education - 1 4 39
COMPUTADOR INSTALADO
NO LABORATóRIO DE INFORMÁTICA
COMPUTER insTAllED AT iT lAb
Sim / yes 3 1 21 25
Não / No 5 1 23 21
INTERNET INSTALADA NO LABORATóRIO DE INFORMÁTICA
inTERnET AVAilAblE AT iT lAb
Sim / yes 2 1 19 26
Não / No 5 1 26 21
1 Base: 1.535 professores. Respostas estimuladas.1 base: 1,535 teachers. stimulated answers.
A1 GRAU DE ESCOLARIDADE DOS PROFESSORESlevel of eduCatIoN of teaCherSPercentual sobre o total de professores¹ Percentage of the total number of teachers¹
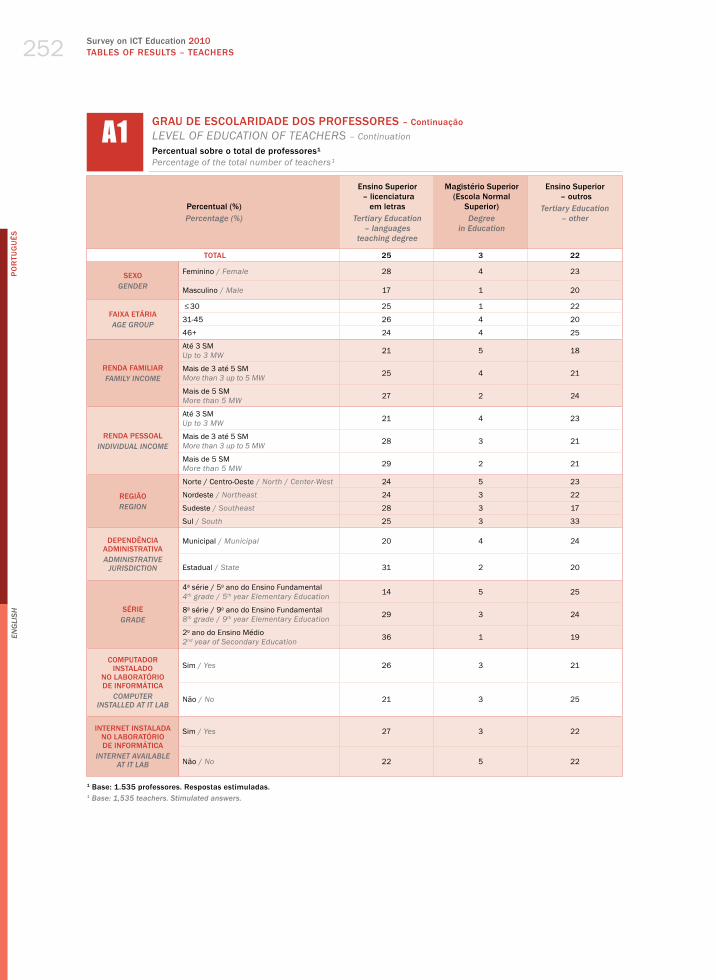
Survey on ICT Education 2010TABLES OF RESuLTS – TEACHERS
PO
RTu
Gu
ÊS
En
gli
sh
252
Percentual (%)Percentage (%)
Ensino Superior – licenciatura
em letrasTertiary Education
– languages teaching degree
Magistério Superior (Escola Normal
Superior)Degree
in Education
Ensino Superior – outros
Tertiary Education – other
TOTAL 25 3 22
SEXOgEnDER
Feminino / female 28 4 23
masculino / male 17 1 20
FAIXA ETÁRIAAgE gROUP
≤ 30 25 1 22
31-45 26 4 20
46+ 24 4 25
RENDA FAMILIARFAMilY inCOME
Até 3 Sm up to 3 mw 21 5 18
mais de 3 até 5 Sm more than 3 up to 5 mw 25 4 21
mais de 5 Sm more than 5 mw 27 2 24
RENDA PESSOALinDiViDUAl inCOME
Até 3 Sm up to 3 mw 21 4 23
mais de 3 até 5 Sm more than 3 up to 5 mw 28 3 21
mais de 5 Sm more than 5 mw 29 2 21
REGIÃOREgiOn
Norte / Centro-oeste / North / Center-west 24 5 23
Nordeste / Northeast 24 3 22
Sudeste / Southeast 28 3 17
Sul / South 25 3 33
DEPENDêNCIA ADMINISTRATIvAADMinisTRATiVE
JURisDiCTiOn
municipal / municipal 20 4 24
Estadual / State 31 2 20
SÉRIEgRADE
4a série / 5o ano do Ensino Fundamental4th grade / 5th year elementary education 14 5 25
8a série / 9o ano do Ensino Fundamental8th grade / 9th year elementary education 29 3 24
2o ano do Ensino médio2nd year of Secondary education 36 1 19
COMPUTADOR INSTALADO
NO LABORATóRIO DE INFORMÁTICA
COMPUTER insTAllED AT iT lAb
Sim / yes 26 3 21
Não / No 21 3 25
INTERNET INSTALADA NO LABORATóRIO DE INFORMÁTICA
inTERnET AVAilAblE AT iT lAb
Sim / yes 27 3 22
Não / No 22 5 22
1 Base: 1.535 professores. Respostas estimuladas.1 base: 1,535 teachers. stimulated answers.
A1 GRAU DE ESCOLARIDADE DOS PROFESSORES – Continuaçãolevel of eduCatIoN of teaCherS – ContinuationPercentual sobre o total de professores¹ Percentage of the total number of teachers¹

2010 Pesquisa TIC EducaçãoTABELAS DE RESuLTADOS – PROFESSORES
PO
RTu
Gu
ÊS
En
gli
sh
253
Percentual (%)Percentage (%)
Especialização (mínimo de 360 horas)
specialization (minimum of 360 hours)
MestradoMasters
DoutoradoPhD
Não fiz ou ainda não completei nenhum curso
de pós-graduaçãoi have not
undertaken or completed any post-graduate
courses
TOTAL 56 4 - 40
SEXOgEnDER
Feminino / female 57 3 - 40
masculino / male 54 5 1 40
FAIXA ETÁRIAAgE gROUP
≤ 30 45 3 1 51
31-45 58 3 - 39
46+ 58 6 - 37
RENDA FAMILIARFAMilY inCOME
Até 3 Sm up to 3 mw 45 3 - 52
mais de 3 até 5 Sm more than 3 up to 5 mw 53 2 - 44
mais de 5 Sm more than 5 mw 60 5 1 34
RENDA PESSOALinDiViDUAl inCOME
Até 3 Sm up to 3 mw 49 3 - 47
mais de 3 até 5 Sm more than 3 up to 5 mw 60 3 - 37
mais de 5 Sm more than 5 mw 62 7 - 31
REGIÃOREgiOn
Norte / Centro-oeste / North / Center-west 62 1 - 36
Nordeste / Northeast 57 3 - 40
Sudeste / Southeast 46 5 1 49
Sul / South 70 6 1 23
DEPENDêNCIA ADMINISTRATIvAADMinisTRATiVE
JURisDiCTiOn
municipal / municipal 57 3 - 40
Estadual / State 55 4 1 40
SÉRIEgRADE
4a série / 5o ano do Ensino Fundamental4th grade / 5th year elementary education 53 2 - 45
8a série / 9o ano do Ensino Fundamental8th grade / 9th year elementary education 60 4 - 36
2o ano do Ensino médio2nd year of Secondary education 57 5 1 37
COMPUTADOR INSTALADO
NO LABORATóRIO DE INFORMÁTICA
COMPUTER insTAllED AT iT lAb
Sim / yes 57 4 - 38
Não / No 51 2 1 46
INTERNET INSTALADA NO LABORATóRIO DE INFORMÁTICA
inTERnET AVAilAblE AT iT lAb
Sim / yes 57 5 - 38
Não / No 54 2 - 44
1 Base: 1.535 professores. Respostas estimuladas.1 base: 1,535 teachers. stimulated answers.
A2 MODALIDADES DE PóS-GRADUAÇÃO DOS PROFESSORESPoSt-graduate QualIfICatIoNS of teaCherSPercentual sobre o total de professores¹ Percentage of the total number of teachers¹

Survey on ICT Education 2010TABLES OF RESuLTS – TEACHERS
PO
RTu
Gu
ÊS
En
gli
sh
254
Percentual (%)Percentage (%)
Letraslanguages
Matemática Mathematics
PedagogiaPedagogy
Ciências físicas e biológicasPhysical and
biological sciences
TOTAL 31 30 27 6
SEXOgEnDER
Feminino / female 34 21 32 5
masculino / male 21 61 14 7
FAIXA ETÁRIAAgE gROUP
≤ 30 30 36 19 3
31-45 32 29 29 6
46+ 30 30 30 7
RENDA FAMILIARFAMilY inCOME
Até 3 Sm up to 3 mw 24 26 26 7
mais de 3 até 5 Sm more than 3 up to 5 mw 30 28 28 6
mais de 5 Sm more than 5 mw 34 33 27 6
RENDA PESSOALinDiViDUAl inCOME
Até 3 Sm up to 3 mw 28 25 29 5
mais de 3 até 5 Sm more than 3 up to 5 mw 32 30 28 7
mais de 5 Sm more than 5 mw 37 40 23 5
REGIÃOREgiOn
Norte / Centro-oeste / North / Center-west 30 26 27 3
Nordeste / Northeast 30 30 22 4
Sudeste / Southeast 32 34 34 9
Sul / South 36 27 24 6
DEPENDêNCIA ADMINISTRATIvAADMinisTRATiVE
JURisDiCTiOn
municipal / municipal 26 26 36 5
Estadual / State 37 35 18 7
SÉRIEgRADE
4a série / 5o ano do Ensino Fundamental4th grade / 5th year elementary education 20 16 46 4
8a série / 9o ano do Ensino Fundamental8th grade / 9th year elementary education 37 36 20 6
2o ano do Ensino médio2nd year of Secondary education 42 45 10 7
COMPUTADOR INSTALADO
NO LABORATóRIO DE INFORMÁTICA
COMPUTER insTAllED AT iT lAb
Sim / yes 33 31 27 6
Não / No 25 28 30 7
INTERNET INSTALADA NO LABORATóRIO DE INFORMÁTICA
inTERnET AVAilAblE AT iT lAb
Sim / yes 34 31 25 6
Não / No 25 28 33 6
1 Base: 1.535 professores. Respostas múltiplas e estimuladas.1 base: 1,535 teachers. Multiple, stimulated answers.
A3 ÁREA DE FORMAÇÃO NA GRADUAÇÃO DOS PROFESSORESfIeld of uNdergraduate StudIeS of teaCherSPercentual sobre o total de professores¹ Percentage of the total number of teachers¹

2010 Pesquisa TIC EducaçãoTABELAS DE RESuLTADOS – PROFESSORES
PO
RTu
Gu
ÊS
En
gli
sh
255
Percentual (%)Percentage (%)
Psicopedagogia Psychopedagogy
Gestão escolarschool
management
Geografiageography
Históriahistory
TOTAL 4 3 2 2
SEXOgEnDER
Feminino / female 5 4 3 2
masculino / male 1 2 1 1
FAIXA ETÁRIAAgE gROUP
≤ 30 3 2 2 2
31-45 4 3 2 2
46+ 5 4 2 3
RENDA FAMILIARFAMilY inCOME
Até 3 Sm up to 3 mw 3 3 4 3
mais de 3 até 5 Sm more than 3 up to 5 mw 4 2 2 3
mais de 5 Sm more than 5 mw 4 4 2 2
RENDA PESSOALinDiViDUAl inCOME
Até 3 Sm up to 3 mw 4 3 2 2
mais de 3 até 5 Sm more than 3 up to 5 mw 4 3 2 2
mais de 5 Sm more than 5 mw 4 5 2 1
REGIÃOREgiOn
Norte / Centro-oeste / North / Center-west 6 4 1 1
Nordeste / Northeast 3 2 3 2
Sudeste / Southeast 5 3 2 2
Sul / South 3 5 3 3
DEPENDêNCIA ADMINISTRATIvAADMinisTRATiVE
JURisDiCTiOn
municipal / municipal 5 4 3 3
Estadual / State 3 2 1 1
SÉRIEgRADE
4a série / 5o ano do Ensino Fundamental4th grade / 5th year elementary education 7 5 3 4
8a série / 9o ano do Ensino Fundamental8th grade / 9th year elementary education 3 2 1 1
2o ano do Ensino médio2nd year of Secondary education 2 2 1 1
COMPUTADOR INSTALADO
NO LABORATóRIO DE INFORMÁTICA
COMPUTER insTAllED AT iT lAb
Sim / yes 4 3 2 2
Não / No 4 4 3 2
INTERNET INSTALADA NO LABORATóRIO DE INFORMÁTICA
inTERnET AVAilAblE AT iT lAb
Sim / yes 4 3 2 2
Não / No 5 4 3 2
1 Base: 1.535 professores. Respostas múltiplas e estimuladas.1 base: 1,535 teachers. Multiple, stimulated answers.
A3 ÁREA DE FORMAÇÃO NA GRADUAÇÃO DOS PROFESSORES – ContinuaçãofIeld of uNdergraduate StudIeS of teaCherS – ContinuationPercentual sobre o total de professores¹ Percentage of the total number of teachers¹
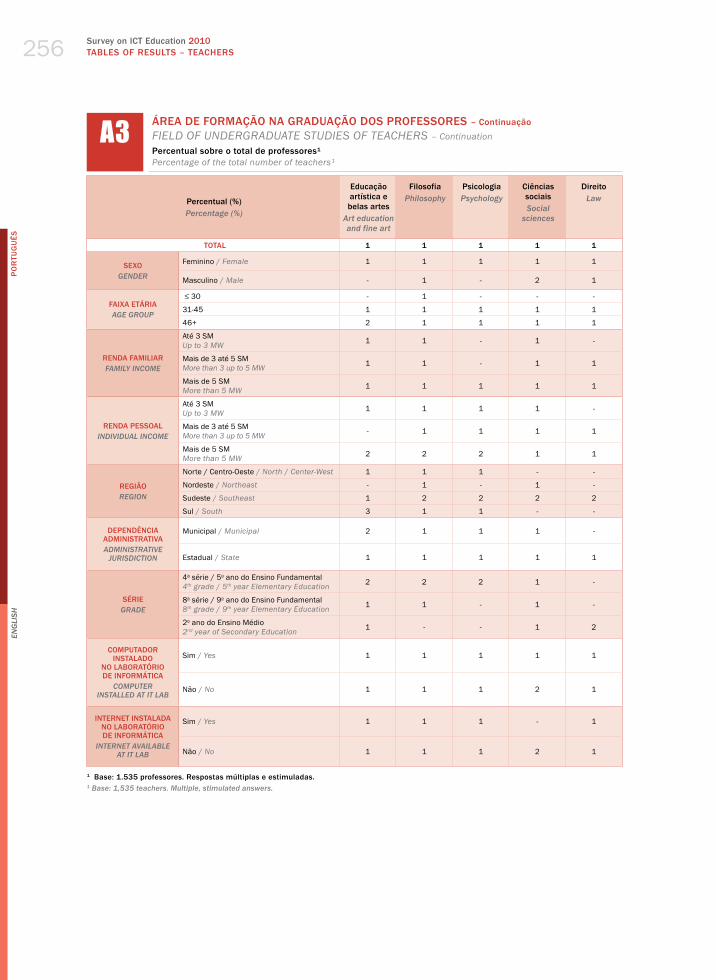
Survey on ICT Education 2010TABLES OF RESuLTS – TEACHERS
PO
RTu
Gu
ÊS
En
gli
sh
256
Percentual (%)Percentage (%)
Educação artística e belas artes
Art education and fine art
FilosofiaPhilosophy
PsicologiaPsychology
Ciências sociais social
sciences
Direito law
TOTAL 1 1 1 1 1
SEXOgEnDER
Feminino / female 1 1 1 1 1
masculino / male - 1 - 2 1
FAIXA ETÁRIAAgE gROUP
≤ 30 - 1 - - -
31-45 1 1 1 1 1
46+ 2 1 1 1 1
RENDA FAMILIARFAMilY inCOME
Até 3 Sm up to 3 mw 1 1 - 1 -
mais de 3 até 5 Sm more than 3 up to 5 mw 1 1 - 1 1
mais de 5 Sm more than 5 mw 1 1 1 1 1
RENDA PESSOALinDiViDUAl inCOME
Até 3 Sm up to 3 mw 1 1 1 1 -
mais de 3 até 5 Sm more than 3 up to 5 mw - 1 1 1 1
mais de 5 Sm more than 5 mw 2 2 2 1 1
REGIÃOREgiOn
Norte / Centro-oeste / North / Center-west 1 1 1 - -
Nordeste / Northeast - 1 - 1 -
Sudeste / Southeast 1 2 2 2 2
Sul / South 3 1 1 - -
DEPENDêNCIA ADMINISTRATIvAADMinisTRATiVE
JURisDiCTiOn
municipal / municipal 2 1 1 1 -
Estadual / State 1 1 1 1 1
SÉRIEgRADE
4a série / 5o ano do Ensino Fundamental4th grade / 5th year elementary education 2 2 2 1 -
8a série / 9o ano do Ensino Fundamental8th grade / 9th year elementary education 1 1 - 1 -
2o ano do Ensino médio2nd year of Secondary education 1 - - 1 2
COMPUTADOR INSTALADO
NO LABORATóRIO DE INFORMÁTICA
COMPUTER insTAllED AT iT lAb
Sim / yes 1 1 1 1 1
Não / No 1 1 1 2 1
INTERNET INSTALADA NO LABORATóRIO DE INFORMÁTICA
inTERnET AVAilAblE AT iT lAb
Sim / yes 1 1 1 - 1
Não / No 1 1 1 2 1
1 Base: 1.535 professores. Respostas múltiplas e estimuladas.1 base: 1,535 teachers. Multiple, stimulated answers.
A3 ÁREA DE FORMAÇÃO NA GRADUAÇÃO DOS PROFESSORES – ContinuaçãofIeld of uNdergraduate StudIeS of teaCherS – ContinuationPercentual sobre o total de professores¹ Percentage of the total number of teachers¹
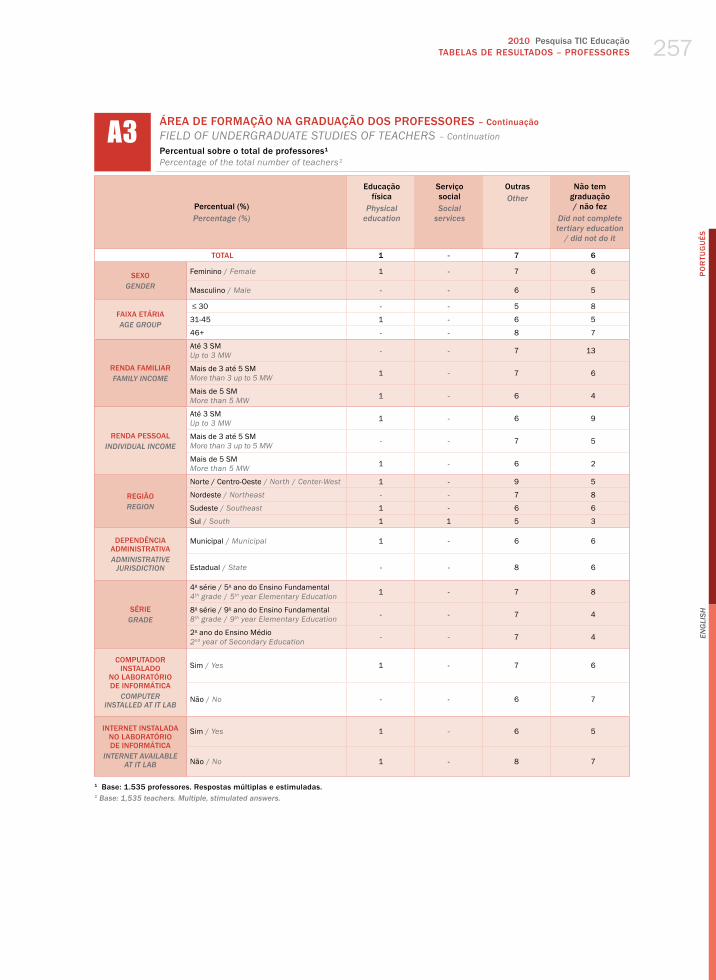
2010 Pesquisa TIC EducaçãoTABELAS DE RESuLTADOS – PROFESSORES
PO
RTu
Gu
ÊS
En
gli
sh
257
Percentual (%)Percentage (%)
Educação física
Physical education
Serviço socialsocial
services
OutrasOther
Não tem graduação / não fez
Did not complete tertiary education
/ did not do it
TOTAL 1 - 7 6
SEXOgEnDER
Feminino / female 1 - 7 6
masculino / male - - 6 5
FAIXA ETÁRIAAgE gROUP
≤ 30 - - 5 8
31-45 1 - 6 5
46+ - - 8 7
RENDA FAMILIARFAMilY inCOME
Até 3 Sm up to 3 mw - - 7 13
mais de 3 até 5 Sm more than 3 up to 5 mw 1 - 7 6
mais de 5 Sm more than 5 mw 1 - 6 4
RENDA PESSOALinDiViDUAl inCOME
Até 3 Sm up to 3 mw 1 - 6 9
mais de 3 até 5 Sm more than 3 up to 5 mw - - 7 5
mais de 5 Sm more than 5 mw 1 - 6 2
REGIÃOREgiOn
Norte / Centro-oeste / North / Center-west 1 - 9 5
Nordeste / Northeast - - 7 8
Sudeste / Southeast 1 - 6 6
Sul / South 1 1 5 3
DEPENDêNCIA ADMINISTRATIvAADMinisTRATiVE
JURisDiCTiOn
municipal / municipal 1 - 6 6
Estadual / State - - 8 6
SÉRIEgRADE
4a série / 5o ano do Ensino Fundamental4th grade / 5th year elementary education 1 - 7 8
8a série / 9o ano do Ensino Fundamental8th grade / 9th year elementary education - - 7 4
2o ano do Ensino médio2nd year of Secondary education - - 7 4
COMPUTADOR INSTALADO
NO LABORATóRIO DE INFORMÁTICA
COMPUTER insTAllED AT iT lAb
Sim / yes 1 - 7 6
Não / No - - 6 7
INTERNET INSTALADA NO LABORATóRIO DE INFORMÁTICA
inTERnET AVAilAblE AT iT lAb
Sim / yes 1 - 6 5
Não / No 1 - 8 7
1 Base: 1.535 professores. Respostas múltiplas e estimuladas.1 base: 1,535 teachers. Multiple, stimulated answers.
A3 ÁREA DE FORMAÇÃO NA GRADUAÇÃO DOS PROFESSORES – ContinuaçãofIeld of uNdergraduate StudIeS of teaCherS – ContinuationPercentual sobre o total de professores¹ Percentage of the total number of teachers¹

Survey on ICT Education 2010TABLES OF RESuLTS – TEACHERS
PO
RTu
Gu
ÊS
En
gli
sh
258
Percentual (%)Percentage (%)
SimYes
Nãono
TOTAL 73 27
SEXOgEnDER
Feminino / female 74 26
masculino / male 69 31
FAIXA ETÁRIAAgE gROUP
≤ 30 72 28
31-45 76 24
46+ 69 31
RENDA FAMILIARFAMilY inCOME
Até 3 Sm up to 3 mw 72 28
mais de 3 até 5 Sm more than 3 up to 5 mw 73 27
mais de 5 Sm more than 5 mw 74 26
RENDA PESSOALinDiViDUAl inCOME
Até 3 Sm up to 3 mw 71 29
mais de 3 até 5 Sm more than 3 up to 5 mw 74 26
mais de 5 Sm more than 5 mw 76 24
REGIÃOREgiOn
Norte / Centro-oeste / North / Center-west 77 23
Nordeste / Northeast 72 28
Sudeste / Southeast 70 30
Sul / South 79 21
DEPENDêNCIA ADMINISTRATIvAADMinisTRATiVE
JURisDiCTiOn
municipal / municipal 78 22
Estadual / State 68 32
SÉRIEgRADE
4a série / 5o ano do Ensino Fundamental4th grade / 5th year elementary education 74 26
8a série / 9o ano do Ensino Fundamental8th grade / 9th year elementary education 73 27
2o ano do Ensino médio2nd year of Secondary education 69 31
COMPUTADOR INSTALADO
NO LABORATóRIO DE INFORMÁTICA
COMPUTER insTAllED AT iT lAb
Sim / yes 73 27
Não / No 73 27
INTERNET INSTALADA NO LABORATóRIO DE INFORMÁTICA
inTERnET AVAilAblE AT iT lAb
Sim / yes 73 27
Não / No 74 26
1 Base: 1.535 professores. 1 base: 1,535 teachers.
A4 FORMAÇÃO CONTINUADA DOS PROFESSORESoNgoINg eduCatIoN of teaCherSPercentual sobre o total de professores¹ Percentage of the total number of teachers¹

2010 Pesquisa TIC EducaçãoTABELAS DE RESuLTADOS – PROFESSORES
PO
RTu
Gu
ÊS
En
gli
sh
259
Percentual (%)Percentage (%)
MédiaAverage
Até 5Up to 5
6-10 11-15 16-20 21+
TOTAL 15 14 20 18 21 27
SEXOgEnDER
Feminino / female 16 12 17 18 22 30
masculino / male 13 20 28 19 18 15
FAIXA ETÁRIAAgE gROUP
≤ 30 5 55 41 4 - -
31-45 14 9 21 28 27 16
46+ 23 2 6 9 21 62
RENDA FAMILIARFAMilY inCOME
Até 3 Sm up to 3 mw 13 23 20 16 17 23
mais de 3 até 5 Sm more than 3 up to 5 mw 15 16 22 18 20 23
mais de 5 Sm more than 5 mw 16 10 18 19 22 30
RENDA PESSOALinDiViDUAl inCOME
Até 3 Sm up to 3 mw 13 21 23 16 20 19
mais de 3 até 5 Sm more than 3 up to 5 mw 16 12 18 20 21 29
mais de 5 Sm more than 5 mw 18 5 16 20 23 36
REGIÃOREgiOn
Norte / Centro-oeste / North / Center-west 14 17 23 20 19 21
Nordeste / Northeast 14 16 25 17 19 23
Sudeste / Southeast 17 11 15 21 23 31
Sul / South 16 15 17 16 23 30
DEPENDêNCIA ADMINISTRATIvAADMinisTRATiVE
JURisDiCTiOn
municipal / municipal 15 14 23 18 22 23
Estadual / State 16 15 16 19 20 30
SÉRIEgRADE
4a série / 5o ano do Ensino Fundamental4th grade / 5th year elementary education 16 13 20 17 22 29
8a série / 9o ano do Ensino Fundamental8th grade / 9th year elementary education 15 16 21 18 21 24
2o ano do Ensino médio2nd year of Secondary education 15 14 20 20 20 26
COMPUTADOR INSTALADO
NO LABORATóRIO DE INFORMÁTICA
COMPUTER insTAllED AT iT lAb
Sim / yes 15 14 19 19 21 26
Não / No 16 13 21 17 22 28
INTERNET INSTALADA NO LABORATóRIO DE INFORMÁTICA
inTERnET AVAilAblE AT iT lAb
Sim / yes 15 14 19 19 21 27
Não / No 15 14 23 17 21 26
1 Base: 1.535 professores. 1 base: 1,535 teachers.
A5 ANOS DE EXPERIêNCIA COMO PROFESSORyearS of teaChINg eXPerIeNCePercentual sobre o total de professores¹ Percentage of the total number of teachers¹
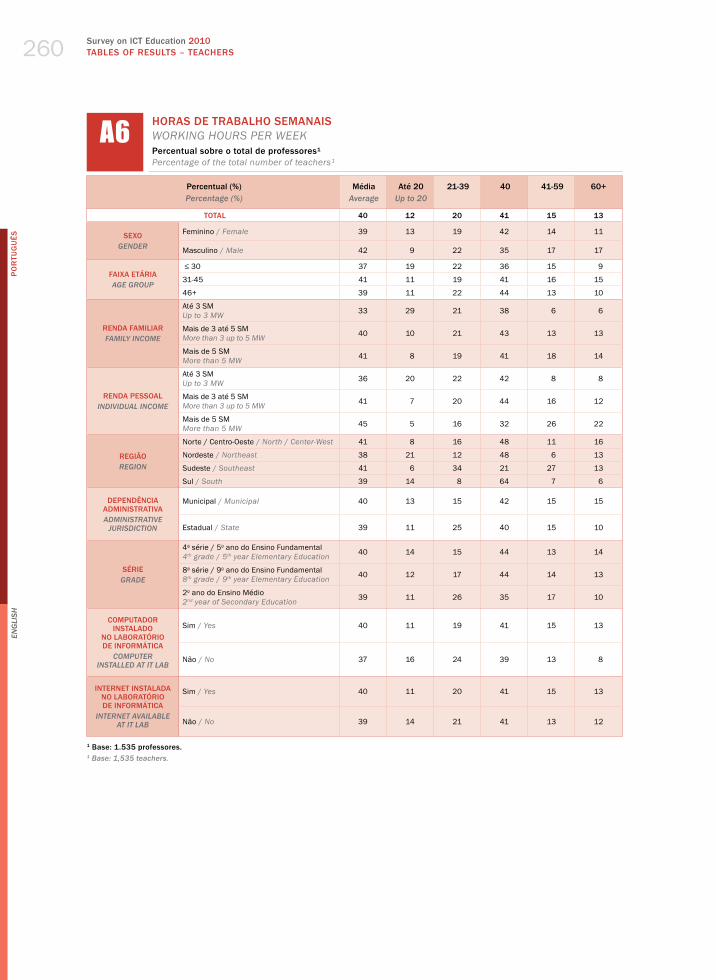
Survey on ICT Education 2010TABLES OF RESuLTS – TEACHERS
PO
RTu
Gu
ÊS
En
gli
sh
260
Percentual (%)Percentage (%)
MédiaAverage
Até 20Up to 20
21-39 40 41-59 60+
TOTAL 40 12 20 41 15 13
SEXOgEnDER
Feminino / female 39 13 19 42 14 11
masculino / male 42 9 22 35 17 17
FAIXA ETÁRIAAgE gROUP
≤ 30 37 19 22 36 15 9
31-45 41 11 19 41 16 15
46+ 39 11 22 44 13 10
RENDA FAMILIARFAMilY inCOME
Até 3 Sm up to 3 mw 33 29 21 38 6 6
mais de 3 até 5 Sm more than 3 up to 5 mw 40 10 21 43 13 13
mais de 5 Sm more than 5 mw 41 8 19 41 18 14
RENDA PESSOALinDiViDUAl inCOME
Até 3 Sm up to 3 mw 36 20 22 42 8 8
mais de 3 até 5 Sm more than 3 up to 5 mw 41 7 20 44 16 12
mais de 5 Sm more than 5 mw 45 5 16 32 26 22
REGIÃOREgiOn
Norte / Centro-oeste / North / Center-west 41 8 16 48 11 16
Nordeste / Northeast 38 21 12 48 6 13
Sudeste / Southeast 41 6 34 21 27 13
Sul / South 39 14 8 64 7 6
DEPENDêNCIA ADMINISTRATIvAADMinisTRATiVE
JURisDiCTiOn
municipal / municipal 40 13 15 42 15 15
Estadual / State 39 11 25 40 15 10
SÉRIEgRADE
4a série / 5o ano do Ensino Fundamental4th grade / 5th year elementary education 40 14 15 44 13 14
8a série / 9o ano do Ensino Fundamental8th grade / 9th year elementary education 40 12 17 44 14 13
2o ano do Ensino médio2nd year of Secondary education 39 11 26 35 17 10
COMPUTADOR INSTALADO
NO LABORATóRIO DE INFORMÁTICA
COMPUTER insTAllED AT iT lAb
Sim / yes 40 11 19 41 15 13
Não / No 37 16 24 39 13 8
INTERNET INSTALADA NO LABORATóRIO DE INFORMÁTICA
inTERnET AVAilAblE AT iT lAb
Sim / yes 40 11 20 41 15 13
Não / No 39 14 21 41 13 12
1 Base: 1.535 professores. 1 base: 1,535 teachers.
A6 HORAS DE TRABALHO SEMANAISworkINg hourS Per weekPercentual sobre o total de professores¹ Percentage of the total number of teachers¹

2010 Pesquisa TIC EducaçãoTABELAS DE RESuLTADOS – PROFESSORES
PO
RTu
Gu
ÊS
En
gli
sh
261
Percentual (%)Percentage (%)
Pública municipal
Municipal public
Pública estadual
state public
Pública federal
Federal public
ParticularPrivate
TOTAL 61 61 1 7
SEXOgEnDER
Feminino / female 62 59 1 6
masculino / male 56 69 1 12
FAIXA ETÁRIAAgE gROUP
≤ 30 60 57 1 13
31-45 65 59 1 7
46+ 53 67 1 5
RENDA FAMILIARFAMilY inCOME
Até 3 Sm up to 3 mw 73 40 - 2
mais de 3 até 5 Sm more than 3 up to 5 mw 62 60 1 6
mais de 5 Sm more than 5 mw 56 68 1 10
RENDA PESSOALinDiViDUAl inCOME
Até 3 Sm up to 3 mw 65 50 1 4
mais de 3 até 5 Sm more than 3 up to 5 mw 57 65 - 6
mais de 5 Sm more than 5 mw 57 75 1 15
REGIÃOREgiOn
Norte / Centro-oeste / North / Center-west 54 70 2 4
Nordeste / Northeast 71 51 1 6
Sudeste / Southeast 56 68 1 11
Sul / South 57 55 - 5
DEPENDêNCIA ADMINISTRATIvAADMinisTRATiVE
JURisDiCTiOn
municipal / municipal 99 27 - 6
Estadual / State 19 99 1 9
SÉRIEgRADE
4a série / 5o ano do Ensino Fundamental4th grade / 5th year elementary education 79 41 1 5
8a série / 9o ano do Ensino Fundamental8th grade / 9th year elementary education 74 54 1 6
2o ano do Ensino médio2nd year of Secondary education 22 96 2 11
COMPUTADOR INSTALADO
NO LABORATóRIO DE INFORMÁTICA
COMPUTER insTAllED AT iT lAb
Sim / yes 58 63 1 7
Não / No 70 55 1 8
INTERNET INSTALADA NO LABORATóRIO DE INFORMÁTICA
inTERnET AVAilAblE AT iT lAb
Sim / yes 55 66 1 7
Não / No 72 51 1 8
1 Base: 1.535 professores. Respostas múltiplas.1 base: 1,535 teachers. Multiple answers.
A7 REDES DE ENSINO EM QUE O PROFESSOR ATUAeduCatIoN SeCtorS IN whICh the teaCher workSPercentual sobre o total de professores¹ Percentage of the total number of teachers¹

Survey on ICT Education 2010TABLES OF RESuLTS – TEACHERS
PO
RTu
Gu
ÊS
En
gli
sh
262
Percentual (%)Percentage (%)
SimYes
Nãono
TOTAL 98 2
SEXOgEnDER
Feminino / female 98 2
masculino / male 99 1
FAIXA ETÁRIAAgE gROUP
≤ 30 100 -
31-45 98 2
46+ 97 3
RENDA FAMILIARFAMilY inCOME
Até 3 Sm up to 3 mw 93 7
mais de 3 até 5 Sm more than 3 up to 5 mw 99 1
mais de 5 Sm more than 5 mw 99 1
RENDA PESSOALinDiViDUAl inCOME
Até 3 Sm up to 3 mw 96 4
mais de 3 até 5 Sm more than 3 up to 5 mw 99 1
mais de 5 Sm more than 5 mw 100 -
REGIÃOREgiOn
Norte / Centro-oeste / North / Center-west 98 2
Nordeste / Northeast 95 5
Sudeste / Southeast 100 -
Sul / South 99 1
DEPENDêNCIA ADMINISTRATIvAADMinisTRATiVE
JURisDiCTiOn
municipal / municipal 97 3
Estadual / State 99 1
SÉRIEgRADE
4a série / 5o ano do Ensino Fundamental4th grade / 5th year elementary education 97 3
8a série / 9o ano do Ensino Fundamental8th grade / 9th year elementary education 98 2
2o ano do Ensino médio2nd year of Secondary education 99 1
COMPUTADOR INSTALADO
NO LABORATóRIO DE INFORMÁTICA
COMPUTER insTAllED AT iT lAb
Sim / yes 99 1
Não / No 96 4
INTERNET INSTALADA NO LABORATóRIO DE INFORMÁTICA
inTERnET AVAilAblE AT iT lAb
Sim / yes 99 1
Não / No 97 3
1 Base: 1.535 professores. 1 base: 1,535 teachers.
b1 PROPORÇÃO DE PROFESSORES QUE JÁ UTILIZARAM UM COMPUTADOR ProPortIoN of teaCherS who have uSed ComPuterS Percentual sobre o total de professores¹ Percentage of the total number of teachers¹

2010 Pesquisa TIC EducaçãoTABELAS DE RESuLTADOS – PROFESSORES
PO
RTu
Gu
ÊS
En
gli
sh
263
Percentual (%)Percentage (%)
SimYes
Nãono
TOTAL 97 3
SEXOgEnDER
Feminino / female 96 4
masculino / male 99 1
FAIXA ETÁRIAAgE gROUP
≤ 30 99 1
31-45 97 3
46+ 94 6
RENDA FAMILIARFAMilY inCOME
Até 3 Sm up to 3 mw 90 10
mais de 3 até 5 Sm more than 3 up to 5 mw 97 3
mais de 5 Sm more than 5 mw 98 2
RENDA PESSOALinDiViDUAl inCOME
Até 3 Sm up to 3 mw 93 7
mais de 3 até 5 Sm more than 3 up to 5 mw 99 1
mais de 5 Sm more than 5 mw 99 1
REGIÃOREgiOn
Norte / Centro-oeste / North / Center-west 96 4
Nordeste / Northeast 93 7
Sudeste / Southeast 99 1
Sul / South 98 2
DEPENDêNCIA ADMINISTRATIvAADMinisTRATiVE
JURisDiCTiOn
municipal / municipal 95 5
Estadual / State 98 2
SÉRIEgRADE
4a série / 5o ano do Ensino Fundamental4th grade / 5th year elementary education 95 5
8a série / 9o ano do Ensino Fundamental8th grade / 9th year elementary education 97 3
2o ano do Ensino médio2nd year of Secondary education 99 1
COMPUTADOR INSTALADO
NO LABORATóRIO DE INFORMÁTICA
COMPUTER insTAllED AT iT lAb
Sim / yes 97 3
Não / No 94 6
INTERNET INSTALADA NO LABORATóRIO DE INFORMÁTICA
inTERnET AVAilAblE AT iT lAb
Sim / yes 98 2
Não / No 94 6
1 Base: 1.535 professores. 1 base: 1,535 teachers.
b2 PROPORÇÃO DE PROFESSORES QUE JÁ UTILIZARAM A INTERNET ProPortIoN of teaCherS who have uSed the INterNet Percentual sobre o total de professores¹ Percentage of the total number of teachers¹
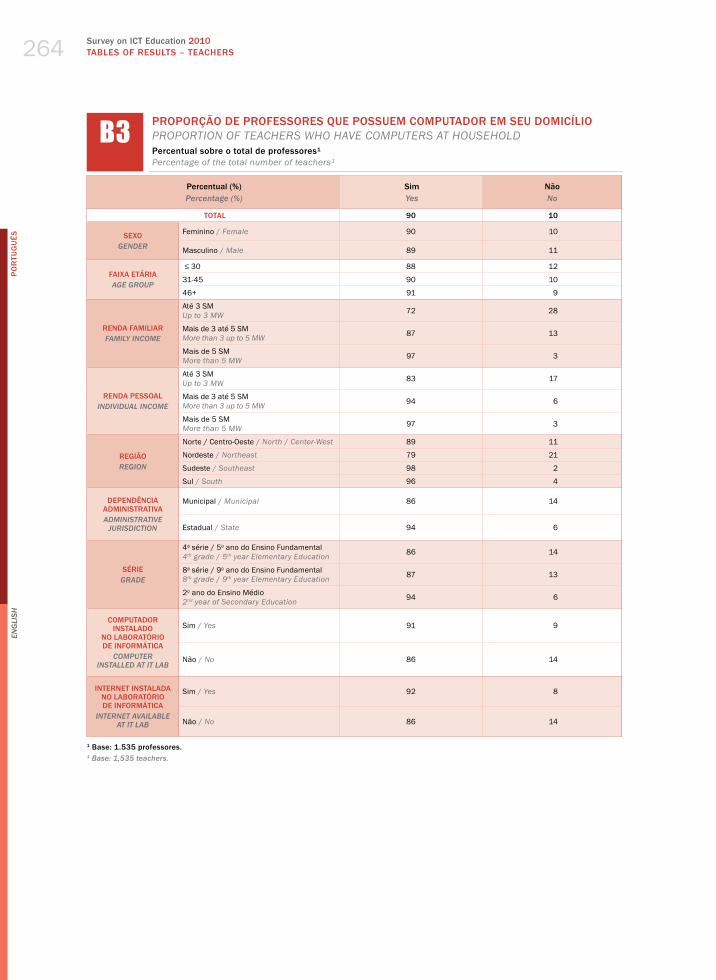
Survey on ICT Education 2010TABLES OF RESuLTS – TEACHERS
PO
RTu
Gu
ÊS
En
gli
sh
264
Percentual (%)Percentage (%)
SimYes
Nãono
TOTAL 90 10
SEXOgEnDER
Feminino / female 90 10
masculino / male 89 11
FAIXA ETÁRIAAgE gROUP
≤ 30 88 12
31-45 90 10
46+ 91 9
RENDA FAMILIARFAMilY inCOME
Até 3 Sm up to 3 mw 72 28
mais de 3 até 5 Sm more than 3 up to 5 mw 87 13
mais de 5 Sm more than 5 mw 97 3
RENDA PESSOALinDiViDUAl inCOME
Até 3 Sm up to 3 mw 83 17
mais de 3 até 5 Sm more than 3 up to 5 mw 94 6
mais de 5 Sm more than 5 mw 97 3
REGIÃOREgiOn
Norte / Centro-oeste / North / Center-west 89 11
Nordeste / Northeast 79 21
Sudeste / Southeast 98 2
Sul / South 96 4
DEPENDêNCIA ADMINISTRATIvAADMinisTRATiVE
JURisDiCTiOn
municipal / municipal 86 14
Estadual / State 94 6
SÉRIEgRADE
4a série / 5o ano do Ensino Fundamental4th grade / 5th year elementary education 86 14
8a série / 9o ano do Ensino Fundamental8th grade / 9th year elementary education 87 13
2o ano do Ensino médio2nd year of Secondary education 94 6
COMPUTADOR INSTALADO
NO LABORATóRIO DE INFORMÁTICA
COMPUTER insTAllED AT iT lAb
Sim / yes 91 9
Não / No 86 14
INTERNET INSTALADA NO LABORATóRIO DE INFORMÁTICA
inTERnET AVAilAblE AT iT lAb
Sim / yes 92 8
Não / No 86 14
1 Base: 1.535 professores. 1 base: 1,535 teachers.
b3 PROPORÇÃO DE PROFESSORES QUE POSSUEM COMPUTADOR EM SEU DOMICÍLIO ProPortIoN of teaCherS who have ComPuterS at houSehold Percentual sobre o total de professores¹ Percentage of the total number of teachers¹

2010 Pesquisa TIC EducaçãoTABELAS DE RESuLTADOS – PROFESSORES
PO
RTu
Gu
ÊS
En
gli
sh
265
Percentual (%)Percentage (%)
Somente computador
de mesaDesktop
only
Computador de mesa e
computador portátilDesktop and
portable computer
Somente computador
portátilPortable
computer only
TOTAL 52 34 14
SEXOgEnDER
Feminino / female 53 34 13
masculino / male 48 35 17
FAIXA ETÁRIAAgE gROUP
≤ 30 50 32 18
31-45 53 33 14
46+ 51 38 11
RENDA FAMILIARFAMilY inCOME
Até 3 Sm up to 3 mw 69 18 13
mais de 3 até 5 Sm more than 3 up to 5 mw 59 24 17
mais de 5 Sm more than 5 mw 45 42 13
RENDA PESSOALinDiViDUAl inCOME
Até 3 Sm up to 3 mw 60 27 13
mais de 3 até 5 Sm more than 3 up to 5 mw 52 35 13
mais de 5 Sm more than 5 mw 37 46 17
REGIÃOREgiOn
Norte / Centro-oeste / North / Center-west 52 29 18
Nordeste / Northeast 63 24 13
Sudeste / Southeast 44 42 14
Sul / South 51 38 11
DEPENDêNCIA ADMINISTRATIvAADMinisTRATiVE
JURisDiCTiOn
municipal / municipal 56 31 13
Estadual / State 47 37 16
SÉRIEgRADE
4a série / 5o ano do Ensino Fundamental4th grade / 5th year elementary education 56 32 13
8a série / 9o ano do Ensino Fundamental8th grade / 9th year elementary education 55 31 14
2o ano do Ensino médio2nd year of Secondary education 45 39 17
COMPUTADOR INSTALADO
NO LABORATóRIO DE INFORMÁTICA
COMPUTER insTAllED AT iT lAb
Sim / yes 50 34 15
Não / No 59 34 7
INTERNET INSTALADA NO LABORATóRIO DE INFORMÁTICA
inTERnET AVAilAblE AT iT lAb
Sim / yes 50 36 15
Não / No 57 30 13
1 Base: 1.382 professores que possuem computador em casa. Respostas estimuladas.1 base: 1,382 teachers who have computers at home. stimulated answers.
b4 TIPO DE COMPUTADOR EXISTENTE NO DOMICÍLIO DO PROFESSORtyPe of ComPuter IN the teaCher’S houSeholdPercentual sobre o total de professores que possuem computador em casa¹ Percentage of the total number of teachers who have computers at home¹
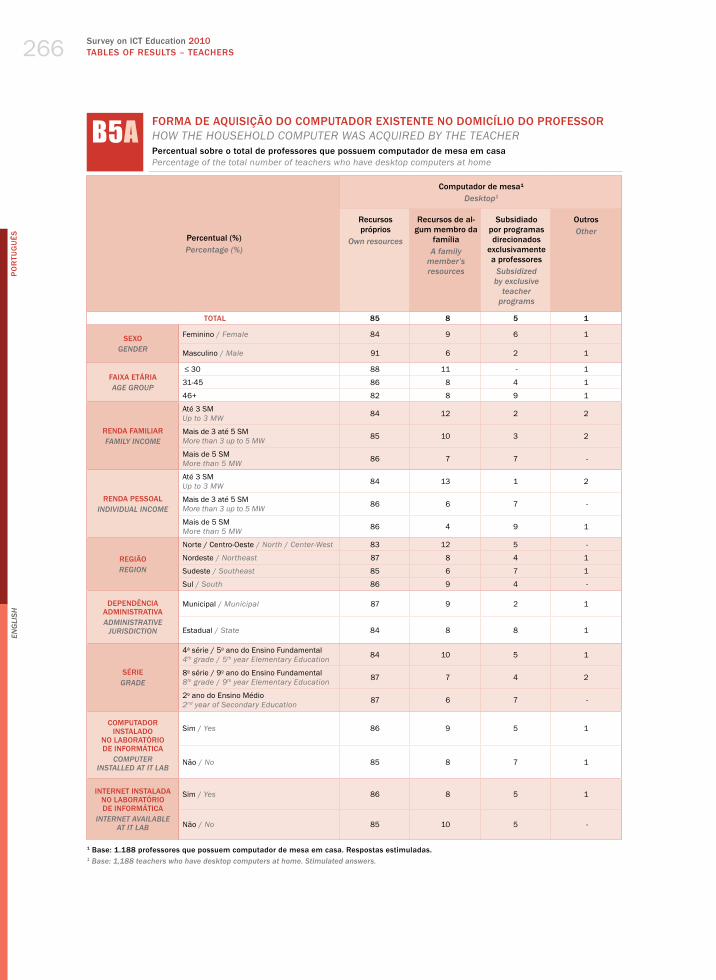
Survey on ICT Education 2010TABLES OF RESuLTS – TEACHERS
PO
RTu
Gu
ÊS
En
gli
sh
266
Percentual (%)Percentage (%)
Computador de mesa¹Desktop1
Recursos próprios
Own resources
Recursos de al-gum membro da
família A family
member’s resources
Subsidiado por programas direcionados
exclusivamente a professores
subsidized by exclusive
teacher programs
OutrosOther
TOTAL 85 8 5 1
SEXOgEnDER
Feminino / female 84 9 6 1
masculino / male 91 6 2 1
FAIXA ETÁRIAAgE gROUP
≤ 30 88 11 - 1
31-45 86 8 4 1
46+ 82 8 9 1
RENDA FAMILIARFAMilY inCOME
Até 3 Sm up to 3 mw 84 12 2 2
mais de 3 até 5 Sm more than 3 up to 5 mw 85 10 3 2
mais de 5 Sm more than 5 mw 86 7 7 -
RENDA PESSOALinDiViDUAl inCOME
Até 3 Sm up to 3 mw 84 13 1 2
mais de 3 até 5 Sm more than 3 up to 5 mw 86 6 7 -
mais de 5 Sm more than 5 mw 86 4 9 1
REGIÃOREgiOn
Norte / Centro-oeste / North / Center-west 83 12 5 -
Nordeste / Northeast 87 8 4 1
Sudeste / Southeast 85 6 7 1
Sul / South 86 9 4 -
DEPENDêNCIA ADMINISTRATIvAADMinisTRATiVE
JURisDiCTiOn
municipal / municipal 87 9 2 1
Estadual / State 84 8 8 1
SÉRIEgRADE
4a série / 5o ano do Ensino Fundamental4th grade / 5th year elementary education 84 10 5 1
8a série / 9o ano do Ensino Fundamental8th grade / 9th year elementary education 87 7 4 2
2o ano do Ensino médio2nd year of Secondary education 87 6 7 -
COMPUTADOR INSTALADO
NO LABORATóRIO DE INFORMÁTICA
COMPUTER insTAllED AT iT lAb
Sim / yes 86 9 5 1
Não / No 85 8 7 1
INTERNET INSTALADA NO LABORATóRIO DE INFORMÁTICA
inTERnET AVAilAblE AT iT lAb
Sim / yes 86 8 5 1
Não / No 85 10 5 -
1 Base: 1.188 professores que possuem computador de mesa em casa. Respostas estimuladas.1 base: 1,188 teachers who have desktop computers at home. stimulated answers.
b5A FORMA DE AQUISIÇÃO DO COMPUTADOR EXISTENTE NO DOMICÍLIO DO PROFESSORhow the houSehold ComPuter waS aCQuIred By the teaCherPercentual sobre o total de professores que possuem computador de mesa em casaPercentage of the total number of teachers who have desktop computers at home

2010 Pesquisa TIC EducaçãoTABELAS DE RESuLTADOS – PROFESSORES
PO
RTu
Gu
ÊS
En
gli
sh
267
Percentual (%)Percentage (%)
Computador portátil (notebook, laptop, netbook) 1
Portable computer (notebook, laptop, netbook) 1
Recursos próprios
Own resources
Recursos de algum membro
da famíliaA family
member’s resources
Subsidiado por programas direcionados
exclusivamente a professoressubsidized by exclusive tea-
cher programs
OutrosOther
TOTAL 65 7 26 1
SEXOgEnDER
Feminino / female 64 9 26 1
masculino / male 70 1 28 1
FAIXA ETÁRIAAgE gROUP
≤ 30 73 6 20 1
31-45 68 7 23 1
46+ 56 8 35 1
RENDA FAMILIARFAMilY inCOME
Até 3 Sm up to 3 mw 69 3 26 2
mais de 3 até 5 Sm more than 3 up to 5 mw 69 6 23 1
mais de 5 Sm more than 5 mw 65 8 26 1
RENDA PESSOALinDiViDUAl inCOME
Até 3 Sm up to 3 mw 73 11 15 1
mais de 3 até 5 Sm more than 3 up to 5 mw 64 6 30 1
mais de 5 Sm more than 5 mw 60 6 33 1
REGIÃOREgiOn
Norte / Centro-oeste / North / Center-west 59 11 28 1
Nordeste / Northeast 76 4 19 1
Sudeste / Southeast 56 6 38 1
Sul / South 86 11 2 1
DEPENDêNCIA ADMINISTRATIvAADMinisTRATiVE
JURisDiCTiOn
municipal / municipal 75 7 16 2
Estadual / State 57 8 35 -
SÉRIEgRADE
4a série / 5o ano do Ensino Fundamental4th grade / 5th year elementary education 67 10 21 2
8a série / 9o ano do Ensino Fundamental8th grade / 9th year elementary education 70 7 22 1
2o ano do Ensino médio2nd year of Secondary education 59 4 36 -
COMPUTADOR INSTALADO
NO LABORATóRIO DE INFORMÁTICA
COMPUTER insTAllED AT iT lAb
Sim / yes 67 8 24 1
Não / No 55 4 39 1
INTERNET INSTALADA NO LABORATóRIO DE INFORMÁTICA
inTERnET AVAilAblE AT iT lAb
Sim / yes 67 8 24 1
Não / No 59 6 35 1
1 Base: 667 professores que possuem computador portátil em casa. Respostas estimuladas.1 base: 667 teachers who have portable computers at home. stimulated answers.
b5b FORMA DE AQUISIÇÃO DO COMPUTADOR EXISTENTE NO DOMICÍLIO DO PROFESSOR – Continuaçãohow the houSehold ComPuter waS aCQuIred By the teaCher – ContinuationPercentual sobre o total de professores que possuem computador portátil em casaPercentage of the total number of teachers who have portable computers at household

Survey on ICT Education 2010TABLES OF RESuLTS – TEACHERS
PO
RTu
Gu
ÊS
En
gli
sh
268
Percentual (%)Percentage (%)
SimYes
Nãono
TOTAL 41 59
SEXOgEnDER
Feminino / female 37 63
masculino / male 54 46
FAIXA ETÁRIAAgE gROUP
≤ 30 51 49
31-45 45 55
46+ 30 70
RENDA FAMILIARFAMilY inCOME
Até 3 Sm up to 3 mw 38 62
mais de 3 até 5 Sm more than 3 up to 5 mw 39 61
mais de 5 Sm more than 5 mw 42 58
RENDA PESSOALinDiViDUAl inCOME
Até 3 Sm up to 3 mw 35 65
mais de 3 até 5 Sm more than 3 up to 5 mw 42 58
mais de 5 Sm more than 5 mw 46 54
REGIÃOREgiOn
Norte / Centro-oeste / North / Center-west 63 38
Nordeste / Northeast 40 60
Sudeste / Southeast 33 67
Sul / South 42 58
DEPENDêNCIA ADMINISTRATIvAADMinisTRATiVE
JURisDiCTiOn
municipal / municipal 40 60
Estadual / State 42 58
SÉRIEgRADE
4a série / 5o ano do Ensino Fundamental4th grade / 5th year elementary education 40 60
8a série / 9o ano do Ensino Fundamental8th grade / 9th year elementary education 40 60
2o ano do Ensino médio2nd year of Secondary education 45 55
COMPUTADOR INSTALADO
NO LABORATóRIO DE INFORMÁTICA
COMPUTER insTAllED AT iT lAb
Sim / yes 41 59
Não / No 42 58
INTERNET INSTALADA NO LABORATóRIO DE INFORMÁTICA
inTERnET AVAilAblE AT iT lAb
Sim / yes 39 61
Não / No 47 53
1 Base: 667 professores que possuem computador portátil em casa. 1 base: 667 teachers who have portable computers at home.
b6 DESLOCAMENTO DO COMPUTADOR PORTÁTIL DO PROFESSOR À ESCOLA takINg the teaCher’S PortaBle ComPuter to SChool Percentual sobre o total de professores que possuem computador portátil em casa ¹ Percentage of the total number of teachers who have portable computers at home ¹

2010 Pesquisa TIC EducaçãoTABELAS DE RESuLTADOS – PROFESSORES
PO
RTu
Gu
ÊS
En
gli
sh
269
Percentual (%)Percentage (%)
SimYes
Nãono
Não sabeDoes not know
TOTAL 81 18 -
SEXOgEnDER
Feminino / female 82 17 -
masculino / male 77 23 -
FAIXA ETÁRIAAgE gROUP
≤ 30 76 24 -
31-45 81 18 1
46+ 84 15 -
RENDA FAMILIARFAMilY inCOME
Até 3 Sm up to 3 mw 59 40 1
mais de 3 até 5 Sm more than 3 up to 5 mw 75 24 1
mais de 5 Sm more than 5 mw 91 9 -
RENDA PESSOALinDiViDUAl inCOME
Até 3 Sm up to 3 mw 72 27 1
mais de 3 até 5 Sm more than 3 up to 5 mw 85 15 -
mais de 5 Sm more than 5 mw 92 8 -
REGIÃOREgiOn
Norte / Centro-oeste / North / Center-west 73 27 1
Nordeste / Northeast 68 31 1
Sudeste / Southeast 94 6 -
Sul / South 88 11 -
DEPENDêNCIA ADMINISTRATIvAADMinisTRATiVE
JURisDiCTiOn
municipal / municipal 78 22 1
Estadual / State 85 15 -
SÉRIEgRADE
4a série / 5o ano do Ensino Fundamental4th grade / 5th year elementary education 78 22 1
8a série / 9o ano do Ensino Fundamental8th grade / 9th year elementary education 78 21 1
2o ano do Ensino médio2nd year of Secondary education 86 14 -
COMPUTADOR INSTALADO
NO LABORATóRIO DE INFORMÁTICA
COMPUTER insTAllED AT iT lAb
Sim / yes 82 18 -
Não / No 77 22 1
INTERNET INSTALADA NO LABORATóRIO DE INFORMÁTICA
inTERnET AVAilAblE AT iT lAb
Sim / yes 84 16 -
Não / No 75 23 1
1 Base: 1.535 professores. 1 base: 1,535 teachers.
b7 PROPORÇÃO DE PROFESSORES COM ACESSO À INTERNET NO DOMICÍLIOProPortIoN of teaCherS who have INterNet aCCeSS at homePercentual sobre o total de professores¹ Percentage of the total number of teachers¹
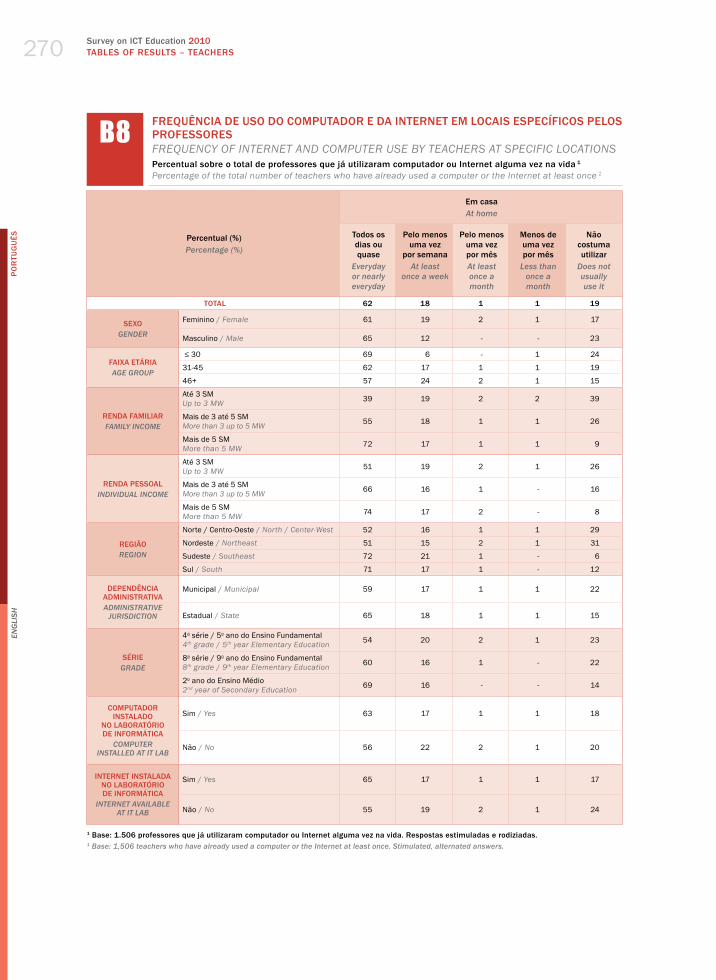
Survey on ICT Education 2010TABLES OF RESuLTS – TEACHERS
PO
RTu
Gu
ÊS
En
gli
sh
270
Percentual (%)Percentage (%)
Em casaAt home
Todos os dias ou quase
Everyday or nearly everyday
Pelo menos uma vez
por semanaAt least
once a week
Pelo menos uma vez por mêsAt least once a month
Menos de uma vez por mês
less than once a month
Não costuma utilizar
Does not usually use it
TOTAL 62 18 1 1 19
SEXOgEnDER
Feminino / female 61 19 2 1 17
masculino / male 65 12 - - 23
FAIXA ETÁRIAAgE gROUP
≤ 30 69 6 - 1 24
31-45 62 17 1 1 19
46+ 57 24 2 1 15
RENDA FAMILIARFAMilY inCOME
Até 3 Sm up to 3 mw 39 19 2 2 39
mais de 3 até 5 Sm more than 3 up to 5 mw 55 18 1 1 26
mais de 5 Sm more than 5 mw 72 17 1 1 9
RENDA PESSOALinDiViDUAl inCOME
Até 3 Sm up to 3 mw 51 19 2 1 26
mais de 3 até 5 Sm more than 3 up to 5 mw 66 16 1 - 16
mais de 5 Sm more than 5 mw 74 17 2 - 8
REGIÃOREgiOn
Norte / Centro-oeste / North / Center-west 52 16 1 1 29
Nordeste / Northeast 51 15 2 1 31
Sudeste / Southeast 72 21 1 - 6
Sul / South 71 17 1 - 12
DEPENDêNCIA ADMINISTRATIvAADMinisTRATiVE
JURisDiCTiOn
municipal / municipal 59 17 1 1 22
Estadual / State 65 18 1 1 15
SÉRIEgRADE
4a série / 5o ano do Ensino Fundamental4th grade / 5th year elementary education 54 20 2 1 23
8a série / 9o ano do Ensino Fundamental8th grade / 9th year elementary education 60 16 1 - 22
2o ano do Ensino médio2nd year of Secondary education 69 16 - - 14
COMPUTADOR INSTALADO
NO LABORATóRIO DE INFORMÁTICA
COMPUTER insTAllED AT iT lAb
Sim / yes 63 17 1 1 18
Não / No 56 22 2 1 20
INTERNET INSTALADA NO LABORATóRIO DE INFORMÁTICA
inTERnET AVAilAblE AT iT lAb
Sim / yes 65 17 1 1 17
Não / No 55 19 2 1 24
1 Base: 1.506 professores que já utilizaram computador ou Internet alguma vez na vida. Respostas estimuladas e rodiziadas.1 base: 1,506 teachers who have already used a computer or the internet at least once. stimulated, alternated answers.
b8 FREQUêNCIA DE USO DO COMPUTADOR E DA INTERNET EM LOCAIS ESPECÍFICOS PELOS PROFESSORESfreQueNCy of INterNet aNd ComPuter uSe By teaCherS at SPeCIfIC loCatIoNS Percentual sobre o total de professores que já utilizaram computador ou Internet alguma vez na vida 1Percentage of the total number of teachers who have already used a computer or the Internet at least once 1

2010 Pesquisa TIC EducaçãoTABELAS DE RESuLTADOS – PROFESSORES
PO
RTu
Gu
ÊS
En
gli
sh
271
Percentual (%)Percentage (%)
Na escolaAt school
Todos os dias ou quase Everyday or nearly everyday
Pelo menos uma vez
por semanaAt least
once a week
Pelo menos uma vez por mêsAt least once a month
Menos de uma vez por mês
less than once a month
Não costuma utilizar
Does not usually use it
TOTAL 20 34 13 7 26
SEXOgEnDER
Feminino / female 18 33 13 7 28
masculino / male 25 37 11 6 22
FAIXA ETÁRIAAgE gROUP
≤ 30 25 36 11 5 23
31-45 20 36 14 8 23
46+ 16 30 12 7 35
RENDA FAMILIARFAMilY inCOME
Até 3 Sm up to 3 mw 15 26 13 9 38
mais de 3 até 5 Sm more than 3 up to 5 mw 19 33 12 6 31
mais de 5 Sm more than 5 mw 21 37 14 8 20
RENDA PESSOALinDiViDUAl inCOME
Até 3 Sm up to 3 mw 17 30 15 7 32
mais de 3 até 5 Sm more than 3 up to 5 mw 20 37 13 7 23
mais de 5 Sm more than 5 mw 24 38 10 8 20
REGIÃOREgiOn
Norte / Centro-oeste / North / Center-west 23 34 11 6 26
Nordeste / Northeast 15 24 12 8 40
Sudeste / Southeast 21 40 12 8 20
Sul / South 19 40 19 5 17
DEPENDêNCIA ADMINISTRATIvAADMinisTRATiVE
JURisDiCTiOn
municipal / municipal 16 31 11 8 34
Estadual / State 23 37 14 7 19
SÉRIEgRADE
4a série / 5o ano do Ensino Fundamental4th grade / 5th year elementary education 17 32 11 7 33
8a série / 9o ano do Ensino Fundamental8th grade / 9th year elementary education 18 34 13 8 28
2o ano do Ensino médio2nd year of Secondary education 24 36 14 8 17
COMPUTADOR INSTALADO
NO LABORATóRIO DE INFORMÁTICA
COMPUTER insTAllED AT iT lAb
Sim / yes 21 36 14 7 22
Não / No 14 24 7 9 45
INTERNET INSTALADA NO LABORATóRIO DE INFORMÁTICA
inTERnET AVAilAblE AT iT lAb
Sim / yes 22 38 15 7 18
Não / No 15 26 7 7 45
1 Base: 1.506 professores que já utilizaram computador ou Internet alguma vez na vida. Respostas estimuladas e rodiziadas.1 base: 1,506 teachers who have already used a computer or the internet at least once. stimulated, alternated answers.
b8 FREQUêNCIA DE USO DO COMPUTADOR E DA INTERNET EM LOCAIS ESPECÍFICOS PELOS PROFESSORES – ContinuaçãofreQueNCy of INterNet aNd ComPuter uSe By teaCherS at SPeCIfIC loCatIoNS – ContinuationPercentual sobre o total de professores que já utilizaram computador ou Internet alguma vez na vida 1Percentage of the total number of teachers who have already used a computer or the Internet at least once 1

Survey on ICT Education 2010TABLES OF RESuLTS – TEACHERS
PO
RTu
Gu
ÊS
En
gli
sh
272
Percentual (%)Percentage (%)
Em algum outro estabelecimento de ensino (faculdade, curso, etc.)At any other educational institution (university, courses, etc.)
Todos os dias ou quaseEveryday or nearly everyday
Pelo menos uma vez
por semanaAt least
once a week
Pelo menos uma vez por mêsAt least once a month
Menos de uma vez por mês
less than once a month
Não costuma utilizar
Does not usually use it
TOTAL 7 10 3 2 78
SEXOgEnDER
Feminino / female 6 9 3 2 81
masculino / male 10 11 4 3 72
FAIXA ETÁRIAAgE gROUP
≤ 30 10 12 6 5 67
31-45 7 10 2 2 79
46+ 5 7 3 1 84
RENDA FAMILIARFAMilY inCOME
Até 3 Sm up to 3 mw 5 10 3 3 80
mais de 3 até 5 Sm more than 3 up to 5 mw 6 9 4 1 80
mais de 5 Sm more than 5 mw 8 10 3 2 77
RENDA PESSOALinDiViDUAl inCOME
Até 3 Sm up to 3 mw 6 8 3 2 81
mais de 3 até 5 Sm more than 3 up to 5 mw 5 11 2 2 80
mais de 5 Sm more than 5 mw 11 12 4 1 72
REGIÃOREgiOn
Norte / Centro-oeste / North / Center-west 3 11 3 2 81
Nordeste / Northeast 7 8 4 3 79
Sudeste / Southeast 9 11 3 2 75
Sul / South 6 9 2 0 83
DEPENDêNCIA ADMINISTRATIvAADMinisTRATiVE
JURisDiCTiOn
municipal / municipal 6 10 3 3 79
Estadual / State 8 10 3 1 78
SÉRIEgRADE
4a série / 5o ano do Ensino Fundamental4th grade / 5th year elementary education 5 9 3 2 81
8a série / 9o ano do Ensino Fundamental8th grade / 9th year elementary education 7 10 4 2 78
2o ano do Ensino médio2nd year of Secondary education 10 10 3 1 76
COMPUTADOR INSTALADO
NO LABORATóRIO DE INFORMÁTICA
COMPUTER insTAllED AT iT lAb
Sim / yes 7 10 3 2 79
Não / No 8 11 2 2 76
INTERNET INSTALADA NO LABORATóRIO DE INFORMÁTICA
inTERnET AVAilAblE AT iT lAb
Sim / yes 7 10 3 2 78
Não / No 7 10 3 2 78
1 Base: 1.506 professores que já utilizaram computador ou Internet alguma vez na vida. Respostas estimuladas e rodiziadas.1 base: 1,506 teachers who have already used a computer or the internet at least once. stimulated, alternated answers.
b8 FREQUêNCIA DE USO DO COMPUTADOR E DA INTERNET EM LOCAIS ESPECÍFICOS PELOS PROFESSORES – ContinuaçãofreQueNCy of INterNet aNd ComPuter uSe By teaCherS at SPeCIfIC loCatIoNS – ContinuationPercentual sobre o total de professores que já utilizaram computador ou Internet alguma vez na vida 1Percentage of the total number of teachers who have already used a computer or the Internet at least once 1
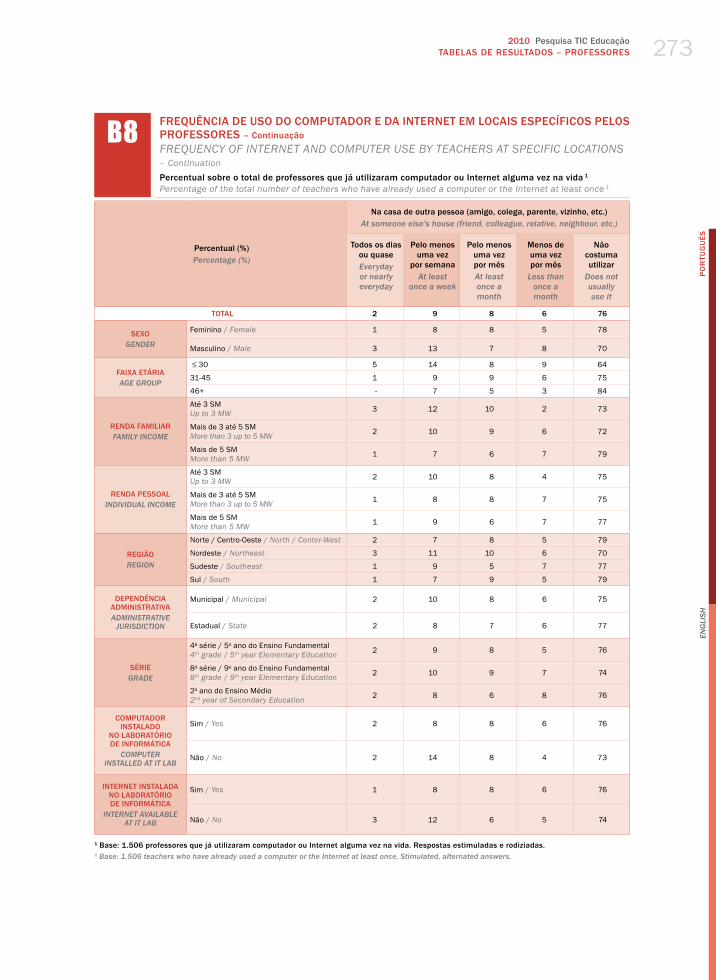
2010 Pesquisa TIC EducaçãoTABELAS DE RESuLTADOS – PROFESSORES
PO
RTu
Gu
ÊS
En
gli
sh
273
Percentual (%)Percentage (%)
Na casa de outra pessoa (amigo, colega, parente, vizinho, etc.)At someone else's house (friend, colleague, relative, neighbour, etc.)
Todos os dias ou quase Everyday or nearly everyday
Pelo menos uma vez
por semanaAt least
once a week
Pelo menos uma vez por mêsAt least once a month
Menos de uma vez por mês
less than once a month
Não costuma utilizar
Does not usually use it
TOTAL 2 9 8 6 76
SEXOgEnDER
Feminino / female 1 8 8 5 78
masculino / male 3 13 7 8 70
FAIXA ETÁRIAAgE gROUP
≤ 30 5 14 8 9 64
31-45 1 9 9 6 75
46+ - 7 5 3 84
RENDA FAMILIARFAMilY inCOME
Até 3 Sm up to 3 mw 3 12 10 2 73
mais de 3 até 5 Sm more than 3 up to 5 mw 2 10 9 6 72
mais de 5 Sm more than 5 mw 1 7 6 7 79
RENDA PESSOALinDiViDUAl inCOME
Até 3 Sm up to 3 mw 2 10 8 4 75
mais de 3 até 5 Sm more than 3 up to 5 mw 1 8 8 7 75
mais de 5 Sm more than 5 mw 1 9 6 7 77
REGIÃOREgiOn
Norte / Centro-oeste / North / Center-west 2 7 8 5 79
Nordeste / Northeast 3 11 10 6 70
Sudeste / Southeast 1 9 5 7 77
Sul / South 1 7 9 5 79
DEPENDêNCIA ADMINISTRATIvAADMinisTRATiVE
JURisDiCTiOn
municipal / municipal 2 10 8 6 75
Estadual / State 2 8 7 6 77
SÉRIEgRADE
4a série / 5o ano do Ensino Fundamental4th grade / 5th year elementary education 2 9 8 5 76
8a série / 9o ano do Ensino Fundamental8th grade / 9th year elementary education 2 10 9 7 74
2o ano do Ensino médio2nd year of Secondary education 2 8 6 8 76
COMPUTADOR INSTALADO
NO LABORATóRIO DE INFORMÁTICA
COMPUTER insTAllED AT iT lAb
Sim / yes 2 8 8 6 76
Não / No 2 14 8 4 73
INTERNET INSTALADA NO LABORATóRIO DE INFORMÁTICA
inTERnET AVAilAblE AT iT lAb
Sim / yes 1 8 8 6 76
Não / No 3 12 6 5 74
1 Base: 1.506 professores que já utilizaram computador ou Internet alguma vez na vida. Respostas estimuladas e rodiziadas.1 base: 1,506 teachers who have already used a computer or the internet at least once. stimulated, alternated answers.
b8 FREQUêNCIA DE USO DO COMPUTADOR E DA INTERNET EM LOCAIS ESPECÍFICOS PELOS PROFESSORES – ContinuaçãofreQueNCy of INterNet aNd ComPuter uSe By teaCherS at SPeCIfIC loCatIoNS – ContinuationPercentual sobre o total de professores que já utilizaram computador ou Internet alguma vez na vida 1Percentage of the total number of teachers who have already used a computer or the Internet at least once 1

Survey on ICT Education 2010TABLES OF RESuLTS – TEACHERS
PO
RTu
Gu
ÊS
En
gli
sh
274
Percentual (%)Percentage (%)
Local público de acesso gratuito (biblioteca externa à escola, centro comunitário, correios, Sesc, etc.)
At a free public internet access center (such as libraries outside the school, community centers, post offices, sesc, etc.)
Todos os dias ou quase Everyday or nearly everyday
Pelo menos uma vez
por semanaAt least
once a week
Pelo menos uma vez por mêsAt least once a month
Menos de uma vez por mês
less than once a month
Não costuma utilizar
Does not usually use it
TOTAL 2 4 3 3 89
SEXOgEnDER
Feminino / female 1 3 3 3 90
masculino / male 2 8 4 3 84
FAIXA ETÁRIAAgE gROUP
≤ 30 4 5 4 3 84
31-45 2 4 3 3 89
46+ 1 3 3 3 90
RENDA FAMILIARFAMilY inCOME
Até 3 Sm up to 3 mw 2 5 4 3 85
mais de 3 até 5 Sm more than 3 up to 5 mw 1 4 3 2 90
mais de 5 Sm more than 5 mw 1 3 3 4 89
RENDA PESSOALinDiViDUAl inCOME
Até 3 Sm up to 3 mw 2 4 3 2 89
mais de 3 até 5 Sm more than 3 up to 5 mw 2 3 3 3 89
mais de 5 Sm more than 5 mw 1 4 3 5 88
REGIÃOREgiOn
Norte / Centro-oeste / North / Center-west 1 6 3 3 87
Nordeste / Northeast 3 5 3 3 87
Sudeste / Southeast 1 3 3 4 89
Sul / South - 1 4 2 92
DEPENDêNCIA ADMINISTRATIvAADMinisTRATiVE
JURisDiCTiOn
municipal / municipal 1 4 4 4 87
Estadual / State 2 4 3 2 90
SÉRIEgRADE
4a série / 5o ano do Ensino Fundamental4th grade / 5th year elementary education 2 4 3 2 90
8a série / 9o ano do Ensino Fundamental8th grade / 9th year elementary education 1 4 3 4 88
2o ano do Ensino médio2nd year of Secondary education 2 4 3 3 87
COMPUTADOR INSTALADO
NO LABORATóRIO DE INFORMÁTICA
COMPUTER insTAllED AT iT lAb
Sim / yes 1 4 3 3 89
Não / No 3 4 4 3 87
INTERNET INSTALADA NO LABORATóRIO DE INFORMÁTICA
inTERnET AVAilAblE AT iT lAb
Sim / yes 1 3 3 3 89
Não / No 2 4 3 3 88
1 Base: 1.506 professores que já utilizaram computador ou Internet alguma vez na vida. Respostas estimuladas e rodiziadas.1 base: 1,506 teachers who have already used a computer or the internet at least once. stimulated, alternated answers.
b8 FREQUêNCIA DE USO DO COMPUTADOR E DA INTERNET EM LOCAIS ESPECÍFICOS PELOS PROFESSORES – ContinuaçãofreQueNCy of INterNet aNd ComPuter uSe By teaCherS at SPeCIfIC loCatIoNS – ContinuationPercentual sobre o total de professores que já utilizaram computador ou Internet alguma vez na vida 1Percentage of the total number of teachers who have already used a computer or the Internet at least once 1

2010 Pesquisa TIC EducaçãoTABELAS DE RESuLTADOS – PROFESSORES
PO
RTu
Gu
ÊS
En
gli
sh
275
Percentual (%)Percentage (%)
Local de acesso pago (lanhouse, Internet café, hot spot)Paid access venue (lAn house, internet cafe, hot spot)
Todos os dias ou quase Everyday or nearly everyday
Pelo menos uma vez
por semanaAt least
once a week
Pelo menos uma vez por mêsAt least once a month
Menos de uma vez por mês
less than once a month
Não costuma utilizar
Does not usually use it
TOTAL 1 5 5 5 84
SEXOgEnDER
Feminino / female 1 4 4 4 87
masculino / male 2 10 5 8 74
FAIXA ETÁRIAAgE gROUP
≤ 30 2 13 6 8 71
31-45 1 4 5 5 84
46+ - 3 2 4 90
RENDA FAMILIARFAMilY inCOME
Até 3 Sm up to 3 mw 2 14 7 5 73
mais de 3 até 5 Sm more than 3 up to 5 mw 2 6 6 7 79
mais de 5 Sm more than 5 mw - 2 3 5 90
RENDA PESSOALinDiViDUAl inCOME
Até 3 Sm up to 3 mw 2 7 6 5 80
mais de 3 até 5 Sm more than 3 up to 5 mw 1 4 4 5 85
mais de 5 Sm more than 5 mw - 2 3 5 89
REGIÃOREgiOn
Norte / Centro-oeste / North / Center-west 1 7 6 8 79
Nordeste / Northeast 2 9 6 6 76
Sudeste / Southeast 1 2 3 3 91
Sul / South - 2 4 4 91
DEPENDêNCIA ADMINISTRATIvAADMinisTRATiVE
JURisDiCTiOn
municipal / municipal 1 6 5 6 82
Estadual / State 1 4 4 4 86
SÉRIEgRADE
4a série / 5o ano do Ensino Fundamental4th grade / 5th year elementary education 1 6 5 5 83
8a série / 9o ano do Ensino Fundamental8th grade / 9th year elementary education 1 6 6 6 81
2o ano do Ensino médio2nd year of Secondary education 1 4 4 7 85
COMPUTADOR INSTALADO
NO LABORATóRIO DE INFORMÁTICA
COMPUTER insTAllED AT iT lAb
Sim / yes 1 5 5 5 84
Não / No 2 7 2 4 85
INTERNET INSTALADA NO LABORATóRIO DE INFORMÁTICA
inTERnET AVAilAblE AT iT lAb
Sim / yes 1 4 5 5 85
Não / No 1 8 5 5 82
1 Base: 1.506 professores que já utilizaram computador ou Internet alguma vez na vida. Respostas estimuladas e rodiziadas.1 base: 1,506 teachers who have already used a computer or the internet at least once. stimulated, alternated answers.
b8 FREQUêNCIA DE USO DO COMPUTADOR E DA INTERNET EM LOCAIS ESPECÍFICOS PELOS PROFESSORES – ContinuaçãofreQueNCy of INterNet aNd ComPuter uSe By teaCherS at SPeCIfIC loCatIoNS – ContinuationPercentual sobre o total de professores que já utilizaram computador ou Internet alguma vez na vida 1Percentage of the total number of teachers who have already used a computer or the Internet at least once 1

Survey on ICT Education 2010TABLES OF RESuLTS – TEACHERS
PO
RTu
Gu
ÊS
En
gli
sh
276
Percentual (%)Percentage (%)
SimYes
Nãono
TOTAL 6 94
SEXOgEnDER
Feminino / female 6 94
masculino / male 6 94
FAIXA ETÁRIAAgE gROUP
≤ 30 10 90
31-45 6 94
46+ 3 97
RENDA FAMILIARFAMilY inCOME
Até 3 Sm up to 3 mw 4 96
mais de 3 até 5 Sm more than 3 up to 5 mw 6 94
mais de 5 Sm more than 5 mw 6 94
RENDA PESSOALinDiViDUAl inCOME
Até 3 Sm up to 3 mw 4 96
mais de 3 até 5 Sm more than 3 up to 5 mw 7 93
mais de 5 Sm more than 5 mw 7 93
REGIÃOREgiOn
Norte / Centro-oeste / North / Center-west 5 95
Nordeste / Northeast 6 94
Sudeste / Southeast 6 94
Sul / South 5 95
DEPENDêNCIA ADMINISTRATIvAADMinisTRATiVE
JURisDiCTiOn
municipal / municipal 6 94
Estadual / State 6 94
SÉRIEgRADE
4a série / 5o ano do Ensino Fundamental4th grade / 5th year elementary education 6 94
8a série / 9o ano do Ensino Fundamental8th grade / 9th year elementary education 5 95
2o ano do Ensino médio2nd year of Secondary education 7 93
COMPUTADOR INSTALADO
NO LABORATóRIO DE INFORMÁTICA
COMPUTER insTAllED AT iT lAb
Sim / yes 6 94
Não / No 5 95
INTERNET INSTALADA NO LABORATóRIO DE INFORMÁTICA
inTERnET AVAilAblE AT iT lAb
Sim / yes 6 94
Não / No 5 95
1 Base: 1.535 professores. 1 base: 1,535 teachers.
b9 ACESSO DO PROFESSOR À INTERNET POR MEIO DE TELEFONE CELULAR teaCher’S aCCeSS to the INterNet vIa moBIle PhoNeS Percentual sobre o total de professores¹ Percentage of the total number of teachers¹

2010 Pesquisa TIC EducaçãoTABELAS DE RESuLTADOS – PROFESSORES
PO
RTu
Gu
ÊS
En
gli
sh
277
Percentual (%)Percentage (%)
Copiar ou mover um arquivo ou uma pastaCopying or moving a file or folder
Muita dificuldade
Very difficult
Dificuldade Difficult
Pouca dificuldade
not very difficult
Nenhuma dificuldade
not difficult
Não se aplica /
Não conhece a atividadeDoes not
apply / is not familiar with the activity
TOTAL 13 16 13 57 1
SEXOgEnDER
Feminino / female 15 17 14 53 1
masculino / male 8 14 10 68 1
FAIXA ETÁRIAAgE gROUP
≤ 30 2 7 7 84 1
31-45 13 16 14 56 1
46+ 21 21 14 42 1
RENDA FAMILIARFAMilY inCOME
Até 3 Sm up to 3 mw 19 18 17 43 3
mais de 3 até 5 Sm more than 3 up to 5 mw 14 17 14 54 -
mais de 5 Sm more than 5 mw 11 15 11 62 1
RENDA PESSOALinDiViDUAl inCOME
Até 3 Sm up to 3 mw 16 16 13 53 2
mais de 3 até 5 Sm more than 3 up to 5 mw 13 16 14 57 -
mais de 5 Sm more than 5 mw 10 17 11 62 -
REGIÃOREgiOn
Norte / Centro-oeste / North / Center-west 15 16 12 56 1
Nordeste / Northeast 19 15 14 50 1
Sudeste / Southeast 10 17 14 58 1
Sul / South 8 14 11 67 -
DEPENDêNCIA ADMINISTRATIvAADMinisTRATiVE
JURisDiCTiOn
municipal / municipal 16 16 14 53 1
Estadual / State 10 16 11 61 1
SÉRIEgRADE
4a série / 5o ano do Ensino Fundamental4th grade / 5th year elementary education 19 17 14 49 1
8a série / 9o ano do Ensino Fundamental8th grade / 9th year elementary education 13 16 14 56 1
2o ano do Ensino médio2nd year of Secondary education 8 15 11 66 -
COMPUTADOR INSTALADO
NO LABORATóRIO DE INFORMÁTICA
COMPUTER insTAllED AT iT lAb
Sim / yes 13 15 13 59 1
Não / No 16 22 12 49 1
INTERNET INSTALADA NO LABORATóRIO DE INFORMÁTICA
inTERnET AVAilAblE AT iT lAb
Sim / yes 12 15 13 59 1
Não / No 15 20 12 52 1
1 Base: 1.506 professores que já utilizaram computador alguma vez na vida. Respostas estimuladas e rodiziadas.1 base: 1,506 teachers who have already used a computer at least once. stimulated, alternated answers.
C1 PERCEPÇÃO DO PROFESSOR SOBRE AS ATIvIDADES REALIZADAS NO COMPUTADORteaCher’S PerCePtIoN oN the aCtIvItIeS CarrIed out oN the ComPuterPercentual sobre o total de professores que já utilizaram computador alguma vez na vida 1Percentage of the total number of teachers who have already used a computer at least once 1

Survey on ICT Education 2010TABLES OF RESuLTS – TEACHERS
PO
RTu
Gu
ÊS
En
gli
sh
278
Percentual (%)Percentage (%)
Escrever utilizando um editor de textoWriting using a text editor
Muita dificuldade
Very difficult
Dificuldade Difficult
Pouca dificuldade
not very difficult
Nenhuma dificuldade
not difficult
Não se aplica /
Não conhece a atividadeDoes not
apply / is not familiar with the activity
TOTAL 7 8 14 70 1
SEXOgEnDER
Feminino / female 9 8 15 67 1
masculino / male 2 8 11 78 -
FAIXA ETÁRIAAgE gROUP
≤ 30 1 4 7 88 1
31-45 7 7 15 71 1
46+ 12 13 16 58 2
RENDA FAMILIARFAMilY inCOME
Até 3 Sm up to 3 mw 13 11 14 59 3
mais de 3 até 5 Sm more than 3 up to 5 mw 7 9 18 66 -
mais de 5 Sm more than 5 mw 6 6 12 75 1
RENDA PESSOALinDiViDUAl inCOME
Até 3 Sm up to 3 mw 9 9 15 65 1
mais de 3 até 5 Sm more than 3 up to 5 mw 7 7 16 70 -
mais de 5 Sm more than 5 mw 5 6 10 78 1
REGIÃOREgiOn
Norte / Centro-oeste / North / Center-west 10 8 15 65 1
Nordeste / Northeast 12 10 16 61 2
Sudeste / Southeast 4 7 13 75 -
Sul / South 4 5 12 79 -
DEPENDêNCIA ADMINISTRATIvAADMinisTRATiVE
JURisDiCTiOn
municipal / municipal 9 10 14 66 1
Estadual / State 6 6 14 73 1
SÉRIEgRADE
4a série / 5o ano do Ensino Fundamental4th grade / 5th year elementary education 11 10 17 61 1
8a série / 9o ano do Ensino Fundamental8th grade / 9th year elementary education 7 8 15 68 1
2o ano do Ensino médio2nd year of Secondary education 3 5 13 79 -
COMPUTADOR INSTALADO
NO LABORATóRIO DE INFORMÁTICA
COMPUTER insTAllED AT iT lAb
Sim / yes 6 7 14 71 1
Não / No 11 11 14 62 2
INTERNET INSTALADA NO LABORATóRIO DE INFORMÁTICA
inTERnET AVAilAblE AT iT lAb
Sim / yes 6 7 14 73 1
Não / No 10 10 16 63 2
1 Base: 1.506 professores que já utilizaram computador alguma vez na vida. Respostas estimuladas e rodiziadas.1 base: 1,506 teachers who have already used a computer at least once. stimulated, alternated answers.
C1 PERCEPÇÃO DO PROFESSOR SOBRE AS ATIvIDADES REALIZADAS NO COMPUTADOR – ContinuaçãoteaCher’S PerCePtIoN oN the aCtIvItIeS CarrIed out oN the ComPuter – ContinuationPercentual sobre o total de professores que já utilizaram computador alguma vez na vida 1Percentage of the total number of teachers who have already used a computer at least once 1

2010 Pesquisa TIC EducaçãoTABELAS DE RESuLTADOS – PROFESSORES
PO
RTu
Gu
ÊS
En
gli
sh
279
Percentual (%)Percentage (%)
Preparar apresentações ou slides usando um editor de apresentaçõesPreparing presentations or slide shows using a presentation editor
Muita dificuldade
Very difficult
Dificuldade Difficult
Pouca dificuldade
not very difficult
Nenhuma dificuldade
not difficult
Não se aplica /
Não conhece a atividadeDoes not
apply / is not familiar with the activity
TOTAL 25 23 17 32 3
SEXOgEnDER
Feminino / female 27 23 17 30 3
masculino / male 18 21 20 40 1
FAIXA ETÁRIAAgE gROUP
≤ 30 9 13 23 55 1
31-45 25 24 19 30 2
46+ 34 26 12 23 5
RENDA FAMILIARFAMilY inCOME
Até 3 Sm up to 3 mw 29 23 15 28 5
mais de 3 até 5 Sm more than 3 up to 5 mw 30 24 16 28 2
mais de 5 Sm more than 5 mw 22 22 19 35 3
RENDA PESSOALinDiViDUAl inCOME
Até 3 Sm up to 3 mw 27 21 16 32 4
mais de 3 até 5 Sm more than 3 up to 5 mw 26 25 18 30 2
mais de 5 Sm more than 5 mw 19 22 21 35 3
REGIÃOREgiOn
Norte / Centro-oeste / North / Center-west 27 20 17 33 3
Nordeste / Northeast 31 20 16 30 4
Sudeste / Southeast 23 27 19 29 2
Sul / South 18 21 18 42 2
DEPENDêNCIA ADMINISTRATIvAADMinisTRATiVE
JURisDiCTiOn
municipal / municipal 29 23 16 30 2
Estadual / State 21 22 19 34 3
SÉRIEgRADE
4a série / 5o ano do Ensino Fundamental4th grade / 5th year elementary education 32 22 14 28 3
8a série / 9o ano do Ensino Fundamental8th grade / 9th year elementary education 25 23 17 31 4
2o ano do Ensino médio2nd year of Secondary education 17 21 23 38 2
COMPUTADOR INSTALADO
NO LABORATóRIO DE INFORMÁTICA
COMPUTER insTAllED AT iT lAb
Sim / yes 23 21 19 34 3
Não / No 33 29 10 24 4
INTERNET INSTALADA NO LABORATóRIO DE INFORMÁTICA
inTERnET AVAilAblE AT iT lAb
Sim / yes 23 21 19 34 3
Não / No 29 27 13 27 4
1 Base: 1.506 professores que já utilizaram computador alguma vez na vida. Respostas estimuladas e rodiziadas.1 base: 1,506 teachers who have already used a computer at least once. stimulated, alternated answers.
C1 PERCEPÇÃO DO PROFESSOR SOBRE AS ATIvIDADES REALIZADAS NO COMPUTADOR – ContinuaçãoteaCher’S PerCePtIoN oN the aCtIvItIeS CarrIed out oN the ComPuter – ContinuationPercentual sobre o total de professores que já utilizaram computador alguma vez na vida 1Percentage of the total number of teachers who have already used a computer at least once 1

Survey on ICT Education 2010TABLES OF RESuLTS – TEACHERS
PO
RTu
Gu
ÊS
En
gli
sh
280
Percentual (%)Percentage (%)
Usar planilha de cálculo Using a calculation spreadsheet
Muita dificuldade
Very difficult
Dificuldade Difficult
Pouca dificuldade
not very difficult
Nenhuma dificuldade
not difficult
Não se aplica /
Não conhece a atividadeDoes not
apply / is not familiar with the activity
TOTAL 31 23 16 26 4
SEXOgEnDER
Feminino / female 35 23 15 22 5
masculino / male 18 22 19 39 2
FAIXA ETÁRIAAgE gROUP
≤ 30 13 21 25 40 1
31-45 32 23 16 25 4
46+ 37 25 12 20 6
RENDA FAMILIARFAMilY inCOME
Até 3 Sm up to 3 mw 32 23 16 23 5
mais de 3 até 5 Sm more than 3 up to 5 mw 36 23 15 25 2
mais de 5 Sm more than 5 mw 27 23 17 28 5
RENDA PESSOALinDiViDUAl inCOME
Até 3 Sm up to 3 mw 34 20 15 27 4
mais de 3 até 5 Sm more than 3 up to 5 mw 31 26 17 23 3
mais de 5 Sm more than 5 mw 25 23 18 29 5
REGIÃOREgiOn
Norte / Centro-oeste / North / Center-west 34 24 18 22 2
Nordeste / Northeast 33 20 13 28 6
Sudeste / Southeast 28 25 18 26 4
Sul / South 27 23 16 30 3
DEPENDêNCIA ADMINISTRATIvAADMinisTRATiVE
JURisDiCTiOn
municipal / municipal 34 23 16 24 3
Estadual / State 28 23 16 29 5
SÉRIEgRADE
4a série / 5o ano do Ensino Fundamental4th grade / 5th year elementary education 37 24 14 21 5
8a série / 9o ano do Ensino Fundamental8th grade / 9th year elementary education 30 23 17 25 5
2o ano do Ensino médio2nd year of Secondary education 22 23 17 34 4
COMPUTADOR INSTALADO
NO LABORATóRIO DE INFORMÁTICA
COMPUTER insTAllED AT iT lAb
Sim / yes 30 23 17 27 4
Não / No 34 24 15 22 5
INTERNET INSTALADA NO LABORATóRIO DE INFORMÁTICA
inTERnET AVAilAblE AT iT lAb
Sim / yes 30 23 17 27 4
Não / No 32 24 15 24 5
1 Base: 1.506 professores que já utilizaram computador alguma vez na vida. Respostas estimuladas e rodiziadas.1 base: 1,506 teachers who have already used a computer at least once. stimulated, alternated answers.
C1 PERCEPÇÃO DO PROFESSOR SOBRE AS ATIvIDADES REALIZADAS NO COMPUTADOR – ContinuaçãoteaCher’S PerCePtIoN oN the aCtIvItIeS CarrIed out oN the ComPuter – ContinuationPercentual sobre o total de professores que já utilizaram computador alguma vez na vida 1Percentage of the total number of teachers who have already used a computer at least once 1

2010 Pesquisa TIC EducaçãoTABELAS DE RESuLTADOS – PROFESSORES
PO
RTu
Gu
ÊS
En
gli
sh
281
Percentual (%)Percentage (%)
Usar programa multimídia, de som e imagemUsing multimedia software, with sound and image
Muita dificuldade
Very difficult
Dificuldade Difficult
Pouca dificuldade
not very difficult
Nenhuma dificuldade
not difficult
Não se aplica /
Não conhece a atividadeDoes not
apply / is not familiar with the activity
TOTAL 22 22 19 34 3
SEXOgEnDER
Feminino / female 24 23 20 31 3
masculino / male 15 21 19 45 1
FAIXA ETÁRIAAgE gROUP
≤ 30 8 14 24 53 1
31-45 21 24 19 33 3
46+ 30 23 17 26 4
RENDA FAMILIARFAMilY inCOME
Até 3 Sm up to 3 mw 24 25 18 30 3
mais de 3 até 5 Sm more than 3 up to 5 mw 25 20 20 34 1
mais de 5 Sm more than 5 mw 19 23 19 35 3
RENDA PESSOALinDiViDUAl inCOME
Até 3 Sm up to 3 mw 23 21 17 35 3
mais de 3 até 5 Sm more than 3 up to 5 mw 21 23 21 34 2
mais de 5 Sm more than 5 mw 20 24 20 33 3
REGIÃOREgiOn
Norte / Centro-oeste / North / Center-west 24 20 19 34 3
Nordeste / Northeast 26 21 14 36 3
Sudeste / Southeast 19 26 23 30 2
Sul / South 15 20 21 42 2
DEPENDêNCIA ADMINISTRATIvAADMinisTRATiVE
JURisDiCTiOn
municipal / municipal 25 23 17 33 3
Estadual / State 18 22 22 35 2
SÉRIEgRADE
4a série / 5o ano do Ensino Fundamental4th grade / 5th year elementary education 26 23 17 31 3
8a série / 9o ano do Ensino Fundamental8th grade / 9th year elementary education 21 24 16 35 4
2o ano do Ensino médio2nd year of Secondary education 16 19 24 39 2
COMPUTADOR INSTALADO
NO LABORATóRIO DE INFORMÁTICA
COMPUTER insTAllED AT iT lAb
Sim / yes 21 22 20 35 3
Não / No 23 26 16 31 3
INTERNET INSTALADA NO LABORATóRIO DE INFORMÁTICA
inTERnET AVAilAblE AT iT lAb
Sim / yes 20 21 21 35 2
Não / No 24 25 17 31 3
1 Base: 1.506 professores que já utilizaram computador alguma vez na vida. Respostas estimuladas e rodiziadas.1 base: 1,506 teachers who have already used a computer at least once. stimulated, alternated answers.
C1 PERCEPÇÃO DO PROFESSOR SOBRE AS ATIvIDADES REALIZADAS NO COMPUTADOR – ContinuaçãoteaCher’S PerCePtIoN oN the aCtIvItIeS CarrIed out oN the ComPuter – ContinuationPercentual sobre o total de professores que já utilizaram computador alguma vez na vida 1Percentage of the total number of teachers who have already used a computer at least once 1

Survey on ICT Education 2010TABLES OF RESuLTS – TEACHERS
PO
RTu
Gu
ÊS
En
gli
sh
282
Percentual (%)Percentage (%)
Acessar e navegar na InternetAccessing and browsing the internet
Muita dificuldade
Very difficult
Dificuldade Difficult
Pouca dificuldade
not very difficult
Nenhuma dificuldade
not difficult
Não se aplica /
Não conhece a atividadeDoes not
apply / is not familiar with the activity
TOTAL 6 7 12 74 1
SEXOgEnDER
Feminino / female 7 7 13 71 1
masculino / male 2 5 8 84 1
FAIXA ETÁRIAAgE gROUP
≤ 30 - 3 4 92 1
31-45 5 6 12 75 1
46+ 11 10 16 62 1
RENDA FAMILIARFAMilY inCOME
Até 3 Sm up to 3 mw 13 9 10 67 2
mais de 3 até 5 Sm more than 3 up to 5 mw 6 9 13 72 -
mais de 5 Sm more than 5 mw 4 5 13 77 1
RENDA PESSOALinDiViDUAl inCOME
Até 3 Sm up to 3 mw 8 8 11 72 2
mais de 3 até 5 Sm more than 3 up to 5 mw 5 7 14 75 -
mais de 5 Sm more than 5 mw 4 6 12 77 1
REGIÃOREgiOn
Norte / Centro-oeste / North / Center-west 8 10 12 69 2
Nordeste / Northeast 11 8 12 69 1
Sudeste / Southeast 2 6 13 78 1
Sul / South 4 3 12 81 -
DEPENDêNCIA ADMINISTRATIvAADMinisTRATiVE
JURisDiCTiOn
municipal / municipal 7 8 12 72 1
Estadual / State 5 6 12 77 1
SÉRIEgRADE
4a série / 5o ano do Ensino Fundamental4th grade / 5th year elementary education 9 8 14 68 1
8a série / 9o ano do Ensino Fundamental8th grade / 9th year elementary education 6 7 12 74 1
2o ano do Ensino médio2nd year of Secondary education 3 5 11 81 -
COMPUTADOR INSTALADO
NO LABORATóRIO DE INFORMÁTICA
COMPUTER insTAllED AT iT lAb
Sim / yes 5 6 12 75 1
Não / No 8 9 13 69 1
INTERNET INSTALADA NO LABORATóRIO DE INFORMÁTICA
inTERnET AVAilAblE AT iT lAb
Sim / yes 5 6 12 76 1
Não / No 8 8 13 69 1
1 Base: 1.506 professores que já utilizaram computador alguma vez na vida. Respostas estimuladas e rodiziadas.1 base: 1,506 teachers who have already used a computer at least once. stimulated, alternated answers.
C1 PERCEPÇÃO DO PROFESSOR SOBRE AS ATIvIDADES REALIZADAS NO COMPUTADOR – ContinuaçãoteaCher’S PerCePtIoN oN the aCtIvItIeS CarrIed out oN the ComPuter – ContinuationPercentual sobre o total de professores que já utilizaram computador alguma vez na vida 1Percentage of the total number of teachers who have already used a computer at least once 1

2010 Pesquisa TIC EducaçãoTABELAS DE RESuLTADOS – PROFESSORES
PO
RTu
Gu
ÊS
En
gli
sh
283
Percentual (%)Percentage (%)
Fazer busca de informação utilizando um buscadorUsing a search engine to look up information
Muita dificuldade
Very difficult
Dificuldade Difficult
Pouca dificuldade
not very difficult
Nenhuma dificuldade
not difficult
Não se aplica /
Não conhece a atividadeDoes not
apply / is not familiar with the activity
TOTAL 4 5 11 79 -
SEXOgEnDER
Feminino / female 5 5 12 77 -
masculino / male 1 5 9 84 -
FAIXA ETÁRIAAgE gROUP
≤ 30 - 3 5 92 -
31-45 3 4 12 80 -
46+ 8 8 15 69 1
RENDA FAMILIARFAMilY inCOME
Até 3 Sm up to 3 mw 10 7 11 70 1
mais de 3 até 5 Sm more than 3 up to 5 mw 3 7 13 77 -
mais de 5 Sm more than 5 mw 3 3 10 83 -
RENDA PESSOALinDiViDUAl inCOME
Até 3 Sm up to 3 mw 5 6 12 77 -
mais de 3 até 5 Sm more than 3 up to 5 mw 4 5 12 80 -
mais de 5 Sm more than 5 mw 3 4 11 81 1
REGIÃOREgiOn
Norte / Centro-oeste / North / Center-west 8 8 13 72 -
Nordeste / Northeast 7 6 14 73 1
Sudeste / Southeast 1 4 11 84 -
Sul / South 2 3 7 88 -
DEPENDêNCIA ADMINISTRATIvAADMinisTRATiVE
JURisDiCTiOn
municipal / municipal 5 5 12 78 -
Estadual / State 3 5 11 80 -
SÉRIEgRADE
4a série / 5o ano do Ensino Fundamental4th grade / 5th year elementary education 6 6 14 74 -
8a série / 9o ano do Ensino Fundamental8th grade / 9th year elementary education 4 5 12 78 1
2o ano do Ensino médio2nd year of Secondary education 2 5 10 84 -
COMPUTADOR INSTALADO
NO LABORATóRIO DE INFORMÁTICA
COMPUTER insTAllED AT iT lAb
Sim / yes 4 5 11 80 -
Não / No 6 7 11 76 -
INTERNET INSTALADA NO LABORATóRIO DE INFORMÁTICA
inTERnET AVAilAblE AT iT lAb
Sim / yes 3 4 12 80 -
Não / No 6 6 11 76 -
1 Base: 1.483 professores que já utilizaram a Internet alguma vez na vida. Respostas estimuladas e rodiziadas.1 base: 1,483 teachers who have already used the internet at least once. stimulated, alternated answers.
C2 PERCEPÇÃO DO PROFESSOR SOBRE AS ATIvIDADES REALIZADAS NA INTERNETteaCher’S PerCePtIoN oN the aCtIvItIeS CarrIed out oN the INterNetPercentual sobre o total de professores que já utilizaram a Internet alguma vez na vida 1Percentage of the total number of teachers who have already used the Internet at least once 1

Survey on ICT Education 2010TABLES OF RESuLTS – TEACHERS
PO
RTu
Gu
ÊS
En
gli
sh
284
Percentual (%)Percentage (%)
Enviar e-mailssending e-mails
Muita dificuldade
Very difficult
Dificuldade Difficult
Pouca dificuldade
not very difficult
Nenhuma dificuldade
not difficult
Não se aplica /
Não conhece a atividadeDoes not
apply / is not familiar with the activity
TOTAL 8 8 10 73 1
SEXOgEnDER
Feminino / female 9 9 10 71 1
masculino / male 5 5 11 79 -
FAIXA ETÁRIAAgE gROUP
≤ 30 2 4 6 88 -
31-45 7 7 10 75 1
46+ 14 11 14 60 2
RENDA FAMILIARFAMilY inCOME
Até 3 Sm up to 3 mw 16 9 13 60 2
mais de 3 até 5 Sm more than 3 up to 5 mw 10 8 13 69 -
mais de 5 Sm more than 5 mw 5 7 8 79 1
RENDA PESSOALinDiViDUAl inCOME
Até 3 Sm up to 3 mw 10 9 11 70 1
mais de 3 até 5 Sm more than 3 up to 5 mw 8 8 9 75 -
mais de 5 Sm more than 5 mw 4 6 11 77 1
REGIÃOREgiOn
Norte / Centro-oeste / North / Center-west 10 11 12 66 1
Nordeste / Northeast 13 9 11 66 1
Sudeste / Southeast 4 6 11 78 -
Sul / South 4 4 6 85 1
DEPENDêNCIA ADMINISTRATIvAADMinisTRATiVE
JURisDiCTiOn
municipal / municipal 10 7 11 70 1
Estadual / State 6 8 10 76 -
SÉRIEgRADE
4a série / 5o ano do Ensino Fundamental4th grade / 5th year elementary education 10 10 12 67 1
8a série / 9o ano do Ensino Fundamental8th grade / 9th year elementary education 7 8 10 72 1
2o ano do Ensino médio2nd year of Secondary education 6 5 9 81 -
COMPUTADOR INSTALADO
NO LABORATóRIO DE INFORMÁTICA
COMPUTER insTAllED AT iT lAb
Sim / yes 7 8 10 74 1
Não / No 12 7 11 68 1
INTERNET INSTALADA NO LABORATóRIO DE INFORMÁTICA
inTERnET AVAilAblE AT iT lAb
Sim / yes 6 7 10 75 1
Não / No 11 8 11 69 1
1 Base: 1.483 professores que já utilizaram a Internet alguma vez na vida. Respostas estimuladas e rodiziadas.1 base: 1,483 teachers who have already used the internet at least once. stimulated, alternated answers.
C2 PERCEPÇÃO DO PROFESSOR SOBRE AS ATIvIDADES REALIZADAS NA INTERNET – ContinuaçãoteaCher’S PerCePtIoN oN the aCtIvItIeS CarrIed out oN the INterNet – ContinuationPercentual sobre o total de professores que já utilizaram a Internet alguma vez na vida 1Percentage of the total number of teachers who have already used the Internet at least once 1
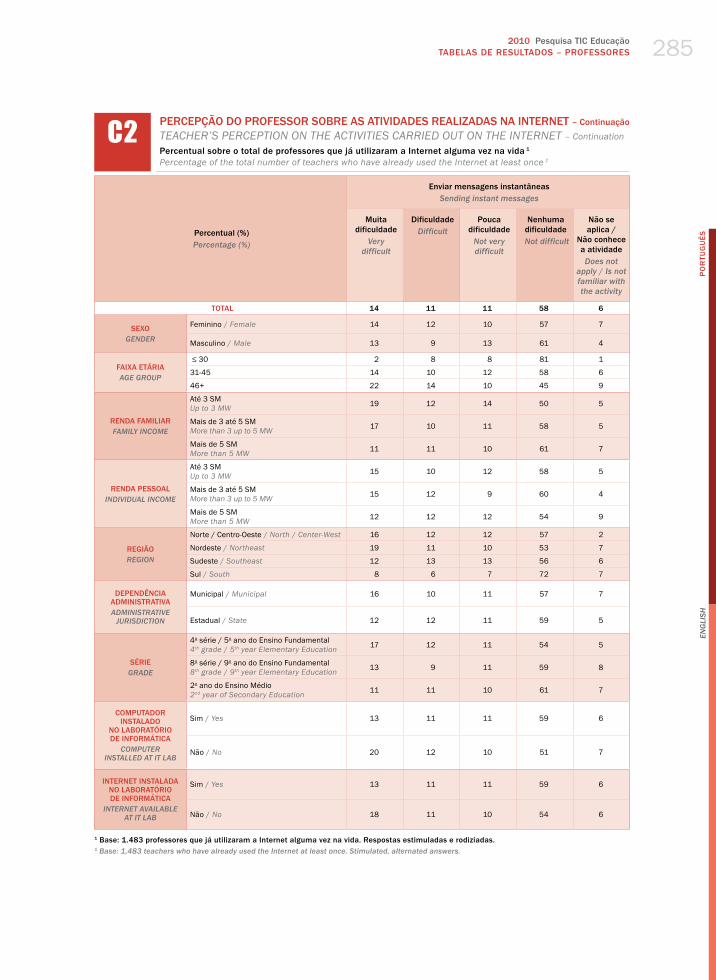
2010 Pesquisa TIC EducaçãoTABELAS DE RESuLTADOS – PROFESSORES
PO
RTu
Gu
ÊS
En
gli
sh
285
Percentual (%)Percentage (%)
Enviar mensagens instantâneassending instant messages
Muita dificuldade
Very difficult
Dificuldade Difficult
Pouca dificuldade
not very difficult
Nenhuma dificuldade
not difficult
Não se aplica /
Não conhece a atividadeDoes not
apply / is not familiar with the activity
TOTAL 14 11 11 58 6
SEXOgEnDER
Feminino / female 14 12 10 57 7
masculino / male 13 9 13 61 4
FAIXA ETÁRIAAgE gROUP
≤ 30 2 8 8 81 1
31-45 14 10 12 58 6
46+ 22 14 10 45 9
RENDA FAMILIARFAMilY inCOME
Até 3 Sm up to 3 mw 19 12 14 50 5
mais de 3 até 5 Sm more than 3 up to 5 mw 17 10 11 58 5
mais de 5 Sm more than 5 mw 11 11 10 61 7
RENDA PESSOALinDiViDUAl inCOME
Até 3 Sm up to 3 mw 15 10 12 58 5
mais de 3 até 5 Sm more than 3 up to 5 mw 15 12 9 60 4
mais de 5 Sm more than 5 mw 12 12 12 54 9
REGIÃOREgiOn
Norte / Centro-oeste / North / Center-west 16 12 12 57 2
Nordeste / Northeast 19 11 10 53 7
Sudeste / Southeast 12 13 13 56 6
Sul / South 8 6 7 72 7
DEPENDêNCIA ADMINISTRATIvAADMinisTRATiVE
JURisDiCTiOn
municipal / municipal 16 10 11 57 7
Estadual / State 12 12 11 59 5
SÉRIEgRADE
4a série / 5o ano do Ensino Fundamental4th grade / 5th year elementary education 17 12 11 54 5
8a série / 9o ano do Ensino Fundamental8th grade / 9th year elementary education 13 9 11 59 8
2o ano do Ensino médio2nd year of Secondary education 11 11 10 61 7
COMPUTADOR INSTALADO
NO LABORATóRIO DE INFORMÁTICA
COMPUTER insTAllED AT iT lAb
Sim / yes 13 11 11 59 6
Não / No 20 12 10 51 7
INTERNET INSTALADA NO LABORATóRIO DE INFORMÁTICA
inTERnET AVAilAblE AT iT lAb
Sim / yes 13 11 11 59 6
Não / No 18 11 10 54 6
1 Base: 1.483 professores que já utilizaram a Internet alguma vez na vida. Respostas estimuladas e rodiziadas.1 base: 1,483 teachers who have already used the internet at least once. stimulated, alternated answers.
C2 PERCEPÇÃO DO PROFESSOR SOBRE AS ATIvIDADES REALIZADAS NA INTERNET – ContinuaçãoteaCher’S PerCePtIoN oN the aCtIvItIeS CarrIed out oN the INterNet – ContinuationPercentual sobre o total de professores que já utilizaram a Internet alguma vez na vida 1Percentage of the total number of teachers who have already used the Internet at least once 1

Survey on ICT Education 2010TABLES OF RESuLTS – TEACHERS
PO
RTu
Gu
ÊS
En
gli
sh
286
Percentual (%)Percentage (%)
Participar de fóruns de discussão on-lineTaking part in online discussion forums
Muita dificuldade
Very difficult
Dificuldade Difficult
Pouca dificuldade
not very difficult
Nenhuma dificuldade
not difficult
Não se aplica /
Não conhece a atividadeDoes not
apply / is not familiar with the activity
TOTAL 22 14 13 37 13
SEXOgEnDER
Feminino / female 22 15 13 35 14
masculino / male 21 12 13 44 10
FAIXA ETÁRIAAgE gROUP
≤ 30 8 13 16 51 11
31-45 22 13 14 39 13
46+ 28 18 10 27 16
RENDA FAMILIARFAMilY inCOME
Até 3 Sm up to 3 mw 31 14 11 31 12
mais de 3 até 5 Sm more than 3 up to 5 mw 27 12 15 34 12
mais de 5 Sm more than 5 mw 16 15 13 42 14
RENDA PESSOALinDiViDUAl inCOME
Até 3 Sm up to 3 mw 23 16 12 36 13
mais de 3 até 5 Sm more than 3 up to 5 mw 22 14 14 37 13
mais de 5 Sm more than 5 mw 19 12 13 42 14
REGIÃOREgiOn
Norte / Centro-oeste / North / Center-west 26 18 11 33 12
Nordeste / Northeast 28 13 12 32 15
Sudeste / Southeast 20 15 15 40 11
Sul / South 9 12 13 49 17
DEPENDêNCIA ADMINISTRATIvAADMinisTRATiVE
JURisDiCTiOn
municipal / municipal 25 13 12 36 15
Estadual / State 19 16 15 40 12
SÉRIEgRADE
4a série / 5o ano do Ensino Fundamental4th grade / 5th year elementary education 27 16 12 32 13
8a série / 9o ano do Ensino Fundamental8th grade / 9th year elementary education 21 14 13 37 15
2o ano do Ensino médio2nd year of Secondary education 15 13 16 44 13
COMPUTADOR INSTALADO
NO LABORATóRIO DE INFORMÁTICA
COMPUTER insTAllED AT iT lAb
Sim / yes 21 14 13 40 12
Não / No 26 16 13 28 17
INTERNET INSTALADA NO LABORATóRIO DE INFORMÁTICA
inTERnET AVAilAblE AT iT lAb
Sim / yes 20 14 14 41 12
Não / No 26 16 12 30 16
1 Base: 1.483 professores que já utilizaram a Internet alguma vez na vida. Respostas estimuladas e rodiziadas.1 base: 1,483 teachers who have already used the internet at least once. stimulated, alternated answers.
C2 PERCEPÇÃO DO PROFESSOR SOBRE AS ATIvIDADES REALIZADAS NA INTERNET – ContinuaçãoteaCher’S PerCePtIoN oN the aCtIvItIeS CarrIed out oN the INterNet – ContinuationPercentual sobre o total de professores que já utilizaram a Internet alguma vez na vida 1Percentage of the total number of teachers who have already used the Internet at least once 1

2010 Pesquisa TIC EducaçãoTABELAS DE RESuLTADOS – PROFESSORES
PO
RTu
Gu
ÊS
En
gli
sh
287
Percentual (%)Percentage (%)
Participar de sites de relacionamentoTaking part in relationship websites
Muita dificuldade
Very difficult
Dificuldade Difficult
Pouca dificuldade
not very difficult
Nenhuma dificuldade
not difficult
Não se aplica /
Não conhece a atividadeDoes not
apply / is not familiar with the activity
TOTAL 19 11 11 49 9
SEXOgEnDER
Feminino / female 19 12 11 48 10
masculino / male 18 10 12 52 8
FAIXA ETÁRIAAgE gROUP
≤ 30 6 9 10 74 2
31-45 18 11 13 48 10
46+ 27 13 9 38 12
RENDA FAMILIARFAMilY inCOME
Até 3 Sm up to 3 mw 25 13 11 44 7
mais de 3 até 5 Sm more than 3 up to 5 mw 22 11 11 48 8
mais de 5 Sm more than 5 mw 16 11 11 52 10
RENDA PESSOALinDiViDUAl inCOME
Até 3 Sm up to 3 mw 18 13 11 49 8
mais de 3 até 5 Sm more than 3 up to 5 mw 20 10 11 52 8
mais de 5 Sm more than 5 mw 19 9 11 47 14
REGIÃOREgiOn
Norte / Centro-oeste / North / Center-west 23 11 12 47 7
Nordeste / Northeast 23 12 10 44 10
Sudeste / Southeast 17 12 12 49 10
Sul / South 11 7 10 61 10
DEPENDêNCIA ADMINISTRATIvAADMinisTRATiVE
JURisDiCTiOn
municipal / municipal 20 12 11 48 9
Estadual / State 17 11 11 51 10
SÉRIEgRADE
4a série / 5o ano do Ensino Fundamental4th grade / 5th year elementary education 21 14 12 46 7
8a série / 9o ano do Ensino Fundamental8th grade / 9th year elementary education 18 10 11 49 12
2o ano do Ensino médio2nd year of Secondary education 17 10 10 52 11
COMPUTADOR INSTALADO
NO LABORATóRIO DE INFORMÁTICA
COMPUTER insTAllED AT iT lAb
Sim / yes 19 10 11 51 9
Não / No 18 15 12 43 12
INTERNET INSTALADA NO LABORATóRIO DE INFORMÁTICA
inTERnET AVAilAblE AT iT lAb
Sim / yes 18 11 11 51 9
Não / No 20 12 13 44 11
1 Base: 1.483 professores que já utilizaram a Internet alguma vez na vida. Respostas estimuladas e rodiziadas.1 base: 1,483 teachers who have already used the internet at least once. stimulated, alternated answers.
C2 PERCEPÇÃO DO PROFESSOR SOBRE AS ATIvIDADES REALIZADAS NA INTERNET – ContinuaçãoteaCher’S PerCePtIoN oN the aCtIvItIeS CarrIed out oN the INterNet – ContinuationPercentual sobre o total de professores que já utilizaram a Internet alguma vez na vida 1Percentage of the total number of teachers who have already used the Internet at least once 1
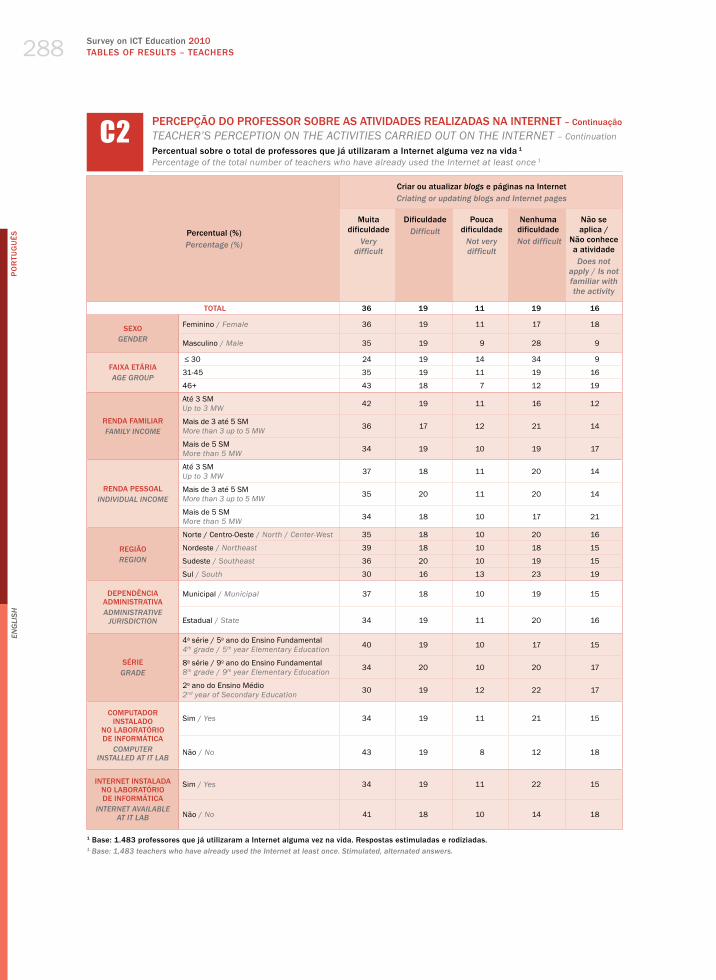
Survey on ICT Education 2010TABLES OF RESuLTS – TEACHERS
PO
RTu
Gu
ÊS
En
gli
sh
288
Percentual (%)Percentage (%)
Criar ou atualizar blogs e páginas na InternetCriating or updating blogs and internet pages
Muita dificuldade
Very difficult
Dificuldade Difficult
Pouca dificuldade
not very difficult
Nenhuma dificuldade
not difficult
Não se aplica /
Não conhece a atividadeDoes not
apply / is not familiar with the activity
TOTAL 36 19 11 19 16
SEXOgEnDER
Feminino / female 36 19 11 17 18
masculino / male 35 19 9 28 9
FAIXA ETÁRIAAgE gROUP
≤ 30 24 19 14 34 9
31-45 35 19 11 19 16
46+ 43 18 7 12 19
RENDA FAMILIARFAMilY inCOME
Até 3 Sm up to 3 mw 42 19 11 16 12
mais de 3 até 5 Sm more than 3 up to 5 mw 36 17 12 21 14
mais de 5 Sm more than 5 mw 34 19 10 19 17
RENDA PESSOALinDiViDUAl inCOME
Até 3 Sm up to 3 mw 37 18 11 20 14
mais de 3 até 5 Sm more than 3 up to 5 mw 35 20 11 20 14
mais de 5 Sm more than 5 mw 34 18 10 17 21
REGIÃOREgiOn
Norte / Centro-oeste / North / Center-west 35 18 10 20 16
Nordeste / Northeast 39 18 10 18 15
Sudeste / Southeast 36 20 10 19 15
Sul / South 30 16 13 23 19
DEPENDêNCIA ADMINISTRATIvAADMinisTRATiVE
JURisDiCTiOn
municipal / municipal 37 18 10 19 15
Estadual / State 34 19 11 20 16
SÉRIEgRADE
4a série / 5o ano do Ensino Fundamental4th grade / 5th year elementary education 40 19 10 17 15
8a série / 9o ano do Ensino Fundamental8th grade / 9th year elementary education 34 20 10 20 17
2o ano do Ensino médio2nd year of Secondary education 30 19 12 22 17
COMPUTADOR INSTALADO
NO LABORATóRIO DE INFORMÁTICA
COMPUTER insTAllED AT iT lAb
Sim / yes 34 19 11 21 15
Não / No 43 19 8 12 18
INTERNET INSTALADA NO LABORATóRIO DE INFORMÁTICA
inTERnET AVAilAblE AT iT lAb
Sim / yes 34 19 11 22 15
Não / No 41 18 10 14 18
1 Base: 1.483 professores que já utilizaram a Internet alguma vez na vida. Respostas estimuladas e rodiziadas.1 base: 1,483 teachers who have already used the internet at least once. stimulated, alternated answers.
C2 PERCEPÇÃO DO PROFESSOR SOBRE AS ATIvIDADES REALIZADAS NA INTERNET – ContinuaçãoteaCher’S PerCePtIoN oN the aCtIvItIeS CarrIed out oN the INterNet – ContinuationPercentual sobre o total de professores que já utilizaram a Internet alguma vez na vida 1Percentage of the total number of teachers who have already used the Internet at least once 1

2010 Pesquisa TIC EducaçãoTABELAS DE RESuLTADOS – PROFESSORES
PO
RTu
Gu
ÊS
En
gli
sh
289
Percentual (%)Percentage (%)
Jogar on-linePlaying online games
Muita dificuldade
Very difficult
Dificuldade Difficult
Pouca dificuldade
not very difficult
Nenhuma dificuldade
not difficult
Não se aplica /
Não conhece a atividadeDoes not
apply / is not familiar with the activity
TOTAL 29 16 9 30 16
SEXOgEnDER
Feminino / female 29 16 9 29 17
masculino / male 27 15 10 34 14
FAIXA ETÁRIAAgE gROUP
≤ 30 16 16 14 44 10
31-45 30 15 9 31 16
46+ 34 18 8 20 21
RENDA FAMILIARFAMilY inCOME
Até 3 Sm up to 3 mw 36 21 8 24 11
mais de 3 até 5 Sm more than 3 up to 5 mw 32 14 8 32 14
mais de 5 Sm more than 5 mw 25 16 10 30 19
RENDA PESSOALinDiViDUAl inCOME
Até 3 Sm up to 3 mw 31 18 8 31 12
mais de 3 até 5 Sm more than 3 up to 5 mw 28 16 8 31 17
mais de 5 Sm more than 5 mw 25 13 12 27 23
REGIÃOREgiOn
Norte / Centro-oeste / North / Center-west 33 13 9 27 17
Nordeste / Northeast 34 17 10 25 15
Sudeste / Southeast 25 17 11 32 15
Sul / South 21 15 5 38 20
DEPENDêNCIA ADMINISTRATIvAADMinisTRATiVE
JURisDiCTiOn
municipal / municipal 31 15 9 30 15
Estadual / State 26 17 10 30 17
SÉRIEgRADE
4a série / 5o ano do Ensino Fundamental4th grade / 5th year elementary education 34 14 9 30 14
8a série / 9o ano do Ensino Fundamental8th grade / 9th year elementary education 26 16 10 29 18
2o ano do Ensino médio2nd year of Secondary education 24 18 10 30 19
COMPUTADOR INSTALADO
NO LABORATóRIO DE INFORMÁTICA
COMPUTER insTAllED AT iT lAb
Sim / yes 28 16 10 31 15
Não / No 32 17 7 24 20
INTERNET INSTALADA NO LABORATóRIO DE INFORMÁTICA
inTERnET AVAilAblE AT iT lAb
Sim / yes 27 16 10 33 14
Não / No 33 15 7 24 21
1 Base: 1.483 professores que já utilizaram a Internet alguma vez na vida. Respostas estimuladas e rodiziadas.1 base: 1,483 teachers who have already used the internet at least once. stimulated, alternated answers.
C2 PERCEPÇÃO DO PROFESSOR SOBRE AS ATIvIDADES REALIZADAS NA INTERNET – ContinuaçãoteaCher’S PerCePtIoN oN the aCtIvItIeS CarrIed out oN the INterNet – ContinuationPercentual sobre o total de professores que já utilizaram a Internet alguma vez na vida 1Percentage of the total number of teachers who have already used the Internet at least once 1

Survey on ICT Education 2010TABLES OF RESuLTS – TEACHERS
PO
RTu
Gu
ÊS
En
gli
sh
290
Percentual (%)Percentage (%)
Assistir a filmes ou vídeos pela InternetWatching movies or videos on the internet
Muita dificuldade
Very difficult
Dificuldade Difficult
Pouca dificuldade
not very difficult
Nenhuma dificuldade
not difficult
Não se aplica /
Não conhece a atividadeDoes not
apply / is not familiar with the activity
TOTAL 22 13 14 40 11
SEXOgEnDER
Feminino / female 23 13 14 38 13
masculino / male 18 14 16 46 7
FAIXA ETÁRIAAgE gROUP
≤ 30 12 11 17 54 6
31-45 22 13 14 40 11
46+ 28 14 14 30 15
RENDA FAMILIARFAMilY inCOME
Até 3 Sm up to 3 mw 29 16 17 26 12
mais de 3 até 5 Sm more than 3 up to 5 mw 24 12 14 41 9
mais de 5 Sm more than 5 mw 18 13 14 43 12
RENDA PESSOALinDiViDUAl inCOME
Até 3 Sm up to 3 mw 23 13 15 39 11
mais de 3 até 5 Sm more than 3 up to 5 mw 22 14 13 41 9
mais de 5 Sm more than 5 mw 18 12 16 39 16
REGIÃOREgiOn
Norte / Centro-oeste / North / Center-west 25 14 12 35 14
Nordeste / Northeast 30 12 15 31 12
Sudeste / Southeast 18 15 16 42 9
Sul / South 10 8 14 56 13
DEPENDêNCIA ADMINISTRATIvAADMinisTRATiVE
JURisDiCTiOn
municipal / municipal 24 12 15 37 12
Estadual / State 19 14 14 43 10
SÉRIEgRADE
4a série / 5o ano do Ensino Fundamental4th grade / 5th year elementary education 27 12 14 36 11
8a série / 9o ano do Ensino Fundamental8th grade / 9th year elementary education 20 14 13 39 14
2o ano do Ensino médio2nd year of Secondary education 19 13 15 42 11
COMPUTADOR INSTALADO
NO LABORATóRIO DE INFORMÁTICA
COMPUTER insTAllED AT iT lAb
Sim / yes 21 12 16 41 11
Não / No 25 17 8 36 14
INTERNET INSTALADA NO LABORATóRIO DE INFORMÁTICA
inTERnET AVAilAblE AT iT lAb
Sim / yes 21 11 16 43 10
Não / No 24 18 11 33 15
1 Base: 1.483 professores que já utilizaram a Internet alguma vez na vida. Respostas estimuladas e rodiziadas.1 base: 1,483 teachers who have already used the internet at least once. stimulated, alternated answers.
C2 PERCEPÇÃO DO PROFESSOR SOBRE AS ATIvIDADES REALIZADAS NA INTERNET – ContinuaçãoteaCher’S PerCePtIoN oN the aCtIvItIeS CarrIed out oN the INterNet – ContinuationPercentual sobre o total de professores que já utilizaram a Internet alguma vez na vida 1Percentage of the total number of teachers who have already used the Internet at least once 1

2010 Pesquisa TIC EducaçãoTABELAS DE RESuLTADOS – PROFESSORES
PO
RTu
Gu
ÊS
En
gli
sh
291
Percentual (%)Percentage (%)
Postar filmes ou vídeos na InternetPosting films or videos on the internet
Muita dificuldade
Very difficult
Dificuldade Difficult
Pouca dificuldade
not very difficult
Nenhuma dificuldade
not difficult
Não se aplica /
Não conhece a atividadeDoes not
apply / is not familiar with the activity
TOTAL 34 16 12 22 17
SEXOgEnDER
Feminino / female 34 16 12 21 18
masculino / male 31 17 12 28 13
FAIXA ETÁRIAAgE gROUP
≤ 30 22 20 10 37 11
31-45 34 16 12 22 17
46+ 39 14 12 16 19
RENDA FAMILIARFAMilY inCOME
Até 3 Sm up to 3 mw 39 17 12 18 14
mais de 3 até 5 Sm more than 3 up to 5 mw 37 15 9 25 13
mais de 5 Sm more than 5 mw 30 16 13 22 19
RENDA PESSOALinDiViDUAl inCOME
Até 3 Sm up to 3 mw 34 18 11 23 14
mais de 3 até 5 Sm more than 3 up to 5 mw 35 15 11 23 16
mais de 5 Sm more than 5 mw 29 14 14 21 23
REGIÃOREgiOn
Norte / Centro-oeste / North / Center-west 35 15 11 21 19
Nordeste / Northeast 39 13 9 23 15
Sudeste / Southeast 32 19 14 20 14
Sul / South 25 14 11 27 22
DEPENDêNCIA ADMINISTRATIvAADMinisTRATiVE
JURisDiCTiOn
municipal / municipal 37 13 12 21 17
Estadual / State 30 19 12 23 16
SÉRIEgRADE
4a série / 5o ano do Ensino Fundamental4th grade / 5th year elementary education 38 15 11 21 15
8a série / 9o ano do Ensino Fundamental8th grade / 9th year elementary education 32 15 12 22 19
2o ano do Ensino médio2nd year of Secondary education 29 18 12 23 18
COMPUTADOR INSTALADO
NO LABORATóRIO DE INFORMÁTICA
COMPUTER insTAllED AT iT lAb
Sim / yes 32 15 12 24 16
Não / No 38 19 10 15 17
INTERNET INSTALADA NO LABORATóRIO DE INFORMÁTICA
inTERnET AVAilAblE AT iT lAb
Sim / yes 32 15 12 25 16
Não / No 37 19 10 16 18
1 Base: 1.483 professores que já utilizaram a Internet alguma vez na vida. Respostas estimuladas e rodiziadas.1 base: 1,483 teachers who have already used the internet at least once. stimulated, alternated answers.
C2 PERCEPÇÃO DO PROFESSOR SOBRE AS ATIvIDADES REALIZADAS NA INTERNET – ContinuaçãoteaCher’S PerCePtIoN oN the aCtIvItIeS CarrIed out oN the INterNet – ContinuationPercentual sobre o total de professores que já utilizaram a Internet alguma vez na vida 1Percentage of the total number of teachers who have already used the Internet at least once 1

Survey on ICT Education 2010TABLES OF RESuLTS – TEACHERS
PO
RTu
Gu
ÊS
En
gli
sh
292
Percentual (%)Percentage (%)
Usar Internet para realizar ligações telefônicasUsing the internet to make phone calls
Muita dificuldade
Very difficult
Dificuldade Difficult
Pouca dificuldade
not very difficult
Nenhuma dificuldade
not difficult
Não se aplica /
Não conhece a atividadeDoes not
apply / is not familiar with the activity
TOTAL 40 9 7 19 25
SEXOgEnDER
Feminino / female 39 9 6 18 27
masculino / male 42 9 7 23 19
FAIXA ETÁRIAAgE gROUP
≤ 30 33 13 8 28 17
31-45 40 9 7 18 26
46+ 43 9 6 15 28
RENDA FAMILIARFAMilY inCOME
Até 3 Sm up to 3 mw 51 11 3 11 24
mais de 3 até 5 Sm more than 3 up to 5 mw 45 11 6 16 23
mais de 5 Sm more than 5 mw 34 8 8 23 27
RENDA PESSOALinDiViDUAl inCOME
Até 3 Sm up to 3 mw 41 11 6 19 24
mais de 3 até 5 Sm more than 3 up to 5 mw 40 8 8 19 24
mais de 5 Sm more than 5 mw 36 9 6 20 29
REGIÃOREgiOn
Norte / Centro-oeste / North / Center-west 45 12 6 13 24
Nordeste / Northeast 49 8 5 12 27
Sudeste / Southeast 38 10 8 20 24
Sul / South 21 8 8 37 26
DEPENDêNCIA ADMINISTRATIvAADMinisTRATiVE
JURisDiCTiOn
municipal / municipal 42 9 7 18 25
Estadual / State 38 10 6 20 25
SÉRIEgRADE
4a série / 5o ano do Ensino Fundamental4th grade / 5th year elementary education 44 10 6 15 25
8a série / 9o ano do Ensino Fundamental8th grade / 9th year elementary education 38 9 7 19 27
2o ano do Ensino médio2nd year of Secondary education 37 9 6 22 25
COMPUTADOR INSTALADO
NO LABORATóRIO DE INFORMÁTICA
COMPUTER insTAllED AT iT lAb
Sim / yes 39 9 7 20 24
Não / No 45 11 4 12 28
INTERNET INSTALADA NO LABORATóRIO DE INFORMÁTICA
inTERnET AVAilAblE AT iT lAb
Sim / yes 38 9 7 22 24
Não / No 45 10 5 13 28
1 Base: 1.483 professores que já utilizaram a Internet alguma vez na vida. Respostas estimuladas e rodiziadas.1 base: 1,483 teachers who have already used the internet at least once. stimulated, alternated answers.
C2 PERCEPÇÃO DO PROFESSOR SOBRE AS ATIvIDADES REALIZADAS NA INTERNET – ContinuaçãoteaCher’S PerCePtIoN oN the aCtIvItIeS CarrIed out oN the INterNet – ContinuationPercentual sobre o total de professores que já utilizaram a Internet alguma vez na vida 1Percentage of the total number of teachers who have already used the Internet at least once 1
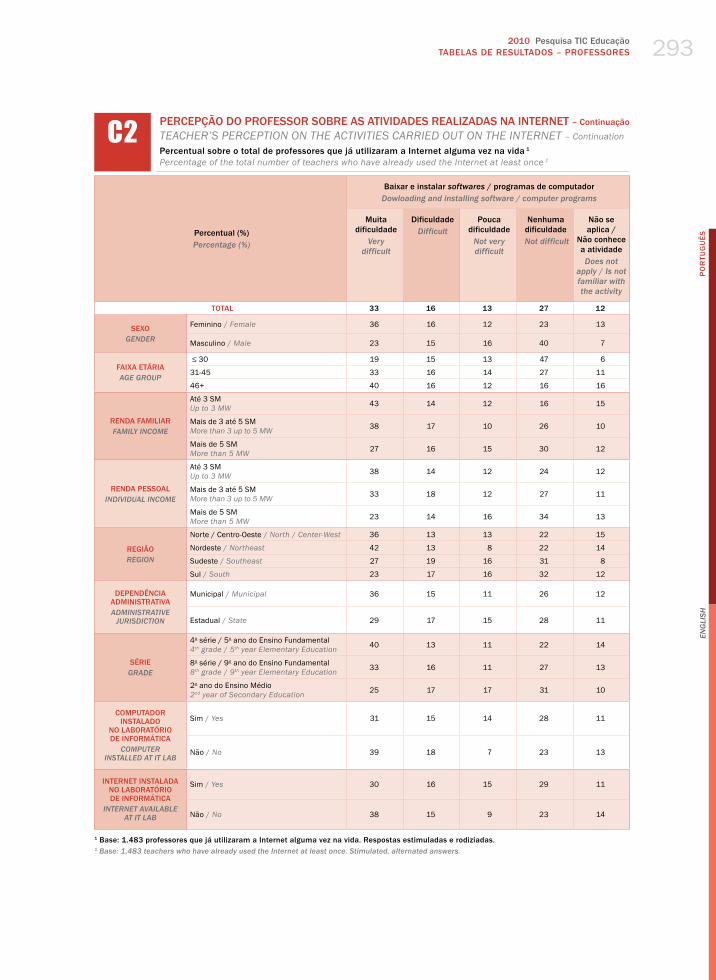
2010 Pesquisa TIC EducaçãoTABELAS DE RESuLTADOS – PROFESSORES
PO
RTu
Gu
ÊS
En
gli
sh
293
Percentual (%)Percentage (%)
Baixar e instalar softwares / programas de computadorDowloading and installing software / computer programs
Muita dificuldade
Very difficult
Dificuldade Difficult
Pouca dificuldade
not very difficult
Nenhuma dificuldade
not difficult
Não se aplica /
Não conhece a atividadeDoes not
apply / is not familiar with the activity
TOTAL 33 16 13 27 12
SEXOgEnDER
Feminino / female 36 16 12 23 13
masculino / male 23 15 16 40 7
FAIXA ETÁRIAAgE gROUP
≤ 30 19 15 13 47 6
31-45 33 16 14 27 11
46+ 40 16 12 16 16
RENDA FAMILIARFAMilY inCOME
Até 3 Sm up to 3 mw 43 14 12 16 15
mais de 3 até 5 Sm more than 3 up to 5 mw 38 17 10 26 10
mais de 5 Sm more than 5 mw 27 16 15 30 12
RENDA PESSOALinDiViDUAl inCOME
Até 3 Sm up to 3 mw 38 14 12 24 12
mais de 3 até 5 Sm more than 3 up to 5 mw 33 18 12 27 11
mais de 5 Sm more than 5 mw 23 14 16 34 13
REGIÃOREgiOn
Norte / Centro-oeste / North / Center-west 36 13 13 22 15
Nordeste / Northeast 42 13 8 22 14
Sudeste / Southeast 27 19 16 31 8
Sul / South 23 17 16 32 12
DEPENDêNCIA ADMINISTRATIvAADMinisTRATiVE
JURisDiCTiOn
municipal / municipal 36 15 11 26 12
Estadual / State 29 17 15 28 11
SÉRIEgRADE
4a série / 5o ano do Ensino Fundamental4th grade / 5th year elementary education 40 13 11 22 14
8a série / 9o ano do Ensino Fundamental8th grade / 9th year elementary education 33 16 11 27 13
2o ano do Ensino médio2nd year of Secondary education 25 17 17 31 10
COMPUTADOR INSTALADO
NO LABORATóRIO DE INFORMÁTICA
COMPUTER insTAllED AT iT lAb
Sim / yes 31 15 14 28 11
Não / No 39 18 7 23 13
INTERNET INSTALADA NO LABORATóRIO DE INFORMÁTICA
inTERnET AVAilAblE AT iT lAb
Sim / yes 30 16 15 29 11
Não / No 38 15 9 23 14
1 Base: 1.483 professores que já utilizaram a Internet alguma vez na vida. Respostas estimuladas e rodiziadas.1 base: 1,483 teachers who have already used the internet at least once. stimulated, alternated answers.
C2 PERCEPÇÃO DO PROFESSOR SOBRE AS ATIvIDADES REALIZADAS NA INTERNET – ContinuaçãoteaCher’S PerCePtIoN oN the aCtIvItIeS CarrIed out oN the INterNet – ContinuationPercentual sobre o total de professores que já utilizaram a Internet alguma vez na vida 1Percentage of the total number of teachers who have already used the Internet at least once 1

Survey on ICT Education 2010TABLES OF RESuLTS – TEACHERS
PO
RTu
Gu
ÊS
En
gli
sh
294
Percentual (%)Percentage (%)
Fazer compras pela internet shopping online
Muita dificuldade
Very difficult
Dificuldade Difficult
Pouca dificuldade
not very difficult
Nenhuma dificuldade
not difficult
Não se aplica /
Não conhece a atividadeDoes not
apply / is not familiar with the activity
TOTAL 25 11 11 40 13
SEXOgEnDER
Feminino / female 27 11 11 37 14
masculino / male 19 12 12 50 8
FAIXA ETÁRIAAgE gROUP
≤ 30 12 12 10 57 8
31-45 24 11 11 41 12
46+ 34 10 11 30 16
RENDA FAMILIARFAMilY inCOME
Até 3 Sm up to 3 mw 38 13 12 23 14
mais de 3 até 5 Sm more than 3 up to 5 mw 29 10 12 37 12
mais de 5 Sm more than 5 mw 18 11 10 48 12
RENDA PESSOALinDiViDUAl inCOME
Até 3 Sm up to 3 mw 27 12 12 37 12
mais de 3 até 5 Sm more than 3 up to 5 mw 26 9 11 41 14
mais de 5 Sm more than 5 mw 18 14 9 48 11
REGIÃOREgiOn
Norte / Centro-oeste / North / Center-west 27 12 11 33 17
Nordeste / Northeast 33 11 12 32 13
Sudeste / Southeast 21 13 11 45 9
Sul / South 16 6 10 54 16
DEPENDêNCIA ADMINISTRATIvAADMinisTRATiVE
JURisDiCTiOn
municipal / municipal 26 12 10 39 13
Estadual / State 24 10 12 42 13
SÉRIEgRADE
4a série / 5o ano do Ensino Fundamental4th grade / 5th year elementary education 29 13 10 34 14
8a série / 9o ano do Ensino Fundamental8th grade / 9th year elementary education 23 11 11 41 14
2o ano do Ensino médio2nd year of Secondary education 21 9 13 45 12
COMPUTADOR INSTALADO
NO LABORATóRIO DE INFORMÁTICA
COMPUTER insTAllED AT iT lAb
Sim / yes 24 10 12 42 12
Não / No 30 14 9 33 13
INTERNET INSTALADA NO LABORATóRIO DE INFORMÁTICA
inTERnET AVAilAblE AT iT lAb
Sim / yes 22 10 12 44 12
Não / No 30 14 9 33 14
1 Base: 1.483 professores que já utilizaram a Internet alguma vez na vida. Respostas estimuladas e rodiziadas.1 base: 1,483 teachers who have already used the internet at least once. stimulated, alternated answers.
C2 PERCEPÇÃO DO PROFESSOR SOBRE AS ATIvIDADES REALIZADAS NA INTERNET – ContinuaçãoteaCher’S PerCePtIoN oN the aCtIvItIeS CarrIed out oN the INterNet – ContinuationPercentual sobre o total de professores que já utilizaram a Internet alguma vez na vida 1Percentage of the total number of teachers who have already used the Internet at least once 1

2010 Pesquisa TIC EducaçãoTABELAS DE RESuLTADOS – PROFESSORES
PO
RTu
Gu
ÊS
En
gli
sh
295
Percentual (%)Percentage (%)
Participar de cursos a distânciaParticipating in distance learning courses
Muita dificuldade
Very difficult
Dificuldade Difficult
Pouca dificuldade
not very difficult
Nenhuma dificuldade
not difficult
Não se aplica /
Não conhece a atividadeDoes not
apply / is not familiar with the activity
TOTAL 23 10 10 42 15
SEXOgEnDER
Feminino / female 24 10 9 41 16
masculino / male 21 11 11 46 12
FAIXA ETÁRIAAgE gROUP
≤ 30 15 9 8 54 15
31-45 22 10 9 44 14
46+ 30 10 11 32 17
RENDA FAMILIARFAMilY inCOME
Até 3 Sm up to 3 mw 36 11 10 27 16
mais de 3 até 5 Sm more than 3 up to 5 mw 28 10 9 41 12
mais de 5 Sm more than 5 mw 17 10 10 47 17
RENDA PESSOALinDiViDUAl inCOME
Até 3 Sm up to 3 mw 26 12 10 38 14
mais de 3 até 5 Sm more than 3 up to 5 mw 25 8 10 43 15
mais de 5 Sm more than 5 mw 16 10 10 49 17
REGIÃOREgiOn
Norte / Centro-oeste / North / Center-west 27 10 11 36 16
Nordeste / Northeast 32 13 8 30 17
Sudeste / Southeast 20 9 10 49 11
Sul / South 10 6 9 57 19
DEPENDêNCIA ADMINISTRATIvAADMinisTRATiVE
JURisDiCTiOn
municipal / municipal 26 10 9 38 16
Estadual / State 20 10 10 46 14
SÉRIEgRADE
4a série / 5o ano do Ensino Fundamental4th grade / 5th year elementary education 29 10 9 36 16
8a série / 9o ano do Ensino Fundamental8th grade / 9th year elementary education 22 11 10 39 18
2o ano do Ensino médio2nd year of Secondary education 17 10 11 48 14
COMPUTADOR INSTALADO
NO LABORATóRIO DE INFORMÁTICA
COMPUTER insTAllED AT iT lAb
Sim / yes 22 10 10 44 14
Não / No 30 10 10 32 19
INTERNET INSTALADA NO LABORATóRIO DE INFORMÁTICA
inTERnET AVAilAblE AT iT lAb
Sim / yes 21 10 10 46 13
Não / No 29 10 10 32 19
1 Base: 1.483 professores que já utilizaram a Internet alguma vez na vida. Respostas estimuladas e rodiziadas.1 base: 1,483 teachers who have already used the internet at least once. stimulated, alternated answers.
C2 PERCEPÇÃO DO PROFESSOR SOBRE AS ATIvIDADES REALIZADAS NA INTERNET – ContinuaçãoteaCher’S PerCePtIoN oN the aCtIvItIeS CarrIed out oN the INterNet – ContinuationPercentual sobre o total de professores que já utilizaram a Internet alguma vez na vida 1Percentage of the total number of teachers who have already used the Internet at least once 1

Survey on ICT Education 2010TABLES OF RESuLTS – TEACHERS
PO
RTu
Gu
ÊS
En
gli
sh
296
Percentual (%)Percentage (%)
Fez um curso específico
Taking a specific
course
SozinhoOn his / her own
Com outras pessoas (filhos, parente,
amigo, etc.)With other
people (children, relatives,
friends, etc.)
Com outro professor
ou educador da escola
With another teacher or educator from the school
Com os alunos / com
um alunoWith
students / with a
student
TOTAL 50 40 28 7 2
SEXOgEnDER
Feminino / female 48 38 31 8 2
masculino / male 55 45 16 5 1
FAIXA ETÁRIAAgE gROUP
≤ 30 67 36 11 3 1
31-45 47 40 29 8 2
46+ 45 40 36 8 3
RENDA FAMILIARFAMilY inCOME
Até 3 Sm up to 3 mw 49 34 21 10 1
mais de 3 até 5 Sm more than 3 up to 5 mw 53 38 26 6 1
mais de 5 Sm more than 5 mw 49 42 31 7 2
RENDA PESSOALinDiViDUAl inCOME
Até 3 Sm up to 3 mw 50 35 26 8 1
mais de 3 até 5 Sm more than 3 up to 5 mw 52 40 30 6 2
mais de 5 Sm more than 5 mw 46 48 27 8 4
REGIÃOREgiOn
Norte / Centro-oeste / North / Center-west 51 35 25 7 2
Nordeste / Northeast 49 33 21 6 1
Sudeste / Southeast 49 48 34 7 2
Sul / South 51 37 30 8 3
DEPENDêNCIA ADMINISTRATIvAADMinisTRATiVE
JURisDiCTiOn
municipal / municipal 48 39 27 8 1
Estadual / State 51 40 28 6 3
SÉRIEgRADE
4a série / 5o ano do Ensino Fundamental4th grade / 5th year elementary education 47 35 32 9 2
8a série / 9o ano do Ensino Fundamental8th grade / 9th year elementary education 50 39 23 6 1
2o ano do Ensino médio2nd year of Secondary education 53 43 24 5 4
COMPUTADOR INSTALADO
NO LABORATóRIO DE INFORMÁTICA
COMPUTER insTAllED AT iT lAb
Sim / yes 50 40 28 8 2
Não / No 50 38 28 4 1
INTERNET INSTALADA NO LABORATóRIO DE INFORMÁTICA
inTERnET AVAilAblE AT iT lAb
Sim / yes 50 40 28 8 2
Não / No 49 38 26 4 1
1 Base: 1.486 professores que já utilizaram computador ou Internet alguma vez na vida. Respostas múltiplas e estimuladas.1 base: 1,486 teachers who have already used a computer or the internet at least once. Multiple, stimulated answers.
D1 FORMA DE APRENDIZADO DO USO DE COMPUTADOR E INTERNET PELO PROFESSORhow ComPuter aNd INterNet SkIllS are learNed By the teaCherPercentual sobre o total de professores que já utilizaram computador ou Internet alguma vez na vida ¹ Percentage of the total number of teachers who have already used a computer or the Internet at least once ¹

2010 Pesquisa TIC EducaçãoTABELAS DE RESuLTADOS – PROFESSORES
PO
RTu
Gu
ÊS
En
gli
sh
297
Percentual (%)Percentage (%)
Eu mesmo(a) paguei
um curso especiali-
zadoi paid for a
specialized course myself
Oferecido pelo
Governo / Secretaria
da Educação Provided
by the government / Department of Education
Treinamento oferecido
pela escola Training
provided by the school
Oferecido por uma empresa,
ONG, associação, telecentro ou outra entidade
Provided by a company,
ngO, association, telecenter or other entity
Não opinouDid not answer
TOTAL 71 22 13 4 -
SEXOgEnDER
Feminino / female 68 24 14 4 -
masculino / male 80 17 10 5 -
FAIXA ETÁRIAAgE gROUP
≤ 30 86 12 4 2 1
31-45 71 22 14 5 -
46+ 58 32 19 6 -
RENDA FAMILIARFAMilY inCOME
Até 3 Sm up to 3 mw 71 22 16 1 -
mais de 3 até 5 Sm more than 3 up to 5 mw 72 20 12 4 1
mais de 5 Sm more than 5 mw 70 23 13 5 -
RENDA PESSOALinDiViDUAl inCOME
Até 3 Sm up to 3 mw 73 20 13 2 -
mais de 3 até 5 Sm more than 3 up to 5 mw 69 22 12 6 -
mais de 5 Sm more than 5 mw 69 26 15 5 -
REGIÃOREgiOn
Norte / Centro-oeste / North / Center-west 79 15 12 3 -
Nordeste / Northeast 69 21 12 4 1
Sudeste / Southeast 69 25 12 6 -
Sul / South 69 27 17 4 -
DEPENDêNCIA ADMINISTRATIvAADMinisTRATiVE
JURisDiCTiOn
municipal / municipal 69 24 13 4 -
Estadual / State 73 20 13 5 -
SÉRIEgRADE
4a série / 5o ano do Ensino Fundamental4th grade / 5th year elementary education 67 23 13 3 -
8a série / 9o ano do Ensino Fundamental8th grade / 9th year elementary education 71 22 11 5 -
2o ano do Ensino médio2nd year of Secondary education 75 21 12 5 -
COMPUTADOR INSTALADO
NO LABORATóRIO DE INFORMÁTICA
COMPUTER insTAllED AT iT lAb
Sim / yes 71 23 13 4 -
Não / No 69 20 12 5 1
INTERNET INSTALADA NO LABORATóRIO DE INFORMÁTICA
inTERnET AVAilAblE AT iT lAb
Sim / yes 70 22 14 4 -
Não / No 71 23 10 5 1
1 Base: 740 professores que já utilizaram computador ou Internet alguma vez na vida e que fizeram algum curso específico para usar computador ou Internet. Respostas múltiplas.
1 base: 740 teachers who have already used a computer or the internet at least once, and who have taken a specific computer or internet course. Multiple answers.
D2 MODO DE ACESSO DO PROFESSOR AO CURSO DE CAPACITAÇÃOteaCher’S aCCeSS to traININgPercentual sobre o total de professores que já utilizaram computador ou Internet alguma vez na vida e que fizeram algum curso específico para o uso de computador ou Internet ¹ Percentage of the total number of teachers who have already used a computer or the Internet at least once, and who have already taken a specific computer or Internet course ¹
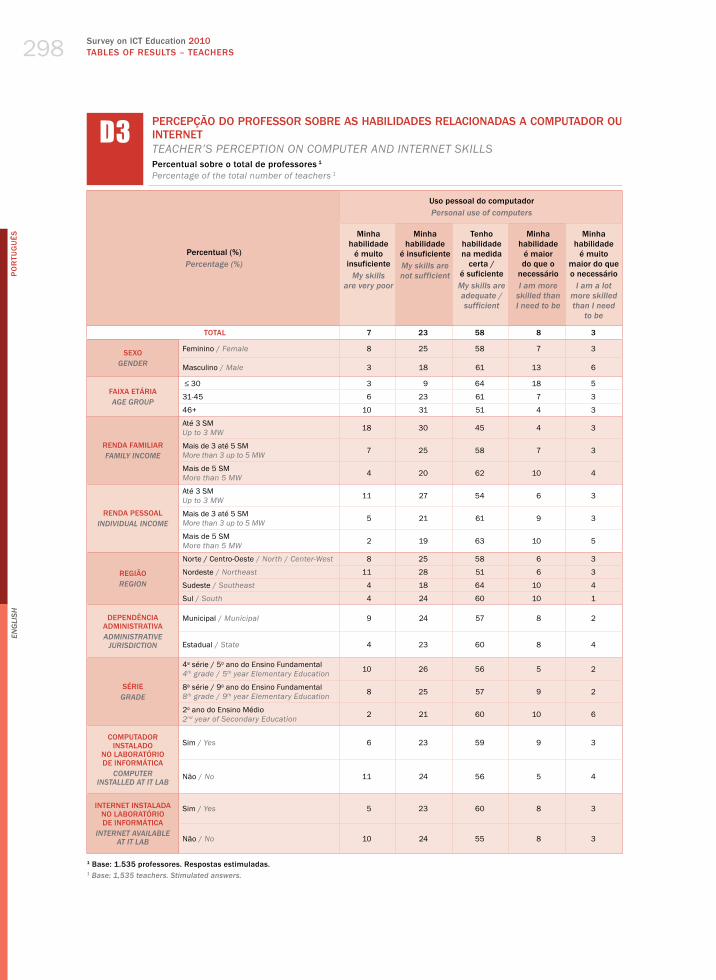
Survey on ICT Education 2010TABLES OF RESuLTS – TEACHERS
PO
RTu
Gu
ÊS
En
gli
sh
298
Percentual (%)Percentage (%)
Uso pessoal do computadorPersonal use of computers
Minha habilidade
é muito insuficiente
My skills are very poor
Minha habilidade
é insuficienteMy skills are not sufficient
Tenho habilidade na medida
certa / é suficiente My skills are adequate / sufficient
Minha habilidade
é maior do que o
necessário i am more
skilled than i need to be
Minha habilidade
é muito maior do que o necessário
i am a lot more skilled than i need
to be
TOTAL 7 23 58 8 3
SEXOgEnDER
Feminino / female 8 25 58 7 3
masculino / male 3 18 61 13 6
FAIXA ETÁRIAAgE gROUP
≤ 30 3 9 64 18 5
31-45 6 23 61 7 3
46+ 10 31 51 4 3
RENDA FAMILIARFAMilY inCOME
Até 3 Sm up to 3 mw 18 30 45 4 3
mais de 3 até 5 Sm more than 3 up to 5 mw 7 25 58 7 3
mais de 5 Sm more than 5 mw 4 20 62 10 4
RENDA PESSOALinDiViDUAl inCOME
Até 3 Sm up to 3 mw 11 27 54 6 3
mais de 3 até 5 Sm more than 3 up to 5 mw 5 21 61 9 3
mais de 5 Sm more than 5 mw 2 19 63 10 5
REGIÃOREgiOn
Norte / Centro-oeste / North / Center-west 8 25 58 6 3
Nordeste / Northeast 11 28 51 6 3
Sudeste / Southeast 4 18 64 10 4
Sul / South 4 24 60 10 1
DEPENDêNCIA ADMINISTRATIvAADMinisTRATiVE
JURisDiCTiOn
municipal / municipal 9 24 57 8 2
Estadual / State 4 23 60 8 4
SÉRIEgRADE
4a série / 5o ano do Ensino Fundamental4th grade / 5th year elementary education 10 26 56 5 2
8a série / 9o ano do Ensino Fundamental8th grade / 9th year elementary education 8 25 57 9 2
2o ano do Ensino médio2nd year of Secondary education 2 21 60 10 6
COMPUTADOR INSTALADO
NO LABORATóRIO DE INFORMÁTICA
COMPUTER insTAllED AT iT lAb
Sim / yes 6 23 59 9 3
Não / No 11 24 56 5 4
INTERNET INSTALADA NO LABORATóRIO DE INFORMÁTICA
inTERnET AVAilAblE AT iT lAb
Sim / yes 5 23 60 8 3
Não / No 10 24 55 8 3
1 Base: 1.535 professores. Respostas estimuladas.1 base: 1,535 teachers. stimulated answers.
D3 PERCEPÇÃO DO PROFESSOR SOBRE AS HABILIDADES RELACIONADAS A COMPUTADOR OU INTERNETteaCher’S PerCePtIoN oN ComPuter aNd INterNet SkIllSPercentual sobre o total de professores 1Percentage of the total number of teachers 1

2010 Pesquisa TIC EducaçãoTABELAS DE RESuLTADOS – PROFESSORES
PO
RTu
Gu
ÊS
En
gli
sh
299
Percentual (%)Percentage (%)
Uso profissional da InternetProfessional use of the internet
Minha habilidade
é muito insuficiente
My skills are very poor
Minha habilidade
é insuficienteMy skills are not sufficient
Tenho habilidade na medida
certa / é suficiente My skills are adequate / sufficient
Minha habilidade
é maior do que o
necessário i am more
skilled than i need to be
Minha habilidade
é muito maior do que o necessário
i am a lot more skilled than i need
to be
TOTAL 8 29 51 9 4
SEXOgEnDER
Feminino / female 9 30 50 7 3
masculino / male 3 26 51 13 7
FAIXA ETÁRIAAgE gROUP
≤ 30 4 12 58 18 8
31-45 7 31 51 8 3
46+ 12 35 45 5 3
RENDA FAMILIARFAMilY inCOME
Até 3 Sm up to 3 mw 18 37 36 5 3
mais de 3 até 5 Sm more than 3 up to 5 mw 7 31 52 6 4
mais de 5 Sm more than 5 mw 5 26 54 11 4
RENDA PESSOALinDiViDUAl inCOME
Até 3 Sm up to 3 mw 12 32 46 6 3
mais de 3 até 5 Sm more than 3 up to 5 mw 6 27 53 10 4
mais de 5 Sm more than 5 mw 3 26 54 12 6
REGIÃOREgiOn
Norte / Centro-oeste / North / Center-west 8 29 51 7 4
Nordeste / Northeast 13 33 43 7 4
Sudeste / Southeast 4 25 55 10 5
Sul / South 5 30 54 10 2
DEPENDêNCIA ADMINISTRATIvAADMinisTRATiVE
JURisDiCTiOn
municipal / municipal 11 31 47 8 3
Estadual / State 4 28 54 9 5
SÉRIEgRADE
4a série / 5o ano do Ensino Fundamental4th grade / 5th year elementary education 11 32 48 6 3
8a série / 9o ano do Ensino Fundamental8th grade / 9th year elementary education 9 30 51 8 2
2o ano do Ensino médio2nd year of Secondary education 2 26 54 11 6
COMPUTADOR INSTALADO
NO LABORATóRIO DE INFORMÁTICA
COMPUTER insTAllED AT iT lAb
Sim / yes 7 29 51 9 4
Não / No 13 30 47 7 4
INTERNET INSTALADA NO LABORATóRIO DE INFORMÁTICA
inTERnET AVAilAblE AT iT lAb
Sim / yes 6 29 53 8 4
Não / No 12 30 45 9 4
1 Base: 1.535 professores. Respostas estimuladas.1 base: 1,535 teachers. stimulated answers.
D3 PERCEPÇÃO DO PROFESSOR SOBRE AS HABILIDADES RELACIONADAS A COMPUTADOR OU INTERNET – ContinuaçãoteaCher’S PerCePtIoN oN ComPuter aNd INterNet SkIllS – ContinuationPercentual sobre o total de professores 1Percentage of the total number of teachers 1

Survey on ICT Education 2010TABLES OF RESuLTS – TEACHERS
PO
RTu
Gu
ÊS
En
gli
sh
300
Percentual (%)Percentage (%)
Preparar os alunos para o mercado de trabalhoPreparing students for the work market
Nada importante
not important
Pouco importante
Of little importance
Importanteimportant
Muito importante
Very important
TOTAL - 1 18 80
SEXOgEnDER
Feminino / female – 2 18 80
masculino / male – 1 19 80
FAIXA ETÁRIAAgE gROUP
≤ 30 – 1 16 83
31-45 – 1 18 80
46+ 1 1 20 78
RENDA FAMILIARFAMilY inCOME
Até 3 Sm up to 3 mw – – 14 86
mais de 3 até 5 Sm more than 3 up to 5 mw 1 1 18 80
mais de 5 Sm more than 5 mw – 1 19 79
RENDA PESSOALinDiViDUAl inCOME
Até 3 Sm up to 3 mw – 1 17 82
mais de 3 até 5 Sm more than 3 up to 5 mw 1 1 18 80
mais de 5 Sm more than 5 mw – 2 21 76
REGIÃOREgiOn
Norte / Centro-oeste / North / Center-west – 3 20 77
Nordeste / Northeast 1 1 16 83
Sudeste / Southeast – 1 19 79
Sul / South – 2 18 80
DEPENDêNCIA ADMINISTRATIvAADMinisTRATiVE
JURisDiCTiOn
municipal / municipal 1 1 18 80
Estadual / State – 1 19 80
SÉRIEgRADE
4a série / 5o ano do Ensino Fundamental4th grade / 5th year elementary education 1 2 17 80
8a série / 9o ano do Ensino Fundamental8th grade / 9th year elementary education – 1 18 81
2o ano do Ensino médio2nd year of Secondary education – 2 18 81
COMPUTADOR INSTALADO
NO LABORATóRIO DE INFORMÁTICA
COMPUTER insTAllED AT iT lAb
Sim / yes – 1 19 79
Não / No – 1 12 86
INTERNET INSTALADA NO LABORATóRIO DE INFORMÁTICA
inTERnET AVAilAblE AT iT lAb
Sim / yes – 1 20 79
Não / No – 1 15 84
1 Base: 1.535 professores. Respostas estimuladas.1 base: 1,535 teachers. stimulated answers.
E1 PERCEPÇÃO DO PROFESSOR SOBRE OS OBJETIvOS PEDAGóGICOSteaCher’S PerCePtIoN oN PedagogIC oBJeCtIveSPercentual sobre o total de professores 1Percentage of the total number of teachers 1
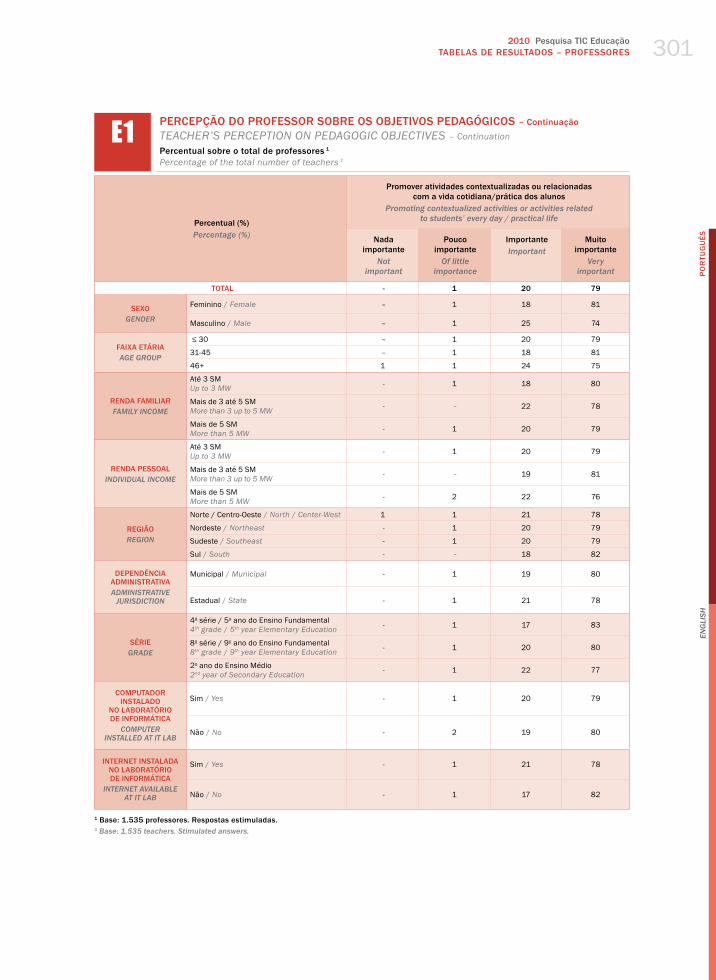
2010 Pesquisa TIC EducaçãoTABELAS DE RESuLTADOS – PROFESSORES
PO
RTu
Gu
ÊS
En
gli
sh
301
Percentual (%)Percentage (%)
Promover atividades contextualizadas ou relacionadas com a vida cotidiana/prática dos alunos
Promoting contextualized activities or activities related to students’ every day / practical life
Nada importante
not important
Pouco importante
Of little importance
Importanteimportant
Muito importante
Very important
TOTAL - 1 20 79
SEXOgEnDER
Feminino / female – 1 18 81
masculino / male – 1 25 74
FAIXA ETÁRIAAgE gROUP
≤ 30 – 1 20 79
31-45 – 1 18 81
46+ 1 1 24 75
RENDA FAMILIARFAMilY inCOME
Até 3 Sm up to 3 mw - 1 18 80
mais de 3 até 5 Sm more than 3 up to 5 mw - - 22 78
mais de 5 Sm more than 5 mw - 1 20 79
RENDA PESSOALinDiViDUAl inCOME
Até 3 Sm up to 3 mw - 1 20 79
mais de 3 até 5 Sm more than 3 up to 5 mw - - 19 81
mais de 5 Sm more than 5 mw - 2 22 76
REGIÃOREgiOn
Norte / Centro-oeste / North / Center-west 1 1 21 78
Nordeste / Northeast - 1 20 79
Sudeste / Southeast - 1 20 79
Sul / South - - 18 82
DEPENDêNCIA ADMINISTRATIvAADMinisTRATiVE
JURisDiCTiOn
municipal / municipal - 1 19 80
Estadual / State - 1 21 78
SÉRIEgRADE
4a série / 5o ano do Ensino Fundamental4th grade / 5th year elementary education - 1 17 83
8a série / 9o ano do Ensino Fundamental8th grade / 9th year elementary education - 1 20 80
2o ano do Ensino médio2nd year of Secondary education - 1 22 77
COMPUTADOR INSTALADO
NO LABORATóRIO DE INFORMÁTICA
COMPUTER insTAllED AT iT lAb
Sim / yes - 1 20 79
Não / No - 2 19 80
INTERNET INSTALADA NO LABORATóRIO DE INFORMÁTICA
inTERnET AVAilAblE AT iT lAb
Sim / yes - 1 21 78
Não / No - 1 17 82
1 Base: 1.535 professores. Respostas estimuladas.1 base: 1,535 teachers. stimulated answers.
E1 PERCEPÇÃO DO PROFESSOR SOBRE OS OBJETIvOS PEDAGóGICOS – ContinuaçãoteaCher’S PerCePtIoN oN PedagogIC oBJeCtIveS – ContinuationPercentual sobre o total de professores 1Percentage of the total number of teachers 1

Survey on ICT Education 2010TABLES OF RESuLTS – TEACHERS
PO
RTu
Gu
ÊS
En
gli
sh
302
Percentual (%)Percentage (%)
Assegurar um bom resultado do aluno em testes de desempenhoEnsuring students do well in performance tests
Nada importante
not important
Pouco importante
Of little importance
Importanteimportant
Muito importante
Very important
TOTAL - 2 27 70
SEXOgEnDER
Feminino / female - 2 25 72
masculino / male - 1 34 64
FAIXA ETÁRIAAgE gROUP
≤ 30 - 3 28 69
31-45 - 1 27 71
46+ 1 2 28 70
RENDA FAMILIARFAMilY inCOME
Até 3 Sm up to 3 mw - - 27 73
mais de 3 até 5 Sm more than 3 up to 5 mw 1 2 27 71
mais de 5 Sm more than 5 mw - 2 28 69
RENDA PESSOALinDiViDUAl inCOME
Até 3 Sm up to 3 mw - 2 27 71
mais de 3 até 5 Sm more than 3 up to 5 mw 1 2 24 74
mais de 5 Sm more than 5 mw - 3 35 63
REGIÃOREgiOn
Norte / Centro-oeste / North / Center-west 1 3 29 68
Nordeste / Northeast - 2 28 71
Sudeste / Southeast - 2 29 69
Sul / South - 2 23 75
DEPENDêNCIA ADMINISTRATIvAADMinisTRATiVE
JURisDiCTiOn
municipal / municipal - 2 26 72
Estadual / State - 2 29 69
SÉRIEgRADE
4a série / 5o ano do Ensino Fundamental4th grade / 5th year elementary education - 2 25 73
8a série / 9o ano do Ensino Fundamental8th grade / 9th year elementary education - 2 27 70
2o ano do Ensino médio2nd year of Secondary education - 2 31 66
COMPUTADOR INSTALADO
NO LABORATóRIO DE INFORMÁTICA
COMPUTER insTAllED AT iT lAb
Sim / yes - 2 29 69
Não / No - 2 21 77
INTERNET INSTALADA NO LABORATóRIO DE INFORMÁTICA
inTERnET AVAilAblE AT iT lAb
Sim / yes - 2 29 69
Não / No 1 2 22 75
1 Base: 1.535 professores. Respostas estimuladas.1 base: 1,535 teachers. stimulated answers.
E1 PERCEPÇÃO DO PROFESSOR SOBRE OS OBJETIvOS PEDAGóGICOS – ContinuaçãoteaCher’S PerCePtIoN oN PedagogIC oBJeCtIveS – ContinuatioPercentual sobre o total de professores 1Percentage of the total number of teachers 1
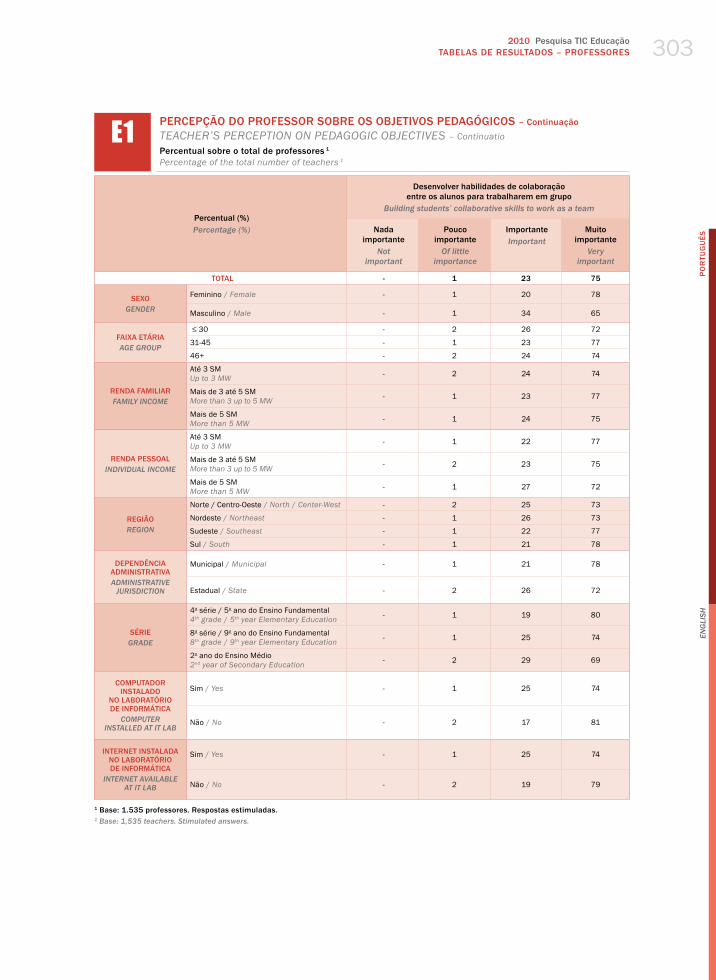
2010 Pesquisa TIC EducaçãoTABELAS DE RESuLTADOS – PROFESSORES
PO
RTu
Gu
ÊS
En
gli
sh
303
Percentual (%)Percentage (%)
Desenvolver habilidades de colaboração entre os alunos para trabalharem em grupo
building students’ collaborative skills to work as a team
Nada importante
not important
Pouco importante
Of little importance
Importanteimportant
Muito importante
Very important
TOTAL - 1 23 75
SEXOgEnDER
Feminino / female - 1 20 78
masculino / male - 1 34 65
FAIXA ETÁRIAAgE gROUP
≤ 30 - 2 26 72
31-45 - 1 23 77
46+ - 2 24 74
RENDA FAMILIARFAMilY inCOME
Até 3 Sm up to 3 mw - 2 24 74
mais de 3 até 5 Sm more than 3 up to 5 mw - 1 23 77
mais de 5 Sm more than 5 mw - 1 24 75
RENDA PESSOALinDiViDUAl inCOME
Até 3 Sm up to 3 mw - 1 22 77
mais de 3 até 5 Sm more than 3 up to 5 mw - 2 23 75
mais de 5 Sm more than 5 mw - 1 27 72
REGIÃOREgiOn
Norte / Centro-oeste / North / Center-west - 2 25 73
Nordeste / Northeast - 1 26 73
Sudeste / Southeast - 1 22 77
Sul / South - 1 21 78
DEPENDêNCIA ADMINISTRATIvAADMinisTRATiVE
JURisDiCTiOn
municipal / municipal - 1 21 78
Estadual / State - 2 26 72
SÉRIEgRADE
4a série / 5o ano do Ensino Fundamental4th grade / 5th year elementary education - 1 19 80
8a série / 9o ano do Ensino Fundamental8th grade / 9th year elementary education - 1 25 74
2o ano do Ensino médio2nd year of Secondary education - 2 29 69
COMPUTADOR INSTALADO
NO LABORATóRIO DE INFORMÁTICA
COMPUTER insTAllED AT iT lAb
Sim / yes - 1 25 74
Não / No - 2 17 81
INTERNET INSTALADA NO LABORATóRIO DE INFORMÁTICA
inTERnET AVAilAblE AT iT lAb
Sim / yes - 1 25 74
Não / No - 2 19 79
1 Base: 1.535 professores. Respostas estimuladas.1 base: 1,535 teachers. stimulated answers.
E1 PERCEPÇÃO DO PROFESSOR SOBRE OS OBJETIvOS PEDAGóGICOS – ContinuaçãoteaCher’S PerCePtIoN oN PedagogIC oBJeCtIveS – ContinuatioPercentual sobre o total de professores 1Percentage of the total number of teachers 1
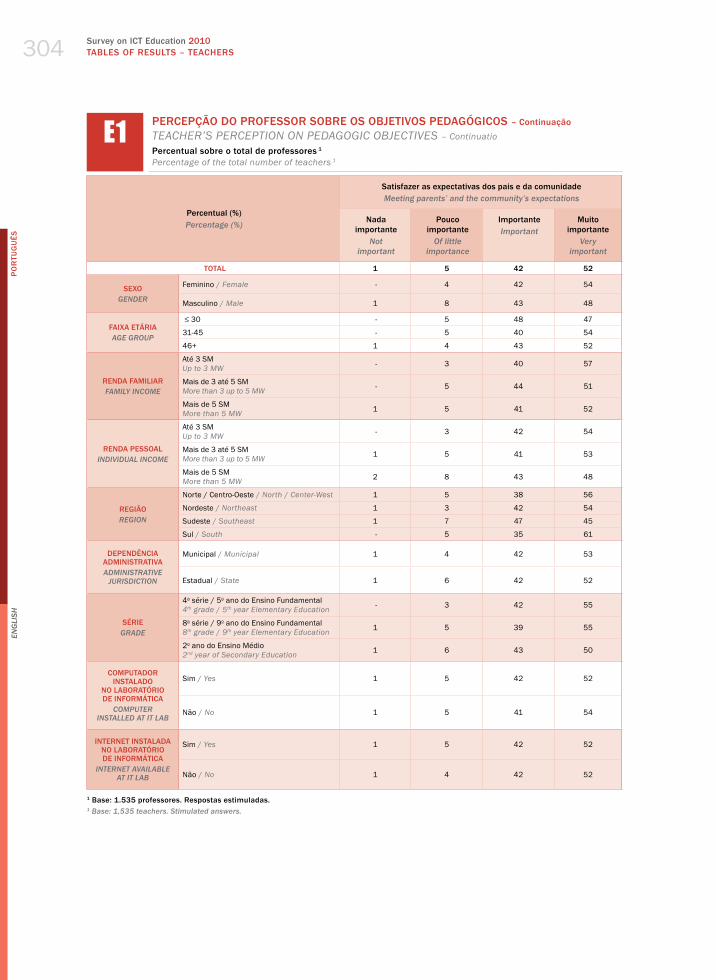
Survey on ICT Education 2010TABLES OF RESuLTS – TEACHERS
PO
RTu
Gu
ÊS
En
gli
sh
304
Percentual (%)Percentage (%)
Satisfazer as expectativas dos pais e da comunidadeMeeting parents’ and the community’s expectations
Nada importante
not important
Pouco importante
Of little importance
Importanteimportant
Muito importante
Very important
TOTAL 1 5 42 52
SEXOgEnDER
Feminino / female - 4 42 54
masculino / male 1 8 43 48
FAIXA ETÁRIAAgE gROUP
≤ 30 - 5 48 47
31-45 - 5 40 54
46+ 1 4 43 52
RENDA FAMILIARFAMilY inCOME
Até 3 Sm up to 3 mw - 3 40 57
mais de 3 até 5 Sm more than 3 up to 5 mw - 5 44 51
mais de 5 Sm more than 5 mw 1 5 41 52
RENDA PESSOALinDiViDUAl inCOME
Até 3 Sm up to 3 mw - 3 42 54
mais de 3 até 5 Sm more than 3 up to 5 mw 1 5 41 53
mais de 5 Sm more than 5 mw 2 8 43 48
REGIÃOREgiOn
Norte / Centro-oeste / North / Center-west 1 5 38 56
Nordeste / Northeast 1 3 42 54
Sudeste / Southeast 1 7 47 45
Sul / South - 5 35 61
DEPENDêNCIA ADMINISTRATIvAADMinisTRATiVE
JURisDiCTiOn
municipal / municipal 1 4 42 53
Estadual / State 1 6 42 52
SÉRIEgRADE
4a série / 5o ano do Ensino Fundamental4th grade / 5th year elementary education - 3 42 55
8a série / 9o ano do Ensino Fundamental8th grade / 9th year elementary education 1 5 39 55
2o ano do Ensino médio2nd year of Secondary education 1 6 43 50
COMPUTADOR INSTALADO
NO LABORATóRIO DE INFORMÁTICA
COMPUTER insTAllED AT iT lAb
Sim / yes 1 5 42 52
Não / No 1 5 41 54
INTERNET INSTALADA NO LABORATóRIO DE INFORMÁTICA
inTERnET AVAilAblE AT iT lAb
Sim / yes 1 5 42 52
Não / No 1 4 42 52
1 Base: 1.535 professores. Respostas estimuladas.1 base: 1,535 teachers. stimulated answers.
E1 PERCEPÇÃO DO PROFESSOR SOBRE OS OBJETIvOS PEDAGóGICOS – ContinuaçãoteaCher’S PerCePtIoN oN PedagogIC oBJeCtIveS – ContinuatioPercentual sobre o total de professores 1Percentage of the total number of teachers 1

2010 Pesquisa TIC EducaçãoTABELAS DE RESuLTADOS – PROFESSORES
PO
RTu
Gu
ÊS
En
gli
sh
305
Percentual (%)Percentage (%)
Promover experiências de aprendizado individualizadas, atendendo a diferentes necessidades de aprendizagem
Promoting customized learning experiences to address different learning needs
Nada importante
not important
Pouco importante
Of little importance
Importanteimportant
Muito importante
Very important
TOTAL - 2 28 70
SEXOgEnDER
Feminino / female - 2 24 74
masculino / male - 3 40 58
FAIXA ETÁRIAAgE gROUP
≤ 30 - 3 34 63
31-45 - 1 28 71
46+ - 3 25 72
RENDA FAMILIARFAMilY inCOME
Até 3 Sm up to 3 mw - 3 29 68
mais de 3 até 5 Sm more than 3 up to 5 mw - 2 29 69
mais de 5 Sm more than 5 mw - 2 27 71
RENDA PESSOALinDiViDUAl inCOME
Até 3 Sm up to 3 mw - 2 29 69
mais de 3 até 5 Sm more than 3 up to 5 mw - 2 27 72
mais de 5 Sm more than 5 mw - 2 30 68
REGIÃOREgiOn
Norte / Centro-oeste / North / Center-west - 2 32 66
Nordeste / Northeast - 2 32 66
Sudeste / Southeast - 2 26 72
Sul / South - 2 20 78
DEPENDêNCIA ADMINISTRATIvAADMinisTRATiVE
JURisDiCTiOn
municipal / municipal - 1 26 72
Estadual / State - 2 30 68
SÉRIEgRADE
4a série / 5o ano do Ensino Fundamental4th grade / 5th year elementary education - 1 25 74
8a série / 9o ano do Ensino Fundamental8th grade / 9th year elementary education - 1 30 69
2o ano do Ensino médio2nd year of Secondary education - 3 32 65
COMPUTADOR INSTALADO
NO LABORATóRIO DE INFORMÁTICA
COMPUTER insTAllED AT iT lAb
Sim / yes - 2 28 70
Não / No - 2 27 71
INTERNET INSTALADA NO LABORATóRIO DE INFORMÁTICA
inTERnET AVAilAblE AT iT lAb
Sim / yes - 2 28 71
Não / No - 3 29 69
1 Base: 1.535 professores. Respostas estimuladas.1 base: 1,535 teachers. stimulated answers.
E1 PERCEPÇÃO DO PROFESSOR SOBRE OS OBJETIvOS PEDAGóGICOS – ContinuaçãoteaCher’S PerCePtIoN oN PedagogIC oBJeCtIveS – ContinuatioPercentual sobre o total de professores 1Percentage of the total number of teachers 1
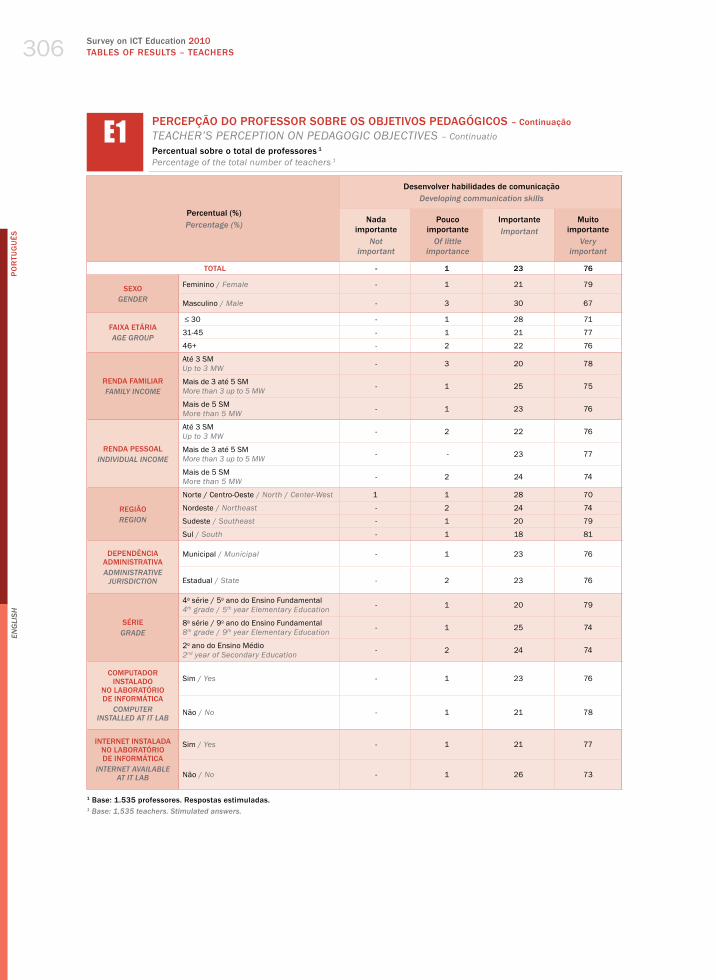
Survey on ICT Education 2010TABLES OF RESuLTS – TEACHERS
PO
RTu
Gu
ÊS
En
gli
sh
306
Percentual (%)Percentage (%)
Desenvolver habilidades de comunicaçãoDeveloping communication skills
Nada importante
not important
Pouco importante
Of little importance
Importanteimportant
Muito importante
Very important
TOTAL - 1 23 76
SEXOgEnDER
Feminino / female - 1 21 79
masculino / male - 3 30 67
FAIXA ETÁRIAAgE gROUP
≤ 30 - 1 28 71
31-45 - 1 21 77
46+ - 2 22 76
RENDA FAMILIARFAMilY inCOME
Até 3 Sm up to 3 mw - 3 20 78
mais de 3 até 5 Sm more than 3 up to 5 mw - 1 25 75
mais de 5 Sm more than 5 mw - 1 23 76
RENDA PESSOALinDiViDUAl inCOME
Até 3 Sm up to 3 mw - 2 22 76
mais de 3 até 5 Sm more than 3 up to 5 mw - - 23 77
mais de 5 Sm more than 5 mw - 2 24 74
REGIÃOREgiOn
Norte / Centro-oeste / North / Center-west 1 1 28 70
Nordeste / Northeast - 2 24 74
Sudeste / Southeast - 1 20 79
Sul / South - 1 18 81
DEPENDêNCIA ADMINISTRATIvAADMinisTRATiVE
JURisDiCTiOn
municipal / municipal - 1 23 76
Estadual / State - 2 23 76
SÉRIEgRADE
4a série / 5o ano do Ensino Fundamental4th grade / 5th year elementary education - 1 20 79
8a série / 9o ano do Ensino Fundamental8th grade / 9th year elementary education - 1 25 74
2o ano do Ensino médio2nd year of Secondary education - 2 24 74
COMPUTADOR INSTALADO
NO LABORATóRIO DE INFORMÁTICA
COMPUTER insTAllED AT iT lAb
Sim / yes - 1 23 76
Não / No - 1 21 78
INTERNET INSTALADA NO LABORATóRIO DE INFORMÁTICA
inTERnET AVAilAblE AT iT lAb
Sim / yes - 1 21 77
Não / No - 1 26 73
1 Base: 1.535 professores. Respostas estimuladas.1 base: 1,535 teachers. stimulated answers.
E1 PERCEPÇÃO DO PROFESSOR SOBRE OS OBJETIvOS PEDAGóGICOS – ContinuaçãoteaCher’S PerCePtIoN oN PedagogIC oBJeCtIveS – ContinuatioPercentual sobre o total de professores 1Percentage of the total number of teachers 1

2010 Pesquisa TIC EducaçãoTABELAS DE RESuLTADOS – PROFESSORES
PO
RTu
Gu
ÊS
En
gli
sh
307
Percentual (%)Percentage (%)
Preparar os alunos para que sejam competentes no uso da tecnologiaPreparing students to use technology effectively
Nada importante
not important
Pouco importante
Of little importance
Importanteimportant
Muito importante
Very important
TOTAL 1 3 27 70
SEXOgEnDER
Feminino / female - 2 27 71
masculino / male 1 4 28 67
FAIXA ETÁRIAAgE gROUP
≤ 30 - 4 25 70
31-45 - 3 29 68
46+ 2 2 25 72
RENDA FAMILIARFAMilY inCOME
Até 3 Sm up to 3 mw 2 1 29 68
mais de 3 até 5 Sm more than 3 up to 5 mw 1 4 24 72
mais de 5 Sm more than 5 mw - 2 29 69
RENDA PESSOALinDiViDUAl inCOME
Até 3 Sm up to 3 mw 1 2 26 71
mais de 3 até 5 Sm more than 3 up to 5 mw - 4 28 68
mais de 5 Sm more than 5 mw - 1 30 69
REGIÃOREgiOn
Norte / Centro-oeste / North / Center-west - 4 28 67
Nordeste / Northeast 1 2 26 71
Sudeste / Southeast - 2 31 67
Sul / South - 2 21 77
DEPENDêNCIA ADMINISTRATIvAADMinisTRATiVE
JURisDiCTiOn
municipal / municipal - 3 26 70
Estadual / State 1 2 28 69
SÉRIEgRADE
4a série / 5o ano do Ensino Fundamental4th grade / 5th year elementary education - 2 25 73
8a série / 9o ano do Ensino Fundamental8th grade / 9th year elementary education - 3 27 69
2o ano do Ensino médio2nd year of Secondary education 1 3 30 66
COMPUTADOR INSTALADO
NO LABORATóRIO DE INFORMÁTICA
COMPUTER insTAllED AT iT lAb
Sim / yes 1 2 27 70
Não / No 1 3 28 68
INTERNET INSTALADA NO LABORATóRIO DE INFORMÁTICA
inTERnET AVAilAblE AT iT lAb
Sim / yes - 2 26 71
Não / No 1 4 30 66
1 Base: 1.535 professores. Respostas estimuladas.1 base: 1,535 teachers. stimulated answers.
E1 PERCEPÇÃO DO PROFESSOR SOBRE OS OBJETIvOS PEDAGóGICOS – ContinuaçãoteaCher’S PerCePtIoN oN PedagogIC oBJeCtIveS – ContinuatioPercentual sobre o total de professores 1Percentage of the total number of teachers 1

Survey on ICT Education 2010TABLES OF RESuLTS – TEACHERS
PO
RTu
Gu
ÊS
En
gli
sh
308
Percentual (%)Percentage (%)
Dar oportunidades para os alunos aprenderem com especialistas e estudantes de outras escolas/países
Creating opportunities for students to learn with experts and students from other schools/countries
Nada importante
not important
Pouco importante
Of little importance
Importanteimportant
Muito importante
Very important
TOTAL 1 6 41 52
SEXOgEnDER
Feminino / female 1 5 40 54
masculino / male 2 9 43 46
FAIXA ETÁRIAAgE gROUP
≤ 30 1 8 41 50
31-45 1 5 42 52
46+ 1 6 39 53
RENDA FAMILIARFAMilY inCOME
Até 3 Sm up to 3 mw 2 5 38 55
mais de 3 até 5 Sm more than 3 up to 5 mw 1 6 39 53
mais de 5 Sm more than 5 mw - 6 42 52
RENDA PESSOALinDiViDUAl inCOME
Até 3 Sm up to 3 mw 1 6 39 54
mais de 3 até 5 Sm more than 3 up to 5 mw 1 6 40 53
mais de 5 Sm more than 5 mw - 7 45 48
REGIÃOREgiOn
Norte / Centro-oeste / North / Center-west 1 7 42 51
Nordeste / Northeast 2 6 40 53
Sudeste / Southeast 1 8 44 48
Sul / South - 3 33 65
DEPENDêNCIA ADMINISTRATIvAADMinisTRATiVE
JURisDiCTiOn
municipal / municipal 1 6 38 56
Estadual / State 1 6 44 49
SÉRIEgRADE
4a série / 5o ano do Ensino Fundamental4th grade / 5th year elementary education - 5 39 56
8a série / 9o ano do Ensino Fundamental8th grade / 9th year elementary education 1 6 41 53
2o ano do Ensino médio2nd year of Secondary education 2 8 42 49
COMPUTADOR INSTALADO
NO LABORATóRIO DE INFORMÁTICA
COMPUTER insTAllED AT iT lAb
Sim / yes 1 6 41 52
Não / No - 5 38 56
INTERNET INSTALADA NO LABORATóRIO DE INFORMÁTICA
inTERnET AVAilAblE AT iT lAb
Sim / yes 1 6 41 52
Não / No 1 6 40 53
1 Base: 1.535 professores. Respostas estimuladas.1 base: 1,535 teachers. stimulated answers.
E1 PERCEPÇÃO DO PROFESSOR SOBRE OS OBJETIvOS PEDAGóGICOS – ContinuaçãoteaCher’S PerCePtIoN oN PedagogIC oBJeCtIveS – ContinuatioPercentual sobre o total de professores 1Percentage of the total number of teachers 1

2010 Pesquisa TIC EducaçãoTABELAS DE RESuLTADOS – PROFESSORES
PO
RTu
Gu
ÊS
En
gli
sh
309
Percentual (%)Percentage (%)
Preparar os estudantes para um comportamento responsávelPreparing students to behave responsibly
Nada importante
not important
Pouco importante
Of little importance
Importanteimportant
Muito importante
Very important
TOTAL - 1 14 85
SEXOgEnDER
Feminino / female - 1 12 86
masculino / male - - 19 81
FAIXA ETÁRIAAgE gROUP
≤ 30 - 1 12 87
31-45 - 1 13 86
46+ - - 17 82
RENDA FAMILIARFAMilY inCOME
Até 3 Sm up to 3 mw - 2 16 82
mais de 3 até 5 Sm more than 3 up to 5 mw - 1 16 83
mais de 5 Sm more than 5 mw - 1 12 87
RENDA PESSOALinDiViDUAl inCOME
Até 3 Sm up to 3 mw - 1 15 83
mais de 3 até 5 Sm more than 3 up to 5 mw - - 13 87
mais de 5 Sm more than 5 mw - 1 14 85
REGIÃOREgiOn
Norte / Centro-oeste / North / Center-west - 1 17 82
Nordeste / Northeast - 2 17 81
Sudeste / Southeast - 1 12 87
Sul / South - - 8 92
DEPENDêNCIA ADMINISTRATIvAADMinisTRATiVE
JURisDiCTiOn
municipal / municipal - 1 13 86
Estadual / State - 1 15 84
SÉRIEgRADE
4a série / 5o ano do Ensino Fundamental4th grade / 5th year elementary education - 1 14 85
8a série / 9o ano do Ensino Fundamental8th grade / 9th year elementary education - 1 13 86
2o ano do Ensino médio2nd year of Secondary education - 1 15 84
COMPUTADOR INSTALADO
NO LABORATóRIO DE INFORMÁTICA
COMPUTER insTAllED AT iT lAb
Sim / yes - 1 15 84
Não / No - 1 10 89
INTERNET INSTALADA NO LABORATóRIO DE INFORMÁTICA
inTERnET AVAilAblE AT iT lAb
Sim / yes - 1 14 85
Não / No - 1 13 85
1 Base: 1.535 professores. Respostas estimuladas.1 base: 1,535 teachers. stimulated answers.
E1 PERCEPÇÃO DO PROFESSOR SOBRE OS OBJETIvOS PEDAGóGICOS – ContinuaçãoteaCher’S PerCePtIoN oN PedagogIC oBJeCtIveS – ContinuatioPercentual sobre o total de professores 1Percentage of the total number of teachers 1

Survey on ICT Education 2010TABLES OF RESuLTS – TEACHERS
PO
RTu
Gu
ÊS
En
gli
sh
310
Percentual (%)Percentage (%)
Projetos ou trabalhos sobre um tema (como aquecimento global, Copa do Mundo, Dia das Mães, etc.)
Theme projects or assignments (such as global warming, World Cup, Mother’s Day, etc.)
Todos os dias ou quase Everyday or nearly everyday
Pelo menos uma vez
por semanaAt least
once a week
Pelo menos uma vez por mêsAt least
once a month
Menos de uma vez por mês
less than once a month
Não costuma realizar esta
atividadeDoes not
usually do this activity
TOTAL 10 34 35 14 7
SEXOgEnDER
Feminino / female 11 36 34 13 5
masculino / male 7 25 37 18 12
FAIXA ETÁRIAAgE gROUP
≤ 30 9 31 34 16 9
31-45 9 35 36 14 5
46+ 13 32 34 13 8
RENDA FAMILIARFAMilY inCOME
Até 3 Sm up to 3 mw 8 35 36 14 7
mais de 3 até 5 Sm more than 3 up to 5 mw 12 31 38 13 6
mais de 5 Sm more than 5 mw 10 35 33 15 7
RENDA PESSOALinDiViDUAl inCOME
Até 3 Sm up to 3 mw 11 35 33 14 8
mais de 3 até 5 Sm more than 3 up to 5 mw 10 33 39 13 6
mais de 5 Sm more than 5 mw 9 34 32 18 7
REGIÃOREgiOn
Norte / Centro-oeste / North / Center-west 8 34 36 16 6
Nordeste / Northeast 9 26 39 18 8
Sudeste / Southeast 12 39 32 12 5
Sul / South 13 37 29 12 8
DEPENDêNCIA ADMINISTRATIvAADMinisTRATiVE
JURisDiCTiOn
municipal / municipal 12 37 34 13 5
Estadual / State 9 31 36 15 9
SÉRIEgRADE
4a série / 5o ano do Ensino Fundamental4th grade / 5th year elementary education 13 42 30 11 4
8a série / 9o ano do Ensino Fundamental8th grade / 9th year elementary education 9 29 38 16 8
2o ano do Ensino médio2nd year of Secondary education 8 23 40 18 10
COMPUTADOR INSTALADO
NO LABORATóRIO DE INFORMÁTICA
COMPUTER insTAllED AT iT lAb
Sim / yes 10 33 35 15 7
Não / No 12 37 33 13 5
INTERNET INSTALADA NO LABORATóRIO DE INFORMÁTICA
inTERnET AVAilAblE AT iT lAb
Sim / yes 9 33 36 15 8
Não / No 12 37 33 13 5
1 Base: 1.535 professores. Respostas estimuladas.1 base: 1,535 teachers. stimulated answers.
E2 PRÁTICA DOCENTE – FREQUêNCIAteaChINg PraCtICe – freQueNCyPercentual sobre o total de professores 1Percentage of the total number of teachers 1

2010 Pesquisa TIC EducaçãoTABELAS DE RESuLTADOS – PROFESSORES
PO
RTu
Gu
ÊS
En
gli
sh
311
Percentual (%)Percentage (%)
Produção de materiais pelos alunos (textos de diferentes gêneros, desenhos, maquetes, relatórios, etc.)
Production of materials by students (different genres of texts, drawings, models, reports, etc.)
Todos os dias ou quase Everyday or nearly everyday
Pelo menos uma vez
por semanaAt least
once a week
Pelo menos uma vez por mêsAt least
once a month
Menos de uma vez por mês
less than once a month
Não costuma realizar esta
atividadeDoes not
usually do this activity
TOTAL 15 36 28 13 7
SEXOgEnDER
Feminino / female 17 39 27 12 5
masculino / male 9 26 31 20 15
FAIXA ETÁRIAAgE gROUP
≤ 30 14 33 30 15 8
31-45 16 38 28 12 6
46+ 14 35 27 15 10
RENDA FAMILIARFAMilY inCOME
Até 3 Sm up to 3 mw 7 45 26 17 6
mais de 3 até 5 Sm more than 3 up to 5 mw 17 38 25 12 7
mais de 5 Sm more than 5 mw 16 33 30 13 8
RENDA PESSOALinDiViDUAl inCOME
Até 3 Sm up to 3 mw 13 40 28 14 6
mais de 3 até 5 Sm more than 3 up to 5 mw 19 35 25 13 8
mais de 5 Sm more than 5 mw 12 32 33 14 10
REGIÃOREgiOn
Norte / Centro-oeste / North / Center-west 11 36 29 15 9
Nordeste / Northeast 12 37 31 12 7
Sudeste / Southeast 21 35 23 14 8
Sul / South 13 37 32 12 7
DEPENDêNCIA ADMINISTRATIvAADMinisTRATiVE
JURisDiCTiOn
municipal / municipal 16 40 26 12 6
Estadual / State 14 32 30 15 9
SÉRIEgRADE
4a série / 5o ano do Ensino Fundamental4th grade / 5th year elementary education 20 43 23 9 5
8a série / 9o ano do Ensino Fundamental8th grade / 9th year elementary education 12 33 31 15 8
2o ano do Ensino médio2nd year of Secondary education 12 29 32 17 11
COMPUTADOR INSTALADO
NO LABORATóRIO DE INFORMÁTICA
COMPUTER insTAllED AT iT lAb
Sim / yes 14 35 29 14 8
Não / No 18 40 23 12 7
INTERNET INSTALADA NO LABORATóRIO DE INFORMÁTICA
inTERnET AVAilAblE AT iT lAb
Sim / yes 13 35 30 14 8
Não / No 20 39 24 12 6
1 Base: 1.535 professores. Respostas estimuladas.1 base: 1,535 teachers. stimulated answers.
E2 PRÁTICA DOCENTE – FREQUêNCIA – ContinuaçãoteaChINg PraCtICe – freQueNCy – ContinuationPercentual sobre o total de professores 1Percentage of the total number of teachers 1
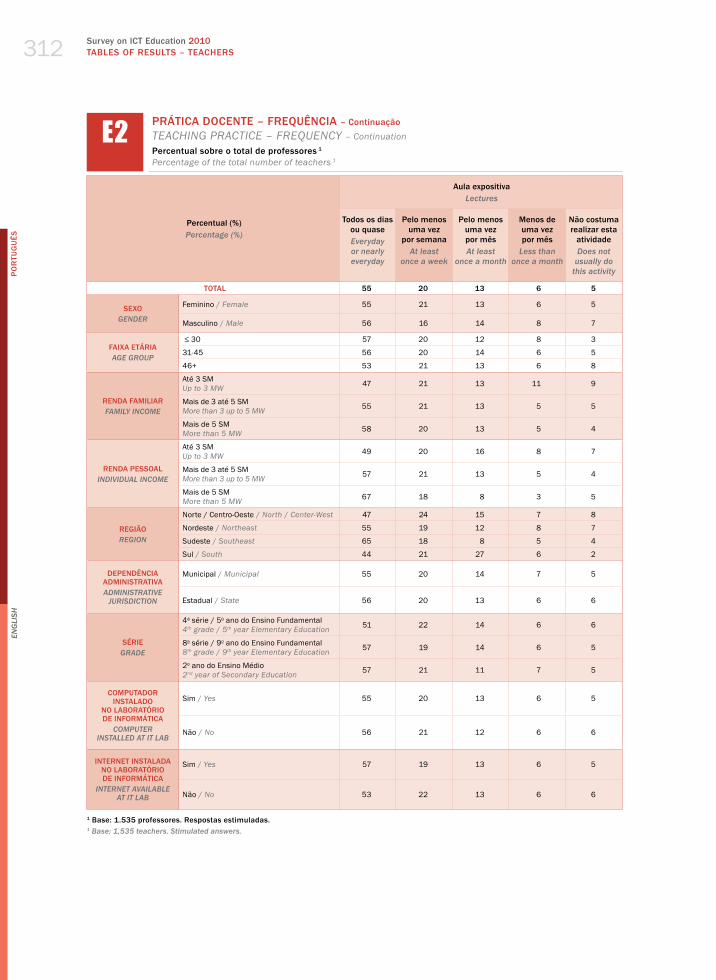
Survey on ICT Education 2010TABLES OF RESuLTS – TEACHERS
PO
RTu
Gu
ÊS
En
gli
sh
312
Percentual (%)Percentage (%)
Aula expositivalectures
Todos os dias ou quase Everyday or nearly everyday
Pelo menos uma vez
por semanaAt least
once a week
Pelo menos uma vez por mêsAt least
once a month
Menos de uma vez por mês
less than once a month
Não costuma realizar esta
atividadeDoes not
usually do this activity
TOTAL 55 20 13 6 5
SEXOgEnDER
Feminino / female 55 21 13 6 5
masculino / male 56 16 14 8 7
FAIXA ETÁRIAAgE gROUP
≤ 30 57 20 12 8 3
31-45 56 20 14 6 5
46+ 53 21 13 6 8
RENDA FAMILIARFAMilY inCOME
Até 3 Sm up to 3 mw 47 21 13 11 9
mais de 3 até 5 Sm more than 3 up to 5 mw 55 21 13 5 5
mais de 5 Sm more than 5 mw 58 20 13 5 4
RENDA PESSOALinDiViDUAl inCOME
Até 3 Sm up to 3 mw 49 20 16 8 7
mais de 3 até 5 Sm more than 3 up to 5 mw 57 21 13 5 4
mais de 5 Sm more than 5 mw 67 18 8 3 5
REGIÃOREgiOn
Norte / Centro-oeste / North / Center-west 47 24 15 7 8
Nordeste / Northeast 55 19 12 8 7
Sudeste / Southeast 65 18 8 5 4
Sul / South 44 21 27 6 2
DEPENDêNCIA ADMINISTRATIvAADMinisTRATiVE
JURisDiCTiOn
municipal / municipal 55 20 14 7 5
Estadual / State 56 20 13 6 6
SÉRIEgRADE
4a série / 5o ano do Ensino Fundamental4th grade / 5th year elementary education 51 22 14 6 6
8a série / 9o ano do Ensino Fundamental8th grade / 9th year elementary education 57 19 14 6 5
2o ano do Ensino médio2nd year of Secondary education 57 21 11 7 5
COMPUTADOR INSTALADO
NO LABORATóRIO DE INFORMÁTICA
COMPUTER insTAllED AT iT lAb
Sim / yes 55 20 13 6 5
Não / No 56 21 12 6 6
INTERNET INSTALADA NO LABORATóRIO DE INFORMÁTICA
inTERnET AVAilAblE AT iT lAb
Sim / yes 57 19 13 6 5
Não / No 53 22 13 6 6
1 Base: 1.535 professores. Respostas estimuladas.1 base: 1,535 teachers. stimulated answers.
E2 PRÁTICA DOCENTE – FREQUêNCIA – ContinuaçãoteaChINg PraCtICe – freQueNCy – ContinuationPercentual sobre o total de professores 1Percentage of the total number of teachers 1

2010 Pesquisa TIC EducaçãoTABELAS DE RESuLTADOS – PROFESSORES
PO
RTu
Gu
ÊS
En
gli
sh
313
Percentual (%)Percentage (%)
Exercícios para prática e fixação de conteúdoPractical exercises for content retention
Todos os dias ou quase Everyday or nearly everyday
Pelo menos uma vez
por semanaAt least
once a week
Pelo menos uma vez por mêsAt least
once a month
Menos de uma vez por mês
less than once a month
Não costuma realizar esta
atividadeDoes not
usually do this activity
TOTAL 74 16 5 3 3
SEXOgEnDER
Feminino / female 75 16 5 2 3
masculino / male 70 17 5 3 4
FAIXA ETÁRIAAgE gROUP
≤ 30 79 11 5 2 2
31-45 73 17 4 3 2
46+ 72 16 6 2 5
RENDA FAMILIARFAMilY inCOME
Até 3 Sm up to 3 mw 76 12 3 5 4
mais de 3 até 5 Sm more than 3 up to 5 mw 73 18 5 1 3
mais de 5 Sm more than 5 mw 74 16 5 2 3
RENDA PESSOALinDiViDUAl inCOME
Até 3 Sm up to 3 mw 75 14 5 3 3
mais de 3 até 5 Sm more than 3 up to 5 mw 73 17 6 2 2
mais de 5 Sm more than 5 mw 71 19 4 2 4
REGIÃOREgiOn
Norte / Centro-oeste / North / Center-west 63 19 8 4 5
Nordeste / Northeast 78 11 5 4 2
Sudeste / Southeast 74 19 3 2 2
Sul / South 75 16 5 1 3
DEPENDêNCIA ADMINISTRATIvAADMinisTRATiVE
JURisDiCTiOn
municipal / municipal 76 14 5 3 2
Estadual / State 71 18 5 2 4
SÉRIEgRADE
4a série / 5o ano do Ensino Fundamental4th grade / 5th year elementary education 74 14 6 3 3
8a série / 9o ano do Ensino Fundamental8th grade / 9th year elementary education 77 13 4 2 3
2o ano do Ensino médio2nd year of Secondary education 70 20 4 2 3
COMPUTADOR INSTALADO
NO LABORATóRIO DE INFORMÁTICA
COMPUTER insTAllED AT iT lAb
Sim / yes 73 17 5 3 3
Não / No 75 13 6 3 3
INTERNET INSTALADA NO LABORATóRIO DE INFORMÁTICA
inTERnET AVAilAblE AT iT lAb
Sim / yes 73 16 5 2 3
Não / No 74 15 5 3 3
1 Base: 1.535 professores. Respostas estimuladas.1 base: 1,535 teachers. stimulated answers.
E2 PRÁTICA DOCENTE – FREQUêNCIA – ContinuaçãoteaChINg PraCtICe – freQueNCy – ContinuationPercentual sobre o total de professores 1Percentage of the total number of teachers 1

Survey on ICT Education 2010TABLES OF RESuLTS – TEACHERS
PO
RTu
Gu
ÊS
En
gli
sh
314
Percentual (%)Percentage (%)
Experiências de ciênciasscience experiments
Todos os dias ou quase Everyday or nearly everyday
Pelo menos uma vez
por semanaAt least
once a week
Pelo menos uma vez por mêsAt least
once a month
Menos de uma vez por mês
less than once a month
Não costuma realizar esta
atividadeDoes not
usually do this activity
TOTAL 5 17 20 16 42
SEXOgEnDER
Feminino / female 5 18 21 16 40
masculino / male 5 13 15 17 49
FAIXA ETÁRIAAgE gROUP
≤ 30 3 15 20 18 44
31-45 5 17 22 16 40
46+ 6 17 17 15 46
RENDA FAMILIARFAMilY inCOME
Até 3 Sm up to 3 mw 4 20 20 20 36
mais de 3 até 5 Sm more than 3 up to 5 mw 6 18 22 17 37
mais de 5 Sm more than 5 mw 5 15 19 14 47
RENDA PESSOALinDiViDUAl inCOME
Até 3 Sm up to 3 mw 5 18 21 18 38
mais de 3 até 5 Sm more than 3 up to 5 mw 5 17 22 15 41
mais de 5 Sm more than 5 mw 5 15 15 14 52
REGIÃOREgiOn
Norte / Centro-oeste / North / Center-west 6 20 21 18 36
Nordeste / Northeast 5 17 19 18 41
Sudeste / Southeast 4 16 19 13 47
Sul / South 7 14 24 14 42
DEPENDêNCIA ADMINISTRATIvAADMinisTRATiVE
JURisDiCTiOn
municipal / municipal 5 19 23 18 34
Estadual / State 5 14 16 14 51
SÉRIEgRADE
4a série / 5o ano do Ensino Fundamental4th grade / 5th year elementary education 6 24 30 18 21
8a série / 9o ano do Ensino Fundamental8th grade / 9th year elementary education 5 12 16 16 52
2o ano do Ensino médio2nd year of Secondary education 4 11 12 14 59
COMPUTADOR INSTALADO
NO LABORATóRIO DE INFORMÁTICA
COMPUTER insTAllED AT iT lAb
Sim / yes 5 16 20 16 43
Não / No 5 19 21 16 39
INTERNET INSTALADA NO LABORATóRIO DE INFORMÁTICA
inTERnET AVAilAblE AT iT lAb
Sim / yes 5 16 20 15 45
Não / No 6 19 21 17 37
1 Base: 1.535 professores. Respostas estimuladas.1 base: 1,535 teachers. stimulated answers.
E2 PRÁTICA DOCENTE – FREQUêNCIA – ContinuaçãoteaChINg PraCtICe – freQueNCy – ContinuationPercentual sobre o total de professores 1Percentage of the total number of teachers 1
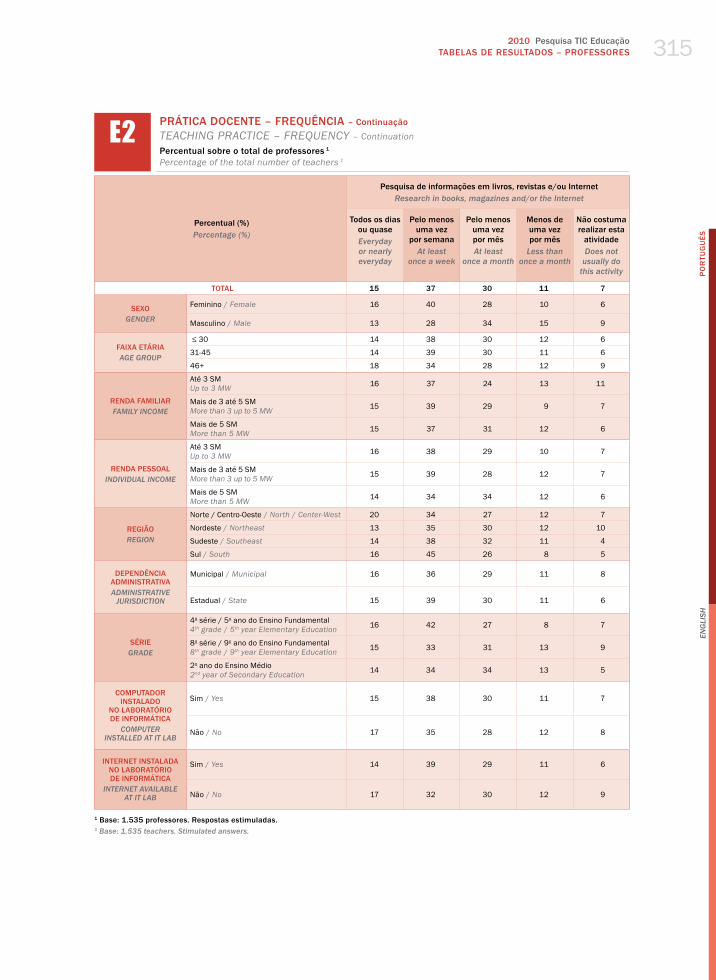
2010 Pesquisa TIC EducaçãoTABELAS DE RESuLTADOS – PROFESSORES
PO
RTu
Gu
ÊS
En
gli
sh
315
Percentual (%)Percentage (%)
Pesquisa de informações em livros, revistas e/ou InternetResearch in books, magazines and/or the internet
Todos os dias ou quase Everyday or nearly everyday
Pelo menos uma vez
por semanaAt least
once a week
Pelo menos uma vez por mêsAt least
once a month
Menos de uma vez por mês
less than once a month
Não costuma realizar esta
atividadeDoes not
usually do this activity
TOTAL 15 37 30 11 7
SEXOgEnDER
Feminino / female 16 40 28 10 6
masculino / male 13 28 34 15 9
FAIXA ETÁRIAAgE gROUP
≤ 30 14 38 30 12 6
31-45 14 39 30 11 6
46+ 18 34 28 12 9
RENDA FAMILIARFAMilY inCOME
Até 3 Sm up to 3 mw 16 37 24 13 11
mais de 3 até 5 Sm more than 3 up to 5 mw 15 39 29 9 7
mais de 5 Sm more than 5 mw 15 37 31 12 6
RENDA PESSOALinDiViDUAl inCOME
Até 3 Sm up to 3 mw 16 38 29 10 7
mais de 3 até 5 Sm more than 3 up to 5 mw 15 39 28 12 7
mais de 5 Sm more than 5 mw 14 34 34 12 6
REGIÃOREgiOn
Norte / Centro-oeste / North / Center-west 20 34 27 12 7
Nordeste / Northeast 13 35 30 12 10
Sudeste / Southeast 14 38 32 11 4
Sul / South 16 45 26 8 5
DEPENDêNCIA ADMINISTRATIvAADMinisTRATiVE
JURisDiCTiOn
municipal / municipal 16 36 29 11 8
Estadual / State 15 39 30 11 6
SÉRIEgRADE
4a série / 5o ano do Ensino Fundamental4th grade / 5th year elementary education 16 42 27 8 7
8a série / 9o ano do Ensino Fundamental8th grade / 9th year elementary education 15 33 31 13 9
2o ano do Ensino médio2nd year of Secondary education 14 34 34 13 5
COMPUTADOR INSTALADO
NO LABORATóRIO DE INFORMÁTICA
COMPUTER insTAllED AT iT lAb
Sim / yes 15 38 30 11 7
Não / No 17 35 28 12 8
INTERNET INSTALADA NO LABORATóRIO DE INFORMÁTICA
inTERnET AVAilAblE AT iT lAb
Sim / yes 14 39 29 11 6
Não / No 17 32 30 12 9
1 Base: 1.535 professores. Respostas estimuladas.1 base: 1,535 teachers. stimulated answers.
E2 PRÁTICA DOCENTE – FREQUêNCIA – ContinuaçãoteaChINg PraCtICe – freQueNCy – ContinuationPercentual sobre o total de professores 1Percentage of the total number of teachers 1

Survey on ICT Education 2010TABLES OF RESuLTS – TEACHERS
PO
RTu
Gu
ÊS
En
gli
sh
316
Percentual (%)Percentage (%)
Interpretação de textosReading comprehension
Todos os dias ou quase Everyday or nearly everyday
Pelo menos uma vez
por semanaAt least
once a week
Pelo menos uma vez por mêsAt least
once a month
Menos de uma vez por mês
less than once a month
Não costuma realizar esta
atividadeDoes not
usually do this activity
TOTAL 54 25 7 5 10
SEXOgEnDER
Feminino / female 58 26 6 3 7
masculino / male 38 22 11 9 20
FAIXA ETÁRIAAgE gROUP
≤ 30 49 25 9 6 11
31-45 55 25 7 5 8
46+ 54 25 6 3 12
RENDA FAMILIARFAMilY inCOME
Até 3 Sm up to 3 mw 54 24 9 4 8
mais de 3 até 5 Sm more than 3 up to 5 mw 56 26 7 4 8
mais de 5 Sm more than 5 mw 52 25 6 5 11
RENDA PESSOALinDiViDUAl inCOME
Até 3 Sm up to 3 mw 52 27 7 4 9
mais de 3 até 5 Sm more than 3 up to 5 mw 57 24 6 4 9
mais de 5 Sm more than 5 mw 50 24 8 6 13
REGIÃOREgiOn
Norte / Centro-oeste / North / Center-west 47 28 9 5 11
Nordeste / Northeast 54 23 7 5 12
Sudeste / Southeast 56 26 6 5 7
Sul / South 56 24 5 3 12
DEPENDêNCIA ADMINISTRATIvAADMinisTRATiVE
JURisDiCTiOn
municipal / municipal 56 26 7 4 8
Estadual / State 51 25 7 5 12
SÉRIEgRADE
4a série / 5o ano do Ensino Fundamental4th grade / 5th year elementary education 58 27 6 3 6
8a série / 9o ano do Ensino Fundamental8th grade / 9th year elementary education 52 23 8 5 11
2o ano do Ensino médio2nd year of Secondary education 48 23 8 6 14
COMPUTADOR INSTALADO
NO LABORATóRIO DE INFORMÁTICA
COMPUTER insTAllED AT iT lAb
Sim / yes 53 25 7 5 10
Não / No 56 28 6 3 7
INTERNET INSTALADA NO LABORATóRIO DE INFORMÁTICA
inTERnET AVAilAblE AT iT lAb
Sim / yes 52 25 7 5 11
Não / No 58 25 7 3 8
1 Base: 1.535 professores. Respostas estimuladas.1 base: 1,535 teachers. stimulated answers.
E2 PRÁTICA DOCENTE – FREQUêNCIA – ContinuaçãoteaChINg PraCtICe – freQueNCy – ContinuationPercentual sobre o total de professores 1Percentage of the total number of teachers 1

2010 Pesquisa TIC EducaçãoTABELAS DE RESuLTADOS – PROFESSORES
PO
RTu
Gu
ÊS
En
gli
sh
317
Percentual (%)Percentage (%)
Realização de debates e apresentações feitas pelos alunos para toda a turma
Debates and presentations made by students to the whole class
Todos os dias ou quase Everyday or nearly everyday
Pelo menos uma vez
por semanaAt least
once a week
Pelo menos uma vez por mêsAt least
once a month
Menos de uma vez por mês
less than once a month
Não costuma realizar esta
atividadeDoes not
usually do this activity
TOTAL 8 24 40 18 10
SEXOgEnDER
Feminino / female 9 26 41 16 8
masculino / male 6 17 36 26 15
FAIXA ETÁRIAAgE gROUP
≤ 30 8 26 35 18 12
31-45 8 24 41 18 9
46+ 9 22 38 20 11
RENDA FAMILIARFAMilY inCOME
Até 3 Sm up to 3 mw 10 28 33 16 12
mais de 3 até 5 Sm more than 3 up to 5 mw 10 23 40 19 8
mais de 5 Sm more than 5 mw 7 23 41 19 10
RENDA PESSOALinDiViDUAl inCOME
Até 3 Sm up to 3 mw 9 24 41 17 8
mais de 3 até 5 Sm more than 3 up to 5 mw 8 26 38 20 8
mais de 5 Sm more than 5 mw 7 20 38 19 15
REGIÃOREgiOn
Norte / Centro-oeste / North / Center-west 7 20 37 23 13
Nordeste / Northeast 11 27 36 17 9
Sudeste / Southeast 6 22 41 20 11
Sul / South 10 26 46 14 4
DEPENDêNCIA ADMINISTRATIvAADMinisTRATiVE
JURisDiCTiOn
municipal / municipal 9 25 39 19 8
Estadual / State 8 23 40 18 11
SÉRIEgRADE
4a série / 5o ano do Ensino Fundamental4th grade / 5th year elementary education 10 27 40 16 7
8a série / 9o ano do Ensino Fundamental8th grade / 9th year elementary education 8 25 37 19 10
2o ano do Ensino médio2nd year of Secondary education 8 21 39 19 13
COMPUTADOR INSTALADO
NO LABORATóRIO DE INFORMÁTICA
COMPUTER insTAllED AT iT lAb
Sim / yes 9 23 40 18 10
Não / No 8 26 36 20 11
INTERNET INSTALADA NO LABORATóRIO DE INFORMÁTICA
inTERnET AVAilAblE AT iT lAb
Sim / yes 8 24 40 18 10
Não / No 10 24 38 18 10
1 Base: 1.535 professores. Respostas estimuladas.1 base: 1,535 teachers. stimulated answers.
E2 PRÁTICA DOCENTE – FREQUêNCIA – ContinuaçãoteaChINg PraCtICe – freQueNCy – ContinuationPercentual sobre o total de professores 1Percentage of the total number of teachers 1

Survey on ICT Education 2010TABLES OF RESuLTS – TEACHERS
PO
RTu
Gu
ÊS
En
gli
sh
318
Percentual (%)Percentage (%)
Organizar e/ou mediar a comunicação entre alunos e especialistas/orientadores externosOrganizing and/or intermediating communication between students and external experts/advisors
Todos os dias ou quase Everyday or nearly everyday
Pelo menos uma vez
por semanaAt least
once a week
Pelo menos uma vez por mêsAt least
once a month
Menos de uma vez por mês
less than once a month
Não costuma realizar esta
atividadeDoes not
usually do this activity
TOTAL 5 11 18 25 41
SEXOgEnDER
Feminino / female 5 12 19 24 40
masculino / male 3 8 17 26 46
FAIXA ETÁRIAAgE gROUP
≤ 30 4 10 19 33 34
31-45 4 12 20 25 39
46+ 7 9 15 19 49
RENDA FAMILIARFAMilY inCOME
Até 3 Sm up to 3 mw 4 12 19 24 41
mais de 3 até 5 Sm more than 3 up to 5 mw 5 12 19 25 38
mais de 5 Sm more than 5 mw 5 10 18 24 42
RENDA PESSOALinDiViDUAl inCOME
Até 3 Sm up to 3 mw 4 12 19 24 40
mais de 3 até 5 Sm more than 3 up to 5 mw 6 11 19 26 39
mais de 5 Sm more than 5 mw 5 9 17 23 46
REGIÃOREgiOn
Norte / Centro-oeste / North / Center-west 3 14 17 27 40
Nordeste / Northeast 3 10 20 25 41
Sudeste / Southeast 7 10 16 23 44
Sul / South 6 11 21 27 36
DEPENDêNCIA ADMINISTRATIvAADMinisTRATiVE
JURisDiCTiOn
municipal / municipal 5 11 19 25 39
Estadual / State 5 10 17 24 43
SÉRIEgRADE
4a série / 5o ano do Ensino Fundamental4th grade / 5th year elementary education 5 15 19 24 38
8a série / 9o ano do Ensino Fundamental8th grade / 9th year elementary education 5 11 20 23 41
2o ano do Ensino médio2nd year of Secondary education 4 8 15 26 47
COMPUTADOR INSTALADO
NO LABORATóRIO DE INFORMÁTICA
COMPUTER insTAllED AT iT lAb
Sim / yes 5 11 18 24 42
Não / No 5 11 20 25 38
INTERNET INSTALADA NO LABORATóRIO DE INFORMÁTICA
inTERnET AVAilAblE AT iT lAb
Sim / yes 4 10 18 25 42
Não / No 6 13 19 22 39
1 Base: 1.535 professores. Respostas estimuladas.1 base: 1,535 teachers. stimulated answers.
E2 PRÁTICA DOCENTE – FREQUêNCIA – ContinuaçãoteaChINg PraCtICe – freQueNCy – ContinuationPercentual sobre o total de professores 1Percentage of the total number of teachers 1
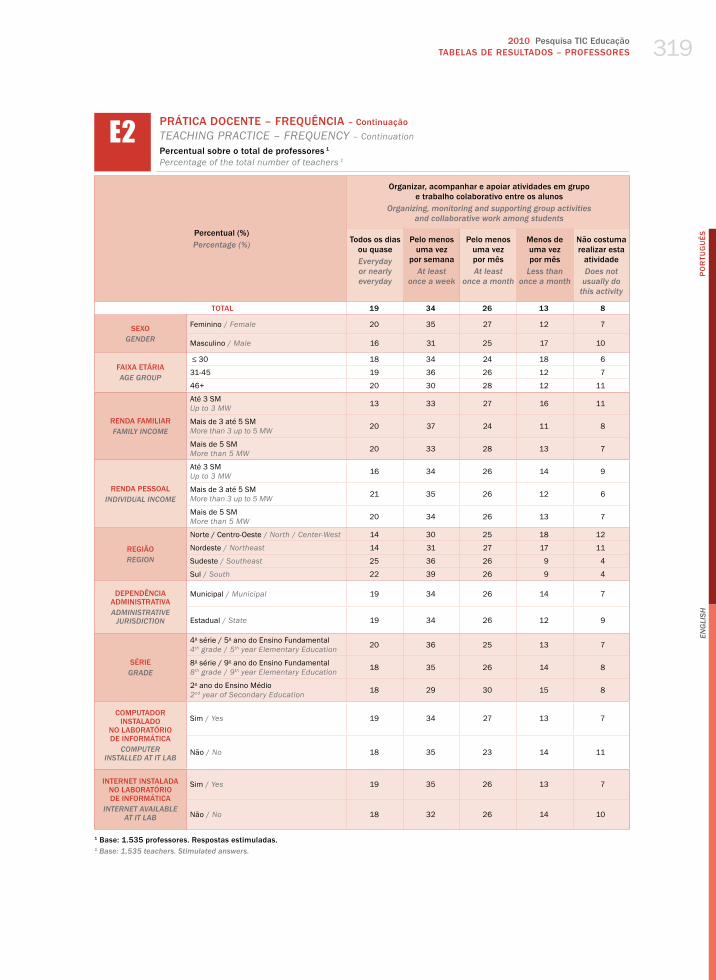
2010 Pesquisa TIC EducaçãoTABELAS DE RESuLTADOS – PROFESSORES
PO
RTu
Gu
ÊS
En
gli
sh
319
Percentual (%)Percentage (%)
Organizar, acompanhar e apoiar atividades em grupo e trabalho colaborativo entre os alunos
Organizing, monitoring and supporting group activities and collaborative work among students
Todos os dias ou quase Everyday or nearly everyday
Pelo menos uma vez
por semanaAt least
once a week
Pelo menos uma vez por mêsAt least
once a month
Menos de uma vez por mês
less than once a month
Não costuma realizar esta
atividadeDoes not
usually do this activity
TOTAL 19 34 26 13 8
SEXOgEnDER
Feminino / female 20 35 27 12 7
masculino / male 16 31 25 17 10
FAIXA ETÁRIAAgE gROUP
≤ 30 18 34 24 18 6
31-45 19 36 26 12 7
46+ 20 30 28 12 11
RENDA FAMILIARFAMilY inCOME
Até 3 Sm up to 3 mw 13 33 27 16 11
mais de 3 até 5 Sm more than 3 up to 5 mw 20 37 24 11 8
mais de 5 Sm more than 5 mw 20 33 28 13 7
RENDA PESSOALinDiViDUAl inCOME
Até 3 Sm up to 3 mw 16 34 26 14 9
mais de 3 até 5 Sm more than 3 up to 5 mw 21 35 26 12 6
mais de 5 Sm more than 5 mw 20 34 26 13 7
REGIÃOREgiOn
Norte / Centro-oeste / North / Center-west 14 30 25 18 12
Nordeste / Northeast 14 31 27 17 11
Sudeste / Southeast 25 36 26 9 4
Sul / South 22 39 26 9 4
DEPENDêNCIA ADMINISTRATIvAADMinisTRATiVE
JURisDiCTiOn
municipal / municipal 19 34 26 14 7
Estadual / State 19 34 26 12 9
SÉRIEgRADE
4a série / 5o ano do Ensino Fundamental4th grade / 5th year elementary education 20 36 25 13 7
8a série / 9o ano do Ensino Fundamental8th grade / 9th year elementary education 18 35 26 14 8
2o ano do Ensino médio2nd year of Secondary education 18 29 30 15 8
COMPUTADOR INSTALADO
NO LABORATóRIO DE INFORMÁTICA
COMPUTER insTAllED AT iT lAb
Sim / yes 19 34 27 13 7
Não / No 18 35 23 14 11
INTERNET INSTALADA NO LABORATóRIO DE INFORMÁTICA
inTERnET AVAilAblE AT iT lAb
Sim / yes 19 35 26 13 7
Não / No 18 32 26 14 10
1 Base: 1.535 professores. Respostas estimuladas.1 base: 1,535 teachers. stimulated answers.
E2 PRÁTICA DOCENTE – FREQUêNCIA – ContinuaçãoteaChINg PraCtICe – freQueNCy – ContinuationPercentual sobre o total de professores 1Percentage of the total number of teachers 1
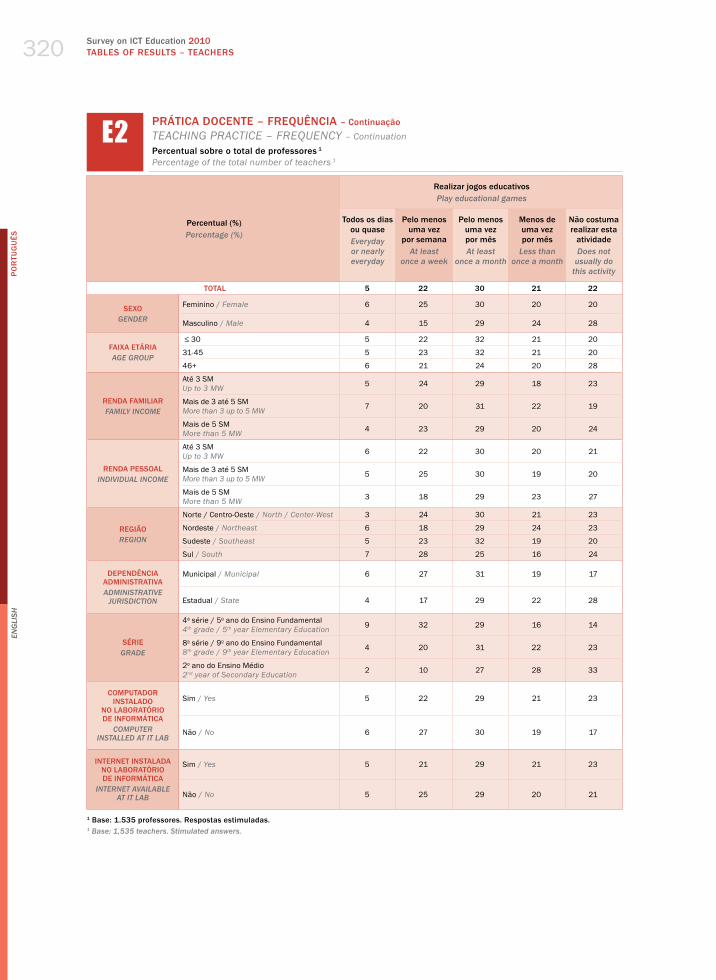
Survey on ICT Education 2010TABLES OF RESuLTS – TEACHERS
PO
RTu
Gu
ÊS
En
gli
sh
320
Percentual (%)Percentage (%)
Realizar jogos educativosPlay educational games
Todos os dias ou quase Everyday or nearly everyday
Pelo menos uma vez
por semanaAt least
once a week
Pelo menos uma vez por mêsAt least
once a month
Menos de uma vez por mês
less than once a month
Não costuma realizar esta
atividadeDoes not
usually do this activity
TOTAL 5 22 30 21 22
SEXOgEnDER
Feminino / female 6 25 30 20 20
masculino / male 4 15 29 24 28
FAIXA ETÁRIAAgE gROUP
≤ 30 5 22 32 21 20
31-45 5 23 32 21 20
46+ 6 21 24 20 28
RENDA FAMILIARFAMilY inCOME
Até 3 Sm up to 3 mw 5 24 29 18 23
mais de 3 até 5 Sm more than 3 up to 5 mw 7 20 31 22 19
mais de 5 Sm more than 5 mw 4 23 29 20 24
RENDA PESSOALinDiViDUAl inCOME
Até 3 Sm up to 3 mw 6 22 30 20 21
mais de 3 até 5 Sm more than 3 up to 5 mw 5 25 30 19 20
mais de 5 Sm more than 5 mw 3 18 29 23 27
REGIÃOREgiOn
Norte / Centro-oeste / North / Center-west 3 24 30 21 23
Nordeste / Northeast 6 18 29 24 23
Sudeste / Southeast 5 23 32 19 20
Sul / South 7 28 25 16 24
DEPENDêNCIA ADMINISTRATIvAADMinisTRATiVE
JURisDiCTiOn
municipal / municipal 6 27 31 19 17
Estadual / State 4 17 29 22 28
SÉRIEgRADE
4a série / 5o ano do Ensino Fundamental4th grade / 5th year elementary education 9 32 29 16 14
8a série / 9o ano do Ensino Fundamental8th grade / 9th year elementary education 4 20 31 22 23
2o ano do Ensino médio2nd year of Secondary education 2 10 27 28 33
COMPUTADOR INSTALADO
NO LABORATóRIO DE INFORMÁTICA
COMPUTER insTAllED AT iT lAb
Sim / yes 5 22 29 21 23
Não / No 6 27 30 19 17
INTERNET INSTALADA NO LABORATóRIO DE INFORMÁTICA
inTERnET AVAilAblE AT iT lAb
Sim / yes 5 21 29 21 23
Não / No 5 25 29 20 21
1 Base: 1.535 professores. Respostas estimuladas.1 base: 1,535 teachers. stimulated answers.
E2 PRÁTICA DOCENTE – FREQUêNCIA – ContinuaçãoteaChINg PraCtICe – freQueNCy – ContinuationPercentual sobre o total de professores 1Percentage of the total number of teachers 1

2010 Pesquisa TIC EducaçãoTABELAS DE RESuLTADOS – PROFESSORES
PO
RTu
Gu
ÊS
En
gli
sh
321
Percentual (%)Percentage (%)
Ensinar os alunos a usar computador e Internet (laboratório de informática)
Teaching students to use computers and the internet (iT lab)
Todos os dias ou quase Everyday or nearly everyday
Pelo menos uma vez
por semanaAt least
once a week
Pelo menos uma vez por mêsAt least
once a month
Menos de uma vez por mês
less than once a month
Não costuma realizar esta
atividadeDoes not
usually do this activity
TOTAL 2 17 9 12 59
SEXOgEnDER
Feminino / female 2 19 9 10 60
masculino / male 2 12 12 16 58
FAIXA ETÁRIAAgE gROUP
≤ 30 5 16 13 17 49
31-45 2 19 10 12 57
46+ 2 14 6 8 70
RENDA FAMILIARFAMilY inCOME
Até 3 Sm up to 3 mw 2 18 7 12 62
mais de 3 até 5 Sm more than 3 up to 5 mw 3 19 9 11 58
mais de 5 Sm more than 5 mw 2 17 10 11 60
RENDA PESSOALinDiViDUAl inCOME
Até 3 Sm up to 3 mw 2 18 8 11 61
mais de 3 até 5 Sm more than 3 up to 5 mw 3 19 10 11 58
mais de 5 Sm more than 5 mw 1 14 12 14 58
REGIÃOREgiOn
Norte / Centro-oeste / North / Center-west 1 18 15 13 52
Nordeste / Northeast 2 11 8 14 65
Sudeste / Southeast 2 22 8 10 57
Sul / South 4 18 9 8 61
DEPENDêNCIA ADMINISTRATIvAADMinisTRATiVE
JURisDiCTiOn
municipal / municipal 2 22 9 9 58
Estadual / State 2 12 10 14 61
SÉRIEgRADE
4a série / 5o ano do Ensino Fundamental4th grade / 5th year elementary education 2 26 8 8 55
8a série / 9o ano do Ensino Fundamental8th grade / 9th year elementary education 2 13 12 14 60
2o ano do Ensino médio2nd year of Secondary education 2 9 9 16 65
COMPUTADOR INSTALADO
NO LABORATóRIO DE INFORMÁTICA
COMPUTER insTAllED AT iT lAb
Sim / yes 2 20 11 13 54
Não / No 2 5 4 5 84
INTERNET INSTALADA NO LABORATóRIO DE INFORMÁTICA
inTERnET AVAilAblE AT iT lAb
Sim / yes 2 20 11 14 53
Não / No 3 11 5 6 76
1 Base: 1.535 professores. Respostas estimuladas.1 base: 1,535 teachers. stimulated answers.
E2 PRÁTICA DOCENTE – FREQUêNCIA – ContinuaçãoteaChINg PraCtICe – freQueNCy – ContinuationPercentual sobre o total de professores 1Percentage of the total number of teachers 1

Survey on ICT Education 2010TABLES OF RESuLTS – TEACHERS
PO
RTu
Gu
ÊS
En
gli
sh
322
Percentual (%)Percentage (%)
Apoio individualizado a alguns alunos para que possam alcançar o restante do grupoCustomized support to ensure certain students are able to perform with the rest of the group
Todos os dias ou quase Everyday or nearly everyday
Pelo menos uma vez
por semanaAt least
once a week
Pelo menos uma vez por mêsAt least
once a month
Menos de uma vez por mês
less than once a month
Não costuma realizar esta
atividadeDoes not
usually do this activity
TOTAL 42 28 12 7 11
SEXOgEnDER
Feminino / female 45 27 11 6 11
masculino / male 34 29 15 13 8
FAIXA ETÁRIAAgE gROUP
≤ 30 39 28 13 11 10
31-45 43 28 12 7 10
46+ 43 26 12 5 13
RENDA FAMILIARFAMilY inCOME
Até 3 Sm up to 3 mw 40 26 13 10 10
mais de 3 até 5 Sm more than 3 up to 5 mw 42 29 13 5 10
mais de 5 Sm more than 5 mw 43 27 12 7 11
RENDA PESSOALinDiViDUAl inCOME
Até 3 Sm up to 3 mw 41 30 11 8 10
mais de 3 até 5 Sm more than 3 up to 5 mw 44 28 12 6 11
mais de 5 Sm more than 5 mw 43 24 15 8 11
REGIÃOREgiOn
Norte / Centro-oeste / North / Center-west 36 27 12 9 16
Nordeste / Northeast 31 28 16 11 14
Sudeste / Southeast 54 25 9 5 6
Sul / South 45 34 11 2 8
DEPENDêNCIA ADMINISTRATIvAADMinisTRATiVE
JURisDiCTiOn
municipal / municipal 44 29 12 7 8
Estadual / State 41 25 12 8 14
SÉRIEgRADE
4a série / 5o ano do Ensino Fundamental4th grade / 5th year elementary education 47 27 11 6 10
8a série / 9o ano do Ensino Fundamental8th grade / 9th year elementary education 38 29 15 8 10
2o ano do Ensino médio2nd year of Secondary education 36 27 13 10 14
COMPUTADOR INSTALADO
NO LABORATóRIO DE INFORMÁTICA
COMPUTER insTAllED AT iT lAb
Sim / yes 41 29 12 7 10
Não / No 47 19 14 8 12
INTERNET INSTALADA NO LABORATóRIO DE INFORMÁTICA
inTERnET AVAilAblE AT iT lAb
Sim / yes 42 30 11 7 10
Não / No 44 23 14 7 12
1 Base: 1.535 professores. Respostas estimuladas.1 base: 1,535 teachers. stimulated answers.
E2 PRÁTICA DOCENTE – FREQUêNCIA – ContinuaçãoteaChINg PraCtICe – freQueNCy – ContinuationPercentual sobre o total de professores 1Percentage of the total number of teachers 1

2010 Pesquisa TIC EducaçãoTABELAS DE RESuLTADOS – PROFESSORES
PO
RTu
Gu
ÊS
En
gli
sh
323
Percentual (%)Percentage (%)
Contribuir com a comunidade por meio de projetos temáticos (como projetos ambientais)
Contributing to the community through theme projects (such as environmental projects)
Todos os dias ou quase Everyday or nearly everyday
Pelo menos uma vez
por semanaAt least
once a week
Pelo menos uma vez por mêsAt least
once a month
Menos de uma vez por mês
less than once a month
Não costuma realizar esta
atividadeDoes not
usually do this activity
TOTAL 3 10 26 29 32
SEXOgEnDER
Feminino / female 3 10 28 30 30
masculino / male 4 8 20 28 40
FAIXA ETÁRIAAgE gROUP
≤ 30 4 11 21 30 34
31-45 3 9 30 31 28
46+ 3 10 21 27 40
RENDA FAMILIARFAMilY inCOME
Até 3 Sm up to 3 mw 2 9 29 32 28
mais de 3 até 5 Sm more than 3 up to 5 mw 4 9 29 32 26
mais de 5 Sm more than 5 mw 3 10 23 27 37
RENDA PESSOALinDiViDUAl inCOME
Até 3 Sm up to 3 mw 3 9 26 31 31
mais de 3 até 5 Sm more than 3 up to 5 mw 3 10 27 28 32
mais de 5 Sm more than 5 mw 4 10 23 28 34
REGIÃOREgiOn
Norte / Centro-oeste / North / Center-west 3 11 27 26 32
Nordeste / Northeast 3 9 27 33 28
Sudeste / Southeast 3 9 26 29 33
Sul / South 3 10 22 27 38
DEPENDêNCIA ADMINISTRATIvAADMinisTRATiVE
JURisDiCTiOn
municipal / municipal 3 9 29 31 28
Estadual / State 3 10 22 28 37
SÉRIEgRADE
4a série / 5o ano do Ensino Fundamental4th grade / 5th year elementary education 4 12 30 29 25
8a série / 9o ano do Ensino Fundamental8th grade / 9th year elementary education 3 9 26 28 34
2o ano do Ensino médio2nd year of Secondary education 3 8 18 31 40
COMPUTADOR INSTALADO
NO LABORATóRIO DE INFORMÁTICA
COMPUTER insTAllED AT iT lAb
Sim / yes 3 10 26 29 32
Não / No 5 7 27 29 32
INTERNET INSTALADA NO LABORATóRIO DE INFORMÁTICA
inTERnET AVAilAblE AT iT lAb
Sim / yes 3 10 25 29 33
Não / No 4 9 27 29 31
1 Base: 1.535 professores. Respostas estimuladas.1 base: 1,535 teachers. stimulated answers.
E2 PRÁTICA DOCENTE – FREQUêNCIA – ContinuaçãoteaChINg PraCtICe – freQueNCy – ContinuationPercentual sobre o total de professores 1Percentage of the total number of teachers 1

Survey on ICT Education 2010TABLES OF RESuLTS – TEACHERS
PO
RTu
Gu
ÊS
En
gli
sh
324
Percentual (%)Percentage (%)
Conversar com pais sobre como eles podem apoiar/monitorar a aprendizagem dos filhos e oferecer aconselhamento
Talking to parents about how they can support / monitor their children’s learning and offering advice
Todos os dias ou quase Everyday or nearly everyday
Pelo menos uma vez
por semanaAt least
once a week
Pelo menos uma vez por mêsAt least
once a month
Menos de uma vez por mês
less than once a month
Não costuma realizar esta
atividadeDoes not
usually do this activity
TOTAL 6 12 36 35 12
SEXOgEnDER
Feminino / female 5 13 37 34 11
masculino / male 6 8 32 37 16
FAIXA ETÁRIAAgE gROUP
≤ 30 4 14 36 33 12
31-45 6 12 37 35 10
46+ 6 10 33 36 16
RENDA FAMILIARFAMilY inCOME
Até 3 Sm up to 3 mw 10 8 40 31 12
mais de 3 até 5 Sm more than 3 up to 5 mw 5 13 38 35 9
mais de 5 Sm more than 5 mw 5 12 33 37 13
RENDA PESSOALinDiViDUAl inCOME
Até 3 Sm up to 3 mw 6 10 39 36 9
mais de 3 até 5 Sm more than 3 up to 5 mw 5 15 36 32 12
mais de 5 Sm more than 5 mw 6 9 28 40 17
REGIÃOREgiOn
Norte / Centro-oeste / North / Center-west 6 15 35 29 16
Nordeste / Northeast 8 13 37 32 11
Sudeste / Southeast 4 8 35 40 13
Sul / South 4 14 37 37 9
DEPENDêNCIA ADMINISTRATIvAADMinisTRATiVE
JURisDiCTiOn
municipal / municipal 6 12 37 36 8
Estadual / State 5 11 34 34 17
SÉRIEgRADE
4a série / 5o ano do Ensino Fundamental4th grade / 5th year elementary education 7 13 40 33 8
8a série / 9o ano do Ensino Fundamental8th grade / 9th year elementary education 6 13 36 34 10
2o ano do Ensino médio2nd year of Secondary education 4 8 30 38 21
COMPUTADOR INSTALADO
NO LABORATóRIO DE INFORMÁTICA
COMPUTER insTAllED AT iT lAb
Sim / yes 5 12 36 35 13
Não / No 9 12 36 33 10
INTERNET INSTALADA NO LABORATóRIO DE INFORMÁTICA
inTERnET AVAilAblE AT iT lAb
Sim / yes 5 11 35 36 13
Não / No 8 13 36 33 10
1 Base: 1.535 professores. Respostas estimuladas.1 base: 1,535 teachers. stimulated answers.
E2 PRÁTICA DOCENTE – FREQUêNCIA – ContinuaçãoteaChINg PraCtICe – freQueNCy – ContinuationPercentual sobre o total de professores 1Percentage of the total number of teachers 1

2010 Pesquisa TIC EducaçãoTABELAS DE RESuLTADOS – PROFESSORES
PO
RTu
Gu
ÊS
En
gli
sh
325
Percentual (%)Percentage (%)
Ensinar os alunos
a usar computador
e Internet (laboratório de informática) ¹
Teaching students
to use computers
and the internet (iT lab) 1
Pesquisa de informações
em livros, revistas e/ou
Internet ²Researching
in books, magazines
and/or the internet 2
Projetos ou trabalhos
sobre um tema (como aqueci-mento global,
Copa do Mundo, Dia das
Mães, etc.) ³Theme
projects or assignments
(such as global warming, World Cup, Mother's
Day, etc.) 3
Produção de materiais pelos alunos (textos de diferentes
gêneros, desenhos, maquetes,
relatórios, etc.) 4
Production of materials by students (different
genres of texts, drawings, models, reports and etc.) 4
TOTAL 66 44 43 35
SEXOgEnDER
Feminino / female 68 44 43 35
masculino / male 57 46 43 34
FAIXA ETÁRIAAgE gROUP
≤ 30 65 45 50 36
31-45 68 46 44 37
46+ 61 41 37 31
RENDA FAMILIARFAMilY inCOME
Até 3 Sm up to 3 mw 54 33 30 24
mais de 3 até 5 Sm more than 3 up to 5 mw 65 45 43 33
mais de 5 Sm more than 5 mw 70 48 47 40
RENDA PESSOALinDiViDUAl inCOME
Até 3 Sm up to 3 mw 62 41 37 29
mais de 3 até 5 Sm more than 3 up to 5 mw 67 46 46 37
mais de 5 Sm more than 5 mw 71 50 52 45
REGIÃOREgiOn
Norte / Centro-oeste / North / Center-west 59 48 53 42
Nordeste / Northeast 55 36 35 26
Sudeste / Southeast 71 45 44 36
Sul / South 81 56 43 42
DEPENDêNCIA ADMINISTRATIvAADMinisTRATiVE
JURisDiCTiOn
municipal / municipal 66 40 38 31
Estadual / State 65 49 49 40
SÉRIEgRADE
4a série / 5o ano do Ensino Fundamental4th grade / 5th year elementary education 69 40 39 32
8a série / 9o ano do Ensino Fundamental8th grade / 9th year elementary education 62 47 44 35
2o ano do Ensino médio2nd year of Secondary education 62 50 48 40
COMPUTADOR INSTALADO
NO LABORATóRIO DE INFORMÁTICA
COMPUTER insTAllED AT iT lAb
Sim / yes 68 51 50 41
Não / No 41 13 12 9
INTERNET INSTALADA NO LABORATóRIO DE INFORMÁTICA
inTERnET AVAilAblE AT iT lAb
Sim / yes 71 54 52 42
Não / No 46 20 22 19
1 Base: 623 professores que costumam ensinar os alunos a usar computador e Internet durante o tempo de aula.¹ base: 623 teachers who usually teach their students to use computers and the internet during class time.² Base: 1.430 professores que costumam realizar pesquisas de informações em livros, revistas e/ou Internet durante o tempo de aula.² base: 1,430 teachers who conduct research in books, magazines and/or the internet during class time. ³ Base: 1.431 professores que costumam realizar projetos ou trabalhos sobre um tema durante o tempo de aula.³ base: 1,431 teachers who propose theme projects or assignments during class time.4 Base: 1.421 professores que costumam promover a produção de materiais pelos alunos durante o tempo de aula.4 base: 1,421 teachers who usually prompt students to produce materials during class time.
E3 PRÁTICA DOCENTE – USO DO COMPUTADOR E INTERNETteaChINg PraCtICe – uSe of ComPuterS aNd the INterNetPercentual sobre o total de professores que costumam realizar a atividadePercentage of the overall number of teachers who usually do this activity
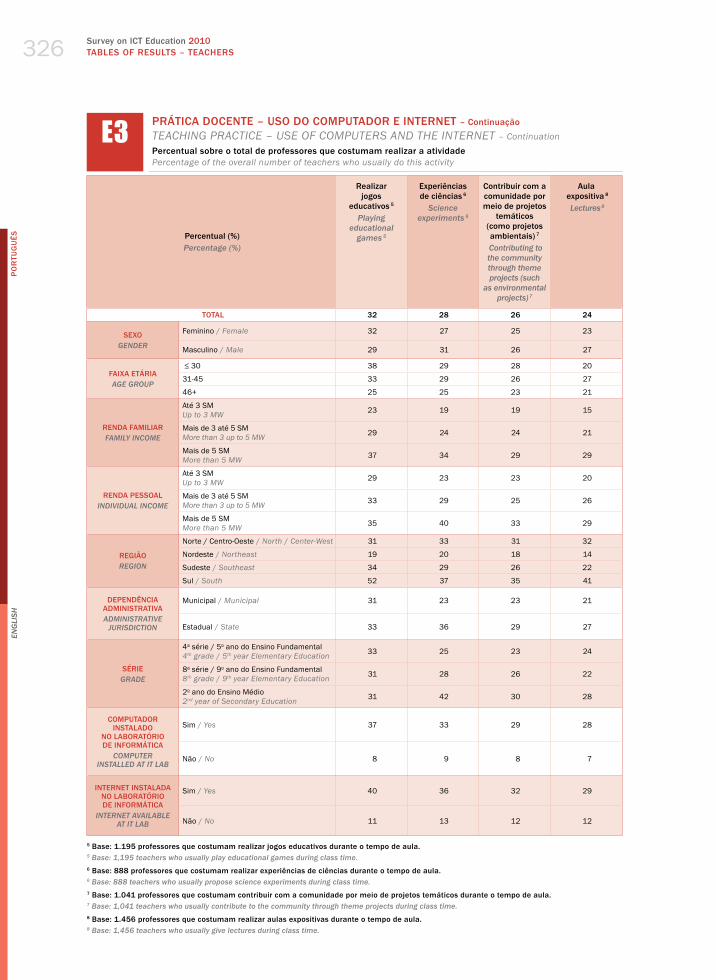
Survey on ICT Education 2010TABLES OF RESuLTS – TEACHERS
PO
RTu
Gu
ÊS
En
gli
sh
326
E3 PRÁTICA DOCENTE – USO DO COMPUTADOR E INTERNET – ContinuaçãoteaChINg PraCtICe – uSe of ComPuterS aNd the INterNet – ContinuationPercentual sobre o total de professores que costumam realizar a atividadePercentage of the overall number of teachers who usually do this activity
Percentual (%)Percentage (%)
Realizar jogos
educativos 5
Playing educational
games 5
Experiências de ciências 6
science experiments 6
Contribuir com a comunidade por meio de projetos
temáticos (como projetos ambientais) 7
Contributing to the community through theme projects (such
as environmental projects) 7
Aula expositiva 8
lectures 8
TOTAL 32 28 26 24
SEXOgEnDER
Feminino / female 32 27 25 23
masculino / male 29 31 26 27
FAIXA ETÁRIAAgE gROUP
≤ 30 38 29 28 20
31-45 33 29 26 27
46+ 25 25 23 21
RENDA FAMILIARFAMilY inCOME
Até 3 Sm up to 3 mw 23 19 19 15
mais de 3 até 5 Sm more than 3 up to 5 mw 29 24 24 21
mais de 5 Sm more than 5 mw 37 34 29 29
RENDA PESSOALinDiViDUAl inCOME
Até 3 Sm up to 3 mw 29 23 23 20
mais de 3 até 5 Sm more than 3 up to 5 mw 33 29 25 26
mais de 5 Sm more than 5 mw 35 40 33 29
REGIÃOREgiOn
Norte / Centro-oeste / North / Center-west 31 33 31 32
Nordeste / Northeast 19 20 18 14
Sudeste / Southeast 34 29 26 22
Sul / South 52 37 35 41
DEPENDêNCIA ADMINISTRATIvAADMinisTRATiVE
JURisDiCTiOn
municipal / municipal 31 23 23 21
Estadual / State 33 36 29 27
SÉRIEgRADE
4a série / 5o ano do Ensino Fundamental4th grade / 5th year elementary education 33 25 23 24
8a série / 9o ano do Ensino Fundamental8th grade / 9th year elementary education 31 28 26 22
2o ano do Ensino médio2nd year of Secondary education 31 42 30 28
COMPUTADOR INSTALADO
NO LABORATóRIO DE INFORMÁTICA
COMPUTER insTAllED AT iT lAb
Sim / yes 37 33 29 28
Não / No 8 9 8 7
INTERNET INSTALADA NO LABORATóRIO DE INFORMÁTICA
inTERnET AVAilAblE AT iT lAb
Sim / yes 40 36 32 29
Não / No 11 13 12 12
5 Base: 1.195 professores que costumam realizar jogos educativos durante o tempo de aula.5 base: 1,195 teachers who usually play educational games during class time.6 Base: 888 professores que costumam realizar experiências de ciências durante o tempo de aula.6 base: 888 teachers who usually propose science experiments during class time.7 Base: 1.041 professores que costumam contribuir com a comunidade por meio de projetos temáticos durante o tempo de aula.7 base: 1,041 teachers who usually contribute to the community through theme projects during class time.8 Base: 1.456 professores que costumam realizar aulas expositivas durante o tempo de aula.8 base: 1,456 teachers who usually give lectures during class time.

2010 Pesquisa TIC EducaçãoTABELAS DE RESuLTADOS – PROFESSORES
PO
RTu
Gu
ÊS
En
gli
sh
327
E3 PRÁTICA DOCENTE – USO DO COMPUTADOR E INTERNET – ContinuaçãoteaChINg PraCtICe – uSe of ComPuterS aNd the INterNet – ContinuationPercentual sobre o total de professores que costumam realizar a atividadePercentage of the overall number of teachers who usually do this activity
Percentual (%)Percentage (%)
Exercícios para prática e fixação
de conteúdo 9
Practical exercises for
content retention 9
Organizar, acom-panhar e apoiar atividades em
grupo e trabalho colaborativo
entre os alunos 10 Organizing,
monitoring and supporting group
activities and collaborative work among students 10
Interpretação de textos 11
Reading comprehension
activities 11
Realizar debates e apresentações
feitas pelos alunos para
toda a turma 12
Promoting debates and
presentations given by
students to the whole class 12
TOTAL 23 23 23 22
SEXOgEnDER
Feminino / female 22 23 23 22
masculino / male 25 23 24 21
FAIXA ETÁRIAAgE gROUP
≤ 30 23 24 24 24
31-45 25 25 25 23
46+ 19 18 17 19
RENDA FAMILIARFAMilY inCOME
Até 3 Sm up to 3 mw 17 17 17 15
mais de 3 até 5 Sm more than 3 up to 5 mw 23 23 22 20
mais de 5 Sm more than 5 mw 25 25 26 25
RENDA PESSOALinDiViDUAl inCOME
Até 3 Sm up to 3 mw 19 19 19 18
mais de 3 até 5 Sm more than 3 up to 5 mw 26 24 24 25
mais de 5 Sm more than 5 mw 27 29 29 24
REGIÃOREgiOn
Norte / Centro-oeste / North / Center-west 30 29 31 28
Nordeste / Northeast 16 15 17 14
Sudeste / Southeast 23 24 22 20
Sul / South 27 28 26 32
DEPENDêNCIA ADMINISTRATIvAADMinisTRATiVE
JURisDiCTiOn
municipal / municipal 23 20 21 18
Estadual / State 23 26 25 25
SÉRIEgRADE
4a série / 5o ano do Ensino Fundamental4th grade / 5th year elementary education 25 21 23 17
8a série / 9o ano do Ensino Fundamental8th grade / 9th year elementary education 23 21 22 23
2o ano do Ensino médio2nd year of Secondary education 22 27 24 28
COMPUTADOR INSTALADO
NO LABORATóRIO DE INFORMÁTICA
COMPUTER insTAllED AT iT lAb
Sim / yes 26 26 26 25
Não / No 8 7 7 8
INTERNET INSTALADA NO LABORATóRIO DE INFORMÁTICA
inTERnET AVAilAblE AT iT lAb
Sim / yes 28 28 28 26
Não / No 11 10 12 12
9 Base: 1.491 professores que costumam realizar exercícios para prática e fixação do conteúdo durante o tempo de aula. 9 base: 1,491 teachers who usually propose practical and retention exercises during class time.10 Base: 1.416 professores que costumam organizar, acompanhar e dar apoio a atividades em grupo e trabalho colaborativo entre os alunos durante
o tempo de aula.10 base: 1,416 teachers who usually organize, monitor and support group and collaborative activities among students during class.11 Base: 1.384 professores que costumam realizar interpretação de textos durante o tempo de aula.11 base: 1,384 teachers who usually propose reading comprehension activities during class time.12 Base: 1.384 professores que costumam realizar debates e apresentações feitas pelos alunos para toda a turma durante o tempo de aula.12 base: 1,384 teachers who usually have debates and presentations prepared by students presented to the whole class during class time.

Survey on ICT Education 2010TABLES OF RESuLTS – TEACHERS
PO
RTu
Gu
ÊS
En
gli
sh
328
E3 PRÁTICA DOCENTE – USO DO COMPUTADOR E INTERNET – ContinuaçãoteaChINg PraCtICe – uSe of ComPuterS aNd the INterNet – ContinuationPercentual sobre o total de professores que costumam realizar a atividadePercentage of the overall number of teachers who usually do this activity
Percentual (%)Percentage (%)
Organizar e/ou mediar a comunicação
entre alunos e especialistas e orientadores externos 13
Organizing and/or intermediating communication
between students and external experts
and advisors 13
Apoio individualizado a alguns alunos para que
possam alcançar o restante do grupo 14
Customized support to ensure certain students are able to perform with the rest of the group 14
Conversas com pais sobre como eles podem apoiar e
monitorar a aprendizagem dos
filhos e oferecer aconselhamento 15
Talking to parents about how they can
support / monitor their children’s learning and
offering advice 15
TOTAL 20 18 8
SEXOgEnDER
Feminino / female 21 19 8
masculino / male 17 15 9
FAIXA ETÁRIAAgE gROUP
≤ 30 19 20 7
31-45 22 20 9
46+ 17 12 6
RENDA FAMILIARFAMilY inCOME
Até 3 Sm up to 3 mw 16 11 6
mais de 3 até 5 Sm more than 3 up to 5 mw 17 17 8
mais de 5 Sm more than 5 mw 24 20 8
RENDA PESSOALinDiViDUAl inCOME
Até 3 Sm up to 3 mw 15 14 7
mais de 3 até 5 Sm more than 3 up to 5 mw 23 19 9
mais de 5 Sm more than 5 mw 29 24 9
REGIÃOREgiOn
Norte / Centro-oeste / North / Center-west 27 24 15
Nordeste / Northeast 10 11 6
Sudeste / Southeast 20 19 6
Sul / South 33 21 9
DEPENDêNCIA ADMINISTRATIvAADMinisTRATiVE
JURisDiCTiOn
municipal / municipal 16 17 7
Estadual / State 26 19 9
SÉRIEgRADE
4a série / 5o ano do Ensino Fundamental4th grade / 5th year elementary education 15 19 7
8a série / 9o ano do Ensino Fundamental8th grade / 9th year elementary education 21 17 9
2o ano do Ensino médio2nd year of Secondary education 28 17 9
COMPUTADOR INSTALADO
NO LABORATóRIO DE INFORMÁTICA
COMPUTER insTAllED AT iT lAb
Sim / yes 23 21 9
Não / No 8 4 3
INTERNET INSTALADA NO LABORATóRIO DE INFORMÁTICA
inTERnET AVAilAblE AT iT lAb
Sim / yes 24 22 9
Não / No 12 8 5
13 Base: 904 professores que costumam organizar e/ou mediar a comunicação entre estudantes e especialistas e orientadores externos durante o tempo de aula.
13 base: 904 teachers who usually organize/intermediate communication between students and external experts or advisors during class time.14 Base: 1.372 professores que costumam realizar apoio individualizado a alguns alunos para que possam alcançar o restante do grupo durante o
tempo de aula.14 base: 1,372 teachers who usually provide individual support to certain students to ensure they perform with the whole class during class time.15 Base: 1.348 professores que costumam conversar com pais sobre como eles podem apoiar/monitorar a aprendizagem dos filhos e oferecer acon-
selhamento durante o tempo de aula.15 base: 1,348 teachers who talk to parents about how they can support/monitor their children’s learning process, and offer advice during class time.

2010 Pesquisa TIC EducaçãoTABELAS DE RESuLTADOS – PROFESSORES
PO
RTu
Gu
ÊS
En
gli
sh
329
E4 PRÁTICA DOCENTE – LOCALteaChINg PraCtICe – loCatIoNPercentual sobre o total de professores que utilizaram computador e/ou Internet para realizar alguma atividade ¹Percentage of the total number teachers who use computers and/or the Internet for some activity 1
Percentual (%)Percentage (%)
No laboratório de informática
ou sala de computadores in the iT lab or computer room
Na sala dos professores
in the teacher’s room
Na sala de aula in the
classroom
Na bibliotecain the library
TOTAL 80 21 18 8
SEXOgEnDER
Feminino / female 80 19 17 8
masculino / male 78 27 23 9
FAIXA ETÁRIAAgE gROUP
≤ 30 86 29 18 7
31-45 78 19 19 8
46+ 80 20 15 9
RENDA FAMILIARFAMilY inCOME
Até 3 Sm up to 3 mw 81 21 18 6
mais de 3 até 5 Sm more than 3 up to 5 mw 77 24 16 10
mais de 5 Sm more than 5 mw 82 19 19 8
RENDA PESSOALinDiViDUAl inCOME
Até 3 Sm up to 3 mw 81 19 17 6
mais de 3 até 5 Sm more than 3 up to 5 mw 80 23 14 8
mais de 5 Sm more than 5 mw 79 19 26 11
REGIÃOREgiOn
Norte / Centro-oeste / North / Center-west 79 23 20 6
Nordeste / Northeast 76 26 16 10
Sudeste / Southeast 79 18 20 10
Sul / South 88 17 15 5
DEPENDêNCIA ADMINISTRATIvAADMinisTRATiVE
JURisDiCTiOn
municipal / municipal 80 17 19 6
Estadual / State 80 24 17 10
SÉRIEgRADE
4a série / 5o ano do Ensino Fundamental4th grade / 5th year elementary education 82 18 20 6
8a série / 9o ano do Ensino Fundamental8th grade / 9th year elementary education 79 25 16 6
2o ano do Ensino médio2nd year of Secondary education 78 25 16 12
COMPUTADOR INSTALADO
NO LABORATóRIO DE INFORMÁTICA
COMPUTER insTAllED AT iT lAb
Sim / yes 83 20 17 8
Não / No 33 24 26 16
INTERNET INSTALADA NO LABORATóRIO DE INFORMÁTICA
inTERnET AVAilAblE AT iT lAb
Sim / yes 85 21 18 8
Não / No 55 21 19 13
1 Base: 892 professores que utilizaram computador e/ou Internet para realizar alguma atividade. Respostas estimuladas.1 base: 892 teachers who have used computers and/or the internet for some activity. stimulated answers.

Survey on ICT Education 2010TABLES OF RESuLTS – TEACHERS
PO
RTu
Gu
ÊS
En
gli
sh
330
E4 PRÁTICA DOCENTE – LOCAL – ContinuaçãoteaChINg PraCtICe – loCatIoN – ContinuationPercentual sobre o total de professores que utilizaram computador e/ou Internet para realizar alguma atividade ¹Percentage of the total number teachers who use computers and/or the Internet for some activity 1
Percentual (%)Percentage (%)
Na secretaria, diretoria ou em
algum computador
“emprestado”At the reception,
the principal’s office or using a “borrowed”
computer
Centro público de acesso gratuito
(como biblioteca externa à escola)
Free public access center
(such as an outside library)
Outros espaços da escola
Other spaces in the school
Não respondeuDid not answer
TOTAL 8 3 1 -
SEXOgEnDER
Feminino / female 8 3 - 1
masculino / male 10 4 2 -
FAIXA ETÁRIAAgE gROUP
≤ 30 10 3 - 1
31-45 9 4 1 -
46+ 7 2 - 1
RENDA FAMILIARFAMilY inCOME
Até 3 Sm up to 3 mw 7 3 - -
mais de 3 até 5 Sm more than 3 up to 5 mw 7 5 1 1
mais de 5 Sm more than 5 mw 9 2 1 -
RENDA PESSOALinDiViDUAl inCOME
Até 3 Sm up to 3 mw 7 2 - -
mais de 3 até 5 Sm more than 3 up to 5 mw 8 3 1 -
mais de 5 Sm more than 5 mw 12 4 1 1
REGIÃOREgiOn
Norte / Centro-oeste / North / Center-west 7 3 - -
Nordeste / Northeast 17 5 - 1
Sudeste / Southeast 5 3 2 -
Sul / South 4 1 - -
DEPENDêNCIA ADMINISTRATIvAADMinisTRATiVE
JURisDiCTiOn
municipal / municipal 8 3 - -
Estadual / State 9 3 1 1
SÉRIEgRADE
4a série / 5o ano do Ensino Fundamental4th grade / 5th year elementary education 9 3 - -
8a série / 9o ano do Ensino Fundamental8th grade / 9th year elementary education 10 2 - -
2o ano do Ensino médio2nd year of Secondary education 8 5 2 1
COMPUTADOR INSTALADO
NO LABORATóRIO DE INFORMÁTICA
COMPUTER insTAllED AT iT lAb
Sim / yes 7 3 1 -
Não / No 22 7 - 3
INTERNET INSTALADA NO LABORATóRIO DE INFORMÁTICA
inTERnET AVAilAblE AT iT lAb
Sim / yes 7 3 1 -
Não / No 14 4 1 1
1 Base: 892 professores que utilizaram computador e/ou Internet para realizar alguma atividade. Respostas estimuladas.1 base: 892 teachers who have used computers and/or the internet for some activity. stimulated answers.
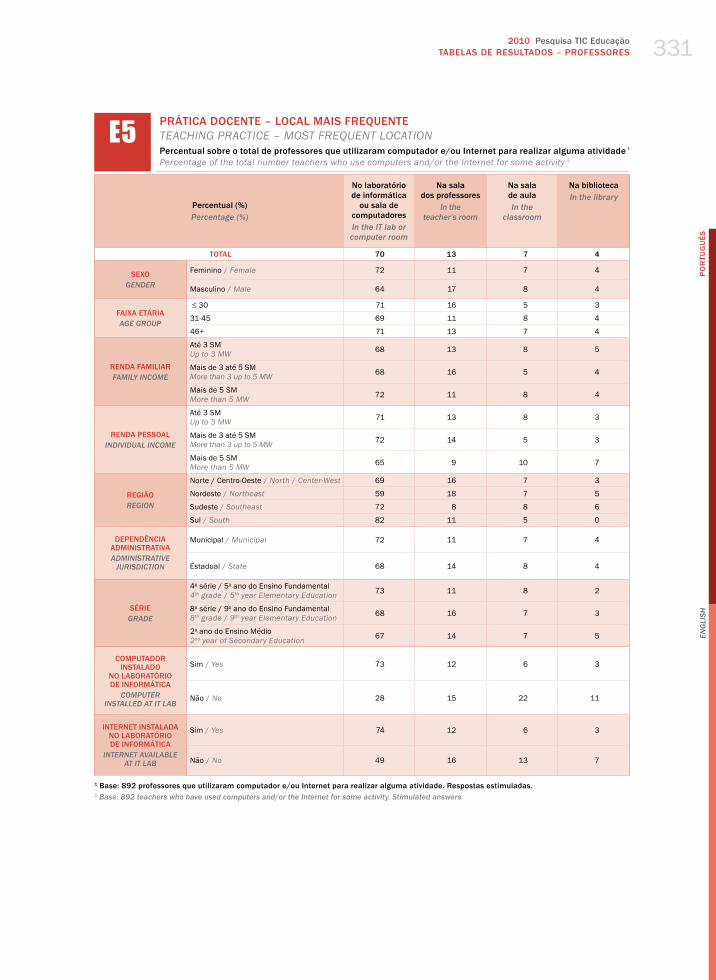
2010 Pesquisa TIC EducaçãoTABELAS DE RESuLTADOS – PROFESSORES
PO
RTu
Gu
ÊS
En
gli
sh
331
E5 PRÁTICA DOCENTE – LOCAL MAIS FREQUENTEteaChINg PraCtICe – moSt freQueNt loCatIoNPercentual sobre o total de professores que utilizaram computador e/ou Internet para realizar alguma atividade ¹Percentage of the total number teachers who use computers and/or the Internet for some activity 1
Percentual (%)Percentage (%)
No laboratório de informática
ou sala de computadores in the iT lab or computer room
Na sala dos professores
in the teacher’s room
Na sala de aula in the
classroom
Na bibliotecain the library
TOTAL 70 13 7 4
SEXOgEnDER
Feminino / female 72 11 7 4
masculino / male 64 17 8 4
FAIXA ETÁRIAAgE gROUP
≤ 30 71 16 5 3
31-45 69 11 8 4
46+ 71 13 7 4
RENDA FAMILIARFAMilY inCOME
Até 3 Sm up to 3 mw 68 13 8 5
mais de 3 até 5 Sm more than 3 up to 5 mw 68 16 5 4
mais de 5 Sm more than 5 mw 72 11 8 4
RENDA PESSOALinDiViDUAl inCOME
Até 3 Sm up to 3 mw 71 13 8 3
mais de 3 até 5 Sm more than 3 up to 5 mw 72 14 5 3
mais de 5 Sm more than 5 mw 65 9 10 7
REGIÃOREgiOn
Norte / Centro-oeste / North / Center-west 69 16 7 3
Nordeste / Northeast 59 18 7 5
Sudeste / Southeast 72 8 8 6
Sul / South 82 11 5 0
DEPENDêNCIA ADMINISTRATIvAADMinisTRATiVE
JURisDiCTiOn
municipal / municipal 72 11 7 4
Estadual / State 68 14 8 4
SÉRIEgRADE
4a série / 5o ano do Ensino Fundamental4th grade / 5th year elementary education 73 11 8 2
8a série / 9o ano do Ensino Fundamental8th grade / 9th year elementary education 68 16 7 3
2o ano do Ensino médio2nd year of Secondary education 67 14 7 5
COMPUTADOR INSTALADO
NO LABORATóRIO DE INFORMÁTICA
COMPUTER insTAllED AT iT lAb
Sim / yes 73 12 6 3
Não / No 28 15 22 11
INTERNET INSTALADA NO LABORATóRIO DE INFORMÁTICA
inTERnET AVAilAblE AT iT lAb
Sim / yes 74 12 6 3
Não / No 49 16 13 7
1 Base: 892 professores que utilizaram computador e/ou Internet para realizar alguma atividade. Respostas estimuladas.1 base: 892 teachers who have used computers and/or the internet for some activity. stimulated answers.
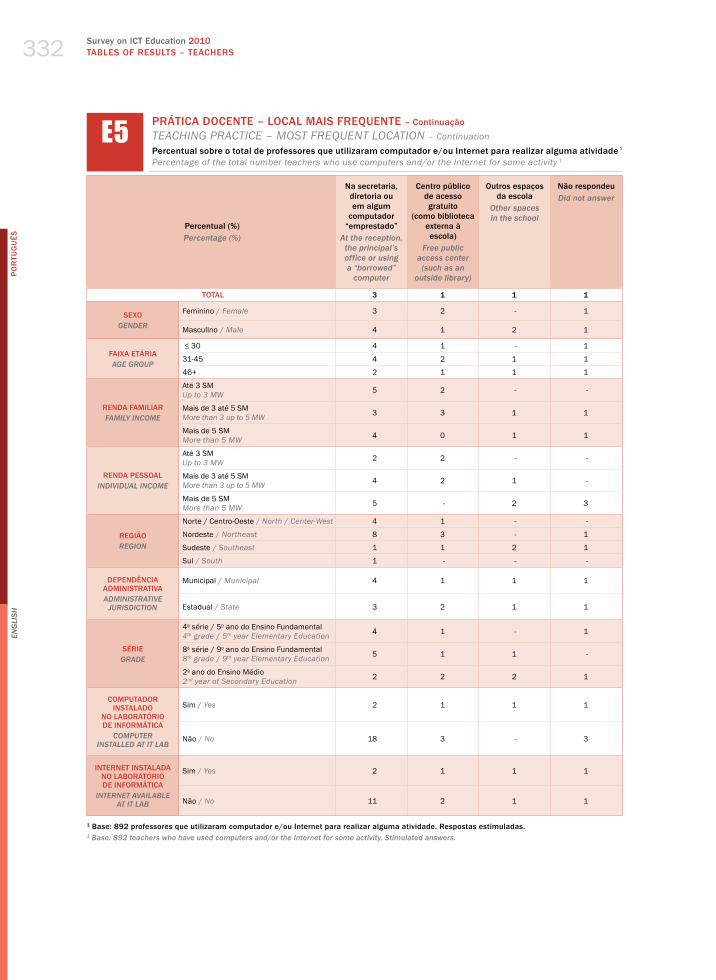
Survey on ICT Education 2010TABLES OF RESuLTS – TEACHERS
PO
RTu
Gu
ÊS
En
gli
sh
332
E5 PRÁTICA DOCENTE – LOCAL MAIS FREQUENTE – ContinuaçãoteaChINg PraCtICe – moSt freQueNt loCatIoN – ContinuationPercentual sobre o total de professores que utilizaram computador e/ou Internet para realizar alguma atividade ¹Percentage of the total number teachers who use computers and/or the Internet for some activity 1
Percentual (%)Percentage (%)
Na secretaria, diretoria ou em algum
computador “emprestado”
At the reception, the principal’s office or using a “borrowed”
computer
Centro público de acesso gratuito
(como biblioteca externa à escola)
Free public access center
(such as an outside library)
Outros espaços da escola
Other spaces in the school
Não respondeuDid not answer
TOTAL 3 1 1 1
SEXOgEnDER
Feminino / female 3 2 - 1
masculino / male 4 1 2 1
FAIXA ETÁRIAAgE gROUP
≤ 30 4 1 - 1
31-45 4 2 1 1
46+ 2 1 1 1
RENDA FAMILIARFAMilY inCOME
Até 3 Sm up to 3 mw 5 2 - -
mais de 3 até 5 Sm more than 3 up to 5 mw 3 3 1 1
mais de 5 Sm more than 5 mw 4 0 1 1
RENDA PESSOALinDiViDUAl inCOME
Até 3 Sm up to 3 mw 2 2 - -
mais de 3 até 5 Sm more than 3 up to 5 mw 4 2 1 -
mais de 5 Sm more than 5 mw 5 - 2 3
REGIÃOREgiOn
Norte / Centro-oeste / North / Center-west 4 1 - -
Nordeste / Northeast 8 3 - 1
Sudeste / Southeast 1 1 2 1
Sul / South 1 - - -
DEPENDêNCIA ADMINISTRATIvAADMinisTRATiVE
JURisDiCTiOn
municipal / municipal 4 1 1 1
Estadual / State 3 2 1 1
SÉRIEgRADE
4a série / 5o ano do Ensino Fundamental4th grade / 5th year elementary education 4 1 - 1
8a série / 9o ano do Ensino Fundamental8th grade / 9th year elementary education 5 1 1 -
2o ano do Ensino médio2nd year of Secondary education 2 2 2 1
COMPUTADOR INSTALADO
NO LABORATóRIO DE INFORMÁTICA
COMPUTER insTAllED AT iT lAb
Sim / yes 2 1 1 1
Não / No 18 3 - 3
INTERNET INSTALADA NO LABORATóRIO DE INFORMÁTICA
inTERnET AVAilAblE AT iT lAb
Sim / yes 2 1 1 1
Não / No 11 2 1 1
1 Base: 892 professores que utilizaram computador e/ou Internet para realizar alguma atividade. Respostas estimuladas.1 base: 892 teachers who have used computers and/or the internet for some activity. stimulated answers.

2010 Pesquisa TIC EducaçãoTABELAS DE RESuLTADOS – PROFESSORES
PO
RTu
Gu
ÊS
En
gli
sh
333
E6 MÉTODOS DE AvALIAÇÃOaSSeSSmeNt methodSPercentual sobre o total de professores ¹Percentage of the total number of teachers 1
Percentual (%)Percentage (%)
Provas e exames escritosWritten
tests and exams
Tarefas e exercícios escritos Written
assignments and exercises
Apresentação de trabalhos para a turma
Presenting assignments to the class
Uso de vídeos, imagens e sons em trabalhos ou apresentações Use of videos, images and sounds in
assignments and presentations
SimYes
Nãono
SimYes
Nãono
SimYes
Nãono
SimYes
Nãono
TOTAL 99 1 99 1 94 6 64 36
SEXOgEnDER
Feminino / female 99 1 99 1 96 4 65 35
masculino / male 99 1 98 2 89 11 58 42
FAIXA ETÁRIAAgE gROUP
≤ 30 98 2 100 - 96 4 70 30
31-45 99 1 99 1 94 6 64 36
46+ 100 - 99 1 94 6 59 41
RENDA FAMILIARFAMilY inCOME
Até 3 Sm up to 3 mw 98 2 99 1 96 4 64 36
mais de 3 até 5 Sm more than 3 up to 5 mw 99 1 99 1 95 5 65 35
mais de 5 Sm more than 5 mw 99 1 99 1 93 7 64 36
RENDA PESSOALinDiViDUAl inCOME
Até 3 Sm up to 3 mw 99 1 99 1 97 3 69 31
mais de 3 até 5 Sm more than 3 up to 5 mw 99 1 100 - 95 5 61 39
mais de 5 Sm more than 5 mw 100 - 98 2 89 11 60 40
REGIÃOREgiOn
Norte / Centro-oeste / North / Center-west 99 1 99 1 92 8 61 39
Nordeste / Northeast 99 1 99 1 97 3 71 29
Sudeste / Southeast 100 - 99 1 93 7 55 45
Sul / South 99 1 100 - 95 5 71 29
DEPENDêNCIA ADMINISTRATIvAADMinisTRATiVE
JURisDiCTiOn
municipal / municipal 99 1 99 1 95 5 61 39
Estadual / State 99 1 99 1 94 6 67 33
SÉRIEgRADE
4a série / 5o ano do Ensino Fundamental4th grade / 5th year elementary education 99 1 99 1 96 4 63 37
8a série / 9o ano do Ensino Fundamental8th grade / 9th year elementary education 99 1 99 1 94 6 65 35
2o ano do Ensino médio2nd year of Secondary education 100 - 99 1 94 6 67 33
COMPUTADOR INSTALADO
NO LABORATóRIO DE INFORMÁTICA
COMPUTER insTAllED AT iT lAb
Sim / yes 99 1 99 1 94 6 64 36
Não / No 100 - 100 - 95 5 64 36
INTERNET INSTALADA NO LABORATóRIO DE INFORMÁTICA
inTERnET AVAilAblE AT iT lAb
Sim / yes 99 1 99 1 94 6 64 36
Não / No 99 1 100 - 95 5 62 38
1 Base: 1.535 professores. Respostas estimuladas.1 base: 1,535 teachers. stimulated answers.
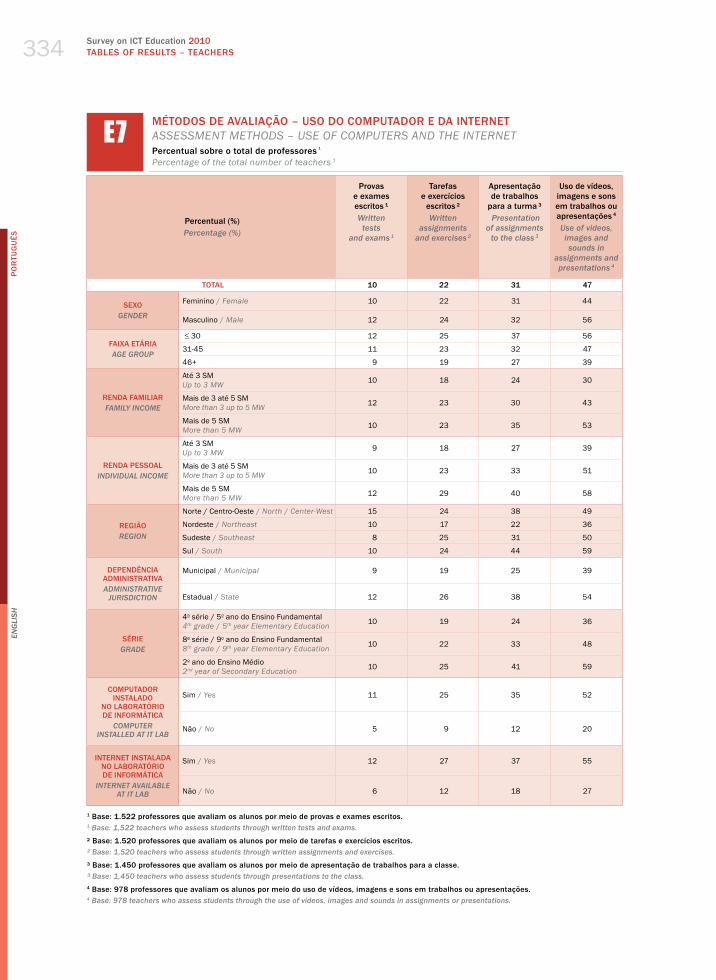
Survey on ICT Education 2010TABLES OF RESuLTS – TEACHERS
PO
RTu
Gu
ÊS
En
gli
sh
334
E7 MÉTODOS DE AvALIAÇÃO – USO DO COMPUTADOR E DA INTERNETaSSeSSmeNt methodS – uSe of ComPuterS aNd the INterNetPercentual sobre o total de professores ¹Percentage of the total number of teachers 1
Percentual (%)Percentage (%)
Provas e exames escritos ¹Written
tests and exams 1
Tarefas e exercícios
escritos ² Written
assignments and exercises 2
Apresentação de trabalhos
para a turma ³ Presentation
of assignments to the class 3
Uso de vídeos, imagens e sons em trabalhos ou apresentações 4 Use of videos, images and sounds in
assignments and presentations 4
TOTAL 10 22 31 47
SEXOgEnDER
Feminino / female 10 22 31 44
masculino / male 12 24 32 56
FAIXA ETÁRIAAgE gROUP
≤ 30 12 25 37 56
31-45 11 23 32 47
46+ 9 19 27 39
RENDA FAMILIARFAMilY inCOME
Até 3 Sm up to 3 mw 10 18 24 30
mais de 3 até 5 Sm more than 3 up to 5 mw 12 23 30 43
mais de 5 Sm more than 5 mw 10 23 35 53
RENDA PESSOALinDiViDUAl inCOME
Até 3 Sm up to 3 mw 9 18 27 39
mais de 3 até 5 Sm more than 3 up to 5 mw 10 23 33 51
mais de 5 Sm more than 5 mw 12 29 40 58
REGIÃOREgiOn
Norte / Centro-oeste / North / Center-west 15 24 38 49
Nordeste / Northeast 10 17 22 36
Sudeste / Southeast 8 25 31 50
Sul / South 10 24 44 59
DEPENDêNCIA ADMINISTRATIvAADMinisTRATiVE
JURisDiCTiOn
municipal / municipal 9 19 25 39
Estadual / State 12 26 38 54
SÉRIEgRADE
4a série / 5o ano do Ensino Fundamental4th grade / 5th year elementary education 10 19 24 36
8a série / 9o ano do Ensino Fundamental8th grade / 9th year elementary education 10 22 33 48
2o ano do Ensino médio2nd year of Secondary education 10 25 41 59
COMPUTADOR INSTALADO
NO LABORATóRIO DE INFORMÁTICA
COMPUTER insTAllED AT iT lAb
Sim / yes 11 25 35 52
Não / No 5 9 12 20
INTERNET INSTALADA NO LABORATóRIO DE INFORMÁTICA
inTERnET AVAilAblE AT iT lAb
Sim / yes 12 27 37 55
Não / No 6 12 18 27
1 Base: 1.522 professores que avaliam os alunos por meio de provas e exames escritos. 1 base: 1,522 teachers who assess students through written tests and exams.
² Base: 1.520 professores que avaliam os alunos por meio de tarefas e exercícios escritos. ² base: 1,520 teachers who assess students through written assignments and exercises.
³ Base: 1.450 professores que avaliam os alunos por meio de apresentação de trabalhos para a classe. ³ base: 1,450 teachers who assess students through presentations to the class.4 Base: 978 professores que avaliam os alunos por meio do uso de vídeos, imagens e sons em trabalhos ou apresentações. 4 base: 978 teachers who assess students through the use of videos, images and sounds in assignments or presentations.

2010 Pesquisa TIC EducaçãoTABELAS DE RESuLTADOS – PROFESSORES
PO
RTu
Gu
ÊS
En
gli
sh
335
E8 APOIO AO PROFESSOR NO USO DE COMPUTADOR E INTERNETSuPPort for teaCherS IN ComPuter aNd INterNet uSePercentual sobre o total de professores ¹Percentage of the total number of teachers 1
Percentual (%)Percentage (%)
Contatos informais com outros
educadoresinformal chats with
other educators
Responsável pelos computadores /
pela sala de informática da escola
Person in charge of the school’s
computers / iT lab
Coordenador pedagógico /
pedagogoDirector
of studies / pedagogue
SimYes
Nãono
Não se aplicaDoes not
apply
SimYes
Nãono
Não se aplicaDoes not
apply
SimYes
Nãono
Não se aplicaDoes not
apply
TOTAL 75 22 3 48 43 9 58 38 5
SEXOgEnDER
Feminino / female 76 21 3 48 42 10 59 36 5
masculino / male 71 27 2 47 48 6 54 44 2
FAIXA ETÁRIAAgE gROUP
≤ 30 75 22 3 54 39 7 62 33 5
31-45 78 20 2 48 43 9 57 39 4
46+ 69 27 4 44 45 11 57 38 5
RENDA FAMILIARFAMilY inCOME
Até 3 Sm up to 3 mw 60 31 8 40 44 16 54 34 12
mais de 3 até 5 Sm more than 3 up to 5 mw 74 24 2 44 47 9 58 39 3
mais de 5 Sm more than 5 mw 80 18 2 52 41 7 59 38 3
RENDA PESSOALinDiViDUAl inCOME
Até 3 Sm up to 3 mw 71 24 5 45 44 11 60 32 8
mais de 3 até 5 Sm more than 3 up to 5 mw 76 23 1 50 43 7 58 40 2
mais de 5 Sm more than 5 mw 81 17 2 52 41 7 53 43 4
REGIÃOREgiOn
Norte / Centro-oeste / North / Center-west 68 28 4 55 36 9 53 41 6
Nordeste / Northeast 64 31 5 38 50 12 54 38 8
Sudeste / Southeast 84 15 1 46 46 7 61 37 2
Sul / South 86 14 1 63 30 7 63 35 2
DEPENDêNCIA ADMINISTRATIvAADMinisTRATiVE
JURisDiCTiOn
municipal / municipal 74 22 4 46 42 12 57 36 6
Estadual / State 76 23 1 50 44 6 58 39 3
SÉRIEgRADE
4a série / 5o ano do Ensino Fundamental4th grade / 5th year elementary education 73 22 4 45 42 13 58 37 6
8a série / 9o ano do Ensino Fundamental8th grade / 9th year elementary education 72 24 3 50 42 8 59 35 6
2o ano do Ensino médio2nd year of Secondary education 77 22 1 52 44 4 54 43 4
COMPUTADOR INSTALADO
NO LABORATóRIO DE INFORMÁTICA
COMPUTER insTAllED AT iT lAb
Sim / yes 77 21 2 55 39 6 59 37 4
Não / No 65 29 7 15 61 25 50 40 10
INTERNET INSTALADA NO LABORATóRIO DE INFORMÁTICA
inTERnET AVAilAblE AT iT lAb
Sim / yes 78 20 2 58 37 5 61 36 4
Não / No 67 28 5 24 57 19 51 41 8
1 Base: 1.535 professores. Respostas estimuladas.1 base: 1,535 teachers. stimulated answers.

Survey on ICT Education 2010TABLES OF RESuLTS – TEACHERS
PO
RTu
Gu
ÊS
En
gli
sh
336
E8 APOIO AO PROFESSOR NO USO DE COMPUTADOR E INTERNET – ContinuaçãoSuPPort for teaCherS IN ComPuter aNd INterNet uSe – ContinuationPercentual sobre o total de professores ¹Percentage of the total number of teachers 1
Percentual (%)Percentage (%)
POIE POiE (Educational
Computing Advisory Teachers)
Diretor da escolaPrincipal
Técnicos de fora da escola
Experts from outside the school
SimYes
Nãono
Não se aplicaDoes not
apply
SimYes
Nãono
Não se aplicaDoes not
apply
SimYes
Nãono
Não se aplicaDoes not
apply
TOTAL 12 62 26 55 41 4 31 63 6
SEXOgEnDER
Feminino / female 13 60 28 56 40 5 30 63 6
masculino / male 11 68 21 52 45 3 32 64 4
FAIXA ETÁRIAAgE gROUP
≤ 30 12 65 23 60 36 5 35 61 4
31-45 12 61 27 53 43 4 30 64 6
46+ 12 62 26 55 40 6 30 64 7
RENDA FAMILIARFAMilY inCOME
Até 3 Sm up to 3 mw 8 62 30 57 32 10 25 63 12
mais de 3 até 5 Sm more than 3 up to 5 mw 9 64 27 54 43 3 31 65 4
mais de 5 Sm more than 5 mw 15 61 24 55 42 3 33 63 4
RENDA PESSOALinDiViDUAl inCOME
Até 3 Sm up to 3 mw 9 63 28 60 34 7 27 64 8
mais de 3 até 5 Sm more than 3 up to 5 mw 13 63 25 53 45 2 34 63 4
mais de 5 Sm more than 5 mw 17 58 25 49 48 4 33 62 5
REGIÃOREgiOn
Norte / Centro-oeste / North / Center-west 16 59 25 41 52 7 36 57 8
Nordeste / Northeast 8 66 26 65 29 6 31 61 8
Sudeste / Southeast 14 60 26 50 47 3 29 67 4
Sul / South 12 60 28 62 37 2 28 70 2
DEPENDêNCIA ADMINISTRATIvAADMinisTRATiVE
JURisDiCTiOn
municipal / municipal 14 61 25 54 40 6 30 62 8
Estadual / State 10 62 27 56 41 3 31 65 4
SÉRIEgRADE
4a série / 5o ano do Ensino Fundamental4th grade / 5th year elementary education 11 61 28 53 41 6 31 61 8
8a série / 9o ano do Ensino Fundamental8th grade / 9th year elementary education 15 61 25 56 38 6 30 63 7
2o ano do Ensino médio2nd year of Secondary education 12 61 27 55 43 2 30 67 2
COMPUTADOR INSTALADO
NO LABORATóRIO DE INFORMÁTICA
COMPUTER insTAllED AT iT lAb
Sim / yes 14 61 25 55 41 4 33 63 5
Não / No 4 64 32 54 38 8 21 68 11
INTERNET INSTALADA NO LABORATóRIO DE INFORMÁTICA
inTERnET AVAilAblE AT iT lAb
Sim / yes 16 60 24 57 40 3 33 63 4
Não / No 4 64 31 50 42 8 25 65 10
1 Base: 1.535 professores. Respostas estimuladas.1 base: 1,535 teachers. stimulated answers.

2010 Pesquisa TIC EducaçãoTABELAS DE RESuLTADOS – PROFESSORES
PO
RTu
Gu
ÊS
En
gli
sh
337
E8 APOIO AO PROFESSOR NO USO DE COMPUTADOR E INTERNET – ContinuaçãoSuPPort for teaCherS IN ComPuter aNd INterNet uSe – ContinuationPercentual sobre o total de professores ¹Percentage of the total number of teachers 1
Percentual (%)Percentage (%)
Grupo de trabalho formado na própria
escola com esta finalidade Working groups
set up in the school itself for this purpose
Nas reuniões coletivas entre professores da escola em que este tema surge com frequência
At teachers’ meetings at the school, where
this theme is common
Leitura em revistas e outros textos especializados
Magazines and other specialized literature
SimYes
Nãono
Não se aplicaDoes not
apply
SimYes
Nãono
Não se aplicaDoes not
apply
SimYes
Nãono
Não se aplicaDoes not
apply
TOTAL 32 61 7 55 40 5 64 32 4
SEXOgEnDER
Feminino / female 34 59 7 57 38 5 65 31 4
masculino / male 26 68 6 48 47 5 61 36 3
FAIXA ETÁRIAAgE gROUP
≤ 30 27 67 6 55 39 6 64 32 4
31-45 34 60 7 55 41 4 66 31 3
46+ 31 62 7 54 40 6 62 33 5
RENDA FAMILIARFAMilY inCOME
Até 3 Sm up to 3 mw 29 60 11 46 43 10 56 35 9
mais de 3 até 5 Sm more than 3 up to 5 mw 30 63 7 50 45 5 63 35 3
mais de 5 Sm more than 5 mw 34 61 5 59 36 4 68 29 3
RENDA PESSOALinDiViDUAl inCOME
Até 3 Sm up to 3 mw 33 57 10 54 38 7 65 29 6
mais de 3 até 5 Sm more than 3 up to 5 mw 31 64 5 57 40 3 63 35 2
mais de 5 Sm more than 5 mw 31 64 5 51 43 6 66 31 3
REGIÃOREgiOn
Norte / Centro-oeste / North / Center-west 30 60 9 46 45 9 57 37 6
Nordeste / Northeast 22 69 9 45 48 8 57 37 6
Sudeste / Southeast 34 62 5 61 36 3 70 28 2
Sul / South 50 47 3 71 28 1 75 24 1
DEPENDêNCIA ADMINISTRATIvAADMinisTRATiVE
JURisDiCTiOn
municipal / municipal 30 61 8 51 43 6 64 31 5
Estadual / State 34 61 5 58 37 4 65 33 2
SÉRIEgRADE
4a série / 5o ano do Ensino Fundamental4th grade / 5th year elementary education 31 60 9 51 42 7 63 32 5
8a série / 9o ano do Ensino Fundamental8th grade / 9th year elementary education 31 62 7 50 43 7 65 30 5
2o ano do Ensino médio2nd year of Secondary education 34 61 4 59 38 3 64 35 1
COMPUTADOR INSTALADO
NO LABORATóRIO DE INFORMÁTICA
COMPUTER insTAllED AT iT lAb
Sim / yes 34 60 6 57 38 4 66 32 3
Não / No 22 65 12 43 47 10 60 31 9
INTERNET INSTALADA NO LABORATóRIO DE INFORMÁTICA
inTERnET AVAilAblE AT iT lAb
Sim / yes 36 59 5 61 36 4 68 30 2
Não / No 23 66 11 41 50 9 57 36 7
1 Base: 1.535 professores. Respostas estimuladas.1 base: 1,535 teachers. stimulated answers.

Survey on ICT Education 2010TABLES OF RESuLTS – TEACHERS
PO
RTu
Gu
ÊS
En
gli
sh
338
E8 APOIO AO PROFESSOR NO USO DE COMPUTADOR E INTERNET – ContinuaçãoSuPPort for teaCherS IN ComPuter aNd INterNet uSe – ContinuationPercentual sobre o total de professores ¹Percentage of the total number of teachers 1
Percentual (%)Percentage (%)
Formadores da Secretaria de Ensino
Trainers from the Department of Education
Formadores de outras organizações externas à escola
Trainers from organizations external to the school
SimYes
Nãono
Não se aplica
Does not apply
SimYes
Nãono
Não se aplica
Does not apply
TOTAL 35 60 4 24 71 5
SEXOgEnDER
Feminino / female 37 58 4 25 70 5
masculino / male 28 68 4 20 75 5
FAIXA ETÁRIAAgE gROUP
≤ 30 33 63 4 27 68 5
31-45 36 60 4 24 71 5
46+ 35 59 5 22 72 7
RENDA FAMILIARFAMilY inCOME
Até 3 Sm up to 3 mw 32 58 9 17 71 13
mais de 3 até 5 Sm more than 3 up to 5 mw 36 60 4 24 72 4
mais de 5 Sm more than 5 mw 37 60 3 26 71 4
RENDA PESSOALinDiViDUAl inCOME
Até 3 Sm up to 3 mw 34 59 7 20 72 9
mais de 3 até 5 Sm more than 3 up to 5 mw 36 62 2 26 71 3
mais de 5 Sm more than 5 mw 39 58 3 27 69 4
REGIÃOREgiOn
Norte / Centro-oeste / North / Center-west 35 57 8 23 68 8
Nordeste / Northeast 32 61 7 17 75 8
Sudeste / Southeast 36 63 2 28 69 3
Sul / South 42 57 2 27 71 2
DEPENDêNCIA ADMINISTRATIvAADMinisTRATiVE
JURisDiCTiOn
municipal / municipal 36 58 5 24 69 7
Estadual / State 34 62 3 23 73 4
SÉRIEgRADE
4a série / 5o ano do Ensino Fundamental4th grade / 5th year elementary education 36 58 6 23 70 7
8a série / 9o ano do Ensino Fundamental8th grade / 9th year elementary education 33 61 6 21 72 6
2o ano do Ensino médio2nd year of Secondary education 36 62 2 25 72 3
COMPUTADOR INSTALADO
NO LABORATóRIO DE INFORMÁTICA
COMPUTER insTAllED AT iT lAb
Sim / yes 38 59 3 24 71 4
Não / No 24 67 9 22 69 10
INTERNET INSTALADA NO LABORATóRIO DE INFORMÁTICA
inTERnET AVAilAblE AT iT lAb
Sim / yes 39 58 3 24 72 4
Não / No 27 65 8 23 68 9
1 Base: 1.535 professores. Respostas estimuladas.1 base: 1,535 teachers. stimulated answers.

2010 Pesquisa TIC EducaçãoTABELAS DE RESuLTADOS – PROFESSORES
PO
RTu
Gu
ÊS
En
gli
sh
339
Percentual (%)Percentage (%)
A escola tem computadores que os alunos podem utilizarThe school has computers that can be used by students
Discordo totalmente
i totally disagree
Discordo em parte i partly
disagree
Não concordo
nem discordoi neither
agree nor disagree
Concordo em partei partly agree
Concordo totalmente
i totally agree
Não sabe Does not
know
TOTAL 19 5 4 23 49 1
SEXOgEnDER
Feminino / female 19 5 4 23 49 1
masculino / male 17 5 3 23 51 1
FAIXA ETÁRIAAgE gROUP
≤ 30 19 4 4 16 56 1
31-45 17 4 5 23 51 1
46+ 22 6 3 26 43 1
RENDA FAMILIARFAMilY inCOME
Até 3 Sm up to 3 mw 27 6 5 16 45 -
mais de 3 até 5 Sm more than 3 up to 5 mw 19 6 5 21 48 1
mais de 5 Sm more than 5 mw 16 3 3 25 52 1
RENDA PESSOALinDiViDUAl inCOME
Até 3 Sm up to 3 mw 21 5 5 19 50 1
mais de 3 até 5 Sm more than 3 up to 5 mw 18 4 4 25 48 1
mais de 5 Sm more than 5 mw 14 4 3 27 52 1
REGIÃOREgiOn
Norte / Centro-oeste / North / Center-west 16 4 5 28 46 -
Nordeste / Northeast 27 5 5 19 43 1
Sudeste / Southeast 17 6 4 25 48 1
Sul / South 8 4 1 17 70 0
DEPENDêNCIA ADMINISTRATIvAADMinisTRATiVE
JURisDiCTiOn
municipal / municipal 21 5 4 22 47 1
Estadual / State 16 5 4 24 52 -
SÉRIEgRADE
4a série / 5o ano do Ensino Fundamental4th grade / 5th year elementary education 21 5 4 23 46 1
8a série / 9o ano do Ensino Fundamental8th grade / 9th year elementary education 17 5 4 21 52 1
2o ano do Ensino médio2nd year of Secondary education 13 6 4 25 51 1
COMPUTADOR INSTALADO
NO LABORATóRIO DE INFORMÁTICA
COMPUTER insTAllED AT iT lAb
Sim / yes 9 4 3 26 57 1
Não / No 64 7 7 8 13 2
INTERNET INSTALADA NO LABORATóRIO DE INFORMÁTICA
inTERnET AVAilAblE AT iT lAb
Sim / yes 7 4 3 25 61 1
Não / No 44 7 7 18 23 1
1 Base: 1.535 professores. Respostas estimuladas e rodiziadas.1 base: 1,535 teachers. stimulated, alternated answers.
E9 PERCEPÇÃO DO PROFESSOR SOBRE AS CONDIÇÕES DE USO DAS TIC NAS ESCOLASteaCher’S PerCePtIoN oN the uSe of ICt reSourCeS IN SChoolSPercentual sobre o total de professores 1Percentage of the total number of teachers 1

Survey on ICT Education 2010TABLES OF RESuLTS – TEACHERS
PO
RTu
Gu
ÊS
En
gli
sh
340
Percentual (%)Percentage (%)
A escola oferece aos alunos possibilidade de acesso à InternetThe school provides internet access to students
Discordo totalmente
i totally disagree
Discordo em parte i partly
disagree
Não concordo,
nem discordoi neither
agree nor disagree
Concordo em partei partly agree
Concordo totalmente
i totally agree
Não sabe Does not
know
TOTAL 25 7 4 22 41 1
SEXOgEnDER
Feminino / female 26 7 4 22 40 1
masculino / male 23 6 4 20 46 1
FAIXA ETÁRIAAgE gROUP
≤ 30 25 6 6 12 50 -
31-45 24 7 3 23 41 1
46+ 27 7 4 25 36 2
RENDA FAMILIARFAMilY inCOME
Até 3 Sm up to 3 mw 39 6 3 15 34 3
mais de 3 até 5 Sm more than 3 up to 5 mw 25 7 5 22 40 1
mais de 5 Sm more than 5 mw 21 7 3 23 45 1
RENDA PESSOALinDiViDUAl inCOME
Até 3 Sm up to 3 mw 31 6 4 18 40 1
mais de 3 até 5 Sm more than 3 up to 5 mw 22 8 5 23 41 1
mais de 5 Sm more than 5 mw 19 5 2 28 44 1
REGIÃOREgiOn
Norte / Centro-oeste / North / Center-west 22 9 5 25 36 2
Nordeste / Northeast 35 7 3 20 34 1
Sudeste / Southeast 22 7 5 24 40 1
Sul / South 14 4 1 16 65 -
DEPENDêNCIA ADMINISTRATIvAADMinisTRATiVE
JURisDiCTiOn
municipal / municipal 31 7 4 20 37 1
Estadual / State 19 7 3 24 46 1
SÉRIEgRADE
4a série / 5o ano do Ensino Fundamental4th grade / 5th year elementary education 31 8 4 21 35 1
8a série / 9o ano do Ensino Fundamental8th grade / 9th year elementary education 23 7 3 21 44 2
2o ano do Ensino médio2nd year of Secondary education 17 7 4 24 47 1
COMPUTADOR INSTALADO
NO LABORATóRIO DE INFORMÁTICA
COMPUTER insTAllED AT iT lAb
Sim / yes 16 7 4 24 49 1
Não / No 67 8 5 12 8 1
INTERNET INSTALADA NO LABORATóRIO DE INFORMÁTICA
inTERnET AVAilAblE AT iT lAb
Sim / yes 9 6 4 25 54 1
Não / No 61 8 4 14 11 2
1 Base: 1.535 professores. Respostas estimuladas e rodiziadas.1 base: 1,535 teachers. stimulated, alternated answers.
E9 PERCEPÇÃO DO PROFESSOR SOBRE AS CONDIÇÕES DE USO DAS TIC NAS ESCOLAS – ContinuaçãoteaCher’S PerCePtIoN oN the uSe of ICt reSourCeS IN SChoolS – ContinuationPercentual sobre o total de professores 1Percentage of the total number of teachers 1

2010 Pesquisa TIC EducaçãoTABELAS DE RESuLTADOS – PROFESSORES
PO
RTu
Gu
ÊS
En
gli
sh
341
Percentual (%)Percentage (%)
Na escola é feita manutenção regular dos computadoresMaintenance is regularly performed in the school
Discordo totalmente
i totally disagree
Discordo em parte i partly
disagree
Não concordo
nem discordoi neither
agree nor disagree
Concordo em partei partly agree
Concordo totalmente
i totally agree
Não sabe Does not
know
TOTAL 17 6 8 22 36 12
SEXOgEnDER
Feminino / female 17 6 8 21 36 11
masculino / male 16 5 8 22 34 14
FAIXA ETÁRIAAgE gROUP
≤ 30 20 4 12 19 34 11
31-45 16 6 7 23 37 11
46+ 16 7 8 20 35 14
RENDA FAMILIARFAMilY inCOME
Até 3 Sm up to 3 mw 26 5 9 13 30 16
mais de 3 até 5 Sm more than 3 up to 5 mw 18 7 8 23 31 13
mais de 5 Sm more than 5 mw 14 5 8 24 40 10
RENDA PESSOALinDiViDUAl inCOME
Até 3 Sm up to 3 mw 20 6 8 17 36 12
mais de 3 até 5 Sm more than 3 up to 5 mw 15 6 9 24 34 12
mais de 5 Sm more than 5 mw 13 5 7 26 38 10
REGIÃOREgiOn
Norte / Centro-oeste / North / Center-west 13 6 11 24 34 13
Nordeste / Northeast 28 6 7 16 26 18
Sudeste / Southeast 13 7 10 26 35 9
Sul / South 8 2 4 20 60 5
DEPENDêNCIA ADMINISTRATIvAADMinisTRATiVE
JURisDiCTiOn
municipal / municipal 19 5 9 19 35 13
Estadual / State 15 6 8 24 36 11
SÉRIEgRADE
4a série / 5o ano do Ensino Fundamental4th grade / 5th year elementary education 19 6 8 20 33 13
8a série / 9o ano do Ensino Fundamental8th grade / 9th year elementary education 15 5 8 22 36 15
2o ano do Ensino médio2nd year of Secondary education 13 8 8 21 39 11
COMPUTADOR INSTALADO
NO LABORATóRIO DE INFORMÁTICA
COMPUTER insTAllED AT iT lAb
Sim / yes 10 6 8 24 40 11
Não / No 45 8 8 11 14 13
INTERNET INSTALADA NO LABORATóRIO DE INFORMÁTICA
inTERnET AVAilAblE AT iT lAb
Sim / yes 8 5 8 24 44 11
Não / No 35 8 8 17 17 14
1 Base: 1.535 professores. Respostas estimuladas e rodiziadas.1 base: 1,535 teachers. stimulated, alternated answers.
E9 PERCEPÇÃO DO PROFESSOR SOBRE AS CONDIÇÕES DE USO DAS TIC NAS ESCOLAS – ContinuaçãoteaCher’S PerCePtIoN oN the uSe of ICt reSourCeS IN SChoolS – ContinuationPercentual sobre o total de professores 1Percentage of the total number of teachers 1

Survey on ICT Education 2010TABLES OF RESuLTS – TEACHERS
PO
RTu
Gu
ÊS
En
gli
sh
342
Percentual (%)Percentage (%)
Na escola falta treinamento para os alunos sobre o uso de computador e Internet
The school lacks computer and internet training for students
Discordo totalmente
i totally disagree
Discordo em parte i partly
disagree
Não concordo
nem discordoi neither
agree nor disagree
Concordo em partei partly agree
Concordo totalmente
i totally agree
Não sabe Does not
know
TOTAL 18 10 6 28 37 2
SEXOgEnDER
Feminino / female 19 10 6 27 36 3
masculino / male 13 9 5 30 40 2
FAIXA ETÁRIAAgE gROUP
≤ 30 21 7 8 28 35 1
31-45 17 9 6 28 37 3
46+ 16 14 5 27 36 2
RENDA FAMILIARFAMilY inCOME
Até 3 Sm up to 3 mw 19 6 6 23 43 2
mais de 3 até 5 Sm more than 3 up to 5 mw 18 8 5 27 40 2
mais de 5 Sm more than 5 mw 17 12 6 30 33 3
RENDA PESSOALinDiViDUAl inCOME
Até 3 Sm up to 3 mw 18 8 6 28 39 2
mais de 3 até 5 Sm more than 3 up to 5 mw 19 10 6 27 35 2
mais de 5 Sm more than 5 mw 15 13 4 29 36 3
REGIÃOREgiOn
Norte / Centro-oeste / North / Center-west 16 9 9 31 31 3
Nordeste / Northeast 16 6 4 22 49 2
Sudeste / Southeast 18 10 6 29 34 3
Sul / South 20 19 4 32 24 1
DEPENDêNCIA ADMINISTRATIvAADMinisTRATiVE
JURisDiCTiOn
municipal / municipal 20 10 5 25 38 3
Estadual / State 14 10 7 31 35 2
SÉRIEgRADE
4a série / 5o ano do Ensino Fundamental4th grade / 5th year elementary education 19 8 6 26 38 3
8a série / 9o ano do Ensino Fundamental8th grade / 9th year elementary education 15 10 5 29 37 4
2o ano do Ensino médio2nd year of Secondary education 15 12 7 27 38 2
COMPUTADOR INSTALADO
NO LABORATóRIO DE INFORMÁTICA
COMPUTER insTAllED AT iT lAb
Sim / yes 18 11 6 31 31 3
Não / No 16 3 5 14 60 2
INTERNET INSTALADA NO LABORATóRIO DE INFORMÁTICA
inTERnET AVAilAblE AT iT lAb
Sim / yes 18 12 6 32 30 2
Não / No 17 5 5 19 52 3
1 Base: 1.535 professores. Respostas estimuladas e rodiziadas.1 base: 1,535 teachers. stimulated, alternated answers.
E9 PERCEPÇÃO DO PROFESSOR SOBRE AS CONDIÇÕES DE USO DAS TIC NAS ESCOLAS – ContinuaçãoteaCher’S PerCePtIoN oN the uSe of ICt reSourCeS IN SChoolS – ContinuationPercentual sobre o total de professores 1Percentage of the total number of teachers 1

2010 Pesquisa TIC EducaçãoTABELAS DE RESuLTADOS – PROFESSORES
PO
RTu
Gu
ÊS
En
gli
sh
343
Percentual (%)Percentage (%)
Na escola falta treinamento para os professores sobre o uso de computador e Internet
The school lacks computer and internet training for teachers
Discordo totalmente
i totally disagree
Discordo em parte i partly
disagree
Não concordo
nem discordoi neither
agree nor disagree
Concordo em partei partly agree
Concordo totalmente
i totally agree
Não sabe Does not
know
TOTAL 14 9 6 29 41 1
SEXOgEnDER
Feminino / female 15 9 5 29 40 1
masculino / male 13 10 6 27 43 1
FAIXA ETÁRIAAgE gROUP
≤ 30 17 10 7 24 41 2
31-45 14 10 5 31 39 1
46+ 14 8 6 27 43 1
RENDA FAMILIARFAMilY inCOME
Até 3 Sm up to 3 mw 13 6 5 22 53 1
mais de 3 até 5 Sm more than 3 up to 5 mw 15 9 5 28 42 1
mais de 5 Sm more than 5 mw 15 10 6 31 36 1
RENDA PESSOALinDiViDUAl inCOME
Até 3 Sm up to 3 mw 12 9 4 28 45 1
mais de 3 até 5 Sm more than 3 up to 5 mw 17 10 6 29 37 2
mais de 5 Sm more than 5 mw 16 10 7 28 38 1
REGIÃOREgiOn
Norte / Centro-oeste / North / Center-west 16 11 10 27 34 2
Nordeste / Northeast 13 7 3 27 51 1
Sudeste / Southeast 16 9 7 27 40 1
Sul / South 13 16 2 39 30 -
DEPENDêNCIA ADMINISTRATIvAADMinisTRATiVE
JURisDiCTiOn
municipal / municipal 15 8 5 27 44 1
Estadual / State 14 11 6 31 37 1
SÉRIEgRADE
4a série / 5o ano do Ensino Fundamental4th grade / 5th year elementary education 13 8 5 28 45 1
8a série / 9o ano do Ensino Fundamental8th grade / 9th year elementary education 13 8 6 31 41 1
2o ano do Ensino médio2nd year of Secondary education 16 12 5 30 37 1
COMPUTADOR INSTALADO
NO LABORATóRIO DE INFORMÁTICA
COMPUTER insTAllED AT iT lAb
Sim / yes 14 10 6 32 37 1
Não / No 16 6 6 13 58 1
INTERNET INSTALADA NO LABORATóRIO DE INFORMÁTICA
inTERnET AVAilAblE AT iT lAb
Sim / yes 14 11 6 33 35 1
Não / No 15 6 5 18 54 1
1 Base: 1.535 professores. Respostas estimuladas e rodiziadas.1 base: 1,535 teachers. stimulated, alternated answers.
E9 PERCEPÇÃO DO PROFESSOR SOBRE AS CONDIÇÕES DE USO DAS TIC NAS ESCOLAS – ContinuaçãoteaCher’S PerCePtIoN oN the uSe of ICt reSourCeS IN SChoolS – ContinuationPercentual sobre o total de professores 1Percentage of the total number of teachers 1

Survey on ICT Education 2010TABLES OF RESuLTS – TEACHERS
PO
RTu
Gu
ÊS
En
gli
sh
344
Percentual (%)Percentage (%)
O projeto pedagógico da escola estabelece o uso de computador e/ou Internet
The pedagogical plan of the school provides for the use of computers and/or the internet
Discordo totalmente
i totally disagree
Discordo em parte i partly
disagree
Não concordo
nem discordoi neither
agree nor disagree
Concordo em partei partly agree
Concordo totalmente
i totally agree
Não sabe Does not
know
TOTAL 16 7 8 25 38 6
SEXOgEnDER
Feminino / female 15 7 8 25 40 5
masculino / male 18 8 9 26 32 7
FAIXA ETÁRIAAgE gROUP
≤ 30 17 6 10 19 42 6
31-45 15 7 8 26 38 6
46+ 16 7 8 28 35 5
RENDA FAMILIARFAMilY inCOME
Até 3 Sm up to 3 mw 23 9 7 24 32 6
mais de 3 até 5 Sm more than 3 up to 5 mw 17 7 10 24 36 7
mais de 5 Sm more than 5 mw 12 6 7 28 41 5
RENDA PESSOALinDiViDUAl inCOME
Até 3 Sm up to 3 mw 17 9 6 24 38 6
mais de 3 até 5 Sm more than 3 up to 5 mw 15 5 10 26 39 5
mais de 5 Sm more than 5 mw 14 6 8 28 37 7
REGIÃOREgiOn
Norte / Centro-oeste / North / Center-west 14 7 13 21 37 7
Nordeste / Northeast 23 8 7 23 31 7
Sudeste / Southeast 13 6 8 28 41 5
Sul / South 9 8 4 30 46 3
DEPENDêNCIA ADMINISTRATIvAADMinisTRATiVE
JURisDiCTiOn
municipal / municipal 16 7 9 24 37 6
Estadual / State 15 7 7 27 39 5
SÉRIEgRADE
4a série / 5o ano do Ensino Fundamental4th grade / 5th year elementary education 18 9 8 22 37 6
8a série / 9o ano do Ensino Fundamental8th grade / 9th year elementary education 16 5 9 26 36 8
2o ano do Ensino médio2nd year of Secondary education 12 7 8 28 40 5
COMPUTADOR INSTALADO
NO LABORATóRIO DE INFORMÁTICA
COMPUTER insTAllED AT iT lAb
Sim / yes 12 7 8 27 42 5
Não / No 32 8 10 21 21 8
INTERNET INSTALADA NO LABORATóRIO DE INFORMÁTICA
inTERnET AVAilAblE AT iT lAb
Sim / yes 10 6 7 28 44 5
Não / No 27 9 12 21 24 6
1 Base: 1.535 professores. Respostas estimuladas e rodiziadas.1 base: 1,535 teachers. stimulated, alternated answers.
E9 PERCEPÇÃO DO PROFESSOR SOBRE AS CONDIÇÕES DE USO DAS TIC NAS ESCOLAS – ContinuaçãoteaCher’S PerCePtIoN oN the uSe of ICt reSourCeS IN SChoolS – ContinuationPercentual sobre o total de professores 1Percentage of the total number of teachers 1

2010 Pesquisa TIC EducaçãoTABELAS DE RESuLTADOS – PROFESSORES
PO
RTu
Gu
ÊS
En
gli
sh
345
Percentual (%)Percentage (%)
A direção/coordenação pedagógica da escola incentiva os professores a usar a Internet nas atividades pedagógicas
The school’s administration and coordination encourage teachers to use the internet in educational activities
Discordo totalmente
i totally disagree
Discordo em parte i partly
disagree
Não concordo
nem discordoi neither
agree nor disagree
Concordo em partei partly agree
Concordo totalmente
i totally agree
Não sabe Does not
know
TOTAL 10 6 9 26 48 1
SEXOgEnDER
Feminino / female 9 6 8 26 50 1
masculino / male 14 6 11 24 42 3
FAIXA ETÁRIAAgE gROUP
≤ 30 10 7 11 23 47 2
31-45 10 4 8 26 50 1
46+ 9 10 9 26 45 1
RENDA FAMILIARFAMilY inCOME
Até 3 Sm up to 3 mw 15 9 10 26 39 1
mais de 3 até 5 Sm more than 3 up to 5 mw 11 6 9 25 47 2
mais de 5 Sm more than 5 mw 8 6 9 26 51 1
RENDA PESSOALinDiViDUAl inCOME
Até 3 Sm up to 3 mw 10 8 9 24 47 2
mais de 3 até 5 Sm more than 3 up to 5 mw 9 5 9 26 49 1
mais de 5 Sm more than 5 mw 11 6 7 27 48 2
REGIÃOREgiOn
Norte / Centro-oeste / North / Center-west 9 7 11 26 46 1
Nordeste / Northeast 14 8 11 27 38 2
Sudeste / Southeast 9 6 8 25 51 1
Sul / South 5 2 3 25 64 -
DEPENDêNCIA ADMINISTRATIvAADMinisTRATiVE
JURisDiCTiOn
municipal / municipal 11 6 10 25 46 2
Estadual / State 9 7 7 26 50 1
SÉRIEgRADE
4a série / 5o ano do Ensino Fundamental4th grade / 5th year elementary education 10 7 10 25 47 1
8a série / 9o ano do Ensino Fundamental8th grade / 9th year elementary education 10 6 9 26 47 2
2o ano do Ensino médio2nd year of Secondary education 9 7 9 25 48 1
COMPUTADOR INSTALADO
NO LABORATóRIO DE INFORMÁTICA
COMPUTER insTAllED AT iT lAb
Sim / yes 8 5 9 25 52 1
Não / No 17 10 10 28 32 3
INTERNET INSTALADA NO LABORATóRIO DE INFORMÁTICA
inTERnET AVAilAblE AT iT lAb
Sim / yes 7 5 8 25 55 1
Não / No 17 8 12 28 32 2
1 Base: 1.535 professores. Respostas estimuladas e rodiziadas.1 base: 1,535 teachers. stimulated, alternated answers.
E9 PERCEPÇÃO DO PROFESSOR SOBRE AS CONDIÇÕES DE USO DAS TIC NAS ESCOLAS – ContinuaçãoteaCher’S PerCePtIoN oN the uSe of ICt reSourCeS IN SChoolS – ContinuationPercentual sobre o total de professores 1Percentage of the total number of teachers 1
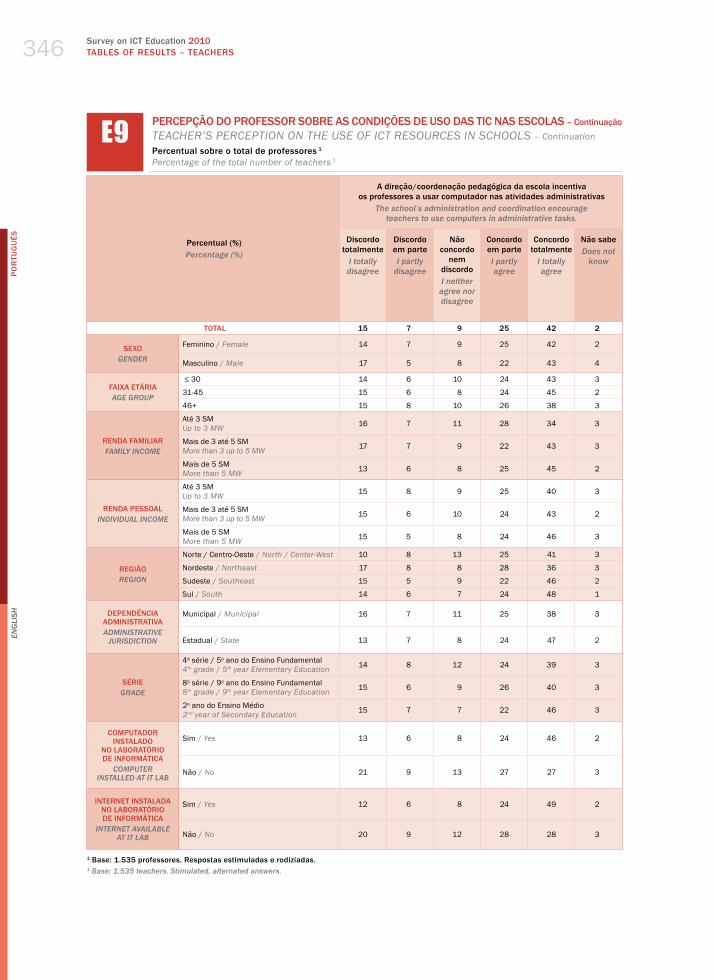
Survey on ICT Education 2010TABLES OF RESuLTS – TEACHERS
PO
RTu
Gu
ÊS
En
gli
sh
346
Percentual (%)Percentage (%)
A direção/coordenação pedagógica da escola incentiva os professores a usar computador nas atividades administrativas
The school’s administration and coordination encourage teachers to use computers in administrative tasks.
Discordo totalmente
i totally disagree
Discordo em parte i partly
disagree
Não concordo
nem discordoi neither
agree nor disagree
Concordo em partei partly agree
Concordo totalmente
i totally agree
Não sabe Does not
know
TOTAL 15 7 9 25 42 2
SEXOgEnDER
Feminino / female 14 7 9 25 42 2
masculino / male 17 5 8 22 43 4
FAIXA ETÁRIAAgE gROUP
≤ 30 14 6 10 24 43 3
31-45 15 6 8 24 45 2
46+ 15 8 10 26 38 3
RENDA FAMILIARFAMilY inCOME
Até 3 Sm up to 3 mw 16 7 11 28 34 3
mais de 3 até 5 Sm more than 3 up to 5 mw 17 7 9 22 43 3
mais de 5 Sm more than 5 mw 13 6 8 25 45 2
RENDA PESSOALinDiViDUAl inCOME
Até 3 Sm up to 3 mw 15 8 9 25 40 3
mais de 3 até 5 Sm more than 3 up to 5 mw 15 6 10 24 43 2
mais de 5 Sm more than 5 mw 15 5 8 24 46 3
REGIÃOREgiOn
Norte / Centro-oeste / North / Center-west 10 8 13 25 41 3
Nordeste / Northeast 17 8 8 28 36 3
Sudeste / Southeast 15 5 9 22 46 2
Sul / South 14 6 7 24 48 1
DEPENDêNCIA ADMINISTRATIvAADMinisTRATiVE
JURisDiCTiOn
municipal / municipal 16 7 11 25 38 3
Estadual / State 13 7 8 24 47 2
SÉRIEgRADE
4a série / 5o ano do Ensino Fundamental4th grade / 5th year elementary education 14 8 12 24 39 3
8a série / 9o ano do Ensino Fundamental8th grade / 9th year elementary education 15 6 9 26 40 3
2o ano do Ensino médio2nd year of Secondary education 15 7 7 22 46 3
COMPUTADOR INSTALADO
NO LABORATóRIO DE INFORMÁTICA
COMPUTER insTAllED AT iT lAb
Sim / yes 13 6 8 24 46 2
Não / No 21 9 13 27 27 3
INTERNET INSTALADA NO LABORATóRIO DE INFORMÁTICA
inTERnET AVAilAblE AT iT lAb
Sim / yes 12 6 8 24 49 2
Não / No 20 9 12 28 28 3
1 Base: 1.535 professores. Respostas estimuladas e rodiziadas.1 base: 1,535 teachers. stimulated, alternated answers.
E9 PERCEPÇÃO DO PROFESSOR SOBRE AS CONDIÇÕES DE USO DAS TIC NAS ESCOLAS – ContinuaçãoteaCher’S PerCePtIoN oN the uSe of ICt reSourCeS IN SChoolS – ContinuationPercentual sobre o total de professores 1Percentage of the total number of teachers 1

2010 Pesquisa TIC EducaçãoTABELAS DE RESuLTADOS – PROFESSORES
PO
RTu
Gu
ÊS
En
gli
sh
347
Percentual (%)Percentage (%)
Muito tempo para planejar aulas ou realizar outras atividades da escola usando computador e/ou Internet
Plenty of time to plan lessons or carry out other school activities using the computer and/or the internet
Discordo totalmente
i totally disagree
Discordo em parte i partly
disagree
Não concordo
nem discordoi neither
agree nor disagree
Concordo em partei partly agree
Concordo totalmente
i totally agree
Não sabe Does not
know
TOTAL 19 12 9 30 31 1
SEXOgEnDER
Feminino / female 18 13 9 30 30 1
masculino / male 20 9 9 29 32 1
FAIXA ETÁRIAAgE gROUP
≤ 30 22 11 10 31 25 2
31-45 19 12 8 29 31 -
46+ 15 12 9 30 33 -
RENDA FAMILIARFAMilY inCOME
Até 3 Sm up to 3 mw 25 13 13 24 24 1
mais de 3 até 5 Sm more than 3 up to 5 mw 21 13 8 29 28 1
mais de 5 Sm more than 5 mw 15 11 8 32 34 -
RENDA PESSOALinDiViDUAl inCOME
Até 3 Sm up to 3 mw 22 13 10 30 24 1
mais de 3 até 5 Sm more than 3 up to 5 mw 16 11 8 29 34 1
mais de 5 Sm more than 5 mw 16 10 7 29 37 1
REGIÃOREgiOn
Norte / Centro-oeste / North / Center-west 14 14 13 29 28 1
Nordeste / Northeast 26 14 12 28 18 1
Sudeste / Southeast 16 9 6 28 40 1
Sul / South 13 10 1 39 37 -
DEPENDêNCIA ADMINISTRATIvAADMinisTRATiVE
JURisDiCTiOn
municipal / municipal 21 12 9 28 28 1
Estadual / State 16 11 8 31 33 -
SÉRIEgRADE
4a série / 5o ano do Ensino Fundamental4th grade / 5th year elementary education 20 14 9 29 28 1
8a série / 9o ano do Ensino Fundamental8th grade / 9th year elementary education 19 9 10 31 30 1
2o ano do Ensino médio2nd year of Secondary education 14 12 10 27 36 -
COMPUTADOR INSTALADO
NO LABORATóRIO DE INFORMÁTICA
COMPUTER insTAllED AT iT lAb
Sim / yes 17 12 8 32 30 1
Não / No 27 12 12 17 31 1
INTERNET INSTALADA NO LABORATóRIO DE INFORMÁTICA
inTERnET AVAilAblE AT iT lAb
Sim / yes 16 12 7 33 31 -
Não / No 24 11 12 23 28 1
1 Base: 1.535 professores. Respostas estimuladas e rodiziadas.1 base: 1,535 teachers. stimulated, alternated answers.
E9 PERCEPÇÃO DO PROFESSOR SOBRE AS CONDIÇÕES DE USO DAS TIC NAS ESCOLAS – ContinuaçãoteaCher’S PerCePtIoN oN the uSe of ICt reSourCeS IN SChoolS – ContinuationPercentual sobre o total de professores 1Percentage of the total number of teachers 1

Survey on ICT Education 2010TABLES OF RESuLTS – TEACHERS
PO
RTu
Gu
ÊS
En
gli
sh
348
Percentual (%)Percentage (%)
Preparar as aulasPlanning lessons
Todos os dias ou quase Everyday or nearly everyday
Pelo menos uma vez
por semanaAt least
once a week
Pelo menos uma vez por mêsAt least
once a month
Menos de uma vez por mês
less than once a month
Não costuma realizar esta
atividadeDoes not
usually do this activity
TOTAL 26 41 12 6 15
SEXOgEnDER
Feminino / female 26 41 12 5 16
masculino / male 27 39 14 7 13
FAIXA ETÁRIAAgE gROUP
≤ 30 33 41 7 9 10
31-45 28 41 14 5 13
46+ 19 39 13 6 23
RENDA FAMILIARFAMilY inCOME
Até 3 Sm up to 3 mw 16 31 15 6 31
mais de 3 até 5 Sm more than 3 up to 5 mw 28 40 11 5 15
mais de 5 Sm more than 5 mw 28 44 12 5 11
RENDA PESSOALinDiViDUAl inCOME
Até 3 Sm up to 3 mw 24 37 11 6 21
mais de 3 até 5 Sm more than 3 up to 5 mw 29 41 12 6 12
mais de 5 Sm more than 5 mw 24 48 14 4 9
REGIÃOREgiOn
Norte / Centro-oeste / North / Center-west 22 41 14 4 19
Nordeste / Northeast 16 33 17 8 27
Sudeste / Southeast 32 46 10 5 7
Sul / South 38 45 7 3 8
DEPENDêNCIA ADMINISTRATIvAADMinisTRATiVE
JURisDiCTiOn
municipal / municipal 24 38 14 5 18
Estadual / State 28 43 11 6 12
SÉRIEgRADE
4a série / 5o ano do Ensino Fundamental4th grade / 5th year elementary education 25 38 12 6 19
8a série / 9o ano do Ensino Fundamental8th grade / 9th year elementary education 23 38 15 6 17
2o ano do Ensino médio2nd year of Secondary education 30 43 10 6 11
COMPUTADOR INSTALADO
NO LABORATóRIO DE INFORMÁTICA
COMPUTER insTAllED AT iT lAb
Sim / yes 27 42 12 6 13
Não / No 22 35 15 4 25
INTERNET INSTALADA NO LABORATóRIO DE INFORMÁTICA
inTERnET AVAilAblE AT iT lAb
Sim / yes 27 43 12 6 12
Não / No 25 35 13 5 23
1 Base: 1.535 professores. Respostas estimuladas e rodiziadas.1 base: 1,535 teachers. stimulated, alternated answers.
E10 ATIvIDADES GERAIS DO PROFESSOR – USO DA INTERNETteaCherS’ geNeral aCtIvItIeS – uSe of the INterNetPercentual sobre o total de professores 1Percentage of the total number of teachers 1

2010 Pesquisa TIC EducaçãoTABELAS DE RESuLTADOS – PROFESSORES
PO
RTu
Gu
ÊS
En
gli
sh
349
Percentual (%)Percentage (%)
Buscar textos / conteúdo a ser trabalhado em sala de aulalooking up texts / content to be used in the classroom
Todos os dias ou quase Everyday or nearly everyday
Pelo menos uma vez
por semanaAt least
once a week
Pelo menos uma vez por mêsAt least
once a month
Menos de uma vez por mês
less than once a month
Não costuma realizar esta
atividadeDoes not
usually do this activity
TOTAL 24 42 16 5 13
SEXOgEnDER
Feminino / female 23 43 16 5 13
masculino / male 25 41 16 5 13
FAIXA ETÁRIAAgE gROUP
≤ 30 30 44 12 5 8
31-45 25 43 17 4 11
46+ 17 40 16 7 21
RENDA FAMILIARFAMilY inCOME
Até 3 Sm up to 3 mw 14 38 18 5 25
mais de 3 até 5 Sm more than 3 up to 5 mw 24 43 15 5 12
mais de 5 Sm more than 5 mw 26 44 15 5 11
RENDA PESSOALinDiViDUAl inCOME
Até 3 Sm up to 3 mw 21 41 15 5 17
mais de 3 até 5 Sm more than 3 up to 5 mw 26 43 16 4 12
mais de 5 Sm more than 5 mw 24 44 17 6 9
REGIÃOREgiOn
Norte / Centro-oeste / North / Center-west 23 36 19 6 16
Nordeste / Northeast 15 37 21 6 21
Sudeste / Southeast 28 47 12 5 8
Sul / South 31 49 10 2 8
DEPENDêNCIA ADMINISTRATIvAADMinisTRATiVE
JURisDiCTiOn
municipal / municipal 21 41 16 5 17
Estadual / State 27 44 15 4 9
SÉRIEgRADE
4a série / 5o ano do Ensino Fundamental4th grade / 5th year elementary education 21 43 16 4 16
8a série / 9o ano do Ensino Fundamental8th grade / 9th year elementary education 20 41 17 6 16
2o ano do Ensino médio2nd year of Secondary education 30 42 15 5 8
COMPUTADOR INSTALADO
NO LABORATóRIO DE INFORMÁTICA
COMPUTER insTAllED AT iT lAb
Sim / yes 24 43 16 5 12
Não / No 21 37 17 5 20
INTERNET INSTALADA NO LABORATóRIO DE INFORMÁTICA
inTERnET AVAilAblE AT iT lAb
Sim / yes 23 45 16 5 11
Não / No 24 36 15 5 20
1 Base: 1.535 professores. Respostas estimuladas e rodiziadas.1 base: 1,535 teachers. stimulated, alternated answers.
E10 ATIvIDADES GERAIS DO PROFESSOR – USO DA INTERNET – ContinuaçãoteaCherS’ geNeral aCtIvItIeS – uSe of the INterNet – ContinuationPercentual sobre o total de professores 1Percentage of the total number of teachers 1

Survey on ICT Education 2010TABLES OF RESuLTS – TEACHERS
PO
RTu
Gu
ÊS
En
gli
sh
350
Percentual (%)Percentage (%)
Buscar exemplos de planos de aulalooking up sample class plans
Todos os dias ou quase Everyday or nearly everyday
Pelo menos uma vez
por semanaAt least
once a week
Pelo menos uma vez por mêsAt least
once a month
Menos de uma vez por mês
less than once a month
Não costuma realizar esta
atividadeDoes not
usually do this activity
TOTAL 16 31 19 12 22
SEXOgEnDER
Feminino / female 15 33 20 11 22
masculino / male 18 27 18 16 21
FAIXA ETÁRIAAgE gROUP
≤ 30 20 35 19 12 14
31-45 16 32 20 11 21
46+ 13 29 18 13 27
RENDA FAMILIARFAMilY inCOME
Até 3 Sm up to 3 mw 11 27 22 8 32
mais de 3 até 5 Sm more than 3 up to 5 mw 16 33 18 11 23
mais de 5 Sm more than 5 mw 17 33 19 13 18
RENDA PESSOALinDiViDUAl inCOME
Até 3 Sm up to 3 mw 16 32 18 9 24
mais de 3 até 5 Sm more than 3 up to 5 mw 16 31 21 11 21
mais de 5 Sm more than 5 mw 15 31 19 18 17
REGIÃOREgiOn
Norte / Centro-oeste / North / Center-west 15 27 23 10 25
Nordeste / Northeast 10 25 19 14 32
Sudeste / Southeast 17 37 19 12 15
Sul / South 25 37 16 9 13
DEPENDêNCIA ADMINISTRATIvAADMinisTRATiVE
JURisDiCTiOn
municipal / municipal 14 30 19 13 24
Estadual / State 18 33 20 11 19
SÉRIEgRADE
4a série / 5o ano do Ensino Fundamental4th grade / 5th year elementary education 15 32 19 11 24
8a série / 9o ano do Ensino Fundamental8th grade / 9th year elementary education 15 29 20 13 24
2o ano do Ensino médio2nd year of Secondary education 19 30 20 13 17
COMPUTADOR INSTALADO
NO LABORATóRIO DE INFORMÁTICA
COMPUTER insTAllED AT iT lAb
Sim / yes 16 32 20 12 19
Não / No 13 30 18 9 31
INTERNET INSTALADA NO LABORATóRIO DE INFORMÁTICA
inTERnET AVAilAblE AT iT lAb
Sim / yes 15 33 20 13 19
Não / No 17 28 18 10 28
1 Base: 1.535 professores. Respostas estimuladas e rodiziadas.1 base: 1,535 teachers. stimulated, alternated answers.
E10 ATIvIDADES GERAIS DO PROFESSOR – USO DA INTERNET – ContinuaçãoteaCherS’ geNeral aCtIvItIeS – uSe of the INterNet – ContinuationPercentual sobre o total de professores 1Percentage of the total number of teachers 1

2010 Pesquisa TIC EducaçãoTABELAS DE RESuLTADOS – PROFESSORES
PO
RTu
Gu
ÊS
En
gli
sh
351
Percentual (%)Percentage (%)
Buscar exemplos de exercícios para os alunoslooking up sample exercises for students
Todos os dias ou quase Everyday or nearly everyday
Pelo menos uma vez
por semanaAt least
once a week
Pelo menos uma vez por mêsAt least
once a month
Menos de uma vez por mês
less than once a month
Não costuma realizar esta
atividadeDoes not
usually do this activity
TOTAL 23 36 17 8 16
SEXOgEnDER
Feminino / female 22 36 17 8 17
masculino / male 27 34 15 9 14
FAIXA ETÁRIAAgE gROUP
≤ 30 27 40 13 10 10
31-45 24 35 18 7 15
46+ 19 34 16 10 22
RENDA FAMILIARFAMilY inCOME
Até 3 Sm up to 3 mw 15 36 15 7 27
mais de 3 até 5 Sm more than 3 up to 5 mw 25 33 17 8 16
mais de 5 Sm more than 5 mw 24 38 16 9 13
RENDA PESSOALinDiViDUAl inCOME
Até 3 Sm up to 3 mw 21 36 15 8 20
mais de 3 até 5 Sm more than 3 up to 5 mw 26 34 18 8 14
mais de 5 Sm more than 5 mw 21 40 17 10 11
REGIÃOREgiOn
Norte / Centro-oeste / North / Center-west 22 30 18 6 23
Nordeste / Northeast 16 30 20 11 23
Sudeste / Southeast 27 41 15 8 9
Sul / South 29 43 14 5 10
DEPENDêNCIA ADMINISTRATIvAADMinisTRATiVE
JURisDiCTiOn
municipal / municipal 21 35 16 10 19
Estadual / State 26 36 18 7 14
SÉRIEgRADE
4a série / 5o ano do Ensino Fundamental4th grade / 5th year elementary education 22 33 15 8 21
8a série / 9o ano do Ensino Fundamental8th grade / 9th year elementary education 21 34 19 9 17
2o ano do Ensino médio2nd year of Secondary education 28 38 16 8 10
COMPUTADOR INSTALADO
NO LABORATóRIO DE INFORMÁTICA
COMPUTER insTAllED AT iT lAb
Sim / yes 24 37 17 8 15
Não / No 21 32 15 10 23
INTERNET INSTALADA NO LABORATóRIO DE INFORMÁTICA
inTERnET AVAilAblE AT iT lAb
Sim / yes 23 38 18 8 14
Não / No 24 29 14 10 22
1 Base: 1.535 professores. Respostas estimuladas e rodiziadas.1 base: 1,535 teachers. stimulated, alternated answers.
E10 ATIvIDADES GERAIS DO PROFESSOR – USO DA INTERNET – ContinuaçãoteaCherS’ geNeral aCtIvItIeS – uSe of the INterNet – ContinuationPercentual sobre o total de professores 1Percentage of the total number of teachers 1

Survey on ICT Education 2010TABLES OF RESuLTS – TEACHERS
PO
RTu
Gu
ÊS
En
gli
sh
352
Percentual (%)Percentage (%)
Realizar tarefas administrativas da escola (como diário de classe, fazer relatórios, registrar e organizar notas, etc.)
Administrative tasks (filling out daily registers, preparing reports, recording and organizing grades, etc.)
Todos os dias ou quase Everyday or nearly everyday
Pelo menos uma vez
por semanaAt least
once a week
Pelo menos uma vez por mêsAt least
once a month
Menos de uma vez por mês
less than once a month
Não costuma realizar esta
atividadeDoes not
usually do this activity
TOTAL 11 16 19 12 42
SEXOgEnDER
Feminino / female 10 16 20 12 42
masculino / male 11 17 17 15 40
FAIXA ETÁRIAAgE gROUP
≤ 30 10 21 20 13 35
31-45 12 17 19 12 41
46+ 9 13 18 14 47
RENDA FAMILIARFAMilY inCOME
Até 3 Sm up to 3 mw 8 13 17 6 55
mais de 3 até 5 Sm more than 3 up to 5 mw 10 19 19 11 42
mais de 5 Sm more than 5 mw 12 16 20 15 38
RENDA PESSOALinDiViDUAl inCOME
Até 3 Sm up to 3 mw 8 16 19 11 45
mais de 3 até 5 Sm more than 3 up to 5 mw 12 17 17 13 42
mais de 5 Sm more than 5 mw 12 16 23 15 34
REGIÃOREgiOn
Norte / Centro-oeste / North / Center-west 15 18 17 9 41
Nordeste / Northeast 7 14 15 11 53
Sudeste / Southeast 12 17 22 16 33
Sul / South 11 17 22 12 39
DEPENDêNCIA ADMINISTRATIvAADMinisTRATiVE
JURisDiCTiOn
municipal / municipal 10 14 20 11 45
Estadual / State 12 19 19 14 38
SÉRIEgRADE
4a série / 5o ano do Ensino Fundamental4th grade / 5th year elementary education 9 16 19 11 45
8a série / 9o ano do Ensino Fundamental8th grade / 9th year elementary education 9 14 19 11 48
2o ano do Ensino médio2nd year of Secondary education 15 19 16 15 35
COMPUTADOR INSTALADO
NO LABORATóRIO DE INFORMÁTICA
COMPUTER insTAllED AT iT lAb
Sim / yes 10 17 20 13 40
Não / No 13 12 16 9 49
INTERNET INSTALADA NO LABORATóRIO DE INFORMÁTICA
inTERnET AVAilAblE AT iT lAb
Sim / yes 10 17 20 14 39
Não / No 12 13 17 9 48
1 Base: 1.535 professores. Respostas estimuladas e rodiziadas.1 base: 1,535 teachers. stimulated, alternated answers.
E10 ATIvIDADES GERAIS DO PROFESSOR – USO DA INTERNET – ContinuaçãoteaCherS’ geNeral aCtIvItIeS – uSe of the INterNet – ContinuationPercentual sobre o total de professores 1Percentage of the total number of teachers 1

2010 Pesquisa TIC EducaçãoTABELAS DE RESuLTADOS – PROFESSORES
PO
RTu
Gu
ÊS
En
gli
sh
353
Percentual (%)Percentage (%)
Pesquisar ou fazer download de livros e trabalhos disponíveis na Internet
Researching or downloading books and articles available on the internet
Todos os dias ou quase Everyday or nearly everyday
Pelo menos uma vez
por semanaAt least
once a week
Pelo menos uma vez por mêsAt least
once a month
Menos de uma vez por mês
less than once a month
Não costuma realizar esta
atividadeDoes not
usually do this activity
TOTAL 7 24 23 13 33
SEXOgEnDER
Feminino / female 7 23 24 13 34
masculino / male 10 26 21 13 30
FAIXA ETÁRIAAgE gROUP
≤ 30 14 28 22 12 24
31-45 7 24 26 13 30
46+ 5 21 17 14 44
RENDA FAMILIARFAMilY inCOME
Até 3 Sm up to 3 mw 5 17 20 9 50
mais de 3 até 5 Sm more than 3 up to 5 mw 8 26 20 14 32
mais de 5 Sm more than 5 mw 8 25 25 14 28
RENDA PESSOALinDiViDUAl inCOME
Até 3 Sm up to 3 mw 5 20 21 13 41
mais de 3 até 5 Sm more than 3 up to 5 mw 8 25 24 13 29
mais de 5 Sm more than 5 mw 10 28 25 14 24
REGIÃOREgiOn
Norte / Centro-oeste / North / Center-west 6 22 22 14 36
Nordeste / Northeast 5 17 21 12 45
Sudeste / Southeast 10 29 25 15 22
Sul / South 8 27 24 11 30
DEPENDêNCIA ADMINISTRATIvAADMinisTRATiVE
JURisDiCTiOn
municipal / municipal 7 21 22 13 37
Estadual / State 8 27 24 13 28
SÉRIEgRADE
4a série / 5o ano do Ensino Fundamental4th grade / 5th year elementary education 6 24 22 12 36
8a série / 9o ano do Ensino Fundamental8th grade / 9th year elementary education 7 20 22 12 39
2o ano do Ensino médio2nd year of Secondary education 9 27 25 14 25
COMPUTADOR INSTALADO
NO LABORATóRIO DE INFORMÁTICA
COMPUTER insTAllED AT iT lAb
Sim / yes 8 25 24 13 31
Não / No 6 18 21 14 42
INTERNET INSTALADA NO LABORATóRIO DE INFORMÁTICA
inTERnET AVAilAblE AT iT lAb
Sim / yes 7 26 24 13 30
Não / No 7 18 22 13 40
1 Base: 1.535 professores. Respostas estimuladas e rodiziadas.1 base: 1,535 teachers. stimulated, alternated answers.
E10 ATIvIDADES GERAIS DO PROFESSOR – USO DA INTERNET – ContinuaçãoteaCherS’ geNeral aCtIvItIeS – uSe of the INterNet – ContinuationPercentual sobre o total de professores 1Percentage of the total number of teachers 1

Survey on ICT Education 2010TABLES OF RESuLTS – TEACHERS
PO
RTu
Gu
ÊS
En
gli
sh
354
Percentual (%)Percentage (%)
Pesquisar ou fazer download de conteúdos audiovisuais (som, imagens, fotos, filmes, músicas) voltados para a prática pedagógica
Researching or downloading pedagogical audiovisual content (sound, images, photos, films, music)
Todos os dias ou quase Everyday or nearly everyday
Pelo menos uma vez
por semanaAt least
once a week
Pelo menos uma vez por mêsAt least
once a month
Menos de uma vez por mês
less than once a month
Não costuma realizar esta
atividadeDoes not
usually do this activity
TOTAL 6 18 24 15 37
SEXOgEnDER
Feminino / female 6 18 25 14 38
masculino / male 8 20 22 16 35
FAIXA ETÁRIAAgE gROUP
≤ 30 11 24 24 16 25
31-45 6 18 28 15 34
46+ 4 16 18 13 49
RENDA FAMILIARFAMilY inCOME
Até 3 Sm up to 3 mw 6 15 15 12 53
mais de 3 até 5 Sm more than 3 up to 5 mw 7 17 27 15 35
mais de 5 Sm more than 5 mw 6 21 25 15 33
RENDA PESSOALinDiViDUAl inCOME
Até 3 Sm up to 3 mw 6 14 20 15 45
mais de 3 até 5 Sm more than 3 up to 5 mw 6 20 27 15 32
mais de 5 Sm more than 5 mw 7 23 27 13 31
REGIÃOREgiOn
Norte / Centro-oeste / North / Center-west 4 20 22 18 37
Nordeste / Northeast 5 12 22 13 48
Sudeste / Southeast 7 21 28 16 28
Sul / South 8 22 23 12 35
DEPENDêNCIA ADMINISTRATIvAADMinisTRATiVE
JURisDiCTiOn
municipal / municipal 5 16 24 13 41
Estadual / State 7 20 25 16 32
SÉRIEgRADE
4a série / 5o ano do Ensino Fundamental4th grade / 5th year elementary education 6 16 26 13 40
8a série / 9o ano do Ensino Fundamental8th grade / 9th year elementary education 5 16 23 14 41
2o ano do Ensino médio2nd year of Secondary education 8 21 24 18 30
COMPUTADOR INSTALADO
NO LABORATóRIO DE INFORMÁTICA
COMPUTER insTAllED AT iT lAb
Sim / yes 6 19 25 15 35
Não / No 8 12 22 12 46
INTERNET INSTALADA NO LABORATóRIO DE INFORMÁTICA
inTERnET AVAilAblE AT iT lAb
Sim / yes 6 20 24 16 34
Não / No 7 13 25 11 44
1 Base: 1.535 professores. Respostas estimuladas e rodiziadas.1 base: 1,535 teachers. stimulated, alternated answers.
E10 ATIvIDADES GERAIS DO PROFESSOR – USO DA INTERNET – ContinuaçãoteaCherS’ geNeral aCtIvItIeS – uSe of the INterNet – ContinuationPercentual sobre o total de professores 1Percentage of the total number of teachers 1

2010 Pesquisa TIC EducaçãoTABELAS DE RESuLTADOS – PROFESSORES
PO
RTu
Gu
ÊS
En
gli
sh
355
Percentual (%)Percentage (%)
Fazer download de programas educativos da Tv para mostrar em sala de aula
Downloading educational TV programs for classroom viewing
Todos os dias ou quase Everyday or nearly everyday
Pelo menos uma vez
por semanaAt least
once a week
Pelo menos uma vez por mêsAt least
once a month
Menos de uma vez por mês
less than once a month
Não costuma realizar esta
atividadeDoes not
usually do this activity
TOTAL 3 10 18 14 55
SEXOgEnDER
Feminino / female 3 10 18 13 56
masculino / male 4 13 15 17 51
FAIXA ETÁRIAAgE gROUP
≤ 30 3 18 20 15 44
31-45 4 9 19 16 53
46+ 3 9 14 11 64
RENDA FAMILIARFAMilY inCOME
Até 3 Sm up to 3 mw 1 9 15 8 67
mais de 3 até 5 Sm more than 3 up to 5 mw 3 10 18 15 54
mais de 5 Sm more than 5 mw 4 11 18 15 51
RENDA PESSOALinDiViDUAl inCOME
Até 3 Sm up to 3 mw 2 9 17 10 61
mais de 3 até 5 Sm more than 3 up to 5 mw 4 11 17 16 52
mais de 5 Sm more than 5 mw 5 11 19 20 45
REGIÃOREgiOn
Norte / Centro-oeste / North / Center-west 3 12 18 20 47
Nordeste / Northeast 3 8 17 11 61
Sudeste / Southeast 4 9 17 16 54
Sul / South 4 16 20 9 51
DEPENDêNCIA ADMINISTRATIvAADMinisTRATiVE
JURisDiCTiOn
municipal / municipal 3 9 16 12 59
Estadual / State 4 12 19 16 50
SÉRIEgRADE
4a série / 5o ano do Ensino Fundamental4th grade / 5th year elementary education 3 10 17 13 56
8a série / 9o ano do Ensino Fundamental8th grade / 9th year elementary education 3 11 17 13 56
2o ano do Ensino médio2nd year of Secondary education 4 11 17 17 51
COMPUTADOR INSTALADO
NO LABORATóRIO DE INFORMÁTICA
COMPUTER insTAllED AT iT lAb
Sim / yes 4 11 18 15 53
Não / No 2 8 16 11 63
INTERNET INSTALADA NO LABORATóRIO DE INFORMÁTICA
inTERnET AVAilAblE AT iT lAb
Sim / yes 4 11 18 16 52
Não / No 3 9 17 11 61
1 Base: 1.535 professores. Respostas estimuladas e rodiziadas.1 base: 1,535 teachers. stimulated, alternated answers.
E10 ATIvIDADES GERAIS DO PROFESSOR – USO DA INTERNET – ContinuaçãoteaCherS’ geNeral aCtIvItIeS – uSe of the INterNet – ContinuationPercentual sobre o total de professores 1Percentage of the total number of teachers 1

Survey on ICT Education 2010TABLES OF RESuLTS – TEACHERS
PO
RTu
Gu
ÊS
En
gli
sh
356
Percentual (%)Percentage (%)
Comunicar-se com os professores da escolaCommunicating with teachers of the school
Todos os dias ou quase Everyday or nearly everyday
Pelo menos uma vez
por semanaAt least
once a week
Pelo menos uma vez por mêsAt least
once a month
Menos de uma vez por mês
less than once a month
Não costuma realizar esta
atividadeDoes not
usually do this activity
TOTAL 16 22 11 9 42
SEXOgEnDER
Feminino / female 16 22 11 8 42
masculino / male 16 21 12 10 41
FAIXA ETÁRIAAgE gROUP
≤ 30 19 25 13 10 33
31-45 18 21 12 9 41
46+ 11 22 10 8 49
RENDA FAMILIARFAMilY inCOME
Até 3 Sm up to 3 mw 12 18 8 8 53
mais de 3 até 5 Sm more than 3 up to 5 mw 18 19 12 9 43
mais de 5 Sm more than 5 mw 17 25 13 9 38
RENDA PESSOALinDiViDUAl inCOME
Até 3 Sm up to 3 mw 15 21 9 7 48
mais de 3 até 5 Sm more than 3 up to 5 mw 18 21 13 9 39
mais de 5 Sm more than 5 mw 17 23 13 12 34
REGIÃOREgiOn
Norte / Centro-oeste / North / Center-west 13 16 13 10 48
Nordeste / Northeast 13 17 10 8 51
Sudeste / Southeast 21 27 12 8 33
Sul / South 15 27 12 9 37
DEPENDêNCIA ADMINISTRATIvAADMinisTRATiVE
JURisDiCTiOn
municipal / municipal 14 20 11 9 45
Estadual / State 18 24 11 8 38
SÉRIEgRADE
4a série / 5o ano do Ensino Fundamental4th grade / 5th year elementary education 15 20 11 8 46
8a série / 9o ano do Ensino Fundamental8th grade / 9th year elementary education 12 21 12 9 45
2o ano do Ensino médio2nd year of Secondary education 21 23 11 10 35
COMPUTADOR INSTALADO
NO LABORATóRIO DE INFORMÁTICA
COMPUTER insTAllED AT iT lAb
Sim / yes 17 23 13 9 39
Não / No 13 18 7 7 56
INTERNET INSTALADA NO LABORATóRIO DE INFORMÁTICA
inTERnET AVAilAblE AT iT lAb
Sim / yes 16 24 13 10 37
Não / No 16 17 9 6 52
1 Base: 1.535 professores. Respostas estimuladas e rodiziadas.1 base: 1,535 teachers. stimulated, alternated answers.
E10 ATIvIDADES GERAIS DO PROFESSOR – USO DA INTERNET – ContinuaçãoteaCherS’ geNeral aCtIvItIeS – uSe of the INterNet – ContinuationPercentual sobre o total de professores 1Percentage of the total number of teachers 1

2010 Pesquisa TIC EducaçãoTABELAS DE RESuLTADOS – PROFESSORES
PO
RTu
Gu
ÊS
En
gli
sh
357
Percentual (%)Percentage (%)
Comunicar-se com outros membros da comunidadeCommunicating with other members of the community
Todos os dias ou quase Everyday or nearly everyday
Pelo menos uma vez
por semanaAt least
once a week
Pelo menos uma vez por mêsAt least
once a month
Menos de uma vez por mês
less than once a month
Não costuma realizar esta
atividadeDoes not
usually do this activity
TOTAL 10 16 11 9 54
SEXOgEnDER
Feminino / female 10 15 12 9 55
masculino / male 11 16 11 11 51
FAIXA ETÁRIAAgE gROUP
≤ 30 17 17 9 12 45
31-45 10 16 13 9 52
46+ 5 13 10 9 63
RENDA FAMILIARFAMilY inCOME
Até 3 Sm up to 3 mw 7 12 10 6 64
mais de 3 até 5 Sm more than 3 up to 5 mw 12 14 12 10 53
mais de 5 Sm more than 5 mw 10 18 12 10 51
RENDA PESSOALinDiViDUAl inCOME
Até 3 Sm up to 3 mw 9 13 11 7 60
mais de 3 até 5 Sm more than 3 up to 5 mw 11 15 12 10 52
mais de 5 Sm more than 5 mw 9 21 12 13 45
REGIÃOREgiOn
Norte / Centro-oeste / North / Center-west 10 13 11 11 54
Nordeste / Northeast 9 14 11 8 58
Sudeste / Southeast 12 18 12 10 49
Sul / South 7 15 10 11 58
DEPENDêNCIA ADMINISTRATIvAADMinisTRATiVE
JURisDiCTiOn
municipal / municipal 8 14 10 9 58
Estadual / State 12 17 12 10 49
SÉRIEgRADE
4a série / 5o ano do Ensino Fundamental4th grade / 5th year elementary education 9 14 12 8 58
8a série / 9o ano do Ensino Fundamental8th grade / 9th year elementary education 9 17 12 8 55
2o ano do Ensino médio2nd year of Secondary education 12 17 12 12 47
COMPUTADOR INSTALADO
NO LABORATóRIO DE INFORMÁTICA
COMPUTER insTAllED AT iT lAb
Sim / yes 10 16 12 10 52
Não / No 9 16 7 6 62
INTERNET INSTALADA NO LABORATóRIO DE INFORMÁTICA
inTERnET AVAilAblE AT iT lAb
Sim / yes 10 16 12 10 51
Não / No 10 14 9 7 60
1 Base: 1.535 professores. Respostas estimuladas e rodiziadas.1 base: 1,535 teachers. stimulated, alternated answers.
E10 ATIvIDADES GERAIS DO PROFESSOR – USO DA INTERNET – ContinuaçãoteaCherS’ geNeral aCtIvItIeS – uSe of the INterNet – ContinuationPercentual sobre o total de professores 1Percentage of the total number of teachers 1

Survey on ICT Education 2010TABLES OF RESuLTS – TEACHERS
PO
RTu
Gu
ÊS
En
gli
sh
358
Percentual (%)Percentage (%)
Enviar vídeos educativos pela Internetsending educational videos through the internet
Todos os dias ou quase Everyday or nearly everyday
Pelo menos uma vez
por semanaAt least
once a week
Pelo menos uma vez por mêsAt least
once a month
Menos de uma vez por mês
less than once a month
Não costuma realizar esta
atividadeDoes not
usually do this activity
TOTAL 4 8 11 11 66
SEXOgEnDER
Feminino / female 4 8 12 10 66
masculino / male 5 8 9 13 65
FAIXA ETÁRIAAgE gROUP
≤ 30 5 9 15 16 56
31-45 4 8 12 11 65
46+ 3 7 8 9 73
RENDA FAMILIARFAMilY inCOME
Até 3 Sm up to 3 mw 3 5 9 8 76
mais de 3 até 5 Sm more than 3 up to 5 mw 4 9 11 10 65
mais de 5 Sm more than 5 mw 4 9 12 12 63
RENDA PESSOALinDiViDUAl inCOME
Até 3 Sm up to 3 mw 3 7 10 9 71
mais de 3 até 5 Sm more than 3 up to 5 mw 5 8 12 11 63
mais de 5 Sm more than 5 mw 3 9 13 15 59
REGIÃOREgiOn
Norte / Centro-oeste / North / Center-west 4 8 12 13 63
Nordeste / Northeast 3 7 9 8 73
Sudeste / Southeast 6 9 12 13 61
Sul / South 2 8 13 9 67
DEPENDêNCIA ADMINISTRATIvAADMinisTRATiVE
JURisDiCTiOn
municipal / municipal 4 7 10 10 69
Estadual / State 4 9 13 11 62
SÉRIEgRADE
4a série / 5o ano do Ensino Fundamental4th grade / 5th year elementary education 4 7 11 9 69
8a série / 9o ano do Ensino Fundamental8th grade / 9th year elementary education 3 8 11 11 67
2o ano do Ensino médio2nd year of Secondary education 4 9 13 13 61
COMPUTADOR INSTALADO
NO LABORATóRIO DE INFORMÁTICA
COMPUTER insTAllED AT iT lAb
Sim / yes 4 8 12 12 64
Não / No 5 6 8 6 74
INTERNET INSTALADA NO LABORATóRIO DE INFORMÁTICA
inTERnET AVAilAblE AT iT lAb
Sim / yes 4 9 12 12 63
Não / No 5 6 9 9 71
1 Base: 1.535 professores. Respostas estimuladas e rodiziadas.1 base: 1,535 teachers. stimulated, alternated answers.
E10 ATIvIDADES GERAIS DO PROFESSOR – USO DA INTERNET – ContinuaçãoteaCherS’ geNeral aCtIvItIeS – uSe of the INterNet – ContinuationPercentual sobre o total de professores 1Percentage of the total number of teachers 1

2010 Pesquisa TIC EducaçãoTABELAS DE RESuLTADOS – PROFESSORES
PO
RTu
Gu
ÊS
En
gli
sh
359
Percentual (%)Percentage (%)
Participar de curso a distância (e-learning)Attending long distance courses (e-learning)
Todos os dias ou quase Everyday or nearly everyday
Pelo menos uma vez
por semanaAt least
once a week
Pelo menos uma vez por mêsAt least
once a month
Menos de uma vez por mês
less than once a month
Não costuma realizar esta
atividadeDoes not
usually do this activity
TOTAL 6 7 8 15 63
SEXOgEnDER
Feminino / female 6 7 8 15 65
masculino / male 7 8 10 18 56
FAIXA ETÁRIAAgE gROUP
≤ 30 9 10 9 17 56
31-45 7 7 9 17 61
46+ 4 7 7 13 70
RENDA FAMILIARFAMilY inCOME
Até 3 Sm up to 3 mw 2 4 7 12 75
mais de 3 até 5 Sm more than 3 up to 5 mw 7 8 9 15 61
mais de 5 Sm more than 5 mw 7 8 8 17 60
RENDA PESSOALinDiViDUAl inCOME
Até 3 Sm up to 3 mw 5 6 7 13 69
mais de 3 até 5 Sm more than 3 up to 5 mw 5 8 10 16 61
mais de 5 Sm more than 5 mw 11 9 8 19 54
REGIÃOREgiOn
Norte / Centro-oeste / North / Center-west 4 7 11 16 62
Nordeste / Northeast 5 4 7 14 71
Sudeste / Southeast 10 9 8 16 58
Sul / South 3 10 9 18 60
DEPENDêNCIA ADMINISTRATIvAADMinisTRATiVE
JURisDiCTiOn
municipal / municipal 6 7 7 13 68
Estadual / State 7 8 10 18 58
SÉRIEgRADE
4a série / 5o ano do Ensino Fundamental4th grade / 5th year elementary education 5 7 7 12 69
8a série / 9o ano do Ensino Fundamental8th grade / 9th year elementary education 5 7 8 14 66
2o ano do Ensino médio2nd year of Secondary education 8 7 10 22 53
COMPUTADOR INSTALADO
NO LABORATóRIO DE INFORMÁTICA
COMPUTER insTAllED AT iT lAb
Sim / yes 6 8 9 16 60
Não / No 6 4 4 11 74
INTERNET INSTALADA NO LABORATóRIO DE INFORMÁTICA
inTERnET AVAilAblE AT iT lAb
Sim / yes 6 8 9 17 60
Não / No 6 5 7 12 69
1 Base: 1.535 professores. Respostas estimuladas e rodiziadas.1 base: 1,535 teachers. stimulated, alternated answers.
E10 ATIvIDADES GERAIS DO PROFESSOR – USO DA INTERNET – ContinuaçãoteaCherS’ geNeral aCtIvItIeS – uSe of the INterNet – ContinuationPercentual sobre o total de professores 1Percentage of the total number of teachers 1

Survey on ICT Education 2010TABLES OF RESuLTS – TEACHERS
PO
RTu
Gu
ÊS
En
gli
sh
360
Percentual (%)Percentage (%)
Participar de grupos de discussão de professoresTaking part in teachers’ discussion groups
Todos os dias ou quase Everyday or nearly everyday
Pelo menos uma vez
por semanaAt least
once a week
Pelo menos uma vez por mêsAt least
once a month
Menos de uma vez por mês
less than once a month
Não costuma realizar esta
atividadeDoes not
usually do this activity
TOTAL 4 10 12 12 62
SEXOgEnDER
Feminino / female 3 10 11 12 63
masculino / male 5 10 13 14 57
FAIXA ETÁRIAAgE gROUP
≤ 30 5 13 16 15 51
31-45 4 10 12 12 61
46+ 2 8 9 10 70
RENDA FAMILIARFAMilY inCOME
Até 3 Sm up to 3 mw 0 9 9 9 73
mais de 3 até 5 Sm more than 3 up to 5 mw 4 11 13 13 59
mais de 5 Sm more than 5 mw 4 10 12 13 60
RENDA PESSOALinDiViDUAl inCOME
Até 3 Sm up to 3 mw 2 10 10 11 67
mais de 3 até 5 Sm more than 3 up to 5 mw 4 9 14 12 61
mais de 5 Sm more than 5 mw 5 13 12 16 55
REGIÃOREgiOn
Norte / Centro-oeste / North / Center-west 3 9 14 11 62
Nordeste / Northeast 3 8 10 12 67
Sudeste / Southeast 5 12 13 12 58
Sul / South 2 10 11 15 62
DEPENDêNCIA ADMINISTRATIvAADMinisTRATiVE
JURisDiCTiOn
municipal / municipal 3 10 11 10 66
Estadual / State 4 10 13 15 57
SÉRIEgRADE
4a série / 5o ano do Ensino Fundamental4th grade / 5th year elementary education 3 10 11 10 66
8a série / 9o ano do Ensino Fundamental8th grade / 9th year elementary education 3 9 12 12 64
2o ano do Ensino médio2nd year of Secondary education 5 11 13 17 54
COMPUTADOR INSTALADO
NO LABORATóRIO DE INFORMÁTICA
COMPUTER insTAllED AT iT lAb
Sim / yes 4 11 12 13 60
Não / No 2 5 11 9 73
INTERNET INSTALADA NO LABORATóRIO DE INFORMÁTICA
inTERnET AVAilAblE AT iT lAb
Sim / yes 4 12 12 14 59
Não / No 3 7 11 10 69
1 Base: 1.535 professores. Respostas estimuladas e rodiziadas.1 base: 1,535 teachers. stimulated, alternated answers.
E10 ATIvIDADES GERAIS DO PROFESSOR – USO DA INTERNET – ContinuaçãoteaCherS’ geNeral aCtIvItIeS – uSe of the INterNet – ContinuationPercentual sobre o total de professores 1Percentage of the total number of teachers 1

2010 Pesquisa TIC EducaçãoTABELAS DE RESuLTADOS – PROFESSORES
PO
RTu
Gu
ÊS
En
gli
sh
361
Percentual (%)Percentage (%)
Criar projetos de colaboração e comunicar-se com alunos de outros países
Creating collaborative projects and communicating with students from other countries
Todos os dias ou quase Everyday or nearly everyday
Pelo menos uma vez
por semanaAt least
once a week
Pelo menos uma vez por mêsAt least
once a month
Menos de uma vez por mês
less than once a month
Não costuma realizar esta
atividadeDoes not
usually do this activity
TOTAL 1 2 3 7 87
SEXOgEnDER
Feminino / female 1 3 4 6 87
masculino / male 1 2 3 8 86
FAIXA ETÁRIAAgE gROUP
≤ 30 1 3 5 6 85
31-45 1 3 4 8 85
46+ - 2 2 5 91
RENDA FAMILIARFAMilY inCOME
Até 3 Sm up to 3 mw - 2 3 5 90
mais de 3 até 5 Sm more than 3 up to 5 mw 1 3 3 5 88
mais de 5 Sm more than 5 mw 1 2 4 8 85
RENDA PESSOALinDiViDUAl inCOME
Até 3 Sm up to 3 mw 1 2 3 5 89
mais de 3 até 5 Sm more than 3 up to 5 mw 1 3 4 6 86
mais de 5 Sm more than 5 mw 1 1 4 11 83
REGIÃOREgiOn
Norte / Centro-oeste / North / Center-west - 4 5 8 83
Nordeste / Northeast 1 2 5 6 87
Sudeste / Southeast - 3 2 7 89
Sul / South 1 3 3 7 87
DEPENDêNCIA ADMINISTRATIvAADMinisTRATiVE
JURisDiCTiOn
municipal / municipal - 2 3 6 88
Estadual / State 1 3 4 7 86
SÉRIEgRADE
4a série / 5o ano do Ensino Fundamental4th grade / 5th year elementary education - 3 3 6 88
8a série / 9o ano do Ensino Fundamental8th grade / 9th year elementary education 1 2 5 6 86
2o ano do Ensino médio2nd year of Secondary education 1 2 3 8 85
COMPUTADOR INSTALADO
NO LABORATóRIO DE INFORMÁTICA
COMPUTER insTAllED AT iT lAb
Sim / yes 1 3 4 7 86
Não / No - 2 2 6 90
INTERNET INSTALADA NO LABORATóRIO DE INFORMÁTICA
inTERnET AVAilAblE AT iT lAb
Sim / yes 1 3 4 6 87
Não / No - 2 3 7 87
1 Base: 1.535 professores. Respostas estimuladas e rodiziadas.1 base: 1,535 teachers. stimulated, alternated answers.
E10 ATIvIDADES GERAIS DO PROFESSOR – USO DA INTERNET – ContinuaçãoteaCherS’ geNeral aCtIvItIeS – uSe of the INterNet – ContinuationPercentual sobre o total de professores 1Percentage of the total number of teachers 1

Survey on ICT Education 2010TABLES OF RESuLTS – TEACHERS
PO
RTu
Gu
ÊS
En
gli
sh
362
Percentual (%)Percentage (%)
Integração do uso da Internet
em suas práticasintegrate the use of the internet in their teaching activities
Adoção de novas
formas de avaliaçãoUse new
assessment methods
Utilização dos computadores para monitorar o desempenho
dos alunos Use computers
to monitor students’ performance
Estimula / Requer
Encourages / Requires
Não requer nem
estimulaneither requires
nor encourages
Estimula / Requer
Encourages / Requires
Não requer nem
estimulaneither requires
nor encourages
Estimula / Requer
Encourages / Requires
Não requer nem
estimulaneither requires
nor encourages
TOTAL 82 18 91 9 67 33
SEXOgEnDER
Feminino / female 83 17 91 9 68 32
masculino / male 79 21 90 10 65 35
FAIXA ETÁRIAAgE gROUP
≤ 30 82 18 90 10 70 30
31-45 81 19 91 9 66 34
46+ 83 17 90 10 69 31
RENDA FAMILIARFAMilY inCOME
Até 3 Sm up to 3 mw 78 22 86 14 65 35
mais de 3 até 5 Sm more than 3 up to 5 mw 79 21 91 9 68 32
mais de 5 Sm more than 5 mw 85 15 92 8 68 32
RENDA PESSOALinDiViDUAl inCOME
Até 3 Sm up to 3 mw 80 20 90 10 68 32
mais de 3 até 5 Sm more than 3 up to 5 mw 84 16 93 7 68 32
mais de 5 Sm more than 5 mw 82 18 90 10 66 34
REGIÃOREgiOn
Norte / Centro-oeste / North / Center-west 85 15 92 8 72 28
Nordeste / Northeast 77 23 87 13 67 33
Sudeste / Southeast 82 18 92 8 65 35
Sul / South 88 12 94 6 69 31
DEPENDêNCIA ADMINISTRATIvAADMinisTRATiVE
JURisDiCTiOn
municipal / municipal 80 20 89 11 64 36
Estadual / State 84 16 93 7 71 29
SÉRIEgRADE
4a série / 5o ano do Ensino Fundamental4th grade / 5th year elementary education 82 18 90 10 66 34
8a série / 9o ano do Ensino Fundamental8th grade / 9th year elementary education 80 20 90 10 68 32
2o ano do Ensino médio2nd year of Secondary education 84 16 92 8 70 30
COMPUTADOR INSTALADO
NO LABORATóRIO DE INFORMÁTICA
COMPUTER insTAllED AT iT lAb
Sim / yes 84 16 92 8 72 28
Não / No 72 28 86 14 47 53
INTERNET INSTALADA NO LABORATóRIO DE INFORMÁTICA
inTERnET AVAilAblE AT iT lAb
Sim / yes 86 14 93 7 74 26
Não / No 73 27 85 15 54 46
1 Base: 1.535 professores. Respostas estimuladas.1 base: 1,535 teachers. stimulated answers.
E11 PERCEPÇÃO DO PROFESSOR SOBRE O PROJETO PEDAGóGICO DA ESCOLAteaCher’S PerCePtIoN oN the SChool’S PedagogIC PlaNPercentual sobre o total de professores 1Percentage of the total number of teachers 1
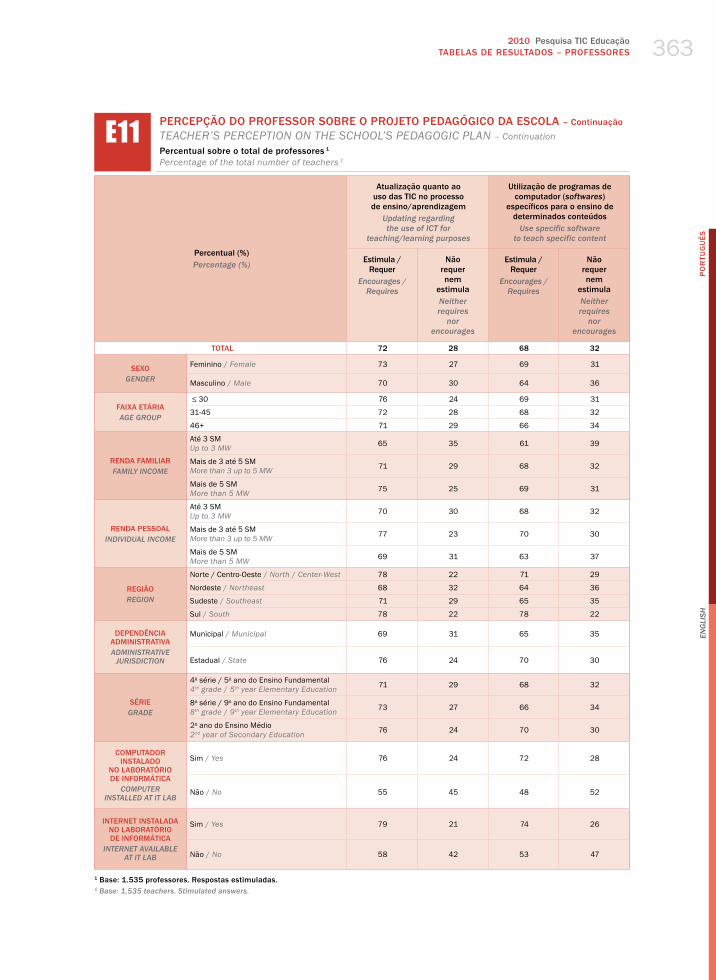
2010 Pesquisa TIC EducaçãoTABELAS DE RESuLTADOS – PROFESSORES
PO
RTu
Gu
ÊS
En
gli
sh
363
Percentual (%)Percentage (%)
Atualização quanto ao uso das TIC no processo de ensino/aprendizagem
Updating regarding the use of iCT for
teaching/learning purposes
Utilização de programas de computador (softwares)
específicos para o ensino de determinados conteúdos
Use specific software to teach specific content
Estimula / Requer
Encourages / Requires
Não requer nem
estimulaneither requires
nor encourages
Estimula / Requer
Encourages / Requires
Não requer nem
estimulaneither requires
nor encourages
TOTAL 72 28 68 32
SEXOgEnDER
Feminino / female 73 27 69 31
masculino / male 70 30 64 36
FAIXA ETÁRIAAgE gROUP
≤ 30 76 24 69 31
31-45 72 28 68 32
46+ 71 29 66 34
RENDA FAMILIARFAMilY inCOME
Até 3 Sm up to 3 mw 65 35 61 39
mais de 3 até 5 Sm more than 3 up to 5 mw 71 29 68 32
mais de 5 Sm more than 5 mw 75 25 69 31
RENDA PESSOALinDiViDUAl inCOME
Até 3 Sm up to 3 mw 70 30 68 32
mais de 3 até 5 Sm more than 3 up to 5 mw 77 23 70 30
mais de 5 Sm more than 5 mw 69 31 63 37
REGIÃOREgiOn
Norte / Centro-oeste / North / Center-west 78 22 71 29
Nordeste / Northeast 68 32 64 36
Sudeste / Southeast 71 29 65 35
Sul / South 78 22 78 22
DEPENDêNCIA ADMINISTRATIvAADMinisTRATiVE
JURisDiCTiOn
municipal / municipal 69 31 65 35
Estadual / State 76 24 70 30
SÉRIEgRADE
4a série / 5o ano do Ensino Fundamental4th grade / 5th year elementary education 71 29 68 32
8a série / 9o ano do Ensino Fundamental8th grade / 9th year elementary education 73 27 66 34
2o ano do Ensino médio2nd year of Secondary education 76 24 70 30
COMPUTADOR INSTALADO
NO LABORATóRIO DE INFORMÁTICA
COMPUTER insTAllED AT iT lAb
Sim / yes 76 24 72 28
Não / No 55 45 48 52
INTERNET INSTALADA NO LABORATóRIO DE INFORMÁTICA
inTERnET AVAilAblE AT iT lAb
Sim / yes 79 21 74 26
Não / No 58 42 53 47
1 Base: 1.535 professores. Respostas estimuladas.1 base: 1,535 teachers. stimulated answers.
E11 PERCEPÇÃO DO PROFESSOR SOBRE O PROJETO PEDAGóGICO DA ESCOLA – ContinuaçãoteaCher’S PerCePtIoN oN the SChool’S PedagogIC PlaN – ContinuationPercentual sobre o total de professores 1Percentage of the total number of teachers 1
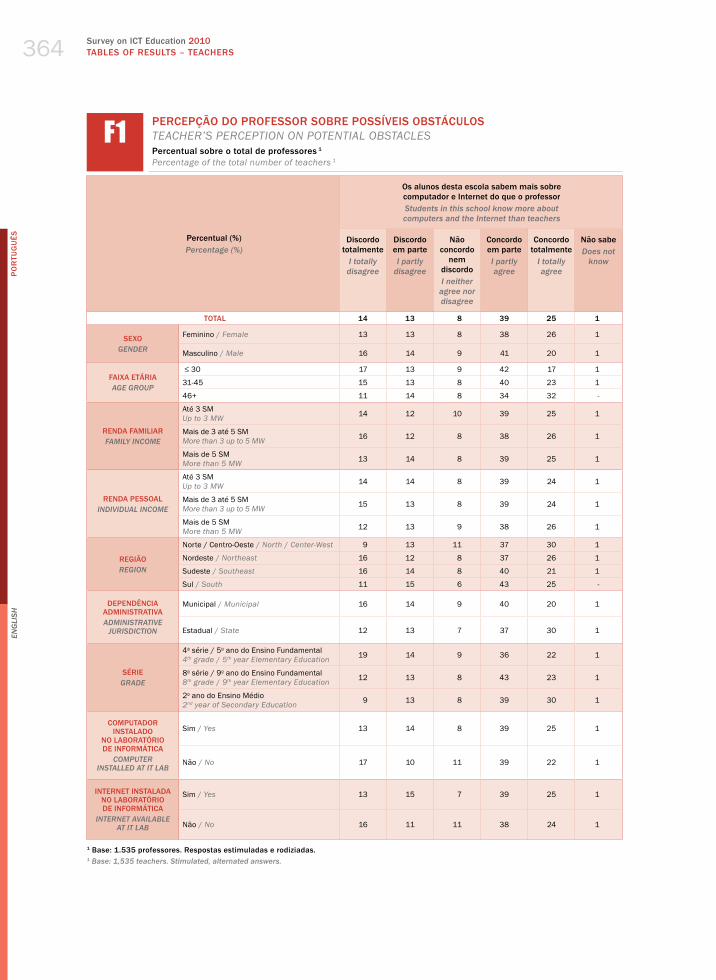
Survey on ICT Education 2010TABLES OF RESuLTS – TEACHERS
PO
RTu
Gu
ÊS
En
gli
sh
364
Percentual (%)Percentage (%)
Os alunos desta escola sabem mais sobre computador e Internet do que o professorstudents in this school know more about computers and the internet than teachers
Discordo totalmente
i totally disagree
Discordo em parte i partly
disagree
Não concordo
nem discordoi neither
agree nor disagree
Concordo em partei partly agree
Concordo totalmente
i totally agree
Não sabe Does not
know
TOTAL 14 13 8 39 25 1
SEXOgEnDER
Feminino / female 13 13 8 38 26 1
masculino / male 16 14 9 41 20 1
FAIXA ETÁRIAAgE gROUP
≤ 30 17 13 9 42 17 1
31-45 15 13 8 40 23 1
46+ 11 14 8 34 32 -
RENDA FAMILIARFAMilY inCOME
Até 3 Sm up to 3 mw 14 12 10 39 25 1
mais de 3 até 5 Sm more than 3 up to 5 mw 16 12 8 38 26 1
mais de 5 Sm more than 5 mw 13 14 8 39 25 1
RENDA PESSOALinDiViDUAl inCOME
Até 3 Sm up to 3 mw 14 14 8 39 24 1
mais de 3 até 5 Sm more than 3 up to 5 mw 15 13 8 39 24 1
mais de 5 Sm more than 5 mw 12 13 9 38 26 1
REGIÃOREgiOn
Norte / Centro-oeste / North / Center-west 9 13 11 37 30 1
Nordeste / Northeast 16 12 8 37 26 1
Sudeste / Southeast 16 14 8 40 21 1
Sul / South 11 15 6 43 25 -
DEPENDêNCIA ADMINISTRATIvAADMinisTRATiVE
JURisDiCTiOn
municipal / municipal 16 14 9 40 20 1
Estadual / State 12 13 7 37 30 1
SÉRIEgRADE
4a série / 5o ano do Ensino Fundamental4th grade / 5th year elementary education 19 14 9 36 22 1
8a série / 9o ano do Ensino Fundamental8th grade / 9th year elementary education 12 13 8 43 23 1
2o ano do Ensino médio2nd year of Secondary education 9 13 8 39 30 1
COMPUTADOR INSTALADO
NO LABORATóRIO DE INFORMÁTICA
COMPUTER insTAllED AT iT lAb
Sim / yes 13 14 8 39 25 1
Não / No 17 10 11 39 22 1
INTERNET INSTALADA NO LABORATóRIO DE INFORMÁTICA
inTERnET AVAilAblE AT iT lAb
Sim / yes 13 15 7 39 25 1
Não / No 16 11 11 38 24 1
1 Base: 1.535 professores. Respostas estimuladas e rodiziadas.1 base: 1,535 teachers. stimulated, alternated answers.
f1 PERCEPÇÃO DO PROFESSOR SOBRE POSSÍvEIS OBSTÁCULOSteaCher’S PerCePtIoN oN PoteNtIal oBStaCleSPercentual sobre o total de professores 1Percentage of the total number of teachers 1

2010 Pesquisa TIC EducaçãoTABELAS DE RESuLTADOS – PROFESSORES
PO
RTu
Gu
ÊS
En
gli
sh
365
Percentual (%)Percentage (%)
Com a Internet, os alunos acabam ficando sobrecarregados de informações
The internet overloads students with information
Discordo totalmente
i totally disagree
Discordo em parte i partly
disagree
Não concordo
nem discordoi neither
agree nor disagree
Concordo em partei partly agree
Concordo totalmente
i totally agree
Não sabe Does not
know
TOTAL 31 24 9 27 8 -
SEXOgEnDER
Feminino / female 32 23 9 28 9 1
masculino / male 30 28 11 24 8 -
FAIXA ETÁRIAAgE gROUP
≤ 30 32 28 9 24 6 -
31-45 32 23 9 27 9 -
46+ 29 25 9 27 9 1
RENDA FAMILIARFAMilY inCOME
Até 3 Sm up to 3 mw 30 27 10 27 6 -
mais de 3 até 5 Sm more than 3 up to 5 mw 28 23 8 29 10 1
mais de 5 Sm more than 5 mw 34 23 9 25 8 -
RENDA PESSOALinDiViDUAl inCOME
Até 3 Sm up to 3 mw 35 23 7 27 7 1
mais de 3 até 5 Sm more than 3 up to 5 mw 27 26 9 28 10 -
mais de 5 Sm more than 5 mw 31 25 12 24 8 1
REGIÃOREgiOn
Norte / Centro-oeste / North / Center-west 23 25 12 28 11 -
Nordeste / Northeast 37 25 7 26 4 -
Sudeste / Southeast 30 25 10 26 9 1
Sul / South 32 20 7 28 13 -
DEPENDêNCIA ADMINISTRATIvAADMinisTRATiVE
JURisDiCTiOn
municipal / municipal 32 23 8 28 8 -
Estadual / State 30 25 10 25 9 -
SÉRIEgRADE
4a série / 5o ano do Ensino Fundamental4th grade / 5th year elementary education 33 24 8 28 7 -
8a série / 9o ano do Ensino Fundamental8th grade / 9th year elementary education 29 23 9 29 10 -
2o ano do Ensino médio2nd year of Secondary education 28 26 11 26 9 1
COMPUTADOR INSTALADO
NO LABORATóRIO DE INFORMÁTICA
COMPUTER insTAllED AT iT lAb
Sim / yes 31 24 9 27 9 -
Não / No 31 25 12 27 6 1
INTERNET INSTALADA NO LABORATóRIO DE INFORMÁTICA
inTERnET AVAilAblE AT iT lAb
Sim / yes 32 23 8 27 9 -
Não / No 30 26 11 26 7 1
1 Base: 1.535 professores. Respostas estimuladas e rodiziadas.1 base: 1,535 teachers. stimulated, alternated answers.
f1 PERCEPÇÃO DO PROFESSOR SOBRE POSSÍvEIS OBSTÁCULOS – ContinuaçãoteaCher’S PerCePtIoN oN PoteNtIal oBStaCleS – ContinuationPercentual sobre o total de professores 1Percentage of the total number of teachers 1

Survey on ICT Education 2010TABLES OF RESuLTS – TEACHERS
PO
RTu
Gu
ÊS
En
gli
sh
366
Percentual (%)Percentage (%)
Com a Internet, os alunos acabam perdendo contato com a realidadeWith the internet, students end up losing touch with reality
Discordo totalmente
i totally disagree
Discordo em parte i partly
disagree
Não concordo
nem discordoi neither
agree nor disagree
Concordo em partei partly agree
Concordo totalmente
i totally agree
Não sabe Does not
know
TOTAL 35 25 9 24 7 -
SEXOgEnDER
Feminino / female 37 24 9 24 6 -
masculino / male 30 27 10 24 8 -
FAIXA ETÁRIAAgE gROUP
≤ 30 33 30 8 24 5 -
31-45 35 25 8 24 7 -
46+ 35 21 12 25 6 1
RENDA FAMILIARFAMilY inCOME
Até 3 Sm up to 3 mw 35 21 10 26 6 1
mais de 3 até 5 Sm more than 3 up to 5 mw 31 26 10 26 7 -
mais de 5 Sm more than 5 mw 37 25 8 22 7 -
RENDA PESSOALinDiViDUAl inCOME
Até 3 Sm up to 3 mw 36 25 8 24 6 1
mais de 3 até 5 Sm more than 3 up to 5 mw 33 24 11 26 6 -
mais de 5 Sm more than 5 mw 37 26 9 19 8 -
REGIÃOREgiOn
Norte / Centro-oeste / North / Center-west 28 25 13 26 8 -
Nordeste / Northeast 38 23 9 22 6 1
Sudeste / Southeast 34 25 10 25 6 -
Sul / South 40 25 5 22 7 -
DEPENDêNCIA ADMINISTRATIvAADMinisTRATiVE
JURisDiCTiOn
municipal / municipal 34 25 8 25 7 1
Estadual / State 36 24 11 23 6 -
SÉRIEgRADE
4a série / 5o ano do Ensino Fundamental4th grade / 5th year elementary education 36 25 10 23 5 1
8a série / 9o ano do Ensino Fundamental8th grade / 9th year elementary education 33 23 9 26 9 1
2o ano do Ensino médio2nd year of Secondary education 32 26 11 25 6 -
COMPUTADOR INSTALADO
NO LABORATóRIO DE INFORMÁTICA
COMPUTER insTAllED AT iT lAb
Sim / yes 36 25 9 24 6 -
Não / No 32 24 11 25 7 -
INTERNET INSTALADA NO LABORATóRIO DE INFORMÁTICA
inTERnET AVAilAblE AT iT lAb
Sim / yes 38 23 9 23 7 -
Não / No 28 28 11 26 6 1
1 Base: 1.535 professores. Respostas estimuladas e rodiziadas.1 base: 1,535 teachers. stimulated, alternated answers.
f1 PERCEPÇÃO DO PROFESSOR SOBRE POSSÍvEIS OBSTÁCULOS – ContinuaçãoteaCher’S PerCePtIoN oN PoteNtIal oBStaCleS – ContinuationPercentual sobre o total de professores 1Percentage of the total number of teachers 1

2010 Pesquisa TIC EducaçãoTABELAS DE RESuLTADOS – PROFESSORES
PO
RTu
Gu
ÊS
En
gli
sh
367
Percentual (%)Percentage (%)
Não entendo de computador e Internet o suficiente para usar na escolai don’t know enough about computers and the internet
to use these resources at school
Discordo totalmente
i totally disagree
Discordo em parte i partly
disagree
Não concordo
nem discordoi neither
agree nor disagree
Concordo em partei partly agree
Concordo totalmente
i totally agree
Não sabe Does not
know
TOTAL 53 16 7 15 9 -
SEXOgEnDER
Feminino / female 49 17 7 17 10 -
masculino / male 65 14 6 10 5 -
FAIXA ETÁRIAAgE gROUP
≤ 30 71 12 5 9 3 -
31-45 54 18 5 16 7 -
46+ 41 15 11 17 16 -
RENDA FAMILIARFAMilY inCOME
Até 3 Sm up to 3 mw 38 16 6 22 17 -
mais de 3 até 5 Sm more than 3 up to 5 mw 50 18 9 14 9 -
mais de 5 Sm more than 5 mw 58 16 6 14 6 -
RENDA PESSOALinDiViDUAl inCOME
Até 3 Sm up to 3 mw 48 16 6 17 13 -
mais de 3 até 5 Sm more than 3 up to 5 mw 55 18 8 13 7 -
mais de 5 Sm more than 5 mw 59 15 6 14 5 -
REGIÃOREgiOn
Norte / Centro-oeste / North / Center-west 43 22 11 15 8 -
Nordeste / Northeast 45 16 6 19 14 -
Sudeste / Southeast 62 14 7 13 5 -
Sul / South 61 16 3 13 7 -
DEPENDêNCIA ADMINISTRATIvAADMinisTRATiVE
JURisDiCTiOn
municipal / municipal 51 15 6 17 11 -
Estadual / State 56 18 8 13 6 -
SÉRIEgRADE
4a série / 5o ano do Ensino Fundamental4th grade / 5th year elementary education 45 17 8 18 11 -
8a série / 9o ano do Ensino Fundamental8th grade / 9th year elementary education 51 16 6 16 10 -
2o ano do Ensino médio2nd year of Secondary education 61 17 7 11 4 -
COMPUTADOR INSTALADO
NO LABORATóRIO DE INFORMÁTICA
COMPUTER insTAllED AT iT lAb
Sim / yes 55 16 6 15 8 -
Não / No 45 18 10 15 13 -
INTERNET INSTALADA NO LABORATóRIO DE INFORMÁTICA
inTERnET AVAilAblE AT iT lAb
Sim / yes 56 16 5 15 7 -
Não / No 46 17 10 15 12 -
1 Base: 1.535 professores. Respostas estimuladas e rodiziadas.1 base: 1,535 teachers. stimulated, alternated answers.
f1 PERCEPÇÃO DO PROFESSOR SOBRE POSSÍvEIS OBSTÁCULOS – ContinuaçãoteaCher’S PerCePtIoN oN PoteNtIal oBStaCleS – ContinuationPercentual sobre o total de professores 1Percentage of the total number of teachers 1
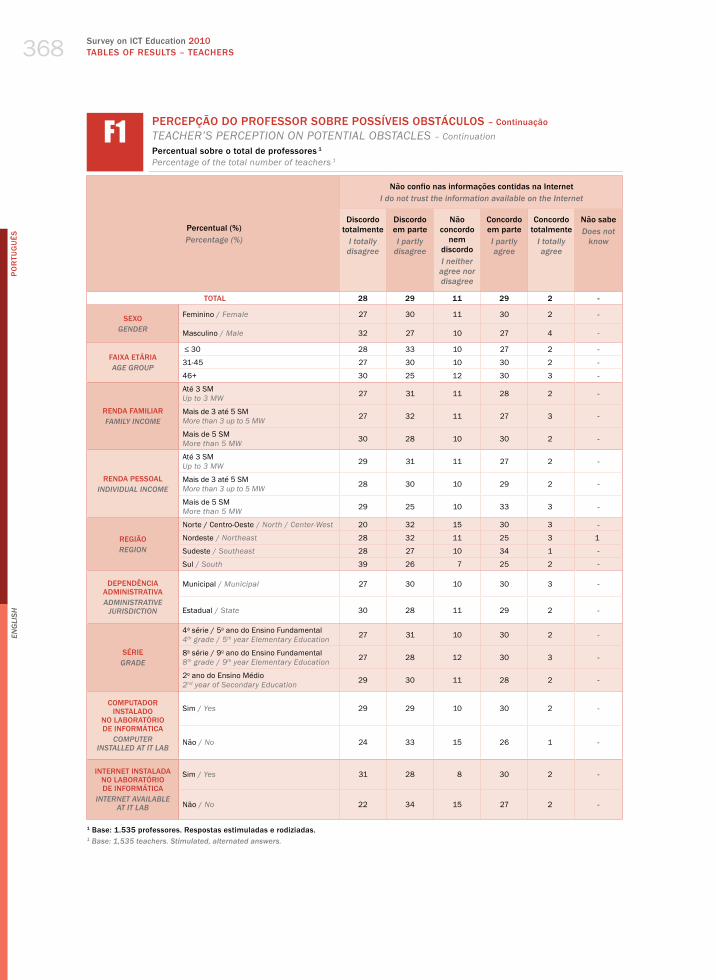
Survey on ICT Education 2010TABLES OF RESuLTS – TEACHERS
PO
RTu
Gu
ÊS
En
gli
sh
368
Percentual (%)Percentage (%)
Não confio nas informações contidas na Interneti do not trust the information available on the internet
Discordo totalmente
i totally disagree
Discordo em parte i partly
disagree
Não concordo
nem discordoi neither
agree nor disagree
Concordo em partei partly agree
Concordo totalmente
i totally agree
Não sabe Does not
know
TOTAL 28 29 11 29 2 -
SEXOgEnDER
Feminino / female 27 30 11 30 2 -
masculino / male 32 27 10 27 4 -
FAIXA ETÁRIAAgE gROUP
≤ 30 28 33 10 27 2 -
31-45 27 30 10 30 2 -
46+ 30 25 12 30 3 -
RENDA FAMILIARFAMilY inCOME
Até 3 Sm up to 3 mw 27 31 11 28 2 -
mais de 3 até 5 Sm more than 3 up to 5 mw 27 32 11 27 3 -
mais de 5 Sm more than 5 mw 30 28 10 30 2 -
RENDA PESSOALinDiViDUAl inCOME
Até 3 Sm up to 3 mw 29 31 11 27 2 -
mais de 3 até 5 Sm more than 3 up to 5 mw 28 30 10 29 2 -
mais de 5 Sm more than 5 mw 29 25 10 33 3 -
REGIÃOREgiOn
Norte / Centro-oeste / North / Center-west 20 32 15 30 3 -
Nordeste / Northeast 28 32 11 25 3 1
Sudeste / Southeast 28 27 10 34 1 -
Sul / South 39 26 7 25 2 -
DEPENDêNCIA ADMINISTRATIvAADMinisTRATiVE
JURisDiCTiOn
municipal / municipal 27 30 10 30 3 -
Estadual / State 30 28 11 29 2 -
SÉRIEgRADE
4a série / 5o ano do Ensino Fundamental4th grade / 5th year elementary education 27 31 10 30 2 -
8a série / 9o ano do Ensino Fundamental8th grade / 9th year elementary education 27 28 12 30 3 -
2o ano do Ensino médio2nd year of Secondary education 29 30 11 28 2 -
COMPUTADOR INSTALADO
NO LABORATóRIO DE INFORMÁTICA
COMPUTER insTAllED AT iT lAb
Sim / yes 29 29 10 30 2 -
Não / No 24 33 15 26 1 -
INTERNET INSTALADA NO LABORATóRIO DE INFORMÁTICA
inTERnET AVAilAblE AT iT lAb
Sim / yes 31 28 8 30 2 -
Não / No 22 34 15 27 2 -
1 Base: 1.535 professores. Respostas estimuladas e rodiziadas.1 base: 1,535 teachers. stimulated, alternated answers.
f1 PERCEPÇÃO DO PROFESSOR SOBRE POSSÍvEIS OBSTÁCULOS – ContinuaçãoteaCher’S PerCePtIoN oN PoteNtIal oBStaCleS – ContinuationPercentual sobre o total de professores 1Percentage of the total number of teachers 1

2010 Pesquisa TIC EducaçãoTABELAS DE RESuLTADOS – PROFESSORES
PO
RTu
Gu
ÊS
En
gli
sh
369
Percentual (%)Percentage (%)
Acredito mais nos métodos tradicionais de ensinoi have greater faith in traditional teaching methods
Discordo totalmente
i totally disagree
Discordo em parte i partly
disagree
Não concordo
nem discordoi neither
agree nor disagree
Concordo em partei partly agree
Concordo totalmente
i totally agree
Não sabe Does not
know
TOTAL 33 27 13 22 6 -
SEXOgEnDER
Feminino / female 33 28 13 21 5 -
masculino / male 31 24 13 23 9 -
FAIXA ETÁRIAAgE gROUP
≤ 30 35 28 14 20 3 -
31-45 34 27 12 21 5 -
46+ 30 25 13 23 8 -
RENDA FAMILIARFAMilY inCOME
Até 3 Sm up to 3 mw 26 25 16 25 7 -
mais de 3 até 5 Sm more than 3 up to 5 mw 35 26 13 19 7 -
mais de 5 Sm more than 5 mw 34 27 12 22 5 -
RENDA PESSOALinDiViDUAl inCOME
Até 3 Sm up to 3 mw 34 25 13 22 6 -
mais de 3 até 5 Sm more than 3 up to 5 mw 31 27 13 20 7 1
mais de 5 Sm more than 5 mw 34 27 12 23 4 -
REGIÃOREgiOn
Norte / Centro-oeste / North / Center-west 28 25 16 24 6 -
Nordeste / Northeast 32 24 17 21 6 -
Sudeste / Southeast 33 28 11 22 5 -
Sul / South 41 31 5 17 5 -
DEPENDêNCIA ADMINISTRATIvAADMinisTRATiVE
JURisDiCTiOn
municipal / municipal 32 28 13 21 6 -
Estadual / State 34 26 13 22 6 -
SÉRIEgRADE
4a série / 5o ano do Ensino Fundamental4th grade / 5th year elementary education 33 28 12 21 5 -
8a série / 9o ano do Ensino Fundamental8th grade / 9th year elementary education 29 25 14 24 7 -
2o ano do Ensino médio2nd year of Secondary education 34 25 13 22 5 -
COMPUTADOR INSTALADO
NO LABORATóRIO DE INFORMÁTICA
COMPUTER insTAllED AT iT lAb
Sim / yes 34 27 13 21 6 -
Não / No 30 26 13 26 6 -
INTERNET INSTALADA NO LABORATóRIO DE INFORMÁTICA
inTERnET AVAilAblE AT iT lAb
Sim / yes 34 27 12 21 6 -
Não / No 31 26 14 23 6 -
1 Base: 1.535 professores. Respostas estimuladas e rodiziadas.1 base: 1,535 teachers. stimulated, alternated answers.
f1 PERCEPÇÃO DO PROFESSOR SOBRE POSSÍvEIS OBSTÁCULOS – ContinuaçãoteaCher’S PerCePtIoN oN PoteNtIal oBStaCleS – ContinuationPercentual sobre o total de professores 1Percentage of the total number of teachers 1

Survey on ICT Education 2010TABLES OF RESuLTS – TEACHERS
PO
RTu
Gu
ÊS
En
gli
sh
370
Percentual (%)Percentage (%)
Não sei de que forma ou para que atividades posso usar computador ou Internet na escola
i don’t know how / for which activities i can use computers and the internet in the school
Discordo totalmente
i totally disagree
Discordo em parte i partly
disagree
Não concordo
nem discordoi neither
agree nor disagree
Concordo em partei partly agree
Concordo totalmente
i totally agree
Não sabe Does not
know
TOTAL 62 18 7 9 3 1
SEXOgEnDER
Feminino / female 61 18 8 9 3 1
masculino / male 66 16 5 10 3 1
FAIXA ETÁRIAAgE gROUP
≤ 30 73 13 6 6 1 1
31-45 64 18 6 9 2 1
46+ 51 20 10 12 6 1
RENDA FAMILIARFAMilY inCOME
Até 3 Sm up to 3 mw 52 19 8 13 6 1
mais de 3 até 5 Sm more than 3 up to 5 mw 63 16 8 9 3 1
mais de 5 Sm more than 5 mw 64 19 6 8 2 -
RENDA PESSOALinDiViDUAl inCOME
Até 3 Sm up to 3 mw 60 17 7 11 4 1
mais de 3 até 5 Sm more than 3 up to 5 mw 61 20 8 8 2 -
mais de 5 Sm more than 5 mw 65 17 7 7 3 1
REGIÃOREgiOn
Norte / Centro-oeste / North / Center-west 49 19 13 14 5 1
Nordeste / Northeast 59 17 8 9 5 2
Sudeste / Southeast 69 17 5 7 1 -
Sul / South 65 22 2 10 1 -
DEPENDêNCIA ADMINISTRATIvAADMinisTRATiVE
JURisDiCTiOn
municipal / municipal 60 18 6 11 4 1
Estadual / State 64 17 8 8 2 -
SÉRIEgRADE
4a série / 5o ano do Ensino Fundamental4th grade / 5th year elementary education 57 19 7 12 4 1
8a série / 9o ano do Ensino Fundamental8th grade / 9th year elementary education 59 17 8 10 4 2
2o ano do Ensino médio2nd year of Secondary education 67 18 8 5 1 -
COMPUTADOR INSTALADO
NO LABORATóRIO DE INFORMÁTICA
COMPUTER insTAllED AT iT lAb
Sim / yes 63 17 6 9 3 1
Não / No 54 21 10 9 4 1
INTERNET INSTALADA NO LABORATóRIO DE INFORMÁTICA
inTERnET AVAilAblE AT iT lAb
Sim / yes 65 17 6 9 3 1
Não / No 55 20 11 9 4 1
1 Base: 1.535 professores. Respostas estimuladas e rodiziadas.1 base: 1,535 teachers. stimulated, alternated answers.
f1 PERCEPÇÃO DO PROFESSOR SOBRE POSSÍvEIS OBSTÁCULOS – ContinuaçãoteaCher’S PerCePtIoN oN PoteNtIal oBStaCleS – ContinuationPercentual sobre o total de professores 1Percentage of the total number of teachers 1

2010 Pesquisa TIC EducaçãoTABELAS DE RESuLTADOS – PROFESSORES
PO
RTu
Gu
ÊS
En
gli
sh
371
Percentual (%)Percentage (%)
Tenho receio de usar a Internet de modo gerali am generally afraid of using the internet
Discordo totalmente
i totally disagree
Discordo em parte i partly
disagree
Não concordo
nem discordoi neither
agree nor disagree
Concordo em partei partly agree
Concordo totalmente
i totally agree
Não sabe Does not
know
TOTAL 62 16 7 12 3 -
SEXOgEnDER
Feminino / female 60 16 7 12 3 -
masculino / male 68 16 5 9 2 -
FAIXA ETÁRIAAgE gROUP
≤ 30 72 12 6 8 2 -
31-45 64 17 6 11 2 -
46+ 53 17 9 15 6 -
RENDA FAMILIARFAMilY inCOME
Até 3 Sm up to 3 mw 51 21 7 14 7 -
mais de 3 até 5 Sm more than 3 up to 5 mw 62 16 7 12 2 1
mais de 5 Sm more than 5 mw 66 15 6 11 2 -
RENDA PESSOALinDiViDUAl inCOME
Até 3 Sm up to 3 mw 60 18 5 12 4 1
mais de 3 até 5 Sm more than 3 up to 5 mw 64 16 7 11 2 -
mais de 5 Sm more than 5 mw 67 12 7 11 3 -
REGIÃOREgiOn
Norte / Centro-oeste / North / Center-west 52 18 15 11 4 1
Nordeste / Northeast 61 17 5 12 4 1
Sudeste / Southeast 68 13 4 13 2 -
Sul / South 64 18 4 11 3 -
DEPENDêNCIA ADMINISTRATIvAADMinisTRATiVE
JURisDiCTiOn
municipal / municipal 63 17 5 12 3 -
Estadual / State 62 15 8 12 3 -
SÉRIEgRADE
4a série / 5o ano do Ensino Fundamental4th grade / 5th year elementary education 60 17 7 13 4 -
8a série / 9o ano do Ensino Fundamental8th grade / 9th year elementary education 62 15 7 11 4 -
2o ano do Ensino médio2nd year of Secondary education 65 15 7 10 2 -
COMPUTADOR INSTALADO
NO LABORATóRIO DE INFORMÁTICA
COMPUTER insTAllED AT iT lAb
Sim / yes 65 15 6 11 3 -
Não / No 51 20 10 14 5 -
INTERNET INSTALADA NO LABORATóRIO DE INFORMÁTICA
inTERnET AVAilAblE AT iT lAb
Sim / yes 66 15 5 11 2 -
Não / No 54 19 10 13 4 -
1 Base: 1.535 professores. Respostas estimuladas e rodiziadas.1 base: 1,535 teachers. stimulated, alternated answers.
f1 PERCEPÇÃO DO PROFESSOR SOBRE POSSÍvEIS OBSTÁCULOS – ContinuaçãoteaCher’S PerCePtIoN oN PoteNtIal oBStaCleS – ContinuationPercentual sobre o total de professores 1Percentage of the total number of teachers 1

Survey on ICT Education 2010TABLES OF RESuLTS – TEACHERS
PO
RTu
Gu
ÊS
En
gli
sh
372
Percentual (%)Percentage (%)
Ausência de suporte técnicoAbsence of technical support
Atrapalha muito
strongly hinders
Atrapalhahinders
Atrapalha um poucohinders
to a certain extent
Não atrapalha Does not
hinder at all
Não se aplicaDoes not
apply
TOTAL 41 22 20 11 6
SEXOgEnDER
Feminino / female 41 22 21 11 6
masculino / male 42 21 19 12 6
FAIXA ETÁRIAAgE gROUP
≤ 30 39 20 22 16 4
31-45 41 22 20 11 5
46+ 42 22 20 8 8
RENDA FAMILIARFAMilY inCOME
Até 3 Sm up to 3 mw 40 21 20 13 7
mais de 3 até 5 Sm more than 3 up to 5 mw 37 25 22 11 6
mais de 5 Sm more than 5 mw 43 21 20 11 5
RENDA PESSOALinDiViDUAl inCOME
Até 3 Sm up to 3 mw 40 23 19 12 6
mais de 3 até 5 Sm more than 3 up to 5 mw 40 22 21 12 5
mais de 5 Sm more than 5 mw 43 21 21 9 6
REGIÃOREgiOn
Norte / Centro-oeste / North / Center-west 35 27 24 9 5
Nordeste / Northeast 41 24 16 11 9
Sudeste / Southeast 43 19 22 11 6
Sul / South 45 19 22 13 1
DEPENDêNCIA ADMINISTRATIvAADMinisTRATiVE
JURisDiCTiOn
municipal / municipal 41 21 20 12 6
Estadual / State 41 23 21 10 5
SÉRIEgRADE
4a série / 5o ano do Ensino Fundamental4th grade / 5th year elementary education 38 22 22 11 7
8a série / 9o ano do Ensino Fundamental8th grade / 9th year elementary education 41 24 18 11 6
2o ano do Ensino médio2nd year of Secondary education 40 22 22 11 5
COMPUTADOR INSTALADO
NO LABORATóRIO DE INFORMÁTICA
COMPUTER insTAllED AT iT lAb
Sim / yes 39 23 22 13 4
Não / No 52 17 13 4 14
INTERNET INSTALADA NO LABORATóRIO DE INFORMÁTICA
inTERnET AVAilAblE AT iT lAb
Sim / yes 38 22 22 13 4
Não / No 47 20 17 6 10
1 Base: 1.535 professores. Respostas estimuladas.1 base: 1,535 teachers. stimulated answers.
f2 PERCEPÇÃO DO PROFESSOR SOBRE O NÍvEL DE OBSTÁCULO NO USO DE COMPUTADOR E INTERNETteaCher’S PerCePtIoN oN oBStaCleS to the uSe of ComPuterS aNd the INterNetPercentual sobre o total de professores 1Percentage of the total number of teachers 1

2010 Pesquisa TIC EducaçãoTABELAS DE RESuLTADOS – PROFESSORES
PO
RTu
Gu
ÊS
En
gli
sh
373
Percentual (%)Percentage (%)
Falta de apoio pedagógico para o uso de computador e Internetlack of pedagogic support to use computers and the internet
Atrapalha muito
strongly hinders
Atrapalhahinders
Atrapalha um poucohinders
to a certain extent
Não atrapalha Does not
hinder at all
Não se aplicaDoes not
apply
TOTAL 33 25 19 16 6
SEXOgEnDER
Feminino / female 33 25 19 17 7
masculino / male 34 27 20 15 5
FAIXA ETÁRIAAgE gROUP
≤ 30 35 26 19 15 5
31-45 33 25 19 17 6
46+ 33 25 18 16 8
RENDA FAMILIARFAMilY inCOME
Até 3 Sm up to 3 mw 37 24 17 14 7
mais de 3 até 5 Sm more than 3 up to 5 mw 32 24 18 19 7
mais de 5 Sm more than 5 mw 33 26 19 16 6
RENDA PESSOALinDiViDUAl inCOME
Até 3 Sm up to 3 mw 35 26 17 16 6
mais de 3 até 5 Sm more than 3 up to 5 mw 32 24 20 18 6
mais de 5 Sm more than 5 mw 32 27 19 15 7
REGIÃOREgiOn
Norte / Centro-oeste / North / Center-west 30 25 25 14 6
Nordeste / Northeast 35 29 13 14 9
Sudeste / Southeast 31 22 22 19 6
Sul / South 39 23 17 19 2
DEPENDêNCIA ADMINISTRATIvAADMinisTRATiVE
JURisDiCTiOn
municipal / municipal 34 25 18 15 7
Estadual / State 33 25 19 18 6
SÉRIEgRADE
4a série / 5o ano do Ensino Fundamental4th grade / 5th year elementary education 30 24 21 17 7
8a série / 9o ano do Ensino Fundamental8th grade / 9th year elementary education 34 27 18 14 6
2o ano do Ensino médio2nd year of Secondary education 34 26 19 16 5
COMPUTADOR INSTALADO
NO LABORATóRIO DE INFORMÁTICA
COMPUTER insTAllED AT iT lAb
Sim / yes 31 26 20 19 5
Não / No 43 22 16 7 13
INTERNET INSTALADA NO LABORATóRIO DE INFORMÁTICA
inTERnET AVAilAblE AT iT lAb
Sim / yes 31 25 19 20 5
Não / No 39 24 19 7 11
1 Base: 1.535 professores. Respostas estimuladas.1 base: 1,535 teachers. stimulated answers.
f2 PERCEPÇÃO DO PROFESSOR SOBRE O NÍvEL DE OBSTÁCULO NO USO DE COMPUTADOR E INTERNET– ContinuaçãoteaCher’S PerCePtIoN oN oBStaCleS to the uSe of ComPuterS aNd the INterNet – ContinuationPercentual sobre o total de professores 1Percentage of the total number of teachers 1

Survey on ICT Education 2010TABLES OF RESuLTS – TEACHERS
PO
RTu
Gu
ÊS
En
gli
sh
374
Percentual (%)Percentage (%)
Número insuficiente de computadores conectados à Internet insufficient number of computers connected to the internet
Atrapalha muito
strongly hinders
Atrapalhahinders
Atrapalha um poucohinders
to a certain extent
Não atrapalha Does not
hinder at all
Não se aplicaDoes not
apply
TOTAL 53 20 12 9 7
SEXOgEnDER
Feminino / female 53 19 12 8 7
masculino / male 51 21 11 11 6
FAIXA ETÁRIAAgE gROUP
≤ 30 51 22 12 10 5
31-45 52 21 13 8 6
46+ 55 17 10 9 8
RENDA FAMILIARFAMilY inCOME
Até 3 Sm up to 3 mw 49 21 11 10 10
mais de 3 até 5 Sm more than 3 up to 5 mw 53 20 11 9 7
mais de 5 Sm more than 5 mw 54 19 13 8 6
RENDA PESSOALinDiViDUAl inCOME
Até 3 Sm up to 3 mw 55 19 10 8 8
mais de 3 até 5 Sm more than 3 up to 5 mw 51 20 13 10 6
mais de 5 Sm more than 5 mw 51 20 13 8 7
REGIÃOREgiOn
Norte / Centro-oeste / North / Center-west 47 26 14 7 5
Nordeste / Northeast 51 20 10 8 10
Sudeste / Southeast 56 16 12 9 7
Sul / South 55 19 13 12 1
DEPENDêNCIA ADMINISTRATIvAADMinisTRATiVE
JURisDiCTiOn
municipal / municipal 52 20 13 9 6
Estadual / State 54 19 11 9 7
SÉRIEgRADE
4a série / 5o ano do Ensino Fundamental4th grade / 5th year elementary education 51 20 13 9 8
8a série / 9o ano do Ensino Fundamental8th grade / 9th year elementary education 50 22 13 8 6
2o ano do Ensino médio2nd year of Secondary education 56 19 11 8 6
COMPUTADOR INSTALADO
NO LABORATóRIO DE INFORMÁTICA
COMPUTER insTAllED AT iT lAb
Sim / yes 51 20 14 10 5
Não / No 59 18 5 2 16
INTERNET INSTALADA NO LABORATóRIO DE INFORMÁTICA
inTERnET AVAilAblE AT iT lAb
Sim / yes 52 19 14 11 4
Não / No 55 21 7 4 13
1 Base: 1.535 professores. Respostas estimuladas.1 base: 1,535 teachers. stimulated answers.
f2 PERCEPÇÃO DO PROFESSOR SOBRE O NÍvEL DE OBSTÁCULO NO USO DE COMPUTADOR E INTERNET– ContinuaçãoteaCher’S PerCePtIoN oN oBStaCleS to the uSe of ComPuterS aNd the INterNet – ContinuationPercentual sobre o total de professores 1Percentage of the total number of teachers 1

2010 Pesquisa TIC EducaçãoTABELAS DE RESuLTADOS – PROFESSORES
PO
RTu
Gu
ÊS
En
gli
sh
375
Percentual (%)Percentage (%)
Baixa velocidade na conexão de Internetlow speed connection to the internet
Atrapalha muito
strongly hinders
Atrapalhahinders
Atrapalha um poucohinders
to a certain extent
Não atrapalha Does not
hinder at all
Não se aplicaDoes not
apply
TOTAL 49 22 14 7 8
SEXOgEnDER
Feminino / female 48 21 15 7 8
masculino / male 51 23 12 7 6
FAIXA ETÁRIAAgE gROUP
≤ 30 46 22 18 9 6
31-45 50 22 14 7 7
46+ 50 22 12 7 10
RENDA FAMILIARFAMilY inCOME
Até 3 Sm up to 3 mw 44 23 11 10 12
mais de 3 até 5 Sm more than 3 up to 5 mw 49 23 14 7 7
mais de 5 Sm more than 5 mw 50 21 15 7 7
RENDA PESSOALinDiViDUAl inCOME
Até 3 Sm up to 3 mw 49 22 12 8 9
mais de 3 até 5 Sm more than 3 up to 5 mw 49 22 15 7 7
mais de 5 Sm more than 5 mw 50 21 17 7 6
REGIÃOREgiOn
Norte / Centro-oeste / North / Center-west 46 25 16 4 8
Nordeste / Northeast 45 23 13 8 11
Sudeste / Southeast 51 19 15 7 8
Sul / South 55 21 12 11 1
DEPENDêNCIA ADMINISTRATIvAADMinisTRATiVE
JURisDiCTiOn
municipal / municipal 49 20 14 7 9
Estadual / State 49 23 14 7 6
SÉRIEgRADE
4a série / 5o ano do Ensino Fundamental4th grade / 5th year elementary education 47 22 14 7 10
8a série / 9o ano do Ensino Fundamental8th grade / 9th year elementary education 47 23 15 7 8
2o ano do Ensino médio2nd year of Secondary education 50 23 16 6 5
COMPUTADOR INSTALADO
NO LABORATóRIO DE INFORMÁTICA
COMPUTER insTAllED AT iT lAb
Sim / yes 48 23 16 8 5
Não / No 53 18 6 4 19
INTERNET INSTALADA NO LABORATóRIO DE INFORMÁTICA
inTERnET AVAilAblE AT iT lAb
Sim / yes 47 22 17 9 5
Não / No 54 20 7 3 15
1 Base: 1.535 professores. Respostas estimuladas.1 base: 1,535 teachers. stimulated answers.
f2 PERCEPÇÃO DO PROFESSOR SOBRE O NÍvEL DE OBSTÁCULO NO USO DE COMPUTADOR E INTERNET– ContinuaçãoteaCher’S PerCePtIoN oN oBStaCleS to the uSe of ComPuterS aNd the INterNet – ContinuationPercentual sobre o total de professores 1Percentage of the total number of teachers 1
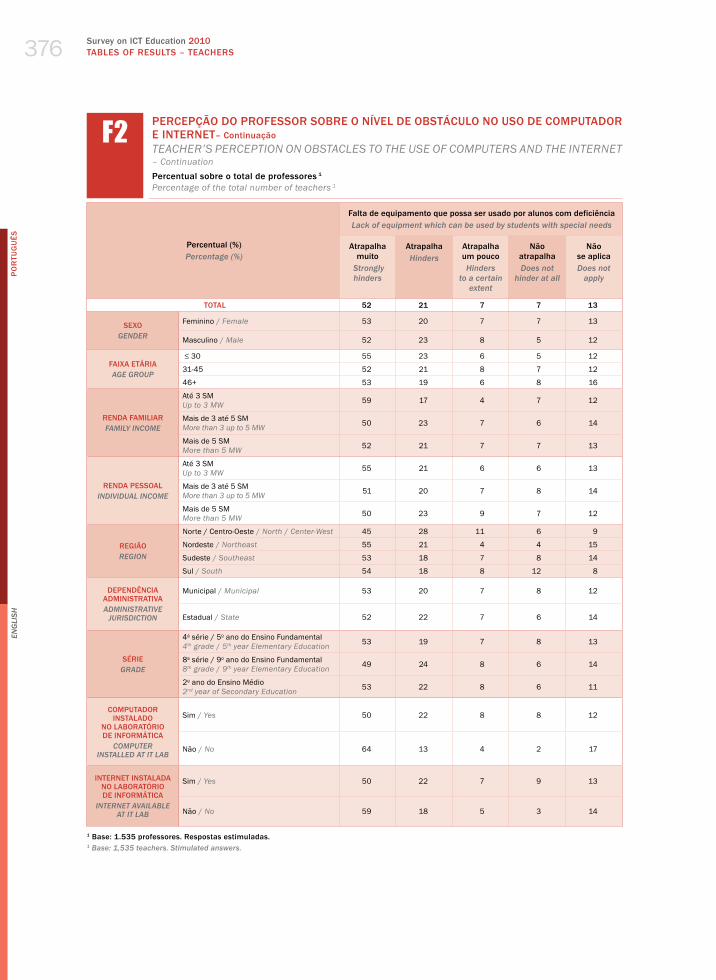
Survey on ICT Education 2010TABLES OF RESuLTS – TEACHERS
PO
RTu
Gu
ÊS
En
gli
sh
376
Percentual (%)Percentage (%)
Falta de equipamento que possa ser usado por alunos com deficiência lack of equipment which can be used by students with special needs
Atrapalha muito
strongly hinders
Atrapalhahinders
Atrapalha um poucohinders
to a certain extent
Não atrapalha Does not
hinder at all
Não se aplicaDoes not
apply
TOTAL 52 21 7 7 13
SEXOgEnDER
Feminino / female 53 20 7 7 13
masculino / male 52 23 8 5 12
FAIXA ETÁRIAAgE gROUP
≤ 30 55 23 6 5 12
31-45 52 21 8 7 12
46+ 53 19 6 8 16
RENDA FAMILIARFAMilY inCOME
Até 3 Sm up to 3 mw 59 17 4 7 12
mais de 3 até 5 Sm more than 3 up to 5 mw 50 23 7 6 14
mais de 5 Sm more than 5 mw 52 21 7 7 13
RENDA PESSOALinDiViDUAl inCOME
Até 3 Sm up to 3 mw 55 21 6 6 13
mais de 3 até 5 Sm more than 3 up to 5 mw 51 20 7 8 14
mais de 5 Sm more than 5 mw 50 23 9 7 12
REGIÃOREgiOn
Norte / Centro-oeste / North / Center-west 45 28 11 6 9
Nordeste / Northeast 55 21 4 4 15
Sudeste / Southeast 53 18 7 8 14
Sul / South 54 18 8 12 8
DEPENDêNCIA ADMINISTRATIvAADMinisTRATiVE
JURisDiCTiOn
municipal / municipal 53 20 7 8 12
Estadual / State 52 22 7 6 14
SÉRIEgRADE
4a série / 5o ano do Ensino Fundamental4th grade / 5th year elementary education 53 19 7 8 13
8a série / 9o ano do Ensino Fundamental8th grade / 9th year elementary education 49 24 8 6 14
2o ano do Ensino médio2nd year of Secondary education 53 22 8 6 11
COMPUTADOR INSTALADO
NO LABORATóRIO DE INFORMÁTICA
COMPUTER insTAllED AT iT lAb
Sim / yes 50 22 8 8 12
Não / No 64 13 4 2 17
INTERNET INSTALADA NO LABORATóRIO DE INFORMÁTICA
inTERnET AVAilAblE AT iT lAb
Sim / yes 50 22 7 9 13
Não / No 59 18 5 3 14
1 Base: 1.535 professores. Respostas estimuladas.1 base: 1,535 teachers. stimulated answers.
f2 PERCEPÇÃO DO PROFESSOR SOBRE O NÍvEL DE OBSTÁCULO NO USO DE COMPUTADOR E INTERNET– ContinuaçãoteaCher’S PerCePtIoN oN oBStaCleS to the uSe of ComPuterS aNd the INterNet – ContinuationPercentual sobre o total de professores 1Percentage of the total number of teachers 1

2010 Pesquisa TIC EducaçãoTABELAS DE RESuLTADOS – PROFESSORES
PO
RTu
Gu
ÊS
En
gli
sh
377
Percentual (%)Percentage (%)
Número insuficiente de computadores por alunoinsufficient number of computers per student
Atrapalha muito
strongly hinders
Atrapalhahinders
Atrapalha um poucohinders
to a certain extent
Não atrapalha Does not
hinder at all
Não se aplicaDoes not
apply
TOTAL 57 21 11 5 6
SEXOgEnDER
Feminino / female 57 21 12 4 6
masculino / male 57 23 8 7 5
FAIXA ETÁRIAAgE gROUP
≤ 30 53 26 12 5 4
31-45 57 21 11 5 6
46+ 58 19 10 5 7
RENDA FAMILIARFAMilY inCOME
Até 3 Sm up to 3 mw 55 19 12 4 10
mais de 3 até 5 Sm more than 3 up to 5 mw 57 23 10 5 5
mais de 5 Sm more than 5 mw 57 21 11 5 5
RENDA PESSOALinDiViDUAl inCOME
Até 3 Sm up to 3 mw 57 22 10 4 7
mais de 3 até 5 Sm more than 3 up to 5 mw 57 21 11 6 5
mais de 5 Sm more than 5 mw 57 19 12 6 6
REGIÃOREgiOn
Norte / Centro-oeste / North / Center-west 51 27 14 4 5
Nordeste / Northeast 56 21 9 4 9
Sudeste / Southeast 62 17 12 4 6
Sul / South 56 25 9 9 1
DEPENDêNCIA ADMINISTRATIvAADMinisTRATiVE
JURisDiCTiOn
municipal / municipal 56 21 12 5 6
Estadual / State 58 21 10 5 6
SÉRIEgRADE
4a série / 5o ano do Ensino Fundamental4th grade / 5th year elementary education 55 21 12 5 7
8a série / 9o ano do Ensino Fundamental8th grade / 9th year elementary education 55 23 12 5 6
2o ano do Ensino médio2nd year of Secondary education 60 22 8 4 5
COMPUTADOR INSTALADO
NO LABORATóRIO DE INFORMÁTICA
COMPUTER insTAllED AT iT lAb
Sim / yes 55 23 12 6 4
Não / No 64 14 4 1 16
INTERNET INSTALADA NO LABORATóRIO DE INFORMÁTICA
inTERnET AVAilAblE AT iT lAb
Sim / yes 55 23 13 6 3
Não / No 60 18 6 2 13
1 Base: 1.535 professores. Respostas estimuladas.1 base: 1,535 teachers. stimulated answers.
f2 PERCEPÇÃO DO PROFESSOR SOBRE O NÍvEL DE OBSTÁCULO NO USO DE COMPUTADOR E INTERNET– ContinuaçãoteaCher’S PerCePtIoN oN oBStaCleS to the uSe of ComPuterS aNd the INterNet – ContinuationPercentual sobre o total de professores 1Percentage of the total number of teachers 1

Survey on ICT Education 2010TABLES OF RESuLTS – TEACHERS
PO
RTu
Gu
ÊS
En
gli
sh
378
Percentual (%)Percentage (%)
Equipamentos obsoletos ou ultrapassadosObsolete or outdated equipment
Atrapalha muito
strongly hinders
Atrapalhahinders
Atrapalha um poucohinders
to a certain extent
Não atrapalha Does not
hinder at all
Não se aplicaDoes not
apply
TOTAL 45 19 11 14 11
SEXOgEnDER
Feminino / female 45 18 11 14 12
masculino / male 43 22 11 14 9
FAIXA ETÁRIAAgE gROUP
≤ 30 42 20 12 15 11
31-45 44 20 11 14 11
46+ 49 18 11 12 11
RENDA FAMILIARFAMilY inCOME
Até 3 Sm up to 3 mw 40 19 13 14 14
mais de 3 até 5 Sm more than 3 up to 5 mw 44 19 10 14 13
mais de 5 Sm more than 5 mw 47 19 11 14 9
RENDA PESSOALinDiViDUAl inCOME
Até 3 Sm up to 3 mw 45 18 10 14 13
mais de 3 até 5 Sm more than 3 up to 5 mw 43 21 12 14 10
mais de 5 Sm more than 5 mw 49 18 12 12 10
REGIÃOREgiOn
Norte / Centro-oeste / North / Center-west 40 22 14 13 11
Nordeste / Northeast 42 20 8 14 15
Sudeste / Southeast 48 17 11 13 12
Sul / South 51 18 13 16 2
DEPENDêNCIA ADMINISTRATIvAADMinisTRATiVE
JURisDiCTiOn
municipal / municipal 44 19 11 14 11
Estadual / State 46 19 11 13 11
SÉRIEgRADE
4a série / 5o ano do Ensino Fundamental4th grade / 5th year elementary education 43 18 11 15 14
8a série / 9o ano do Ensino Fundamental8th grade / 9th year elementary education 43 22 11 13 11
2o ano do Ensino médio2nd year of Secondary education 50 18 12 10 9
COMPUTADOR INSTALADO
NO LABORATóRIO DE INFORMÁTICA
COMPUTER insTAllED AT iT lAb
Sim / yes 43 20 12 16 9
Não / No 54 15 7 4 20
INTERNET INSTALADA NO LABORATóRIO DE INFORMÁTICA
inTERnET AVAilAblE AT iT lAb
Sim / yes 43 19 13 16 8
Não / No 49 19 8 7 18
1 Base: 1.535 professores. Respostas estimuladas.1 base: 1,535 teachers. stimulated answers.
f2 PERCEPÇÃO DO PROFESSOR SOBRE O NÍvEL DE OBSTÁCULO NO USO DE COMPUTADOR E INTERNET– ContinuaçãoteaCher’S PerCePtIoN oN oBStaCleS to the uSe of ComPuterS aNd the INterNet – ContinuationPercentual sobre o total de professores 1Percentage of the total number of teachers 1
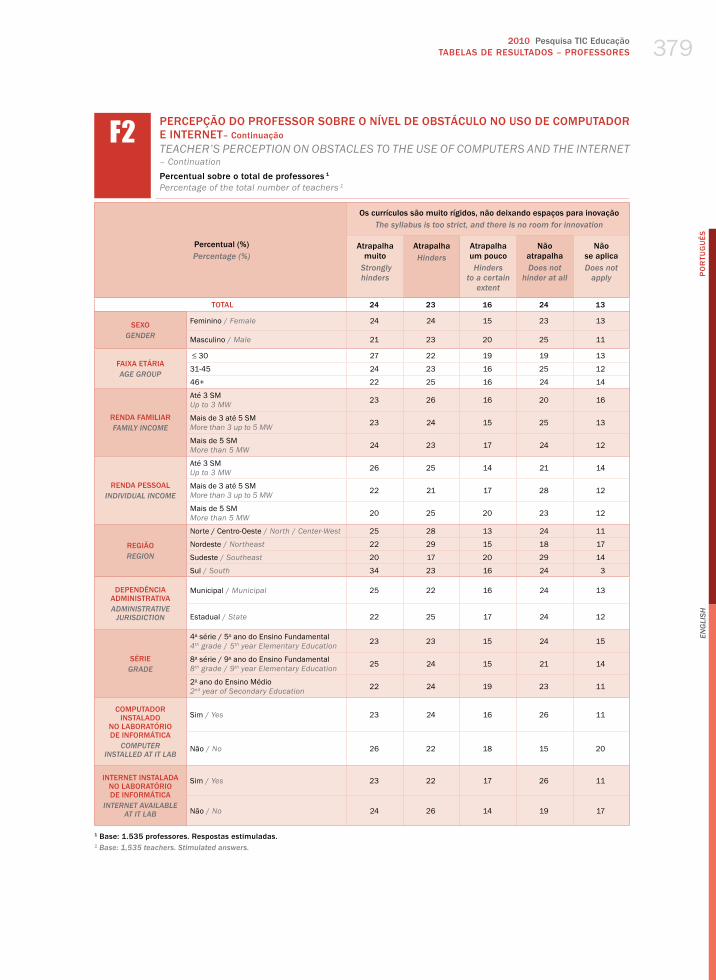
2010 Pesquisa TIC EducaçãoTABELAS DE RESuLTADOS – PROFESSORES
PO
RTu
Gu
ÊS
En
gli
sh
379
Percentual (%)Percentage (%)
Os currículos são muito rígidos, não deixando espaços para inovaçãoThe syllabus is too strict, and there is no room for innovation
Atrapalha muito
strongly hinders
Atrapalhahinders
Atrapalha um poucohinders
to a certain extent
Não atrapalha Does not
hinder at all
Não se aplicaDoes not
apply
TOTAL 24 23 16 24 13
SEXOgEnDER
Feminino / female 24 24 15 23 13
masculino / male 21 23 20 25 11
FAIXA ETÁRIAAgE gROUP
≤ 30 27 22 19 19 13
31-45 24 23 16 25 12
46+ 22 25 16 24 14
RENDA FAMILIARFAMilY inCOME
Até 3 Sm up to 3 mw 23 26 16 20 16
mais de 3 até 5 Sm more than 3 up to 5 mw 23 24 15 25 13
mais de 5 Sm more than 5 mw 24 23 17 24 12
RENDA PESSOALinDiViDUAl inCOME
Até 3 Sm up to 3 mw 26 25 14 21 14
mais de 3 até 5 Sm more than 3 up to 5 mw 22 21 17 28 12
mais de 5 Sm more than 5 mw 20 25 20 23 12
REGIÃOREgiOn
Norte / Centro-oeste / North / Center-west 25 28 13 24 11
Nordeste / Northeast 22 29 15 18 17
Sudeste / Southeast 20 17 20 29 14
Sul / South 34 23 16 24 3
DEPENDêNCIA ADMINISTRATIvAADMinisTRATiVE
JURisDiCTiOn
municipal / municipal 25 22 16 24 13
Estadual / State 22 25 17 24 12
SÉRIEgRADE
4a série / 5o ano do Ensino Fundamental4th grade / 5th year elementary education 23 23 15 24 15
8a série / 9o ano do Ensino Fundamental8th grade / 9th year elementary education 25 24 15 21 14
2o ano do Ensino médio2nd year of Secondary education 22 24 19 23 11
COMPUTADOR INSTALADO
NO LABORATóRIO DE INFORMÁTICA
COMPUTER insTAllED AT iT lAb
Sim / yes 23 24 16 26 11
Não / No 26 22 18 15 20
INTERNET INSTALADA NO LABORATóRIO DE INFORMÁTICA
inTERnET AVAilAblE AT iT lAb
Sim / yes 23 22 17 26 11
Não / No 24 26 14 19 17
1 Base: 1.535 professores. Respostas estimuladas.1 base: 1,535 teachers. stimulated answers.
f2 PERCEPÇÃO DO PROFESSOR SOBRE O NÍvEL DE OBSTÁCULO NO USO DE COMPUTADOR E INTERNET– ContinuaçãoteaCher’S PerCePtIoN oN oBStaCleS to the uSe of ComPuterS aNd the INterNet – ContinuationPercentual sobre o total de professores 1Percentage of the total number of teachers 1

Survey on ICT Education 2010TABLES OF RESuLTS – TEACHERS
PO
RTu
Gu
ÊS
En
gli
sh
380
Percentual (%)Percentage (%)
O uso de computador e Internet não é um objetivo importante da escolaThe use of computers and the internet is not a key goal for the school
Atrapalha muito
strongly hinders
Atrapalhahinders
Atrapalha um poucohinders
to a certain extent
Não atrapalha Does not
hinder at all
Não se aplicaDoes not
apply
TOTAL 24 19 13 23 20
SEXOgEnDER
Feminino / female 24 20 13 22 21
masculino / male 25 18 13 27 17
FAIXA ETÁRIAAgE gROUP
≤ 30 24 20 18 21 18
31-45 25 19 12 23 22
46+ 24 21 15 22 19
RENDA FAMILIARFAMilY inCOME
Até 3 Sm up to 3 mw 22 19 12 26 21
mais de 3 até 5 Sm more than 3 up to 5 mw 22 22 11 23 22
mais de 5 Sm more than 5 mw 27 18 15 22 19
RENDA PESSOALinDiViDUAl inCOME
Até 3 Sm up to 3 mw 25 21 10 23 20
mais de 3 até 5 Sm more than 3 up to 5 mw 24 18 15 24 20
mais de 5 Sm more than 5 mw 24 18 16 19 22
REGIÃOREgiOn
Norte / Centro-oeste / North / Center-west 28 21 15 22 14
Nordeste / Northeast 23 21 9 23 24
Sudeste / Southeast 20 15 17 21 27
Sul / South 32 25 12 26 5
DEPENDêNCIA ADMINISTRATIvAADMinisTRATiVE
JURisDiCTiOn
municipal / municipal 26 20 12 23 18
Estadual / State 22 18 14 22 23
SÉRIEgRADE
4a série / 5o ano do Ensino Fundamental4th grade / 5th year elementary education 24 21 12 23 20
8a série / 9o ano do Ensino Fundamental8th grade / 9th year elementary education 26 21 12 22 19
2o ano do Ensino médio2nd year of Secondary education 22 18 17 22 22
COMPUTADOR INSTALADO
NO LABORATóRIO DE INFORMÁTICA
COMPUTER insTAllED AT iT lAb
Sim / yes 23 20 14 25 19
Não / No 30 18 12 13 27
INTERNET INSTALADA NO LABORATóRIO DE INFORMÁTICA
inTERnET AVAilAblE AT iT lAb
Sim / yes 23 19 14 25 20
Não / No 28 22 12 16 22
1 Base: 1.535 professores. Respostas estimuladas.1 base: 1,535 teachers. stimulated answers.
f2 PERCEPÇÃO DO PROFESSOR SOBRE O NÍvEL DE OBSTÁCULO NO USO DE COMPUTADOR E INTERNET– ContinuaçãoteaCher’S PerCePtIoN oN oBStaCleS to the uSe of ComPuterS aNd the INterNet – ContinuationPercentual sobre o total de professores 1Percentage of the total number of teachers 1

2010 Pesquisa TIC EducaçãoTABELAS DE RESuLTADOS – PROFESSORES
PO
RTu
Gu
ÊS
En
gli
sh
381
Percentual (%)Percentage (%)
Os professores não sabem ao certo como lidar com computador e InternetTeachers are not sure how to handle computers and the internet
Atrapalha muito
strongly hinders
Atrapalhahinders
Atrapalha um poucohinders
to a certain extent
Não atrapalha Does not
hinder at all
Não se aplicaDoes not
apply
TOTAL 28 27 22 10 11
SEXOgEnDER
Feminino / female 30 26 22 10 12
masculino / male 25 31 22 12 11
FAIXA ETÁRIAAgE gROUP
≤ 30 25 29 22 13 12
31-45 28 28 23 10 11
46+ 32 25 21 11 12
RENDA FAMILIARFAMilY inCOME
Até 3 Sm up to 3 mw 25 27 21 14 13
mais de 3 até 5 Sm more than 3 up to 5 mw 28 28 20 11 13
mais de 5 Sm more than 5 mw 30 27 23 10 10
RENDA PESSOALinDiViDUAl inCOME
Até 3 Sm up to 3 mw 28 29 20 12 12
mais de 3 até 5 Sm more than 3 up to 5 mw 30 23 24 11 12
mais de 5 Sm more than 5 mw 28 31 23 7 11
REGIÃOREgiOn
Norte / Centro-oeste / North / Center-west 33 30 22 9 6
Nordeste / Northeast 26 30 18 12 15
Sudeste / Southeast 25 21 29 9 16
Sul / South 36 34 15 13 1
DEPENDêNCIA ADMINISTRATIvAADMinisTRATiVE
JURisDiCTiOn
municipal / municipal 29 29 20 11 11
Estadual / State 28 25 25 10 12
SÉRIEgRADE
4a série / 5o ano do Ensino Fundamental4th grade / 5th year elementary education 29 28 21 10 12
8a série / 9o ano do Ensino Fundamental8th grade / 9th year elementary education 27 32 20 9 11
2o ano do Ensino médio2nd year of Secondary education 29 23 26 10 11
COMPUTADOR INSTALADO
NO LABORATóRIO DE INFORMÁTICA
COMPUTER insTAllED AT iT lAb
Sim / yes 28 28 23 11 10
Não / No 31 25 18 7 19
INTERNET INSTALADA NO LABORATóRIO DE INFORMÁTICA
inTERnET AVAilAblE AT iT lAb
Sim / yes 28 27 24 12 10
Não / No 29 29 18 8 16
1 Base: 1.535 professores. Respostas estimuladas.1 base: 1,535 teachers. stimulated answers.
f2 PERCEPÇÃO DO PROFESSOR SOBRE O NÍvEL DE OBSTÁCULO NO USO DE COMPUTADOR E INTERNET– ContinuaçãoteaCher’S PerCePtIoN oN oBStaCleS to the uSe of ComPuterS aNd the INterNet – ContinuationPercentual sobre o total de professores 1Percentage of the total number of teachers 1
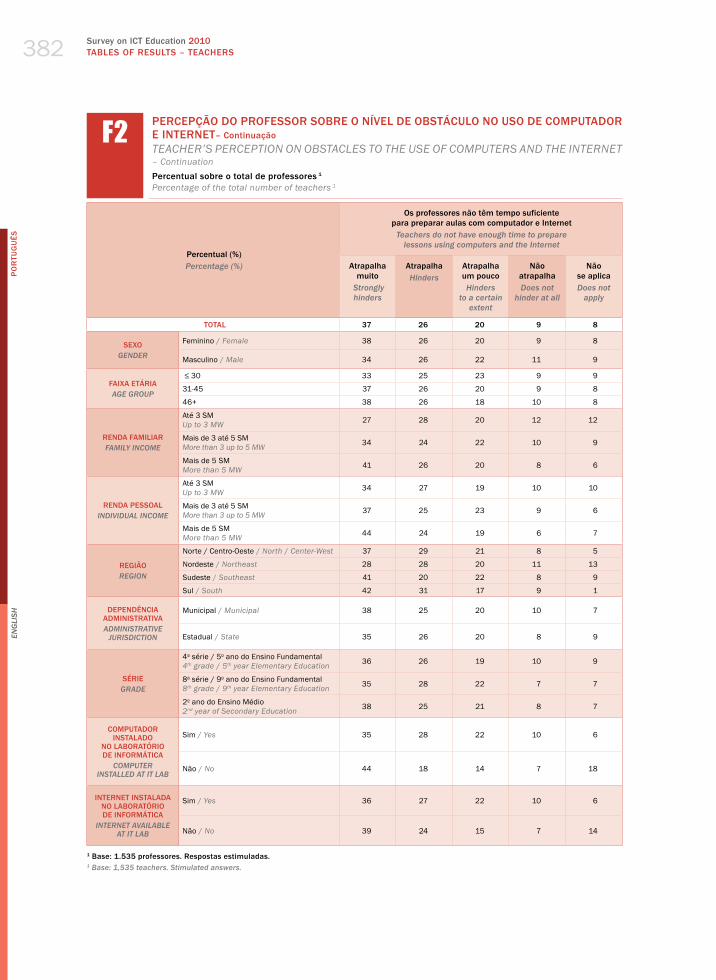
Survey on ICT Education 2010TABLES OF RESuLTS – TEACHERS
PO
RTu
Gu
ÊS
En
gli
sh
382
Percentual (%)Percentage (%)
Os professores não têm tempo suficiente para preparar aulas com computador e Internet
Teachers do not have enough time to prepare lessons using computers and the internet
Atrapalha muito
strongly hinders
Atrapalhahinders
Atrapalha um poucohinders
to a certain extent
Não atrapalha Does not
hinder at all
Não se aplicaDoes not
apply
TOTAL 37 26 20 9 8
SEXOgEnDER
Feminino / female 38 26 20 9 8
masculino / male 34 26 22 11 9
FAIXA ETÁRIAAgE gROUP
≤ 30 33 25 23 9 9
31-45 37 26 20 9 8
46+ 38 26 18 10 8
RENDA FAMILIARFAMilY inCOME
Até 3 Sm up to 3 mw 27 28 20 12 12
mais de 3 até 5 Sm more than 3 up to 5 mw 34 24 22 10 9
mais de 5 Sm more than 5 mw 41 26 20 8 6
RENDA PESSOALinDiViDUAl inCOME
Até 3 Sm up to 3 mw 34 27 19 10 10
mais de 3 até 5 Sm more than 3 up to 5 mw 37 25 23 9 6
mais de 5 Sm more than 5 mw 44 24 19 6 7
REGIÃOREgiOn
Norte / Centro-oeste / North / Center-west 37 29 21 8 5
Nordeste / Northeast 28 28 20 11 13
Sudeste / Southeast 41 20 22 8 9
Sul / South 42 31 17 9 1
DEPENDêNCIA ADMINISTRATIvAADMinisTRATiVE
JURisDiCTiOn
municipal / municipal 38 25 20 10 7
Estadual / State 35 26 20 8 9
SÉRIEgRADE
4a série / 5o ano do Ensino Fundamental4th grade / 5th year elementary education 36 26 19 10 9
8a série / 9o ano do Ensino Fundamental8th grade / 9th year elementary education 35 28 22 7 7
2o ano do Ensino médio2nd year of Secondary education 38 25 21 8 7
COMPUTADOR INSTALADO
NO LABORATóRIO DE INFORMÁTICA
COMPUTER insTAllED AT iT lAb
Sim / yes 35 28 22 10 6
Não / No 44 18 14 7 18
INTERNET INSTALADA NO LABORATóRIO DE INFORMÁTICA
inTERnET AVAilAblE AT iT lAb
Sim / yes 36 27 22 10 6
Não / No 39 24 15 7 14
1 Base: 1.535 professores. Respostas estimuladas.1 base: 1,535 teachers. stimulated answers.
f2 PERCEPÇÃO DO PROFESSOR SOBRE O NÍvEL DE OBSTÁCULO NO USO DE COMPUTADOR E INTERNET– ContinuaçãoteaCher’S PerCePtIoN oN oBStaCleS to the uSe of ComPuterS aNd the INterNet – ContinuationPercentual sobre o total de professores 1Percentage of the total number of teachers 1

2010 Pesquisa TIC EducaçãoTABELAS DE RESuLTADOS – PROFESSORES
PO
RTu
Gu
ÊS
En
gli
sh
383
Percentual (%)Percentage (%)
Pressão / falta de tempo para cumprir com o conteúdo previsto (grade curricular)
Pressure/ lack of time to cover the syllabus (curriculum framework)
Atrapalha muito
strongly hinders
Atrapalhahinders
Atrapalha um poucohinders
to a certain extent
Não atrapalha Does not
hinder at all
Não se aplicaDoes not
apply
TOTAL 36 26 19 12 8
SEXOgEnDER
Feminino / female 37 25 19 11 8
masculino / male 32 29 18 13 8
FAIXA ETÁRIAAgE gROUP
≤ 30 31 30 24 9 6
31-45 38 26 16 12 7
46+ 35 22 21 12 10
RENDA FAMILIARFAMilY inCOME
Até 3 Sm up to 3 mw 25 27 24 13 11
mais de 3 até 5 Sm more than 3 up to 5 mw 37 25 18 13 8
mais de 5 Sm more than 5 mw 39 25 18 11 7
RENDA PESSOALinDiViDUAl inCOME
Até 3 Sm up to 3 mw 33 26 19 12 9
mais de 3 até 5 Sm more than 3 up to 5 mw 37 25 19 13 7
mais de 5 Sm more than 5 mw 40 25 18 9 8
REGIÃOREgiOn
Norte / Centro-oeste / North / Center-west 34 30 20 10 5
Nordeste / Northeast 26 30 18 14 12
Sudeste / Southeast 40 19 20 11 9
Sul / South 48 25 15 11 1
DEPENDêNCIA ADMINISTRATIvAADMinisTRATiVE
JURisDiCTiOn
municipal / municipal 37 26 19 12 7
Estadual / State 36 25 19 12 9
SÉRIEgRADE
4a série / 5o ano do Ensino Fundamental4th grade / 5th year elementary education 34 26 19 13 8
8a série / 9o ano do Ensino Fundamental8th grade / 9th year elementary education 35 28 19 11 7
2o ano do Ensino médio2nd year of Secondary education 38 25 18 11 8
COMPUTADOR INSTALADO
NO LABORATóRIO DE INFORMÁTICA
COMPUTER insTAllED AT iT lAb
Sim / yes 35 27 19 13 6
Não / No 39 21 16 8 16
INTERNET INSTALADA NO LABORATóRIO DE INFORMÁTICA
inTERnET AVAilAblE AT iT lAb
Sim / yes 36 25 19 14 6
Não / No 35 27 18 7 12
1 Base: 1.535 professores. Respostas estimuladas.1 base: 1,535 teachers. stimulated answers.
f2 PERCEPÇÃO DO PROFESSOR SOBRE O NÍvEL DE OBSTÁCULO NO USO DE COMPUTADOR E INTERNET– ContinuaçãoteaCher’S PerCePtIoN oN oBStaCleS to the uSe of ComPuterS aNd the INterNet – ContinuationPercentual sobre o total de professores 1Percentage of the total number of teachers 1

Survey on ICT Education 2010TABLES OF RESuLTS – TEACHERS
PO
RTu
Gu
ÊS
En
gli
sh
384
Percentual (%)Percentage (%)
Pressão para conseguir boas notas nas avaliações de desempenhoPressure to get good performance assessment grades
Atrapalha muito
strongly hinders
Atrapalhahinders
Atrapalha um poucohinders
to a certain extent
Não atrapalha Does not
hinder at all
Não se aplicaDoes not
apply
TOTAL 33 24 19 15 9
SEXOgEnDER
Feminino / female 34 24 18 15 9
masculino / male 31 24 22 15 9
FAIXA ETÁRIAAgE gROUP
≤ 30 31 25 22 16 6
31-45 35 25 19 13 9
46+ 32 23 17 18 10
RENDA FAMILIARFAMilY inCOME
Até 3 Sm up to 3 mw 28 26 19 15 11
mais de 3 até 5 Sm more than 3 up to 5 mw 32 24 19 16 9
mais de 5 Sm more than 5 mw 35 24 18 15 7
RENDA PESSOALinDiViDUAl inCOME
Até 3 Sm up to 3 mw 32 27 17 15 9
mais de 3 até 5 Sm more than 3 up to 5 mw 35 21 21 15 7
mais de 5 Sm more than 5 mw 35 24 16 16 10
REGIÃOREgiOn
Norte / Centro-oeste / North / Center-west 32 27 21 15 6
Nordeste / Northeast 25 29 19 14 13
Sudeste / Southeast 38 18 19 16 9
Sul / South 43 27 14 16 1
DEPENDêNCIA ADMINISTRATIvAADMinisTRATiVE
JURisDiCTiOn
municipal / municipal 33 25 21 14 8
Estadual / State 34 24 16 16 10
SÉRIEgRADE
4a série / 5o ano do Ensino Fundamental4th grade / 5th year elementary education 32 25 19 16 9
8a série / 9o ano do Ensino Fundamental8th grade / 9th year elementary education 32 28 19 13 8
2o ano do Ensino médio2nd year of Secondary education 33 24 19 16 8
COMPUTADOR INSTALADO
NO LABORATóRIO DE INFORMÁTICA
COMPUTER insTAllED AT iT lAb
Sim / yes 32 26 19 16 7
Não / No 39 18 17 9 17
INTERNET INSTALADA NO LABORATóRIO DE INFORMÁTICA
inTERnET AVAilAblE AT iT lAb
Sim / yes 33 25 19 17 7
Não / No 35 24 18 10 13
1 Base: 1.535 professores. Respostas estimuladas.1 base: 1,535 teachers. stimulated answers.
f2 PERCEPÇÃO DO PROFESSOR SOBRE O NÍvEL DE OBSTÁCULO NO USO DE COMPUTADOR E INTERNET– ContinuaçãoteaCher’S PerCePtIoN oN oBStaCleS to the uSe of ComPuterS aNd the INterNet – ContinuationPercentual sobre o total de professores 1Percentage of the total number of teachers 1

2010 Pesquisa TIC EducaçãoTABELAS DE RESuLTADOS – PROFESSORES
PO
RTu
Gu
ÊS
En
gli
sh
385
Percentual (%)Percentage (%)
Passei a adotar novos métodos de ensinoi’ve started using new teaching techniques
Discordo totalmente
i totally disagree
Discordo em parte i partly
disagree
Não concordo
nem discordo i neither
agree nor disagree
Concordo em partei partly agree
Concordo totalmente
i totally agree
Não sabe Does not
know
TOTAL 5 3 5 33 47 7
SEXOgEnDER
Feminino / female 4 3 5 32 47 8
masculino / male 8 2 5 35 45 4
FAIXA ETÁRIAAgE gROUP
≤ 30 6 4 4 29 52 6
31-45 4 3 6 34 48 5
46+ 7 3 6 34 42 9
RENDA FAMILIARFAMilY inCOME
Até 3 Sm up to 3 mw 6 2 6 29 45 11
mais de 3 até 5 Sm more than 3 up to 5 mw 5 3 5 31 51 6
mais de 5 Sm more than 5 mw 5 3 5 35 45 6
RENDA PESSOALinDiViDUAl inCOME
Até 3 Sm up to 3 mw 5 3 4 31 48 9
mais de 3 até 5 Sm more than 3 up to 5 mw 4 3 7 33 49 5
mais de 5 Sm more than 5 mw 7 3 5 37 42 5
REGIÃOREgiOn
Norte / Centro-oeste / North / Center-west 7 3 9 32 42 7
Nordeste / Northeast 7 3 5 28 47 11
Sudeste / Southeast 4 4 6 36 45 5
Sul / South 2 1 1 38 57 1
DEPENDêNCIA ADMINISTRATIvAADMinisTRATiVE
JURisDiCTiOn
municipal / municipal 6 2 5 33 47 7
Estadual / State 4 4 6 33 47 7
SÉRIEgRADE
4a série / 5o ano do Ensino Fundamental4th grade / 5th year elementary education 5 2 5 33 47 8
8a série / 9o ano do Ensino Fundamental8th grade / 9th year elementary education 7 3 6 32 46 6
2o ano do Ensino médio2nd year of Secondary education 3 3 7 34 46 7
COMPUTADOR INSTALADO
NO LABORATóRIO DE INFORMÁTICA
COMPUTER insTAllED AT iT lAb
Sim / yes 5 3 5 32 51 5
Não / No 6 3 8 40 30 14
INTERNET INSTALADA NO LABORATóRIO DE INFORMÁTICA
inTERnET AVAilAblE AT iT lAb
Sim / yes 5 3 5 32 51 4
Não / No 5 3 7 36 36 13
1 Base: 1.535 professores. Respostas estimuladas.1 base: 1,535 teachers. stimulated answers.
f3 PERCEPÇÃO DO PROFESSOR SOBRE CONTRIBUIÇÃO DAS TICteaCher’S PerCePtIoN oN the CoNtrIButIoN of ICtPercentual sobre o total de professores 1Percentage of the total number of teachers 1

Survey on ICT Education 2010TABLES OF RESuLTS – TEACHERS
PO
RTu
Gu
ÊS
En
gli
sh
386
Percentual (%)Percentage (%)
Posso fazer uma avaliação mais individualizada dos alunosi can customize my assessment of students
Discordo totalmente
i totally disagree
Discordo em parte i partly
disagree
Não concordo
nem discordo i neither
agree nor disagree
Concordo em partei partly agree
Concordo totalmente
i totally agree
Não sabe Does not
know
TOTAL 6 6 10 38 33 7
SEXOgEnDER
Feminino / female 6 6 9 38 34 8
masculino / male 7 7 10 41 30 5
FAIXA ETÁRIAAgE gROUP
≤ 30 9 2 9 39 36 5
31-45 5 7 10 40 33 6
46+ 7 6 10 35 32 11
RENDA FAMILIARFAMilY inCOME
Até 3 Sm up to 3 mw 8 3 11 37 28 12
mais de 3 até 5 Sm more than 3 up to 5 mw 5 6 8 37 38 6
mais de 5 Sm more than 5 mw 6 7 10 39 32 7
RENDA PESSOALinDiViDUAl inCOME
Até 3 Sm up to 3 mw 5 4 9 38 34 10
mais de 3 até 5 Sm more than 3 up to 5 mw 6 7 9 38 35 5
mais de 5 Sm more than 5 mw 8 6 12 41 27 6
REGIÃOREgiOn
Norte / Centro-oeste / North / Center-west 9 5 13 37 29 7
Nordeste / Northeast 7 6 9 35 32 11
Sudeste / Southeast 5 7 10 42 31 6
Sul / South 7 4 7 38 43 1
DEPENDêNCIA ADMINISTRATIvAADMinisTRATiVE
JURisDiCTiOn
municipal / municipal 7 5 9 36 35 7
Estadual / State 5 6 10 40 31 7
SÉRIEgRADE
4a série / 5o ano do Ensino Fundamental4th grade / 5th year elementary education 5 6 9 36 37 8
8a série / 9o ano do Ensino Fundamental8th grade / 9th year elementary education 9 5 11 38 31 6
2o ano do Ensino médio2nd year of Secondary education 5 7 10 40 31 8
COMPUTADOR INSTALADO
NO LABORATóRIO DE INFORMÁTICA
COMPUTER insTAllED AT iT lAb
Sim / yes 7 5 9 39 35 6
Não / No 3 7 15 37 24 14
INTERNET INSTALADA NO LABORATóRIO DE INFORMÁTICA
inTERnET AVAilAblE AT iT lAb
Sim / yes 6 5 8 40 35 5
Não / No 6 7 12 34 28 13
1 Base: 1.535 professores. Respostas estimuladas.1 base: 1,535 teachers. stimulated answers.
f3 PERCEPÇÃO DO PROFESSOR SOBRE CONTRIBUIÇÃO DAS TIC – ContinuaçãoteaCher’S PerCePtIoN oN the CoNtrIButIoN of ICt – ContinuaçãoPercentual sobre o total de professores 1Percentage of the total number of teachers 1

2010 Pesquisa TIC EducaçãoTABELAS DE RESuLTADOS – PROFESSORES
PO
RTu
Gu
ÊS
En
gli
sh
387
Percentual (%)Percentage (%)
Passei a ter acesso a materiais mais diversificados / de melhor qualidade
i’ve gained access to more diverse / better quality materials
Discordo totalmente
i totally disagree
Discordo em parte i partly
disagree
Não concordo
nem discordo i neither
agree nor disagree
Concordo em partei partly agree
Concordo totalmente
i totally agree
Não sabe Does not
know
TOTAL 4 3 5 24 58 7
SEXOgEnDER
Feminino / female 4 3 5 23 58 7
masculino / male 5 3 4 26 58 4
FAIXA ETÁRIAAgE gROUP
≤ 30 3 3 5 22 61 5
31-45 4 3 5 24 59 5
46+ 5 3 6 22 54 10
RENDA FAMILIARFAMilY inCOME
Até 3 Sm up to 3 mw 6 3 8 25 47 11
mais de 3 até 5 Sm more than 3 up to 5 mw 4 3 5 24 60 6
mais de 5 Sm more than 5 mw 3 3 4 23 60 6
RENDA PESSOALinDiViDUAl inCOME
Até 3 Sm up to 3 mw 4 4 5 22 55 9
mais de 3 até 5 Sm more than 3 up to 5 mw 4 3 5 24 60 4
mais de 5 Sm more than 5 mw 4 1 4 25 59 6
REGIÃOREgiOn
Norte / Centro-oeste / North / Center-west 6 4 11 23 49 7
Nordeste / Northeast 5 4 6 26 50 11
Sudeste / Southeast 3 2 3 24 63 5
Sul / South 1 2 1 19 75 1
DEPENDêNCIA ADMINISTRATIvAADMinisTRATiVE
JURisDiCTiOn
municipal / municipal 4 3 5 24 58 6
Estadual / State 3 3 6 23 58 7
SÉRIEgRADE
4a série / 5o ano do Ensino Fundamental4th grade / 5th year elementary education 4 4 5 24 55 7
8a série / 9o ano do Ensino Fundamental8th grade / 9th year elementary education 5 3 4 25 57 6
2o ano do Ensino médio2nd year of Secondary education 2 2 5 24 59 7
COMPUTADOR INSTALADO
NO LABORATóRIO DE INFORMÁTICA
COMPUTER insTAllED AT iT lAb
Sim / yes 4 3 4 23 61 5
Não / No 4 4 9 25 44 14
INTERNET INSTALADA NO LABORATóRIO DE INFORMÁTICA
inTERnET AVAilAblE AT iT lAb
Sim / yes 3 2 4 23 63 4
Não / No 5 4 7 24 46 13
1 Base: 1.535 professores. Respostas estimuladas.1 base: 1,535 teachers. stimulated answers.
f3 PERCEPÇÃO DO PROFESSOR SOBRE CONTRIBUIÇÃO DAS TIC – ContinuaçãoteaCher’S PerCePtIoN oN the CoNtrIButIoN of ICt – ContinuaçãoPercentual sobre o total de professores 1Percentage of the total number of teachers 1

Survey on ICT Education 2010TABLES OF RESuLTS – TEACHERS
PO
RTu
Gu
ÊS
En
gli
sh
388
Percentual (%)Percentage (%)
Passei a ter contato com professores de outras escolas e com especialistas de fora da escola
i’ve been in touch with teachers from other schools and external experts
Discordo totalmente
i totally disagree
Discordo em parte i partly
disagree
Não concordo
nem discordo i neither
agree nor disagree
Concordo em partei partly agree
Concordo totalmente
i totally agree
Não sabe Does not
know
TOTAL 14 9 13 30 27 8
SEXOgEnDER
Feminino / female 14 8 12 28 28 9
masculino / male 16 9 15 34 22 5
FAIXA ETÁRIAAgE gROUP
≤ 30 14 9 13 29 28 7
31-45 12 7 13 32 29 7
46+ 18 11 12 26 23 11
RENDA FAMILIARFAMilY inCOME
Até 3 Sm up to 3 mw 19 7 13 27 21 14
mais de 3 até 5 Sm more than 3 up to 5 mw 13 9 15 28 29 6
mais de 5 Sm more than 5 mw 14 9 12 31 28 7
RENDA PESSOALinDiViDUAl inCOME
Até 3 Sm up to 3 mw 15 8 11 30 25 11
mais de 3 até 5 Sm more than 3 up to 5 mw 12 10 15 30 27 5
mais de 5 Sm more than 5 mw 15 7 12 28 32 7
REGIÃOREgiOn
Norte / Centro-oeste / North / Center-west 16 6 18 28 23 8
Nordeste / Northeast 14 10 11 27 26 12
Sudeste / Southeast 14 9 13 30 27 7
Sul / South 12 9 8 35 34 1
DEPENDêNCIA ADMINISTRATIvAADMinisTRATiVE
JURisDiCTiOn
municipal / municipal 13 8 15 28 28 8
Estadual / State 15 9 11 31 26 8
SÉRIEgRADE
4a série / 5o ano do Ensino Fundamental4th grade / 5th year elementary education 13 9 13 29 26 9
8a série / 9o ano do Ensino Fundamental8th grade / 9th year elementary education 15 8 14 28 28 7
2o ano do Ensino médio2nd year of Secondary education 15 8 12 31 27 8
COMPUTADOR INSTALADO
NO LABORATóRIO DE INFORMÁTICA
COMPUTER insTAllED AT iT lAb
Sim / yes 14 8 12 31 28 6
Não / No 12 10 18 23 21 16
INTERNET INSTALADA NO LABORATóRIO DE INFORMÁTICA
inTERnET AVAilAblE AT iT lAb
Sim / yes 14 8 11 32 29 5
Não / No 14 9 17 24 22 14
1 Base: 1.535 professores. Respostas estimuladas.1 base: 1,535 teachers. stimulated answers.
f3 PERCEPÇÃO DO PROFESSOR SOBRE CONTRIBUIÇÃO DAS TIC – ContinuaçãoteaCher’S PerCePtIoN oN the CoNtrIButIoN of ICt – ContinuaçãoPercentual sobre o total de professores 1Percentage of the total number of teachers 1
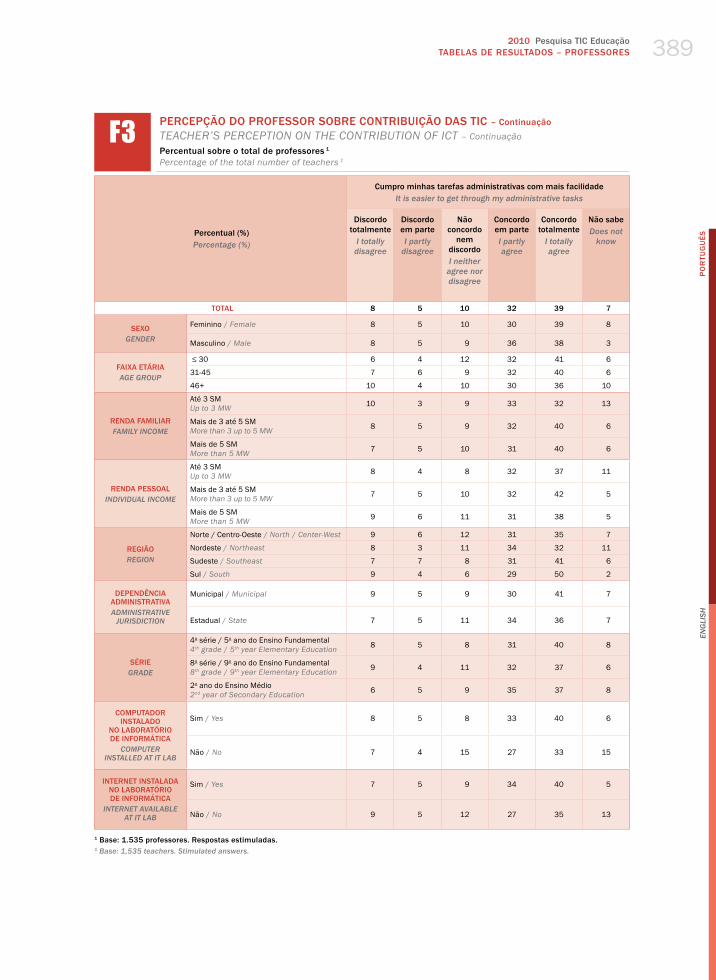
2010 Pesquisa TIC EducaçãoTABELAS DE RESuLTADOS – PROFESSORES
PO
RTu
Gu
ÊS
En
gli
sh
389
Percentual (%)Percentage (%)
Cumpro minhas tarefas administrativas com mais facilidadeit is easier to get through my administrative tasks
Discordo totalmente
i totally disagree
Discordo em parte i partly
disagree
Não concordo
nem discordo i neither
agree nor disagree
Concordo em partei partly agree
Concordo totalmente
i totally agree
Não sabe Does not
know
TOTAL 8 5 10 32 39 7
SEXOgEnDER
Feminino / female 8 5 10 30 39 8
masculino / male 8 5 9 36 38 3
FAIXA ETÁRIAAgE gROUP
≤ 30 6 4 12 32 41 6
31-45 7 6 9 32 40 6
46+ 10 4 10 30 36 10
RENDA FAMILIARFAMilY inCOME
Até 3 Sm up to 3 mw 10 3 9 33 32 13
mais de 3 até 5 Sm more than 3 up to 5 mw 8 5 9 32 40 6
mais de 5 Sm more than 5 mw 7 5 10 31 40 6
RENDA PESSOALinDiViDUAl inCOME
Até 3 Sm up to 3 mw 8 4 8 32 37 11
mais de 3 até 5 Sm more than 3 up to 5 mw 7 5 10 32 42 5
mais de 5 Sm more than 5 mw 9 6 11 31 38 5
REGIÃOREgiOn
Norte / Centro-oeste / North / Center-west 9 6 12 31 35 7
Nordeste / Northeast 8 3 11 34 32 11
Sudeste / Southeast 7 7 8 31 41 6
Sul / South 9 4 6 29 50 2
DEPENDêNCIA ADMINISTRATIvAADMinisTRATiVE
JURisDiCTiOn
municipal / municipal 9 5 9 30 41 7
Estadual / State 7 5 11 34 36 7
SÉRIEgRADE
4a série / 5o ano do Ensino Fundamental4th grade / 5th year elementary education 8 5 8 31 40 8
8a série / 9o ano do Ensino Fundamental8th grade / 9th year elementary education 9 4 11 32 37 6
2o ano do Ensino médio2nd year of Secondary education 6 5 9 35 37 8
COMPUTADOR INSTALADO
NO LABORATóRIO DE INFORMÁTICA
COMPUTER insTAllED AT iT lAb
Sim / yes 8 5 8 33 40 6
Não / No 7 4 15 27 33 15
INTERNET INSTALADA NO LABORATóRIO DE INFORMÁTICA
inTERnET AVAilAblE AT iT lAb
Sim / yes 7 5 9 34 40 5
Não / No 9 5 12 27 35 13
1 Base: 1.535 professores. Respostas estimuladas.1 base: 1,535 teachers. stimulated answers.
f3 PERCEPÇÃO DO PROFESSOR SOBRE CONTRIBUIÇÃO DAS TIC – ContinuaçãoteaCher’S PerCePtIoN oN the CoNtrIButIoN of ICt – ContinuaçãoPercentual sobre o total de professores 1Percentage of the total number of teachers 1

Survey on ICT Education 2010TABLES OF RESuLTS – TEACHERS
PO
RTu
Gu
ÊS
En
gli
sh
390
Percentual (%)Percentage (%)
Minha quantidade de trabalho aumentouMy workload has increased
Discordo totalmente
i totally disagree
Discordo em parte i partly
disagree
Não concordo
nem discordo i neither
agree nor disagree
Concordo em partei partly agree
Concordo totalmente
i totally agree
Não sabe Does not
know
TOTAL 21 15 11 24 22 7
SEXOgEnDER
Feminino / female 21 16 10 24 21 8
masculino / male 24 14 15 21 22 4
FAIXA ETÁRIAAgE gROUP
≤ 30 21 13 12 23 23 7
31-45 22 16 12 23 23 5
46+ 20 15 11 25 19 10
RENDA FAMILIARFAMilY inCOME
Até 3 Sm up to 3 mw 21 10 13 23 21 12
mais de 3 até 5 Sm more than 3 up to 5 mw 21 17 12 22 23 6
mais de 5 Sm more than 5 mw 22 16 11 25 20 5
RENDA PESSOALinDiViDUAl inCOME
Até 3 Sm up to 3 mw 19 16 12 24 20 10
mais de 3 até 5 Sm more than 3 up to 5 mw 24 15 11 24 22 4
mais de 5 Sm more than 5 mw 23 15 12 22 23 5
REGIÃOREgiOn
Norte / Centro-oeste / North / Center-west 20 14 13 25 23 6
Nordeste / Northeast 20 12 16 24 17 11
Sudeste / Southeast 22 16 9 23 24 5
Sul / South 22 22 6 25 24 1
DEPENDêNCIA ADMINISTRATIvAADMinisTRATiVE
JURisDiCTiOn
municipal / municipal 22 14 13 23 22 7
Estadual / State 21 16 10 25 21 7
SÉRIEgRADE
4a série / 5o ano do Ensino Fundamental4th grade / 5th year elementary education 21 14 12 25 20 8
8a série / 9o ano do Ensino Fundamental8th grade / 9th year elementary education 22 16 13 22 21 6
2o ano do Ensino médio2nd year of Secondary education 20 17 10 24 21 7
COMPUTADOR INSTALADO
NO LABORATóRIO DE INFORMÁTICA
COMPUTER insTAllED AT iT lAb
Sim / yes 22 15 11 25 22 5
Não / No 18 15 14 19 20 15
INTERNET INSTALADA NO LABORATóRIO DE INFORMÁTICA
inTERnET AVAilAblE AT iT lAb
Sim / yes 22 15 11 25 22 4
Não / No 18 16 12 21 20 13
1 Base: 1.535 professores. Respostas estimuladas.1 base: 1,535 teachers. stimulated answers.
f3 PERCEPÇÃO DO PROFESSOR SOBRE CONTRIBUIÇÃO DAS TIC – ContinuaçãoteaCher’S PerCePtIoN oN the CoNtrIButIoN of ICt – ContinuaçãoPercentual sobre o total de professores 1Percentage of the total number of teachers 1

2010 Pesquisa TIC EducaçãoTABELAS DE RESuLTADOS – PROFESSORES
PO
RTu
Gu
ÊS
En
gli
sh
391
Percentual (%)Percentage (%)
Tornei-me um educador mais eficazi’ve become a more effective educator
Discordo totalmente
i totally disagree
Discordo em parte i partly
disagree
Não concordo
nem discordo i neither
agree nor disagree
Concordo em partei partly agree
Concordo totalmente
i totally agree
Não sabe Does not
know
TOTAL 7 4 9 32 42 7
SEXOgEnDER
Feminino / female 6 4 9 30 43 8
masculino / male 8 3 11 35 39 4
FAIXA ETÁRIAAgE gROUP
≤ 30 6 4 7 32 44 6
31-45 6 5 10 32 42 5
46+ 8 2 7 31 41 10
RENDA FAMILIARFAMilY inCOME
Até 3 Sm up to 3 mw 9 4 7 35 33 12
mais de 3 até 5 Sm more than 3 up to 5 mw 7 3 9 32 44 6
mais de 5 Sm more than 5 mw 6 4 10 30 44 6
RENDA PESSOALinDiViDUAl inCOME
Até 3 Sm up to 3 mw 6 3 8 32 42 9
mais de 3 até 5 Sm more than 3 up to 5 mw 7 4 10 31 43 5
mais de 5 Sm more than 5 mw 9 5 9 33 40 5
REGIÃOREgiOn
Norte / Centro-oeste / North / Center-west 7 3 11 31 41 7
Nordeste / Northeast 8 4 9 34 34 11
Sudeste / Southeast 7 4 9 33 41 5
Sul / South 3 4 4 25 63 1
DEPENDêNCIA ADMINISTRATIvAADMinisTRATiVE
JURisDiCTiOn
municipal / municipal 7 4 9 31 42 6
Estadual / State 7 4 9 32 42 7
SÉRIEgRADE
4a série / 5o ano do Ensino Fundamental4th grade / 5th year elementary education 6 4 9 31 43 8
8a série / 9o ano do Ensino Fundamental8th grade / 9th year elementary education 8 4 10 31 42 5
2o ano do Ensino médio2nd year of Secondary education 6 3 9 32 42 8
COMPUTADOR INSTALADO
NO LABORATóRIO DE INFORMÁTICA
COMPUTER insTAllED AT iT lAb
Sim / yes 6 4 8 32 45 5
Não / No 8 4 14 29 30 14
INTERNET INSTALADA NO LABORATóRIO DE INFORMÁTICA
inTERnET AVAilAblE AT iT lAb
Sim / yes 6 4 8 33 45 4
Não / No 8 5 11 28 35 13
1 Base: 1.535 professores. Respostas estimuladas.1 base: 1,535 teachers. stimulated answers.
f3 PERCEPÇÃO DO PROFESSOR SOBRE CONTRIBUIÇÃO DAS TIC – ContinuaçãoteaCher’S PerCePtIoN oN the CoNtrIButIoN of ICt – ContinuaçãoPercentual sobre o total de professores 1Percentage of the total number of teachers 1

Survey on ICT Education 2010TABLES OF RESuLTS – TEACHERS
PO
RTu
Gu
ÊS
En
gli
sh
392
Percentual (%)Percentage (%)
Tenho maior domínio do uso de computador e Interneti have better computer and internet skills
Discordo totalmente
i totally disagree
Discordo em parte i partly
disagree
Não concordo
nem discordo i neither
agree nor disagree
Concordo em partei partly agree
Concordo totalmente
i totally agree
Não sabe Does not
know
TOTAL 7 6 10 31 39 7
SEXOgEnDER
Feminino / female 7 7 10 31 37 8
masculino / male 7 3 9 29 48 3
FAIXA ETÁRIAAgE gROUP
≤ 30 7 3 11 25 48 6
31-45 7 6 9 32 41 6
46+ 9 7 10 31 32 10
RENDA FAMILIARFAMilY inCOME
Até 3 Sm up to 3 mw 13 8 11 30 25 13
mais de 3 até 5 Sm more than 3 up to 5 mw 7 7 10 31 39 6
mais de 5 Sm more than 5 mw 6 5 10 31 43 6
RENDA PESSOALinDiViDUAl inCOME
Até 3 Sm up to 3 mw 9 7 9 29 35 10
mais de 3 até 5 Sm more than 3 up to 5 mw 6 6 12 31 42 4
mais de 5 Sm more than 5 mw 7 4 8 34 42 5
REGIÃOREgiOn
Norte / Centro-oeste / North / Center-west 9 6 15 30 33 7
Nordeste / Northeast 10 9 11 27 31 11
Sudeste / Southeast 5 4 8 34 44 5
Sul / South 3 4 5 33 54 1
DEPENDêNCIA ADMINISTRATIvAADMinisTRATiVE
JURisDiCTiOn
municipal / municipal 9 7 9 30 38 7
Estadual / State 5 5 11 32 41 7
SÉRIEgRADE
4a série / 5o ano do Ensino Fundamental4th grade / 5th year elementary education 9 7 9 32 35 8
8a série / 9o ano do Ensino Fundamental8th grade / 9th year elementary education 8 6 11 31 38 6
2o ano do Ensino médio2nd year of Secondary education 3 4 11 30 44 8
COMPUTADOR INSTALADO
NO LABORATóRIO DE INFORMÁTICA
COMPUTER insTAllED AT iT lAb
Sim / yes 7 6 9 32 42 5
Não / No 8 6 15 28 27 16
INTERNET INSTALADA NO LABORATóRIO DE INFORMÁTICA
inTERnET AVAilAblE AT iT lAb
Sim / yes 6 5 8 32 44 4
Não / No 10 8 14 28 28 14
1 Base: 1.535 professores. Respostas estimuladas.1 base: 1,535 teachers. stimulated answers.
f3 PERCEPÇÃO DO PROFESSOR SOBRE CONTRIBUIÇÃO DAS TIC – ContinuaçãoteaCher’S PerCePtIoN oN the CoNtrIButIoN of ICt – ContinuaçãoPercentual sobre o total de professores 1Percentage of the total number of teachers 1

2010 Pesquisa TIC EducaçãoTABELAS DE RESuLTADOS – PROFESSORES
PO
RTu
Gu
ÊS
En
gli
sh
393
Percentual (%)Percentage (%)
Passei a organizar de outra maneira a aprendizagem dos alunosi’ve changed how i organize students’ learning
Discordo totalmente
i totally disagree
Discordo em parte i partly
disagree
Não concordo
nem discordo i neither
agree nor disagree
Concordo em partei partly agree
Concordo totalmente
i totally agree
Não sabe Does not
know
TOTAL 6 5 9 36 37 7
SEXOgEnDER
Feminino / female 6 5 9 34 38 8
masculino / male 8 4 11 41 33 3
FAIXA ETÁRIAAgE gROUP
≤ 30 6 5 10 34 39 6
31-45 5 5 10 38 37 5
46+ 8 5 8 33 36 10
RENDA FAMILIARFAMilY inCOME
Até 3 Sm up to 3 mw 10 4 9 36 30 12
mais de 3 até 5 Sm more than 3 up to 5 mw 5 5 9 35 40 6
mais de 5 Sm more than 5 mw 6 5 10 36 38 6
RENDA PESSOALinDiViDUAl inCOME
Até 3 Sm up to 3 mw 7 4 7 35 37 10
mais de 3 até 5 Sm more than 3 up to 5 mw 5 5 11 35 40 5
mais de 5 Sm more than 5 mw 8 6 9 39 33 5
REGIÃOREgiOn
Norte / Centro-oeste / North / Center-west 7 6 15 33 34 6
Nordeste / Northeast 7 4 9 36 32 12
Sudeste / Southeast 5 6 9 38 37 5
Sul / South 4 4 4 34 53 1
DEPENDêNCIA ADMINISTRATIvAADMinisTRATiVE
JURisDiCTiOn
municipal / municipal 7 5 9 35 37 7
Estadual / State 5 4 10 37 37 7
SÉRIEgRADE
4a série / 5o ano do Ensino Fundamental4th grade / 5th year elementary education 6 5 9 35 37 8
8a série / 9o ano do Ensino Fundamental8th grade / 9th year elementary education 8 4 11 34 37 6
2o ano do Ensino médio2nd year of Secondary education 4 4 10 38 37 8
COMPUTADOR INSTALADO
NO LABORATóRIO DE INFORMÁTICA
COMPUTER insTAllED AT iT lAb
Sim / yes 6 5 8 36 40 5
Não / No 5 6 16 36 23 15
INTERNET INSTALADA NO LABORATóRIO DE INFORMÁTICA
inTERnET AVAilAblE AT iT lAb
Sim / yes 6 4 8 37 42 4
Não / No 7 6 14 34 27 13
1 Base: 1.535 professores. Respostas estimuladas.1 base: 1,535 teachers. stimulated answers.
f3 PERCEPÇÃO DO PROFESSOR SOBRE CONTRIBUIÇÃO DAS TIC – ContinuaçãoteaCher’S PerCePtIoN oN the CoNtrIButIoN of ICt – ContinuaçãoPercentual sobre o total de professores 1Percentage of the total number of teachers 1
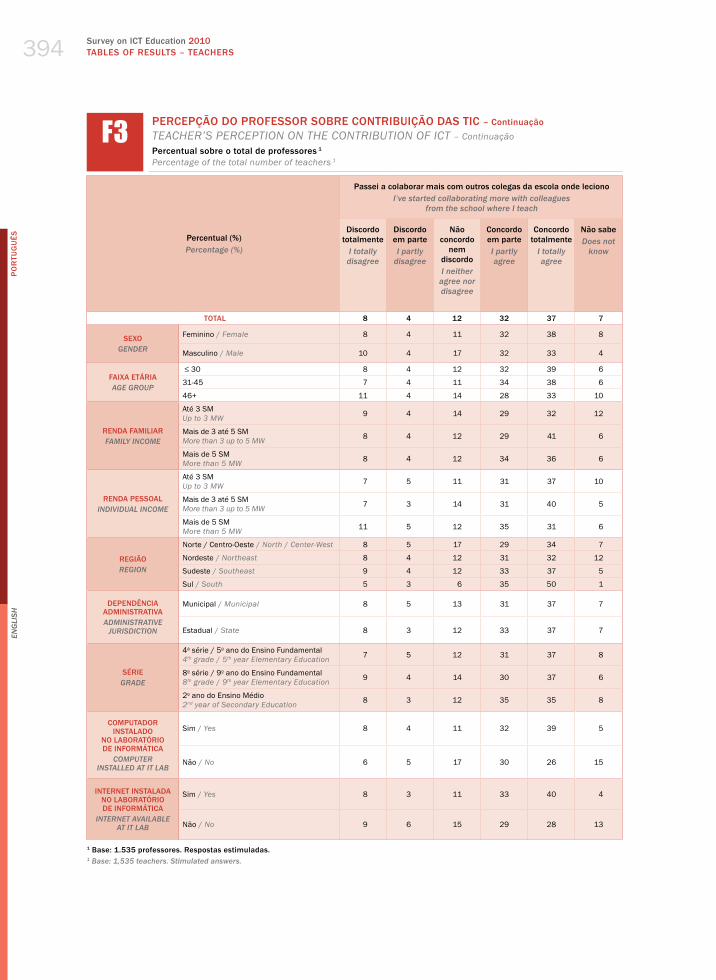
Survey on ICT Education 2010TABLES OF RESuLTS – TEACHERS
PO
RTu
Gu
ÊS
En
gli
sh
394
Percentual (%)Percentage (%)
Passei a colaborar mais com outros colegas da escola onde lecionoi’ve started collaborating more with colleagues
from the school where i teach
Discordo totalmente
i totally disagree
Discordo em parte i partly
disagree
Não concordo
nem discordo i neither
agree nor disagree
Concordo em partei partly agree
Concordo totalmente
i totally agree
Não sabe Does not
know
TOTAL 8 4 12 32 37 7
SEXOgEnDER
Feminino / female 8 4 11 32 38 8
masculino / male 10 4 17 32 33 4
FAIXA ETÁRIAAgE gROUP
≤ 30 8 4 12 32 39 6
31-45 7 4 11 34 38 6
46+ 11 4 14 28 33 10
RENDA FAMILIARFAMilY inCOME
Até 3 Sm up to 3 mw 9 4 14 29 32 12
mais de 3 até 5 Sm more than 3 up to 5 mw 8 4 12 29 41 6
mais de 5 Sm more than 5 mw 8 4 12 34 36 6
RENDA PESSOALinDiViDUAl inCOME
Até 3 Sm up to 3 mw 7 5 11 31 37 10
mais de 3 até 5 Sm more than 3 up to 5 mw 7 3 14 31 40 5
mais de 5 Sm more than 5 mw 11 5 12 35 31 6
REGIÃOREgiOn
Norte / Centro-oeste / North / Center-west 8 5 17 29 34 7
Nordeste / Northeast 8 4 12 31 32 12
Sudeste / Southeast 9 4 12 33 37 5
Sul / South 5 3 6 35 50 1
DEPENDêNCIA ADMINISTRATIvAADMinisTRATiVE
JURisDiCTiOn
municipal / municipal 8 5 13 31 37 7
Estadual / State 8 3 12 33 37 7
SÉRIEgRADE
4a série / 5o ano do Ensino Fundamental4th grade / 5th year elementary education 7 5 12 31 37 8
8a série / 9o ano do Ensino Fundamental8th grade / 9th year elementary education 9 4 14 30 37 6
2o ano do Ensino médio2nd year of Secondary education 8 3 12 35 35 8
COMPUTADOR INSTALADO
NO LABORATóRIO DE INFORMÁTICA
COMPUTER insTAllED AT iT lAb
Sim / yes 8 4 11 32 39 5
Não / No 6 5 17 30 26 15
INTERNET INSTALADA NO LABORATóRIO DE INFORMÁTICA
inTERnET AVAilAblE AT iT lAb
Sim / yes 8 3 11 33 40 4
Não / No 9 6 15 29 28 13
1 Base: 1.535 professores. Respostas estimuladas.1 base: 1,535 teachers. stimulated answers.
f3 PERCEPÇÃO DO PROFESSOR SOBRE CONTRIBUIÇÃO DAS TIC – ContinuaçãoteaCher’S PerCePtIoN oN the CoNtrIButIoN of ICt – ContinuaçãoPercentual sobre o total de professores 1Percentage of the total number of teachers 1

4Tabelas de resulTados
indicadores selecionados Para alunos,
coordenadores Pedagógicos e direTores
Tables of resulTsseleCTeD
inDiCATORs FOR sTUDenTs,
DiReCTORs OF sTUDies, AnD pRinCipAls

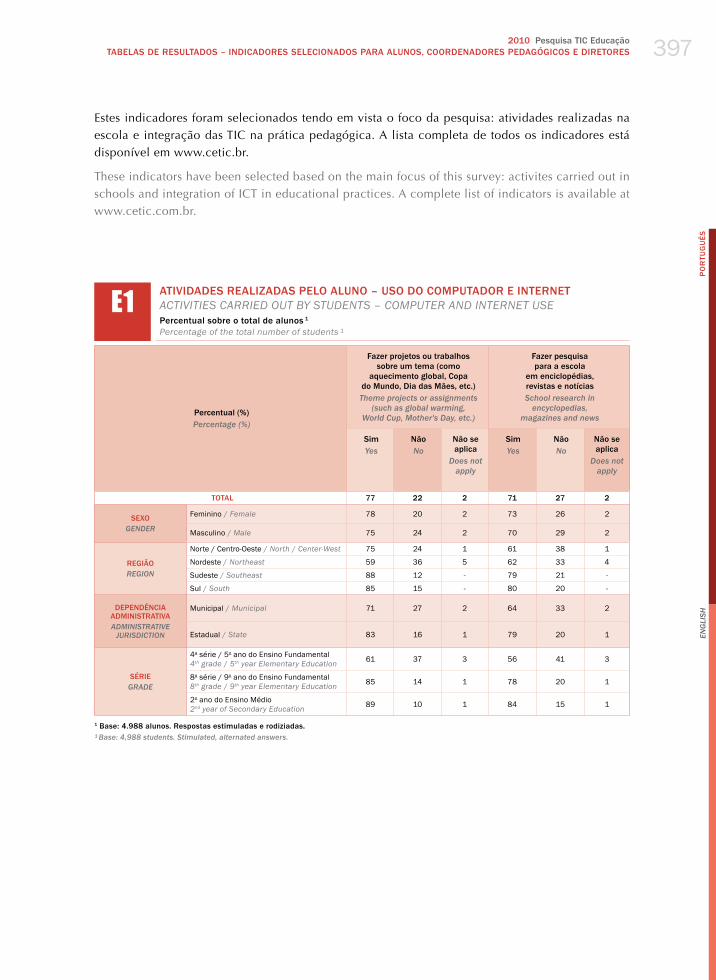
2010 Pesquisa TIC EducaçãoTABELAS DE RESuLTADOS – INDICADORES SELECIONADOS PARA ALuNOS, COORDENADORES PEDAGÓGICOS E DIRETORES
PO
RTu
Gu
ÊS
En
gli
sh
397
Estes indicadores foram selecionados tendo em vista o foco da pesquisa: atividades realizadas na escola e integração das TIC na prática pedagógica. A lista completa de todos os indicadores está disponível em www.cetic.br.
These indicators have been selected based on the main focus of this survey: activites carried out in schools and integration of ICT in educational practices. A complete list of indicators is available at www.cetic.com.br.
Percentual (%)Percentage (%)
Fazer projetos ou trabalhos sobre um tema (como
aquecimento global, Copa do Mundo, Dia das Mães, etc.)Theme projects or assignments
(such as global warming, World Cup, Mother's Day, etc.)
Fazer pesquisa para a escola
em enciclopédias, revistas e notíciasschool research in
encyclopedias, magazines and news
SimYes
Nãono
Não se aplica
Does not apply
SimYes
Nãono
Não se aplica
Does not apply
TOTAL 77 22 2 71 27 2
SEXOgEnDER
Feminino / female 78 20 2 73 26 2
masculino / male 75 24 2 70 29 2
REGIÃOREgiOn
Norte / Centro-oeste / North / Center-west 75 24 1 61 38 1
Nordeste / Northeast 59 36 5 62 33 4
Sudeste / Southeast 88 12 - 79 21 -
Sul / South 85 15 - 80 20 -
DEPENDêNCIA ADMINISTRATIvAADMinisTRATiVE
JURisDiCTiOn
municipal / municipal 71 27 2 64 33 2
Estadual / State 83 16 1 79 20 1
SÉRIEgRADE
4a série / 5o ano do Ensino Fundamental4th grade / 5th year elementary education 61 37 3 56 41 3
8a série / 9o ano do Ensino Fundamental8th grade / 9th year elementary education 85 14 1 78 20 1
2o ano do Ensino médio2nd year of Secondary education 89 10 1 84 15 1
1 Base: 4.988 alunos. Respostas estimuladas e rodiziadas.¹ base: 4,988 students. stimulated, alternated answers.
E1 ATIvIDADES REALIZADAS PELO ALUNO – USO DO COMPUTADOR E INTERNETaCtIvItIeS CarrIed out By StudeNtS – ComPuter aNd INterNet uSePercentual sobre o total de alunos 1 Percentage of the total number of students ¹

Survey on ICT Education 2010TABLES OF RESuLTS – SELECTED INDICATORS FOR STuDENTS, DIRECTOR OF STuDIES, AND PRINCIPALS
PO
RTu
Gu
ÊS
En
gli
sh
398
Percentual (%)Percentage (%)
Aprender a usar o computador e a Internet
learning to use computers and the internet
Escrever textos, fazer desenhos, maquetes, etc.
Writing texts, drawing, creating models, etc.
SimYes
Nãono
Não se aplica
Does not apply
SimYes
Nãono
Não se aplica
Does not apply
TOTAL 70 28 2 62 36 2
SEXOgEnDER
Feminino / female 69 29 2 64 35 2
masculino / male 71 27 2 61 37 2
REGIÃOREgiOn
Norte / Centro-oeste / North / Center-west 65 33 1 64 35 1
Nordeste / Northeast 60 36 5 49 46 5
Sudeste / Southeast 81 18 1 72 27 1
Sul / South 70 29 1 65 34 1
DEPENDêNCIA ADMINISTRATIvAADMinisTRATiVE
JURisDiCTiOn
municipal / municipal 66 31 3 60 38 2
Estadual / State 74 24 2 65 33 1
SÉRIEgRADE
4a série / 5o ano do Ensino Fundamental4th grade / 5th year elementary education 60 37 3 54 43 3
8a série / 9o ano do Ensino Fundamental8th grade / 9th year elementary education 75 24 1 67 32 1
2o ano do Ensino médio2nd year of Secondary education 78 21 2 69 30 1
1 Base: 4.988 alunos. Respostas estimuladas e rodiziadas.¹ base: 4,988 students. stimulated, alternated answers.
E1 ATIvIDADES REALIZADAS PELO ALUNO – USO DO COMPUTADOR E INTERNET – ContinuaçãoaCtIvItIeS CarrIed out By StudeNtS – ComPuter aNd INterNet uSe – ContinuationPercentual sobre o total de alunos 1 Percentage of the total number of students ¹

2010 Pesquisa TIC EducaçãoTABELAS DE RESuLTADOS – INDICADORES SELECIONADOS PARA ALuNOS, COORDENADORES PEDAGÓGICOS E DIRETORES
PO
RTu
Gu
ÊS
En
gli
sh
399
Percentual (%)Percentage (%)
Fazer lição / exercícios que o professor passa
Doing homework / exercises assigned by the teacher
Jogar jogos educativos
Playing educational games
SimYes
Nãono
Não se aplica
Does not apply
SimYes
Nãono
Não se aplica
Does not apply
TOTAL 57 41 2 56 42 2
SEXOgEnDER
Feminino / female 57 41 2 54 44 2
masculino / male 57 41 2 59 39 2
REGIÃOREgiOn
Norte / Centro-oeste / North / Center-west 56 43 1 56 43 1
Nordeste / Northeast 46 49 5 45 50 5
Sudeste / Southeast 67 32 1 63 36 1
Sul / South 57 42 1 62 37 1
DEPENDêNCIA ADMINISTRATIvAADMinisTRATiVE
JURisDiCTiOn
municipal / municipal 52 45 2 61 37 2
Estadual / State 63 36 1 50 48 2
SÉRIEgRADE
4a série / 5o ano do Ensino Fundamental4th grade / 5th year elementary education 46 51 3 66 32 2
8a série / 9o ano do Ensino Fundamental8th grade / 9th year elementary education 64 35 1 56 43 2
2o ano do Ensino médio2nd year of Secondary education 64 34 1 42 55 2
1 Base: 4.988 alunos. Respostas estimuladas e rodiziadas.¹ base: 4,988 students. stimulated, alternated answers.
E1 ATIvIDADES REALIZADAS PELO ALUNO – USO DO COMPUTADOR E INTERNET – ContinuaçãoaCtIvItIeS CarrIed out By StudeNtS – ComPuter aNd INterNet uSe – ContinuationPercentual sobre o total de alunos 1 Percentage of the total number of students ¹

Survey on ICT Education 2010TABLES OF RESuLTS – SELECTED INDICATORS FOR STuDENTS, DIRECTOR OF STuDIES, AND PRINCIPALS
PO
RTu
Gu
ÊS
En
gli
sh
400
Percentual (%)Percentage (%)
Fazer apresentações para os colegas de classePresenting to classmates
Fazer interpretação de textos
Reading comprehension
SimYes
Nãono
Não se aplica
Does not apply
SimYes
Nãono
Não se aplica
Does not apply
TOTAL 43 55 2 40 58 2
SEXOgEnDER
Feminino / female 43 55 2 40 58 2
masculino / male 44 54 2 40 58 2
REGIÃOREgiOn
Norte / Centro-oeste / North / Center-west 42 56 1 41 57 1
Nordeste / Northeast 32 64 5 32 64 5
Sudeste / Southeast 47 51 1 47 52 1
Sul / South 55 44 - 37 62 1
DEPENDêNCIA ADMINISTRATIvAADMinisTRATiVE
JURisDiCTiOn
municipal / municipal 37 60 3 37 60 3
Estadual / State 50 48 1 43 56 1
SÉRIEgRADE
4a série / 5o ano do Ensino Fundamental4th grade / 5th year elementary education 23 73 3 32 65 3
8a série / 9o ano do Ensino Fundamental8th grade / 9th year elementary education 53 45 2 44 54 2
2o ano do Ensino médio2nd year of Secondary education 58 40 1 45 53 2
1 Base: 4.988 alunos. Respostas estimuladas e rodiziadas.¹ base: 4,988 students. stimulated, alternated answers.
E1 ATIvIDADES REALIZADAS PELO ALUNO – USO DO COMPUTADOR E INTERNET – ContinuaçãoaCtIvItIeS CarrIed out By StudeNtS – ComPuter aNd INterNet uSe – ContinuationPercentual sobre o total de alunos 1 Percentage of the total number of students ¹
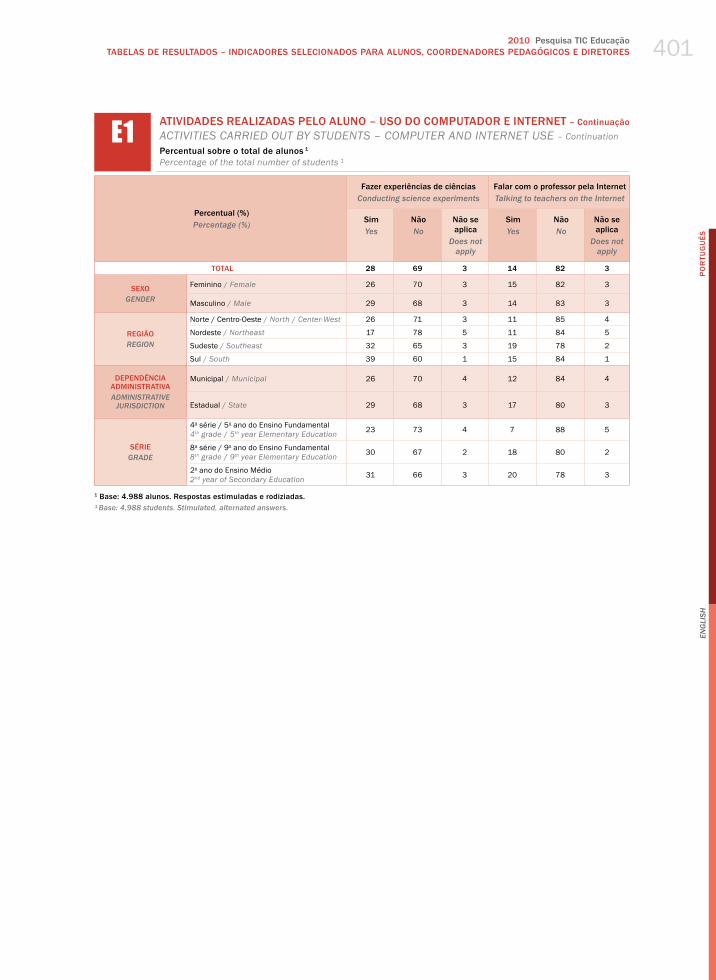
2010 Pesquisa TIC EducaçãoTABELAS DE RESuLTADOS – INDICADORES SELECIONADOS PARA ALuNOS, COORDENADORES PEDAGÓGICOS E DIRETORES
PO
RTu
Gu
ÊS
En
gli
sh
401
Percentual (%)Percentage (%)
Fazer experiências de ciênciasConducting science experiments
Falar com o professor pela InternetTalking to teachers on the internet
SimYes
Nãono
Não se aplica
Does not apply
SimYes
Nãono
Não se aplica
Does not apply
TOTAL 28 69 3 14 82 3
SEXOgEnDER
Feminino / female 26 70 3 15 82 3
masculino / male 29 68 3 14 83 3
REGIÃOREgiOn
Norte / Centro-oeste / North / Center-west 26 71 3 11 85 4
Nordeste / Northeast 17 78 5 11 84 5
Sudeste / Southeast 32 65 3 19 78 2
Sul / South 39 60 1 15 84 1
DEPENDêNCIA ADMINISTRATIvAADMinisTRATiVE
JURisDiCTiOn
municipal / municipal 26 70 4 12 84 4
Estadual / State 29 68 3 17 80 3
SÉRIEgRADE
4a série / 5o ano do Ensino Fundamental4th grade / 5th year elementary education 23 73 4 7 88 5
8a série / 9o ano do Ensino Fundamental8th grade / 9th year elementary education 30 67 2 18 80 2
2o ano do Ensino médio2nd year of Secondary education 31 66 3 20 78 3
1 Base: 4.988 alunos. Respostas estimuladas e rodiziadas.¹ base: 4,988 students. stimulated, alternated answers.
E1 ATIvIDADES REALIZADAS PELO ALUNO – USO DO COMPUTADOR E INTERNET – ContinuaçãoaCtIvItIeS CarrIed out By StudeNtS – ComPuter aNd INterNet uSe – ContinuationPercentual sobre o total de alunos 1 Percentage of the total number of students ¹
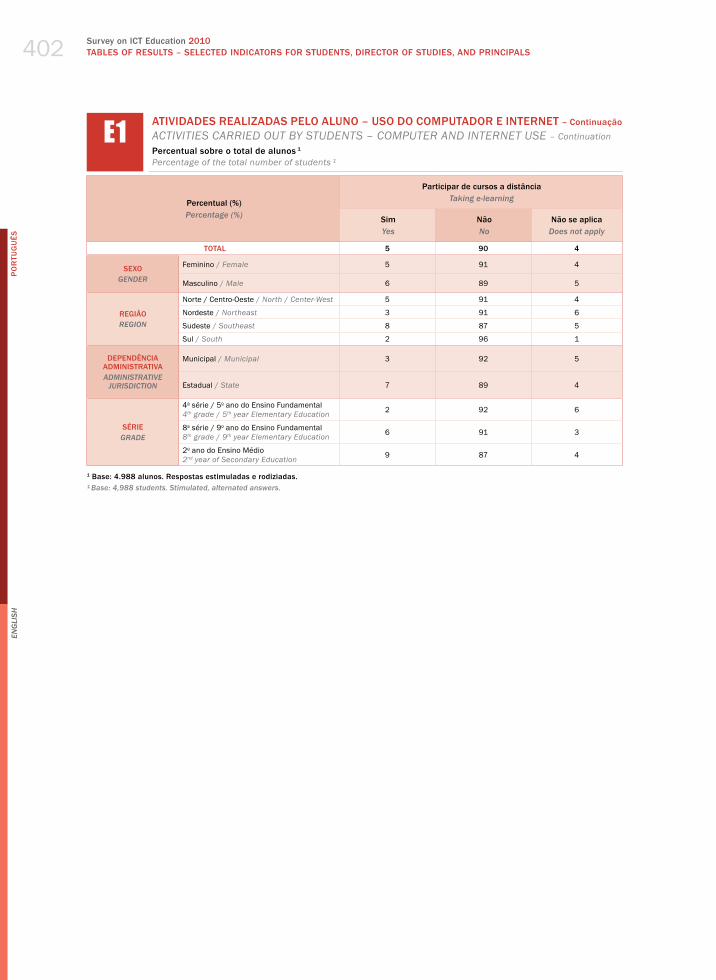
Survey on ICT Education 2010TABLES OF RESuLTS – SELECTED INDICATORS FOR STuDENTS, DIRECTOR OF STuDIES, AND PRINCIPALS
PO
RTu
Gu
ÊS
En
gli
sh
402
Percentual (%)Percentage (%)
Participar de cursos a distânciaTaking e-learning
SimYes
Nãono
Não se aplicaDoes not apply
TOTAL 5 90 4
SEXOgEnDER
Feminino / female 5 91 4
masculino / male 6 89 5
REGIÃOREgiOn
Norte / Centro-oeste / North / Center-west 5 91 4
Nordeste / Northeast 3 91 6
Sudeste / Southeast 8 87 5
Sul / South 2 96 1
DEPENDêNCIA ADMINISTRATIvAADMinisTRATiVE
JURisDiCTiOn
municipal / municipal 3 92 5
Estadual / State 7 89 4
SÉRIEgRADE
4a série / 5o ano do Ensino Fundamental4th grade / 5th year elementary education 2 92 6
8a série / 9o ano do Ensino Fundamental8th grade / 9th year elementary education 6 91 3
2o ano do Ensino médio2nd year of Secondary education 9 87 4
1 Base: 4.988 alunos. Respostas estimuladas e rodiziadas.¹ base: 4,988 students. stimulated, alternated answers.
E1 ATIvIDADES REALIZADAS PELO ALUNO – USO DO COMPUTADOR E INTERNET – ContinuaçãoaCtIvItIeS CarrIed out By StudeNtS – ComPuter aNd INterNet uSe – ContinuationPercentual sobre o total de alunos 1 Percentage of the total number of students ¹
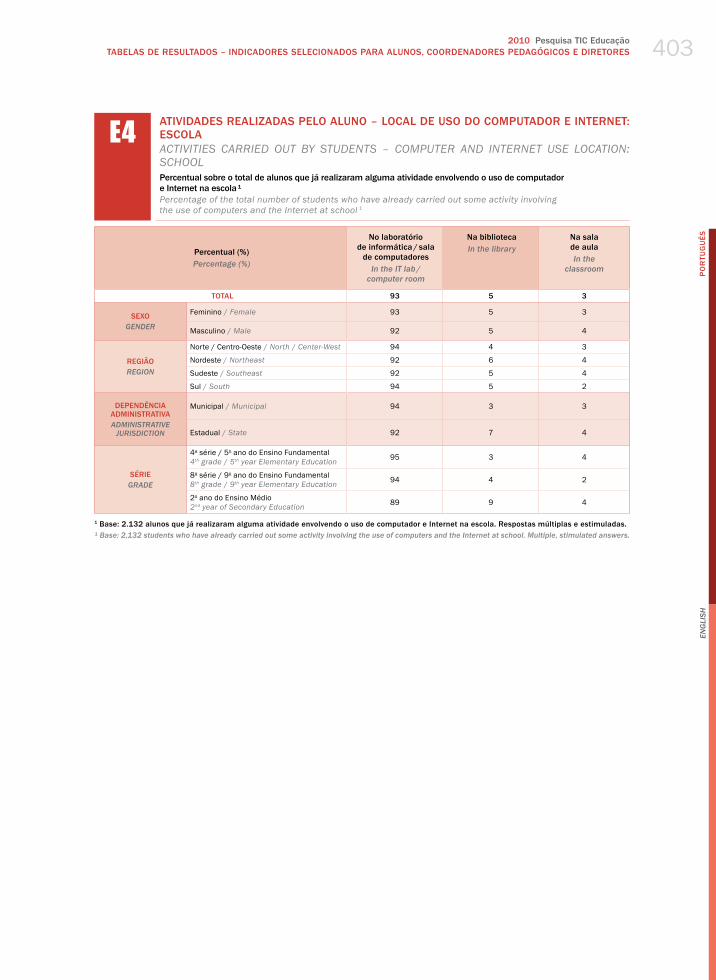
2010 Pesquisa TIC EducaçãoTABELAS DE RESuLTADOS – INDICADORES SELECIONADOS PARA ALuNOS, COORDENADORES PEDAGÓGICOS E DIRETORES
PO
RTu
Gu
ÊS
En
gli
sh
403
Percentual (%)Percentage (%)
No laboratório de informática / sala
de computadoresin the iT lab /
computer room
Na bibliotecain the library
Na sala de aulain the
classroom
TOTAL 93 5 3
SEXOgEnDER
Feminino / female 93 5 3
masculino / male 92 5 4
REGIÃOREgiOn
Norte / Centro-oeste / North / Center-west 94 4 3
Nordeste / Northeast 92 6 4
Sudeste / Southeast 92 5 4
Sul / South 94 5 2
DEPENDêNCIA ADMINISTRATIvAADMinisTRATiVE
JURisDiCTiOn
municipal / municipal 94 3 3
Estadual / State 92 7 4
SÉRIEgRADE
4a série / 5o ano do Ensino Fundamental4th grade / 5th year elementary education 95 3 4
8a série / 9o ano do Ensino Fundamental8th grade / 9th year elementary education 94 4 2
2o ano do Ensino médio2nd year of Secondary education 89 9 4
1 Base: 2.132 alunos que já realizaram alguma atividade envolvendo o uso de computador e Internet na escola. Respostas múltiplas e estimuladas.¹ base: 2,132 students who have already carried out some activity involving the use of computers and the internet at school. Multiple, stimulated answers.
E4 ATIvIDADES REALIZADAS PELO ALUNO – LOCAL DE USO DO COMPUTADOR E INTERNET: ESCOLAaCtIvItIeS CarrIed out By StudeNtS – ComPuter aNd INterNet uSe loCatIoN: SChool Percentual sobre o total de alunos que já realizaram alguma atividade envolvendo o uso de computador e Internet na escola ¹Percentage of the total number of students who have already carried out some activity involving the use of computers and the Internet at school 1
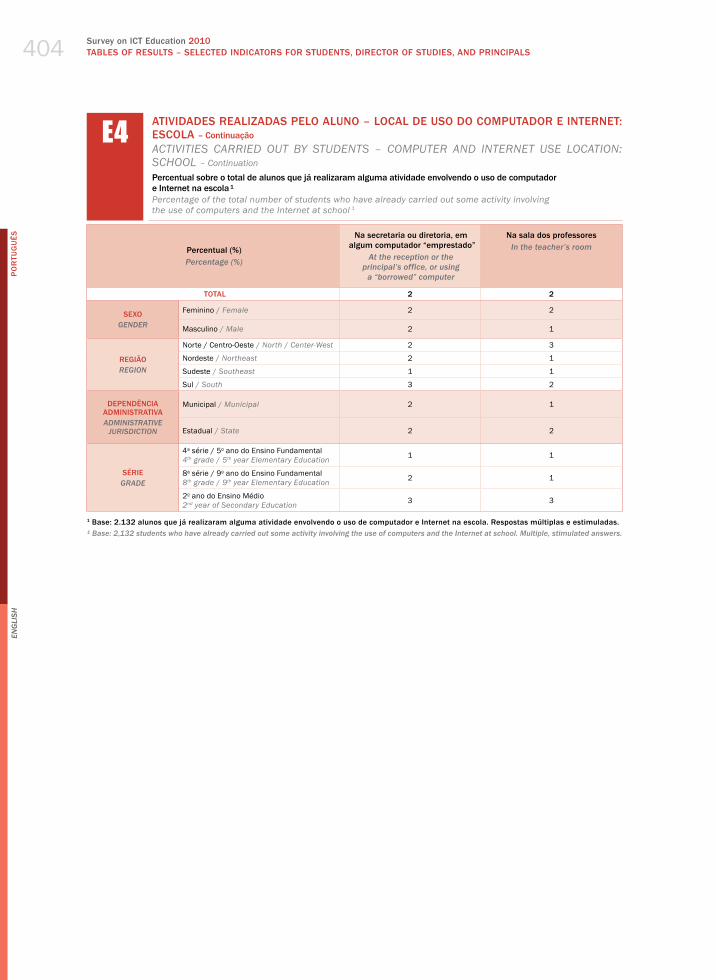
Survey on ICT Education 2010TABLES OF RESuLTS – SELECTED INDICATORS FOR STuDENTS, DIRECTOR OF STuDIES, AND PRINCIPALS
PO
RTu
Gu
ÊS
En
gli
sh
404
Percentual (%)Percentage (%)
Na secretaria ou diretoria, em algum computador “emprestado”
At the reception or the principal’s office, or using
a “borrowed” computer
Na sala dos professoresin the teacher’s room
TOTAL 2 2
SEXOgEnDER
Feminino / female 2 2
masculino / male 2 1
REGIÃOREgiOn
Norte / Centro-oeste / North / Center-west 2 3
Nordeste / Northeast 2 1
Sudeste / Southeast 1 1
Sul / South 3 2
DEPENDêNCIA ADMINISTRATIvAADMinisTRATiVE
JURisDiCTiOn
municipal / municipal 2 1
Estadual / State 2 2
SÉRIEgRADE
4a série / 5o ano do Ensino Fundamental4th grade / 5th year elementary education 1 1
8a série / 9o ano do Ensino Fundamental8th grade / 9th year elementary education 2 1
2o ano do Ensino médio2nd year of Secondary education 3 3
1 Base: 2.132 alunos que já realizaram alguma atividade envolvendo o uso de computador e Internet na escola. Respostas múltiplas e estimuladas.¹ base: 2,132 students who have already carried out some activity involving the use of computers and the internet at school. Multiple, stimulated answers.
E4 ATIvIDADES REALIZADAS PELO ALUNO – LOCAL DE USO DO COMPUTADOR E INTERNET: ESCOLA – ContinuaçãoaCtIvItIeS CarrIed out By StudeNtS – ComPuter aNd INterNet uSe loCatIoN: SChool – Continuation Percentual sobre o total de alunos que já realizaram alguma atividade envolvendo o uso de computador e Internet na escola ¹Percentage of the total number of students who have already carried out some activity involving the use of computers and the Internet at school 1

2010 Pesquisa TIC EducaçãoTABELAS DE RESuLTADOS – INDICADORES SELECIONADOS PARA ALuNOS, COORDENADORES PEDAGÓGICOS E DIRETORES
PO
RTu
Gu
ÊS
En
gli
sh
405
Percentual (%)Percentage (%)
Outros espaços da escolaOther places in the school
Não opinouDid not answer
TOTAL - -
SEXOgEnDER
Feminino / female - -
masculino / male - -
REGIÃOREgiOn
Norte / Centro-oeste / North / Center-west - -
Nordeste / Northeast - -
Sudeste / Southeast - -
Sul / South - -
DEPENDêNCIA ADMINISTRATIvAADMinisTRATiVE
JURisDiCTiOn
municipal / municipal - -
Estadual / State - -
SÉRIEgRADE
4a série / 5o ano do Ensino Fundamental4th grade / 5th year elementary education - -
8a série / 9o ano do Ensino Fundamental8th grade / 9th year elementary education - -
2o ano do Ensino médio2nd year of Secondary education - -
1 Base: 2.132 alunos que já realizaram alguma atividade envolvendo o uso de computador e Internet na escola. Respostas múltiplas e estimuladas.¹ base: 2,132 students who have already carried out some activity involving the use of computers and the internet at school. Multiple, stimulated answers.
E4 ATIvIDADES REALIZADAS PELO ALUNO – LOCAL DE USO DO COMPUTADOR E INTERNET: ESCOLA – ContinuaçãoaCtIvItIeS CarrIed out By StudeNtS – ComPuter aNd INterNet uSe loCatIoN: SChool – Continuation Percentual sobre o total de alunos que já realizaram alguma atividade envolvendo o uso de computador e Internet na escola ¹Percentage of the total number of students who have already carried out some activity involving the use of computers and the Internet at school 1

Survey on ICT Education 2010TABLES OF RESuLTS – SELECTED INDICATORS FOR STuDENTS, DIRECTOR OF STuDIES, AND PRINCIPALS
PO
RTu
Gu
ÊS
En
gli
sh
406
Percentual (%)Percentage (%)
Média Average
As tecnologias de informação e comunicação são consideradas relevantes em nossa escolainformation and communication technologies
are regarded as relevant in our school
Discordo totalmente
i totally disagree
Discordo em parte i partly
disagree
Não concordo
nem discordoi neither
agree nor disagree
Concordo em partei partly agree
Concordo totalmente
i totally agree
TOTAL 4,4 5 2 3 24 66
SEXOgEnDER
Feminino / female 4,4 5 2 3 25 65
masculino / male 4,4 5 6 3 14 71
FAIXA ETÁRIAAgE gROUP
≤ 30 4,0 16 4 - 25 55
31-45 4,4 5 3 3 22 67
46+ 4,5 5 1 2 26 66
RENDA FAMILIARFAMilY inCOME
Até 3 Sm up to 3 mw 3,9 19 3 3 16 58
mais de 3 até 5 Sm more than 3 up to 5 mw 4,5 5 2 3 18 72
mais de 5 Sm more than 5 mw 4,4 4 3 2 27 64
RENDA PESSOALinDiViDUAl inCOME
Até 3 Sm up to 3 mw 4,3 10 2 5 19 64
mais de 3 até 5 Sm more than 3 up to 5 mw 4,5 4 2 2 23 70
mais de 5 Sm more than 5 mw 4,4 3 3 1 31 61
REGIÃOREgiOn
Norte / Centro-oeste / North / Center-west 4,4 4 2 3 26 65
Nordeste / Northeast 4,2 8 6 3 22 61
Sudeste / Southeast 4,5 5 1 1 25 67
Sul / South 4,5 3 2 4 20 70
DEPENDêNCIA ADMINISTRATIvAADMinisTRATiVE
JURisDiCTiOn
municipal / municipal 4,3 8 3 3 22 65
Estadual / State 4,5 3 2 3 25 67
COMPUTADOR INSTALADO
NO LABORATóRIO DE INFORMÁTICA
COMPUTER insTAllED AT iT lAb
Sim / yes 4,4 5 3 2 24 67
Não / No 4,3 7 2 7 20 64
INTERNET INSTALADA NO LABORATóRIO DE INFORMÁTICA
inTERnET AVAilAblE AT iT lAb
Sim / yes 4,5 4 3 2 24 67
Não / No 4,3 8 2 4 22 65
1 Base: 421 coordenadores pedagógicos. Respostas estimuladas e rodiziadas.¹ base: 421 directors of studies. stimulated, alternated answers.
C3 PERCEPÇÃO DOS COORDENADORES PEDAGóGICOS SOBRE O USO DO COMPUTADOR E DA INTERNET NA ESCOLAdIreCtor of StudIeS’ PerCePtIoN oN the uSe of ComPuterS aNd the INterNet at SChool Percentual sobre o total de coordenadores pedagógicos ¹Percentage of the total number of directors of studies 1

2010 Pesquisa TIC EducaçãoTABELAS DE RESuLTADOS – INDICADORES SELECIONADOS PARA ALuNOS, COORDENADORES PEDAGÓGICOS E DIRETORES
PO
RTu
Gu
ÊS
En
gli
sh
407
C3 PERCEPÇÃO DOS COORDENADORES PEDAGóGICOS SOBRE O USO DO COMPUTADOR E DA INTERNET NA ESCOLA – ContinuaçãodIreCtor of StudIeS’ PerCePtIoN oN the uSe of ComPuterS aNd the INterNet at SChool – Continuation Percentual sobre o total de coordenadores pedagógicos ¹Percentage of the total number of directors of studies 1
Percentual (%)Percentage (%)
Média Average
Nossa escola integrou as TIC na maioria das práticas de ensino-aprendizagem
Our school has integrated iCT into most of our teaching-learning practices
Discordo totalmente
i totally disagree
Discordo em parte i partly
disagree
Não concordo
nem discordoi neither
agree nor disagree
Concordo em partei partly agree
Concordo totalmente
i totally agree
TOTAL 3,7 11 10 8 39 31
SEXOgEnDER
Feminino / female 3,7 12 10 9 39 30
masculino / male 3,9 6 11 2 46 34
FAIXA ETÁRIAAgE gROUP
≤ 30 3,5 12 7 17 44 19
31-45 3,6 12 11 8 41 28
46+ 3,8 9 10 8 35 38
RENDA FAMILIARFAMilY inCOME
Até 3 Sm up to 3 mw 3,1 31 9 14 15 32
mais de 3 até 5 Sm more than 3 up to 5 mw 3,6 14 10 6 36 33
mais de 5 Sm more than 5 mw 3,8 8 11 9 44 29
RENDA PESSOALinDiViDUAl inCOME
Até 3 Sm up to 3 mw 3,5 17 10 8 34 32
mais de 3 até 5 Sm more than 3 up to 5 mw 3,7 10 11 9 39 31
mais de 5 Sm more than 5 mw 3,8 6 10 9 47 28
REGIÃOREgiOn
Norte / Centro-oeste / North / Center-west 3,9 7 6 14 37 35
Nordeste / Northeast 3,2 24 11 8 31 26
Sudeste / Southeast 3,7 8 12 8 42 29
Sul / South 4,0 5 9 3 46 37
DEPENDêNCIA ADMINISTRATIvAADMinisTRATiVE
JURisDiCTiOn
municipal / municipal 3,5 16 10 9 35 30
Estadual / State 3,8 6 10 8 44 31
COMPUTADOR INSTALADO
NO LABORATóRIO DE INFORMÁTICA
COMPUTER insTAllED AT iT lAb
Sim / yes 3,9 8 9 5 44 34
Não / No 2,9 24 15 22 20 19
INTERNET INSTALADA NO LABORATóRIO DE INFORMÁTICA
inTERnET AVAilAblE AT iT lAb
Sim / yes 3,9 7 8 5 45 34
Não / No 3,2 20 15 15 26 23
1 Base: 421 coordenadores pedagógicos. Respostas estimuladas e rodiziadas.¹ base: 421 directors of studies. stimulated, alternated answers.

Survey on ICT Education 2010TABLES OF RESuLTS – SELECTED INDICATORS FOR STuDENTS, DIRECTOR OF STuDIES, AND PRINCIPALS
PO
RTu
Gu
ÊS
En
gli
sh
408
Percentual (%)Percentage (%)
Média Average
Começamos (recentemente) a usar as TIC no ensino-aprendizagem dos conteúdos escolares
We have (recently) started using iCT in teaching our school syllabus
Discordo totalmente
i totally disagree
Discordo em parte i partly
disagree
Não concordo
nem discordoi neither
agree nor disagree
Concordo em partei partly agree
Concordo totalmente
i totally agree
TOTAL 3,5 16 12 8 33 30
SEXOgEnDER
Feminino / female 3,5 16 12 9 34 29
masculino / male 3,6 14 14 6 28 38
FAIXA ETÁRIAAgE gROUP
≤ 30 3,3 19 6 14 52 9
31-45 3,5 17 10 9 36 29
46+ 3,5 14 18 7 26 35
RENDA FAMILIARFAMilY inCOME
Até 3 Sm up to 3 mw 3,1 35 8 3 18 36
mais de 3 até 5 Sm more than 3 up to 5 mw 3,5 16 12 7 36 29
mais de 5 Sm more than 5 mw 3,5 14 13 10 34 29
RENDA PESSOALinDiViDUAl inCOME
Até 3 Sm up to 3 mw 3,4 21 9 7 34 29
mais de 3 até 5 Sm more than 3 up to 5 mw 3,5 13 16 10 30 31
mais de 5 Sm more than 5 mw 3,5 15 10 9 39 27
REGIÃOREgiOn
Norte / Centro-oeste / North / Center-west 3,7 10 11 7 45 28
Nordeste / Northeast 3,3 25 10 3 32 30
Sudeste / Southeast 3,4 17 13 13 31 25
Sul / South 3,8 9 15 6 29 41
DEPENDêNCIA ADMINISTRATIvAADMinisTRATiVE
JURisDiCTiOn
municipal / municipal 3,5 19 10 10 30 32
Estadual / State 3,5 13 15 7 37 27
COMPUTADOR INSTALADO
NO LABORATóRIO DE INFORMÁTICA
COMPUTER insTAllED AT iT lAb
Sim / yes 3,7 11 13 6 36 33
Não / No 2,7 35 9 19 22 16
INTERNET INSTALADA NO LABORATóRIO DE INFORMÁTICA
inTERnET AVAilAblE AT iT lAb
Sim / yes 3,7 11 13 6 36 34
Não / No 3,1 26 11 14 28 22
1 Base: 421 coordenadores pedagógicos. Respostas estimuladas e rodiziadas.¹ base: 421 directors of studies. stimulated, alternated answers.
C3 PERCEPÇÃO DOS COORDENADORES PEDAGóGICOS SOBRE O USO DO COMPUTADOR E DA INTERNET NA ESCOLA – ContinuaçãodIreCtor of StudIeS’ PerCePtIoN oN the uSe of ComPuterS aNd the INterNet at SChool – Continuation Percentual sobre o total de coordenadores pedagógicos ¹Percentage of the total number of directors of studies 1

2010 Pesquisa TIC EducaçãoTABELAS DE RESuLTADOS – INDICADORES SELECIONADOS PARA ALuNOS, COORDENADORES PEDAGÓGICOS E DIRETORES
PO
RTu
Gu
ÊS
En
gli
sh
409
Percentual (%)Percentage (%)
Média Average
Ainda não sabemos quais ferramentas de TIC são úteis para nossa escola
We still don’t know which iCT are useful for our school
Discordo totalmente
i totally disagree
Discordo em parte i partly
disagree
Não concordo
nem discordoi neither
agree nor disagree
Concordo em partei partly agree
Concordo totalmente
i totally agree
TOTAL 2,6 35 21 7 24 13
SEXOgEnDER
Feminino / female 2,6 34 21 7 24 14
masculino / male 2,3 43 24 4 20 8
FAIXA ETÁRIAAgE gROUP
≤ 30 2,5 32 22 17 24 4
31-45 2,5 40 17 6 22 15
46+ 2,7 25 28 6 28 12
RENDA FAMILIARFAMilY inCOME
Até 3 Sm up to 3 mw 3,2 24 16 8 16 36
mais de 3 até 5 Sm more than 3 up to 5 mw 2,6 37 17 6 29 10
mais de 5 Sm more than 5 mw 2,5 35 23 7 23 12
RENDA PESSOALinDiViDUAl inCOME
Até 3 Sm up to 3 mw 2,6 37 21 6 19 17
mais de 3 até 5 Sm more than 3 up to 5 mw 2,7 32 21 7 29 11
mais de 5 Sm more than 5 mw 2,6 36 21 8 22 13
REGIÃOREgiOn
Norte / Centro-oeste / North / Center-west 2,6 29 24 14 26 7
Nordeste / Northeast 2,7 32 20 6 27 15
Sudeste / Southeast 2,6 41 14 6 22 17
Sul / South 2,5 30 33 3 24 10
DEPENDêNCIA ADMINISTRATIvAADMinisTRATiVE
JURisDiCTiOn
municipal / municipal 2,7 34 17 7 25 17
Estadual / State 2,5 35 26 7 23 10
COMPUTADOR INSTALADO
NO LABORATóRIO DE INFORMÁTICA
COMPUTER insTAllED AT iT lAb
Sim / yes 2,5 36 22 6 26 10
Não / No 2,9 28 18 12 15 26
INTERNET INSTALADA NO LABORATóRIO DE INFORMÁTICA
inTERnET AVAilAblE AT iT lAb
Sim / yes 2,5 36 23 5 26 10
Não / No 2,8 32 18 10 20 20
1 Base: 421 coordenadores pedagógicos. Respostas estimuladas e rodiziadas.¹ base: 421 directors of studies. stimulated, alternated answers.
C3 PERCEPÇÃO DOS COORDENADORES PEDAGóGICOS SOBRE O USO DO COMPUTADOR E DA INTERNET NA ESCOLA – ContinuaçãodIreCtor of StudIeS’ PerCePtIoN oN the uSe of ComPuterS aNd the INterNet at SChool – Continuation Percentual sobre o total de coordenadores pedagógicos ¹Percentage of the total number of directors of studies 1
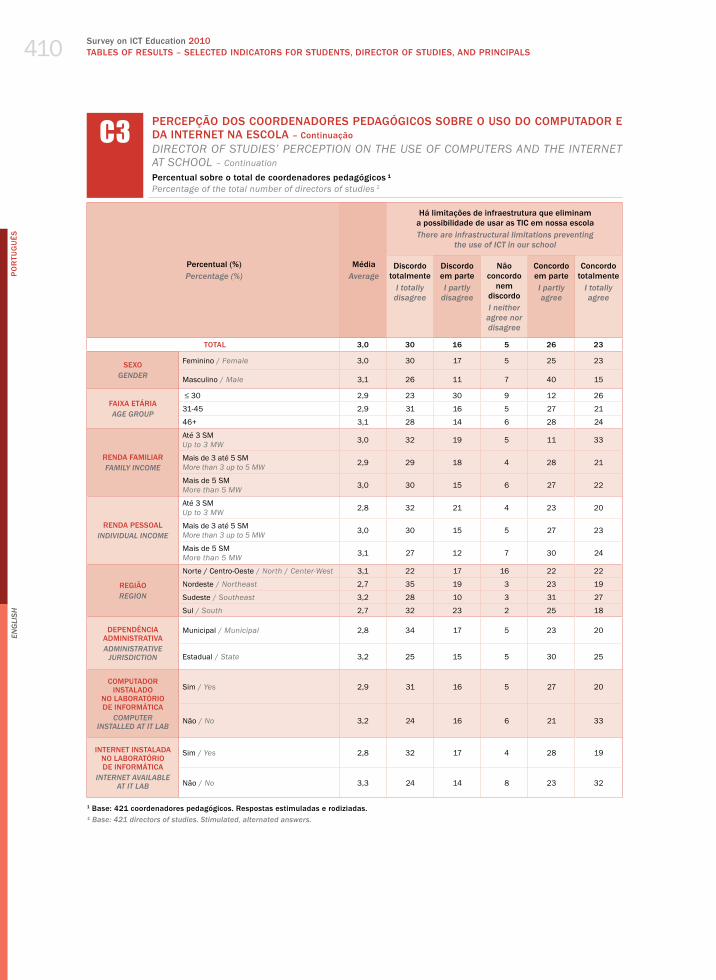
Survey on ICT Education 2010TABLES OF RESuLTS – SELECTED INDICATORS FOR STuDENTS, DIRECTOR OF STuDIES, AND PRINCIPALS
PO
RTu
Gu
ÊS
En
gli
sh
410
Percentual (%)Percentage (%)
Média Average
Há limitações de infraestrutura que eliminam a possibilidade de usar as TIC em nossa escolaThere are infrastructural limitations preventing
the use of iCT in our school
Discordo totalmente
i totally disagree
Discordo em parte i partly
disagree
Não concordo
nem discordoi neither
agree nor disagree
Concordo em partei partly agree
Concordo totalmente
i totally agree
TOTAL 3,0 30 16 5 26 23
SEXOgEnDER
Feminino / female 3,0 30 17 5 25 23
masculino / male 3,1 26 11 7 40 15
FAIXA ETÁRIAAgE gROUP
≤ 30 2,9 23 30 9 12 26
31-45 2,9 31 16 5 27 21
46+ 3,1 28 14 6 28 24
RENDA FAMILIARFAMilY inCOME
Até 3 Sm up to 3 mw 3,0 32 19 5 11 33
mais de 3 até 5 Sm more than 3 up to 5 mw 2,9 29 18 4 28 21
mais de 5 Sm more than 5 mw 3,0 30 15 6 27 22
RENDA PESSOALinDiViDUAl inCOME
Até 3 Sm up to 3 mw 2,8 32 21 4 23 20
mais de 3 até 5 Sm more than 3 up to 5 mw 3,0 30 15 5 27 23
mais de 5 Sm more than 5 mw 3,1 27 12 7 30 24
REGIÃOREgiOn
Norte / Centro-oeste / North / Center-west 3,1 22 17 16 22 22
Nordeste / Northeast 2,7 35 19 3 23 19
Sudeste / Southeast 3,2 28 10 3 31 27
Sul / South 2,7 32 23 2 25 18
DEPENDêNCIA ADMINISTRATIvAADMinisTRATiVE
JURisDiCTiOn
municipal / municipal 2,8 34 17 5 23 20
Estadual / State 3,2 25 15 5 30 25
COMPUTADOR INSTALADO
NO LABORATóRIO DE INFORMÁTICA
COMPUTER insTAllED AT iT lAb
Sim / yes 2,9 31 16 5 27 20
Não / No 3,2 24 16 6 21 33
INTERNET INSTALADA NO LABORATóRIO DE INFORMÁTICA
inTERnET AVAilAblE AT iT lAb
Sim / yes 2,8 32 17 4 28 19
Não / No 3,3 24 14 8 23 32
1 Base: 421 coordenadores pedagógicos. Respostas estimuladas e rodiziadas.¹ base: 421 directors of studies. stimulated, alternated answers.
C3 PERCEPÇÃO DOS COORDENADORES PEDAGóGICOS SOBRE O USO DO COMPUTADOR E DA INTERNET NA ESCOLA – ContinuaçãodIreCtor of StudIeS’ PerCePtIoN oN the uSe of ComPuterS aNd the INterNet at SChool – Continuation Percentual sobre o total de coordenadores pedagógicos ¹Percentage of the total number of directors of studies 1

2010 Pesquisa TIC EducaçãoTABELAS DE RESuLTADOS – INDICADORES SELECIONADOS PARA ALuNOS, COORDENADORES PEDAGÓGICOS E DIRETORES
PO
RTu
Gu
ÊS
En
gli
sh
411
Percentual (%)Percentage (%)
Integração do uso da Internet em suas práticasintegration of the use of the internet in their activities
EstimulaEncourages
RequerRequires
Não requer nem estimula
neither requires nor encourages
TOTAL 76 17 7
SEXOgEnDER
Feminino / female 76 17 7
masculino / male 75 16 8
FAIXA ETÁRIAAgE gROUP
≤ 30 68 18 13
31-45 75 16 9
46+ 79 19 2
RENDA FAMILIARFAMilY inCOME
Até 3 Sm up to 3 mw 71 14 15
mais de 3 até 5 Sm more than 3 up to 5 mw 73 15 12
mais de 5 Sm more than 5 mw 77 18 4
RENDA PESSOALinDiViDUAl inCOME
Até 3 Sm up to 3 mw 76 13 11
mais de 3 até 5 Sm more than 3 up to 5 mw 76 19 5
mais de 5 Sm more than 5 mw 74 19 7
REGIÃOREgiOn
Norte / Centro-oeste / North / Center-west 79 14 7
Nordeste / Northeast 67 18 15
Sudeste / Southeast 76 18 5
Sul / South 83 16 1
DEPENDêNCIA ADMINISTRATIvAADMinisTRATiVE
JURisDiCTiOn
municipal / municipal 74 18 8
Estadual / State 78 16 6
COMPUTADOR INSTALADO
NO LABORATóRIO DE INFORMÁTICA
COMPUTER insTAllED AT iT lAb
Sim / yes 78 17 5
Não / No 66 18 16
INTERNET INSTALADA NO LABORATóRIO DE INFORMÁTICA
inTERnET AVAilAblE AT iT lAb
Sim / yes 80 16 4
Não / No 65 20 15
1 Base: 421 coordenadores pedagógicos. Respostas estimuladas e rodiziadas.¹ base: 421 directors of studies. stimulated, alternated answers.
C9 PERCEPÇÃO DOS COORDENADORES PEDAGóGICOS SOBRE O PROJETO PEDAGóGICOdIreCtor of StudIeS’ PerCePtIoN oN the PedagogICal PlaN Percentual sobre o total de coordenadores pedagógicos ¹Percentage of the total number of directors of studies 1
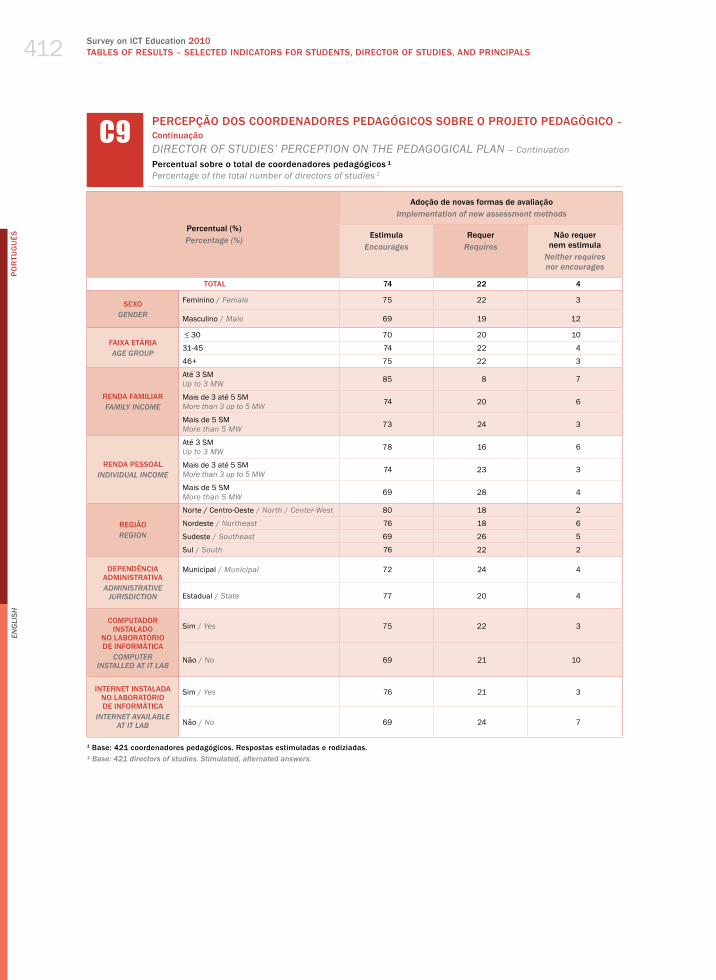
Survey on ICT Education 2010TABLES OF RESuLTS – SELECTED INDICATORS FOR STuDENTS, DIRECTOR OF STuDIES, AND PRINCIPALS
PO
RTu
Gu
ÊS
En
gli
sh
412
Percentual (%)Percentage (%)
Adoção de novas formas de avaliaçãoimplementation of new assessment methods
EstimulaEncourages
RequerRequires
Não requer nem estimula
neither requires nor encourages
TOTAL 74 22 4
SEXOgEnDER
Feminino / female 75 22 3
masculino / male 69 19 12
FAIXA ETÁRIAAgE gROUP
≤ 30 70 20 10
31-45 74 22 4
46+ 75 22 3
RENDA FAMILIARFAMilY inCOME
Até 3 Sm up to 3 mw 85 8 7
mais de 3 até 5 Sm more than 3 up to 5 mw 74 20 6
mais de 5 Sm more than 5 mw 73 24 3
RENDA PESSOALinDiViDUAl inCOME
Até 3 Sm up to 3 mw 78 16 6
mais de 3 até 5 Sm more than 3 up to 5 mw 74 23 3
mais de 5 Sm more than 5 mw 69 28 4
REGIÃOREgiOn
Norte / Centro-oeste / North / Center-west 80 18 2
Nordeste / Northeast 76 18 6
Sudeste / Southeast 69 26 5
Sul / South 76 22 2
DEPENDêNCIA ADMINISTRATIvAADMinisTRATiVE
JURisDiCTiOn
municipal / municipal 72 24 4
Estadual / State 77 20 4
COMPUTADOR INSTALADO
NO LABORATóRIO DE INFORMÁTICA
COMPUTER insTAllED AT iT lAb
Sim / yes 75 22 3
Não / No 69 21 10
INTERNET INSTALADA NO LABORATóRIO DE INFORMÁTICA
inTERnET AVAilAblE AT iT lAb
Sim / yes 76 21 3
Não / No 69 24 7
1 Base: 421 coordenadores pedagógicos. Respostas estimuladas e rodiziadas.¹ base: 421 directors of studies. stimulated, alternated answers.
C9 PERCEPÇÃO DOS COORDENADORES PEDAGóGICOS SOBRE O PROJETO PEDAGóGICO – ContinuaçãodIreCtor of StudIeS’ PerCePtIoN oN the PedagogICal PlaN – Continuation Percentual sobre o total de coordenadores pedagógicos ¹Percentage of the total number of directors of studies 1

2010 Pesquisa TIC EducaçãoTABELAS DE RESuLTADOS – INDICADORES SELECIONADOS PARA ALuNOS, COORDENADORES PEDAGÓGICOS E DIRETORES
PO
RTu
Gu
ÊS
En
gli
sh
413
Percentual (%)Percentage (%)
Utilização dos computadores para monitorar o desempenho dos alunos
Use of computers to monitor students’ performance
EstimulaEncourages
RequerRequires
Não requer nem estimula
neither requires nor encourages
TOTAL 59 21 20
SEXOgEnDER
Feminino / female 59 21 20
masculino / male 55 20 25
FAIXA ETÁRIAAgE gROUP
≤ 30 52 14 35
31-45 57 21 21
46+ 63 20 16
RENDA FAMILIARFAMilY inCOME
Até 3 Sm up to 3 mw 66 7 27
mais de 3 até 5 Sm more than 3 up to 5 mw 58 18 24
mais de 5 Sm more than 5 mw 59 23 18
RENDA PESSOALinDiViDUAl inCOME
Até 3 Sm up to 3 mw 65 14 22
mais de 3 até 5 Sm more than 3 up to 5 mw 53 25 22
mais de 5 Sm more than 5 mw 62 21 17
REGIÃOREgiOn
Norte / Centro-oeste / North / Center-west 62 20 18
Nordeste / Northeast 51 25 24
Sudeste / Southeast 58 22 20
Sul / South 69 13 18
DEPENDêNCIA ADMINISTRATIvAADMinisTRATiVE
JURisDiCTiOn
municipal / municipal 56 22 22
Estadual / State 62 19 18
COMPUTADOR INSTALADO
NO LABORATóRIO DE INFORMÁTICA
COMPUTER insTAllED AT iT lAb
Sim / yes 63 20 17
Não / No 40 24 36
INTERNET INSTALADA NO LABORATóRIO DE INFORMÁTICA
inTERnET AVAilAblE AT iT lAb
Sim / yes 65 19 16
Não / No 45 25 30
1 Base: 421 coordenadores pedagógicos. Respostas estimuladas e rodiziadas.¹ base: 421 directors of studies. stimulated, alternated answers.
C9 PERCEPÇÃO DOS COORDENADORES PEDAGóGICOS SOBRE O PROJETO PEDAGóGICO – ContinuaçãodIreCtor of StudIeS’ PerCePtIoN oN the PedagogICal PlaN – Continuation Percentual sobre o total de coordenadores pedagógicos ¹Percentage of the total number of directors of studies 1
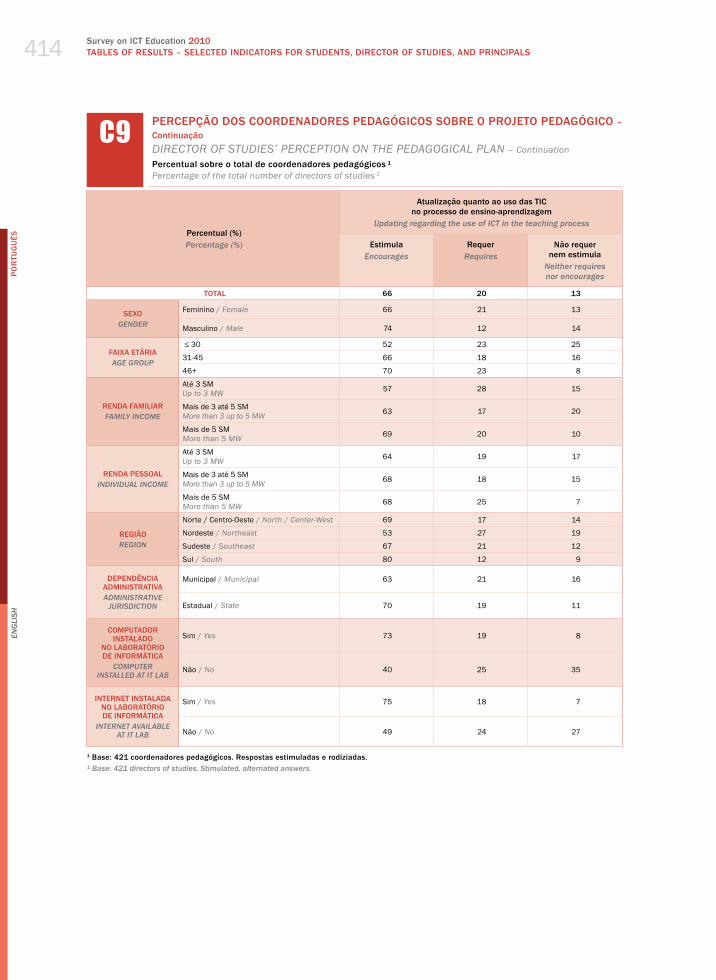
Survey on ICT Education 2010TABLES OF RESuLTS – SELECTED INDICATORS FOR STuDENTS, DIRECTOR OF STuDIES, AND PRINCIPALS
PO
RTu
Gu
ÊS
En
gli
sh
414
Percentual (%)Percentage (%)
Atualização quanto ao uso das TIC no processo de ensino-aprendizagem
Updating regarding the use of iCT in the teaching process
EstimulaEncourages
RequerRequires
Não requer nem estimula
neither requires nor encourages
TOTAL 66 20 13
SEXOgEnDER
Feminino / female 66 21 13
masculino / male 74 12 14
FAIXA ETÁRIAAgE gROUP
≤ 30 52 23 25
31-45 66 18 16
46+ 70 23 8
RENDA FAMILIARFAMilY inCOME
Até 3 Sm up to 3 mw 57 28 15
mais de 3 até 5 Sm more than 3 up to 5 mw 63 17 20
mais de 5 Sm more than 5 mw 69 20 10
RENDA PESSOALinDiViDUAl inCOME
Até 3 Sm up to 3 mw 64 19 17
mais de 3 até 5 Sm more than 3 up to 5 mw 68 18 15
mais de 5 Sm more than 5 mw 68 25 7
REGIÃOREgiOn
Norte / Centro-oeste / North / Center-west 69 17 14
Nordeste / Northeast 53 27 19
Sudeste / Southeast 67 21 12
Sul / South 80 12 9
DEPENDêNCIA ADMINISTRATIvAADMinisTRATiVE
JURisDiCTiOn
municipal / municipal 63 21 16
Estadual / State 70 19 11
COMPUTADOR INSTALADO
NO LABORATóRIO DE INFORMÁTICA
COMPUTER insTAllED AT iT lAb
Sim / yes 73 19 8
Não / No 40 25 35
INTERNET INSTALADA NO LABORATóRIO DE INFORMÁTICA
inTERnET AVAilAblE AT iT lAb
Sim / yes 75 18 7
Não / No 49 24 27
1 Base: 421 coordenadores pedagógicos. Respostas estimuladas e rodiziadas.¹ base: 421 directors of studies. stimulated, alternated answers.
C9 PERCEPÇÃO DOS COORDENADORES PEDAGóGICOS SOBRE O PROJETO PEDAGóGICO – ContinuaçãodIreCtor of StudIeS’ PerCePtIoN oN the PedagogICal PlaN – Continuation Percentual sobre o total de coordenadores pedagógicos ¹Percentage of the total number of directors of studies 1
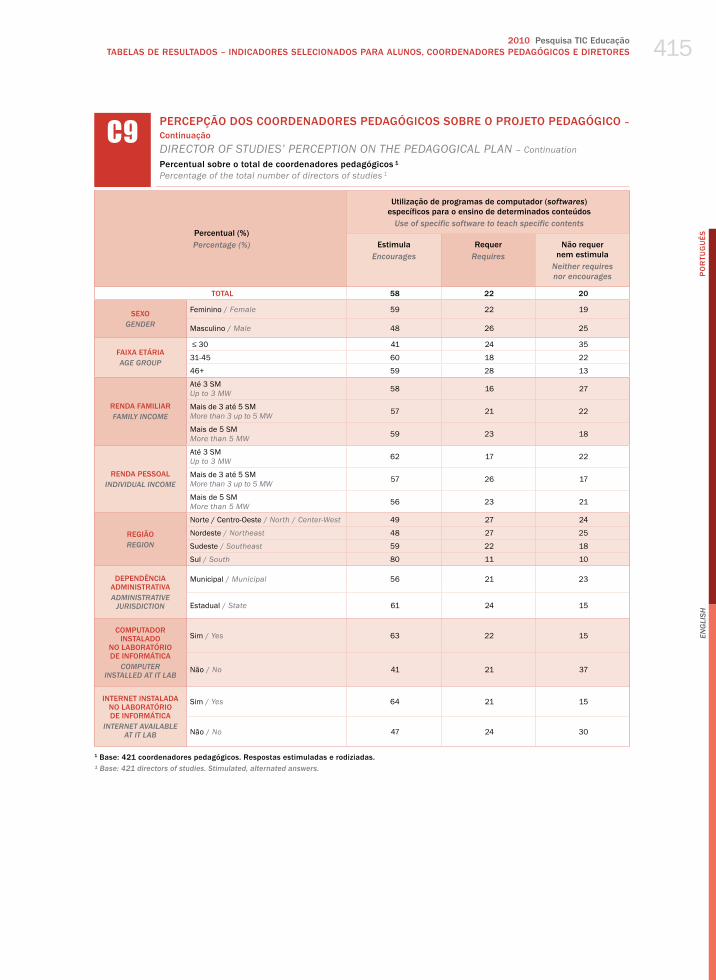
2010 Pesquisa TIC EducaçãoTABELAS DE RESuLTADOS – INDICADORES SELECIONADOS PARA ALuNOS, COORDENADORES PEDAGÓGICOS E DIRETORES
PO
RTu
Gu
ÊS
En
gli
sh
415
Percentual (%)Percentage (%)
Utilização de programas de computador (softwares) específicos para o ensino de determinados conteúdos
Use of specific software to teach specific contents
EstimulaEncourages
RequerRequires
Não requer nem estimula
neither requires nor encourages
TOTAL 58 22 20
SEXOgEnDER
Feminino / female 59 22 19
masculino / male 48 26 25
FAIXA ETÁRIAAgE gROUP
≤ 30 41 24 35
31-45 60 18 22
46+ 59 28 13
RENDA FAMILIARFAMilY inCOME
Até 3 Sm up to 3 mw 58 16 27
mais de 3 até 5 Sm more than 3 up to 5 mw 57 21 22
mais de 5 Sm more than 5 mw 59 23 18
RENDA PESSOALinDiViDUAl inCOME
Até 3 Sm up to 3 mw 62 17 22
mais de 3 até 5 Sm more than 3 up to 5 mw 57 26 17
mais de 5 Sm more than 5 mw 56 23 21
REGIÃOREgiOn
Norte / Centro-oeste / North / Center-west 49 27 24
Nordeste / Northeast 48 27 25
Sudeste / Southeast 59 22 18
Sul / South 80 11 10
DEPENDêNCIA ADMINISTRATIvAADMinisTRATiVE
JURisDiCTiOn
municipal / municipal 56 21 23
Estadual / State 61 24 15
COMPUTADOR INSTALADO
NO LABORATóRIO DE INFORMÁTICA
COMPUTER insTAllED AT iT lAb
Sim / yes 63 22 15
Não / No 41 21 37
INTERNET INSTALADA NO LABORATóRIO DE INFORMÁTICA
inTERnET AVAilAblE AT iT lAb
Sim / yes 64 21 15
Não / No 47 24 30
1 Base: 421 coordenadores pedagógicos. Respostas estimuladas e rodiziadas.¹ base: 421 directors of studies. stimulated, alternated answers.
C9 PERCEPÇÃO DOS COORDENADORES PEDAGóGICOS SOBRE O PROJETO PEDAGóGICO – ContinuaçãodIreCtor of StudIeS’ PerCePtIoN oN the PedagogICal PlaN – Continuation Percentual sobre o total de coordenadores pedagógicos ¹Percentage of the total number of directors of studies 1

Survey on ICT Education 2010TABLES OF RESuLTS – SELECTED INDICATORS FOR STuDENTS, DIRECTOR OF STuDIES, AND PRINCIPALS
PO
RTu
Gu
ÊS
En
gli
sh
416
Percentual (%)Percentage (%)
Escrever documentos, relatórios e comunicados
Writing documents, reports and notices
Fazer orçamentos e controle de gastos
budgeting and monitoring expenses
Sim / Yes Não / no Sim / Yes Não / no
TOTAL 97 3 87 13
SEXOgEnDER
Feminino / female 98 2 88 12
masculino / male 94 6 80 20
FAIXA ETÁRIAAgE gROUP
≤ 30 93 7 86 14
31-45 98 2 86 14
46+ 97 3 87 13
RENDA FAMILIARFAMilY inCOME
Até 3 Sm up to 3 mw 91 9 73 27
mais de 3 até 5 Sm more than 3 up to 5 mw 98 2 79 21
mais de 5 Sm more than 5 mw 98 2 89 11
RENDA PESSOALinDiViDUAl inCOME
Até 3 Sm up to 3 mw 93 7 78 22
mais de 3 até 5 Sm more than 3 up to 5 mw 97 3 86 14
mais de 5 Sm more than 5 mw 99 1 90 10
REGIÃOREgiOn
Norte / Centro-oeste / North / Center-west 98 2 87 13
Nordeste / Northeast 95 5 76 24
Sudeste / Southeast 99 1 94 6
Sul / South 96 4 90 10
DEPENDêNCIA ADMINISTRATIvAADMinisTRATiVE
JURisDiCTiOn
municipal / municipal 97 3 85 15
Estadual / State 98 2 88 12
COMPUTADOR INSTALADO
NO LABORATóRIO DE INFORMÁTICA
COMPUTER insTAllED AT iT lAb
Sim / yes 98 2 87 13
Não / No 96 4 85 15
INTERNET INSTALADA NO LABORATóRIO DE INFORMÁTICA
inTERnET AVAilAblE AT iT lAb
Sim / yes 98 2 88 12
Não / No 95 5 84 16
1 Base: 497 diretores. Respostas estimuladas e rodiziadas.¹ base: 497 principals. stimulated, alternated answers.
C1 USO DO COMPUTADOR E DA INTERNET PELOS DIRETORES PARA AS ATIvIDADES DE GESTÃO ESCOLARPrINCIPal’S ComPuter aNd INterNet uSe IN SChool maNagemeNt aCtIvItIeSPercentual sobre o total de diretores ¹Percentage of the total number of principals 1

2010 Pesquisa TIC EducaçãoTABELAS DE RESuLTADOS – INDICADORES SELECIONADOS PARA ALuNOS, COORDENADORES PEDAGÓGICOS E DIRETORES
PO
RTu
Gu
ÊS
En
gli
sh
417
C1 USO DO COMPUTADOR E DA INTERNET PELOS DIRETORES PARA AS ATIvIDADES DE GESTÃO ESCOLAR – ContinuaçãoPrINCIPal’S ComPuter aNd INterNet uSe IN SChool maNagemeNt aCtIvItIeS – ContinuationPercentual sobre o total de diretores ¹Percentage of the total number of principals 1
Percentual (%)Percentage (%)
Comunicar-se com os professoresCommunicating with teachers
SimYes
Nãono
não sabeDoes not know
não se aplicaDoes not apply
TOTAL 78 21 - -
SEXOgEnDER
Feminino / female 79 21 - -
masculino / male 76 23 1 -
FAIXA ETÁRIAAgE gROUP
≤ 30 76 24 - -
31-45 79 20 1 -
46+ 78 22 - -
RENDA FAMILIARFAMilY inCOME
Até 3 Sm up to 3 mw 75 25 - -
mais de 3 até 5 Sm more than 3 up to 5 mw 73 25 1 1
mais de 5 Sm more than 5 mw 80 20 - -
RENDA PESSOALinDiViDUAl inCOME
Até 3 Sm up to 3 mw 80 19 - 1
mais de 3 até 5 Sm more than 3 up to 5 mw 74 25 1 -
mais de 5 Sm more than 5 mw 82 18 - -
REGIÃOREgiOn
Norte / Centro-oeste / North / Center-west 66 32 1 1
Nordeste / Northeast 78 21 1 -
Sudeste / Southeast 85 15 - -
Sul / South 77 23 - -
DEPENDêNCIA ADMINISTRATIvAADMinisTRATiVE
JURisDiCTiOn
municipal / municipal 78 21 - -
Estadual / State 79 21 - -
COMPUTADOR INSTALADO
NO LABORATóRIO DE INFORMÁTICA
COMPUTER insTAllED AT iT lAb
Sim / yes 80 20 - -
Não / No 71 28 - 1
INTERNET INSTALADA NO LABORATóRIO DE INFORMÁTICA
inTERnET AVAilAblE AT iT lAb
Sim / yes 80 20 1 -
Não / No 75 24 - 1
1 Base: 497 diretores. Respostas estimuladas e rodiziadas.¹ base: 497 principals. stimulated, alternated answers.
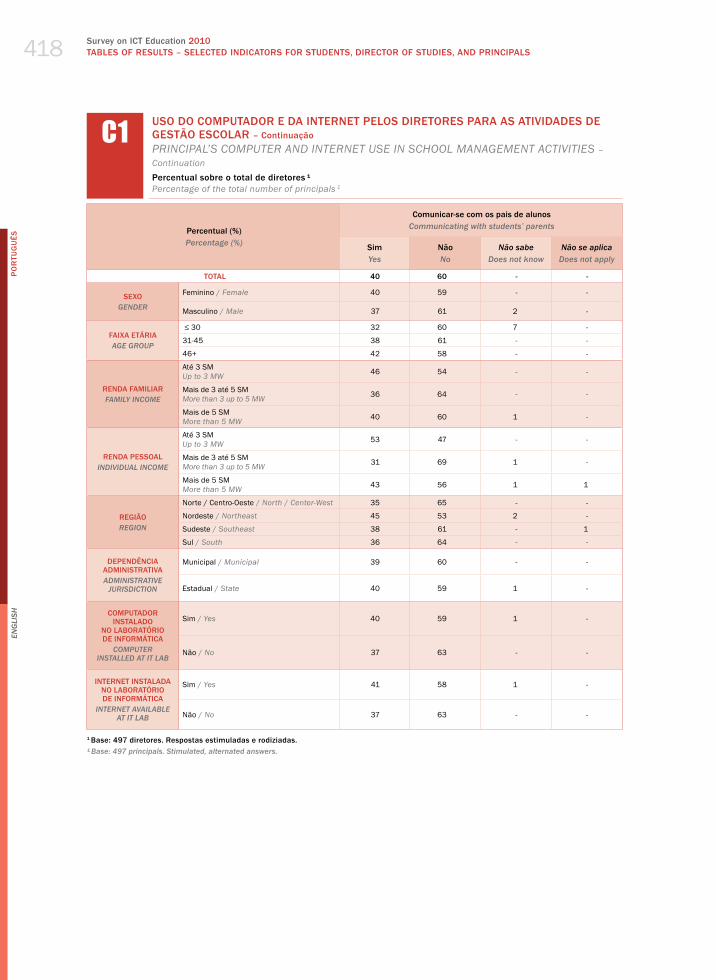
Survey on ICT Education 2010TABLES OF RESuLTS – SELECTED INDICATORS FOR STuDENTS, DIRECTOR OF STuDIES, AND PRINCIPALS
PO
RTu
Gu
ÊS
En
gli
sh
418
Percentual (%)Percentage (%)
Comunicar-se com os pais de alunosCommunicating with students’ parents
SimYes
Nãono
não sabeDoes not know
não se aplicaDoes not apply
TOTAL 40 60 - -
SEXOgEnDER
Feminino / female 40 59 - -
masculino / male 37 61 2 -
FAIXA ETÁRIAAgE gROUP
≤ 30 32 60 7 -
31-45 38 61 - -
46+ 42 58 - -
RENDA FAMILIARFAMilY inCOME
Até 3 Sm up to 3 mw 46 54 - -
mais de 3 até 5 Sm more than 3 up to 5 mw 36 64 - -
mais de 5 Sm more than 5 mw 40 60 1 -
RENDA PESSOALinDiViDUAl inCOME
Até 3 Sm up to 3 mw 53 47 - -
mais de 3 até 5 Sm more than 3 up to 5 mw 31 69 1 -
mais de 5 Sm more than 5 mw 43 56 1 1
REGIÃOREgiOn
Norte / Centro-oeste / North / Center-west 35 65 - -
Nordeste / Northeast 45 53 2 -
Sudeste / Southeast 38 61 - 1
Sul / South 36 64 - -
DEPENDêNCIA ADMINISTRATIvAADMinisTRATiVE
JURisDiCTiOn
municipal / municipal 39 60 - -
Estadual / State 40 59 1 -
COMPUTADOR INSTALADO
NO LABORATóRIO DE INFORMÁTICA
COMPUTER insTAllED AT iT lAb
Sim / yes 40 59 1 -
Não / No 37 63 - -
INTERNET INSTALADA NO LABORATóRIO DE INFORMÁTICA
inTERnET AVAilAblE AT iT lAb
Sim / yes 41 58 1 -
Não / No 37 63 - -
1 Base: 497 diretores. Respostas estimuladas e rodiziadas.¹ base: 497 principals. stimulated, alternated answers.
C1 USO DO COMPUTADOR E DA INTERNET PELOS DIRETORES PARA AS ATIvIDADES DE GESTÃO ESCOLAR – ContinuaçãoPrINCIPal’S ComPuter aNd INterNet uSe IN SChool maNagemeNt aCtIvItIeS – ContinuationPercentual sobre o total de diretores ¹Percentage of the total number of principals 1

2010 Pesquisa TIC EducaçãoTABELAS DE RESuLTADOS – INDICADORES SELECIONADOS PARA ALuNOS, COORDENADORES PEDAGÓGICOS E DIRETORES
PO
RTu
Gu
ÊS
En
gli
sh
419
Percentual (%)Percentage (%)
Buscar informaçõeslooking up information
SimYes
Nãono
não sabeDoes not know
não se aplicaDoes not apply
TOTAL 96 4 - -
SEXOgEnDER
Feminino / female 97 3 - -
masculino / male 91 7 1 -
FAIXA ETÁRIAAgE gROUP
≤ 30 79 14 7 -
31-45 96 3 - -
46+ 97 3 - -
RENDA FAMILIARFAMilY inCOME
Até 3 Sm up to 3 mw 83 17 - -
mais de 3 até 5 Sm more than 3 up to 5 mw 94 5 - 1
mais de 5 Sm more than 5 mw 97 2 - -
RENDA PESSOALinDiViDUAl inCOME
Até 3 Sm up to 3 mw 89 10 - 1
mais de 3 até 5 Sm more than 3 up to 5 mw 98 2 - -
mais de 5 Sm more than 5 mw 97 2 1 -
REGIÃOREgiOn
Norte / Centro-oeste / North / Center-west 99 0 - 1
Nordeste / Northeast 90 9 1 -
Sudeste / Southeast 99 1 - -
Sul / South 97 3 - -
DEPENDêNCIA ADMINISTRATIvAADMinisTRATiVE
JURisDiCTiOn
municipal / municipal 94 6 - -
Estadual / State 99 1 1 -
COMPUTADOR INSTALADO
NO LABORATóRIO DE INFORMÁTICA
COMPUTER insTAllED AT iT lAb
Sim / yes 97 3 - -
Não / No 92 8 - 1
INTERNET INSTALADA NO LABORATóRIO DE INFORMÁTICA
inTERnET AVAilAblE AT iT lAb
Sim / yes 98 2 - -
Não / No 91 9 - 1
1 Base: 497 diretores. Respostas estimuladas e rodiziadas.¹ base: 497 principals. stimulated, alternated answers.
C1 USO DO COMPUTADOR E DA INTERNET PELOS DIRETORES PARA AS ATIvIDADES DE GESTÃO ESCOLAR – ContinuaçãoPrINCIPal’S ComPuter aNd INterNet uSe IN SChool maNagemeNt aCtIvItIeS – ContinuationPercentual sobre o total de diretores ¹Percentage of the total number of principals 1

Survey on ICT Education 2010TABLES OF RESuLTS – SELECTED INDICATORS FOR STuDENTS, DIRECTOR OF STuDIES, AND PRINCIPALS
PO
RTu
Gu
ÊS
En
gli
sh
420
Percentual (%)Percentage (%)
Preparar e fazer apresentaçõesPreparing and delivering presentations
SimYes
Nãono
não sabeDoes not know
TOTAL 94 6 -
SEXOgEnDER
Feminino / female 95 5 -
masculino / male 88 10 1
FAIXA ETÁRIAAgE gROUP
≤ 30 79 14 7
31-45 95 5 -
46+ 94 6 -
RENDA FAMILIARFAMilY inCOME
Até 3 Sm up to 3 mw 78 22 -
mais de 3 até 5 Sm more than 3 up to 5 mw 92 8 -
mais de 5 Sm more than 5 mw 95 4 -
RENDA PESSOALinDiViDUAl inCOME
Até 3 Sm up to 3 mw 87 13 -
mais de 3 até 5 Sm more than 3 up to 5 mw 94 6 -
mais de 5 Sm more than 5 mw 96 3 1
REGIÃOREgiOn
Norte / Centro-oeste / North / Center-west 96 4 -
Nordeste / Northeast 91 9 1
Sudeste / Southeast 97 3 -
Sul / South 90 10 -
DEPENDêNCIA ADMINISTRATIvAADMinisTRATiVE
JURisDiCTiOn
municipal / municipal 91 9 -
Estadual / State 96 3 1
COMPUTADOR INSTALADO
NO LABORATóRIO DE INFORMÁTICA
COMPUTER insTAllED AT iT lAb
Sim / yes 95 5 -
Não / No 88 12 -
INTERNET INSTALADA NO LABORATóRIO DE INFORMÁTICA
inTERnET AVAilAblE AT iT lAb
Sim / yes 96 4 -
Não / No 88 12 -
1 Base: 497 diretores. Respostas estimuladas e rodiziadas.¹ base: 497 principals. stimulated, alternated answers.
C1 USO DO COMPUTADOR E DA INTERNET PELOS DIRETORES PARA AS ATIvIDADES DE GESTÃO ESCOLAR – ContinuaçãoPrINCIPal’S ComPuter aNd INterNet uSe IN SChool maNagemeNt aCtIvItIeS – ContinuationPercentual sobre o total de diretores ¹Percentage of the total number of principals 1

2010 Pesquisa TIC EducaçãoTABELAS DE RESuLTADOS – INDICADORES SELECIONADOS PARA ALuNOS, COORDENADORES PEDAGÓGICOS E DIRETORES
PO
RTu
Gu
ÊS
En
gli
sh
421
Percentual (%)Percentage (%)
Fazer cronogramas / grade de horáriosPreparing schedules / timetables
SimYes
Nãono
não sabeDoes not know
TOTAL 94 5 -
SEXOgEnDER
Feminino / female 96 4 -
masculino / male 88 11 1
FAIXA ETÁRIAAgE gROUP
≤ 30 86 7 7
31-45 94 6 -
46+ 95 5 -
RENDA FAMILIARFAMilY inCOME
Até 3 Sm up to 3 mw 87 13 -
mais de 3 até 5 Sm more than 3 up to 5 mw 91 9 -
mais de 5 Sm more than 5 mw 96 4 -
RENDA PESSOALinDiViDUAl inCOME
Até 3 Sm up to 3 mw 88 12 -
mais de 3 até 5 Sm more than 3 up to 5 mw 96 4 -
mais de 5 Sm more than 5 mw 95 4 1
REGIÃOREgiOn
Norte / Centro-oeste / North / Center-west 91 9 -
Nordeste / Northeast 91 9 1
Sudeste / Southeast 98 2 -
Sul / South 97 3 -
DEPENDêNCIA ADMINISTRATIvAADMinisTRATiVE
JURisDiCTiOn
municipal / municipal 94 6 -
Estadual / State 94 5 1
COMPUTADOR INSTALADO
NO LABORATóRIO DE INFORMÁTICA
COMPUTER insTAllED AT iT lAb
Sim / yes 95 5 -
Não / No 91 9 -
INTERNET INSTALADA NO LABORATóRIO DE INFORMÁTICA
inTERnET AVAilAblE AT iT lAb
Sim / yes 95 4 -
Não / No 92 8 -
1 Base: 497 diretores. Respostas estimuladas e rodiziadas.¹ base: 497 principals. stimulated, alternated answers.
C1 USO DO COMPUTADOR E DA INTERNET PELOS DIRETORES PARA AS ATIvIDADES DE GESTÃO ESCOLAR – ContinuaçãoPrINCIPal’S ComPuter aNd INterNet uSe IN SChool maNagemeNt aCtIvItIeS – ContinuationPercentual sobre o total de diretores ¹Percentage of the total number of principals 1

Survey on ICT Education 2010TABLES OF RESuLTS – SELECTED INDICATORS FOR STuDENTS, DIRECTOR OF STuDIES, AND PRINCIPALS
PO
RTu
Gu
ÊS
En
gli
sh
422
Percentual (%)Percentage (%)
Administrar compromissos pessoais (agenda)Managing personal appointments (diary)
SimYes
Nãono
não sabeDoes not know
não se aplicaDoes not apply
TOTAL 51 48 1 1
SEXOgEnDER
Feminino / female 50 48 1 1
masculino / male 51 47 1 -
FAIXA ETÁRIAAgE gROUP
≤ 30 61 32 7 -
31-45 48 51 1 1
46+ 53 46 - -
RENDA FAMILIARFAMilY inCOME
Até 3 Sm up to 3 mw 53 47 - -
mais de 3 até 5 Sm more than 3 up to 5 mw 47 51 1 1
mais de 5 Sm more than 5 mw 51 47 1 1
RENDA PESSOALinDiViDUAl inCOME
Até 3 Sm up to 3 mw 53 46 - 1
mais de 3 até 5 Sm more than 3 up to 5 mw 46 53 1 -
mais de 5 Sm more than 5 mw 54 44 1 1
REGIÃOREgiOn
Norte / Centro-oeste / North / Center-west 61 37 1 1
Nordeste / Northeast 55 44 1 -
Sudeste / Southeast 42 56 1 1
Sul / South 50 50 - -
DEPENDêNCIA ADMINISTRATIvAADMinisTRATiVE
JURisDiCTiOn
municipal / municipal 50 48 1 1
Estadual / State 51 48 1 -
COMPUTADOR INSTALADO
NO LABORATóRIO DE INFORMÁTICA
COMPUTER insTAllED AT iT lAb
Sim / yes 52 47 1 1
Não / No 45 54 - 1
INTERNET INSTALADA NO LABORATóRIO DE INFORMÁTICA
inTERnET AVAilAblE AT iT lAb
Sim / yes 52 46 1 1
Não / No 48 52 - 1
1 Base: 497 diretores. Respostas estimuladas e rodiziadas.¹ base: 497 principals. stimulated, alternated answers.
C1 USO DO COMPUTADOR E DA INTERNET PELOS DIRETORES PARA AS ATIvIDADES DE GESTÃO ESCOLAR – ContinuaçãoPrINCIPal’S ComPuter aNd INterNet uSe IN SChool maNagemeNt aCtIvItIeS – ContinuationPercentual sobre o total de diretores ¹Percentage of the total number of principals 1
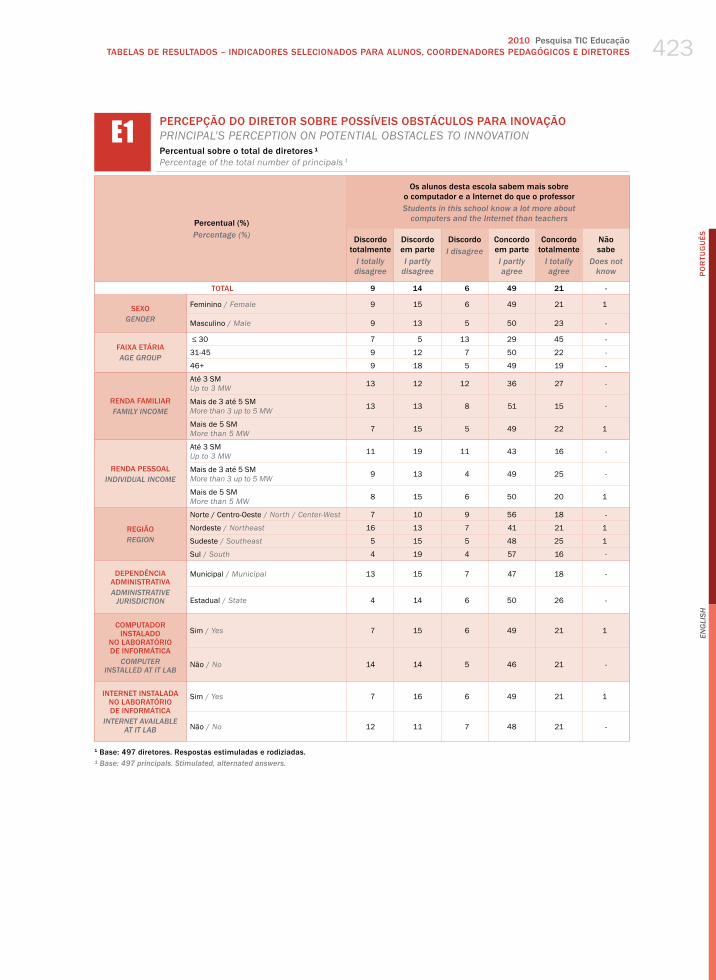
2010 Pesquisa TIC EducaçãoTABELAS DE RESuLTADOS – INDICADORES SELECIONADOS PARA ALuNOS, COORDENADORES PEDAGÓGICOS E DIRETORES
PO
RTu
Gu
ÊS
En
gli
sh
423
Percentual (%)Percentage (%)
Os alunos desta escola sabem mais sobre o computador e a Internet do que o professorstudents in this school know a lot more about
computers and the internet than teachers
Discordo totalmente
i totally disagree
Discordo em partei partly
disagree
Discordoi disagree
Concordo em parte i partly agree
Concordo totalmente
i totally agree
Não sabe
Does not know
TOTAL 9 14 6 49 21 -
SEXOgEnDER
Feminino / female 9 15 6 49 21 1
masculino / male 9 13 5 50 23 -
FAIXA ETÁRIAAgE gROUP
≤ 30 7 5 13 29 45 -
31-45 9 12 7 50 22 -
46+ 9 18 5 49 19 -
RENDA FAMILIARFAMilY inCOME
Até 3 Sm up to 3 mw 13 12 12 36 27 -
mais de 3 até 5 Sm more than 3 up to 5 mw 13 13 8 51 15 -
mais de 5 Sm more than 5 mw 7 15 5 49 22 1
RENDA PESSOALinDiViDUAl inCOME
Até 3 Sm up to 3 mw 11 19 11 43 16 -
mais de 3 até 5 Sm more than 3 up to 5 mw 9 13 4 49 25 -
mais de 5 Sm more than 5 mw 8 15 6 50 20 1
REGIÃOREgiOn
Norte / Centro-oeste / North / Center-west 7 10 9 56 18 -
Nordeste / Northeast 16 13 7 41 21 1
Sudeste / Southeast 5 15 5 48 25 1
Sul / South 4 19 4 57 16 -
DEPENDêNCIA ADMINISTRATIvAADMinisTRATiVE
JURisDiCTiOn
municipal / municipal 13 15 7 47 18 -
Estadual / State 4 14 6 50 26 -
COMPUTADOR INSTALADO
NO LABORATóRIO DE INFORMÁTICA
COMPUTER insTAllED AT iT lAb
Sim / yes 7 15 6 49 21 1
Não / No 14 14 5 46 21 -
INTERNET INSTALADA NO LABORATóRIO DE INFORMÁTICA
inTERnET AVAilAblE AT iT lAb
Sim / yes 7 16 6 49 21 1
Não / No 12 11 7 48 21 -
1 Base: 497 diretores. Respostas estimuladas e rodiziadas.¹ base: 497 principals. stimulated, alternated answers.
E1 PERCEPÇÃO DO DIRETOR SOBRE POSSÍvEIS OBSTÁCULOS PARA INOvAÇÃOPrINCIPal’S PerCePtIoN oN PoteNtIal oBStaCleS to INNovatIoN Percentual sobre o total de diretores ¹Percentage of the total number of principals 1

Survey on ICT Education 2010TABLES OF RESuLTS – SELECTED INDICATORS FOR STuDENTS, DIRECTOR OF STuDIES, AND PRINCIPALS
PO
RTu
Gu
ÊS
En
gli
sh
424
Percentual (%)Percentage (%)
Com a Internet, os alunos acabam ficando sobrecarregados de informações
The internet overloads students with information
Discordo totalmente
i totally disagree
Discordo em partei partly
disagree
Discordoi disagree
Concordo em parte i partly agree
Concordo totalmente
i totally agree
Não sabe
Does not know
TOTAL 38 28 5 24 5 -
SEXOgEnDER
Feminino / female 37 29 6 23 5 1
masculino / male 41 22 5 27 5 -
FAIXA ETÁRIAAgE gROUP
≤ 30 32 50 5 - 13 -
31-45 40 27 5 23 5 -
46+ 37 27 6 26 5 -
RENDA FAMILIARFAMilY inCOME
Até 3 Sm up to 3 mw 31 35 9 17 8 -
mais de 3 até 5 Sm more than 3 up to 5 mw 37 30 5 24 5 -
mais de 5 Sm more than 5 mw 38 26 6 24 5 1
RENDA PESSOALinDiViDUAl inCOME
Até 3 Sm up to 3 mw 43 23 6 22 5 -
mais de 3 até 5 Sm more than 3 up to 5 mw 37 32 2 23 6 -
mais de 5 Sm more than 5 mw 36 26 8 26 4 1
REGIÃOREgiOn
Norte / Centro-oeste / North / Center-west 30 28 5 33 4 -
Nordeste / Northeast 41 33 5 16 4 1
Sudeste / Southeast 35 25 5 28 6 1
Sul / South 46 22 9 17 6 -
DEPENDêNCIA ADMINISTRATIvAADMinisTRATiVE
JURisDiCTiOn
municipal / municipal 39 29 5 23 3 1
Estadual / State 36 26 6 25 7 -
COMPUTADOR INSTALADO
NO LABORATóRIO DE INFORMÁTICA
COMPUTER insTAllED AT iT lAb
Sim / yes 38 28 6 22 6 1
Não / No 39 24 4 31 2 -
INTERNET INSTALADA NO LABORATóRIO DE INFORMÁTICA
inTERnET AVAilAblE AT iT lAb
Sim / yes 40 27 6 21 6 1
Não / No 33 30 5 30 3 -
1 Base: 497 diretores. Respostas estimuladas e rodiziadas.¹ base: 497 principals. stimulated, alternated answers.
E1 PERCEPÇÃO DO DIRETOR SOBRE POSSÍvEIS OBSTÁCULOS PARA INOvAÇÃO – ContinuaçãoPrINCIPal’S PerCePtIoN oN PoteNtIal oBStaCleS to INNovatIoN – ContinuationPercentual sobre o total de diretores ¹Percentage of the total number of principals 1
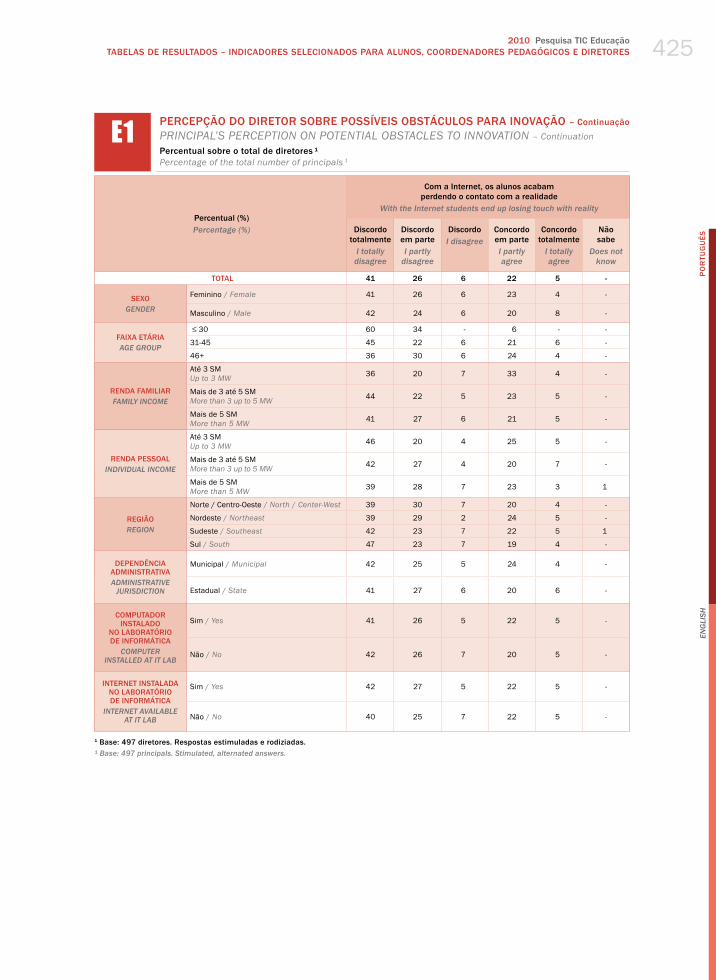
2010 Pesquisa TIC EducaçãoTABELAS DE RESuLTADOS – INDICADORES SELECIONADOS PARA ALuNOS, COORDENADORES PEDAGÓGICOS E DIRETORES
PO
RTu
Gu
ÊS
En
gli
sh
425
Percentual (%)Percentage (%)
Com a Internet, os alunos acabam perdendo o contato com a realidade
With the internet students end up losing touch with reality
Discordo totalmente
i totally disagree
Discordo em partei partly
disagree
Discordoi disagree
Concordo em parte i partly agree
Concordo totalmente
i totally agree
Não sabe
Does not know
TOTAL 41 26 6 22 5 -
SEXOgEnDER
Feminino / female 41 26 6 23 4 -
masculino / male 42 24 6 20 8 -
FAIXA ETÁRIAAgE gROUP
≤ 30 60 34 - 6 - -
31-45 45 22 6 21 6 -
46+ 36 30 6 24 4 -
RENDA FAMILIARFAMilY inCOME
Até 3 Sm up to 3 mw 36 20 7 33 4 -
mais de 3 até 5 Sm more than 3 up to 5 mw 44 22 5 23 5 -
mais de 5 Sm more than 5 mw 41 27 6 21 5 -
RENDA PESSOALinDiViDUAl inCOME
Até 3 Sm up to 3 mw 46 20 4 25 5 -
mais de 3 até 5 Sm more than 3 up to 5 mw 42 27 4 20 7 -
mais de 5 Sm more than 5 mw 39 28 7 23 3 1
REGIÃOREgiOn
Norte / Centro-oeste / North / Center-west 39 30 7 20 4 -
Nordeste / Northeast 39 29 2 24 5 -
Sudeste / Southeast 42 23 7 22 5 1
Sul / South 47 23 7 19 4 -
DEPENDêNCIA ADMINISTRATIvAADMinisTRATiVE
JURisDiCTiOn
municipal / municipal 42 25 5 24 4 -
Estadual / State 41 27 6 20 6 -
COMPUTADOR INSTALADO
NO LABORATóRIO DE INFORMÁTICA
COMPUTER insTAllED AT iT lAb
Sim / yes 41 26 5 22 5 -
Não / No 42 26 7 20 5 -
INTERNET INSTALADA NO LABORATóRIO DE INFORMÁTICA
inTERnET AVAilAblE AT iT lAb
Sim / yes 42 27 5 22 5 -
Não / No 40 25 7 22 5 -
1 Base: 497 diretores. Respostas estimuladas e rodiziadas.¹ base: 497 principals. stimulated, alternated answers.
E1 PERCEPÇÃO DO DIRETOR SOBRE POSSÍvEIS OBSTÁCULOS PARA INOvAÇÃO – ContinuaçãoPrINCIPal’S PerCePtIoN oN PoteNtIal oBStaCleS to INNovatIoN – ContinuationPercentual sobre o total de diretores ¹Percentage of the total number of principals 1

Survey on ICT Education 2010TABLES OF RESuLTS – SELECTED INDICATORS FOR STuDENTS, DIRECTOR OF STuDIES, AND PRINCIPALS
PO
RTu
Gu
ÊS
En
gli
sh
426
Percentual (%)Percentage (%)
Não entendo de computador e Internet o suficiente para usar na escolai do not know enough about computers and
the internet to use these resources at school
Discordo totalmente
i totally disagree
Discordo em partei partly
disagree
Discordoi disagree
Concordo em parte i partly agree
Concordo totalmente
i totally agree
Não sabe
Does not know
TOTAL 65 15 4 14 1 -
SEXOgEnDER
Feminino / female 65 16 4 14 1 -
masculino / male 69 12 3 15 2 -
FAIXA ETÁRIAAgE gROUP
≤ 30 79 17 - 5 - -
31-45 68 12 4 16 - -
46+ 62 18 4 13 3 1
RENDA FAMILIARFAMilY inCOME
Até 3 Sm up to 3 mw 62 7 4 27 - -
mais de 3 até 5 Sm more than 3 up to 5 mw 60 18 3 17 3 -
mais de 5 Sm more than 5 mw 67 15 4 13 1 -
RENDA PESSOALinDiViDUAl inCOME
Até 3 Sm up to 3 mw 62 13 6 17 3 -
mais de 3 até 5 Sm more than 3 up to 5 mw 63 19 1 15 2 -
mais de 5 Sm more than 5 mw 69 12 5 13 1 1
REGIÃOREgiOn
Norte / Centro-oeste / North / Center-west 55 15 9 21 - -
Nordeste / Northeast 59 18 4 14 4 1
Sudeste / Southeast 72 14 2 12 1 -
Sul / South 72 12 2 14 - -
DEPENDêNCIA ADMINISTRATIvAADMinisTRATiVE
JURisDiCTiOn
municipal / municipal 65 15 3 15 2 -
Estadual / State 66 15 5 13 1 1
COMPUTADOR INSTALADO
NO LABORATóRIO DE INFORMÁTICA
COMPUTER insTAllED AT iT lAb
Sim / yes 65 15 3 15 2 -
Não / No 68 17 5 10 - -
INTERNET INSTALADA NO LABORATóRIO DE INFORMÁTICA
inTERnET AVAilAblE AT iT lAb
Sim / yes 64 16 3 15 2 -
Não / No 68 13 6 13 - -
1 Base: 497 diretores. Respostas estimuladas e rodiziadas.¹ base: 497 principals. stimulated, alternated answers.
E1 PERCEPÇÃO DO DIRETOR SOBRE POSSÍvEIS OBSTÁCULOS PARA INOvAÇÃO – ContinuaçãoPrINCIPal’S PerCePtIoN oN PoteNtIal oBStaCleS to INNovatIoN – ContinuationPercentual sobre o total de diretores ¹Percentage of the total number of principals 1

2010 Pesquisa TIC EducaçãoTABELAS DE RESuLTADOS – INDICADORES SELECIONADOS PARA ALuNOS, COORDENADORES PEDAGÓGICOS E DIRETORES
PO
RTu
Gu
ÊS
En
gli
sh
427
Percentual (%)Percentage (%)
Não confio nas informações contidas na Interneti do not trust the information available on the internet
Discordo totalmente
i totally disagree
Discordo em partei partly
disagree
Discordoi disagree
Concordo em parte i partly agree
Concordo totalmente
i totally agree
Não sabe
Does not know
TOTAL 28 36 6 29 1 -
SEXOgEnDER
Feminino / female 27 35 7 31 1 -
masculino / male 34 39 2 21 4 -
FAIXA ETÁRIAAgE gROUP
≤ 30 33 48 - 20 - -
31-45 27 35 5 31 2 -
46+ 30 36 7 27 1 -
RENDA FAMILIARFAMilY inCOME
Até 3 Sm up to 3 mw 26 27 11 36 - -
mais de 3 até 5 Sm more than 3 up to 5 mw 24 37 7 29 3 -
mais de 5 Sm more than 5 mw 30 36 5 28 1 -
RENDA PESSOALinDiViDUAl inCOME
Até 3 Sm up to 3 mw 33 33 8 23 2 -
mais de 3 até 5 Sm more than 3 up to 5 mw 29 37 5 29 1 -
mais de 5 Sm more than 5 mw 25 36 6 30 2 1
REGIÃOREgiOn
Norte / Centro-oeste / North / Center-west 26 33 9 31 1 -
Nordeste / Northeast 31 38 8 22 2 -
Sudeste / Southeast 24 36 4 36 1 1
Sul / South 36 35 4 23 2 -
DEPENDêNCIA ADMINISTRATIvAADMinisTRATiVE
JURisDiCTiOn
municipal / municipal 27 39 5 28 2 -
Estadual / State 30 32 7 30 1 -
COMPUTADOR INSTALADO
NO LABORATóRIO DE INFORMÁTICA
COMPUTER insTAllED AT iT lAb
Sim / yes 28 37 5 29 2 -
Não / No 29 31 10 29 1 -
INTERNET INSTALADA NO LABORATóRIO DE INFORMÁTICA
inTERnET AVAilAblE AT iT lAb
Sim / yes 28 37 5 28 2 -
Não / No 29 32 9 29 1 -
1 Base: 497 diretores. Respostas estimuladas e rodiziadas.¹ base: 497 principals. stimulated, alternated answers.
E1 PERCEPÇÃO DO DIRETOR SOBRE POSSÍvEIS OBSTÁCULOS PARA INOvAÇÃO – ContinuaçãoPrINCIPal’S PerCePtIoN oN PoteNtIal oBStaCleS to INNovatIoN – ContinuationPercentual sobre o total de diretores ¹Percentage of the total number of principals 1

Survey on ICT Education 2010TABLES OF RESuLTS – SELECTED INDICATORS FOR STuDENTS, DIRECTOR OF STuDIES, AND PRINCIPALS
PO
RTu
Gu
ÊS
En
gli
sh
428
Percentual (%)Percentage (%)
Tenho receio de usar a Internet, de modo gerali am generally afraid of using the internet
Discordo totalmente
i totally disagree
Discordo em partei partly
disagree
Discordoi disagree
Concordo em parte i partly agree
Concordo totalmente
i totally agree
Não sabe
Does not know
TOTAL 61 18 4 13 3 -
SEXOgEnDER
Feminino / female 60 18 5 15 2 1
masculino / male 68 17 4 7 4 -
FAIXA ETÁRIAAgE gROUP
≤ 30 71 18 5 6 - -
31-45 65 18 3 13 2 -
46+ 57 18 6 14 3 1
RENDA FAMILIARFAMilY inCOME
Até 3 Sm up to 3 mw 54 20 8 6 12 -
mais de 3 até 5 Sm more than 3 up to 5 mw 56 15 5 21 3 -
mais de 5 Sm more than 5 mw 63 18 4 12 2 1
RENDA PESSOALinDiViDUAl inCOME
Até 3 Sm up to 3 mw 57 19 7 14 4 -
mais de 3 até 5 Sm more than 3 up to 5 mw 61 18 2 16 4 -
mais de 5 Sm more than 5 mw 63 18 6 10 1 1
REGIÃOREgiOn
Norte / Centro-oeste / North / Center-west 46 20 10 20 4 -
Nordeste / Northeast 58 21 5 13 2 1
Sudeste / Southeast 67 15 2 12 2 1
Sul / South 69 17 2 10 2 -
DEPENDêNCIA ADMINISTRATIvAADMinisTRATiVE
JURisDiCTiOn
municipal / municipal 60 19 4 13 3 -
Estadual / State 62 16 5 13 2 1
COMPUTADOR INSTALADO
NO LABORATóRIO DE INFORMÁTICA
COMPUTER insTAllED AT iT lAb
Sim / yes 62 18 5 13 3 -
Não / No 60 20 3 15 2 1
INTERNET INSTALADA NO LABORATóRIO DE INFORMÁTICA
inTERnET AVAilAblE AT iT lAb
Sim / yes 62 17 5 13 3 -
Não / No 59 21 4 13 3 1
1 Base: 497 diretores. Respostas estimuladas e rodiziadas.¹ base: 497 principals. stimulated, alternated answers.
E1 PERCEPÇÃO DO DIRETOR SOBRE POSSÍvEIS OBSTÁCULOS PARA INOvAÇÃO – ContinuaçãoPrINCIPal’S PerCePtIoN oN PoteNtIal oBStaCleS to INNovatIoN – ContinuationPercentual sobre o total de diretores ¹Percentage of the total number of principals 1
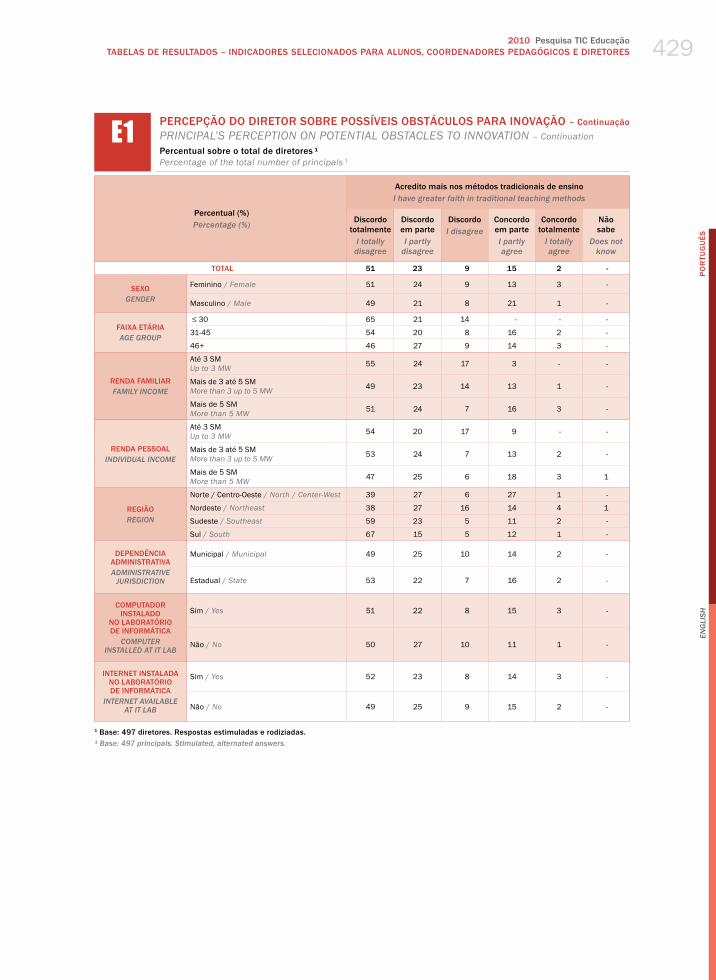
2010 Pesquisa TIC EducaçãoTABELAS DE RESuLTADOS – INDICADORES SELECIONADOS PARA ALuNOS, COORDENADORES PEDAGÓGICOS E DIRETORES
PO
RTu
Gu
ÊS
En
gli
sh
429
Percentual (%)Percentage (%)
Acredito mais nos métodos tradicionais de ensinoi have greater faith in traditional teaching methods
Discordo totalmente
i totally disagree
Discordo em partei partly
disagree
Discordoi disagree
Concordo em parte i partly agree
Concordo totalmente
i totally agree
Não sabe
Does not know
TOTAL 51 23 9 15 2 -
SEXOgEnDER
Feminino / female 51 24 9 13 3 -
masculino / male 49 21 8 21 1 -
FAIXA ETÁRIAAgE gROUP
≤ 30 65 21 14 - - -
31-45 54 20 8 16 2 -
46+ 46 27 9 14 3 -
RENDA FAMILIARFAMilY inCOME
Até 3 Sm up to 3 mw 55 24 17 3 - -
mais de 3 até 5 Sm more than 3 up to 5 mw 49 23 14 13 1 -
mais de 5 Sm more than 5 mw 51 24 7 16 3 -
RENDA PESSOALinDiViDUAl inCOME
Até 3 Sm up to 3 mw 54 20 17 9 - -
mais de 3 até 5 Sm more than 3 up to 5 mw 53 24 7 13 2 -
mais de 5 Sm more than 5 mw 47 25 6 18 3 1
REGIÃOREgiOn
Norte / Centro-oeste / North / Center-west 39 27 6 27 1 -
Nordeste / Northeast 38 27 16 14 4 1
Sudeste / Southeast 59 23 5 11 2 -
Sul / South 67 15 5 12 1 -
DEPENDêNCIA ADMINISTRATIvAADMinisTRATiVE
JURisDiCTiOn
municipal / municipal 49 25 10 14 2 -
Estadual / State 53 22 7 16 2 -
COMPUTADOR INSTALADO
NO LABORATóRIO DE INFORMÁTICA
COMPUTER insTAllED AT iT lAb
Sim / yes 51 22 8 15 3 -
Não / No 50 27 10 11 1 -
INTERNET INSTALADA NO LABORATóRIO DE INFORMÁTICA
inTERnET AVAilAblE AT iT lAb
Sim / yes 52 23 8 14 3 -
Não / No 49 25 9 15 2 -
1 Base: 497 diretores. Respostas estimuladas e rodiziadas.¹ base: 497 principals. stimulated, alternated answers.
E1 PERCEPÇÃO DO DIRETOR SOBRE POSSÍvEIS OBSTÁCULOS PARA INOvAÇÃO – ContinuaçãoPrINCIPal’S PerCePtIoN oN PoteNtIal oBStaCleS to INNovatIoN – ContinuationPercentual sobre o total de diretores ¹Percentage of the total number of principals 1

Survey on ICT Education 2010TABLES OF RESuLTS – SELECTED INDICATORS FOR STuDENTS, DIRECTOR OF STuDIES, AND PRINCIPALS
PO
RTu
Gu
ÊS
En
gli
sh
430
Percentual (%)Percentage (%)
Não sei de que forma / para que atividades posso usar o computador e a Internet na escola
i do not know how / for what purpose to use computers and the internet in the school
Discordo totalmente
i totally disagree
Discordo em partei partly
disagree
Discordoi disagree
Concordo em parte i partly agree
Concordo totalmente
i totally agree
TOTAL 75 14 4 6 1
SEXOgEnDER
Feminino / female 76 13 5 5 1
masculino / male 72 17 2 9 -
FAIXA ETÁRIAAgE gROUP
≤ 30 90 10 - - -
31-45 76 13 4 8 1
46+ 73 16 5 5 1
RENDA FAMILIARFAMilY inCOME
Até 3 Sm up to 3 mw 83 13 - 4 -
mais de 3 até 5 Sm more than 3 up to 5 mw 77 14 4 6 -
mais de 5 Sm more than 5 mw 74 14 4 6 1
RENDA PESSOALinDiViDUAl inCOME
Até 3 Sm up to 3 mw 74 13 3 9 -
mais de 3 até 5 Sm more than 3 up to 5 mw 77 13 3 6 1
mais de 5 Sm more than 5 mw 73 16 6 5 1
REGIÃOREgiOn
Norte / Centro-oeste / North / Center-west 65 15 7 10 3
Nordeste / Northeast 70 15 6 9 1
Sudeste / Southeast 82 14 2 3 -
Sul / South 81 13 2 4 -
DEPENDêNCIA ADMINISTRATIvAADMinisTRATiVE
JURisDiCTiOn
municipal / municipal 73 14 4 8 1
Estadual / State 77 14 4 4 1
COMPUTADOR INSTALADO
NO LABORATóRIO DE INFORMÁTICA
COMPUTER insTAllED AT iT lAb
Sim / yes 76 13 4 6 1
Não / No 71 21 3 5 -
INTERNET INSTALADA NO LABORATóRIO DE INFORMÁTICA
inTERnET AVAilAblE AT iT lAb
Sim / yes 77 12 4 6 1
Não / No 72 18 5 5 1
1 Base: 497 diretores. Respostas estimuladas e rodiziadas.¹ base: 497 principals. stimulated, alternated answers.
E1 PERCEPÇÃO DO DIRETOR SOBRE POSSÍvEIS OBSTÁCULOS PARA INOvAÇÃO – ContinuaçãoPrINCIPal’S PerCePtIoN oN PoteNtIal oBStaCleS to INNovatIoN – ContinuationPercentual sobre o total de diretores ¹Percentage of the total number of principals 1

2010 Pesquisa TIC EducaçãoTABELAS DE RESuLTADOS – INDICADORES SELECIONADOS PARA ALuNOS, COORDENADORES PEDAGÓGICOS E DIRETORES
PO
RTu
Gu
ÊS
En
gli
sh
431
Percentual (%)Percentage (%)
Os professores tornam-se educadores menos eficazesTeachers become less effective educators
Discordo totalmente
i totally disagree
Discordo em partei partly
disagree
Discordoi disagree
Concordo em parte i partly agree
Concordo totalmente
i totally agree
Não sabe
Does not know
TOTAL 77 11 5 5 3 -
SEXOgEnDER
Feminino / female 77 10 5 5 2 -
masculino / male 77 12 3 2 4 1
FAIXA ETÁRIAAgE gROUP
≤ 30 68 11 - - 13 7
31-45 81 6 5 6 2 -
46+ 73 16 5 4 2 -
RENDA FAMILIARFAMilY inCOME
Até 3 Sm up to 3 mw 66 25 - - 4 4
mais de 3 até 5 Sm more than 3 up to 5 mw 80 6 6 7 1 -
mais de 5 Sm more than 5 mw 77 11 5 5 3 -
RENDA PESSOALinDiViDUAl inCOME
Até 3 Sm up to 3 mw 70 14 4 6 4 1
mais de 3 até 5 Sm more than 3 up to 5 mw 82 8 3 5 2 -
mais de 5 Sm more than 5 mw 74 12 7 4 3 -
REGIÃOREgiOn
Norte / Centro-oeste / North / Center-west 75 14 7 3 1 -
Nordeste / Northeast 70 13 7 5 4 1
Sudeste / Southeast 80 10 3 4 3 -
Sul / South 83 6 3 6 2 -
DEPENDêNCIA ADMINISTRATIvAADMinisTRATiVE
JURisDiCTiOn
municipal / municipal 80 8 5 4 3 -
Estadual / State 73 14 4 6 3 -
COMPUTADOR INSTALADO
NO LABORATóRIO DE INFORMÁTICA
COMPUTER insTAllED AT iT lAb
Sim / yes 76 11 5 5 3 -
Não / No 78 8 6 5 2 -
INTERNET INSTALADA NO LABORATóRIO DE INFORMÁTICA
inTERnET AVAilAblE AT iT lAb
Sim / yes 77 12 4 4 3 -
Não / No 76 9 7 5 2 1
1 Base: 497 diretores. Respostas estimuladas e rodiziadas.¹ base: 497 principals. stimulated, alternated answers.
E1 PERCEPÇÃO DO DIRETOR SOBRE POSSÍvEIS OBSTÁCULOS PARA INOvAÇÃO – ContinuaçãoPrINCIPal’S PerCePtIoN oN PoteNtIal oBStaCleS to INNovatIoN – ContinuationPercentual sobre o total de diretores ¹Percentage of the total number of principals 1


5aPêndices
AppenDixes


2010 Pesquisa TIC EducaçãoAPÊNDICES 435
PO
RTu
Gu
ÊS
GLoSSÁRIo
Baixar software – Ver Download.
Banda larga – Conexão à Internet com capacidade acima daquela usualmente conseguida em conexão disca-
da via sistema telefônico. Não há uma definição de métrica de banda larga aceita por todos, mas é comum que
conexões em banda larga sejam permanentes e não comutadas, como as conexões discadas. Mede-se a ban-
da em bps (bits por segundo) ou seus múltiplos, Kbps e Mbps. Banda larga, usualmente, compreende conexões
com mais de 256 Kbps, porém esse limite é muito variável de país para país e de serviço para serviço. No caso
desta pesquisa, banda larga refere-se a todas as conexões diferentes da conexão discada. ver conexão discada.
Blog – é uma contração da palavra “weblog”, usada para descrever uma forma de “diário” na Internet. A maior
parte dos blogs é mantida por indivíduos (como os diários no papel) que escrevem suas ideias sobre os aconte-
cimentos diários ou outros assuntos de interesse.
CD (Compact Disc) – Disco compacto. é um disco óptico com grande capacidade de armazenamento de dados.
é amplamente utilizado pela indústria fonográfica para a gravação de músicas.
CD Player – Aparelho leitor de disco compacto, que reproduz os arquivos armazenados no disco.
Celular com Internet (WAP, GPRS, UMTS, etc.) – Telefone celular que oferece como uma de suas funcionalida-
des a possibilidade de acesso à Internet. Por meio desses aparelhos é possível ler e-mails, navegar por páginas
da Internet, fazer compras e acessar informações de forma geral. Cada sigla (WAP, GPRS, UMTS) indica uma
tecnologia diferente para acessar a Internet pelo celular ou computador de mão.
Compressão de arquivos – Tarefa realizada por software para reduzir o tamanho de um arquivo digital de modo
a facilitar o envio e o recebimento via Internet. O programa mais utilizado é o Winzip.
Computador de mão (pocket PC, palmtop) – Computador pequeno, que cabe na palma da mão, do tamanho de
uma pequena agenda telefônica. Computadores de mão possuem muito mais funções que agendas eletrônicas
e podem receber e executar certos programas, o que não acontece com as agendas eletrônicas. Por ser peque-
no, seu desempenho é limitado em comparação com o de um computador de mesa ou um computador portátil.
Por outro lado, permite maior mobilidade.
Computador de mesa (desktop, PC) – A grande maioria dos computadores em uso é de mesa. desktop literal-
mente significa “sobre a mesa”, e é o termo usado para designar o computador pessoal em inglês. Geralmente, o
computador de mesa é composto de um monitor, que lembra um televisor, com um teclado à frente, um mouse
para movimentar o ponteiro na tela e uma caixa metálica onde ficam seus principais componentes eletrônicos.
Pesquisa TIC Educação 2010APÊNDICES436
PO
RTu
Gu
ÊS
Computador portátil (laptop, notebook, netbook, tablet) – é um computador compacto e fácil de transportar.
laptop, notebook, netbook e tablet Pc são os tipos mais comuns de computador portátil.
Conexão discada – Conexão comutada à Internet, realizada por meio de um modem analógico e uma linha da
rede de telefonia fixa, que requer que o modem disque um número telefônico para realizar o acesso.
Conexão via celular – Acesso à Internet sem fio, de longo alcance, que utiliza a transmissão sem fio das redes
de telefonia móvel, tais como hSCSD, GPRS, CDMA, GSM, entre outras.
Conexão via rádio – Conexão à Internet sem fio, de longo alcance, que utiliza radiofrequências para transmitir
sinais de dados (e prover o acesso à Internet) entre pontos fixos.
Conexão via satélite – Conexão à Internet sem fio, de longo alcance, que utiliza satélites para transmitir sinais
de dados (e prover o acesso à Internet) entre pontos fixos distantes entre si.
Cursos on-line – Método de ensino que conta com o suporte da Internet para educação a distância.
Datashow – Projetor de vídeo, que processa um sinal de vídeo e projeta a imagem correspondente em uma tela
usando um sistema de lentes.
Desktop / PC – Ver Computador de mesa.
Download – é a transferência de arquivos de um computador remoto / site para o computador “local” do usuá-
rio. No Brasil, é comum usar o termo “baixar” arquivos com o mesmo sentido que “fazer download”.
DVD (Digital Video Disc) – Disco óptico utilizado para armazenamento de dados, com alta capacidade de
armazenamento, muito superior à do CD.
E-learning – Ensino a distância. Cursos, de nível técnico, graduação e especialização que podem ser realiza-
dos por meio da Internet.
E-mail – O equivalente a “correio eletrônico”. Refere-se a um endereço eletrônico, ou seja, a uma caixa postal
para trocar mensagens pela Internet. Normalmente, a fórmula de um endereço de e-mail é “nome” + @ + “nome
do domínio”. Para enviar mensagens a um determinado usuário, é necessário escrever seu endereço eletrônico.
Excel (Microsoft Excel) – Software editor de planilhas desenvolvido pela empresa Microsoft.
Extranet – Extensão segura de uma Intranet que permite o acesso a alguns setores da Intranet de uma organiza-
ção aos usuários externos. Ver Intranet.
Facebook – Rede social na Internet, que permite a seus membros criar novas amizades e manter relacionamen-
tos. Ver Participar de sites de comunidades e relacionamentos.
Filtro – Configuração na conta de e-mail que bloqueia mensagens indesejadas ou não solicitadas. Ver Software
anti-spam.
Firewall – Software ou programa utilizado para proteger um computador de acessos não autorizados vindos da
Internet.
Fóruns – Ver Listas de discussão / Fóruns.
2010 Pesquisa TIC EducaçãoAPÊNDICES 437
PO
RTu
Gu
ÊS
IDH (Índice de Desenvolvimento Humano) – Indicador utilizado pelo Pnud, composto de três dimensões – saú-
de, educação e qualidade de vida – e medido a partir de quatro indicadores: expectativa de vida da população,
média de anos de estudo da população, expectativa de vida escolar e PIB per capita.
Internet banking – Conjunto de operações bancárias que podem ser feitas pela Internet, como ver saldo, fazer
transferências, pagar contas, entre outras.
Internet café – Local de acesso público, onde se pode usar computador e acessar a Internet. Normalmente seu
uso é pago. Ver Lanhouse.
Internet Explorer – Programa de navegação na Internet.
Kbps – Abreviatura de kilobits por segundo. é uma unidade de medida de transmissão de dados equivalente a
mil bits por segundo.
Lanhouse – Estabelecimento comercial em que é possível pagar para utilizar um computador com acesso à
Internet. é comum que esse estabelecimento ofereça também uma série de serviços, como impressão, xerox,
digitação, entre outros. No Brasil, a denominação lanhouse é a mais corrente, mas também podem ser chama-
dos de cyber café, ou Internet café.
Laptop – Ver Computador portátil.
Linux – Sistema operacional da família Unix, de código aberto, desenvolvido inicialmente por Linus Torvalds e
que hoje conta com milhares de desenvolvedores em colaboração.
Listas de discussão / Fóruns – Listas em que grupos de usuários trocam opiniões, comentam e discutem diver-
sos assuntos pertinentes a temas em comum.
Material on-line – Documentação ou conteúdo de curso ou atividade disponível para download pela Internet.
Mbps – Abreviatura de megabits por segundo. é uma unidade de medida de transmissão de dados equivalente
a mil kilobits por segundo.
Mecanismo de busca – Uma ferramenta na Internet que serve para a procura de informações em sites. O mais
conhecido atualmente é o Google.
Microsoft – Empresa multinacional de softwares, criadora do sistema operacional Windows e do pacote Office.
Mimeógrafo – Aparelho de impressão, elétrico ou manual, com que se reproduzem cópias de páginas escritas,
datilografadas ou de desenhos sobre matriz de papel ou metálica, chamada estêncil.
Mouse – Equipamento para mover o ponteiro do computador.
Mozilla Firefox – Programa de navegação na Internet.
Notebook – Ver Computador portátil.
On-line – Em linha. significa eletronicamente “disponível” no momento, ligado.

Pesquisa TIC Educação 2010APÊNDICES438
PO
RTu
Gu
ÊS
Página na Internet (webpage) – A web funciona como uma grande coleção de locais de informação agrupada.
Cada página de informação de um agrupamento é uma webpage. Ao agrupamento dessas páginas denomina-se
website, que significa literalmente “local na rede”.
PC (Personal Computer) – Ver Computador de mesa.
PIB (Produto Interno Bruto) – Representa a soma (em valores monetários) de todos os bens e serviços finais pro-
duzidos numa determinada região (quer seja, países, estados, cidades), durante um período determinado (mês,
trimestre, ano, etc.).
Palmtop – Ver Computador de mão.
Participar de sites de comunidades e relacionamentos – é possível se cadastrar em certas páginas da Internet
para entrar em contato com outras pessoas, fazer novos amigos, reencontrar os antigos e discutir assuntos de
interesse.
Sistema operacional – Programa ou Conjunto de programas e aplicativos que servem de interface entre o usu-
ário e o computador. O sistema operacional gerencia os recursos de hardware do computador via softwares.
Skype – Software que permite comunicação de voz pela Internet por meio de conexões VoIP (Voz sobre IP) e
pode substituir a linha telefônica tradicional.
Software – Qualquer programa de computador. O computador se divide em duas partes: a parte física e palpá-
vel (hardware) e a parte não física, os programas, que são as instruções para qualquer computador funcionar
(software).
Upload – é a transferência de arquivos de um computador “local” do usuário para uma máquina remota / site.
No Brasil, é comum usar o termo “subir” arquivos com o mesmo sentido que “fazer upload”.
Videoconferência – Comunicação de imagem (vídeo) e voz via Internet.
WAP (Wireless Application Protocol) – Protocolo de Aplicação sem Fio. é um padrão aberto que permite que
dispositivos móveis, como celulares ou PDAs, acessem na Internet informações ou serviços projetados especial-
mente para seu uso.
Webcam – Câmera de vídeo de baixo custo que capta e transfere imagens de modo quase instantâneo para o
computador. A conexão utilizada é do tipo USB. ver uSB.
Website – Literalmente, significa “local na rede”. Pode-se dizer que é um conjunto de páginas na Internet sobre
determinado tema, identificado por um endereço web. Ver Página na Internet.
WiFi (Wireless Fidelity) – Marca licenciada originalmente pela Wi-Fi Alliance para descrever a tecnologia de
redes sem fio (WLAN), baseadas no padrão IEEE 802.11.
Windows (Microsoft Windows) – Nome comercial do sistema operacional desenvolvido pela empresa Microsoft.
WinZip – Software utilizado para compactação e descompactação de arquivos digitais.
Word (Microsoft Word) – Software editor de texto desenvolvido pela empresa Microsoft, que faz parte do Pacote
Office.

2010 Pesquisa TIC EducaçãoAPÊNDICES 439
PO
RTu
Gu
ÊS
WWW (World Wide Web) – é a rede mundial de computadores.
YouTube – website que permite aos usuários carregar, ver e compartilhar vídeos em formato digital na Internet,
sem a necessidade de download do arquivo de vídeo para o computador.


2010 Pesquisa TIC EducaçãoAPÊNDICES 441
PO
RTu
Gu
ÊS
LISTA dE ABREvIATURAS
Abep – Associação Brasileira de Empresas de Pesquisa
CenPRA – Centro de Pesquisa Renato Archer
Cepal – Comissão Econômica para a América Latina e Caribe das Nações Unidas
Certi – Fundação Centros de Referência em Tecnologias Inovadoras
Eurostat – Instituto de Estatísticas da Comissão Europeia
FacTI – Fundação de Apoio à Capacitação em Tecnologia da Informação
Finep – Financiadora de Estudos e Projetos
IBGE – Instituto Brasileiro de Geografia e Estatística
Ideb – Índice de Desenvolvimento da Educação Básica
IEA – International Association for the Evaluation of Educational Achievement (Associação Internacional para a
Avaliação das Conquistas Educacionais)
Inep – Instituto Nacional de Estudos e Pesquisas Educacionais Anísio Teixeira
Ipea – Instituto de Pesquisa Econômica Aplicada
ITU – Agência das Nações Unidas especializada em TIC
LSI – Laboratório de Sistemas Integráveis Tecnológicos
MEC – Ministério da Educação
Minc – Ministério da Cultura
OCDE – Organização para a Cooperação e Desenvolvimento Econômico

Pesquisa TIC Educação 2010APÊNDICES442
PO
RTu
Gu
ÊS
OIT – Organização Internacional do Trabalho
OLPC – One Laptop per Child
Osilac – Observatório para a Sociedade da Informação na América Latina e Caribe
Pisa – Programa Internacional de Avaliação dos Alunos
Pnad – Pesquisa Nacional por Amostra de Domicílios
PNBL – Plano Nacional de Banda Larga
PNBLE – Programa Banda Larga nas Escolas
Pnud – Programa das Nações Unidas para o Desenvolvimento
Proinfo – Programa Nacional de Informática na Educação
Prouca – Programa Um Computador por Aluno
Saeb – Sistema Nacional de Avaliação da Educação Básica
SEED – Secretaria de Ensino à Distância, órgão do Ministério da Educação

En
gli
sh
2010 Survey on ICT EducationAPPENDIxES 443
GLoSSARY
Blog – It is a contraction of the words “web log” which is used to describe an online “journal”. The majority of
these blogs, similarly to paper journals, is maintained by individuals who write their ideas about daily events
and other topics of interest.
Broadband – Internet access that offers higher capacity than that usually supplied by dial-up connections.
There is no metric definition of broadband that is universally accepted. however, it is common for broadband
connections to be permanent and not commuted as the dial-up ones. Bandwidth is measured in bps (bits
per second) or its multiples, kbps and Mbps. Broadband usually comprises connections that supply download
speeds of more than 256 Kbps; but this is highly variable from country to country and service to service. For the
purpose of this survey, broadband comprises any connection that differs from dial-up connections. See Dial-up
connection.
CD (Compact Disc) – It is an optical disk with great data storage capacity. It is widely used by the music industry
to record songs.
CD player – Device used to read a compact disc, which reproduces all its stored files.
Datashow – Video projector, which processes a video signal and projects the image in a screen using a lens
system.
Desktop computer (PC) – Constitute the great majority of computers being used. Generally the computer
comprises a monitor, which resembles a TV set, with a keyboard in front of it, a mouse to move the arrow on the
screen, and a metal box where the main electronic components of a desktop are.
Dial-up connection – A temporary connection to the Internet via an analogue modem and standard telephone
line, which requires the modem to dial a phone number to access the Internet.
Discussion list/Forums – Lists in which groups of users exchange opinions, comment and discuss several issues
that are relevant to common themes.
Download – It is the transfer of files from a remote computer/website to user´s “local” computer.
DVD (Digital Video Disc) – Optical disc with high data storage capacity, far superior to the CD.
E-learning – Long distance technical, graduation and specialization courses that can be done through the
Internet.

En
gli
sh
Survey on ICT Education 2010APPENDIxES444
E-mail – Electronic mail is an electronic address, a type of PO Box, which enables message exchange through
the Internet. The usual configuration of an e-mail is “name” + @ + “domain name”. In order to send messages to
a certain user it is necessary to type in his/her e-mail.
Excel (Microsoft Excel) – Software developed by Microsoft to edit spreadsheets.
Extranet – A secure extension of an Intranet that allows external users to access some parts of an organization’s
Intranet. See Intranet.
Facebook – Social network in the Internet, which allows its members to create new friendships and maintain
relationships.
File compacting – Task performed by specific software that reduces the size of digital files in order to facilitate
sending and receiving them via the Internet. The most used software of this kind is Winzip.
Filter – E-mail account configuration that blocks unwanted or unsolicited messages. See Anti-spam software.
Firewall – Program or software used to protect a computer of unauthorized access from other Internet users.
Forums – See Discussion lists/Forums.
GDP (Gross Domestic Product) – Represents, in monetary values, all assets and final services produced in a
certain region (country, state or city) during some time (month, three months, year).
Handheld computer – A small computer that fits in the hand, and is the size of a small phonebook. handheld
computers have more functions than electronic calendars and can receive and execute certain programs, which
is not the case of phonebooks. Due to its size, its performance is limited when compared to the performance of
a desktop computer or a laptop computer. On the other hand, its size allows the owner to have greater mobility.
HDI (Human Development Index) – Index used by the UNDP, composed of three dimensions – health, education
and standard of living –, measured according to four indicator: life expectancy, average of years of study, school
life years and GDP per capita.
Internet banking – Set of bank transactions that can be done on the Internet, such as balance checks, money
transfers, bill payments among others.
Internet café – Public access facility where a computer can be used to access the Internet. Usually this usage
has to be paid for. See LAN house.
Internet Explorer – Internet browser developed by Microsfot.
Internet Mobile Phone (WAP, GPRS, UMTS, etc.) – Mobile phone that enables connection to the Internet.
Through these devices it is possible to read e-mails, browse through websites, shop and access information in
general. Each acronym (WAP, GPRS, UMTS) indicates a different technology used to access the Internet from a
mobile phone or a handheld computer.
Kbps – Stands for kilobits per second, a unit of measuring data transmission equivalent to a thousand bits per
second.

En
gli
sh
2010 Survey on ICT EducationAPPENDIxES 445
LAN house – A commercial establishment where people can pay to use a computer with access to the Internet.
This establishment usually offer many services, as printing, photocopying, digitation, among others. In Brazil,
LAN house is the most used term, but it can also be called cyber café or Internet café.
Laptop – See Portable computer.
Linux – Open source operating system from the Unix family, initially developed by Linus Torvalds and which
currently has thousands of developers working in collaboration.
Mbps – Abbreviation of megabits per second. It is a unit of measurement for data transmission equivalent to a
thousand kilobits per second.
Microsoft – Multinational software manufacturer, which developed the Windows operating system and Office
package.
Mimeograph – Printing device, electric or manual, which reproduces copies of written or typewritten pages or
drawings over a paper or metal matrix called stencil.
Mobile phone connection – Wireless, long range Internet connection, which uses a long range wireless
transmission from mobile network technologies such as hSCSD, GPRS, CDMA, GSM, etc.
Mouse – Computer pointing device.
Mozilla Firefox – Internet browser.
Notebook – See Portable computer.
Online – “Online” means electronically available at the moment, turned on.
Online courses – Teaching method that relies on Internet support for distance education (e-learning).
Online material – Documents or content from a course or activity available for download on the Internet.
Operating system – Group of computer programs and applications that works as the interface between the user
and the computer. The operating system manages the computer hardware resources via softwares.
Palmtop – See Handheld computer.
PC (Personal Computer) – See Desktop computer.
Portable computer (laptop, notebook, netbook, tablet PC) – It is a compact computer, easy to transport.
Radio connection – Wireless, long range Internet connection, which uses radio frequencies to transmit data
signals (and provide access to the Internet) between fixed points.
Satellite connection – Wireless, long range Internet connection, which uses satellites to transmit data signals
(and provide access to the Internet) between fixed points.
Search engines – Internet tool to search for information on websites. The most known is Google.

En
gli
sh
Survey on ICT Education 2010APPENDIxES446
Skype – Software that enables voice communication on the Internet over VoIP (Voice over IP), which can replace
the traditional landline.
Software – Any computer program. The computer is divided into two parts: the physical, tangible part (hardware),
and the non-physical part, the programs, which are the instructions for any computer to work (software).
Taking part in social networks – It is possible to register in some websites where you can get in touch with other
people, make new friends, meet with old friends and discuss themes of common interest.
Upload – A transfer of files from a “local” computer to a remote machine or website.
Videoconference – Image (video) and voice communication over the Internet.
WAP (Wireless Application Protocol) – An open standard that enables mobile devices, such as mobile phones
or PDAs, to access information and services, designed specifically for its use, over the Internet.
Webcam – Low cost video camera that captures and transfers images almost instantly to a computer. It is
connected to the computer through a USB port. See USB.
Webpage – Corresponds to a web address which one can see and browse through a browser. The web functions
as a great collection of sites where the information is grouped. Each information page from a group is a webpage.
A group of these pages is called “website”.
Website – Literally means a “place in the network”. You can say that it is a set of webpages of a particular issue
identified by a web address. See Webpage.
WiFi (Wireless Fidelity) – Trademark of Wi-Fi Alliance, created to describe a type of wireless network technology
(WLAN) based on the IEEE 802.11 standard.
Windows (Microsoft Windows) – Commercial name of the operating system developed by Microsoft.
WinZip – Software used to compress and decompress digital files.
Word (Microsoft Word) – Text editing software developed by Microsoft, which is part of Microsoft Office.
WWW (World Wide Web) – The world network of computers.
YouTube – Website that allows users to load, watch and share videos in digital format over the Internet, without
having to download the video file in their computer.

En
gli
sh
2010 Survey on ICT EducationAPPENDIxES 447
LIST oF ABBREvIATIoNS
Abep – Associação Brasileira de Empresas de Pesquisa (Brazilian Association of Research Institutes)
CenPRA – Centro de Pesquisa Renato Archer (Renato Archer Research Center)
Certi – Fundação Centros de Referência em Tecnologias Inovadoras (Foundation Reference Center on Innovative
Technologies)
FacTI – Fundação de Apoio à Capacitação em Tecnologia da Informação (Foundation of Support to IT Learning)
Finep – Financiadora de Estudos e Projetos (Financier of Studies and Projects)
IBGE – Instituto Brasileiro de Geografia e Estatística (Brazilian Institute of Geography and Statistics)
Ideb – Índice de Desenvolvimento da Educação Básica (Index of Basic EducationDevelopment)
IEA – International Association for the Evaluation of Educational Achievement
Inep – Instituto Nacional de Estudos e Pesquisas Educacionais Anísio Teixeira (Anisio Teixeira National Institute
of Education Study and Research)
Ipea – Instituto de Pesquisa Econômica Aplicada (Institute of Applied Economic Research)
ITU – International Telecommunication Union
LSI – Laboratório de Sistemas Integráveis Tecnológicos (Labs for Technological Integrable Systems)
MEC – Ministério da Educação (Ministry of Education)
Minc – Ministério da Cultura (Ministry of Cultural Affairs)
OCED – Organisation for Economic Co-operation and Development
OIT – Organização Internacional do Trabalho
OLPC – One Laptop per Child
Osilac – Observatory for the Information Society in Latin America and the Caribbean
En
gli
sh
Survey on ICT Education 2010APPENDIxES448
Pisa – Programa Internacional de Avaliação dos Alunos (International Program for Students Assessment)
Pnad – Pesquisa Nacional por Amostra de Domicílios (National Survey on household Sample)
PNBL – Plano Nacional de Banda Larga (National Plan for Broadband)
PNBLE – Programa Banda Larga nas Escolas (National Program for Broadband in Schools)
Proinfo – Programa Nacional de Informática na Educação (National Program for IT in Education)
Prouca – Programa Um Computador por Aluno (One Laptop per Student Program)
Saeb – Sistema Nacional de Avaliação da Educação Básica (National System of Basic Education Evaluation)
SEED – Secretaria de Ensino à Distância (E-Learning Office), a body of the Ministry of Education
UNDP – United Nations Development Program
UNECLAC – United Nations Economic Commission for Latin America and the Caribbean


www.cetic.br
Núcleo de Informação e Coordenação do Ponto BRBrazilian Network Information Center
Tel 55 11 5509 3511Fax 55 11 5509 3512
www.nic.br
ISBN 978-85-60062-45-4
9 788560 062454