
MSc Dissertation - For Jury Evaluation
86
FACULDADE DE E NGENHARIA DA UNIVERSIDADE DO P ORTO Liveness Detection in Biometrics Ana Rute Caetano Louro F OR J URY E VALUATION Mestrado Integrado em Engenharia Eletrotécnica e de Computadores Supervisor: Prof. Jaime Cardoso Co-Supervisor: Ana Filipa Sequeira June 30, 2014
Transcript of MSc Dissertation - For Jury Evaluation
FACULDADE DE ENGENHARIA DA UNIVERSIDADE DO PORTO
Liveness Detection in Biometrics
Ana Rute Caetano Louro
FOR JURY EVALUATION
Mestrado Integrado em Engenharia Eletrotécnica e de Computadores
Supervisor: Prof. Jaime Cardoso
Co-Supervisor: Ana Filipa Sequeira
June 30, 2014

c© Ana Rute Caetano Louro, 2014

Resumo
Sistemas biométricos de reconhecimento são mais vantajosos em relação aos métodos de recon-hecimento usuais pois permitem que um indivíduo seja reconhecido por aquilo que é e não peloque sabe ou tem em sua posse.Dois dos traços biométricos usados atualmente neste tipo de sistemas são a íris e a impressãodigital. Estes traços têm características únicas que permitem a distinção e o reconhecimento depessoas, no entanto, podem ser reproduzidos ou usados de forma fraudulenta.Um possível modo de defraudar um sistema de reconhecimento automático é através da apresen-tação de uma reprodução falsa do traço biométrico usado ao sensor. Uma forma de tentar subvertero número de casos de admissão de utilizadores falsos que tentam aceder ao sistema da forma acimadescrita é através do estudo da vivacidade do traço biométrico apresentado ao sensor. Assim, noâmbito desta dissertação, serão estudados e testados algoritmos de deteção de vivacidade da íris eda impressão digital.No caso da íris, o estudo foca-se em casos em que lentes de contacto são utilizadas para tentar de-fraudar o sistema de reconhecimento. Quanto à impressão digital, bases de dados com exemplaresfalsos obtidos a partir de moldes de impressões digitais reais são utilizadas para testar os métodosescolhidos.Os algoritmos utilizados são replicações de algoritmos do estado da arte, os quais são testados paraos dois traços biométricos escolhidos, tendo como objectivo estudar não só a precisão de cada al-goritmo individualmente, mas também comparar a sua performance em cada traço biométrico.Os resultados mostram que é possível obter resultados semelhantes ou até melhores que os obtidosno estado da arte, usando outras bases de dados de iris e impressões digitais, mas isso não acontecepara todas as bases de dados testadas, provando, então, que ainda é necessário melhorar ou talvezcombinar os algoritmos, de modo a reduzir ainda mais a taxa de erro de classificação.
i

ii
Abstract
Biometric recognition systems are more advantageous than traditional methods of recognition asthey allow the recognition of an individual for what he is and not for what he possesses or knows.Two of the currently most used biometric traits are the iris and the fingerprint. These traits haveunique characteristics that allow people’s recognition and distinction. However, they can also bereproduced or used fraudulently.A possible way of accessing the system fradulently is by presenting a fake reproduction of thebiometric trait to the sensor, which can by prevented by studying the liveness of the biometric trait.Therefore, in the context of this dissertation, liveness detection algorithms for iris and fingerprintwill be studied and tested.Concerning this, for the iris images the study is focused on cases where contact lenses are usedto spoof the recognition system. For the fingerprint, databases with fake samples obtained frommolds of real fingerprints are used to test the methods.The replicated algorithms are state of the art methods and were tested in both biometric traits, irisand fingerprint. Their accuracy is individually studied and its performance is also compared whenthe method is used with iris images and fingerprint images, aiming to assess if the same approachcan be used in both cases.The results show that it is possible to obtain results comparable or even better than the state-of-the-art ones, using other iris and fingerprint databases, but that does not occur for every databasetested. This proves that it is still necessary to improve or maybe combine the algorithms, so thatthe classification error rate drops.
iii

iv

Agradecimentos
Começo por agradecer ao meu orientador, Professor Jaime Cardoso, pela oportunidade de realizareste projecto em colaboração com o VCMI, pela orientação global do trabalho e propostas desoluções nos momentos em que os obstáculos me atingiram em força.Agradeço igualmente à minha co-orientadora, Ana Filipa Sequeira, sem a qual esta dissertaçãonão teria tido pernas para andar. Um muito sincero obrigada por toda a sua paciência, dedicação,disponibilidade e apoio fornecidos durante estes últimos seis meses de desenvolvimento desta dis-sertação.Uma palavra de apreço aos restante membros do VCMI pelo apoio prestado, pelas questões, sug-estões, explicações e simpatia.Agradeço ao João e ao Zé, por me acompanharem sempre nas pausas para café ou almoço, mesmoque algumas delas fossem apenas uma desculpa para libertar um pouco a mente do trabalho, e porme darem sugestões, dicas e apoio quanto a este processo, pelo qual também já passaram.Estou também grata a todos os amigos que fiz nestes últimos seis anos, sem os quais o meu per-curso académico não teria sido nem 1/10 tão divertido quanto o foi. As memórias das serenatas,das aulas às 8h da manhã, das tarde na AE e por aí fora, tornaram tudo tão especial...Um gigante abraço também, às minhas amigas Rey, Tatiana, Marta, Cláudia e Inês, por meapoiarem neste capítulo que agora termina, por se mostrarem sempre interessadas na minha dis-sertação e no rumo que esta levava ao longo do semestre e por perceberem a minha ausência emcertas ocasiões.Por último, mas com certeza mais importante, agradeço, do fundo do meu coração, à minhafamília, especialmente aos meus pais, que nunca deixaram de me apoiar e que acreditaram sempreno meu sucesso, mesmo quando eu própria não acreditava.
Ana Rute Louro
v

vi

”I love those who can smile in trouble, who can gather strength from distress, and grow brave byreflection. ’Tis the business of little minds to shrink, but they whose heart is firm, and whose
conscience approves their conduct, will pursue their principles unto death.”
Leonardo da Vinci
vii

viii
Contents
1 Introduction 11.1 Context . . . . . . . . . . . . . . . . . . . . . . . . . . . . . . . . . . . . . . . 11.2 Overview . . . . . . . . . . . . . . . . . . . . . . . . . . . . . . . . . . . . . . 11.3 Motivation . . . . . . . . . . . . . . . . . . . . . . . . . . . . . . . . . . . . . . 21.4 Objectives . . . . . . . . . . . . . . . . . . . . . . . . . . . . . . . . . . . . . . 21.5 Structure . . . . . . . . . . . . . . . . . . . . . . . . . . . . . . . . . . . . . . . 3
2 Biometrics’ Overview 52.1 Historical Context . . . . . . . . . . . . . . . . . . . . . . . . . . . . . . . . . . 52.2 Definition . . . . . . . . . . . . . . . . . . . . . . . . . . . . . . . . . . . . . . 52.3 Biometric Traits . . . . . . . . . . . . . . . . . . . . . . . . . . . . . . . . . . . 62.4 Biometric Systems . . . . . . . . . . . . . . . . . . . . . . . . . . . . . . . . . 7
2.4.1 Architecture . . . . . . . . . . . . . . . . . . . . . . . . . . . . . . . . . 72.4.2 Operating Mode . . . . . . . . . . . . . . . . . . . . . . . . . . . . . . 82.4.3 Accuracy Measurements . . . . . . . . . . . . . . . . . . . . . . . . . . 8
2.5 Spoofing Attacks . . . . . . . . . . . . . . . . . . . . . . . . . . . . . . . . . . 92.5.1 Accuracy Measurements . . . . . . . . . . . . . . . . . . . . . . . . . . 11
3 State of Art 133.1 Iris Recognition and Liveness Detection . . . . . . . . . . . . . . . . . . . . . . 13
3.1.1 Eye Anatomy . . . . . . . . . . . . . . . . . . . . . . . . . . . . . . . . 133.1.2 Iris Databases . . . . . . . . . . . . . . . . . . . . . . . . . . . . . . . . 143.1.3 Iris Recognition Methods . . . . . . . . . . . . . . . . . . . . . . . . . . 183.1.4 Commercially Available Solutions . . . . . . . . . . . . . . . . . . . . . 223.1.5 Iris Liveness Detection . . . . . . . . . . . . . . . . . . . . . . . . . . . 23
3.2 Fingerprint Recognition and Liveness Detection . . . . . . . . . . . . . . . . . . 283.2.1 Fingerprint Anatomy . . . . . . . . . . . . . . . . . . . . . . . . . . . . 283.2.2 Fingerprint Databases . . . . . . . . . . . . . . . . . . . . . . . . . . . 293.2.3 Fingerprint Recognition Methods . . . . . . . . . . . . . . . . . . . . . 313.2.4 Fingerprint Sensors . . . . . . . . . . . . . . . . . . . . . . . . . . . . . 333.2.5 Fingerprint Liveness Detection . . . . . . . . . . . . . . . . . . . . . . . 38
3.3 Summary . . . . . . . . . . . . . . . . . . . . . . . . . . . . . . . . . . . . . . 42
4 Methodology 434.1 Segmentation . . . . . . . . . . . . . . . . . . . . . . . . . . . . . . . . . . . . 434.2 Algorithms . . . . . . . . . . . . . . . . . . . . . . . . . . . . . . . . . . . . . 44
4.2.1 Algorithm I - Weighted Local Binary Patterns . . . . . . . . . . . . . . . 444.2.2 Algorithm II - Gray Level Co-occurence Matrices . . . . . . . . . . . . . 47
ix

x CONTENTS
4.3 Classification . . . . . . . . . . . . . . . . . . . . . . . . . . . . . . . . . . . . 51
5 Experimental Setup and Results 535.1 Databases . . . . . . . . . . . . . . . . . . . . . . . . . . . . . . . . . . . . . . 53
5.1.1 Iris . . . . . . . . . . . . . . . . . . . . . . . . . . . . . . . . . . . . . 535.1.2 Fingerprint . . . . . . . . . . . . . . . . . . . . . . . . . . . . . . . . . 53
5.2 Feature Extraction . . . . . . . . . . . . . . . . . . . . . . . . . . . . . . . . . . 535.2.1 Weighted Local Binary Patterns . . . . . . . . . . . . . . . . . . . . . . 535.2.2 Gray-Level Co-Occurence Matrices . . . . . . . . . . . . . . . . . . . . 54
5.3 Learning methodology . . . . . . . . . . . . . . . . . . . . . . . . . . . . . . . 545.3.1 Classification results using SVM . . . . . . . . . . . . . . . . . . . . . . 545.3.2 Cross-Validation . . . . . . . . . . . . . . . . . . . . . . . . . . . . . . 54
5.4 Evaluation Metrics . . . . . . . . . . . . . . . . . . . . . . . . . . . . . . . . . 555.5 Results for the Iris images . . . . . . . . . . . . . . . . . . . . . . . . . . . . . 555.6 Results for the Fingerprint images . . . . . . . . . . . . . . . . . . . . . . . . . 565.7 Discussion . . . . . . . . . . . . . . . . . . . . . . . . . . . . . . . . . . . . . . 58
5.7.1 Types of fake fingerprints comparison . . . . . . . . . . . . . . . . . . . 585.7.2 Comparison with the State of the Art . . . . . . . . . . . . . . . . . . . 59
6 Conclusions and Future Work 616.1 Conclusions . . . . . . . . . . . . . . . . . . . . . . . . . . . . . . . . . . . . . 616.2 Future Work . . . . . . . . . . . . . . . . . . . . . . . . . . . . . . . . . . . . . 62
References 63
List of Figures
2.1 Classification of Biometric Traits . . . . . . . . . . . . . . . . . . . . . . . . . . 72.2 Scheme of a typical Biometric System . . . . . . . . . . . . . . . . . . . . . . . 82.3 Representation of FAR and FRR . . . . . . . . . . . . . . . . . . . . . . . . . . 92.4 Vulnerable points of Biometric Systems . . . . . . . . . . . . . . . . . . . . . . 10
3.1 Human Eye Anatomy . . . . . . . . . . . . . . . . . . . . . . . . . . . . . . . . 133.2 Photograph of a Human Eye . . . . . . . . . . . . . . . . . . . . . . . . . . . . 143.3 Examples of iris images from BATH database . . . . . . . . . . . . . . . . . . . 143.4 Examples of iris images from CASIA database . . . . . . . . . . . . . . . . . . 153.5 Examples of iris images from ICE database. . . . . . . . . . . . . . . . . . . . . 153.6 Examples of iris images from WVU database . . . . . . . . . . . . . . . . . . . 163.7 Examples of iris images from UBIRIS.v1 database . . . . . . . . . . . . . . . . 163.8 Examples of iris images from UBIRIS.v2 database . . . . . . . . . . . . . . . . 163.9 Examples of iris images from MMU database . . . . . . . . . . . . . . . . . . . 173.10 Examples of iris images from UPOL database . . . . . . . . . . . . . . . . . . . 173.11 Examples of iris images from MobBIO database . . . . . . . . . . . . . . . . . . 183.12 Schematic diagram of Daugman’s iris recognition method . . . . . . . . . . . . . 183.13 Normalization of the iris image through Daugman’s Rubber Sheet . . . . . . . . 193.14 Schematic diagram of Wildes’ iris recognition method . . . . . . . . . . . . . . 203.15 Use of printed iris images in a biometric system . . . . . . . . . . . . . . . . . . 243.16 Examples of cosmetic contact lenses . . . . . . . . . . . . . . . . . . . . . . . . 243.17 Examples of iris images from CLARKSON database . . . . . . . . . . . . . . . 263.18 Examples of iris images from NOTRE DAME database. . . . . . . . . . . . . . 273.19 Examples of iris images from WARSAW database. . . . . . . . . . . . . . . . . 273.20 Examples of iris images from MobBIOfake database . . . . . . . . . . . . . . . 273.21 Examples of iris images from BIOSEC database . . . . . . . . . . . . . . . . . . 283.22 Three main fingerprint pattern types. . . . . . . . . . . . . . . . . . . . . . . . . 293.23 Core and delta points; Fingerprint minutiae details . . . . . . . . . . . . . . . . . 293.24 Examples of fingerprint images from FVC2006 database . . . . . . . . . . . . . 303.25 Fingerprint recognition system block diagram . . . . . . . . . . . . . . . . . . . 313.26 A fingerprint image faded into the corresponding direction map . . . . . . . . . . 313.27 Fingerprint image and corresponding binarized skeleton . . . . . . . . . . . . . . 323.28 Typical structure of a fingerprint scanner . . . . . . . . . . . . . . . . . . . . . . 333.29 Example of fingerprint scanners . . . . . . . . . . . . . . . . . . . . . . . . . . 333.30 Examples of plain, rolled, swept and multiple fingerprints. . . . . . . . . . . . . 343.31 FTIR fingerprint acquisition . . . . . . . . . . . . . . . . . . . . . . . . . . . . 353.32 Optical-fibers fingerprint acquisition . . . . . . . . . . . . . . . . . . . . . . . . 353.33 Electro-optical fingerprint acquisition . . . . . . . . . . . . . . . . . . . . . . . 36
xi
xii LIST OF FIGURES
3.34 Capacitive fingerprint acquisition . . . . . . . . . . . . . . . . . . . . . . . . . . 373.35 Ultrasound fingerprint acquisition . . . . . . . . . . . . . . . . . . . . . . . . . 383.36 Finger model and mold . . . . . . . . . . . . . . . . . . . . . . . . . . . . . . . 393.37 Examples of live fingerprints from the LivDet2013 datasets . . . . . . . . . . . . 413.38 Examples of fake fingerprints from the LivDet2013 datasets . . . . . . . . . . . 413.39 Examples of live and fake fingerprints from the ATVS database . . . . . . . . . . 42
4.1 Reference points obtained with the manual segmentation . . . . . . . . . . . . . 444.2 Representation of the Gaussian scale space generation . . . . . . . . . . . . . . . 454.3 Gradient orientations & Histogram of orientations . . . . . . . . . . . . . . . . . 454.4 Local Binary Pattern method scheme . . . . . . . . . . . . . . . . . . . . . . . . 464.5 Weighted LBP process . . . . . . . . . . . . . . . . . . . . . . . . . . . . . . . 464.6 Weighted LBP at different scales . . . . . . . . . . . . . . . . . . . . . . . . . . 474.7 GLCM method - Iris image pre-processing . . . . . . . . . . . . . . . . . . . . . 484.8 Example of the creation of a GLCM matrix . . . . . . . . . . . . . . . . . . . . 484.9 Directions used for the GLCM calculations . . . . . . . . . . . . . . . . . . . . 51
List of Tables
2.1 Comparative analysis of Biometric Traits . . . . . . . . . . . . . . . . . . . . . 7
3.1 Advantages and disadvantages of Wildes’ method . . . . . . . . . . . . . . . . . 22
5.1 Results of the SVM Classifier for GLCM and weighted LBP Features using Irisimages . . . . . . . . . . . . . . . . . . . . . . . . . . . . . . . . . . . . . . . . 56
5.2 Results of the SVM Classifier for GLCM and weighted LBP Features using theLivDet2013 - Biometrika dataset . . . . . . . . . . . . . . . . . . . . . . . . . . 57
5.3 Results of the SVM Classifier for GLCM and weighted LBP Features using theLivDet2013 - CrossMatch dataset . . . . . . . . . . . . . . . . . . . . . . . . . 57
5.4 Results of the SVM Classifier for GLCM and weighted LBP Features using theLivDet2013 - Italdata dataset . . . . . . . . . . . . . . . . . . . . . . . . . . . . 57
5.5 Results of the SVM Classifier for GLCM and weighted LBP Features using theLivDet2013 - Swipe dataset . . . . . . . . . . . . . . . . . . . . . . . . . . . . . 58
5.6 Best results for the GLCM method . . . . . . . . . . . . . . . . . . . . . . . . . 585.7 Best results for the weighted LBP method . . . . . . . . . . . . . . . . . . . . . 595.8 Best results for the GLCM method . . . . . . . . . . . . . . . . . . . . . . . . . 59
xiii

xiv LIST OF TABLES

Symbols and Abbreviations
3D Three dimensional2D Two dimensionalATM Automated teller machineBATH University of Bath Iris Image DatabaseBSIF Binarized Statistical Image FeaturesCASIA Institute of Automation Chinese Academy of Sciences Iris Image DatabaseCMOS Complementary metal–oxide–semiconductorCCD Charge-coupled DeviceDB DatabaseEER Equal Error RateFAR False Accept RateFFT Fast Fourier TransformFRR False Rejection RateFTIR Frustrated Total Internal ReflectionFVC First Verification CompetitionGLCM Gray Level Co-occurrence MatricesICE Iris Challenge Evaluation Iris Image DatabaseID IdentificationIR Infra-redIRIS Iris Recognition Immigration SystemLBP Local Binary PatternLED light-emitting diodeLPQ Local Phase QuantizationMatLab Matrix LaboratoryMMU Multimedia University Iris Image DatabaseNIST National Institute of Standards and TechnologyRFID Radio-Frequency IdentificationRGB Red Green and Blue additive color modelROI Region of InterestSIFT Scale Invariant Feature TransformSVM Support Vector MachineUBIRIS University of Beira Interior Iris Image DatabaseUID Unique IdentificationUPOL Univerzita Palackého V Olomouci Iris Image DatabaseVCMI Visual Computing and Machine IntelligenceWLB Weber Local DescriptorwLBP Weighted Local Binary PatternWVU West Virginia University Iris Image Database
xv

Chapter 1
Introduction
1.1 Context
This work was developed in the context of the Curricular Unit (EEC0020) - Dissertation, from
the Integrated Master in Electrical and Computer Engineering from the Faculty of Engineering of
Porto University. It was done in collaboration with the VCMI (Virtual Computing and Machine
Intelligence) group at INESC TEC - Porto.
In order to provide global information about this project and update the state of it, a website was
created and is available at http://paginas.fe.up.pt/~ee08206.
1.2 Overview
Personal recognition is the process of determining the identity of a particular individual from a
database of known people [1]. Recognizing someone’s identity has been a concern of modern
societies now that the restriction of access to data is crucial in almost every contemporary field,
mostly due to fraud attempts and other illegal attacks. The most frequent recognition applications
are the ones used for criminal investigation, access to security systems or restricted areas, border
control and access to computers or cellphones.
The traditional way of validating one’s identity is by using something that can be possessed or
learnt, as a magnetic card, Radio-Frequency Identification (RFID) card or a password. However,
as items and keys can be lost, stolen, forgotten or revealed, enabling fraudulent usage, it is known
that a more reliable way of recognition is by using something that one is, instead of something that
one has or knows.
For this reason, it is becoming conventional the application of biometrics in recognition systems.
This phenomenon is arising due to the fact that biometrics recognition systems operate based on
physical or behavioral features, called biometric traits, which are usually exclusive of each person
[1].
A biometric recognition system can use one or several human traits as samples, being the most
commonly adopted the fingerprint, the speech, the face, the iris or the retina.
1

2 Introduction
The fingerprint is the most known biometric trait used in recognition systems and it is still the
most used one due to its easiness of acquisition, high distinctiveness, persistence, and acceptance
by the users [2].
On the other hand, iris recognition is increasingly employed in admission systems and it is con-
stantly evolving. It has been considered as one of the strongest recognition methods due to the
characteristics of the human iris, which are usually exclusive to a singular individual.
The fact that the iris is such an exclusive human feature becomes a huge advantage when used in
recognition systems. However, contrary to what was believed to be true, recent researches [3, 4]
conclude that the aging of an iris template is possible and it leads to the increment of the error rate
between an enrollment image and an image taken for the recognition process, a few years after.
1.3 Motivation
Currently, iris and fingerprint recognition systems can be found worldwide with outstanding rates
of success.
Whilst recognition methods evolve, new ways of spoofing them break out as well, creating a need
for safer solutions in order to guarantee the authenticity of the collected images.
Prior to the recognition process, especially in a scenario where no human control is required, the
system should be able to recognize whether a biometric trait is real or if someone is trying to access
the system fraudulently. One way of achieving that is by assessing the liveness of the sample.
Since both iris and fingerprints are rich in texture, the same methods of detecting the liveness of
the traits could be, theoretically, applied to them. The challenge now is to test if a method perform
the same way with different traits or if the characteristics of iris and fingerprints influence the
accuracy of a liveness detection method.
1.4 Objectives
The aim of the dissertation "Liveness Detection in Biometrics" is to review existing algorithms for
liveness detection in iris and fingerprint recognition systems.
These two biometric traits were chosen because one of them is the most known trait (fingerprint)
and the other has been gaining popularity in this type of system (iris). Also, they are both known
for their advantages in terms of unique anatomical characteristics.
One of the objectives of this work is to test iris liveness detection algorithms in cases where cos-
metic contact lenses are used, as this is a relatively new way of spoofing recognition systems.
Two databases containing patterned contact lenses were used to test the selected algorithms were
used, which are are Notre Dame and Clarkson.
The second stage of this project is to test the same algorithms in fingerprint databases with fake
samples. The database chosen for this trait was the LivDet2013.

1.5 Structure 3
With the results from both tests, we should be able to compare the effectiveness of the used meth-
ods in two different biometric traits.
1.5 Structure
The remaining chapters of this document are organized as follows: Chapter 2 gives a brief overview
of the global topic of this dissertation, "Biometrics". Chapter 3 describes the State of the Art of the
topics related to the proposed work. This Chapter is sub-divided in: Iris Recognition and Liveness
Detection and Fingerprint Recognition and Liveness Detection. A brief summary is presented as
the last topic in this chapter.
Chapter 4 presents the methodology and algorithms used during the development of this disserta-
tion, followed by Chapter 5 where the practical setup and results are presented and analyzed.
Lastly, Chapter 6 gives the conclusions, difficulties found and future work suggestions for this
theme.

4 Introduction
Chapter 2
Biometrics’ Overview
2.1 Historical Context
It is known that the first scientific system for human identification appeared in the 19th century.
However, the use of biometrics as a way of identifying people has been present in the human life
since prehistorical times, as palm prints were found in ancient petroglyphs and it has been said
that those handprints were used to sign the paintings [5].
Also, around 200 BC, Chinese records include descriptions of the use of handprints as evidence
during robbery investigations, revealing that the first applications of biometrics as we know it were
mainly for forensic and law enforcement use. It is known that, later, also in China, palms and feet
of children were stamped on paper to register them [6].
As quoted in the first paragraph, the first science-based identification system appeared in the 19th
century, created by Alphonse Bertillon, who introduced the use of a number of anthropomorphic
measurements to identify criminals. Due to the fact that Bertillon’s system was time consuming
and, not much later on, the use of fingerprints became the standard security biometric system
worldwide, his system quickly became obsolete [7].
Lately, modern societies are becoming concerned about the security and accuracy of recognition
systems due to the increasing of terrorist acts and scam schemes. There is, then, a need to exploit
other biometric features, which may be more impervious to attacks than fingerprints.
Nowadays, several systems are using other types of characteristics, such as face, iris, or speech
and those systems are applied not only for forensic purposes, but also to a range of other things
like accessing a room or a computer, or authenticating in a public network.
2.2 Definition
The etymology of the word “biometrics” comes from the Greek “bio-” which refers to one’s life,
course or way of living, and “-metros” which means measure [8]. Even though this term has
been previously used in the field of statistics to refer to the analysis of biological data (which is
now known as biostatistics), it is generally used to refer to an automated method of authenticating
5

6 Biometrics’ Overview
individuals based on anatomical or behavioral human characteristics [9, 10].
The fact that biometrics use physical or observable characteristics makes it a reliable solution
to authenticate individuals since it recognizes unique features that are not secret, i.e. even though
everyone can see the physical/behavioral characteristics of the subject, they cannot memorize them
in order to access the authentication system [10].
The use of a specific anatomic trait relies upon its distinctiveness and permanence. The accuracy
of the system depends, ultimately, on those two premises and how much they hold true for general
population [7].
The use of biometrics can be split in two branches: identification and verification. Identification
imples establishing a person’s identity based on his/hers biometric traits and aims to answer the
question: "Who is this person?". Verification, on the other hand, involves confirming or denying
someone’s identity, aiming to reply the query: "Is this person who he/she claims he/she is?" [9].
2.3 Biometric Traits
Biometric traits are physical and behavioral human features used by identification and verification
applications. The most common human features used for biometric purposes are:
• Fingerprint;
• Iris;
• Face;
• Voice;
• Signature;
• Hand Geometry;
• DNA;
• Keystroke;
• Gait.
Physical traits normally refer to a part of the human body like the face, the eyes, the hands, etc. On
the other hand, behavioral traits relate to the conduct of a person, e.g. the voice or the signature.
Biometric traits can also be labeled as genotypic or phenotypic. Genotypic features are geneti-
cally defined, while phenotypic features can be changed over time and depend on the surrounding
environment [11, 12].
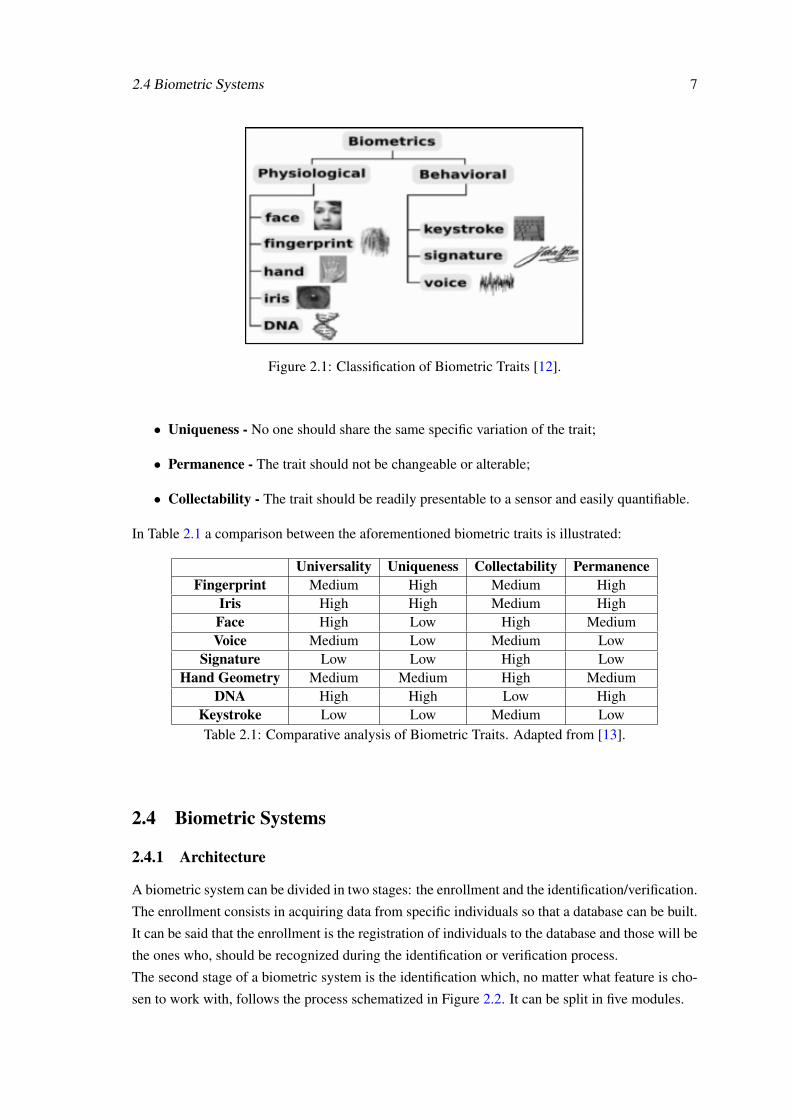
Figure 2.1 illustrates the division of those traits in the correspondent categories of physical or
behavioral.
The choice of a trait for a biometric system can affect the effectiveness and efficiency of it, so
there are some aspects that biometric traits are expected to have and that should be taken into
account while developing a recognition system:
• Universality - Every person must possess their specific variation of the trait;
2.4 Biometric Systems 7
Figure 2.1: Classification of Biometric Traits [12].
• Uniqueness - No one should share the same specific variation of the trait;
• Permanence - The trait should not be changeable or alterable;
• Collectability - The trait should be readily presentable to a sensor and easily quantifiable.
In Table 2.1 a comparison between the aforementioned biometric traits is illustrated:
Universality Uniqueness Collectability PermanenceFingerprint Medium High Medium High
Iris High High Medium HighFace High Low High MediumVoice Medium Low Medium Low
Signature Low Low High LowHand Geometry Medium Medium High Medium
DNA High High Low HighKeystroke Low Low Medium LowTable 2.1: Comparative analysis of Biometric Traits. Adapted from [13].
2.4 Biometric Systems
2.4.1 Architecture
A biometric system can be divided in two stages: the enrollment and the identification/verification.
The enrollment consists in acquiring data from specific individuals so that a database can be built.
It can be said that the enrollment is the registration of individuals to the database and those will be
the ones who, should be recognized during the identification or verification process.
The second stage of a biometric system is the identification which, no matter what feature is cho-
sen to work with, follows the process schematized in Figure 2.2. It can be split in five modules.
8 Biometrics’ Overview
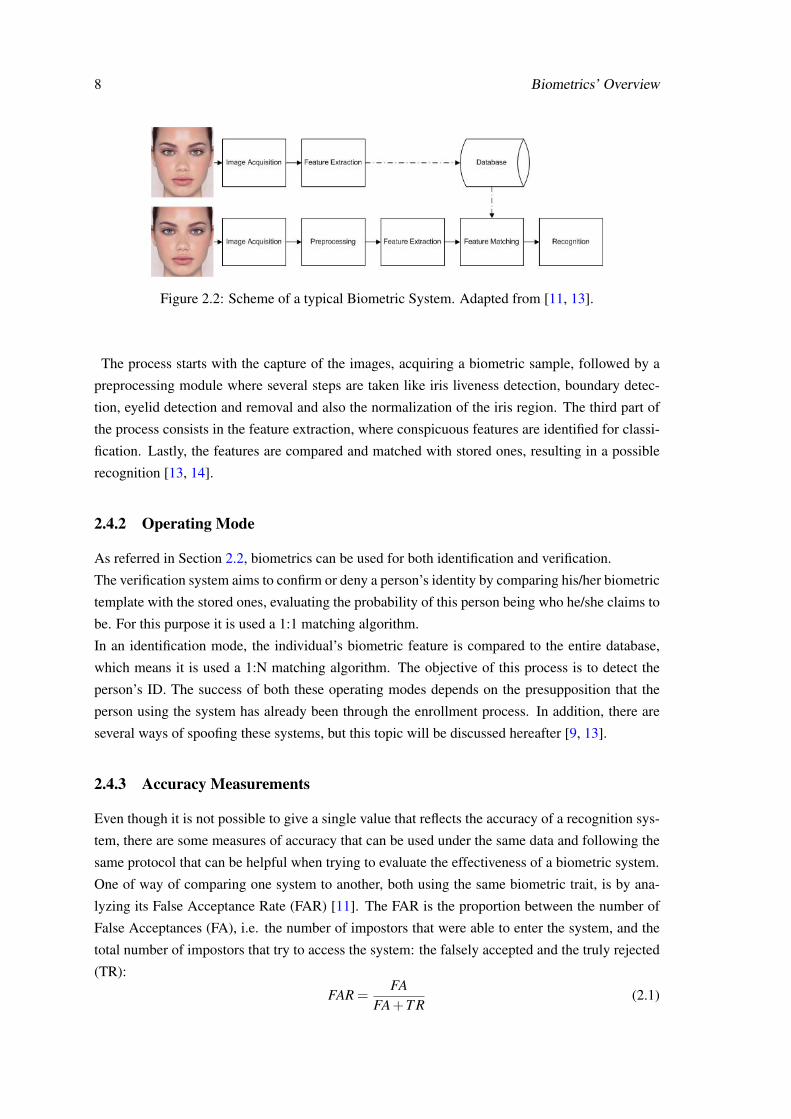
Figure 2.2: Scheme of a typical Biometric System. Adapted from [11, 13].
The process starts with the capture of the images, acquiring a biometric sample, followed by a
preprocessing module where several steps are taken like iris liveness detection, boundary detec-
tion, eyelid detection and removal and also the normalization of the iris region. The third part of
the process consists in the feature extraction, where conspicuous features are identified for classi-
fication. Lastly, the features are compared and matched with stored ones, resulting in a possible
recognition [13, 14].
2.4.2 Operating Mode
As referred in Section 2.2, biometrics can be used for both identification and verification.
The verification system aims to confirm or deny a person’s identity by comparing his/her biometric
template with the stored ones, evaluating the probability of this person being who he/she claims to
be. For this purpose it is used a 1:1 matching algorithm.
In an identification mode, the individual’s biometric feature is compared to the entire database,
which means it is used a 1:N matching algorithm. The objective of this process is to detect the
person’s ID. The success of both these operating modes depends on the presupposition that the
person using the system has already been through the enrollment process. In addition, there are
several ways of spoofing these systems, but this topic will be discussed hereafter [9, 13].
2.4.3 Accuracy Measurements
Even though it is not possible to give a single value that reflects the accuracy of a recognition sys-
tem, there are some measures of accuracy that can be used under the same data and following the
same protocol that can be helpful when trying to evaluate the effectiveness of a biometric system.
One of way of comparing one system to another, both using the same biometric trait, is by ana-
lyzing its False Acceptance Rate (FAR) [11]. The FAR is the proportion between the number of
False Acceptances (FA), i.e. the number of impostors that were able to enter the system, and the
total number of impostors that try to access the system: the falsely accepted and the truly rejected
(TR):
FAR =FA
FA+T R(2.1)
2.5 Spoofing Attacks 9
The FAR measures, then, the probability of confusing two identities, but it is only meaningful
when presented simultaneously with the False Rejection Rate (FRR).
The FRR is the probability of the identity a valid user being denied and it can be calculated as the
proportion between the False Rejections (FR) and the total number of users that try to access the
system, the falsely rejected and the truly accepted (TA).
FRR =FR
FR+TA(2.2)
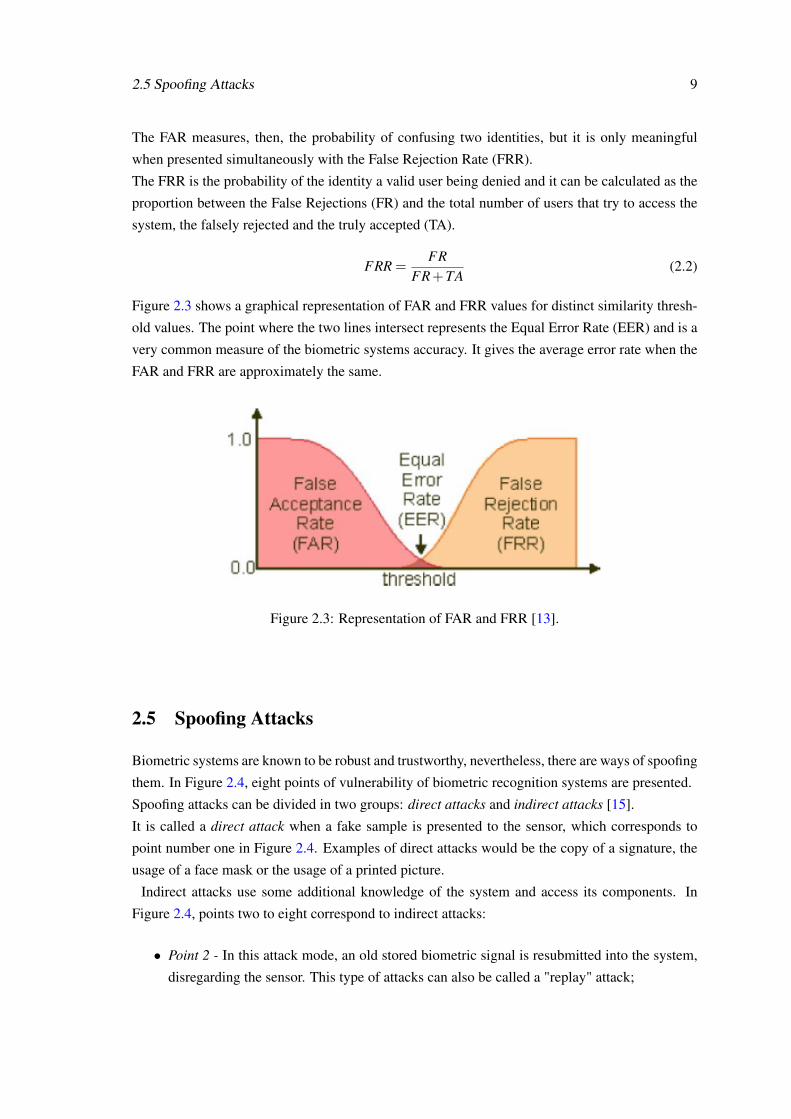
Figure 2.3 shows a graphical representation of FAR and FRR values for distinct similarity thresh-
old values. The point where the two lines intersect represents the Equal Error Rate (EER) and is a
very common measure of the biometric systems accuracy. It gives the average error rate when the
FAR and FRR are approximately the same.
Figure 2.3: Representation of FAR and FRR [13].
2.5 Spoofing Attacks
Biometric systems are known to be robust and trustworthy, nevertheless, there are ways of spoofing
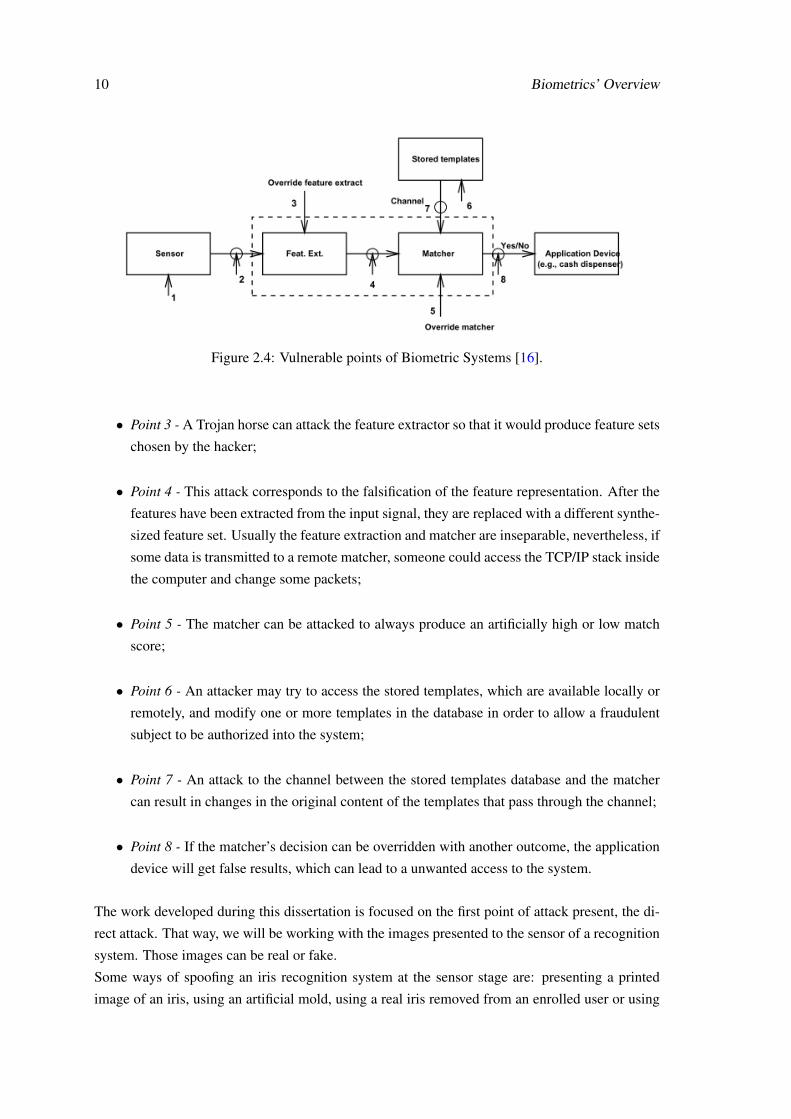
them. In Figure 2.4, eight points of vulnerability of biometric recognition systems are presented.
Spoofing attacks can be divided in two groups: direct attacks and indirect attacks [15].
It is called a direct attack when a fake sample is presented to the sensor, which corresponds to
point number one in Figure 2.4. Examples of direct attacks would be the copy of a signature, the
usage of a face mask or the usage of a printed picture.
Indirect attacks use some additional knowledge of the system and access its components. In
Figure 2.4, points two to eight correspond to indirect attacks:
• Point 2 - In this attack mode, an old stored biometric signal is resubmitted into the system,
disregarding the sensor. This type of attacks can also be called a "replay" attack;
10 Biometrics’ Overview
Figure 2.4: Vulnerable points of Biometric Systems [16].
• Point 3 - A Trojan horse can attack the feature extractor so that it would produce feature sets
chosen by the hacker;
• Point 4 - This attack corresponds to the falsification of the feature representation. After the
features have been extracted from the input signal, they are replaced with a different synthe-
sized feature set. Usually the feature extraction and matcher are inseparable, nevertheless, if
some data is transmitted to a remote matcher, someone could access the TCP/IP stack inside
the computer and change some packets;
• Point 5 - The matcher can be attacked to always produce an artificially high or low match
score;
• Point 6 - An attacker may try to access the stored templates, which are available locally or
remotely, and modify one or more templates in the database in order to allow a fraudulent
subject to be authorized into the system;
• Point 7 - An attack to the channel between the stored templates database and the matcher
can result in changes in the original content of the templates that pass through the channel;
• Point 8 - If the matcher’s decision can be overridden with another outcome, the application
device will get false results, which can lead to a unwanted access to the system.
The work developed during this dissertation is focused on the first point of attack present, the di-
rect attack. That way, we will be working with the images presented to the sensor of a recognition
system. Those images can be real or fake.
Some ways of spoofing an iris recognition system at the sensor stage are: presenting a printed
image of an iris, using an artificial mold, using a real iris removed from an enrolled user or using
2.5 Spoofing Attacks 11
printed contact lenses.
On the other hand, the access to a fingerprint recognition system can be forged by using printed
images of a fingerprint, using a real finger removed from an authentic user or by creating a mold
of a finger. That can be done with the user cooperation, that is, the user placed his finger in a
material capable of creating a mold, or without user cooperation, through capturing a fingerprint
let on a surface of object.
Our purpose is then to classify iris and fingerprint images as real or fake. That can be done by
studying the liveness of the trait.
2.5.1 Accuracy Measurements
To determine whether a liveness detection method is viable or not, one should assess the perfor-
mance of its classification system. The classification is usually measured in terms of error rate or
accuracy [17].
The error rate is calculated by finding the ratio between the number of misclassified images and
the total number of images in the testing set. The accuracy is precisely the opposite of the error
rate, that is, the percentage of correctly classified images.
Error Rate =misclassified images
total number of images×100(%) (2.3)
Accuracy = 100%−Error Rate (2.4)

12 Biometrics’ Overview

Chapter 3
State of Art
3.1 Iris Recognition and Liveness Detection
3.1.1 Eye Anatomy
The eye (Figure 3.1) is a globular and hollow part of the human body composed by three layers:
the internal, external and middle layer [13].
The external layer can also be called fibrous tunic and is constituted by the sclera and the cornea.
The middle layer, or uvea/vascular tunic, has the iris and the cilliar body in it; and the internal
layer, called nervous tunic, is composed by the retina.
Figure 3.1: Human Eye Anatomy [11].
When observing a human eye (Figure 3.2), in a non-invasive way, three of its features can be seen:
the sclera, the pupil and the iris.
The sclera, commonly known as the white area of the eye, is a tough and fibrous tissue that sur-
rounds the eye and aims to protect it, maintain the 3D shape of it and connect it with some of the
movement muscles.
The pupil is a black hole located in the center of the eye that allows light to enter the retina. The
13
14 State of Art
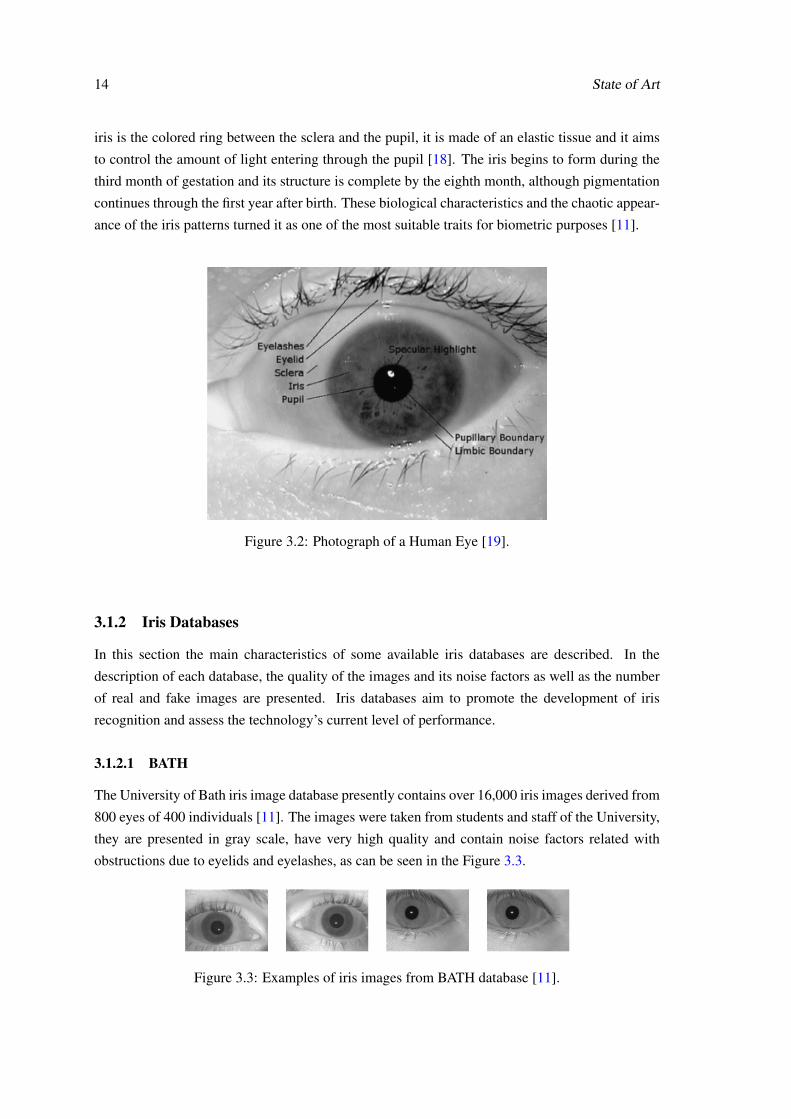
iris is the colored ring between the sclera and the pupil, it is made of an elastic tissue and it aims
to control the amount of light entering through the pupil [18]. The iris begins to form during the
third month of gestation and its structure is complete by the eighth month, although pigmentation
continues through the first year after birth. These biological characteristics and the chaotic appear-
ance of the iris patterns turned it as one of the most suitable traits for biometric purposes [11].
Figure 3.2: Photograph of a Human Eye [19].
3.1.2 Iris Databases
In this section the main characteristics of some available iris databases are described. In the
description of each database, the quality of the images and its noise factors as well as the number
of real and fake images are presented. Iris databases aim to promote the development of iris
recognition and assess the technology’s current level of performance.
3.1.2.1 BATH
The University of Bath iris image database presently contains over 16,000 iris images derived from
800 eyes of 400 individuals [11]. The images were taken from students and staff of the University,
they are presented in gray scale, have very high quality and contain noise factors related with
obstructions due to eyelids and eyelashes, as can be seen in the Figure 3.3.
Figure 3.3: Examples of iris images from BATH database [11].

3.1 Iris Recognition and Liveness Detection 15
3.1.2.2 CASIA
The latest version of CASIA database, CASIA-Irisv4 [20], contains a total of 54,607 iris images.
This database has several similarities with the BATH database (Subsection 3.1.2.1) since its images
were also captured under very constrained circumstances thus conditioning the resultant images.
All iris images from the CASIA-Irisv4 database are 8 bit gray-level JPEG files, they present ho-
mogeneous characteristics and their noise factors are related with iris obstructions.
It comprises six data subsets, which were collected or synthesized at different times: CASIA-Iris-
Interval, CASIA-Iris-Lamp, CASIA-Iris-Distance, CASIA-Iris-Thousand, CASIA-Iris-Twins and
CASIA-Iris-Syn.
Figure 3.4: Examples of iris images from CASIA database [11].
3.1.2.3 ICE
The ICE database [21] is the database of the contest Iris Challenge Evaluation. The database is
constituted of 2,954 images, with a variable number of images per individual.
The images from the ICE database have high quality, their noise factors are mostly related to iris
obstructions and poorly focused images.
Figure 3.5: Examples of iris images from ICE database [11].
3.1.2.4 WVU
The WVU database [22] was developed by the West Virginia University and it consists of 1,852
images from 380 different eyes.
The images from this DB were captured under less constrained conditions and thus incorporate
assorted types of noise, such as iris obstruction, poorly focused images and off-angle images. Few
images have some regions affected by specular and lighting reflections which result from their
acquisition under a natural environment.
16 State of Art
Figure 3.6: Examples of iris images from WVU database [11].
3.1.2.5 UBIRIS.v1
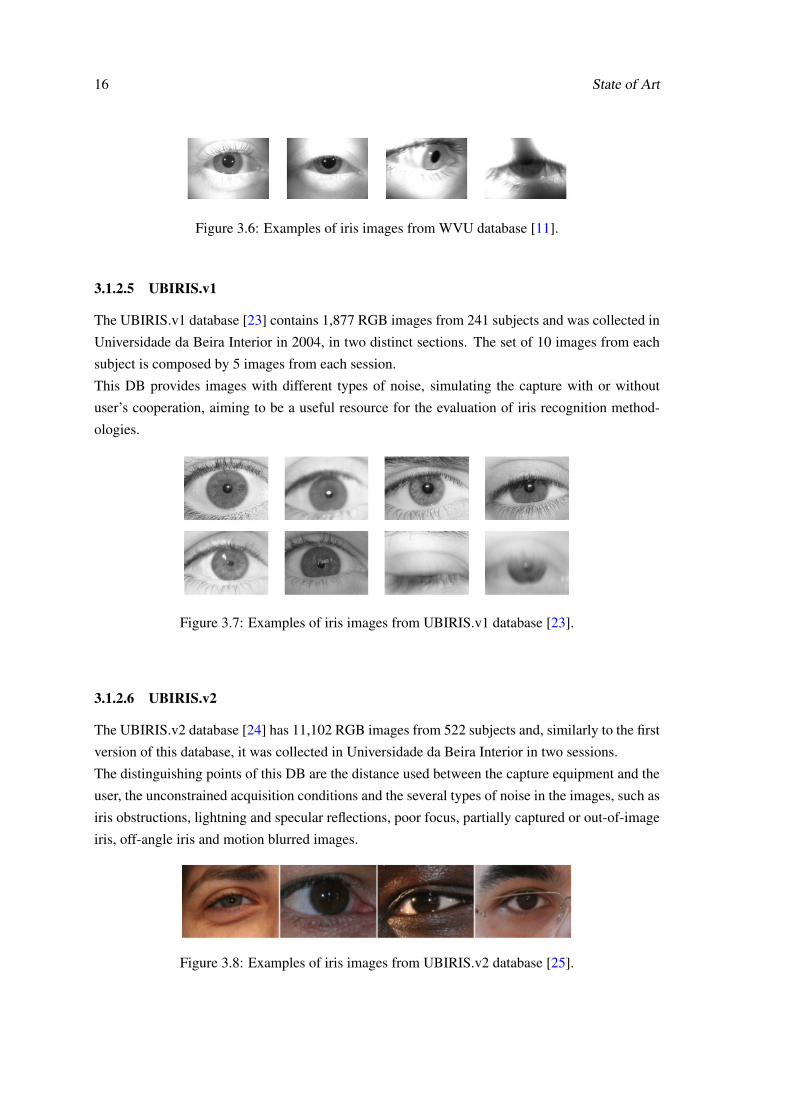
The UBIRIS.v1 database [23] contains 1,877 RGB images from 241 subjects and was collected in
Universidade da Beira Interior in 2004, in two distinct sections. The set of 10 images from each
subject is composed by 5 images from each session.
This DB provides images with different types of noise, simulating the capture with or without
user’s cooperation, aiming to be a useful resource for the evaluation of iris recognition method-
ologies.
Figure 3.7: Examples of iris images from UBIRIS.v1 database [23].
3.1.2.6 UBIRIS.v2
The UBIRIS.v2 database [24] has 11,102 RGB images from 522 subjects and, similarly to the first
version of this database, it was collected in Universidade da Beira Interior in two sessions.
The distinguishing points of this DB are the distance used between the capture equipment and the
user, the unconstrained acquisition conditions and the several types of noise in the images, such as
iris obstructions, lightning and specular reflections, poor focus, partially captured or out-of-image
iris, off-angle iris and motion blurred images.
Figure 3.8: Examples of iris images from UBIRIS.v2 database [25].

3.1 Iris Recognition and Liveness Detection 17
3.1.2.7 MMU
The MMU database [26] was developed by the Multimedia University and is constituted by 450
images of iris. Afterwards, a new dataset with 995 images was made, MMU2. The images were
captured from 100 subjects with different ages and nationalities that provided five images from
each eye. Analogous to other databases, MMU contains highly homogeneous images and their
noise factors are related with iris obstructions and eye rotation, as can be seen in the second image
of Figure 3.9.
Figure 3.9: Examples of iris images from MMU database [11].
3.1.2.8 UPOL
The UPOL database is an iris image database that contains 384 images extracted from 64 subjects,
with three iris images per eye. This database was built within the University of Palackého and
Olomouc and its images were captured with optometric equipment, leading to very high quality
images and maximum homogeneity. A dark circle (Figure 3.10) was added around the iris in all
images in order to allow an easier segmentation.
Figure 3.10: Examples of iris images from UPOL database [11].
3.1.2.9 MobBIO
The MobBIO [27] database was created by a group of researchers of the Visual Computing and
Machine Intelligence (VCMI) group at INESC Porto and contains biometric data from the face,
iris and voice of 105 individuals.
The images are colored and were captured by the back camera of an Asus Transformer Pad TF
300T, with a resolution of 8 megapixels and auto-focus.
Some types of noise factors can be found in this database images such as iris obstructions, glasses
reflection and occlusion, reflection occlusion and off-angle iris.
18 State of Art
Figure 3.11: Examples of iris images from MobBIO database[27].
3.1.3 Iris Recognition Methods
In this section two classic methods in the iris recognition field are presented. The methods de-
scribed are the Daugman’s and Wildes’ methods, considered as pioneers in this area.
3.1.3.1 Daugman’s method
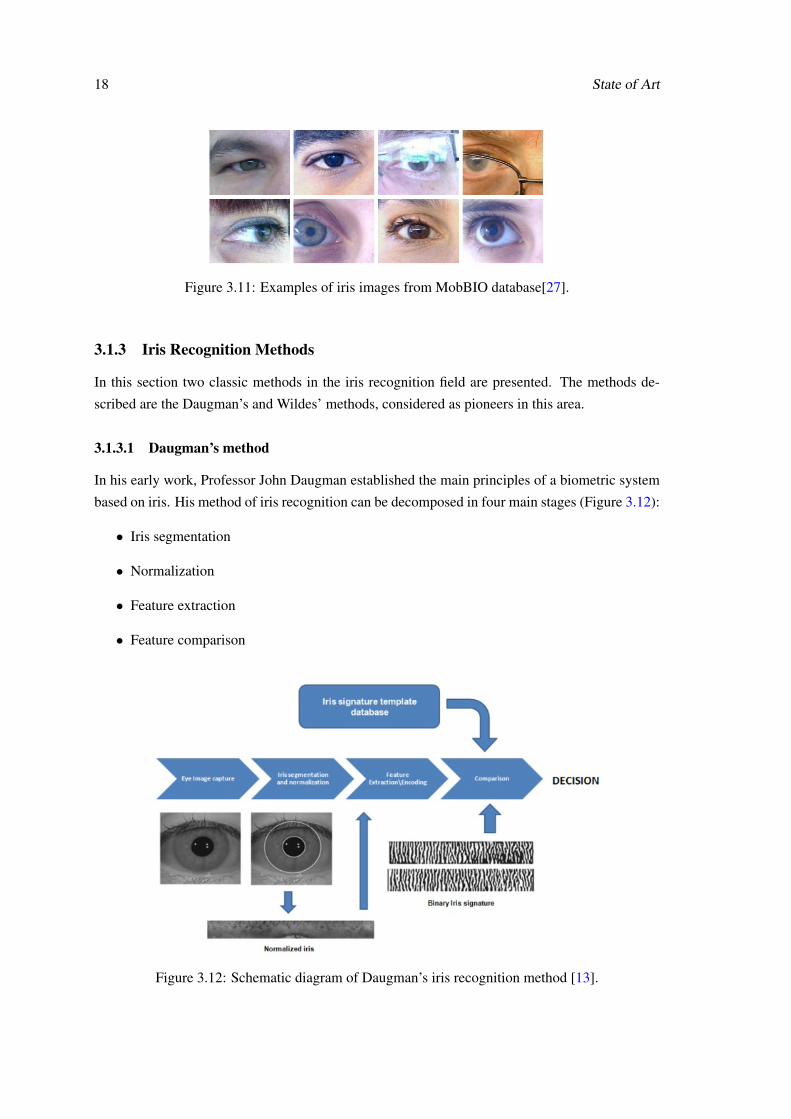
In his early work, Professor John Daugman established the main principles of a biometric system
based on iris. His method of iris recognition can be decomposed in four main stages (Figure 3.12):
• Iris segmentation
• Normalization
• Feature extraction
• Feature comparison
Figure 3.12: Schematic diagram of Daugman’s iris recognition method [13].
3.1 Iris Recognition and Liveness Detection 19
For the iris localization and segmentation, Daugman proposed an integro-differential operator
(Equation 3.1) that searches for the maximum difference between the average intensity of circum-
ferences with consecutive radius values [11].
maxr,x0,y0
|Gσ (r)∗δ
δ r
∮r,x0,y0
I(x,y)2πr
ds| (3.1)
In the Equation 3.1, the integro-differential operator I represents the original iris image and Gσ is
a low-pass Gaussian filter that aims to smooth the image; the r represents the radius and the x0 and
y0 represent the coordinates of the iris’ center.
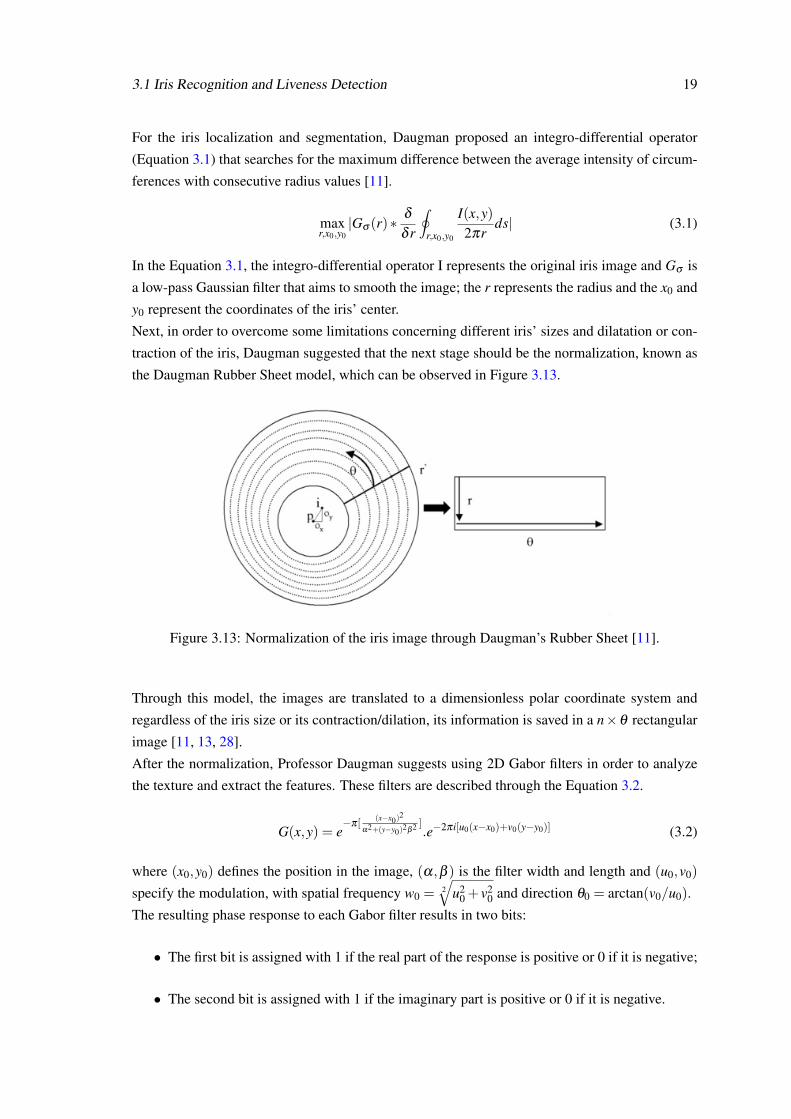
Next, in order to overcome some limitations concerning different iris’ sizes and dilatation or con-
traction of the iris, Daugman suggested that the next stage should be the normalization, known as
the Daugman Rubber Sheet model, which can be observed in Figure 3.13.
Figure 3.13: Normalization of the iris image through Daugman’s Rubber Sheet [11].
Through this model, the images are translated to a dimensionless polar coordinate system and
regardless of the iris size or its contraction/dilation, its information is saved in a n×θ rectangular
image [11, 13, 28].
After the normalization, Professor Daugman suggests using 2D Gabor filters in order to analyze
the texture and extract the features. These filters are described through the Equation 3.2.
G(x,y) = e−π[
(x−x0)2
α2+(y−y0)2β2 ].e−2πi[u0(x−x0)+v0(y−y0)] (3.2)
where (x0,y0) defines the position in the image, (α,β ) is the filter width and length and (u0,v0)
specify the modulation, with spatial frequency w0 =2√
u20 + v2
0 and direction θ0 = arctan(v0/u0).
The resulting phase response to each Gabor filter results in two bits:
• The first bit is assigned with 1 if the real part of the response is positive or 0 if it is negative;
• The second bit is assigned with 1 if the imaginary part is positive or 0 if it is negative.
20 State of Art
This technique aims to lower the computing time and complexity of the algorithm as it results in
a binary code for each iris signature and thus the matching process can be performed by simple
bit operations. This binarization also allows the application of the Hamming distance as the dis-
similarity measurement. Given two binary sets, corresponding to two iris images, with N bits, the
Hamming distance can be described as:
HD(A,B) =1N∗
N
∑i=1
ai⊗
bi (3.3)
where A = {a1, ...,aN} and B = {b1, ...bN}, resulting in a Hamming distance of 0 for two equal
images and 1 for different ones.
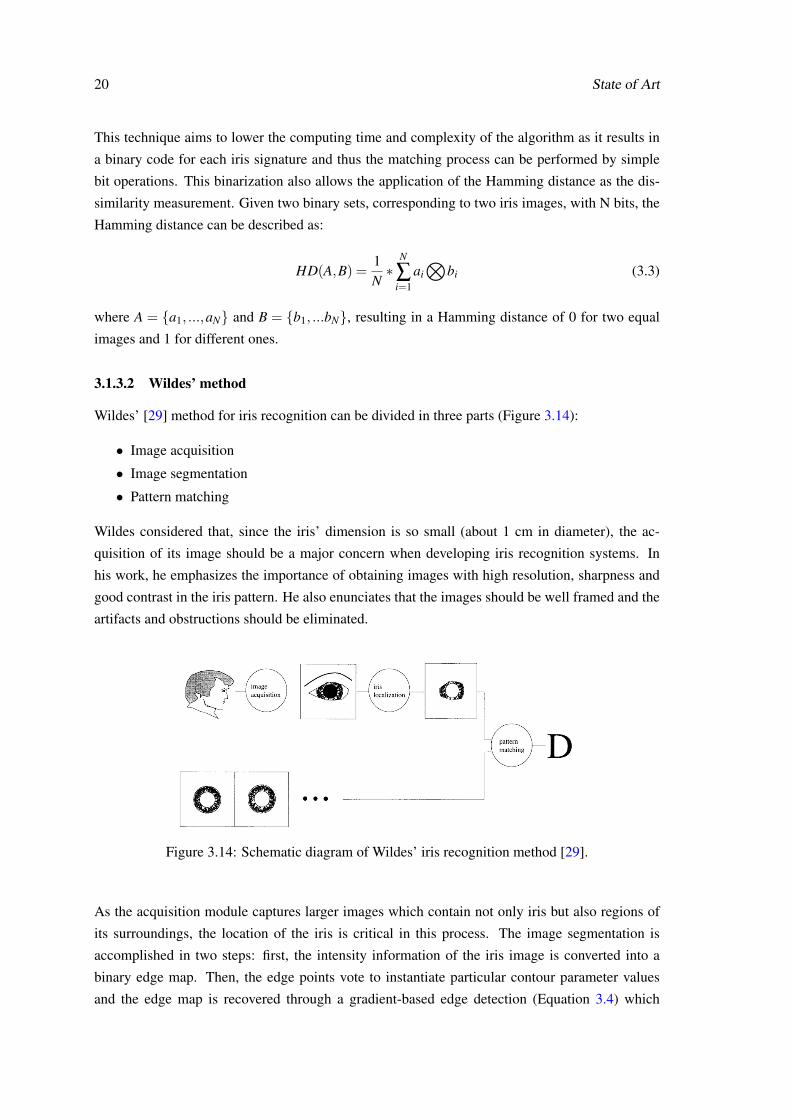
3.1.3.2 Wildes’ method
Wildes’ [29] method for iris recognition can be divided in three parts (Figure 3.14):
• Image acquisition
• Image segmentation
• Pattern matching
Wildes considered that, since the iris’ dimension is so small (about 1 cm in diameter), the ac-
quisition of its image should be a major concern when developing iris recognition systems. In
his work, he emphasizes the importance of obtaining images with high resolution, sharpness and
good contrast in the iris pattern. He also enunciates that the images should be well framed and the
artifacts and obstructions should be eliminated.
Figure 3.14: Schematic diagram of Wildes’ iris recognition method [29].
As the acquisition module captures larger images which contain not only iris but also regions of
its surroundings, the location of the iris is critical in this process. The image segmentation is
accomplished in two steps: first, the intensity information of the iris image is converted into a
binary edge map. Then, the edge points vote to instantiate particular contour parameter values
and the edge map is recovered through a gradient-based edge detection (Equation 3.4) which

3.1 Iris Recognition and Liveness Detection 21
comes down to thresholding the magnitude of the image intensity gradient convolved with a two-
dimensional Gaussian Kernel G.
|5G(x,y)∗ I(x,y)| (3.4)
where
5≡ (δ
δx,
δ
δy) (3.5)
and G is a 2D Gaussian Kernel described by:
G(x,y) =1
2πσ2 e−(x−x0)
2+(y−y0)2
2σ2 (3.6)
The limbic boundary detection is obtained through a maximization process, similar to the one
used in Daugman’s method, using an integro-differential operator. The parameters used for this
maximization are then used by a scoring method called Circular Hough Transform (CHT):
H(xc,yc,r) =n
∑j=1
h(x j,y j,xc,yc,r) (3.7)
where xc, yc and r are the parameters used for the maximization and
h(x j,y j,xc,yc,r) =
1, if g(x j,y j,xx,yc,r) = 0
0,otherwise(3.8)
with
g(x j,y j,xc,yc,r) = (x j− xc)2 +(y j− yc)
2− r2 (3.9)
The global maximum of the H array is identified as the most probable candidate to represent
the limbic boundary, that is, the iris’ borders.
Lastly, the final step is to settle if the captured pattern matches one of the previously stored. This
task can be divided in four parts:
• Alignment: spatially align the new iris pattern with candidate previously stored;
• Representation: choose a representation of the aligned patterns that makes their dissimi-
larities noticeable;
• Comparison: evaluate the excellence of the match;
• Decision: decide if the patterns, both the recently acquired and the previously stored, derive
from the same iris.
Table 3.1 outlines the advantages and disadvantages of Wildes’ method in comparison with Daug-
man’s.

22 State of Art
Advantages DisadvantagesLess intrusive light source Complex acquisition systemRemoval of specular reflection Smaller sensitivity to some detailsSegmentation is more stable to noise disturbances Less compact representation of iris featuresCapable of finer distinctions High computational costBetter adaptability to real world situations
Table 3.1: Advantages and disadvantages of Wildes’ method. Adapted from [13].
3.1.4 Commercially Available Solutions
Nowadays, the implementation of iris recognition systems is becoming usual and some of these
systems can already be seen at airports, border control and social security services or even at pri-
vate companies, which use them to give access to a room or area. Here are presented some of the
commercially available systems:
IRIS - Iris Recognition Immigration SystemIRIS [30] was implemented by the United Kingdom border agency in order to regulate the flow
of people entering the UK, namely frequent travelers. This system was used by the following
airports: Heathrow, Manchester, Birmingham and Gatwick; however, since this is already an old
system, the UK border agency decided to decommission it.
IrisGuard’s Homeland Security Border ControlThis system is used by the United Arabian Emirates’ Expellee Tracking and Border Crossing
Control System in all its 17 air, land, and sea ports since 2001, revealing some optimistic results
relative to false matches as none was reported, from 2001 to 2004, despite of 2.7 billion iris daily
comparisons [31].
India’s UID ProgramThe Unique ID program [32] is the Indian’s unique identification number which is linked with
biometric details – fingerprints and iris. They use this system to eliminate redundant records from
their database and simplify the authentication process since the lack of some identification docu-
ments by the poorest residents is quite common.
CANPASS Air and NEXUSNEXUS pass is a binational boarding crossing pass for faster US Canada and USA border crossing
[33]. Travellers with NEXUS pass can cross the border without being subject to regular question-
ing by customs and immigration officers [34]. People applying for the card must have an iris scan
during an interview and some high-resolution iris images are taken [35].

3.1 Iris Recognition and Liveness Detection 23
CairoAmman Bank SystemCairoAmman was one of the the first companies in the banking section to use an iris recognition
system in their offices and ATMs. This iris recognition system is available at more than sixty
ATMs and more than thirty seven offices [36].
Bank United SystemThe Bank United Corporation from Houston, USA, installed an iris scanning system at three of its
ATMs and researched whether it was well accepted by the clients or not. The response to the sur-
vey, made by an independent research was positive, as 98% of the users reported their experience
as a good one [37].
Based on the positive response by the clients, they decided then to install the system at sixty ATMs
in supermarkets across Texas [38].
Venerable Bede School - ImpactVenerable Bede School in Ryhope, England, uses an iris recognition system instead of ID cards
for its students. The used system is called "Impact", it was implemented in the fall of 2003 and
is composed by an iris recognition camera which is integrated into a catering system. This way,
students are identified and their meals are automatically charged to an account. They can also
borrow library books or access restricted areas in the school, if they have permission [38].
3.1.5 Iris Liveness Detection
3.1.5.1 Illegal use of iris recognition systems
The fact that the human iris has such unique features makes them useful in biometric systems.
Nevertheless, as any other automated recognition technique, systems using iris as a biometric
template may be spoofed and illegally used. Some of the most common ways of forging an iris
recognition system are [39]:
• Use of an eye image - e.g. photographs, video signal, screen images or paper print images
(Figure 3.15);
• Use of an artificial eye - e.g. eye made of plastic, glass, silicon;
• Use of a natural eye (user) - i.e. forcing an individual to use the system;
• Capture/Replay attack - e.g. eye image or iris code template;
• Use of a natural eye (impostor) - i.e. eye removed from body or printed contact lenses
(Figure 3.16).
24 State of Art
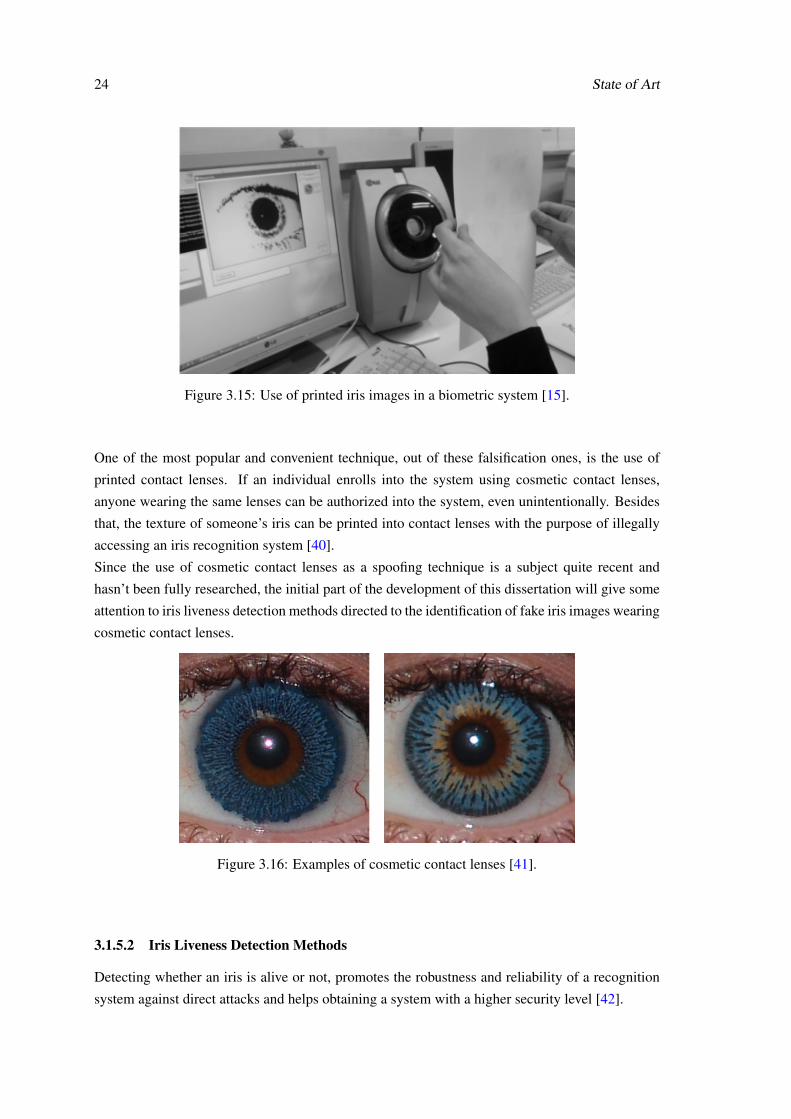
Figure 3.15: Use of printed iris images in a biometric system [15].
One of the most popular and convenient technique, out of these falsification ones, is the use of
printed contact lenses. If an individual enrolls into the system using cosmetic contact lenses,
anyone wearing the same lenses can be authorized into the system, even unintentionally. Besides
that, the texture of someone’s iris can be printed into contact lenses with the purpose of illegally
accessing an iris recognition system [40].
Since the use of cosmetic contact lenses as a spoofing technique is a subject quite recent and
hasn’t been fully researched, the initial part of the development of this dissertation will give some
attention to iris liveness detection methods directed to the identification of fake iris images wearing
cosmetic contact lenses.
Figure 3.16: Examples of cosmetic contact lenses [41].
3.1.5.2 Iris Liveness Detection Methods
Detecting whether an iris is alive or not, promotes the robustness and reliability of a recognition
system against direct attacks and helps obtaining a system with a higher security level [42].

3.1 Iris Recognition and Liveness Detection 25
The liveness detection methods can be divided in four categories based on physical characteristics
of the chosen biometric trait, liveness data and measurement times [43]:
• Simultaneous measuring model: biometric and liveness data are simultaneously obtained
from different physical characteristics;
• Same biometric measuring model: biometric and liveness data are obtained from the same
physical characteristic, but not at the same time;
• Independent measuring model: biometric and liveness data are obtained from different phys-
ical characteristics, in different times;
• Perfect matching model: both biometric and liveness data are obtained at the same time
from the same physical characteristic. This category is considered the ideal configuration.
These techniques can also be divided into two classes:
• Software-based techniques: fake irises are detected once the sample has been acquired by
the sensor and the detection of its liveness is done using the image captured;
• Hardware-bases techniques: an additional device is added to the sensor in order to detect
the liveness of the iris by measuring some particular properties. Daugman [44] states that
this type of detection can be done based in two types of eye behavior – voluntary or involun-
tary behavior. The voluntary moves are those where the user moves the eyes or blinks them
according to system indication. The involuntary ones happen when the eye moves without
the user’s demand, as the pupil oscillation, dilatation or contraction as a response to light.
Even though hardware-based approaches are usually more efficient, software-based ones are less
expensive and less intrusive for the user and thus are commonly favored. Next, some software-
based methods are presented.
Daugman [45] and Tan et al. [46] proposed a software-based method of detecting iris liveness
via frequency analysis, through FFT’s – Fast Fourier Transform. However, this technique can only
be used for printed iris detection as it uses the frequency aspects of a printed image contrasting
with a living iris.
He et al. [47] suggested another method for iris liveness detection via statistical texture anal-
ysis for detecting the use of contact lenses. In this method, four features based on gray level
co-occurrence matrix (GLCM) and properties of statistical intensity values of image pixels are
extracted and a support vector machine is used for classification.
Detecting iris edge sharpness is another possible measure for iris liveness detection. When contact
lenses are used, fake iris edge is sharper than the edge of a living one [40].

26 State of Art
Wei et al. [40] also proposed the use of texture analysis to detect contact lenses but in their
work Iris-Textons are learned and used for texture representation.
The potential of quality assessment to identify real and fake iris images is analyzed in [42] and has
also been tested for spoofing detection in fingerprint recognition systems.
The main point of a software-based liveness detection process is to identify a set of discriminant
features that allow the construction of an appropriate classifier that provides the probability of an
iris being alive or not, based on the extracted set of features.
3.1.5.3 Databases with fake samples
In order to test iris liveness detection methods, databases with false samples are needed. Since
some work will be done in detecting the use of cosmetic contact lenses, two of the presented
databases have fake samples using colored contact lenses and will be used later on to test the de-
veloped algorithms.
CLARKSONThis database was made available for the contestants of the LivDet-2013 challenge [48]. It con-
tains 270 images of real iris and 400 of fake ones. All the fake samples are images of iris with
contact lenses, with a total of 14 types of lenses. The data was acquired through video (100 frames
with focus variation) and two types of lighting are present in the database.
Figure 3.17: Examples of iris images from CLARKSON database. Images a) and b) are real andc) and d) are fake images.
NOTRE DAMEThe Notre Dame [49] database contains iris images:
• with cosmetic contact lenses;
• with clear soft lenses;
• without contact lenses.
All images are 480 x 640 in size and were acquired under near-IR illumination, in two different
periods – the soft lens and no lens data was acquired from 2008 to 2010 and the cosmetic contact
lens images were acquired in 2012.
3.1 Iris Recognition and Liveness Detection 27
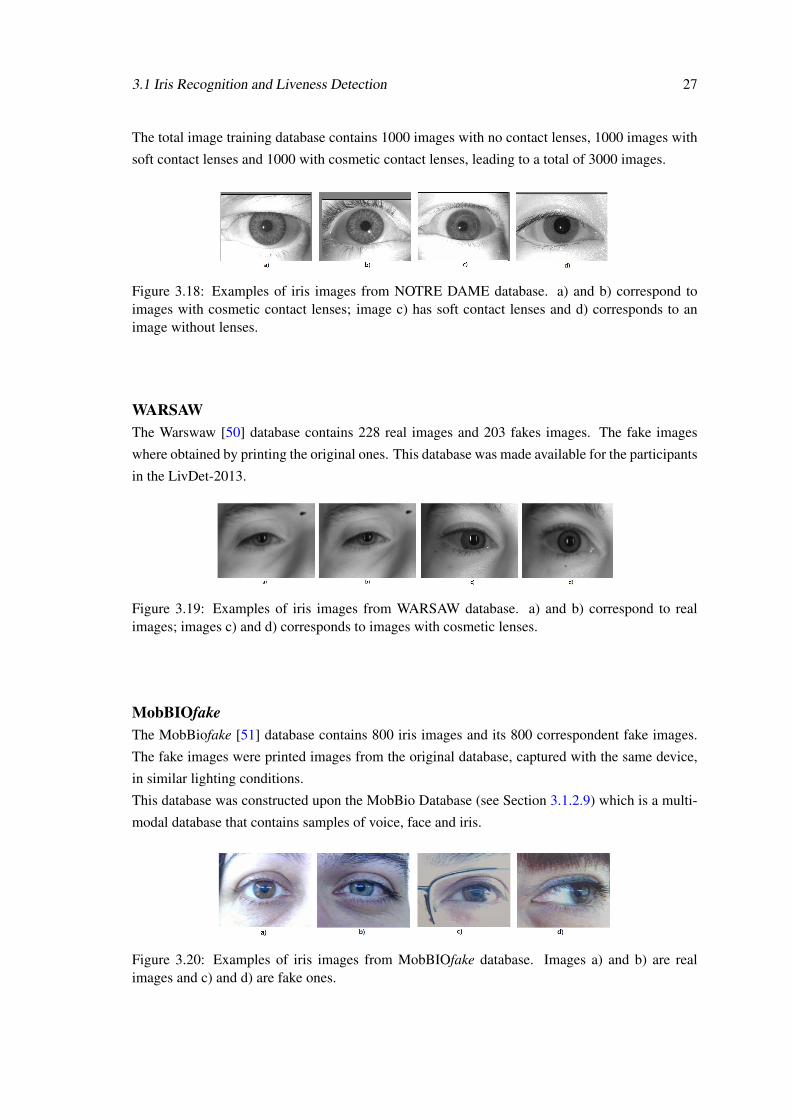
The total image training database contains 1000 images with no contact lenses, 1000 images with
soft contact lenses and 1000 with cosmetic contact lenses, leading to a total of 3000 images.
Figure 3.18: Examples of iris images from NOTRE DAME database. a) and b) correspond toimages with cosmetic contact lenses; image c) has soft contact lenses and d) corresponds to animage without lenses.
WARSAWThe Warswaw [50] database contains 228 real images and 203 fakes images. The fake images
where obtained by printing the original ones. This database was made available for the participants
in the LivDet-2013.
Figure 3.19: Examples of iris images from WARSAW database. a) and b) correspond to realimages; images c) and d) corresponds to images with cosmetic lenses.
MobBIOfakeThe MobBiofake [51] database contains 800 iris images and its 800 correspondent fake images.
The fake images were printed images from the original database, captured with the same device,
in similar lighting conditions.
This database was constructed upon the MobBio Database (see Section 3.1.2.9) which is a multi-
modal database that contains samples of voice, face and iris.
Figure 3.20: Examples of iris images from MobBIOfake database. Images a) and b) are realimages and c) and d) are fake ones.

28 State of Art
BIOSECThe Biosec [52] database was created in the Polytechnic University of Madrid (UPM) and Poly-
technic University of Catalunya (UPC) and contains both real and fake iris images. The images
were taken in unconstrained conditions, in order to simulate a real situation, with a LB IrisAccess
EOU3000 sensor. To build the fake part of the DB, the original images were preprocessed and
printed in a paper, using a commercial printer. Then, the printed images were presented to the
sensor, obtaining the fake samples.
The Biosec database contains 800 fake images and its correspondent real images. Fifty people
participated in the image acquisition process which took place in two different occasions [15].
Figure 3.21: Examples of iris images from BIOSEC database. a) and b) correspond to real imagesand c) and d) to fake images.
3.2 Fingerprint Recognition and Liveness Detection
3.2.1 Fingerprint Anatomy
Fingerprints are small lines/ridges and valleys in the skin of fingertips. Their configuration do
not change throughout life (except if an accident, such as a burnt, happens) and are formed at
around seven months of fetus development due to a combination of genes and environmental fac-
tors. [17, 53]
The environmental factors of the fingerprint formation result in such variations that it is considered
impossible to have two fingerprint looking exactly alike [54, 17]. However, their patterns are not
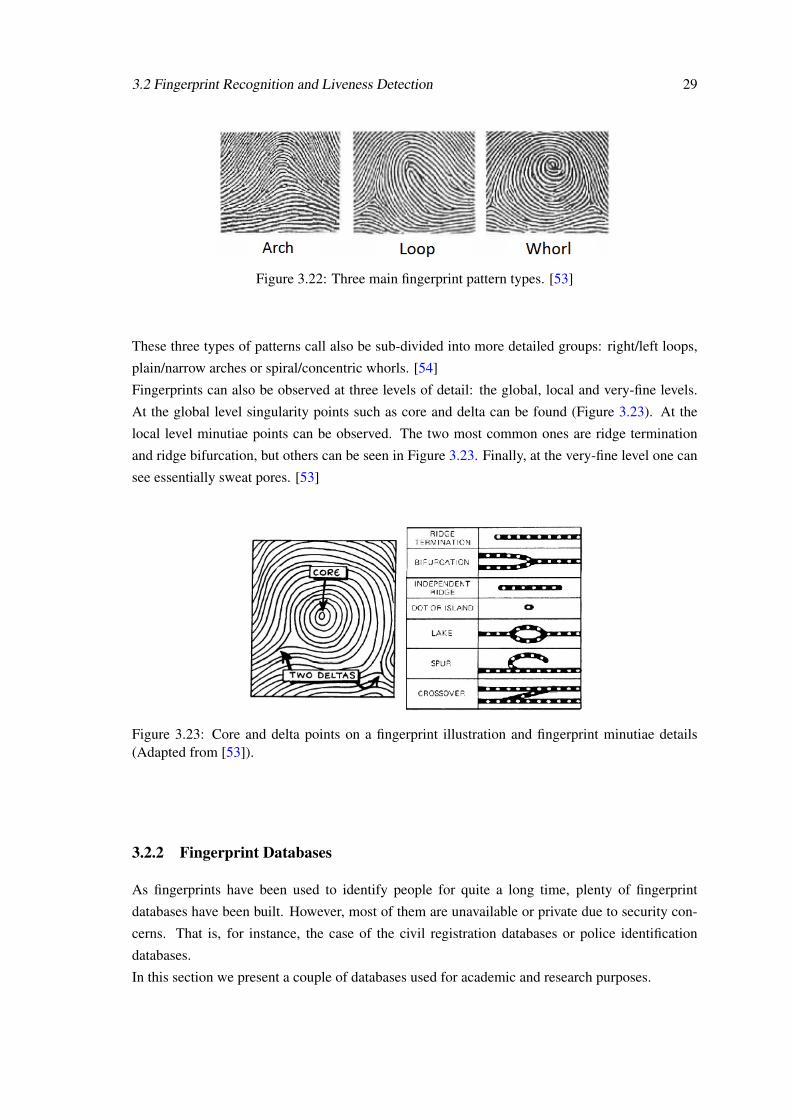
completely random and can be divided in three types: arches, loops and whorls (Figure 3.22).
3.2 Fingerprint Recognition and Liveness Detection 29
Figure 3.22: Three main fingerprint pattern types. [53]
These three types of patterns call also be sub-divided into more detailed groups: right/left loops,
plain/narrow arches or spiral/concentric whorls. [54]
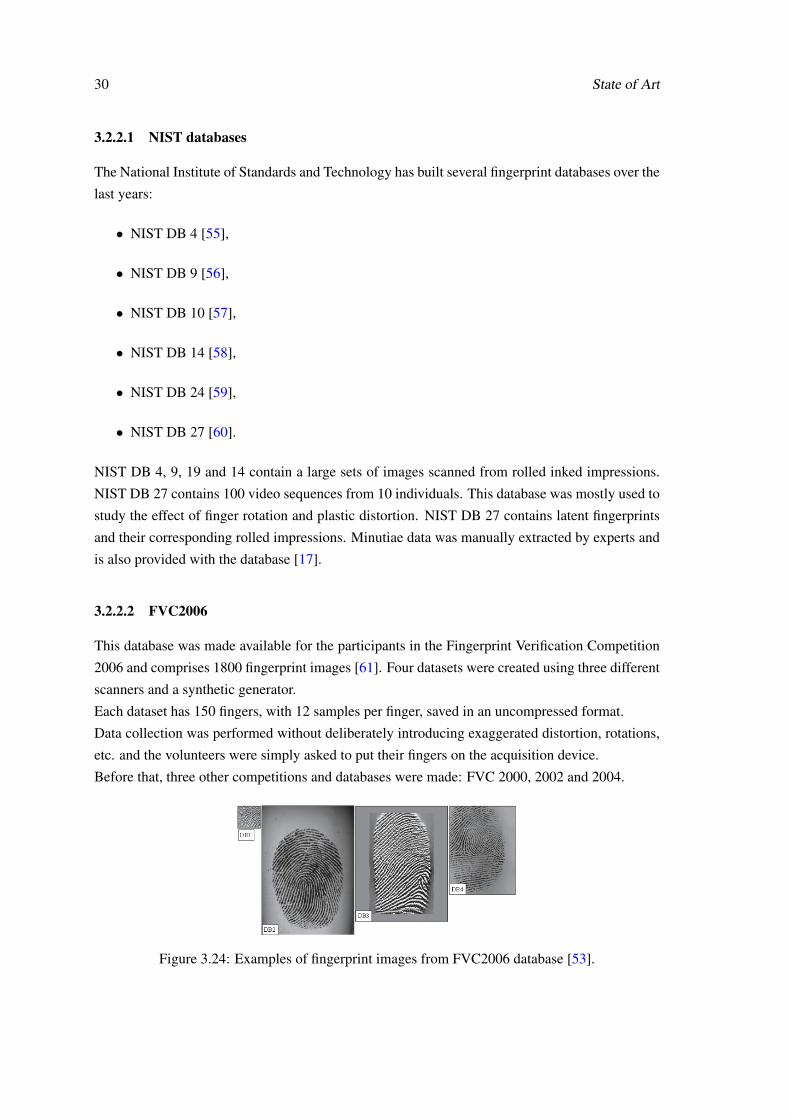
Fingerprints can also be observed at three levels of detail: the global, local and very-fine levels.
At the global level singularity points such as core and delta can be found (Figure 3.23). At the
local level minutiae points can be observed. The two most common ones are ridge termination
and ridge bifurcation, but others can be seen in Figure 3.23. Finally, at the very-fine level one can
see essentially sweat pores. [53]
Figure 3.23: Core and delta points on a fingerprint illustration and fingerprint minutiae details(Adapted from [53]).
3.2.2 Fingerprint Databases
As fingerprints have been used to identify people for quite a long time, plenty of fingerprint
databases have been built. However, most of them are unavailable or private due to security con-
cerns. That is, for instance, the case of the civil registration databases or police identification
databases.
In this section we present a couple of databases used for academic and research purposes.
30 State of Art
3.2.2.1 NIST databases
The National Institute of Standards and Technology has built several fingerprint databases over the
last years:
• NIST DB 4 [55],
• NIST DB 9 [56],
• NIST DB 10 [57],
• NIST DB 14 [58],
• NIST DB 24 [59],
• NIST DB 27 [60].
NIST DB 4, 9, 19 and 14 contain a large sets of images scanned from rolled inked impressions.
NIST DB 27 contains 100 video sequences from 10 individuals. This database was mostly used to
study the effect of finger rotation and plastic distortion. NIST DB 27 contains latent fingerprints
and their corresponding rolled impressions. Minutiae data was manually extracted by experts and
is also provided with the database [17].
3.2.2.2 FVC2006
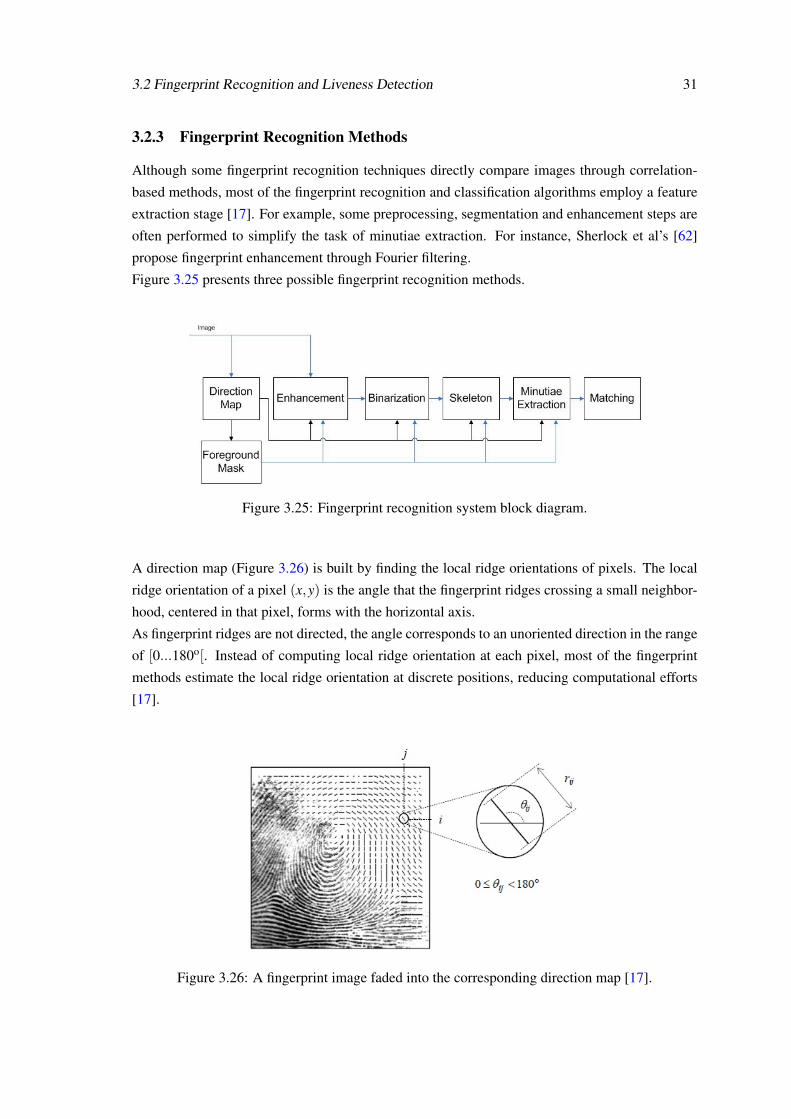
This database was made available for the participants in the Fingerprint Verification Competition
2006 and comprises 1800 fingerprint images [61]. Four datasets were created using three different
scanners and a synthetic generator.
Each dataset has 150 fingers, with 12 samples per finger, saved in an uncompressed format.
Data collection was performed without deliberately introducing exaggerated distortion, rotations,
etc. and the volunteers were simply asked to put their fingers on the acquisition device.
Before that, three other competitions and databases were made: FVC 2000, 2002 and 2004.
Figure 3.24: Examples of fingerprint images from FVC2006 database [53].
3.2 Fingerprint Recognition and Liveness Detection 31
3.2.3 Fingerprint Recognition Methods
Although some fingerprint recognition techniques directly compare images through correlation-
based methods, most of the fingerprint recognition and classification algorithms employ a feature
extraction stage [17]. For example, some preprocessing, segmentation and enhancement steps are
often performed to simplify the task of minutiae extraction. For instance, Sherlock et al’s [62]
propose fingerprint enhancement through Fourier filtering.
Figure 3.25 presents three possible fingerprint recognition methods.
Figure 3.25: Fingerprint recognition system block diagram.
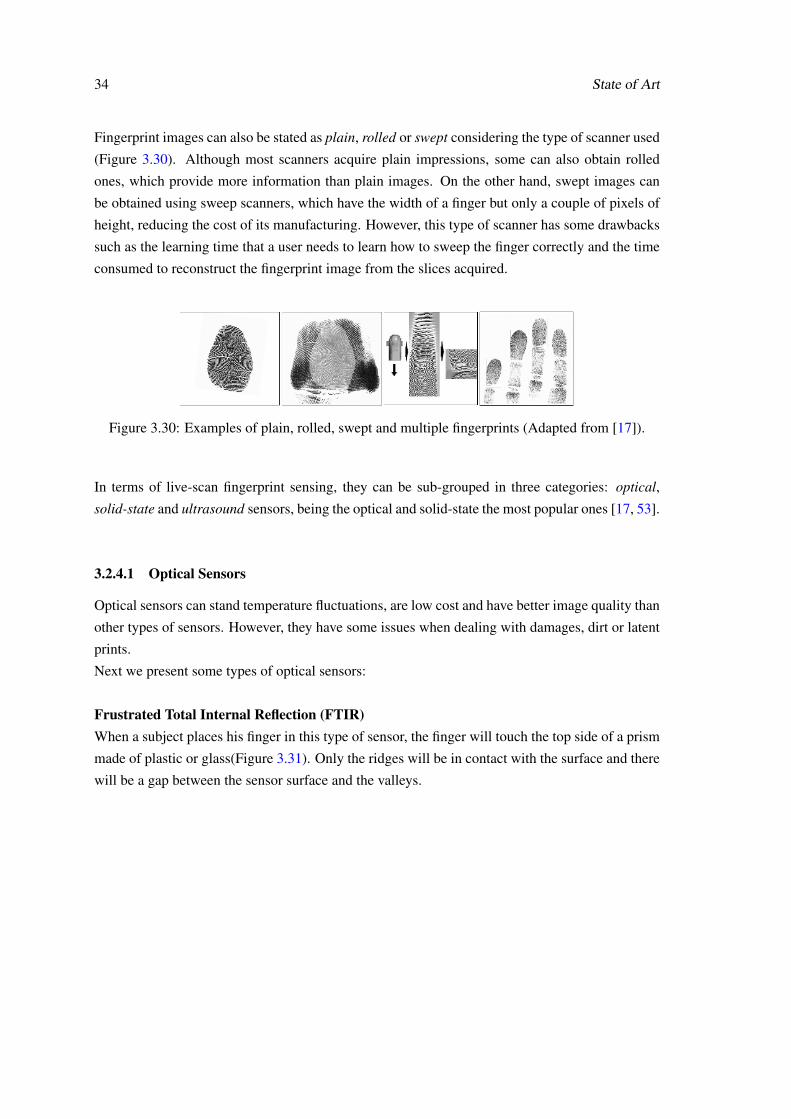
A direction map (Figure 3.26) is built by finding the local ridge orientations of pixels. The local
ridge orientation of a pixel (x,y) is the angle that the fingerprint ridges crossing a small neighbor-
hood, centered in that pixel, forms with the horizontal axis.
As fingerprint ridges are not directed, the angle corresponds to an unoriented direction in the range
of [0...180o[. Instead of computing local ridge orientation at each pixel, most of the fingerprint
methods estimate the local ridge orientation at discrete positions, reducing computational efforts
[17].
Figure 3.26: A fingerprint image faded into the corresponding direction map [17].

32 State of Art
The simplest binarization approach uses a global threshold and works by setting the pixels whose
gray-level is lower than the threshold to 0 and the remaining pixels to 1. However, different
portions of an image may have different contrast and intensity and thus a single threshold for
the entire image may not be sufficient for a correct binarization. Some binarization methods were
proposed by Abutaleb et al. [63] and Zhang et al. [64] and through binarizing the image, a skeleton
image is obtained (Figure 3.27).
Figure 3.27: Fingerprint image and corresponding binarized skeleton[17].
While some authors propose minutiae extraction methods that need previous binarization, others
use approaches that work directly with gray-scale images, as binarization is time consuming and
some information may be lost during its process.
A fingerprint matching algorithm compares two given fingerprints and returns either a degree
of similarity or a binary decision [17]. There are several factors that should be taken into account
when performing fingerprint matching and that can influence its result, like displacements, rota-
tions, partial overlaps, distortions, pressure, skin conditions and noise.
Fingerprint matching techniques can be divided into three groups:
• Correlation-based matching: the correlation between two fingerprint image’s pixels is
computed for different alignments. One example of a correlation-based matching is the one
proposed by Hatano et al.’s [65];
• Minutiae-based matching: Minutiae are extracted from the two fingerprint images and
stored as sets of points in a two dimensional plane. By comparing the two stored matrices,
the method tries to find an alignment between them so that it results in the maximum number
of minutiae pairings. Jea et al’s [66] proposed a method for this type of matching methods;
• Non-Minutiae feature-based matching: comparison of fingerprints in term of features
extracted from the ridge pattern. The most commonly used features are: size of fingerprint
and external silhouette; number, type and position of singularities; global and local texture
information; geometrical attributes and spatial relationship of the ridge lines; level 3 features
(e.g. sweat pores). For instance, Zhang et al’s [67] proposed a method based in local texture
information.

3.2 Fingerprint Recognition and Liveness Detection 33
3.2.4 Fingerprint Sensors
The traditional way of obtaining a fingerprint is the called off-line fingerprint acquisition, also
called "ink-technique". In this technique a person’s finger is stained with black ink and pressed or
rolled on a paper. That paper is then scanned by a regular scanner obtaining then a digital image
of the fingerprint [17].
However, with the growth of demand and technological development, the most used technique
is the live-scan acquisition in which digital images are obtained directly through a scanner. This
development has also allowed the creation of smaller scanners, with lower prices, that can even be
integrated into laptops, smartphones or mouses. [53].
Figure 3.28: Typical structure of a fingerprint scanner [17].
Typically, a sensor has the following structure: it reads the ridge pattern in the surface of a finger,
converts the analog reading to a digital form and an interface module communicates and sends the
images to external devices (e.g. a personal computer). This structure is shown in Figure 3.28.
Currently available scanners can be classified as multi-finger, if more than one finger can be ac-
quired at the same time, or single-finger, if only one finger at a time can be acquired (See Figure
3.29).
Figure 3.29: Example of fingerprint scanners. The left image represents a multi-finger scannerand the right image represents a single-finger scanner [17].
34 State of Art
Fingerprint images can also be stated as plain, rolled or swept considering the type of scanner used
(Figure 3.30). Although most scanners acquire plain impressions, some can also obtain rolled
ones, which provide more information than plain images. On the other hand, swept images can
be obtained using sweep scanners, which have the width of a finger but only a couple of pixels of
height, reducing the cost of its manufacturing. However, this type of scanner has some drawbacks
such as the learning time that a user needs to learn how to sweep the finger correctly and the time
consumed to reconstruct the fingerprint image from the slices acquired.
Figure 3.30: Examples of plain, rolled, swept and multiple fingerprints (Adapted from [17]).
In terms of live-scan fingerprint sensing, they can be sub-grouped in three categories: optical,
solid-state and ultrasound sensors, being the optical and solid-state the most popular ones [17, 53].
3.2.4.1 Optical Sensors
Optical sensors can stand temperature fluctuations, are low cost and have better image quality than
other types of sensors. However, they have some issues when dealing with damages, dirt or latent
prints.
Next we present some types of optical sensors:
Frustrated Total Internal Reflection (FTIR)When a subject places his finger in this type of sensor, the finger will touch the top side of a prism
made of plastic or glass(Figure 3.31). Only the ridges will be in contact with the surface and there
will be a gap between the sensor surface and the valleys.
3.2 Fingerprint Recognition and Liveness Detection 35
Figure 3.31: FTIR fingerprint acquisition [17].
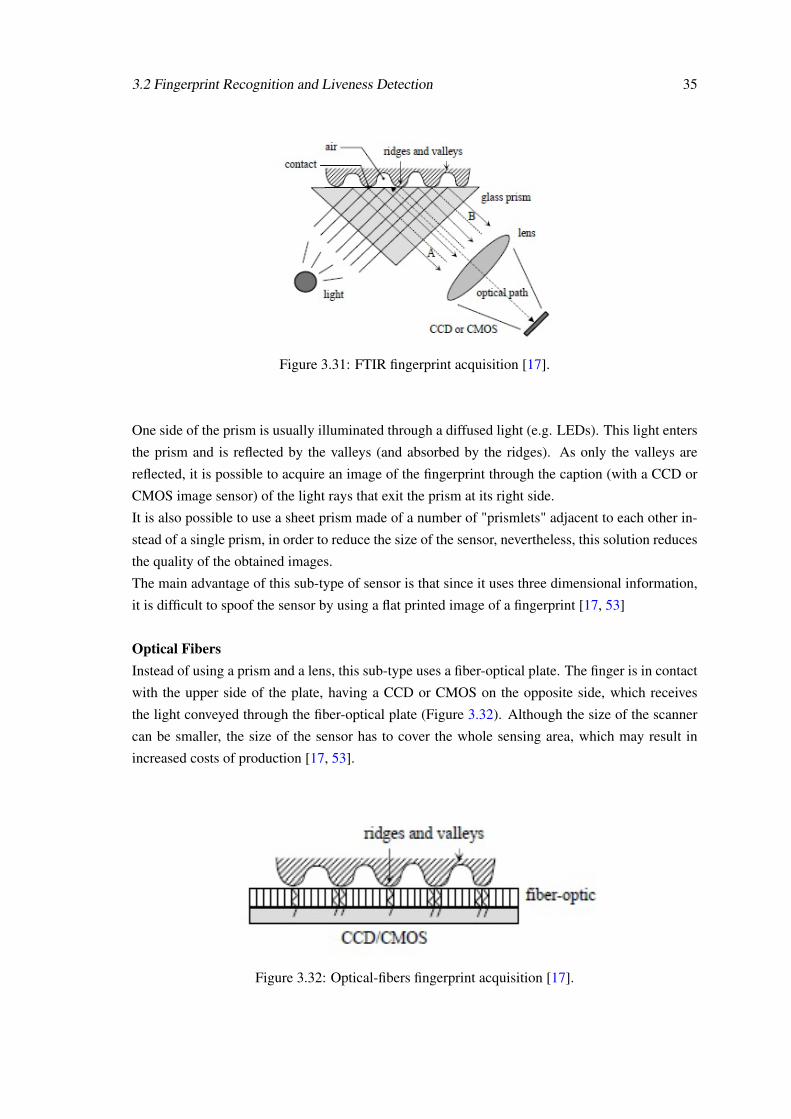
One side of the prism is usually illuminated through a diffused light (e.g. LEDs). This light enters
the prism and is reflected by the valleys (and absorbed by the ridges). As only the valleys are
reflected, it is possible to acquire an image of the fingerprint through the caption (with a CCD or
CMOS image sensor) of the light rays that exit the prism at its right side.
It is also possible to use a sheet prism made of a number of "prismlets" adjacent to each other in-
stead of a single prism, in order to reduce the size of the sensor, nevertheless, this solution reduces
the quality of the obtained images.
The main advantage of this sub-type of sensor is that since it uses three dimensional information,
it is difficult to spoof the sensor by using a flat printed image of a fingerprint [17, 53]
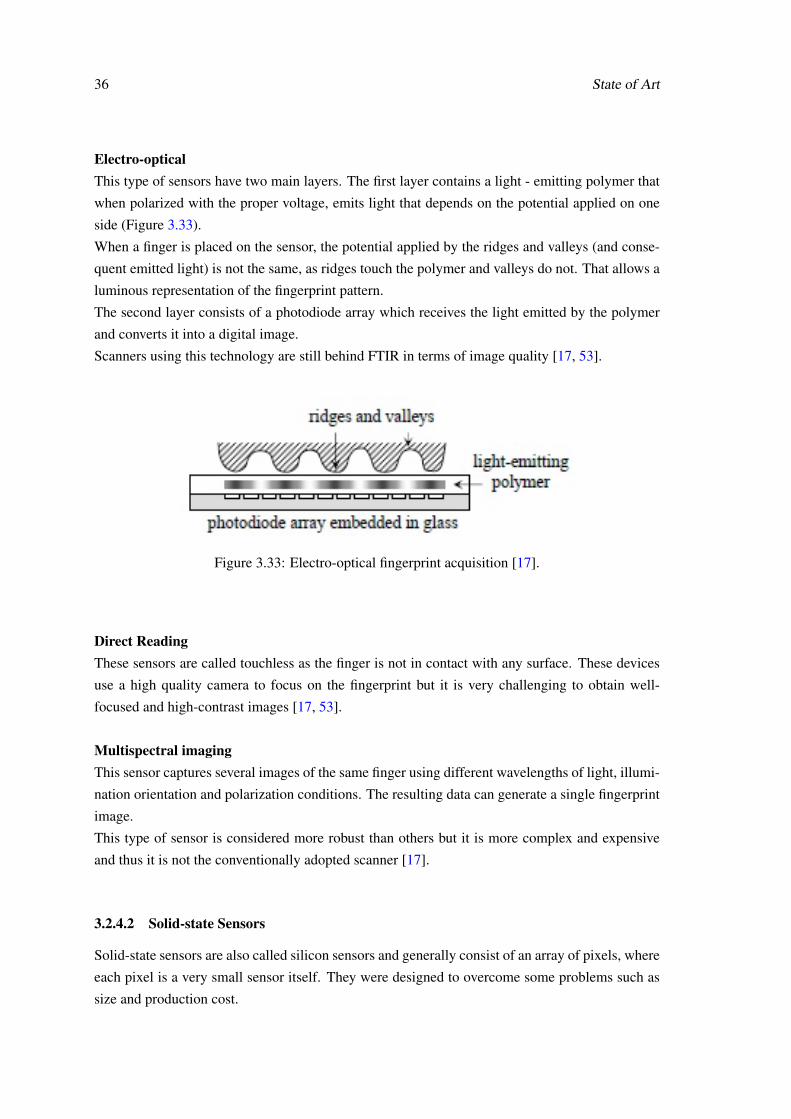
Optical FibersInstead of using a prism and a lens, this sub-type uses a fiber-optical plate. The finger is in contact
with the upper side of the plate, having a CCD or CMOS on the opposite side, which receives
the light conveyed through the fiber-optical plate (Figure 3.32). Although the size of the scanner
can be smaller, the size of the sensor has to cover the whole sensing area, which may result in
increased costs of production [17, 53].
Figure 3.32: Optical-fibers fingerprint acquisition [17].
36 State of Art
Electro-opticalThis type of sensors have two main layers. The first layer contains a light - emitting polymer that
when polarized with the proper voltage, emits light that depends on the potential applied on one
side (Figure 3.33).
When a finger is placed on the sensor, the potential applied by the ridges and valleys (and conse-
quent emitted light) is not the same, as ridges touch the polymer and valleys do not. That allows a
luminous representation of the fingerprint pattern.
The second layer consists of a photodiode array which receives the light emitted by the polymer
and converts it into a digital image.
Scanners using this technology are still behind FTIR in terms of image quality [17, 53].
Figure 3.33: Electro-optical fingerprint acquisition [17].
Direct ReadingThese sensors are called touchless as the finger is not in contact with any surface. These devices
use a high quality camera to focus on the fingerprint but it is very challenging to obtain well-
focused and high-contrast images [17, 53].
Multispectral imagingThis sensor captures several images of the same finger using different wavelengths of light, illumi-
nation orientation and polarization conditions. The resulting data can generate a single fingerprint
image.
This type of sensor is considered more robust than others but it is more complex and expensive
and thus it is not the conventionally adopted scanner [17].
3.2.4.2 Solid-state Sensors
Solid-state sensors are also called silicon sensors and generally consist of an array of pixels, where
each pixel is a very small sensor itself. They were designed to overcome some problems such as
size and production cost.

3.2 Fingerprint Recognition and Liveness Detection 37
Capacitive sensorsIt is a two-dimensional array of micro-capacitor plates embedded in a chip. In this case, the skin
of the finger works as the other plate of the micro-capacitor (Figure 3.34).
Small charges of electricity are created between the finger’s surface and each of the silicon plates.
The magnitude of these electrical charges depends on the distance between the ridges or valleys
and the capacitance plates. These differences can then be used to obtain an image of the finger-
print.
These sensors, like the optical ones, can not be spoofed by photographs or printed images. How-
ever, there are a number of disadvantages that should be taken into account, such as: they have
a small sensor area which require more careful enrollments; electrostatic discharges from the fin-
gerprint may cause large electrical fields that can damage the device: the silicon chip needs to be
protected from some chemical substances that may be present in finger perspiration[17, 53].
Figure 3.34: Capacitive fingerprint acquisition [17].
Thermal sensorsThermal sensors are made of pyro-electric material. This material generates current based on tem-
perature differentials. The difference between the temperature of the skin (of the ridges) and the
air (in the valleys) is used to obtain the fingerprint image.
These sensors are usually maintained at a high temperature to increase the difference between the
sensor surface and the skin of the finger [17, 53].
Electric Field sensorsIt creates a fingerprint image from below the top layer of the skin, avoiding the calluses, cuts and
dirt that the finger might have. It consists of a drive ring and a matrix of active antennas. The ring
generates a radio frequency sinusoidal signal and the antennas receive the signal transmitted by
the drive ring and modulated by the subsurface of the skin [17, 53].

38 State of Art
Piezoelectric sensorsPiezoelectric sensors are also called pressure-sensitive sensors. Its surface is made of a non-
conductive dielectric material that generates current according to the pressure applied by the fin-
ger.
The distinct pressure applied by the valleys and the ridges results in different amounts of current
[17, 53].
3.2.4.3 Ultrasound Sensors
An ultrasound sensor is based on sending acoustic signals toward the fingerprint and capturing the
echo signal. This echo signal is then used to compute the depth image of the fingerprint. In order
to perform that, this type of sensor contains two main components: a transmitter and a receiver
(Figure 3.35). Even though it is known that ultrasound is probably the most accurate type of sensor
for fingerprint recognition, it’s cost and size still largely influences it’s use [17, 53].
Figure 3.35: Ultrasound fingerprint acquisition [17].
3.2.5 Fingerprint Liveness Detection
3.2.5.1 Fake Fingerprints Acquisition
One of the main problems of fingerprint recognition systems, or biometric recognition systems in
general, is that they can be spoofed by using fake samples of the biometric trait used in a specific
system. This samples could be acquired with or without user cooperation.
With user cooperation, an authorized user may help an hacker to create a clone of his fingerprint.
In order to obtain a fingerprint without the cooperation of its correspondent individual, it is neces-
sary to obtain its print from a glass or other surface. Those marks left on surfaces are called latent
fingerprints [17, 68].
Latent fingerprints can be painted with a dye or powder and then "lifted" with tape or glue. How-
ever, these prints are , usually, low quality as they can be incomplete or smudged and thus are not
very accurate.

3.2 Fingerprint Recognition and Liveness Detection 39
The easiest way of creating a fake sample is by printing the fingerprint image into a transparent pa-
per. However, a more successful method is to create a 3D fake model with the fingerprint stamped
on it. This can be done by creating a mold that is then filled with a substance (silicon, gelatin,
Play-Doh, wax, glue, plastic). This mold is used to create a thick or thin dummy (Figure 3.36) that
an intruder can use.
Figure 3.36: Finger model and mold (Adapted from [17, 53]).
3.2.5.2 Liveness Detection Methods
Detecting the liveness of a fingerprint is even harder than detecting the liveness of an iris, as both
the material used in the fake models and the epidermis of a finger are not alive.
Just as with iris, liveness detection can be performed through additional hardware or by processing
the obtained image. Hardware-based solutions try to detect the liveness of the fingertip by mea-
suring some physical characteristics such as blood pressure, temperature or pulse. These solutions
have the disadvantage of being expensive and thus we will confine the study of liveness detection
methods to software-based approaches.
Ghiani et al. [69] propose the use of Binarized Statistical Image Features (BSIF) to detect the
vitality of fingerprints. This approach has already been tested for face recognition and texture
classification and they propose to test it in fingerprint recognition.
Their goal is to obtain statistically meaningful representation of the fingerprint data by learning a
fixed set of filters from a small set of images. They also claim that through learning, it is possible
to adjust the descriptor length to the unusual characteristics of a fingerprint.
Ghiani et al. tested this algorithm with the four LivDet2011 [70] datasets, obtaining promising re-
sults. However, there are still some problems with this algorithm, such as finding the right window
size or the length of the binary string that results from the application of the filters to the image.
The same authors of the previous algorithm, Ghiani et al., have also proposed another method
for liveness detection by using Local Phase Quantization (LPQ) [71].
The Local Phase Quantization is a blur insensitive texture classification method. As it is able to
represent all spectrum characteristics of images in a compact feature representation, avoiding re-
dundant or blurred information, the authors believe that it could be used in this field.
They used the four data sets collected for the Second International Fingerprint Liveness Detection

40 State of Art
Competition (LivDet11) [70] to test the algorithm and obtained results almost equivalent to when
Local Binary Patterns (LBP) [72] are used.
Diego Gragnaniello et al. [73] investigate the use of a local discriminatory feature space, called
Weber Local Descriptor (WLD) for fingerprint liveness detection. This descriptor consists of two
blocks: differential excitation and orientation. These are then evaluated for each pixel of the image
and concatenated into an histogram that is used to build the discriminatory features.
A linear kenel SVM classifier is then used to classify the images.
These authors have tested this method with both LivDet2009 [74] and LivDet2011 [70] datasets
and propose the combination of this method with the Local Phase Quantization (LPQ) [71] in or-
der to obtain better results.
Warwante et al. [75] studied how the Wavelet transform can be applied to fingerprint verifica-
tion. In this work, it is stated that Wavelet analysis can help minimizing the effect of ridge and
valley pattern when estimating the surface coarseness because it allows the study of the input im-
age at different scales.
They have created a high resolution database to which they then applied the proposed algorithm.
Although they obtained positive results, one can not say that the same would occur with images
with less quality.
In [76], Tan and Schuckers propose a new method for fingerprint liveness detection based on
ridge signal analysis and valley noise analysis. They aim is to quantify perspiration patterns along
ridge in live samples and quantify noise patterns along valleys in fake samples.
Their results show that the performance can reach 99.1% of correctly classified images.
They have also proposed another method based on the statistics of Wavelet signal processing [77]
aiming to detect the perspiration phenomenon using only a single image.
Galbally et al. [78] use quality related features in their liveness detection work. The extracted
features are ridge strength, ridge continuity, ridge clarity. They claim that those features can be
extracted from the following quality measures: local angle, power spectrum and pixel intensity.
This study presented an overall rate of 90% correctly classified samples, tested on a challenging
database comprising over 10,500 real and fake images. This large database is created from the
images of LivDet2009 [74] and ATVS [79] databases.
Ojala et al.’s [72] approach is based on Local Binary Patterns (LBP). It is known that a LBP’s
histogram can be a powerful texture features and thus can be used to determine whether a finger-
print is real or fake. Even though this study was published in 2002, it is still a very actual method
with results comparable to newer solutions.
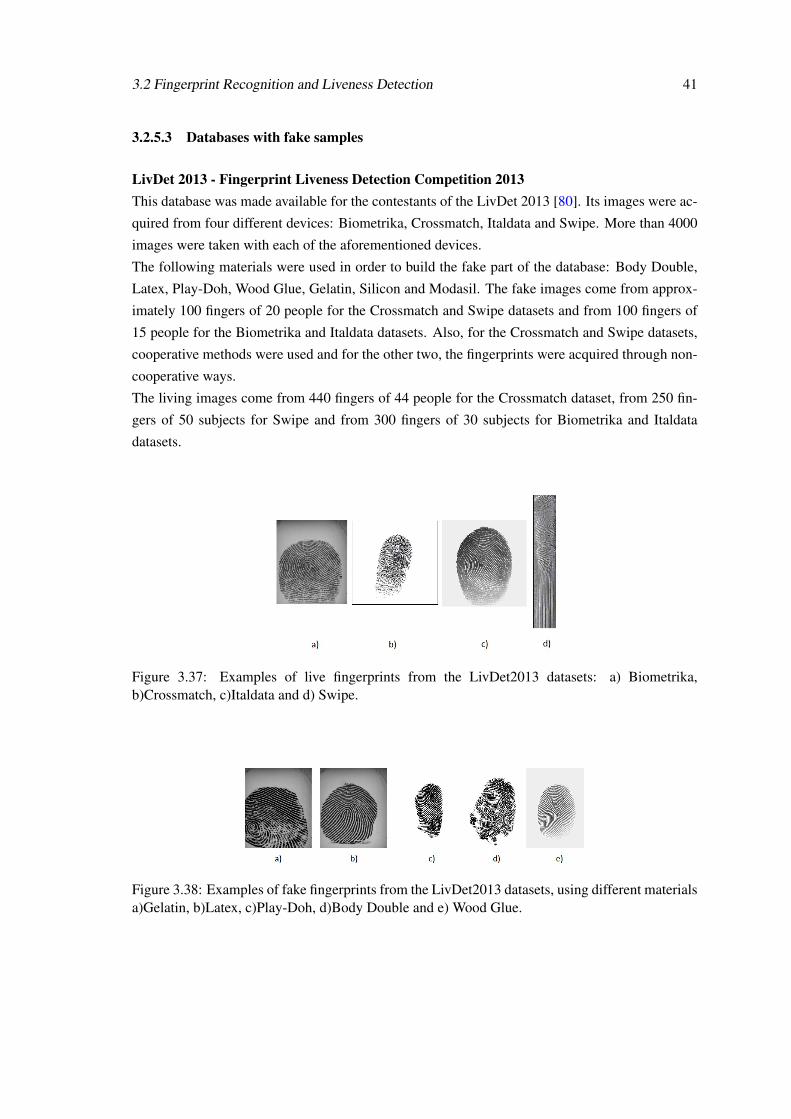
3.2 Fingerprint Recognition and Liveness Detection 41
3.2.5.3 Databases with fake samples
LivDet 2013 - Fingerprint Liveness Detection Competition 2013This database was made available for the contestants of the LivDet 2013 [80]. Its images were ac-
quired from four different devices: Biometrika, Crossmatch, Italdata and Swipe. More than 4000
images were taken with each of the aforementioned devices.
The following materials were used in order to build the fake part of the database: Body Double,
Latex, Play-Doh, Wood Glue, Gelatin, Silicon and Modasil. The fake images come from approx-
imately 100 fingers of 20 people for the Crossmatch and Swipe datasets and from 100 fingers of
15 people for the Biometrika and Italdata datasets. Also, for the Crossmatch and Swipe datasets,
cooperative methods were used and for the other two, the fingerprints were acquired through non-
cooperative ways.
The living images come from 440 fingers of 44 people for the Crossmatch dataset, from 250 fin-
gers of 50 subjects for Swipe and from 300 fingers of 30 subjects for Biometrika and Italdata
datasets.
Figure 3.37: Examples of live fingerprints from the LivDet2013 datasets: a) Biometrika,b)Crossmatch, c)Italdata and d) Swipe.
Figure 3.38: Examples of fake fingerprints from the LivDet2013 datasets, using different materialsa)Gelatin, b)Latex, c)Play-Doh, d)Body Double and e) Wood Glue.
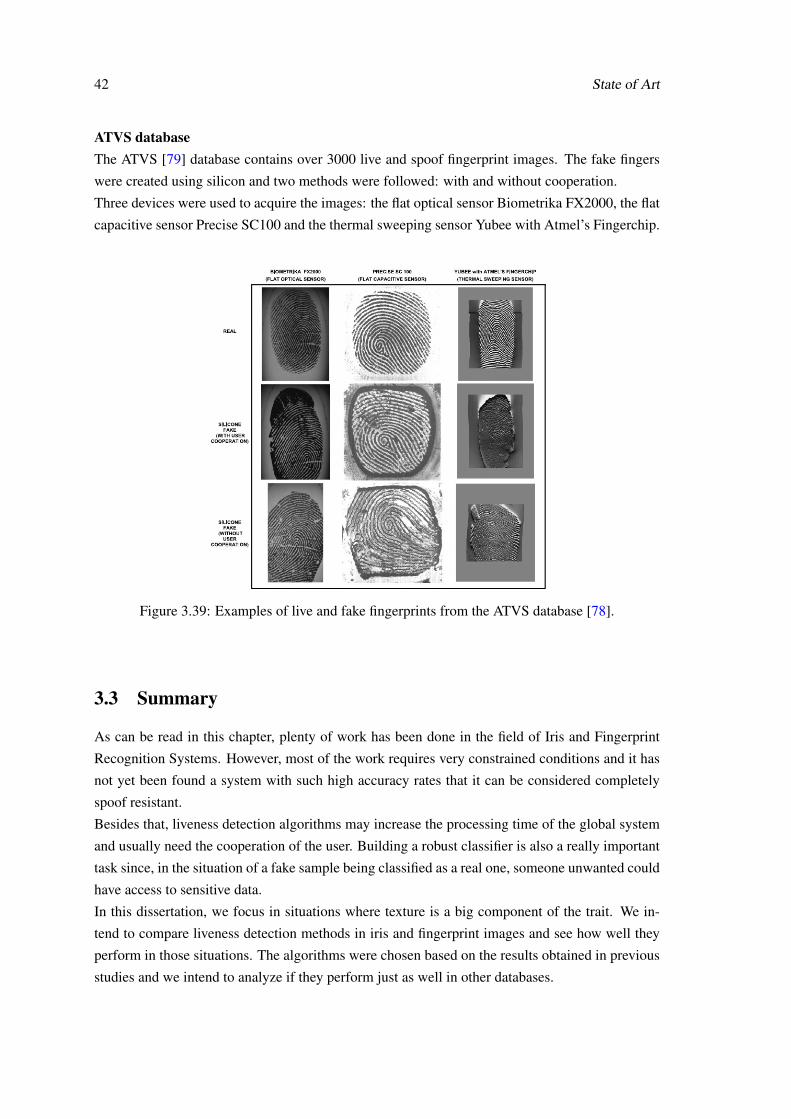
42 State of Art
ATVS databaseThe ATVS [79] database contains over 3000 live and spoof fingerprint images. The fake fingers
were created using silicon and two methods were followed: with and without cooperation.
Three devices were used to acquire the images: the flat optical sensor Biometrika FX2000, the flat
capacitive sensor Precise SC100 and the thermal sweeping sensor Yubee with Atmel’s Fingerchip.
Figure 3.39: Examples of live and fake fingerprints from the ATVS database [78].
3.3 Summary
As can be read in this chapter, plenty of work has been done in the field of Iris and Fingerprint
Recognition Systems. However, most of the work requires very constrained conditions and it has
not yet been found a system with such high accuracy rates that it can be considered completely
spoof resistant.
Besides that, liveness detection algorithms may increase the processing time of the global system
and usually need the cooperation of the user. Building a robust classifier is also a really important
task since, in the situation of a fake sample being classified as a real one, someone unwanted could
have access to sensitive data.
In this dissertation, we focus in situations where texture is a big component of the trait. We in-
tend to compare liveness detection methods in iris and fingerprint images and see how well they
perform in those situations. The algorithms were chosen based on the results obtained in previous
studies and we intend to analyze if they perform just as well in other databases.

Chapter 4
Methodology
This chapter presents the methodology adopted during the realization of this MSc Dissertation.
Two state of the art liveness detection algorithms were selected, aiming to replicate them and test
them both in iris and fingerprint databases.
The databases used were the Clarkson [48] and Notre Dame [49] for the iris images, since these
possess fake images of irises wearing cosmetic contact lenses.
On the other and, to test the algorithms in fingerprint images, the four datasets from the LivDet2013
[80] competition were used. More detail about these databases can be found in Sections 3.1.5.3
and 3.2.5.3.
4.1 Segmentation
In order to test the liveness detection algorithms with the iris images, segmentation had to be done
since it largely influences the results of the algorithms. That occurs because there is a lot of useless
information around the iris that is not needed while performing liveness detection tests. However,
there are some available methods capable of working with the whole image too.
Segmentation is thus used to determine the region of interest of the image. We decided to use
manual segmentation considering that this task was not one of the goals of this dissertation and
we could use the manual segmentation done in the scope of a previous work of the VCMI group
[25] that guarantees a reasonable precision.
To do the manual segmentation, three points (the center of the eye, the pupil’s border and the iris’
border) were marked in every image (Figure 4.1). With those points as a reference, it was possible
to consider the contours of the iris as two concentric circumferences.
For the fingerprints, no segmentation was needed and the whole images were used.
43
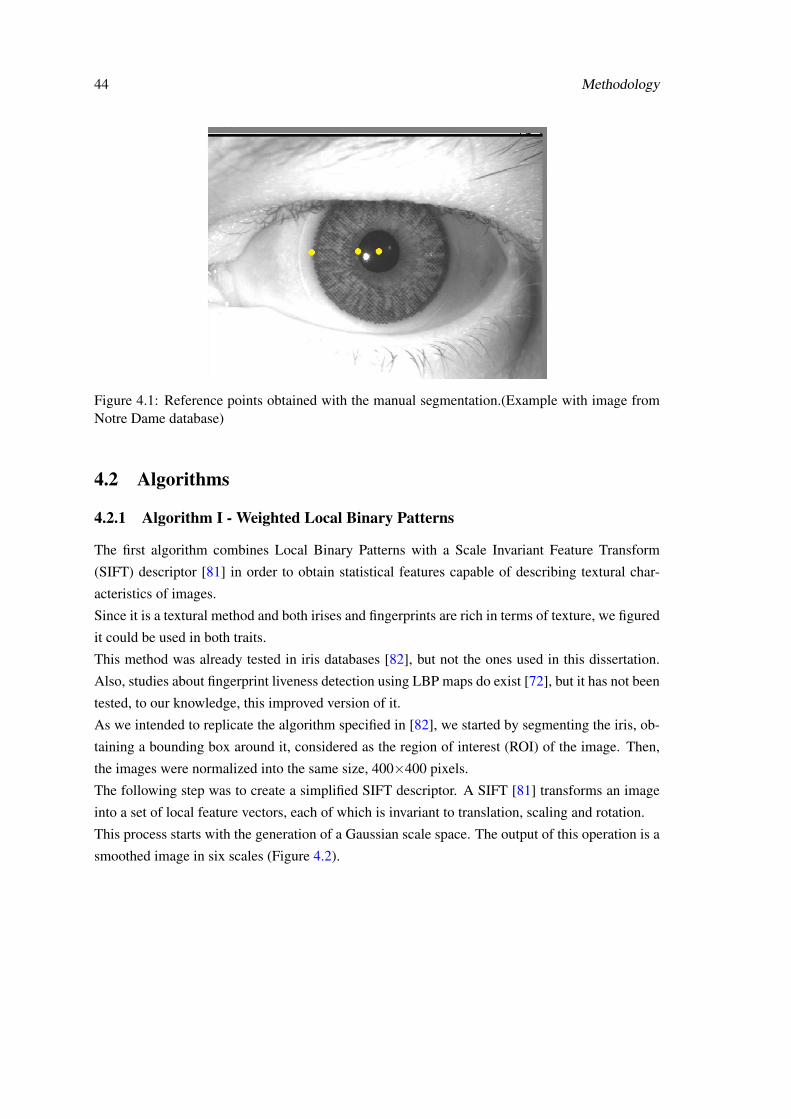
44 Methodology
Figure 4.1: Reference points obtained with the manual segmentation.(Example with image fromNotre Dame database)
4.2 Algorithms
4.2.1 Algorithm I - Weighted Local Binary Patterns
The first algorithm combines Local Binary Patterns with a Scale Invariant Feature Transform
(SIFT) descriptor [81] in order to obtain statistical features capable of describing textural char-
acteristics of images.
Since it is a textural method and both irises and fingerprints are rich in terms of texture, we figured
it could be used in both traits.
This method was already tested in iris databases [82], but not the ones used in this dissertation.
Also, studies about fingerprint liveness detection using LBP maps do exist [72], but it has not been
tested, to our knowledge, this improved version of it.
As we intended to replicate the algorithm specified in [82], we started by segmenting the iris, ob-
taining a bounding box around it, considered as the region of interest (ROI) of the image. Then,
the images were normalized into the same size, 400×400 pixels.
The following step was to create a simplified SIFT descriptor. A SIFT [81] transforms an image
into a set of local feature vectors, each of which is invariant to translation, scaling and rotation.
This process starts with the generation of a Gaussian scale space. The output of this operation is a
smoothed image in six scales (Figure 4.2).

4.2 Algorithms 45
Figure 4.2: Representation of the Gaussian scale space generation (Adapted from [83]).
For each scale, the gradient orientation of each pixel is calculated and, by analyzing every pixel’s
5×5 neighborhood, an histogram of gradient orientations is created. A Gaussian window is ap-
plied to the neighborhood so that the closest neighbors to the pixel are more relevant than the
farthest ones.
Figure 4.3 represents the aforementioned operation. The arrows represent the gradient orienta-
tions, the circle is the Gaussian window and the illustration on the right symbolizes an histogram
of gradient orientations. The gradient orientations are rotated to the following eight orientations:
O = {0o,45o,90o,135o,180o,225o,270o,315o} (4.1)
Every histogram is then converted into a descending rank, from 7 to 0. The orientation corre-
spondent to the biggest histogram bin is set to 7 while the lowest is set to 0, as can be seen in the
example of Figure 4.5.
Figure 4.3: Gradient orientations & Histogram of orientations [82].
Since irises have very fine textures that could influence the accuracy of this method, applying a
SIFT descriptor to the LBP approach will improve its invariability to local rotations and distor-
tions.
A Local Binary Pattern (LBP) labels the pixels of an image by comparing the neighborhood of
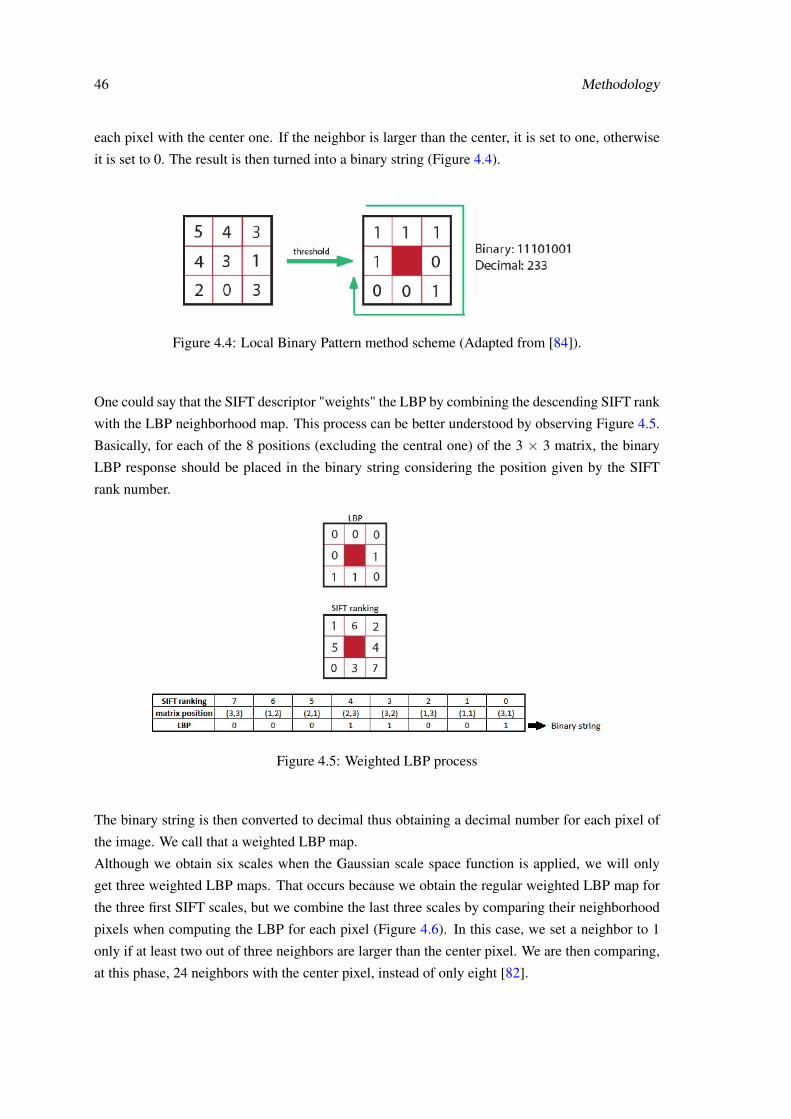
46 Methodology
each pixel with the center one. If the neighbor is larger than the center, it is set to one, otherwise
it is set to 0. The result is then turned into a binary string (Figure 4.4).
Figure 4.4: Local Binary Pattern method scheme (Adapted from [84]).
One could say that the SIFT descriptor "weights" the LBP by combining the descending SIFT rank
with the LBP neighborhood map. This process can be better understood by observing Figure 4.5.
Basically, for each of the 8 positions (excluding the central one) of the 3 × 3 matrix, the binary
LBP response should be placed in the binary string considering the position given by the SIFT
rank number.
Figure 4.5: Weighted LBP process
The binary string is then converted to decimal thus obtaining a decimal number for each pixel of
the image. We call that a weighted LBP map.
Although we obtain six scales when the Gaussian scale space function is applied, we will only
get three weighted LBP maps. That occurs because we obtain the regular weighted LBP map for
the three first SIFT scales, but we combine the last three scales by comparing their neighborhood
pixels when computing the LBP for each pixel (Figure 4.6). In this case, we set a neighbor to 1
only if at least two out of three neighbors are larger than the center pixel. We are then comparing,
at this phase, 24 neighbors with the center pixel, instead of only eight [82].
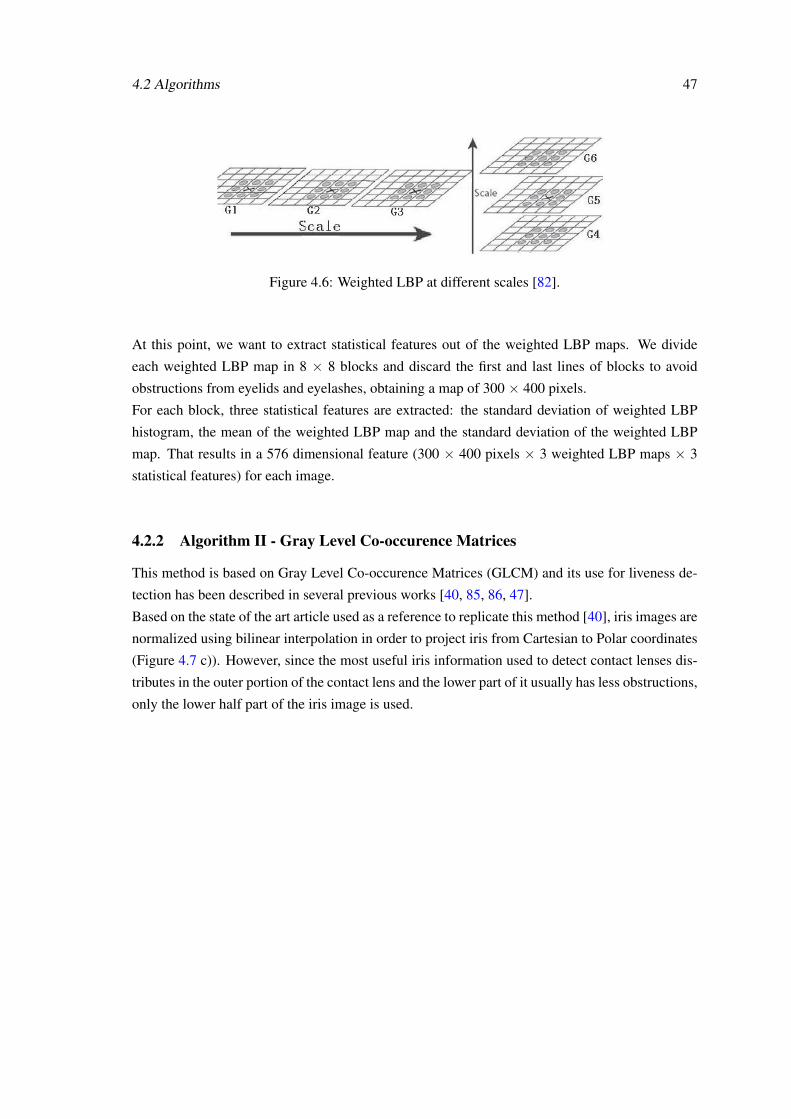
4.2 Algorithms 47
Figure 4.6: Weighted LBP at different scales [82].
At this point, we want to extract statistical features out of the weighted LBP maps. We divide
each weighted LBP map in 8 × 8 blocks and discard the first and last lines of blocks to avoid
obstructions from eyelids and eyelashes, obtaining a map of 300 × 400 pixels.
For each block, three statistical features are extracted: the standard deviation of weighted LBP
histogram, the mean of the weighted LBP map and the standard deviation of the weighted LBP
map. That results in a 576 dimensional feature (300 × 400 pixels × 3 weighted LBP maps × 3
statistical features) for each image.
4.2.2 Algorithm II - Gray Level Co-occurence Matrices
This method is based on Gray Level Co-occurence Matrices (GLCM) and its use for liveness de-
tection has been described in several previous works [40, 85, 86, 47].
Based on the state of the art article used as a reference to replicate this method [40], iris images are
normalized using bilinear interpolation in order to project iris from Cartesian to Polar coordinates
(Figure 4.7 c)). However, since the most useful iris information used to detect contact lenses dis-
tributes in the outer portion of the contact lens and the lower part of it usually has less obstructions,
only the lower half part of the iris image is used.

48 Methodology
Figure 4.7: GLCM method - Iris image pre-processing [40].
Co-occurrence matrices characterize the relationship between neighboring pixels (Figure 4.8.
Each element p(i, j) of a GLCM matrix represents the relative frequency with which two neigh-
boring pixels separated by a certain distance occur, one with a gray scale i and another with a gray
scale j [47].
Figure 4.8: Example of the creation of a GLCM matrix [25].
Haralick et al. [85] define 14 features that can be extracted from a GLCM matrix, these are:
1) Angular Second Moment (ASM):
f1 = ∑i
∑j{p(i, j)}2 (4.2)
where p(i, j) is the (i, j)th entry in a normalized gray-tone spacial-dependence matrix.
2) Contrast:

4.2 Algorithms 49
f2 =Ng−1
∑n=0
n2{Ng
∑i=1
Ng
∑j=1
|i− j|=n
p(i, j)} (4.3)
where Ng is the number of distinct gray levels in the quantized image.
3) Correlation:
f3 =∑i ∑ j(i, j)p(i, j)−µxµy
σxσy(4.4)
4) Sum of Squares (Variance):
f4 = ∑i
∑j(i−µ)2 p(i, j) (4.5)
5) Inverse Difference Moment:
f5 = ∑i
∑j
11+(i− j)2 p(i, j) (4.6)
6) Sum Average:
f6 =2Ng
∑i=2
ipx+y(i) (4.7)
7) Sum Variance:
f7 =2Ng
∑i=2
(i− f8)2 px+y(i) (4.8)
8) Sum Entropy:
f8 =−2Ng
∑i=2
px+y(i)log{px+y(i)} (4.9)
9) Entropy:
f9 =−∑i
∑j
p(i, j)log(p(i, j)) (4.10)
10) Difference Variance:
f10 = variance of px−y (4.11)
11) Difference Entropy:
f11 =−Ng−1
∑i=0
px−y(i)log{px−y(i)} (4.12)
12) & 13) Information Measures of Correlation:
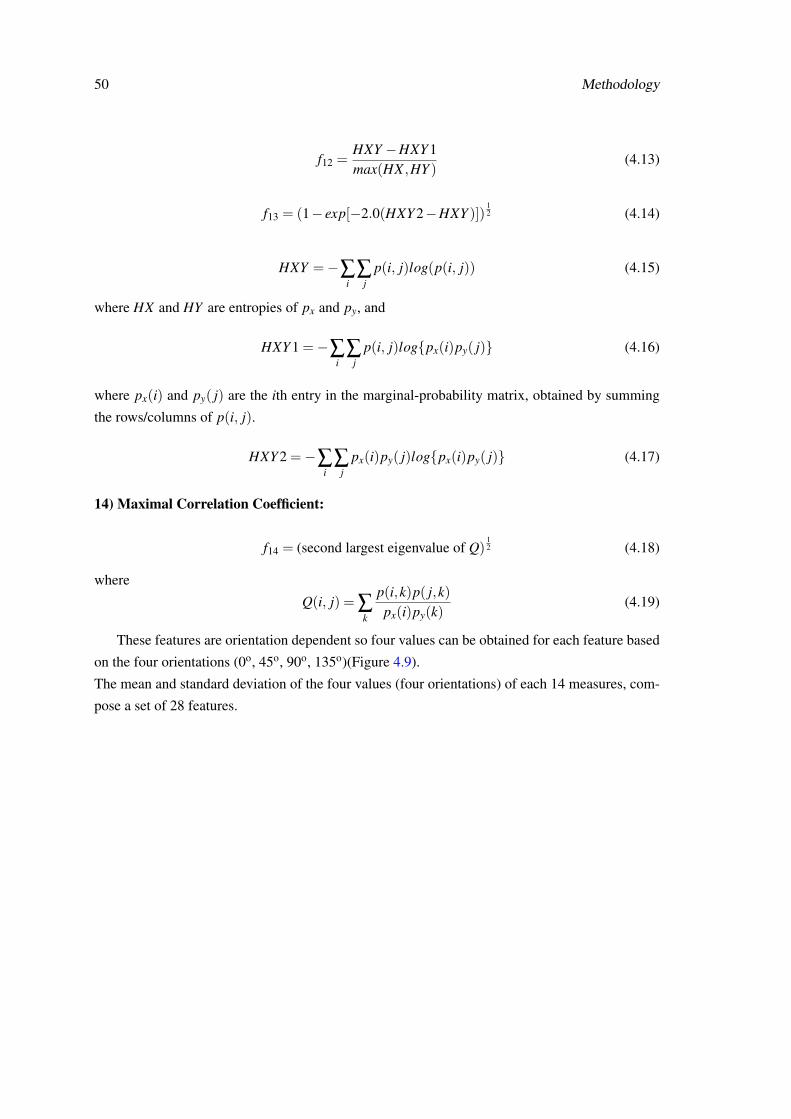
50 Methodology
f12 =HXY −HXY 1max(HX ,HY )
(4.13)
f13 = (1− exp[−2.0(HXY 2−HXY )])12 (4.14)
HXY =−∑i
∑j
p(i, j)log(p(i, j)) (4.15)
where HX and HY are entropies of px and py, and
HXY 1 =−∑i
∑j
p(i, j)log{px(i)py( j)} (4.16)
where px(i) and py( j) are the ith entry in the marginal-probability matrix, obtained by summing
the rows/columns of p(i, j).
HXY 2 =−∑i
∑j
px(i)py( j)log{px(i)py( j)} (4.17)
14) Maximal Correlation Coefficient:
f14 = (second largest eigenvalue of Q)12 (4.18)
where
Q(i, j) = ∑k
p(i,k)p( j,k)px(i)py(k)
(4.19)
These features are orientation dependent so four values can be obtained for each feature based
on the four orientations (0o, 45o, 90o, 135o)(Figure 4.9).
The mean and standard deviation of the four values (four orientations) of each 14 measures, com-
pose a set of 28 features.
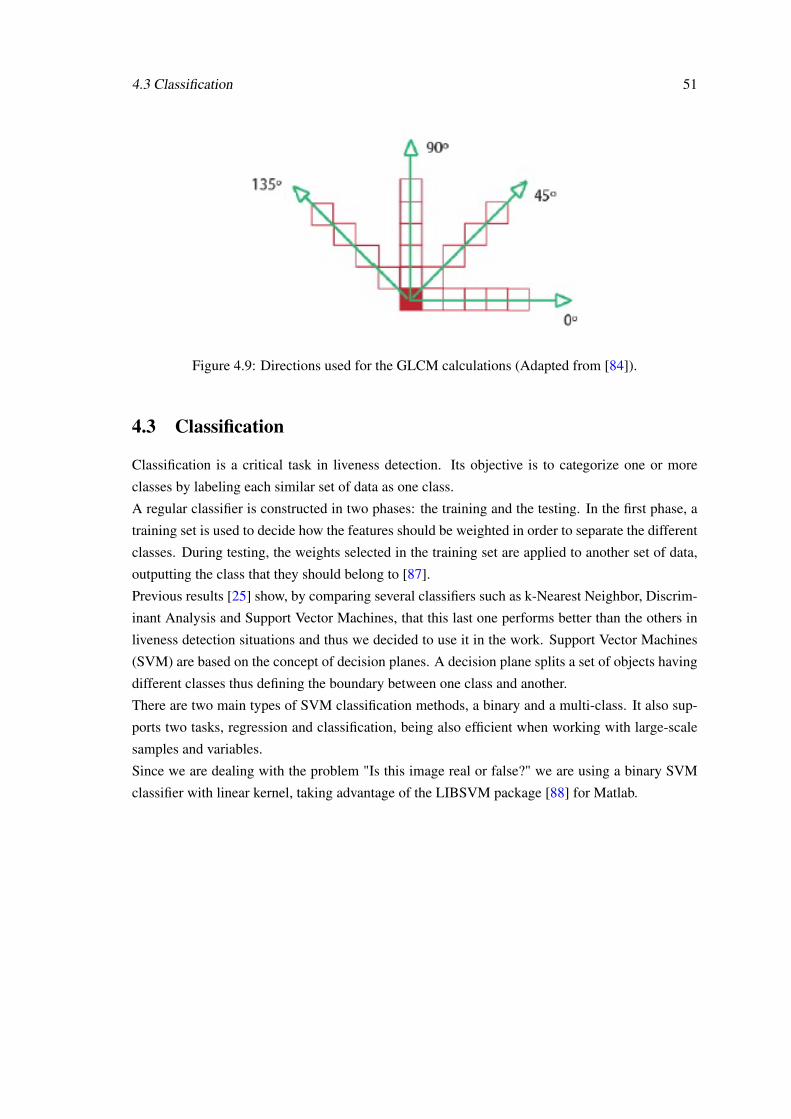
4.3 Classification 51
Figure 4.9: Directions used for the GLCM calculations (Adapted from [84]).
4.3 Classification
Classification is a critical task in liveness detection. Its objective is to categorize one or more
classes by labeling each similar set of data as one class.
A regular classifier is constructed in two phases: the training and the testing. In the first phase, a
training set is used to decide how the features should be weighted in order to separate the different
classes. During testing, the weights selected in the training set are applied to another set of data,
outputting the class that they should belong to [87].
Previous results [25] show, by comparing several classifiers such as k-Nearest Neighbor, Discrim-
inant Analysis and Support Vector Machines, that this last one performs better than the others in
liveness detection situations and thus we decided to use it in the work. Support Vector Machines
(SVM) are based on the concept of decision planes. A decision plane splits a set of objects having
different classes thus defining the boundary between one class and another.
There are two main types of SVM classification methods, a binary and a multi-class. It also sup-
ports two tasks, regression and classification, being also efficient when working with large-scale
samples and variables.
Since we are dealing with the problem "Is this image real or false?" we are using a binary SVM
classifier with linear kernel, taking advantage of the LIBSVM package [88] for Matlab.

52 Methodology
Chapter 5
Experimental Setup and Results
This chapter presents the results obtained by applying the methodology described in Chapter 4 for
liveness detection in iris and fingerprint recognition systems. A brief explanation of what actions
performed is also present as well as some global information about the chosen databases.
5.1 Databases
5.1.1 Iris
The databases selected to test the liveness detection methods in iris images were the Clarkson
and Notre Dame databases. This choice was made because these are the only databases, to our
knowledge, with fake samples using cosmetic contact lenses.
More information about this database can be found in Section 3.1.5.3.
5.1.2 Fingerprint
To test the algorithms in fingerprint images, the four datasets from the LivDet2013 [80] were used.
The four datasets correspond to four sensors used to collect the images. It is also a very diverse
database since several types of materials were used to create the dummy fingers: gelatin, latex,
ecoflex, wood glue, Play-Doh, etc.
More information about this database can be found in Section 3.2.5.3.
5.2 Feature Extraction
5.2.1 Weighted Local Binary Patterns
For the wLBP method we started by obtaining the weighted LBP maps for both fake and real
images of the Clarkson and Notre Dame databases. As quoted before, the fake samples of these
databases are from iris using cosmetic contact lenses.
Since we are working with 3 simple scales plus a combined one (scale 4, 5 and 6), we obtained a
53
54 Experimental Setup and Results
300 × 400 × 4 map for each image.
From these maps, 3 statistical features were extracted: the standard deviation of weighted LBP
histogram, the mean of the weighted LBP map and standard deviation of weighted LBP map, ob-
taining thus a 576 dimensional feature for each image.
The procedure for this method using Fingerprint Datasets was similar to the one explained above.
The main difference between these implementations is that, for the fingerprint images, no segmen-
tation was needed and the whole images were used.
5.2.2 Gray-Level Co-Occurence Matrices
For this method we started by obtaining a GLCM matrix for every picture, using four orientations:
0o, 45o, 90o, 135o. Fourteen measures (see Section 4.2.2) were extracted from these matrices, that
is, 14 measures for each of the four orientations.
We then obtained the mean and standard deviation of those 4 values of each measure thus getting
28 features, that where then used by the classifier.
Similarly to what has been stated for the first method, this second method has similar procedures
for both iris and fingerprint images. However, there is no need to normalize the fingerprint and so,
the whole images were used in that case.
5.3 Learning methodology
5.3.1 Classification results using SVM
SVM was the classifier chosen for this work as it has presented better results in liveness detection
situations in previous studies.
We run the SVM classifier 50 times using a polinomial kernel. In each run, the results were ob-
tained by dividing randomly 62.5% of the samples for training and 37.5% for testing.
Cross-validation was also used for SVM to optimize its parameters. A "grid-search" was per-
formed on the parameters of the models. The exponential growth of C = 2N was tested, with
N varying from −1 to 15. The polynomial degree (d) was tested with the following values
{1,2,3,4,5}.
5.3.2 Cross-Validation
Cross-validation is a technique to estimate the performance of a predictive model and it aims to
define a dataset to test in the training phase.
The holdout method, also called 2-fold cross-validation, was the method chosen for this work. In
this method, the data set is split into two sets, the training set and the testing set. A function that
approximates the training data is found and then it asked to predict the output values for the testing
5.4 Evaluation Metrics 55
set [89].
The mean absolute testing set error are calculated and used to evaluate the model. However, this
evaluation may depend on which data end up in the training set and which end up in the training
set.
The Matlab function used in this dissertation returns logical index vectors for cross-validation of
N observations (N = 2 in this work). That is done by randomly selecting the percentage of data
tested × N (approximately) observations to hold out for the evaluation set.
We used this technique to obtain the best parameters (d,C) to use for the estimation of the testing
set classes.
5.4 Evaluation Metrics
To evaluate the accuracy of the classification method used, the misclassification rate was calcu-
lated. For each pair of C and d, the misclassification rate was estimated as:
misclassificationRate =∑(predicted data class 6= true data class)
length of data(5.1)
The minimum misclassification rate was then found, giving also the best pair of parameters to use.
This process was repeated 50 times and, for each cycle, the classification was performed using
the chosen (d,C) pair. The misclassification rate (Equation 5.1) was calculated again for each of
the 50 cycles and the mean and standard deviation of these rates allow us to analyze the overall
performance of the classification.
5.5 Results for the Iris images
Table 5.1 presents the results obtained using Iris databases for both studied algorithms. The results
are express as the percentage (%) of classification error. The columns "mean" correspond to the
mean classification error and σ stands for standard deviation.
For Algorithm I, we also used an available LBP algorithm [90] in order to compare results. We
tested this method using 8 and 16 neighbors, using the histogram of the obtained maps, since it is
considered to be a powerful textural feature.
In this table, LBP8 stands for the available LBP algorithm [90] using 8 neighbors of each pixel,
LBP16 stands for the LBP algorithm using 16 neighbors and wLBP corresponds to the implemented
weighted LBP method (see Section 5.2.1).
For the GLCM method, GLCM1 corresponds to the results obtained using the algorithm reported in
[25] and GLCM2 refers to the use of the Matlab functions available, graycoprops. Finally, GLCM3
corresponds to the method described in the previous chapter (Section 5.2.2).
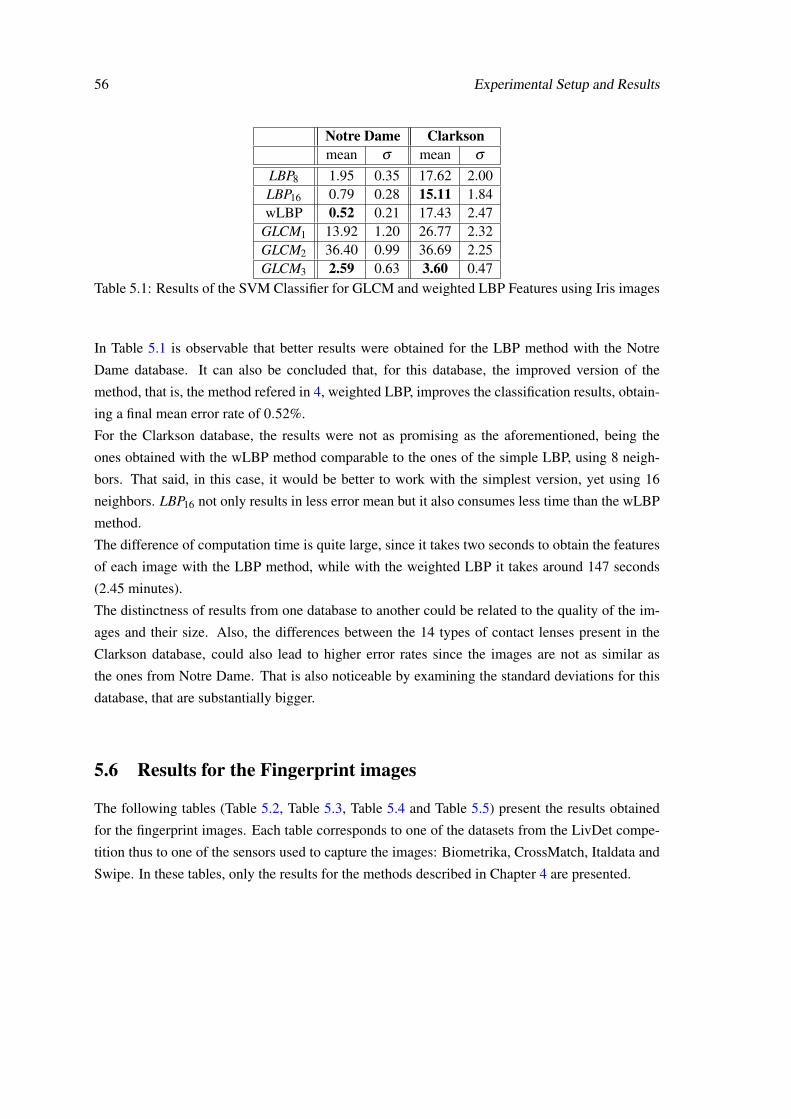
56 Experimental Setup and Results
Notre Dame Clarksonmean σ mean σ
LBP8 1.95 0.35 17.62 2.00LBP16 0.79 0.28 15.11 1.84wLBP 0.52 0.21 17.43 2.47
GLCM1 13.92 1.20 26.77 2.32GLCM2 36.40 0.99 36.69 2.25GLCM3 2.59 0.63 3.60 0.47
Table 5.1: Results of the SVM Classifier for GLCM and weighted LBP Features using Iris images
In Table 5.1 is observable that better results were obtained for the LBP method with the Notre
Dame database. It can also be concluded that, for this database, the improved version of the
method, that is, the method refered in 4, weighted LBP, improves the classification results, obtain-
ing a final mean error rate of 0.52%.
For the Clarkson database, the results were not as promising as the aforementioned, being the
ones obtained with the wLBP method comparable to the ones of the simple LBP, using 8 neigh-
bors. That said, in this case, it would be better to work with the simplest version, yet using 16
neighbors. LBP16 not only results in less error mean but it also consumes less time than the wLBP
method.
The difference of computation time is quite large, since it takes two seconds to obtain the features
of each image with the LBP method, while with the weighted LBP it takes around 147 seconds
(2.45 minutes).
The distinctness of results from one database to another could be related to the quality of the im-
ages and their size. Also, the differences between the 14 types of contact lenses present in the
Clarkson database, could also lead to higher error rates since the images are not as similar as
the ones from Notre Dame. That is also noticeable by examining the standard deviations for this
database, that are substantially bigger.
5.6 Results for the Fingerprint images
The following tables (Table 5.2, Table 5.3, Table 5.4 and Table 5.5) present the results obtained
for the fingerprint images. Each table corresponds to one of the datasets from the LivDet compe-
tition thus to one of the sensors used to capture the images: Biometrika, CrossMatch, Italdata and
Swipe. In these tables, only the results for the methods described in Chapter 4 are presented.

5.6 Results for the Fingerprint images 57
BiometrikaEcoflex Gelatin Latex Modasil Wood Glue
mean σ mean σ mean σ mean σ mean σ
wLBP 0.78 0.22 3.82 0.61 1.54 0.40 0.98 0.38 1.38 0.38GLCM3 16.97 1.01 16.65 1.03 16.62 1.04 16.32 0.79 16.66 1.16
Table 5.2: Results of the SVM Classifier for GLCM and weighted LBP Features using theLivDet2013 - Biometrika dataset.
Table 5.2 shows that the weighted LBP method performs better than the GLCM method using
the Biometrika dataset. For the weighted LBP, the best outcome is the one resulting from the use
of Ecoflex fake samples: 0.78% of mean error.
For the GLCM method, the results are weighted in the range of ]16,17[, corresponding the best
one to the Modasil fingerprints. The high GLCM method error rates may have to do with the
"curse of dimensionality". That is, using all features could not be resulting in the best outcome
and a subset of these features could result in lower classification errors. This means that, in this
case, performing feature selection could be necessary.
CrossMatchBody Double Latex Play-Doh Wood Gluemean σ mean σ mean σ mean σ
wLBP 16.63 0.75 16.54 0.96 16.58 0.93 16.63 0.76GLCM3 16.57 0.91 16.54 0.85 16.57 0.86 16.69 0.86
Table 5.3: Results of the SVM Classifier for GLCM and weighted LBP Features using theLivDet2013 - CrossMatch dataset.
The results for this dataset, presented in Table 5.3, were unexpected, especially for the weighted
LBP method, that shows higher results than the ones got for the other datasets.
The best result for both method was the same, 16.54%, for the Latex fake dummies images. How-
ever, the standard deviation for these images was slightly higher for the weighted LBP method.
The range of values for the GLCM method remains the same obtained for the previous dataset,
confirming that feature selection should be employed in order to get a subset of features that lower
the error rate obtained.
ItaldataEcoflex Gelatin Latex Modasil Wood Glue
mean σ mean σ mean σ mean σ mean σ
wLBP 1.13 0.30 1.36 0.41 1.42 0.38 0.82 0.31 1.22 0.48GLCM3 16.61 1.11 16.56 0.99 16.40 0.79 16.79 0.75 16.82 0.95
Table 5.4: Results of the SVM Classifier for GLCM and weighted LBP Features using theLivDet2013 - Italdata dataset
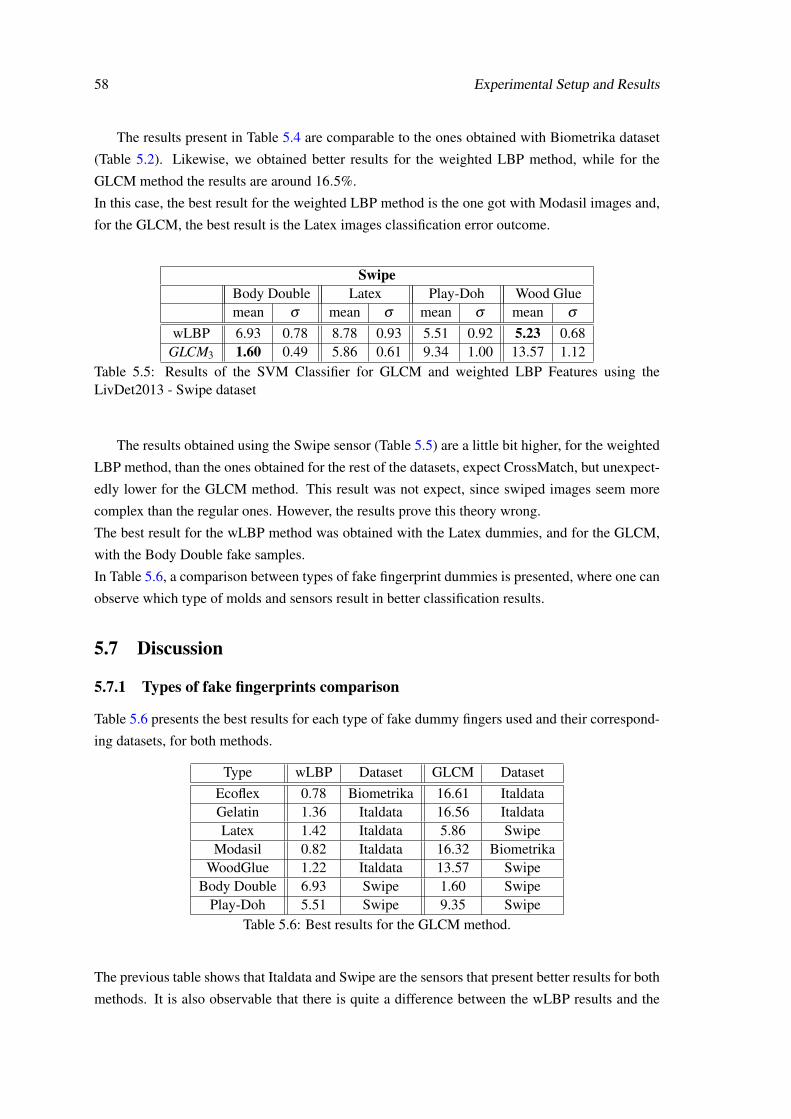
58 Experimental Setup and Results
The results present in Table 5.4 are comparable to the ones obtained with Biometrika dataset
(Table 5.2). Likewise, we obtained better results for the weighted LBP method, while for the
GLCM method the results are around 16.5%.
In this case, the best result for the weighted LBP method is the one got with Modasil images and,
for the GLCM, the best result is the Latex images classification error outcome.
SwipeBody Double Latex Play-Doh Wood Gluemean σ mean σ mean σ mean σ
wLBP 6.93 0.78 8.78 0.93 5.51 0.92 5.23 0.68GLCM3 1.60 0.49 5.86 0.61 9.34 1.00 13.57 1.12
Table 5.5: Results of the SVM Classifier for GLCM and weighted LBP Features using theLivDet2013 - Swipe dataset
The results obtained using the Swipe sensor (Table 5.5) are a little bit higher, for the weighted
LBP method, than the ones obtained for the rest of the datasets, expect CrossMatch, but unexpect-
edly lower for the GLCM method. This result was not expect, since swiped images seem more
complex than the regular ones. However, the results prove this theory wrong.
The best result for the wLBP method was obtained with the Latex dummies, and for the GLCM,
with the Body Double fake samples.
In Table 5.6, a comparison between types of fake fingerprint dummies is presented, where one can
observe which type of molds and sensors result in better classification results.
5.7 Discussion
5.7.1 Types of fake fingerprints comparison
Table 5.6 presents the best results for each type of fake dummy fingers used and their correspond-
ing datasets, for both methods.
Type wLBP Dataset GLCM DatasetEcoflex 0.78 Biometrika 16.61 ItaldataGelatin 1.36 Italdata 16.56 ItaldataLatex 1.42 Italdata 5.86 Swipe
Modasil 0.82 Italdata 16.32 BiometrikaWoodGlue 1.22 Italdata 13.57 Swipe
Body Double 6.93 Swipe 1.60 SwipePlay-Doh 5.51 Swipe 9.35 Swipe
Table 5.6: Best results for the GLCM method.
The previous table shows that Italdata and Swipe are the sensors that present better results for both
methods. It is also observable that there is quite a difference between the wLBP results and the
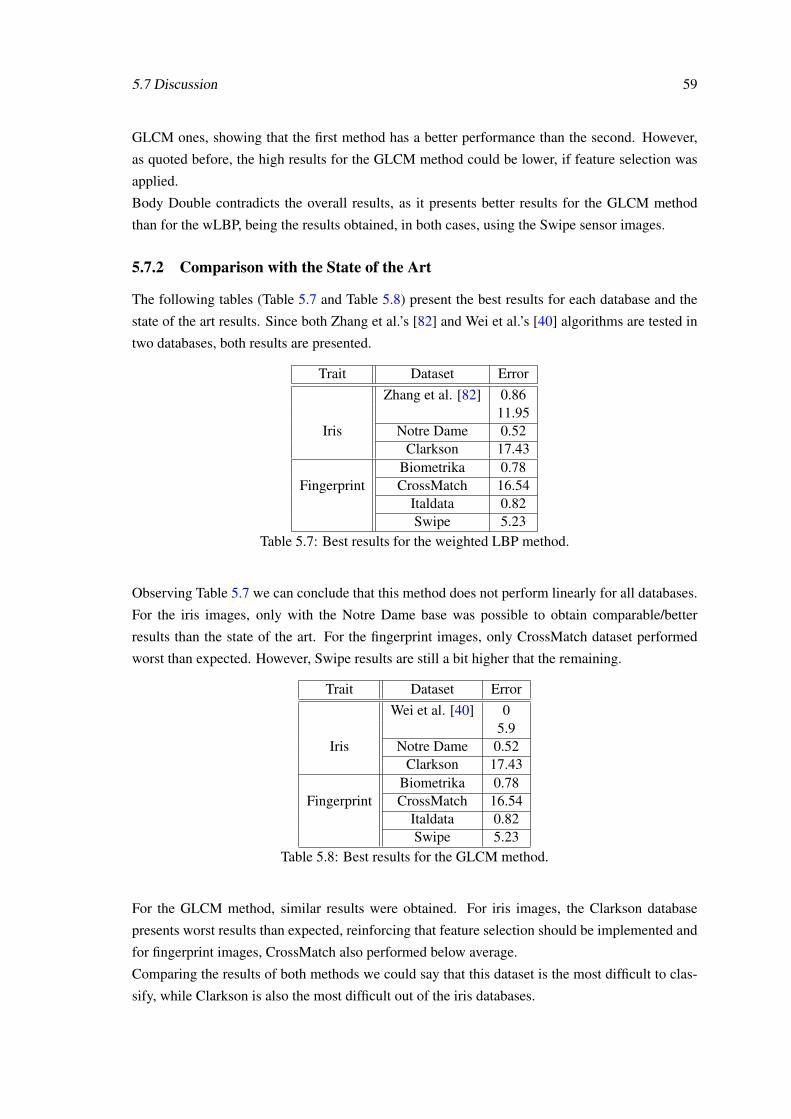
5.7 Discussion 59
GLCM ones, showing that the first method has a better performance than the second. However,
as quoted before, the high results for the GLCM method could be lower, if feature selection was
applied.
Body Double contradicts the overall results, as it presents better results for the GLCM method
than for the wLBP, being the results obtained, in both cases, using the Swipe sensor images.
5.7.2 Comparison with the State of the Art
The following tables (Table 5.7 and Table 5.8) present the best results for each database and the
state of the art results. Since both Zhang et al.’s [82] and Wei et al.’s [40] algorithms are tested in
two databases, both results are presented.
Trait Dataset ErrorZhang et al. [82] 0.86
11.95Iris Notre Dame 0.52
Clarkson 17.43Biometrika 0.78
Fingerprint CrossMatch 16.54Italdata 0.82Swipe 5.23
Table 5.7: Best results for the weighted LBP method.
Observing Table 5.7 we can conclude that this method does not perform linearly for all databases.
For the iris images, only with the Notre Dame base was possible to obtain comparable/better
results than the state of the art. For the fingerprint images, only CrossMatch dataset performed
worst than expected. However, Swipe results are still a bit higher that the remaining.
Trait Dataset ErrorWei et al. [40] 0
5.9Iris Notre Dame 0.52
Clarkson 17.43Biometrika 0.78
Fingerprint CrossMatch 16.54Italdata 0.82Swipe 5.23
Table 5.8: Best results for the GLCM method.
For the GLCM method, similar results were obtained. For iris images, the Clarkson database
presents worst results than expected, reinforcing that feature selection should be implemented and
for fingerprint images, CrossMatch also performed below average.
Comparing the results of both methods we could say that this dataset is the most difficult to clas-
sify, while Clarkson is also the most difficult out of the iris databases.

60 Experimental Setup and Results

Chapter 6
Conclusions and Future Work
6.1 Conclusions
During the research and the development of this work, it was possible to better understand the
liveness detection problem and how iris and fingerprint recognition systems work.
Even though the usage of iris and fingerprints in recognition system is now usual, there is still a
need to improve their efficiency, security and applicability.
Detecting the liveness detection of these traits is a great concern as successful spoofing attacks
may lead to the leakage of important information or theft of important objects.
In this work we selected and implemented two liveness detection algorithms and tested them in
both iris and fingerprint databases aiming to compare their accuracy and relationship between
traits.
We worked with two iris databases: Notre Dame and Clarkson and four datasets from the finger-
print database LivDet2013: Biometrika, CrossMatch, Italdata, and Swipe. Each of these corre-
sponding to a sensor used to capture of images.
The two iris databases are quite singular as their fake samples correspond to iris wearing cosmetic
contact lenses, which allowed us to use the same algorithms for both traits, as they both have tex-
tural characteristics.
The most important step of this work was feature extraction, as the classifying the images, depend
on the relevancy of the extracted features. Two types of texture features were extracted: an im-
proved LBP feature and GLCM features. In the weighted LBP feature, only one feature, with 575
dimentionality, was used in classification. In the GLCM method, 28 features were extracted.
In terms of classifier, the SVM were chosen, because it has presented the best results in previous
works.
The results show that overall the weighted LBP method performs better than the GLCM. This
second method gives promising results for the iris images, but high error rates for the fingerprint
images.
For the fingerprint images, it was also shown that the Italdata, Swipe and Biometrika sensors are
the ones resulting in a better outcome.
61

62 Conclusions and Future Work
Comparing the obtained results with the state-of-the-art ones, it has been shown that, even though
in some cases it was possible to obtain comparable or even better results, in some datasets, the
results were much worst than expected, showing that these methods’ results vary from database
to database. We may conclude that, although this work has showed that some good classification
results are already reachable, the study and the search for a better solution is still needed, as in the
security field, the error rate needs to be practically null.
6.2 Future Work
This dissertation intended to compare liveness detection methods for iris and fingerprint images.
It was not possible - nor was under the scope of this work - to explore, implement and test all
possible methods available. However, some other strategies and paths could be followed in the
future. This document ends with suggestions of potential directions and possibilities for future
studies about this theme.
First of all, making some improvements to the two algorithms presented could boost their robust-
ness and uniformity to different databases.
Testing new methods, combining methods, trying new classifiers or kernel functions for the SVM
used, could not only enhance the system performance, but also help to understand whether the
options made during this dissertation were the best ones.
Since liveness detection methods usually increase the processing time of the global recognition
system, it could be profitable to implement them in more efficient language, such as C++ or Java.
Also, the segmentation of iris images should be done automatically as we can not call it an "auto-
matic recognition" if part of the process is done manually.
Lastly, the final suggestion would be to implement the liveness detection algorithms presented in
a functional prototype.

References
[1] Anil Jain, Lin Hong, and Sharath Pankanti. Biometric identification. Communications of theACM, 43(2):90–98, 2000.
[2] S. Gayathri and V. Sridhar. FPGA implementation of orientation field estimation of fin-gerprint recognition process. International Journal on Recent Trends in Engineering andTechnology, 11(1), 2014.
[3] Samuel Fenker, Estefan Ortiz, and Kevin Bowyer. Template aging phenomenon in iris recog-nition. Access, IEEE, 1:266–274, 2013.
[4] Kevin Bowyer. Accuracy of iris recognition systems degrades with increase in elapsed time.https://spie.org/x90748.xml, 2012.
[5] Janeen Renaghan. Etched in stone. Smithsonian Zoogoer, August 1997.
[6] Deepthi Bala. Biometrics and information security. In Proceedings of the 5th annual confer-ence on Information security curriculum development, pages 64–66. ACM, 2008.
[7] Anil Jain and Ajay Kumar. Biometrics of next generation: An overview. Second GenerationBiometrics, 2010.
[8] Adrian Pocovnicu. Biometric security for cell phones. Informatica Economica, 13(1):57–63,2009.
[9] Siddhesh Angle, Reema Bhagtani, and Hemali Chheda. Biometrics: A further echelon ofsecurity. In UAE International Conference on Biological and Medical Physics, 2005.
[10] Yogendra Narain Singh and Sanjay Kumar Singh. Vitality detection from biometrics:state-of-the-art. In 2011 World Congress on Information and Communication Technologies(WICT), pages 106–111. IEEE, 2011.
[11] Hugo Proença. Towards non-cooperative biometric iris recognition. University of BeiraInterior. Department of Computer Science, 2006.
[12] Mohmad Kashif Qureshi. Liveness detection of biometric traits. International Journal ofInformation Technology and Knowledge Management, 4:293–295, 2011.
[13] João Monteiro. Robust iris recognition under unconstrained settings. Master’s thesis, Facul-dade de Engenharia da Universidade do Porto, Portugal, 2012.
[14] T Rakesh and MG Khogare. Survey of biometric recognition system for iris. InternationalJournal of Emerging Technology and Advanced Engineering (ISSN 2250-2459, Volume 2,Issue 6, 2012.
63

64 REFERENCES
[15] Virginia Ruiz-Albacete, Pedro Tome-Gonzalez, Fernando Alonso-Fernandez, Javier Gal-bally, Julian Fierrez, and Javier Ortega-Garcia. Direct attacks using fake images in irisverification. In Biometrics and Identity Management, pages 181–190. Springer, 2008.
[16] Nalini Ratha, Jonathan Connell, and Ruud Bolle. An analysis of minutiae matching strength.In Audio-and Video-Based Biometric Person Authentication, pages 223–228. Springer, 2001.
[17] Davide Maltoni, Dario Maio, Anil K Jain, and Salil Prabhakar. Handbook of fingerprintrecognition. Springer, 2009.
[18] Rod Seeley, Trent Stephens, and Philip Tate. Essentials of anatomy & physiology. St. Louis:Mosby-year book, 1996.
[19] Kevin Bowyer, Karen Hollingsworth, and Patrick Flynn. Image understanding for iris bio-metrics: A survey. Computer vision and image understanding, 110(2):281–307, 2008.
[20] Institute of Automation Chinese Academy of Sciences. Casia iris image database. http://www.cbsr.ia.ac.cn/china/Iris%20Databases%20CH.asp, 2004.
[21] National Institute of Standards and Technology (NIST). Iris challenge evaluation. http://www.nist.gov/itl/iad/ig/ice.cfm, 2006.
[22] S. Crihalmeanu, A. Ross, R. Govindarajan, L. Hornak, and S. Schuckers. A centralizedweb-enabled multimodal biometric database. In Biometric Consortium Conference (BCC),Crystal City, Virginia, 2004.
[23] Hugo Proença and Luís Alexandre. Ubiris: A noisy iris image database. In Image Analysisand Processing–ICIAP 2005, pages 970–977. Springer, 2005.
[24] Hugo Proenca, Silvio Filipe, Ricardo Santos, Joao Oliveira, and Luis Alexandre. The ubiris.v2: A database of visible wavelength iris images captured on-the-move and at-a-distance.IEE Transactions on Pattern Analysis and Machine Intelligence, 32(8):1529–1535, 2010.
[25] Juliano Murari. Detecção de vivacidade em sistemas de reconhecimento de íris. Master’sthesis, Faculdade de Engenharia da Universidade do Porto, Portugal, 2013.
[26] Multimedia University. MMU iris image database. http://pesona.mmu.edu.my/~ccteo/, 2004.
[27] Ana Sequeira, João Monteiro, Ana Rebelo, and Helder Oliveira. Mobbio a multimodaldatabase captured with an handheld device. volume 3, pages 133–139, 2014.
[28] John Daugman. High confidence visual recognition of persons by a test of statistical indepen-dence. IEEE Transactions on Pattern Analysis and Machine Intelligence, 15(11):1148–1161,1993.
[29] Richard Wildes. Iris recognition: an emerging biometric technology. Proceedings of theIEEE, 85(9):1348–1363, 1997.
[30] Using iris to enter the uk. http://www.ukba.homeoffice.gov.uk/customs-travel/Enteringtheuk/usingiris/.
[31] John Daugman. Iris recognition border-crossing system in the UAE. International AirportReview, 8(2), 2004.

REFERENCES 65
[32] Ensuring uniqueness: Collecting iris biometrics for the unique ID mission. http://uidai.gov.in/UID_PDF/Working_Papers/UID_and_iris_paper_final.pdf.
[33] Nexus pass application, US immigration visa & travel. http://usa.immigrationvisaforms.com/travel/nexus-pass.
[34] Nexus - service Canada. http://www.servicecanada.gc.ca/eng/goc/nexus_highway.shtml.
[35] About NEXUS. http://cbsa-asfc.gc.ca/prog/nexus/about-sujet-eng.html.
[36] Iris recognition - Cairoamman bank. http://www.cab.jo/service-details/61.
[37] Iris recognition finds favor. http://www.bankersonline.com/articles/bhv10n02/bhv10n02a2.html.
[38] Don’t blink: Iris recognition for biometric identification. http://www.sans.org/reading-room/whitepapers/authentication/dont-blink-iris-recognition-biometric-identification-1341, 2004.
[39] Xiaofu He, Yue Lu, and Pengfei Shi. A new fake iris detection method. In Advances inBiometrics, pages 1132–1139. Springer, 2009.
[40] Zhuoshi Wei, Xianchao Qiu, Zhenan Sun, and Tieniu Tan. Counterfeit iris detection basedon texture analysis. In 19th International Conference on Pattern Recognition. ICPR 2008.,pages 1–4. IEEE, 2008.
[41] Ulf von Seelen. Countermeasures against iris spoofing with contact lenses. In BiometricConsortium Conference BC, 2005.
[42] Javier Galbally, Jaime Ortiz-Lopez, Julian Fierrez, and Javier Ortega-Garcia. Iris livenessdetection based on quality related features. In 5th IAPR International Conference on Bio-metrics (ICB), pages 271–276. IEEE, 2012.
[43] Masashi Kanematsu, Hironobu Takano, and Kiyomi Nakamura. Highly reliable livenessdetection method for iris recognition. In SICE, 2007 Annual Conference, pages 361–364.IEEE, 2007.
[44] John Daugman. Anti-spoofing liveness detection. University of Cambridge, computer labo-ratory, Cambridge., 2001.
[45] John Daugman. Demodulation by complex-valued wavelets for stochastic pattern recog-nition. International Journal of Wavelets, Multiresolution and Information Processing,1(01):1–17, 2003.
[46] Li Ma, Tieniu Tan, Yunhong Wang, and Dexin Zhang. Personal identification based on iristexture analysis. IEEE Transactions on Pattern Analysis and Machine Intelligence, IEEETransactions on, 25(12):1519–1533, 2003.
[47] Xiaofu He, Shujuan An, and Pengfei Shi. Statistical texture analysis-based approach forfake iris detection using support vector machines. In Advances in Biometrics, pages 540–546. Springer, 2007.
66 REFERENCES
[48] Liveness competition 2013. http://people.clarkson.edu/projects/biosal/iris/.
[49] Jay Doyle and Kevin Bowyer. Notre dame image dataset for contact lens detection in irisrecognition, 2013.
[50] Adam Czajka. Database of iris printouts and is application: Development of liveness de-tection method for iris recognition. In Methods and Models in Automation and Robotics(MMAR), 2013 18th International Conference on, pages 28–33. IEEE, 2013.
[51] Juliano Murari, Ana Sequeira, and Jaime Cardoso. Iris liveness detection methods in mobileapplications. In Proceedings of International Conference on Computer Vision Theory andApplications (VISAPP), 2014.
[52] Julian Fierrez, Javier Ortega-Garcia, Doroteo Torre Toledano, and Joaquin Gonzalez-Rodriguez. Biosec baseline corpus: A multimodal biometric database. Pattern Recognition,40(4):1389–1392, 2007.
[53] Marie Sandström. Liveness detection in fingerprint recognition systems. 2004.
[54] Yau Wei Yun. The ‘123’of biometric technology. Synthesis Journal, 2002, 2002.
[55] CI Watson and CL Wilson. NIST special database 4. Fingerprint Database, National Insti-tute of Standards and Technology, 17, 1992.
[56] CI Watson and CL Wilson. NIST special database 9, fingerprint database. Special Database,1992.
[57] CI Watson. NIST special database 10: Supplemental fingerprint card data (sfcd) for NISTspecial database 9. 1993.
[58] Craig I Watson. Special database 14. In S. Department of Commerce, NIST, AdvancedSystems Division, Gaithersburg, Maryland. Citeseer, 1993.
[59] CI Watson. NIST special database 24 digital video of live-scan fingerprint data. 1998.
[60] Michael Garris and Michael McCabe. NIST special database 27: Fingerprint minutiae fromlatent and matching tenprint images. 2000.
[61] Raffaele Cappelli, Matteo Ferrara, Annalisa Franco, and Davide Maltoni. Fingerprint verifi-cation competition 2006. Biometric Technology Today, 15(7):7–9, 2007.
[62] BG Sherlock, DM Monro, and K Millard. Fingerprint enhancement by directional fourierfiltering. In Vision, Image and Signal Processing, IEE Proceedings-, volume 141, pages87–94. IET, 1994.
[63] Ahmed Abutaleb and M Kamel. A genetic algorithm for the estimation of ridges in finger-prints. Image Processing, IEEE Transactions on, 8(8):1134–1139, 1999.
[64] Yuheng Zhang and Qinghan Xiao. An optimized approach for fingerprint binarization.In Neural Networks, 2006. IJCNN’06. International Joint Conference on, pages 391–395.IEEE, 2006.
REFERENCES 67
[65] Takahiro Hatano, Takuya Adachi, Satoshi Shigematsu, Hiroki Morimura, Shigehiko Onishi,Yukio Okazaki, and Hakaru Kyuragi. A fingerprint verification algorithm using the differ-ential matching rate. In Pattern Recognition, International Conference on, volume 3, pages30799–30799. IEEE Computer Society, 2002.
[66] Tsai-Yang Jea and Venu Govindaraju. A minutia-based partial fingerprint recognition sys-tem. Pattern Recognition, 38(10):1672–1684, 2005.
[67] Yangyang Zhang, Xin Yang, Qi Su, and Jie Tian. Fingerprint recognition based on combinedfeatures. In Advances in Biometrics, pages 281–289. Springer, 2007.
[68] Ton Van der Putte and Jeroen Keuning. Biometrical fingerprint recognition: don’t getyour fingers burned. In Smart Card Research and Advanced Applications, pages 289–303.Springer, 2000.
[69] Luca Ghiani, Abdenour Hadid, Gian Luca Marcialis, and Fabio Roli. Fingerprint livenessdetection using binarized statistical image features. In IEEE Sixth International Conferenceon Biometrics: Theory, Applications and Systems (BTAS), pages 1–6. IEEE, 2013.
[70] David Yambay, Luca Ghiani, Paolo Denti, Gian Luca Marcialis, Fabio Roli, and S Schuckers.LivDet 2011—fingerprint liveness detection competition 2011. In 5th IAPR InternationalConference onBiometrics (ICB), pages 208–215. IEEE, 2012.
[71] Luca Ghiani, Gian Luca Marcialis, and Fabio Roli. Fingerprint liveness detection by localphase quantization. In 21st International Conference on Pattern Recognition (ICPR), pages537–540. IEEE, 2012.
[72] Timo Ojala, Matti Pietikainen, and Topi Maenpaa. Multiresolution gray-scale and rotationinvariant texture classification with local binary patterns. Pattern Analysis and MachineIntelligence, IEEE Transactions on, 24(7):971–987, 2002.
[73] Diego Gragnaniello, Giovanni Poggi, Carlo Sansone, and Luisa Verdoliva. Fingerprint live-ness detection based on weber local image descriptor. In Biometric Measurements and Sys-tems for Security and Medical Applications (BIOMS), 2013 IEEE Workshop on, pages 46–50.IEEE, 2013.
[74] Gian Luca Marcialis, Aaron Lewicke, Bozhao Tan, Pietro Coli, Dominic Grimberg, AlbertoCongiu, Alessandra Tidu, Fabio Roli, and Stephanie Schuckers. First international fingerprintliveness detection competition—livdet 2009. In Image Analysis and Processing–ICIAP 2009,pages 12–23. Springer, 2009.
[75] BG Warwante and Mr SA Maske. Wavelet based fingerprint liveness detection. InternationalJournal of Engineering Research and Applications, 2(2):1643–1645, 2012.
[76] Bozhao Tan and Stephanie Schuckers. Spoofing protection for fingerprint scanner by fusingridge signal and valley noise. Pattern Recognition, 43(8):2845–2857, 2010.
[77] Bozhao Tan and Stephanie Schuckers. Liveness detection for fingerprint scanners basedon the statistics of wavelet signal processing. In Computer Vision and Pattern RecognitionWorkshop, 2006. CVPRW’06., pages 26–26. IEEE, 2006.
[78] Javier Galbally, Fernando Alonso-Fernandez, Julian Fierrez, and Javier Ortega-Garcia. Ahigh performance fingerprint liveness detection method based on quality related features.Future Generation Computer Systems, 28(1):311–321, 2012.

68 REFERENCES
[79] Javier Galbally, Julian Fierrez, Fernando Alonso-Fernandez, and Marcos Martinez-Diaz.Evaluation of direct attacks to fingerprint verification systems. Telecommunication Systems,47(3-4):243–254, 2011.
[80] Luca Ghiani, David Yambay, Valerio Mura, Simona Tocco, Gian Luca Marcialis, Fabio Roli,and Stephanie Schuckers. Livdet 2013 fingerprint liveness detection competition 2013. In2013 International Conference on Biometrics (ICB), pages 1–6. IEEE, 2013.
[81] David G Lowe. Object recognition from local scale-invariant features. In Seventh IEEEinternational conference on Computer vision, volume 2, pages 1150–1157. Ieee, 1999.
[82] Hui Zhang, Zhenan Sun, and Tieniu Tan. Contact lens detection based on weighted LBP.In 20th International Conference on Pattern Recognition (ICPR), pages 4279–4282. IEEE,2010.
[83] Konstantinos G. Derpanis. Computer vision related note - York University.http://dweller.cvr.yorku.ca/members/gradstudents/kosta/compvis/index.html.
[84] Joana Fonseca. Pre-cads in breast cancer. Master’s thesis, Faculdade de Engenharia daUniversidade do Porto, Portugal, 2013.
[85] Robert M Haralick, Karthikeyan Shanmugam, and Its’hak Dinstein. Textural features forimage classification. IEEE Transactions on Systems, Man and Cybernetics, (6):610–621,1973.
[86] Luca Ghiani, Gian Luca Marcialis, and Fabio Roli. Experimental results on the feature-level fusion of multiple fingerprint liveness detection algorithms. In Proceedings of the onMultimedia and security, pages 157–164. ACM, 2012.
[87] Richard L. White. Methods for classification. http://sundog.stsci.edu/rick/SCMA/node1.html.
[88] Chih-Chung Chang and Chih-Jen Lin. Libsvm: a library for support vector machines. ACMTransactions on Intelligent Systems and Technology (TIST), 2(3):27, 2011.
[89] Jeff Schneider. Cross validation. http://www.cs.cmu.edu/~schneide/tut5/node42.html, 1997.
[90] Luigi Rosa. LBP face recognition system matlab code. http://www.advancedsourcecode.com/lbpfacedem.zip.