Perspectivas de la Industria Automotriz PERUaap.org.pe/descarga/ea2017/Presentacion-Guido... ·...
33
© 2017 IHS Markit. All Rights Reserved. © 2017 IHS Markit. All Rights Reserved. Perspectivas de la Industria Automotriz PERU Diciembre, 2017 Guido Vildozo | Senior Manager, Americas +1 781 301 9037, [email protected]
Transcript of Perspectivas de la Industria Automotriz PERUaap.org.pe/descarga/ea2017/Presentacion-Guido... ·...

© 2017 IHS Markit. All Rights Reserved.© 2017 IHS Markit. All Rights Reserved.
Perspectivas de la Industria AutomotrizPERUDiciembre, 2017
Guido Vildozo | Senior Manager, Americas
+1 781 301 9037, [email protected]

© 2017 IHS Markit. All Rights Reserved.
Enfrentado retos del futuro al conectar industrias criticas globales.
MateriasPrimas
Finanzas
Tecnologia yEspecificaciones
TransporteOPERATIONAL RISK
& REGULATORY COMPLIANCE
DIGITAL & WEB SOLUTIONS
MARITIME & TRADE
AEROSPACE,DEFENSE &SECURITY
AUTOMOTIVEENGINEERING &
PRODUCT DESIGN
ECONOMICS & COUNTRY RISKENERGY
CHEMICALFINANCIAL
MARKETS DATA& SERVICES
TECHNOLOGY,MEDIA &TELECOM
© 2016 IHS Markit© 2016 IHS Markit© 2016 IHS Markit – All Rights Reserved
© 2017 IHS Markit. All Rights Reserved.
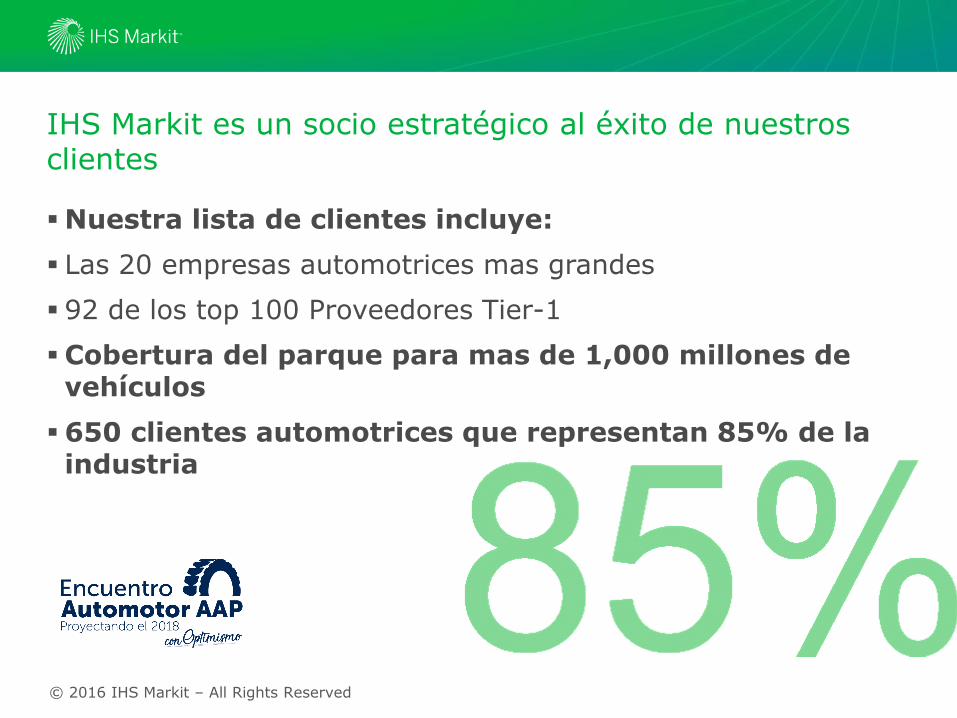
IHS Markit es un socio estratégico al éxito de nuestros clientes
▪ Nuestra lista de clientes incluye:
▪ Las 20 empresas automotrices mas grandes
▪ 92 de los top 100 Proveedores Tier-1
▪ Cobertura del parque para mas de 1,000 millones de vehículos
▪ 650 clientes automotrices que representan 85% de la industria
© 2016 IHS Markit – All Rights Reserved

Contents
© 2016 IHS Markit
SOCIMÓNOCE SERODACIDNI
AL ED LABOLG AVITCEPSREP INDUSTRIA AUTOMOTRIZ
NOICAZIROTOM NE SOIBMAC
AIRTSUDNI AL ED AVITCEPSREP AUTOMOTRIZ EN AMÉRICA LATINA
SATNEV ED AVITCEPSREP AUTOMOTRICES PARA EL MERCADO PERUANO
NEMUSER
4
© 2017 IHS Markit. All Rights Reserved.
0
1
2
3
4
5
2012 2013 2014 2015 2016 2017 2018 2019 2020
Pe
rce
nt
ch
an
ge
Real GDP Industrial production Real goods & services trade
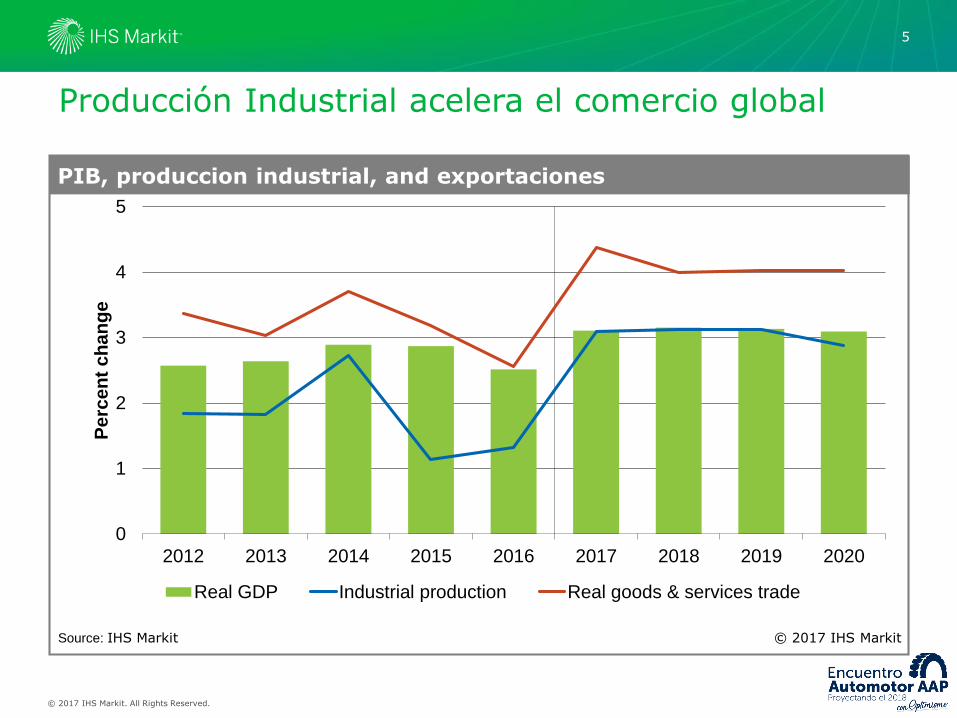
Producción Industrial acelera el comercio global
PIB, produccion industrial, and exportaciones
Source: IHS Markit © 2017 IHS Markit
5
© 2017 IHS Markit. All Rights Reserved.
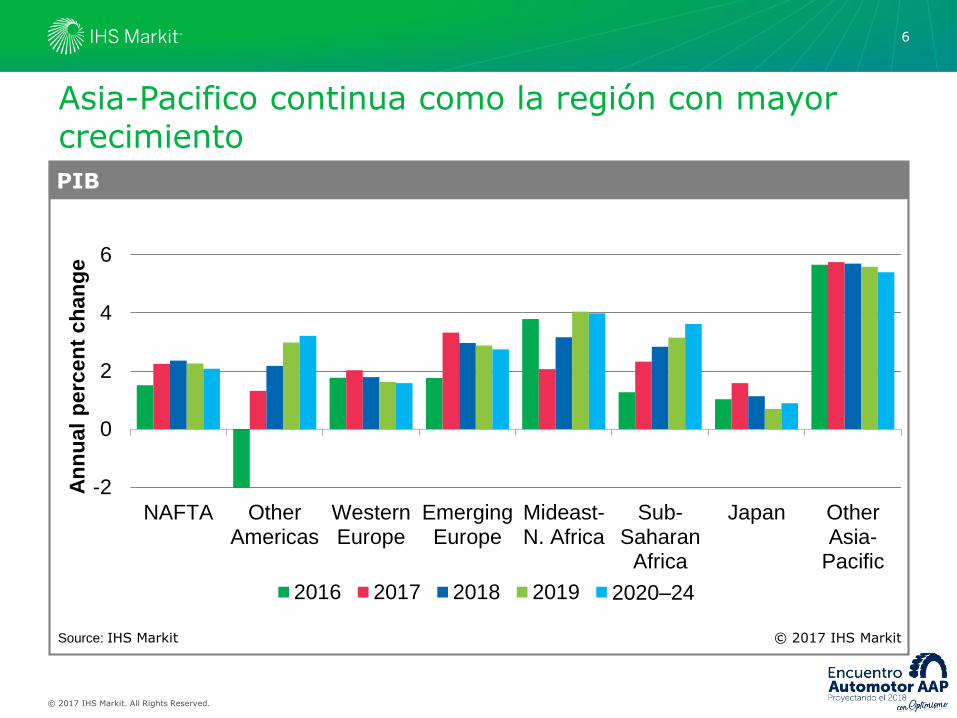
-2
0
2
4
6
NAFTA OtherAmericas
WesternEurope
EmergingEurope
Mideast-N. Africa
Sub-Saharan
Africa
Japan OtherAsia-
Pacific
An
nu
al
perc
en
t ch
an
ge
2016 2017 2018 2019 2020–24
Asia-Pacifico continua como la región con mayor crecimiento
PIB
Source: IHS Markit © 2017 IHS Markit
6
© 2017 IHS Markit. All Rights Reserved.
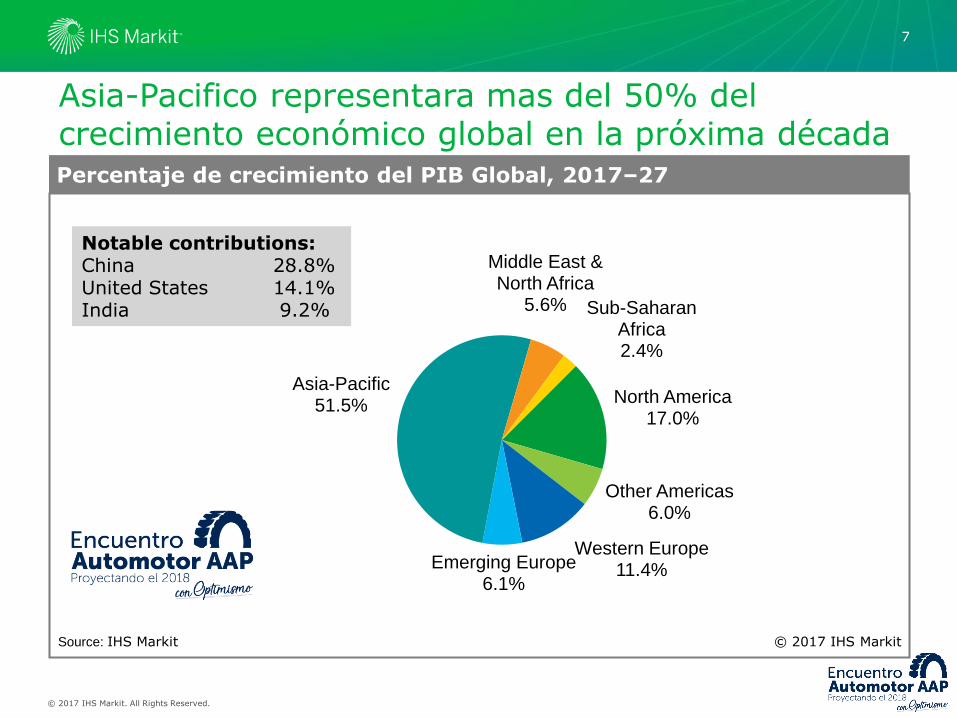
North America17.0%
Other Americas6.0%
Western Europe11.4%Emerging Europe
6.1%
Asia-Pacific51.5%
Middle East & North Africa
5.6% Sub-Saharan Africa2.4%
Asia-Pacifico representara mas del 50% del crecimiento económico global en la próxima décadaPercentaje de crecimiento del PIB Global, 2017–27
Source: IHS Markit © 2017 IHS Markit
Notable contributions:China 28.8%United States 14.1%India 9.2%
7

© 2017 IHS Markit. All Rights Reserved.
30
35
40
45
50
55
60
2007 2008 2009 2010 2011 2012 2013 2014 2015 2016 2017
Ind
ex, o
ver
50 s
ign
als
exp
an
sio
n
United States Eurozone China Japan
IHS Markit Índices de Manufactura Global refleja una onda expansivaPurchasing managers’ indexes
Source: IHS Markit © 2017 IHS Markit
8

© 2017 IHS Markit. All Rights Reserved.
IHS Markit Índice de Precios de Materias Primas llevan dos años de crecimiento
1
2
3
4
5
6
2007 2008 2009 2010 2011 2012 2013 2014 2015 2016 2017
All industrial materials Chemicals Nonferrous metals
IH
S M
arkit
weekly
in
dexes, 2
00
2:1
=1
IHS Markit Materials Price Index
Source: IHS Markit © 2017 IHS Markit
9
© 2017 IHS Markit. All Rights Reserved.
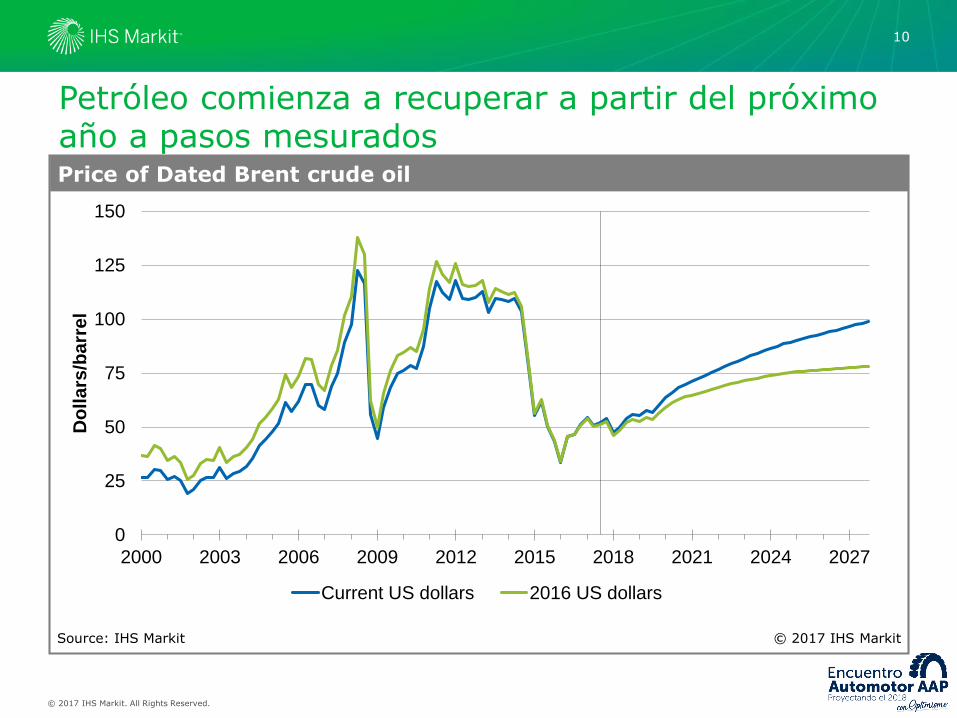
Petróleo comienza a recuperar a partir del próximo año a pasos mesurados
0
25
50
75
100
125
150
2000 2003 2006 2009 2012 2015 2018 2021 2024 2027
Do
lla
rs/b
arr
el
Current US dollars 2016 US dollars
Price of Dated Brent crude oil
Source: IHS Markit © 2017 IHS Markit
10

© 2017 IHS Markit. All Rights Reserved.
Bolsas de Valores con tendencia a la alza
Equity prices, percent change
-20 -10 0 10 20 30
China (SSEA)
Eurozone (FTSE Euro 100)
Japan (Nikkei 225)
World, developed* (MSCI)
Emerging markets* (MSCI)
United States (S&P 500)
United Kingdom (FTSE 100)
Canada (S&P TSX)
2017 year to date (to 11 October) 2016 2015
* In US dollarsSource: The Economist © 2017 IHS Markit
11
© 2017 IHS Markit. All Rights Reserved.
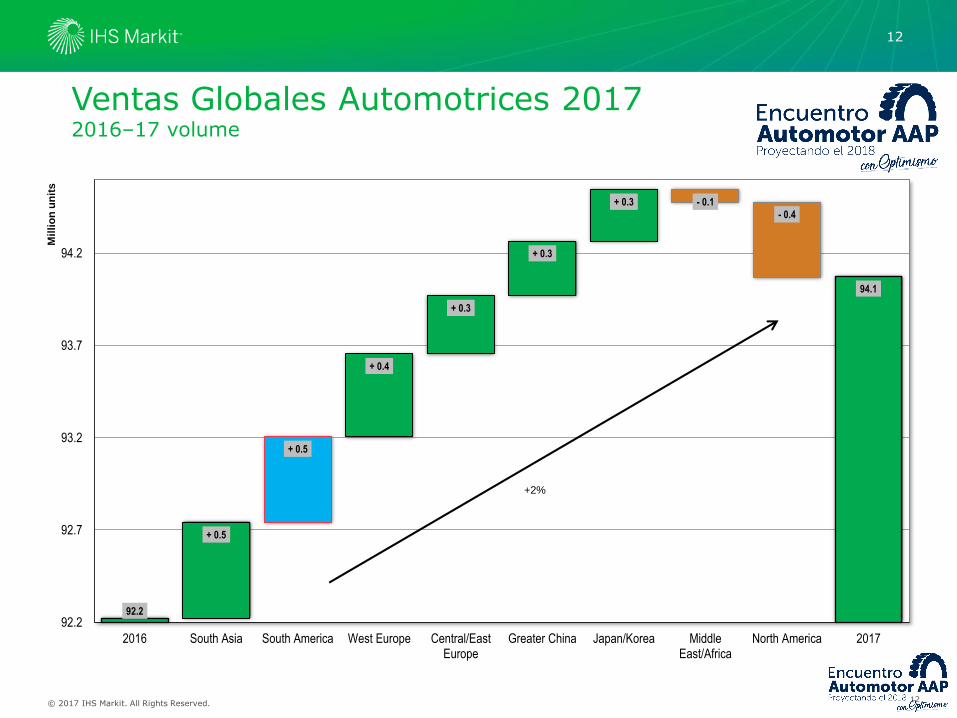
Ventas Globales Automotrices 20172016–17 volume
12
92.2
94.1
+ 0.5
+ 0.5
+ 0.4
+ 0.3
+ 0.3
+ 0.3 - 0.1
- 0.4
92.2
92.7
93.2
93.7
94.2
2016 South Asia South America West Europe Central/EastEurope
Greater China Japan/Korea MiddleEast/Africa
North America 2017
Mil
lio
n u
nit
s
+2%
12

© 2017 IHS Markit. All Rights Reserved.
64
93
108
50
60
70
80
90
100
110
120
2007 2008 2009 2010 2011 2012 2013 2014 2015 2016 2017 2018 2019 2020 2021 2022 2023 2024
Global Light Vehicle Sales (Millions)
Source: IHS Markit © 2017 IHS
29million
15million
94
-0.4-0.20.0
0.00.10.40.40.91.2
2.69.3
-2.00.02.04.06.08.010.0
MPV
Wagon
Convertible
Roadster
Coupe
Van
Chassis-Cab
Pickup
Sedan
Hatchback
SUV
Ventas globales se aproximan a 100 millones
13
© 2017 IHS Markit. All Rights Reserved.
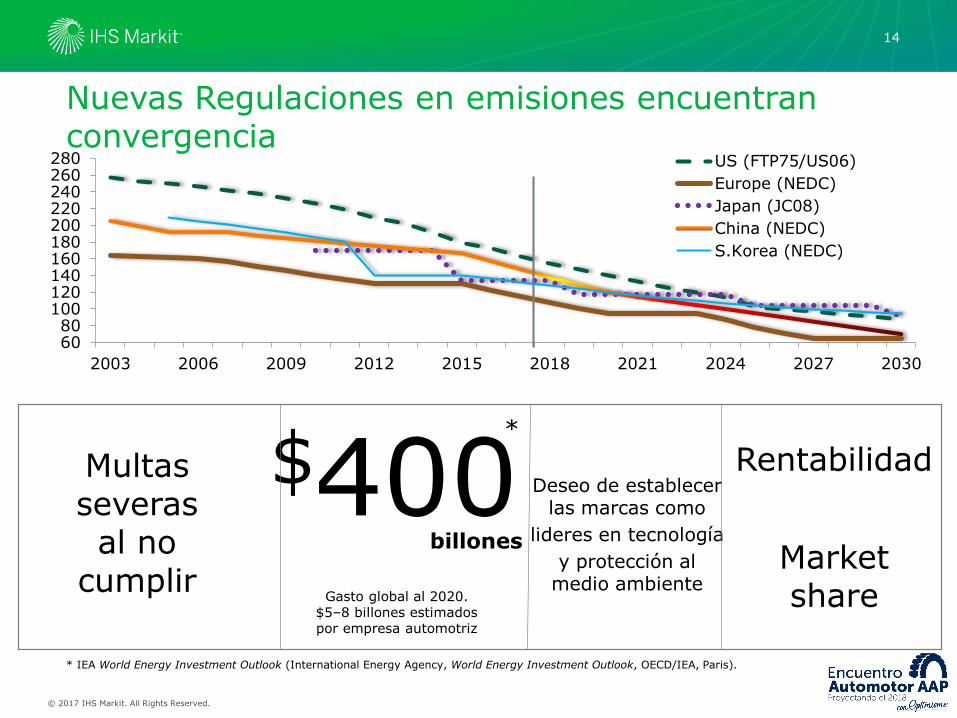
$400Gasto global al 2020.
$5–8 billones estimados por empresa automotriz
Multas severasal no
cumplir
billones
Deseo de establecerlas marcas como
lideres en tecnología
y protección al medio ambiente
Rentabilidad
Market share
*
* IEA World Energy Investment Outlook (International Energy Agency, World Energy Investment Outlook, OECD/IEA, Paris).
6080
100120140160180200220240260280
2003 2006 2009 2012 2015 2018 2021 2024 2027 2030
US (FTP75/US06)
Europe (NEDC)
Japan (JC08)
China (NEDC)
S.Korea (NEDC)
Nuevas Regulaciones en emisiones encuentran convergencia
14

© 2017 IHS Markit. All Rights Reserved.
15
Que es un ZEV?
Hydrogen fuel cell electric
vehicles (FCEVs)
Battery electric vehicles (BEVs)
Plug-in hybrid
vehicles (PHEVs)
Note: ZEV = zero emissions vehicle.
© 2017 IHS Markit. All Rights Reserved.
Disruptivo
–Toyota
–Honda
–Nissan
–Ford
–BMW
–Volkswagen
–Mazda
–Hyundai
– Lexus
–Audi
16
© 2016 IHS16

© 2017 IHS Markit. All Rights Reserved.
Photo By: Devin Lindsay
Productos
Evolucion de las Baterias
Infraestructura
Incentivos Gubernamentales
Precio del petroleo
Consumidor
Puntos Criticos
Photos by: Devin Lindsay
Source: Shutterstock
Source: Shutterstock
Source: ShutterstockSource: Shutterstock
17

© 2017 IHS Markit. All Rights Reserved.18
Ventas de Vehículos Ligeros en América LatinaMargen de error 2016 y perspectivas de crecimiento
18
Pais CY 2015 CY 2016 P'16 CY 2017 P'17 CY 2018 P'18
CY 2017
Dic16 MOE '17
Argentina 632,063 676,375 7.0% 859,548 27.1% 850,923 -1.0% 710,291 21.0%
Brazil 2,480,502 1,988,099 -19.9% 2,181,580 9.7% 2,455,054 12.5% 1,969,610 10.8%
Chile 283,497 304,626 7.5% 350,912 15.2% 365,930 4.3% 314,877 11.4%
Colombia 267,821 243,469 -9.1% 239,366 -1.7% 250,011 4.4% 247,472 -3.3%
Ecuador 72,117 68,969 -4.4% 100,969 46.4% 96,955 -4.0% 54,497 85.3%
Mexico 1,351,812 1,601,208 18.4% 1,550,959 -3.1% 1,575,090 1.6% 1,695,393 -8.5%
Peru 147,560 154,335 4.6% 171,350 11.0% 183,824 7.3% 162,531 5.4%
© 2017 IHS Markit. All Rights Reserved.
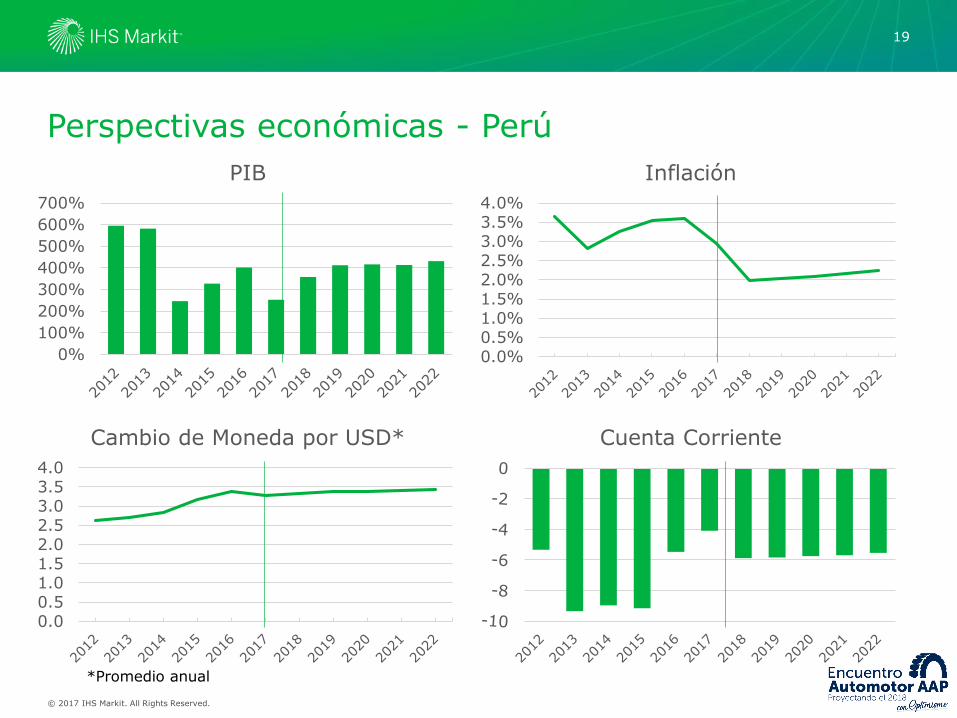
Perspectivas económicas - Perú
19
0%
100%
200%
300%
400%
500%
600%
700%
PIB
0.0%0.5%1.0%1.5%2.0%2.5%3.0%3.5%4.0%
Inflación
0.00.51.01.52.02.53.03.54.0
Cambio de Moneda por USD* Cuenta Corriente
*Promedio anual

© 2017 IHS Markit. All Rights Reserved.
Venta de Vehículos Ligeros (SAAR) - Perú
20
0
50
100
150
200
250
2008 2009 2010 2011 2012 2013 2014 2015 2016 2017
Miles
© 2017 IHS Markit. All Rights Reserved.
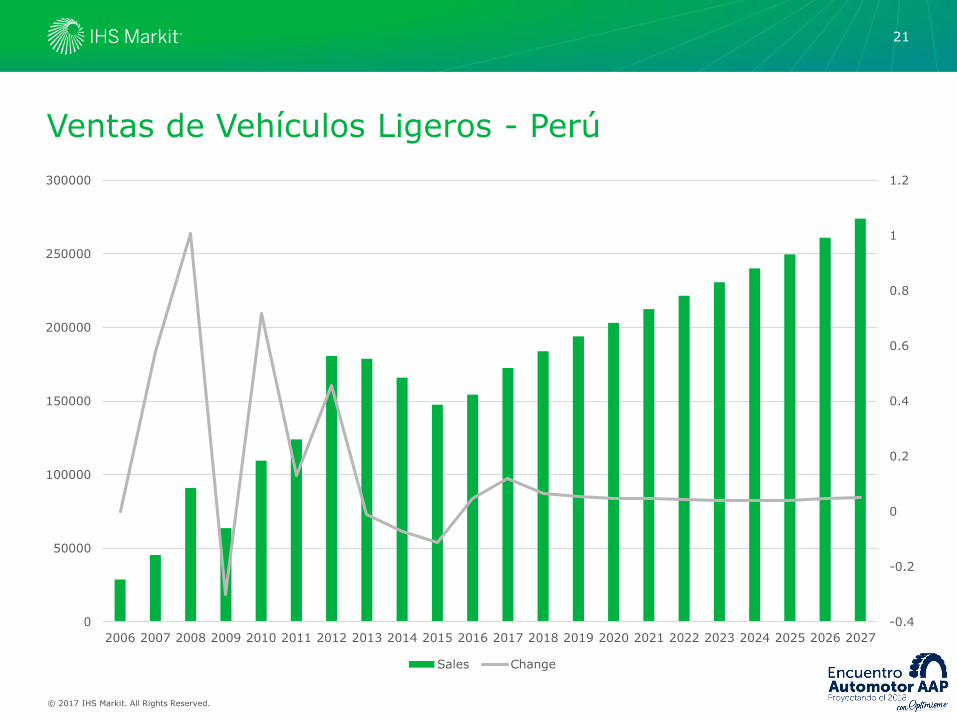
Ventas de Vehículos Ligeros - Perú
21
-0.4
-0.2
0
0.2
0.4
0.6
0.8
1
1.2
0
50000
100000
150000
200000
250000
300000
2006 2007 2008 2009 2010 2011 2012 2013 2014 2015 2016 2017 2018 2019 2020 2021 2022 2023 2024 2025 2026 2027
Sales Change

© 2017 IHS Markit. All Rights Reserved.
Marcas Mas Vendidas 2017
22
Hyundai Toyota Kia Chevrolet Nissan Suzuki MazdaVolkswage
nRenault Mitsubishi Others
2011 15.1% 28.0% 8.6% 7.5% 9.1% 5.6% 1.3% 5.0% 1.8% 1.8% 16.3%
2016 16.7% 18.8% 13.4% 4.8% 7.6% 6.0% 2.7% 2.4% 2.7% 2.4% 22.5%
2017 15.8% 15.3% 10.7% 7.2% 5.8% 5.7% 3.2% 3.0% 2.6% 2.3% 28.4%
2018 15.4% 15.9% 11.2% 6.3% 5.9% 5.3% 2.8% 2.6% 2.7% 1.8% 30.1%
0%
5%
10%
15%
20%
25%
30%
35%

© 2017 IHS Markit. All Rights Reserved.
Bodytype –SUVs sobrepasaron a sedanes
23
0%
10%
20%
30%
40%
50%
60%
70%
80%
90%
100%
2009 2010 2011 2012 2013 2014 2015 2016 2017 2018 2019 2020 2021 2022 2023
SUV Sedan Hatchback Van Pickup MPV Chassis-Cab Coupe Wagon Roadster Convertible

© 2017 IHS Markit. All Rights Reserved.
Peru LigerosHyundai
24
Source: IHS Automotive
Chassis-Cab
Convertible
Coupe
Hatchback
MPV
PickupRoadster
Sedan
SUV
Van
Wagon
Industry 2017
Industry 2025
Hyundai 2017
Hyundai 2025
0.0
0.5
1.0
1.5
2.0
2.5
3.0
3.5
4.0
4.5
5.0
Portfolio Age
0%
10%
20%
30%
40%
50%
60%
70%
80%
90%
100%
Grand i10 Accent Elantra i20 Tucson Others
-30%
-20%
-10%
0%
10%
20%
30%
40%
50%
60%
70%
0
5000
10000
15000
20000
25000
30000
35000
40000
Hyundai Brand YOY Industry YOY

© 2017 IHS Markit. All Rights Reserved.
Peru LigerosToyota
25
Source: IHS Automotive
0.0
1.0
2.0
3.0
4.0
5.0
6.0
7.0
Portfolio Age
Chassis-Cab
Convertible
Coupe
Hatchback
MPV
PickupRoadster
Sedan
SUV
Van
Wagon
Industry 2017
Industry 2025
Toyota 2017
Toyota 2025
0%
10%
20%
30%
40%
50%
60%
70%
80%
90%
100%
Yaris Hilux RAV4 Avanza Corolla Others
-30%
-20%
-10%
0%
10%
20%
30%
40%
50%
0
5000
10000
15000
20000
25000
30000
35000
40000
45000
Toyota Brand YOY Industry YOY
© 2017 IHS Markit. All Rights Reserved.
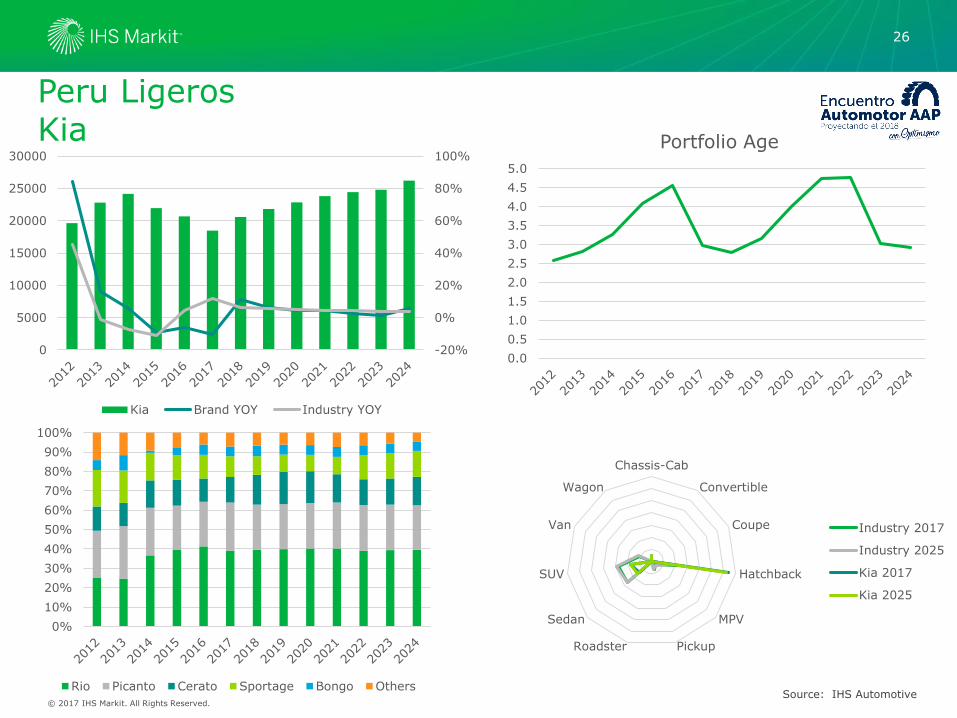
Peru LigerosKia
26
Source: IHS Automotive
0.0
0.5
1.0
1.5
2.0
2.5
3.0
3.5
4.0
4.5
5.0
Portfolio Age
Chassis-Cab
Convertible
Coupe
Hatchback
MPV
PickupRoadster
Sedan
SUV
Van
Wagon
Industry 2017
Industry 2025
Kia 2017
Kia 2025
0%
10%
20%
30%
40%
50%
60%
70%
80%
90%
100%
Rio Picanto Cerato Sportage Bongo Others
-20%
0%
20%
40%
60%
80%
100%
0
5000
10000
15000
20000
25000
30000
Kia Brand YOY Industry YOY
© 2017 IHS Markit. All Rights Reserved.
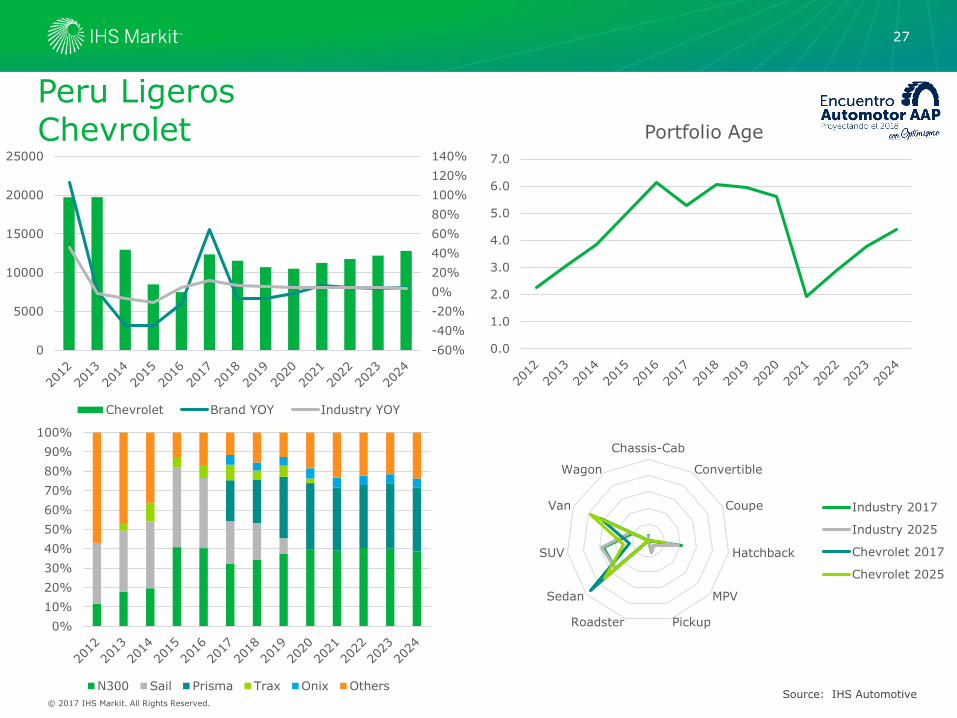
Peru LigerosChevrolet
27
Source: IHS Automotive
0.0
1.0
2.0
3.0
4.0
5.0
6.0
7.0
Portfolio Age
Chassis-Cab
Convertible
Coupe
Hatchback
MPV
PickupRoadster
Sedan
SUV
Van
Wagon
Industry 2017
Industry 2025
Chevrolet 2017
Chevrolet 2025
0%
10%
20%
30%
40%
50%
60%
70%
80%
90%
100%
N300 Sail Prisma Trax Onix Others
-60%
-40%
-20%
0%
20%
40%
60%
80%
100%
120%
140%
0
5000
10000
15000
20000
25000
Chevrolet Brand YOY Industry YOY
© 2017 IHS Markit. All Rights Reserved.
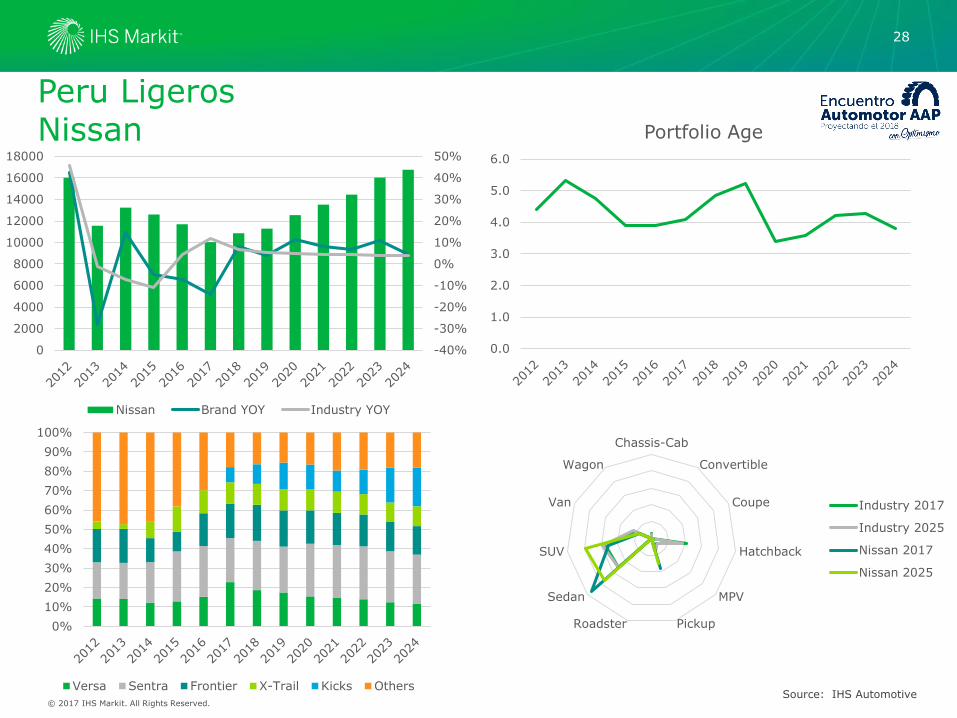
Peru LigerosNissan
28
Source: IHS Automotive
0.0
1.0
2.0
3.0
4.0
5.0
6.0
Portfolio Age
Chassis-Cab
Convertible
Coupe
Hatchback
MPV
PickupRoadster
Sedan
SUV
Van
Wagon
Industry 2017
Industry 2025
Nissan 2017
Nissan 2025
0%
10%
20%
30%
40%
50%
60%
70%
80%
90%
100%
Versa Sentra Frontier X-Trail Kicks Others
-40%
-30%
-20%
-10%
0%
10%
20%
30%
40%
50%
0
2000
4000
6000
8000
10000
12000
14000
16000
18000
Nissan Brand YOY Industry YOY
© 2017 IHS Markit. All Rights Reserved.
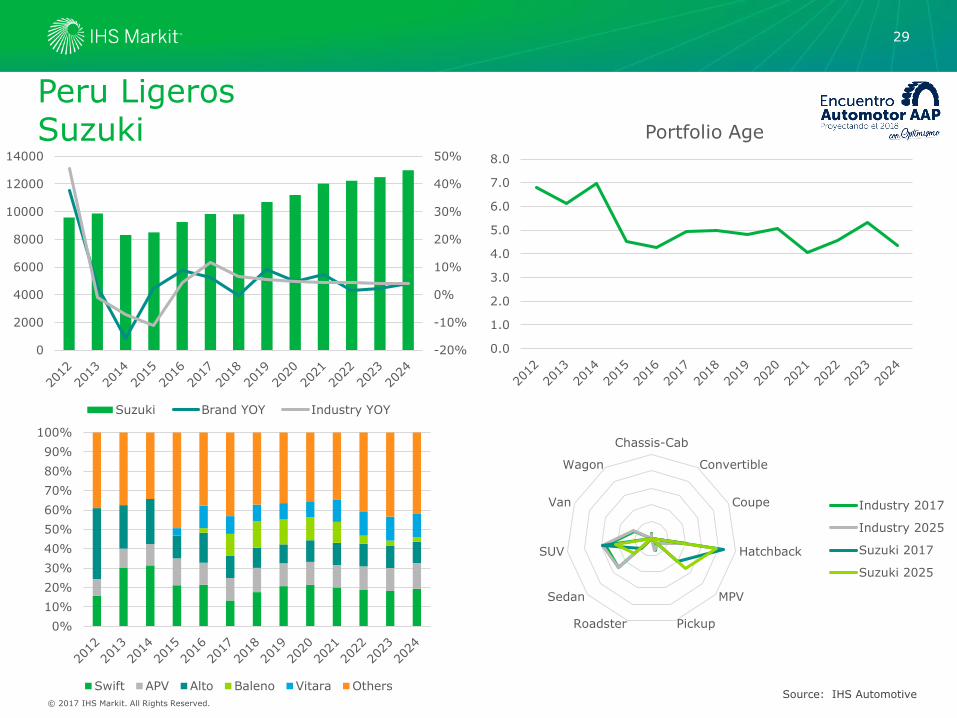
Peru LigerosSuzuki
29
Source: IHS Automotive
0.0
1.0
2.0
3.0
4.0
5.0
6.0
7.0
8.0
Portfolio Age
Chassis-Cab
Convertible
Coupe
Hatchback
MPV
PickupRoadster
Sedan
SUV
Van
Wagon
Industry 2017
Industry 2025
Suzuki 2017
Suzuki 2025
0%
10%
20%
30%
40%
50%
60%
70%
80%
90%
100%
Swift APV Alto Baleno Vitara Others
-20%
-10%
0%
10%
20%
30%
40%
50%
0
2000
4000
6000
8000
10000
12000
14000
Suzuki Brand YOY Industry YOY
© 2017 IHS Markit. All Rights Reserved.
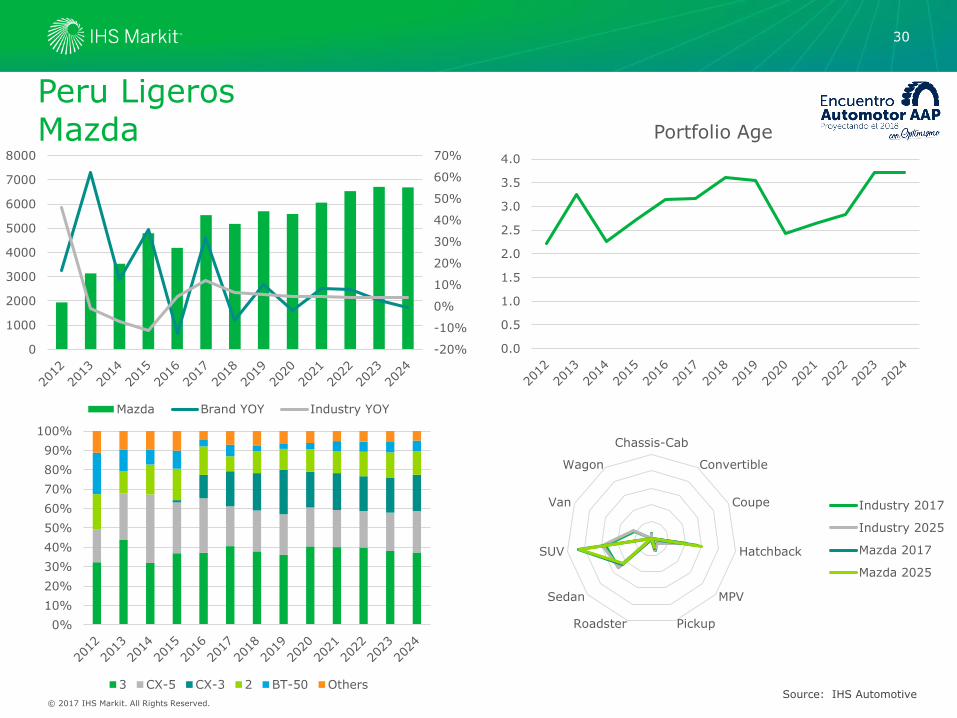
Peru LigerosMazda
30
Source: IHS Automotive
0.0
0.5
1.0
1.5
2.0
2.5
3.0
3.5
4.0
Portfolio Age
Chassis-Cab
Convertible
Coupe
Hatchback
MPV
PickupRoadster
Sedan
SUV
Van
Wagon
Industry 2017
Industry 2025
Mazda 2017
Mazda 2025
0%
10%
20%
30%
40%
50%
60%
70%
80%
90%
100%
3 CX-5 CX-3 2 BT-50 Others
-20%
-10%
0%
10%
20%
30%
40%
50%
60%
70%
0
1000
2000
3000
4000
5000
6000
7000
8000
Mazda Brand YOY Industry YOY

© 2017 IHS Markit. All Rights Reserved.
Peru LigerosVolkswagen
31
Source: IHS Automotive
0.0
1.0
2.0
3.0
4.0
5.0
6.0
7.0
Portfolio Age
Chassis-Cab
Convertible
Coupe
Hatchback
MPV
PickupRoadster
Sedan
SUV
Van
Wagon
Industry 2017
Industry 2025
Volkswagen 2017
Volkswagen 2025
0%
10%
20%
30%
40%
50%
60%
70%
80%
90%
100%
Gol Fox Amarok Jetta Polo Others
-50%
-40%
-30%
-20%
-10%
0%
10%
20%
30%
40%
50%
0
1000
2000
3000
4000
5000
6000
7000
8000
Volkswagen Brand YOY Industry YOY

© 2017 IHS Markit. All Rights Reserved.
Peru LigerosRenault
32
Source: IHS Automotive
0.0
0.5
1.0
1.5
2.0
2.5
3.0
3.5
4.0
4.5
5.0
Portfolio Age
Chassis-Cab
Convertible
Coupe
Hatchback
MPV
PickupRoadster
Sedan
SUV
Van
Wagon
Industry 2017
Industry 2025
Renault 2017
Renault 2025
0%
10%
20%
30%
40%
50%
60%
70%
80%
90%
100%
Duster Logan Duster Oroch Master Sandero Others
-20%
-10%
0%
10%
20%
30%
40%
50%
0
1000
2000
3000
4000
5000
6000
7000
Renault Brand YOY Industry YOY
IHS MarkitTM COPYRIGHT NOTICE AND DISCLAIMER © 2016 IHS Markit.
No portion of this presentation may be reproduced, reused, or otherwise distributed in any form without prior written consent of IHS Markit. Content reproduced or redistributed with IHS Markit permission must display IHS Markit legal notices and attributions of authorship. The information contained herein is from sources considered reliable, but its accuracy and completeness are not warranted, nor are the opinions and analyses that are based upon it, and to the extent permitted by law, IHS Markit shall not be liable for any errors or omissions or any loss, damage, or expense incurred by reliance on information or any statement contained herein. In particular, please note that no representation or warranty is given as to the achievement or reasonableness of, and no reliance should be placed on, any projections, forecasts, estimates, or assumptions, and, due to various risks and uncertainties, actual events and results may differ materially from forecasts and statements of belief noted herein. This presentation is not to be construed as legal or financial advice, and use of or reliance on any information in this publication is entirely at your own risk. IHS Markit and the IHS Markit logo are trademarks of IHS Markit.
IHS Markit Customer Care:
Americas: +1 800 IHS CARE (+1 800 447 2273)
Europe, Middle East, and Africa: +44 (0) 1344 328 300
Asia and the Pacific Rim: +604 291 3600
Thank you! Muchas Gracias! Muito Obrigado!
Guido Vildozo, Senior Manager, Americas