Potencial para o atendimento de emissões EURO VI e US 10 ... · Evolução dos níveis de...
26
© by FEV – all rights reserved. Confidential – no passing on to third parties Titel / Autor / Datum 1 Potencial para o atendimento de emissões EURO VI e US 10 com consumo e complexidade otimizado Horst Bergmann 27.10.2009 São Paulo -SP
-
Upload
nguyendieu -
Category
Documents
-
view
215 -
download
0
Transcript of Potencial para o atendimento de emissões EURO VI e US 10 ... · Evolução dos níveis de...
© by FEV – all rights reserved. Confidential – no passing on to third partiesTitel / Autor / Datum
1
Potencial para o atendimento de emissões EURO VI e US 10 com consumo e complexidade otimizado
Horst Bergmann
27.10.2009 São Paulo -SP
© by FEV – all rights reserved. Confidential – no passing on to third parties
Visão Geral da Apresentação
Evolução dos níveis de emissões de NOx e material particulado para veículos comerciais (caminhões e ônibus) bem como motores industriais na Europa e EUA;
Complexidade do sistema completo motor e pós-tratamento de gases de escape
Dimensionamento do motor, minimização das emissões brutas através de medidas internas ao motor
Requisitos do sistema de pós-tratamento de gases de escape
Dimensionamento de catalisadores (SCR e DPF)
Comportamento transiente, otimização do sistema completo
Resumo
© by FEV – all rights reserved. Confidential – no passing on to third parties
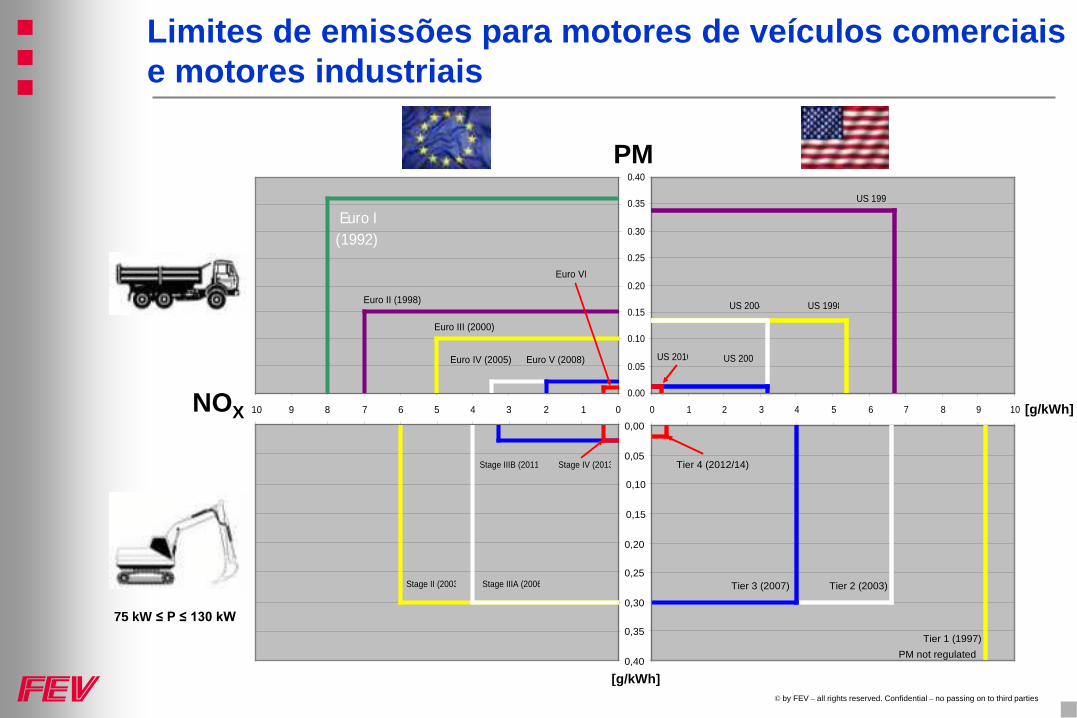
US 1998US 2004
US 2007US 2010
US 1991
0.00
0.05
0.10
0.15
0.20
0.25
0.30
0.35
0.40
0 1 2 3 4 5 6 7 8 9 10
Euro I (1992)
Euro II (1998)
Euro III (2000)
Euro IV (2005) Euro V (2008)
Euro VI
012345678910
PM
Tier 1 (1997)PM not regulated
Tier 2 (2003)Tier 3 (2007)
Tier 4 (2012/14)
0,00
0,05
0,10
0,15
0,20
0,25
0,30
0,35
0,40
Stage II (2003 Stage IIIA (2006
Stage IIIB (2011 Stage IV (2013
[g/kWh]
NOX [g/kWh]
75 kW ≤ P ≤ 130 kW
Limites de emissões para motores de veículos comerciais e motores industriais

© by FEV – all rights reserved. Confidential – no passing on to third parties
Desenvolvimento Padrão para a Redução das Emissões -Abordagem Geral
© by FEV – all rights reserved. Confidential – no passing on to third parties
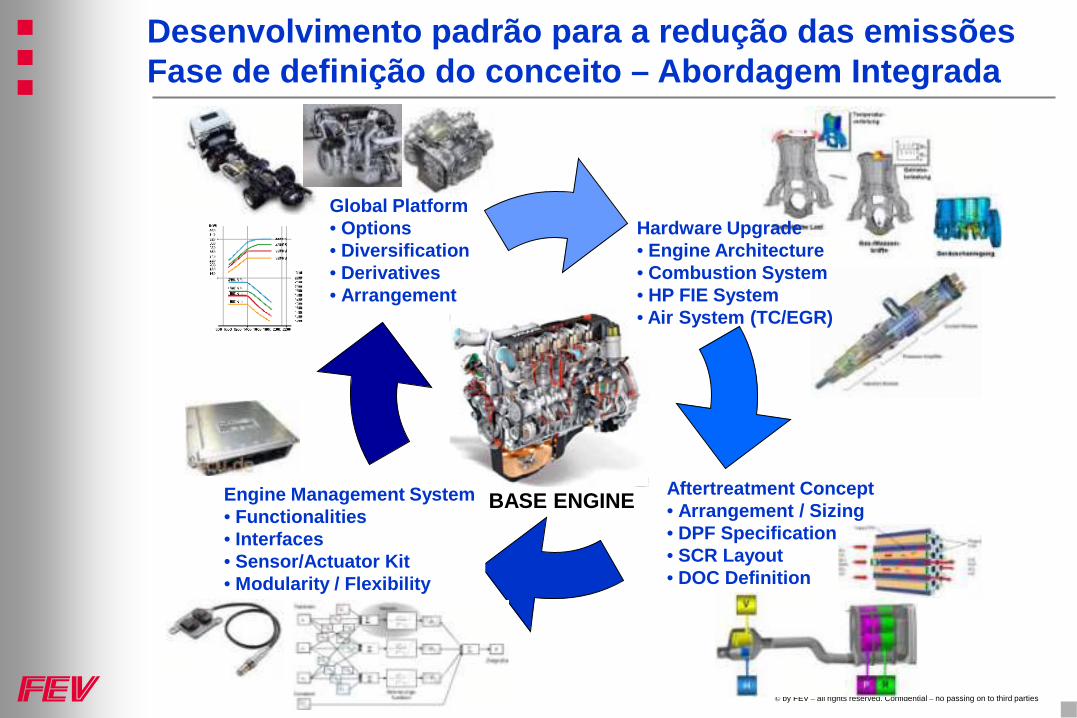
Aftertreatment Concept• Arrangement / Sizing • DPF Specification• SCR Layout• DOC Definition
BASE ENGINE
Global Platform• Options• Diversification• Derivatives• Arrangement
Engine Management System• Functionalities• Interfaces• Sensor/Actuator Kit• Modularity / Flexibility
Hardware Upgrade• Engine Architecture• Combustion System• HP FIE System• Air System (TC/EGR)
Desenvolvimento padrão para a redução das emissões Fase de definição do conceito – Abordagem Integrada
© by FEV – all rights reserved. Confidential – no passing on to third parties
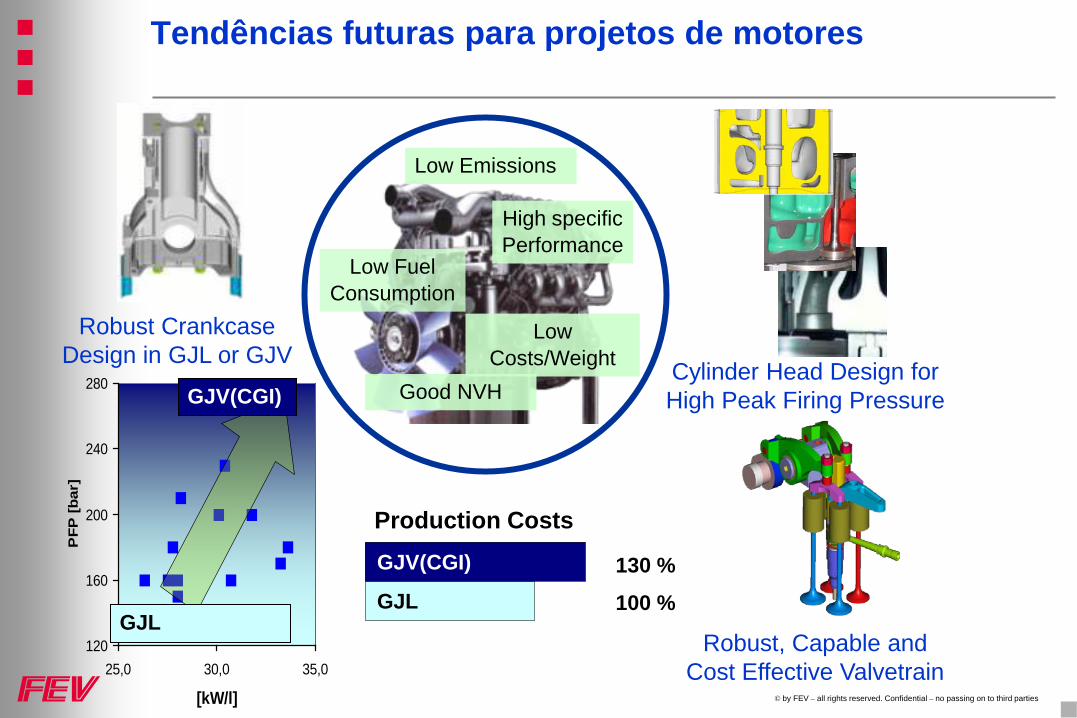
Tendências futuras para projetos de motores
Cylinder Head Design for High Peak Firing Pressure
Robust Crankcase Design in GJL or GJV
Robust, Capable and Cost Effective Valvetrain
Low Emissions
Low Costs/Weight
Low Fuel Consumption
Good NVH
High specific Performance
GJV(CGI)
GJL
Production Costs
130 %
100 %
120
160
200
240
280
25,0 30,0 35,0
[kW/l]
PFP
[bar
]
GJV(CGI)
GJL
© by FEV – all rights reserved. Confidential – no passing on to third parties
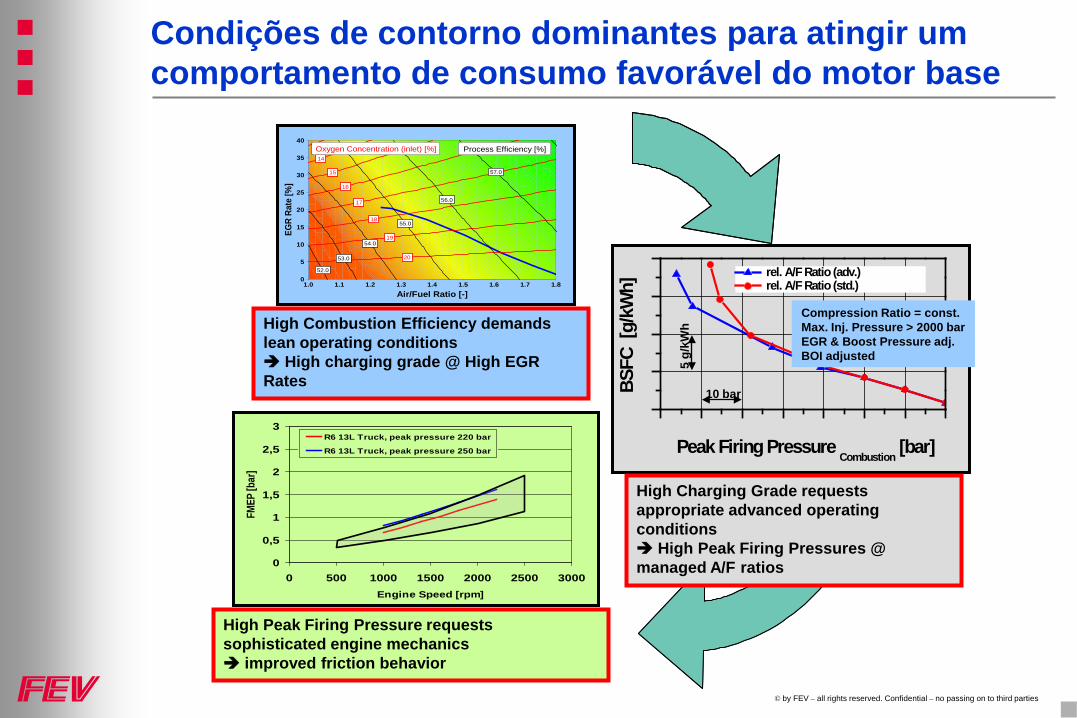
Condições de contorno dominantes para atingir umcomportamento de consumo favorável do motor base
EGR
Rate
[%]
0
5
10
15
20
25
30
35
40
Air/Fuel Ratio [-]1.0 1.1 1.2 1.3 1.4 1.5 1.6 1.7 1.8
20
19
18
17
16
15
14
53.0
54.0
55.0
56.0
57.0
52.0
Process Efficiency [%]Oxygen Concentration (inlet) [%]
Peak Firing Pressure Combustion
[bar]
rel. A/F Ratio (adv.) rel. A/F Ratio (std.)
BSFC
[g/
kWh]
5 g/
kWh
10 bar
Compression Ratio = const.Max. Inj. Pressure > 2000 barEGR & Boost Pressure adj.BOI adjusted
0
0,5
1
1,5
2
2,5
3
0 500 1000 1500 2000 2500 3000Engine Speed [rpm]
FMEP
[bar
]
R6 13L Truck, peak pressure 220 bar
R6 13L Truck, peak pressure 250 bar
High Combustion Efficiency demands lean operating conditions High charging grade @ High EGR Rates
High Peak Firing Pressure requests sophisticated engine mechanics improved friction behavior
High Charging Grade requests appropriate advanced operating conditions High Peak Firing Pressures @ managed A/F ratios
© by FEV – all rights reserved. Confidential – no passing on to third parties
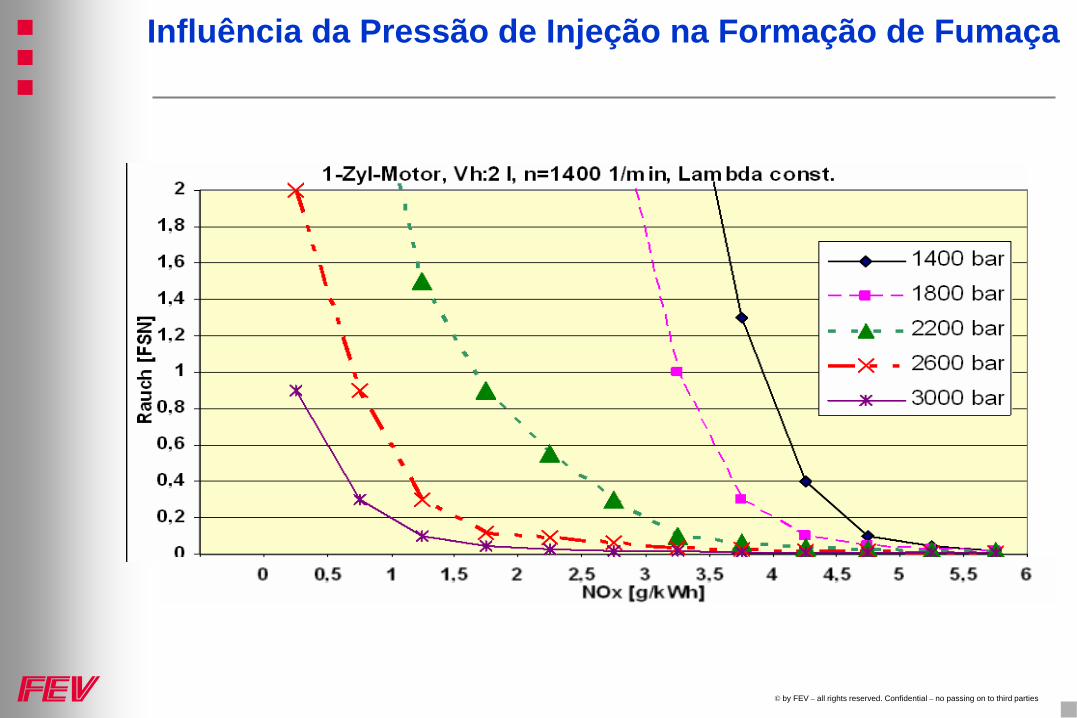
Influência da Pressão de Injeção na Formação de Fumaça
© by FEV – all rights reserved. Confidential – no passing on to third parties
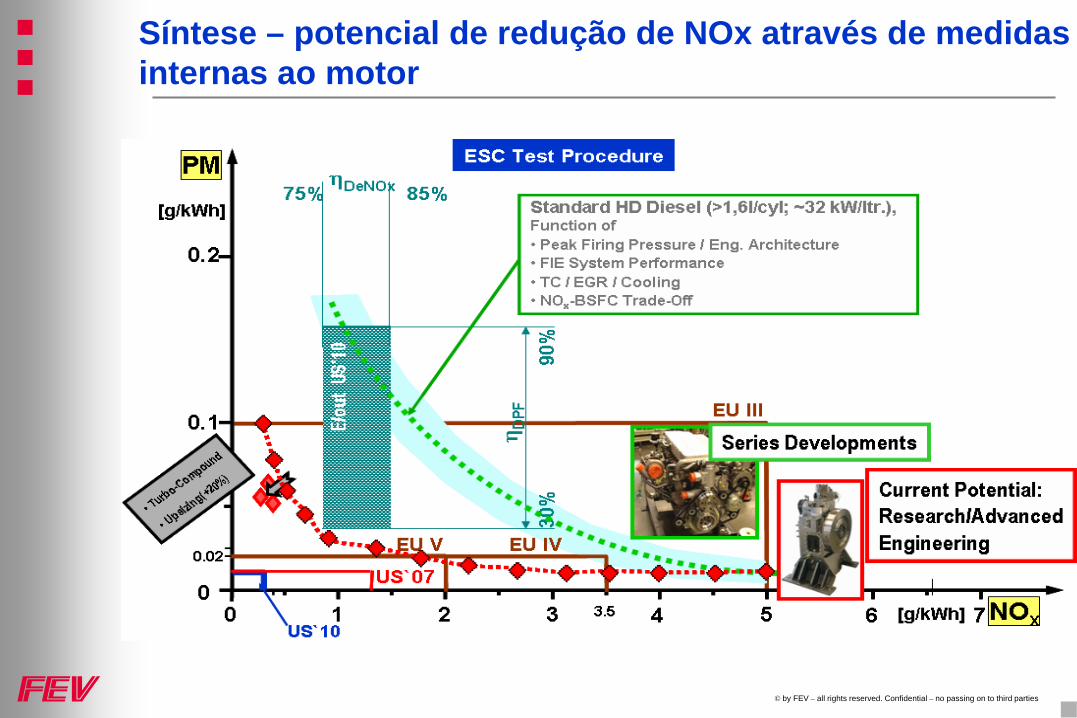
Síntese – potencial de redução de NOx através de medidasinternas ao motor
© by FEV – all rights reserved. Confidential – no passing on to third parties
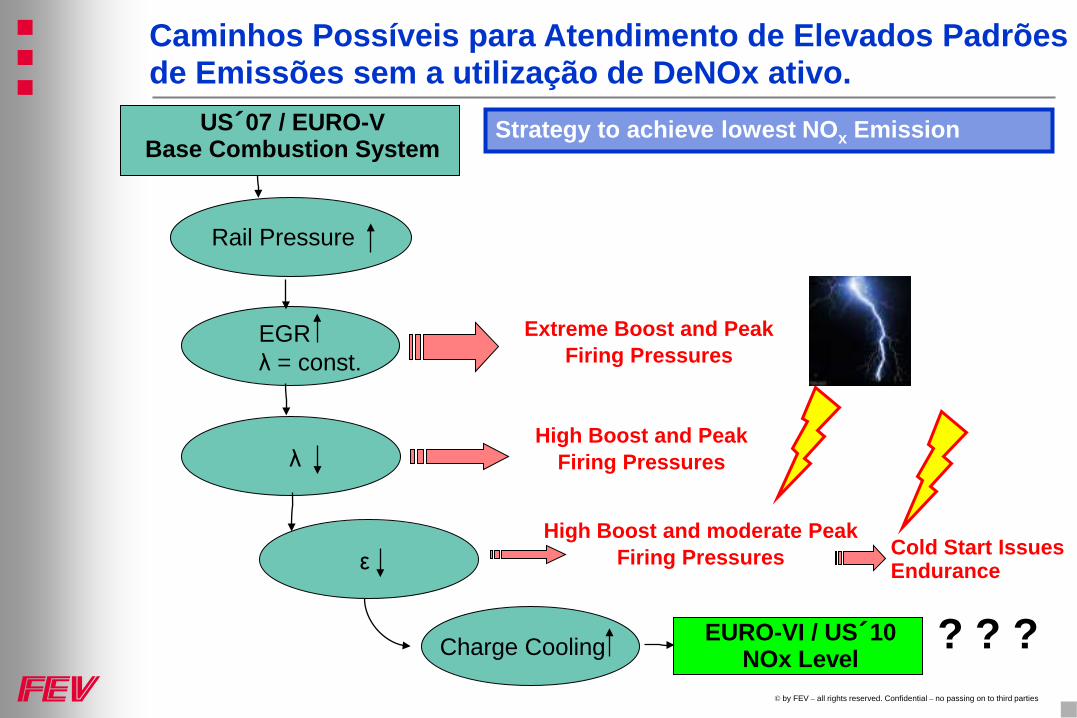
Strategy to achieve lowest NOx EmissionUS´07 / EURO-V Base Combustion System
EGR λ = const.
λ
Rail Pressure
ε
EURO-VI / US´10NOx LevelCharge Cooling
Extreme Boost and Peak Firing Pressures
High Boost and Peak Firing Pressures
High Boost and moderate Peak Firing Pressures Cold Start Issues
Endurance
? ? ?
Caminhos Possíveis para Atendimento de Elevados Padrõesde Emissões sem a utilização de DeNOx ativo.
© by FEV – all rights reserved. Confidential – no passing on to third parties
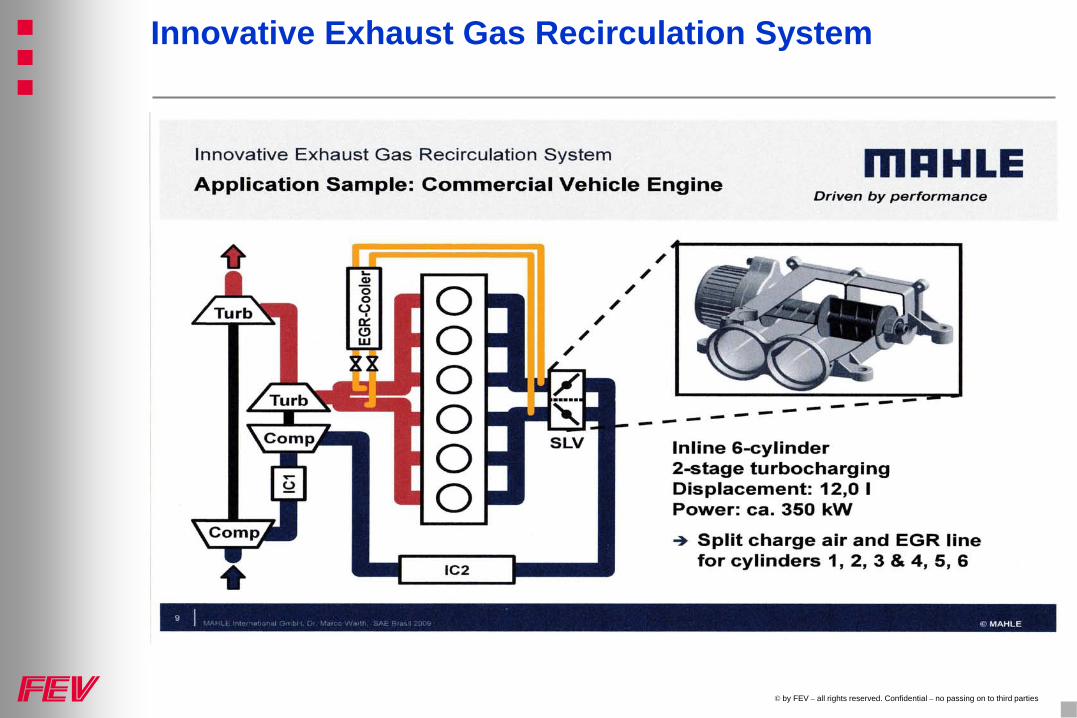
Innovative Exhaust Gas Recirculation System
© by FEV – all rights reserved. Confidential – no passing on to third parties
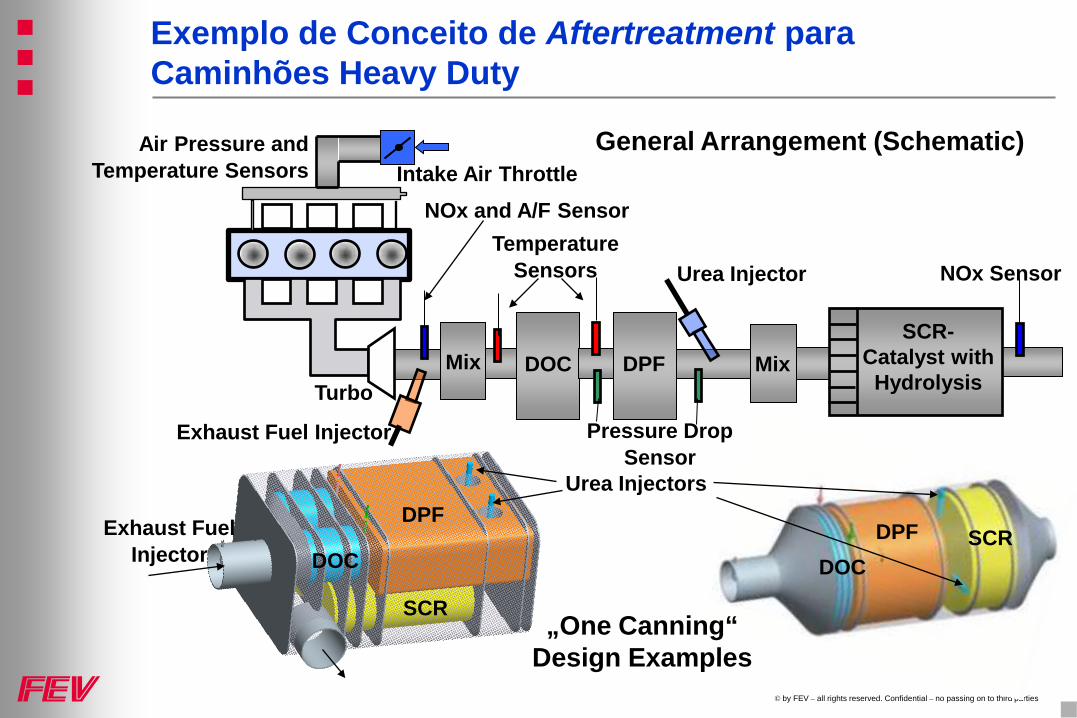
Exemplo de Conceito de Aftertreatment para Caminhões Heavy Duty
DPF MixDOC
Exhaust Fuel Injector
Urea Injector
SCR-Catalyst with Hydrolysis
Mix
Temperature Sensors NOx Sensor
Intake Air ThrottleNOx and A/F Sensor
Air Pressure and Temperature Sensors
Turbo
General Arrangement (Schematic)
DPF
DOC
SCR
Urea Injectors
Exhaust Fuel Injector
Pressure Drop Sensor
„One Canning“ Design Examples
DPFDOC
SCR
© by FEV – all rights reserved. Confidential – no passing on to third parties
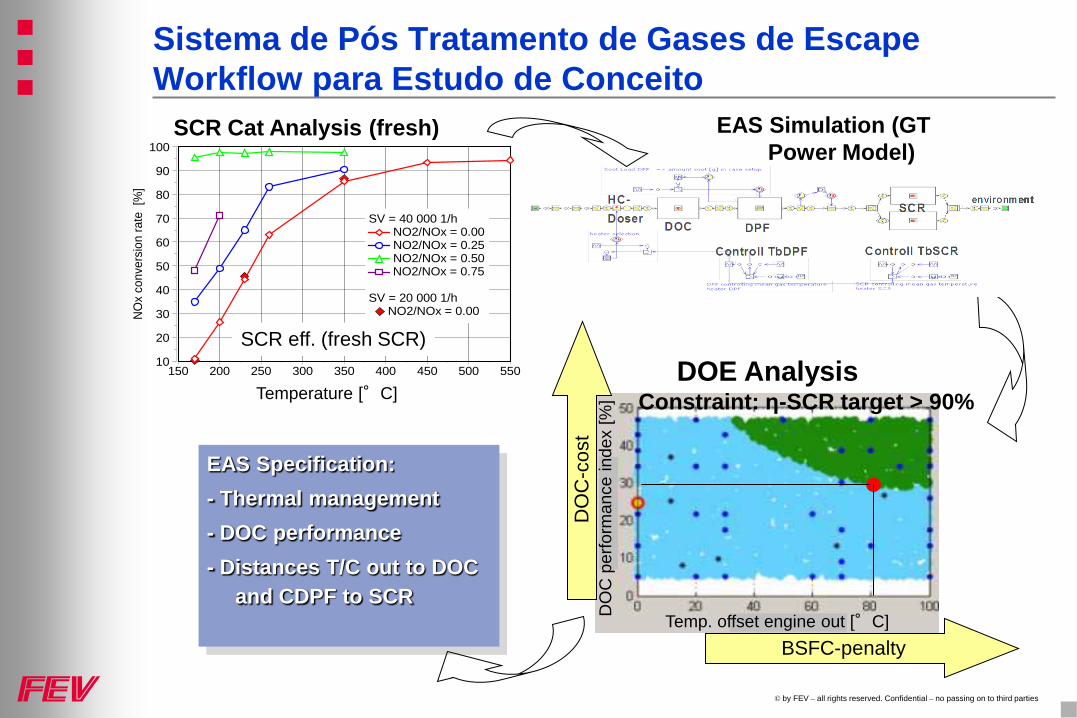
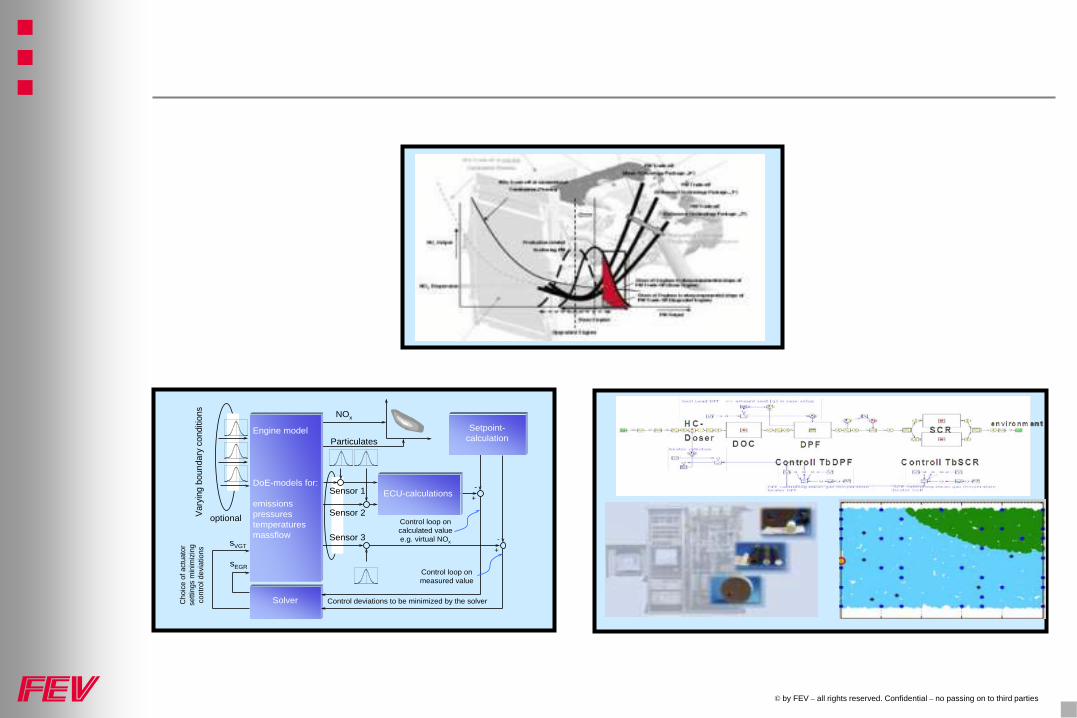
Sistema de Pós Tratamento de Gases de EscapeWorkflow para Estudo de Conceito
NO
x co
nver
sion
rate
[%
]
10
20
30
40
50
60
70
80
90
100
temperature [°C]150 200 250 300 350 400 450 500 550
SV = 40 000 1/h NO2/NOx = 0.00 NO2/NOx = 0.25 NO2/NOx = 0.50 NO2/NOx = 0.75
SV = 20 000 1/h NO2/NOx = 0.00
SCR Cat Analysis (fresh)
SCR eff. (fresh SCR)
DOE AnalysisConstraint: η-SCR target > 90%
DO
C-c
ost
BSFC-penaltyTemp. offset engine out [°C] D
OC
per
form
ance
inde
x [%
]
EAS Simulation (GT Power Model)
EAS Specification:- Thermal management- DOC performance- Distances T/C out to DOC
and CDPF to SCR
Temperature [°C]
© by FEV – all rights reserved. Confidential – no passing on to third parties
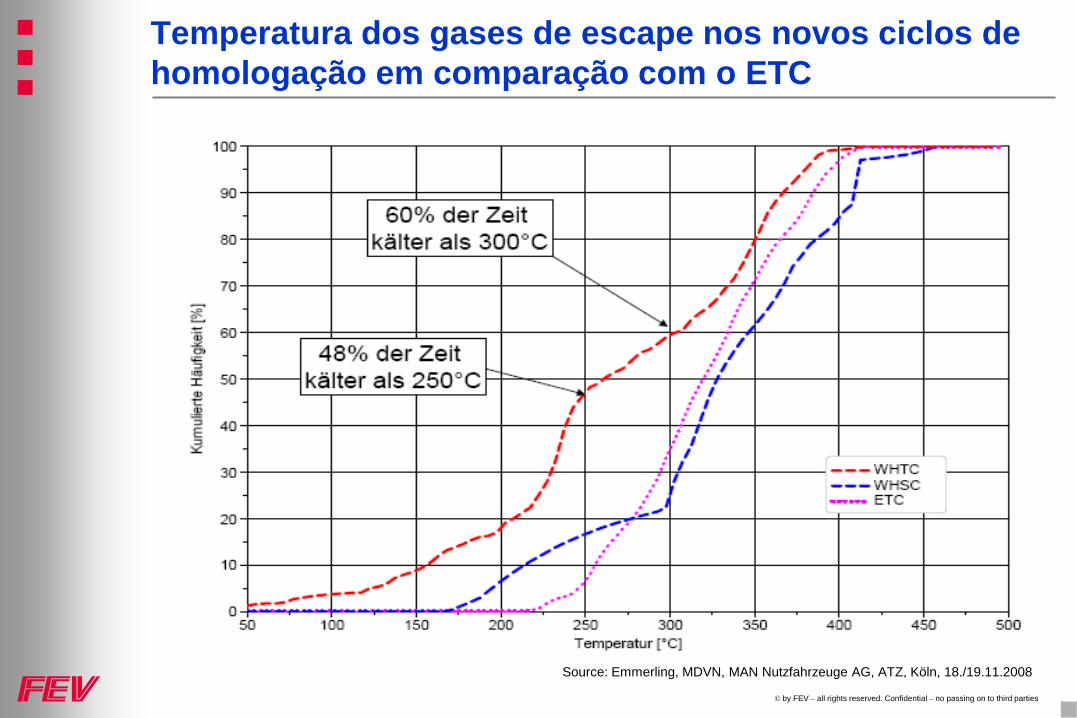
Temperatura dos gases de escape nos novos ciclos de homologação em comparação com o ETC
Source: Emmerling, MDVN, MAN Nutzfahrzeuge AG, ATZ, Köln, 18./19.11.2008
© by FEV – all rights reserved. Confidential – no passing on to third parties
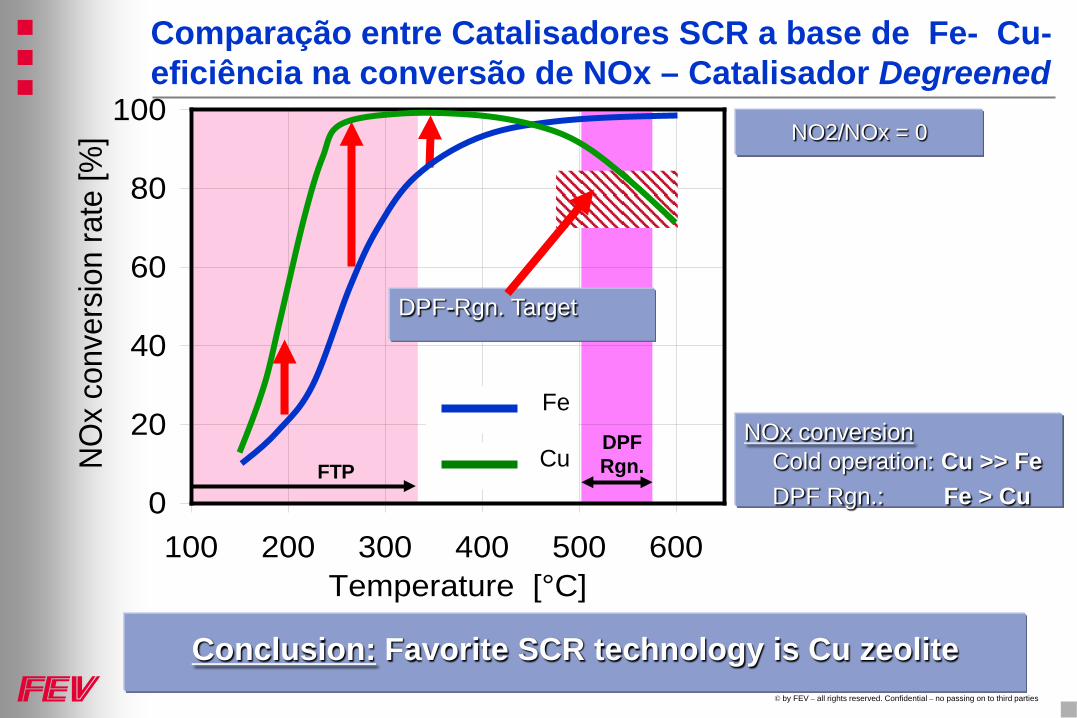
Comparação entre Catalisadores SCR a base de Fe- Cu-eficiência na conversão de NOx – Catalisador Degreened
NOx conversionCold operation: Cu >> FeDPF Rgn.: Fe > Cu0
20
40
60
80
100
100 200 300 400 500 600Temperature [°C]
NO
x co
nver
sion
rate
[%] NO2/NOx = 0
DPF-Rgn. Target
Fe
CuFTPDPF Rgn.
Conclusion: Favorite SCR technology is Cu zeolite
© by FEV – all rights reserved. Confidential – no passing on to third parties
Vary
ing
boun
dary
con
ditio
ns
+
ECU-calculations
Solver
-
-
sVGT
sEGR
NOx
Particulates
optional
Sensor 1
Sensor 2
Engine model
DoE-models for:
emissionspressurestemperaturesmassflow
Setpoint-calculation
+
Sensor 3
Control loop oncalculated valuee.g. virtual NOx
Control loop onmeasured value
Control deviations to be minimized by the solverCho
ice
of a
ctua
tor
setti
ngs
min
imiz
ing
cont
rol d
evia
tions
© by FEV – all rights reserved. Confidential – no passing on to third parties
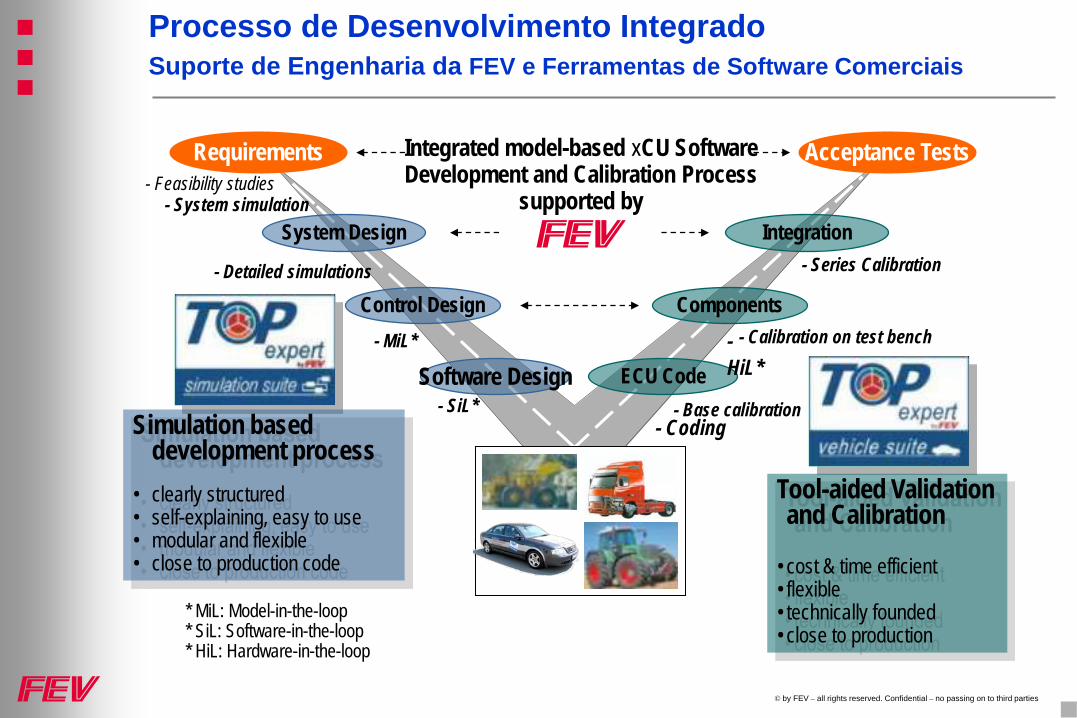
Processo de Desenvolvimento IntegradoSuporte de Engenharia da FEV e Ferramentas de Software Comerciais
- Feasibility studies- System simulation
Requirements
System Design
Control Design
Acceptance Tests
Integration
Components
- Series Calibration
Software Design ECU Code- SiL*
- Detailed simulations
-HiL*
- Calibration on test bench
- Coding
- MiL*
Tool-aided Validation and Calibration
• cost & time efficient• flexible• technically founded• close to production
* MiL: Model-in-the-loop* SiL: Software-in-the-loop* HiL: Hardware-in-the-loop
Integrated model-based xCU Software Development and Calibration Process
supported by
- Base calibrationSimulation based development process
• clearly structured• self-explaining, easy to use• modular and flexible• close to production code
© by FEV – all rights reserved. Confidential – no passing on to third parties
Resumo
As futuras legislações de emissões para veículos heavy duty, on- e off-highway na Europa e EUA têm restrições de nível comparável.
O esforço técnico tanto no que tange a modificações internas no motor como no âmbito do pós-tratamento dos gases de escapamento é enorme.
O desafio consiste em dominar a complexidade com pouca variabilidade de sistemas atendendo um amplo espectro de aplicação.
Com a necessária experiência e os mais modernos processos de desenvolvimento é possível atingir os níveis de emissões desejados e o ponto ótimo de consumo.
© by FEV – all rights reserved. Confidential – no passing on to third partiesTitel / Autor / Datum
19
Muito obrigado pela atençãoHorst Bergmann
27.10. 2009 São Paulo - SP
© by FEV – all rights reserved. Confidential – no passing on to third parties
215220225230235
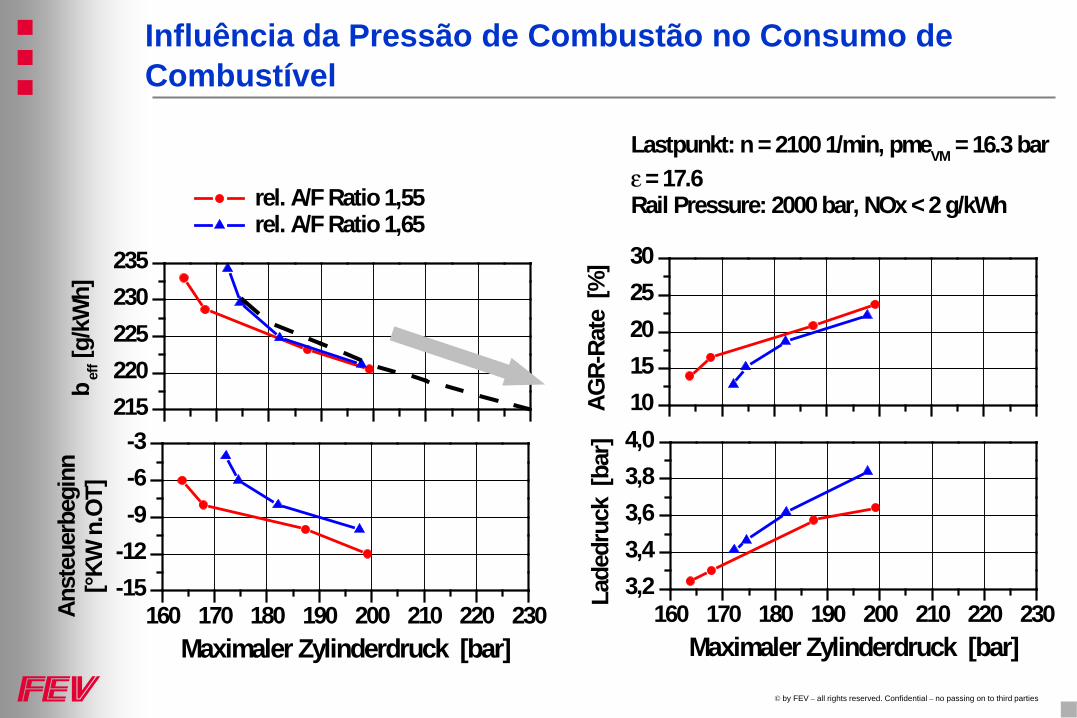
rel. A/F Ratio 1,55 rel. A/F Ratio 1,65
b eff [
g/kW
h]
1015202530
AG
R-Ra
te [
%]
160 170 180 190 200 210 220 230-15-12-9-6-3
Anst
euer
begi
nn[°K
W n
.OT]
Maximaler Zylinderdruck [bar]
160 170 180 190 200 210 220 2303,23,43,63,84,0
Lastpunkt: n = 2100 1/min, pmeVM = 16.3 barε = 17.6Rail Pressure: 2000 bar, NOx < 2 g/kWh
Lade
druc
k [b
ar]
Maximaler Zylinderdruck [bar]
Influência da Pressão de Combustão no Consumo de Combustível
© by FEV – all rights reserved. Confidential – no passing on to third parties
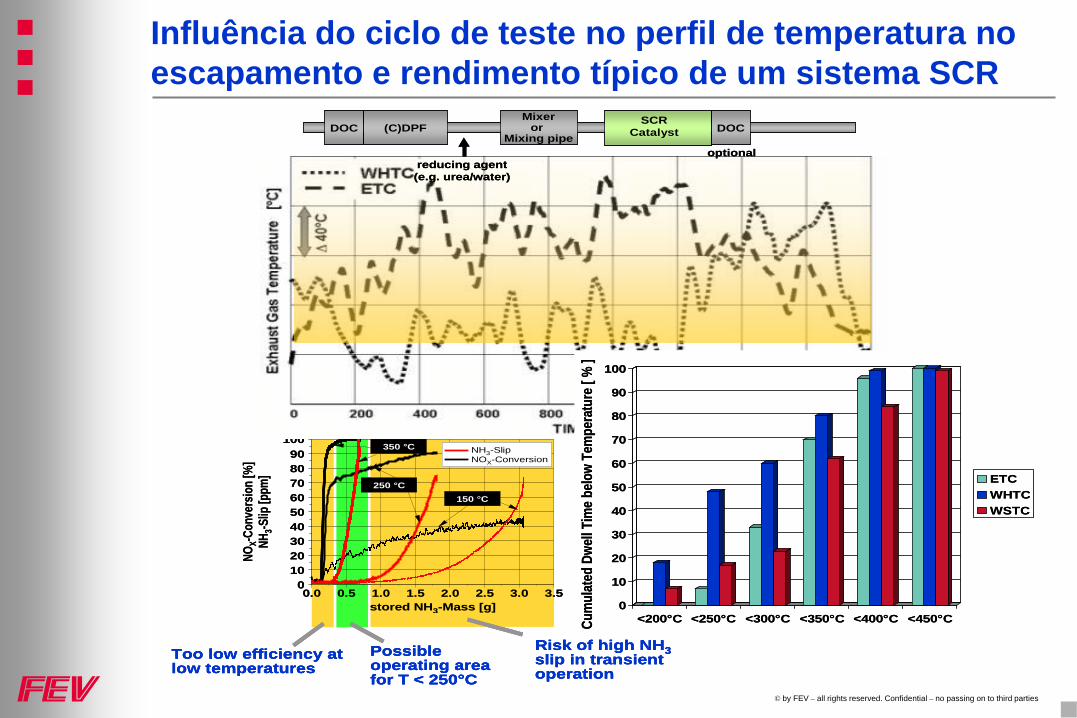
Risk of high NH3slip in transient operation
Too low efficiency at low temperatures
Possible operating areafor T < 250°C
NOX-C
onve
rsion
[%]
NH3-S
lip [p
pm]
0102030405060708090
100
stored NH3-Mass [g]0.0 0.5 1.0 1.5 2.0 2.5 3.0 3.5
250 °C150 °C
350 °C NH3-Slip NOX-Conversion
Risk of high NH3slip in transient operation
Risk of high NH3slip in transient operation
Too low efficiency at low temperaturesToo low efficiency at low temperatures
Possible operating areafor T < 250°C
Possible operating areafor T < 250°C
NOX-C
onve
rsion
[%]
NH3-S
lip [p
pm]
0102030405060708090
100
stored NH3-Mass [g]0.0 0.5 1.0 1.5 2.0 2.5 3.0 3.5
250 °C150 °C
350 °C NH3-Slip NOX-Conversion
reducing agent(e.g. urea/water)
SCRCatalystDOC DOC(C)DPF
Mixeror
Mixing pipeoptional
reducing agent(e.g. urea/water)
SCRCatalystDOC DOC(C)DPF
Mixeror
Mixing pipeoptional
0
10
20
30
40
50
60
70
80
90
100
<200°C <250°C <300°C <350°C <400°C <450°C
ETCWHTCWSTC
Cum
ulat
edDw
ellTi
me b
elow
Tem
pera
ture
[ % ]
0
10
20
30
40
50
60
70
80
90
100
<200°C <250°C <300°C <350°C <400°C <450°C
ETCWHTCWSTC
Cum
ulat
edDw
ellTi
me b
elow
Tem
pera
ture
[ % ]
Influência do ciclo de teste no perfil de temperatura noescapamento e rendimento típico de um sistema SCR

© by FEV – all rights reserved. Confidential – no passing on to third parties
Estratégias para atingir baixos teores de NOxEficiência do Aftertreatment vs. Emissões Brutas do Motor
0%10%20%30%40%50%
60%70%80%90%
100%
0.0 0.5 1.0 1.5 2.0 2.5 3.0 3.5 4.0 4.5 5.0NOx raw emission [g/kWh]
requ
ired
NO
x-re
duct
ion
effic
ienc
y [%
]
Assumption:•NOx limit = 0.4 g/ kWh (NRTC)•20% engineering target
Legal Emission Lim
it
Engi
neer
ing
Targ
et
Significant additional effort & cost for engine, low cost aftertreatment technology Significant additional effort & cost for engine; low cost potential with regard to aftertreatmentNOx conversion rates not be realized considering series production boundaries
Well-balanced demand & costs regarding aftertreatment and engineSignificant additional effort regarding aftertreatment (costs & fuel consumption penalty)
© by FEV – all rights reserved. Confidential – no passing on to third parties
Target AreaTarget Area
20 25 30 35 40 45 50 55180
200
220
240
260
280
300
Cylin
der p
eak
pres
sure
[b
ar]
20 25 30 35 40 45 50 551.0
1.2
1.4
1.6
1.8
2.0
2.2
rela
tive
A/F
Ratio
[-] Rail pressure = 2100 bar
Rail pressure = 2300 bar Rail pressure = 2500 bar
Rail pressure = 3000 bar
20 25 30 35 40 45 50 550.0
0.3
0.6
0.9
1.2
1.5
1.8
NOx
Emiss
ion
[g/
kWh]
EGR-Rate [%]20 25 30 35 40 45 50 55
0.0
0.1
0.2
0.3
0.4
0.5
0.6
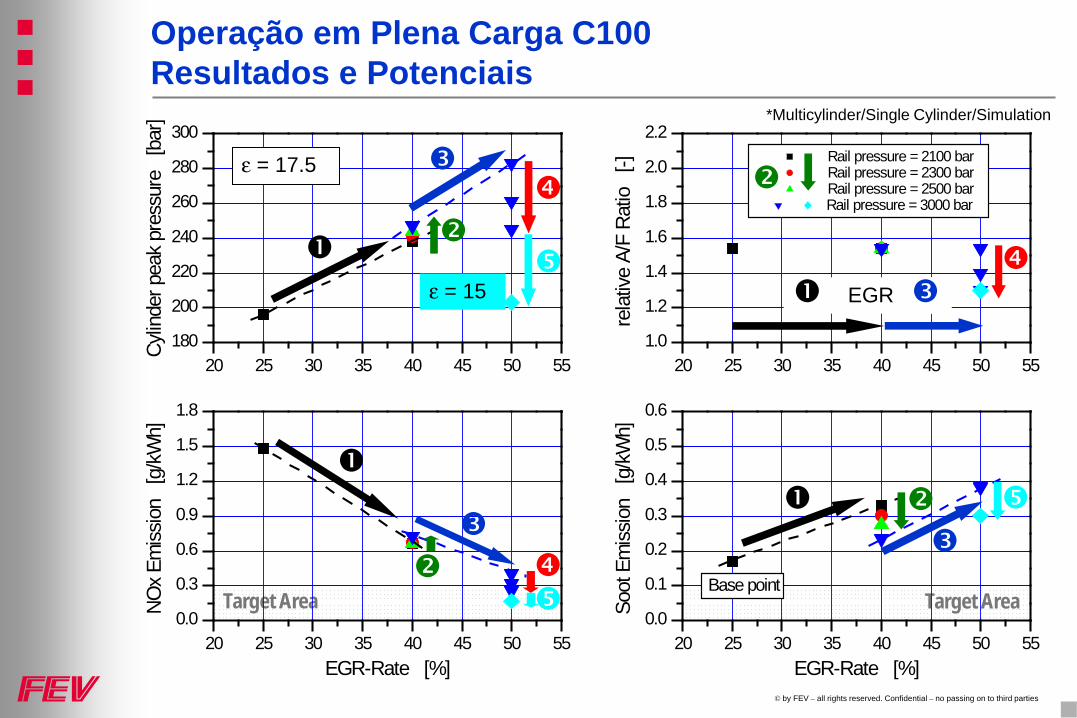
Base point
Soot
Em
issio
n [
g/kW
h]
EGR-Rate [%]
EGR
ε = 15
ε = 17.5
*Multicylinder/Single Cylinder/Simulation
Operação em Plena Carga C100 Resultados e Potenciais
© by FEV – all rights reserved. Confidential – no passing on to third parties
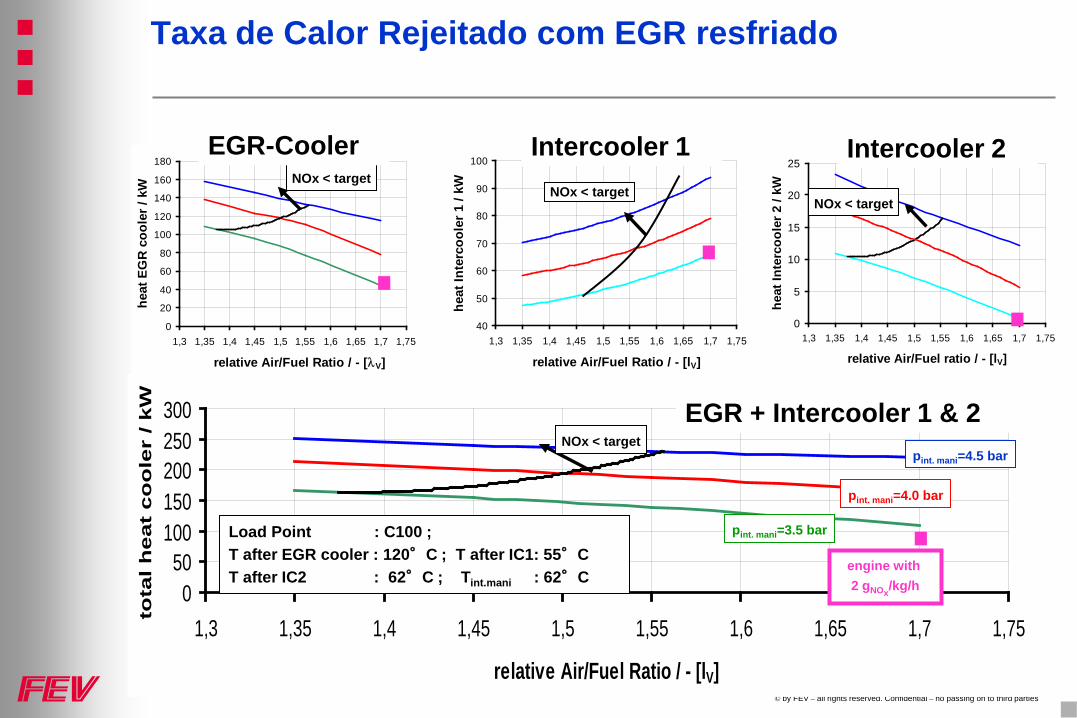
0
20
40
60
80
100
120
140
160
180
1,3 1,35 1,4 1,45 1,5 1,55 1,6 1,65 1,7 1,75
relative Air/Fuel Ratio / - [λV]
heat
EG
R c
oole
r / k
W
40
50
60
70
80
90
100
1,3 1,35 1,4 1,45 1,5 1,55 1,6 1,65 1,7 1,75
relative Air/Fuel Ratio / - [lV]
heat
Inte
rcoo
ler 1
/ kW
0
5
10
15
20
25
1,3 1,35 1,4 1,45 1,5 1,55 1,6 1,65 1,7 1,75
relative Air/Fuel ratio / - [lV]
heat
Inte
rcoo
ler 2
/ kW
050
100150200250300
1,3 1,35 1,4 1,45 1,5 1,55 1,6 1,65 1,7 1,75
relative Air/Fuel Ratio / - [lV]
tota
l h
eat
co
ole
r / kW
Load Point : C100 ; T after EGR cooler : 120°C ; T after IC1: 55°C T after IC2 : 62°C ; Tint.mani : 62°C
.pint. mani=3.5 bar
pint. mani=4.0 bar
pint. mani=4.5 barNOx < target
engine with 2 gNOx/kg/h
NOx < target
.NOx < target
NOx < target
..EGR-Cooler Intercooler 1 Intercooler 2
EGR + Intercooler 1 & 2
Taxa de Calor Rejeitado com EGR resfriado
© by FEV – all rights reserved. Confidential – no passing on to third parties
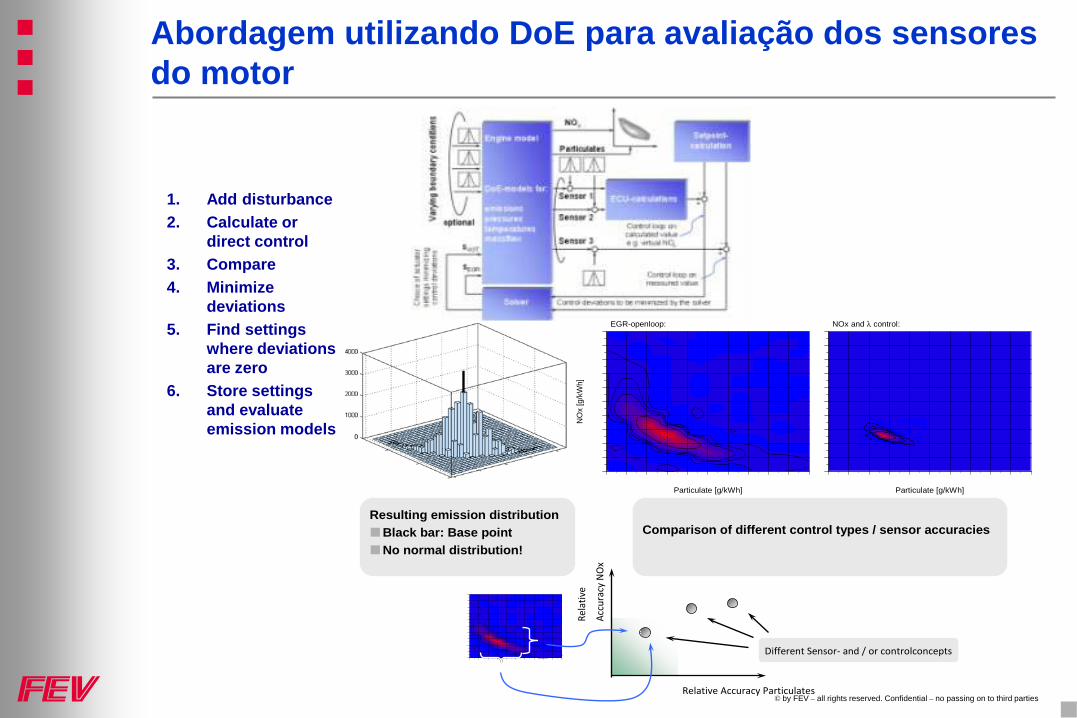
1. Add disturbance2. Calculate or
direct control3. Compare4. Minimize
deviations5. Find settings
where deviationsare zero
6. Store settingsand evaluateemission models
Resulting emission distributionBlack bar: Base pointNo normal distribution!
NO
x [g
/kW
h]
Particulate [g/kWh]
EGR-openloop:
Particulate [g/kWh]
NOx and λ control:
Particulate 3σ = 0.054 g/kWhNOx 3σ = 0.08 g/kWhComparison of different control types / sensor accuracies
Relative Accuracy Particulates
Different Sensor- and / or controlconcepts
Rela
tive
Accu
racy
NO
x
Abordagem utilizando DoE para avaliação dos sensoresdo motor
© by FEV – all rights reserved. Confidential – no passing on to third parties
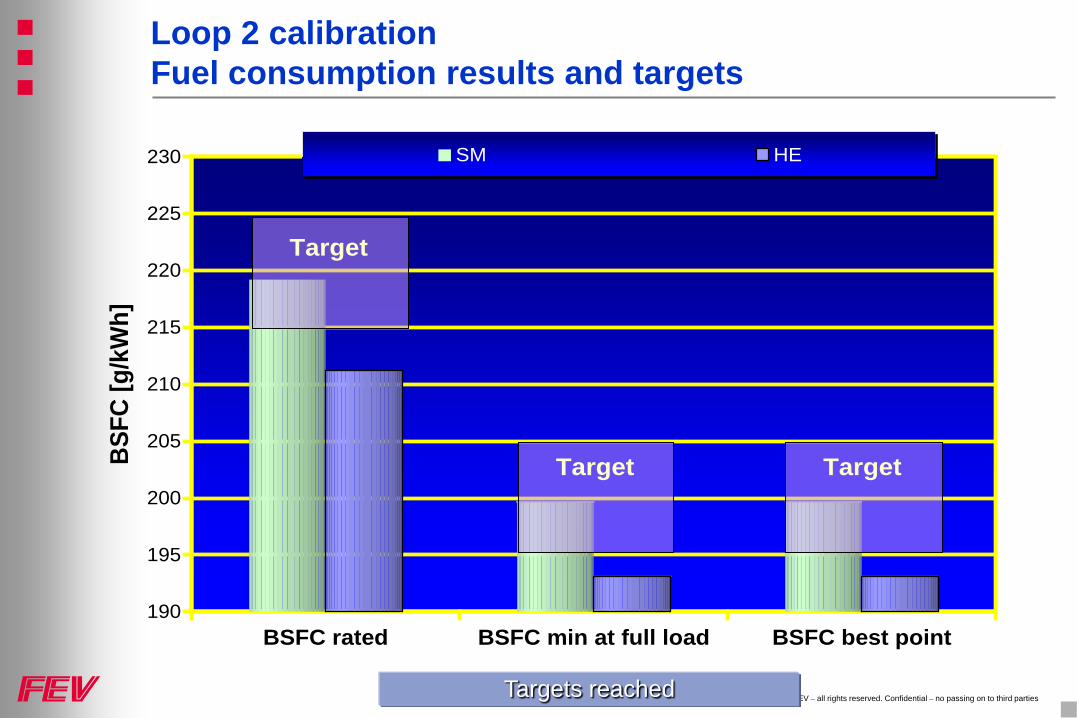
Loop 2 calibrationFuel consumption results and targets
BSFC rated BSFC min at full load BSFC best point190
195
200
205
210
215
220
225
230
BSFC
[g/k
Wh]
SM HE
Target
Target Target
Targets reached