RBGN REVISTA BRASILEIRA DE GESTÃO DE NEGÓCIOS … · Health and Well-being, Golf, Integrated...
18
788 Rev. bus. manag., São Paulo, Vol. 17, No. 54, pp. 788-805, Jan./Mar. 2015 REVISTA BRASILEIRA DE GESTÃO DE NEGÓCIOS ISSN 1806-4892 REVIEW OF BUSINESS MANAGEMENT © FECAP RBGN Received on June 22, 2012 Approved on February 4, 2015 1. Ricardo Samuel Lisboa Pereira Oliveira PhD in Engineering and Management by University of Lisbon. [[email protected]] 2. Maria Isabel Craveiro Pedro PhD in Engineering and Management by University of Lisbon. [[email protected]] 3. Rui Domingos Ribeiro da Cunha Marques PhD in Civil Engineering by University of Lisbon. [[email protected]] Revista Brasileira de Gestão e Negócios DOI:10.7819/rbgn.v17i54. 1375 Efficiency Evaluation of Portuguese Hotels in the Algarve using Data Envelopment Analysis (DEA) Ricardo Samuel Lisboa Pereira Oliveira Maria Isabel Craveiro Pedro Lisbon University / Technical Institute, Department of Engineering and Management, Portugal Rui Domingos Ribeiro da Cunha Marques Lisbon University / Technical Institute, Department of Civil Engineering, Portugal Editor in charge: João Maurício Gama Boaventura, Dr. Evaluation process: Double Blind Review ABSTRACT Objective – To analyse the efficiency levels of company owners of four and five-star hotels in the Algarve in Portugal for the years 2005 to 2007. Variables with quantitative and monetary units were used corresponding to two different models applied. An analysis to the slacks and peers of companies was also performed. Design/methodology/approach – Using data envelopment analysis (DEA) methodology to evaluate the efficiency of 28 hotels in the Portuguese Algarve. Findings – Tourism has an importance universally recognized. is sector has an high economic, social, cultural and environmental impact level. Global destinations and greater competitiveness have turned efficiency into a major issue in the hotel industry nowadays. In Portugal, the Algarve is the region with more tourism (70%), and it is also the area that attracts more foreign demand. e application of frontier techniques to the hotel sector is still scarce in Portugal but innovating. Practical implications – e results suggest that the model, which adopted inputs with monetary units, has higher levels of efficiency. High levels of inefficiency were found and the hotel best practices were identified. It was concluded that the efficiency differences of the results are related to the managerial practices, the use of weak infrastructure (low season), the seasonality and the institutional and contextual environment. Keywords – DEA; Hospitality companies; Efficiency; Slacks; Peers.
Transcript of RBGN REVISTA BRASILEIRA DE GESTÃO DE NEGÓCIOS … · Health and Well-being, Golf, Integrated...

788
Rev. bus. manag., São Paulo, Vol. 17, No. 54, pp. 788-805, Jan./Mar. 2015
REVISTA BRASILEIRA DE GESTÃO DE NEGÓCIOS ISSN 1806-4892REVIEw Of BuSINESS MANAGEMENT
© FECAPRBGN
Received onJune 22, 2012Approved onFebruary 4, 2015
1. Ricardo Samuel Lisboa Pereira OliveiraPhD in Engineering and Management by University of Lisbon.[[email protected]]
2. Maria Isabel Craveiro PedroPhD in Engineering and Management by University of Lisbon.[[email protected]]
3. Rui Domingos Ribeiro da Cunha MarquesPhD in Civil Engineering by University of Lisbon.[[email protected]]
Revista Brasileira de Gestão e Negócios
DOI:10.7819/rbgn.v17i54. 1375
Efficiency Evaluation of Portuguese Hotels in the Algarve using Data Envelopment Analysis (DEA)
Ricardo Samuel Lisboa Pereira OliveiraMaria Isabel Craveiro Pedro
Lisbon University / Technical Institute, Department of Engineering and Management, Portugal
Rui Domingos Ribeiro da Cunha Marques Lisbon University / Technical Institute, Department
of Civil Engineering, Portugal
Editor in charge: João Maurício Gama Boaventura, Dr.Evaluation process: Double Blind Review
ABStRACtObjective – To analyse the efficiency levels of company owners of four and five-star hotels in the Algarve in Portugal for the years 2005 to 2007. Variables with quantitative and monetary units were used corresponding to two different models applied. An analysis to the slacks and peers of companies was also performed.
Design/methodology/approach – Using data envelopment analysis (DEA) methodology to evaluate the efficiency of 28 hotels in the Portuguese Algarve.
Findings – Tourism has an importance universally recognized. This sector has an high economic, social, cultural and environmental impact level. Global destinations and greater competitiveness have turned efficiency into a major issue in the hotel industry nowadays. In Portugal, the Algarve is the region with more tourism (70%), and it is also the area that attracts more foreign demand. The application of frontier techniques to the hotel sector is still scarce in Portugal but innovating.
Practical implications – The results suggest that the model, which adopted inputs with monetary units, has higher levels of efficiency. High levels of inefficiency were found and the hotel best practices were identified. It was concluded that the efficiency differences of the results are related to the managerial practices, the use of weak infrastructure (low season), the seasonality and the institutional and contextual environment.
Keywords – DEA; Hospitality companies; Efficiency; Slacks; Peers.

789
Rev. bus. manag., São Paulo, Vol. 17, No. 54, pp. 788-805, Jan./Mar. 2015
Efficiency Evaluation of Portuguese Hotels in the Algarve using Data Envelopment Analysis (DEA)
1 INtRODuCtION
The importance of tourism is universally recognized. It is a sector with economic, social, cultural and environmental impacts.
Tourism has been the subject of various approaches, a result of its multifaceted and multidisciplinary nature. According to McIntosh and Goeldner (1986), tourism has been studied using economic, sociological and geographical approaches. It is also a resource for interdisciplinary and systemic analyses.
According to Claver-Cortés, Molina-Azorín and Pereira-Moliner (2006), tourism is the main leisure activity in the 21st century or, as Holjevac (2003) states, tourism emerges as the world’s most important service industry, both in number of employees and effects on the economic and social development of regions and countries. According to Fayos (1996) and Smeral (1998), tourism is also one of the biggest opportunities to create wealth and employment in all countries.
Portugal, particularly Algarve, has a privileged position as an excellence tourist destination. It offers weather conditions and natural and cultural resources indispensable for the consolidation and development of ten strategic tourism products: Sun and Sea, Cultural and Landscape Touring, City Break, Business Tourism, Nature Tourism, Nautical Tourism, Health and Well-being, Golf, Integrated Resorts, Residential Tourism, Gastronomy and Wine.
In Portugal, Algarve is the region that concentrates most of the tourism activity (70%), and the area that most attracts the foreign demand. According to Tourism Statistics - 2011 (National Institute of Statistics, 2012), the group of main outbound markets is formed by the United Kingdom, Germany, Spain, Netherlands, France, Italy, Ireland and Brazil, and it represents over 85% of overnight stays of non-residents. The importance of Brazil in the Portuguese market, in terms of number of guests, is 2.76% and, in line with the trend of recent years, it has been steadily increasing.
Competitiveness and survival of the tourism industry in general and hotel services
in particular involve paying attention to all the factors that may represent competitiveness. One of such factors is efficiency, because only the companies that are internally assessed are able to take improvement measures in order to overcome the challenges that current contexts require.
The adequacy and directed strategic intent to inefficiency areas is a serious concern of managers. The high levels of competition pressure companies operating on the efficient edge. The analisys of the so-called X inefficiencies primarily associated to technical faults and then to motivational issues and the lack of competitive pressure in some sectors (Leibenstein, 1966) suggests that they are a determining of competitiveness. Anderson, Fok and Scott (2000) report that the use of X efficiency measures for hotels allows the estimation of the competitive structure of this sector. According to Chen, Liang, Yang and Zhu (2006), efficiency measures can provide hoteliers an additional analysis in order to improve the use of their resources, also playing a crucial role in the profitability and survival of companies.
Using Data Envelopment Analysis (DEA), this article analyzes 4 and 5-star hotels that operated in 2005-2007 as to efficiency levels in the Algarve region and are represented by a group of hotel companies based in the region. Therefor, two different models were considered: in one of them, variables with units in amounts were used, i.e., in a more physical/operational perspective; in the other model, monetary units were used in a more economical/financial perspective. The results from the two models allowed a comparison of efficiencies in line with orientation (input or output), technology (Constant Returns to Scale - CRS, and Variable Returns to Scale - VRS) and the perspective taken in each of the two models. In the literature, no study that made a comparative approach taking into account the nature of physical/operational versus more economic-financial inputs were found.
After a literature review, the DEA model is briefly presented, followed by a case study with presentation and discussion of the results for the

790
Rev. bus. manag., São Paulo, Vol. 17, No. 54, pp. 788-805, Jan./Mar. 2015
Ricardo Samuel Lisboa Pereira Oliveira / Maria Isabel Craveiro Pedro / Rui Domingos Ribeiro da Cunha Marques
two models regarding the efficiency of 4 and 5-star hotel companies in Algarve. Finally, the main conclusions are presented.
2 LIteRAtuRe RevIew
According Marques and Silva (2006), the efficiency of an organization or activity/process refers to the comparison between the values of inputs and outputs/results and their optimal values. Within tourism, efficiency aspects are the provision of services in the tourism sector with cost optimization.
In this section, a set of studies that used the DEA methodology to measure the efficiency of a hotel is presented. For example, Chiang, Tsai and Wang (2004) argue that the DEA methodology is an excellent tool to test the relative efficiency of decision units. They note that, with the variable input/output carefully selected, the DEA technique is useful to locate and diagnose inefficiencies and provide information for an improvement. From a sample with 25 hotels in Taiwan, they used as inputs number of rooms, feeding capacity (F&B), the number of employees and total costs. As outputs, production rates, F&B revenue and total revenue less room revenue and F&B costs were adopted. The authors concluded that not all franchisees and international hotels had levels of efficiency higher than others did. The technical efficiency levels (TE), pure technical efficiency (PTE) and scale efficiency (SE) were verified, for each of these, resulting in 95.9%, 94.2% and 89.3%, respectively.
Barros (2005), using DEA (CCR and BCC), analyzed the individual efficiency of the chain Pousadas de Portugal. Sample size consisted of 43 units. The author used as inputs the number of full-time workers, labor cost, number of rooms, hotel area, account value of fixed assets, operating costs and external costs. As outputs, the author used sales, number of guests and number of nights with occupation. The results obtained for TE, PTE and SE were 90.9%, 94.5% and 97.2%, respectively. Barros (2005) concluded that most
of the studied hotels are efficient and that scale and location are the major determinants of the efficiency of a hotel.
Barros and Mascarenhas (2005) used pricing information in order to study the efficiency of 42 pousadas of Enatur between 1999 and 2001. They used as inputs number of employees and physical capital. As outputs, they used sales, number of guests and number of nights with occupation. The authors found that only 4 of 43 hotels were both technical and efficient in VRS, the TE stood at 86.8%; the size of the hotel had a positive correlation with efficiency.
Barros and Santos (2006), using DEA modeling, studied 15 Portuguese hotels that operated throughout the period 1998-2002. They used as inputs number of employees and physical capital. As outputs, they used sales, value added and earnings. They concluded that size was a factor that influences the efficiency of hotels and there was no evidence that the property influenced the results. 51.1% of the hotels under VRS operated with high levels of overall economic efficiency. Average technical, allocative and economic efficiencies represented 78.7%, 92% and 73%, respectively.
Hsieh and Lin (2010) studied the effectiveness of international tourist hotels in Taiwan using DEA technique. The authors used as inputs rooms costs, number of employees of room staff, catering cost and the number of employees in the catering department. As outputs, they used accommodation revenue and catering revenue. The findings suggested that hotels that are not individual properties had better efficiencies than those that are individually owned, and had better results in terms of production and consumption.
Brida, Detotto and Pulina (2011) studied hotels in 20 Italian regions using the DEA and SFA methodologies. As inputs, labor costs and investments in fixed capital were used. As outputs, they used sales revenue and generated added value. According to the results, the average TE of hotels in Italy was 84.5%. The best performing region was the Lombardy and the less efficient (66.9%) was Costa Valley. They concluded that a weak use

791
Rev. bus. manag., São Paulo, Vol. 17, No. 54, pp. 788-805, Jan./Mar. 2015
Efficiency Evaluation of Portuguese Hotels in the Algarve using Data Envelopment Analysis (DEA)
of infrastructure and seasonality was the main source of inefficiency.
Barros, Botti, Peypoch and Solonandrasana (2011) studied the determinants of efficiency of Portuguese hotel groups using DEA methodology. As inputs, the authors used number of full-time workers, property value and operating costs and as outputs sales and number of guests. Average technical efficiencies represented 91.0% and 97.2% for CRS and VRS, respectively. The estimated average SE was 93.5%. The authors concluded that there are significant differences among Portuguese hotels and all studied hotels had high efficiency levels, being the scaling the dominant source of efficiency. Regarding TE, Portuguese hotels were well managed. They also indicated that the existence of mergers and acquisitions, being a member of a hotel group and having an internationalization strategy were determinants of efficiency.
3 MethODOLOGy
The nonparametric frontier DEA method is based on mathematical programming to measure the relative efficiency of observations that have a homogeneous set of inputs and outputs.
3.1 Origin, advantages and limitations of DeA
The DEA methodology was developed by Charnes, Cooper and Rhodes (1978), who, taking advantage of the seminal work by Michael Farrell in the 50s (Farrell, 1957), applied to it their knowledge of operational research (Charnes & Cooper, 1962). The method was initially designed considering an input orientation and assuming CRS. Later, in the 80s, the possibility of VRS was contemplated (Banker, Charnes, & Cooper, 1984). Other more complete models were further developed (see, for a review of the literature, Cooper, Seiford & Tone, 2000).
The first application of DEA was to evaluate the results of a monitoring program for needy students in American public elementary
schools supported by the federal government of the United States of America. The main point was to compare the performance of a group of school students who participated in the aforementioned program with students from schools that did not join the program (Charnes et al., 1978). This method had a wide use in various fields: banking (Kumar & Gulati, 2008), health (Amado & Dyson, 2003); education (Tyagi, Yadav, & Singh, 2009), hotel services (Assaf & Cvelbar, 2010; Barros and Mascarenhas, 2005; Sigala, Jones, Lockwood, & Airey, 2005; Turner, 2008), water supply (De Witte & Marques, 2010), even soccer (Haas, 2003), among others.
The advantages of DEA are associated with its high applicability, in particular by identifying best practices (Marques, 2006), which can be transposed and followed by other observations to determine its optimal dimension, in the assessment of potential efficiency gains (regarding reductions of inputs or expansion of results), obtain marginal rates of substitution among production factors, calculate productivity variability over the time of each observation, identify the most efficient observations at each time point and determine the most efficient organizational structure.
Since 1978, when the DEA technique was implemented, until the end of 2001 (Tavares, 2002), over 3,200 publications that applied DEA were recorded, reflecting its advantages, importance and potentials. The choice of this methodology has to do primarily with its use in tourism studies, with the possibility of data analysis and its ease of application, adoption of multiple inputs and outputs, as well as the ability to take different orientations (input and output orientations).
3.2Determination of efficiency
The DEA is a methodology that is based on solving linear programming problems and aims to measure the relative efficiency of decision units (which will be referred to in this study as observations). This methodology looks for more efficient observations (best practices), which will
792
Rev. bus. manag., São Paulo, Vol. 17, No. 54, pp. 788-805, Jan./Mar. 2015
Ricardo Samuel Lisboa Pereira Oliveira / Maria Isabel Craveiro Pedro / Rui Domingos Ribeiro da Cunha Marques
form the efficient frontier, and then estimates the efficiencies of the remaining observations (inefficient) based on the efficient frontier. The inefficiencies of inefficient observations are represented by the distance that they have from efficient frontiers. The closer to efficient frontiers observations are, the lower their inefficiency.
Inefficiency reduction can be done from the perspective of inputs (input orientation), evaluating the amount of inputs necessary to be reduced for the observation to become efficient while maintaining the same level of output production; or, from the perspective of outputs (output orientation), while maintaining the level of inputs, determines the amount of outputs necessary to be increased for the observation to become efficient (Thanassoulis, 2001).
The concepts of input and output orientation are exemplified in Figure 1.
Figure 1. Orientation of DEA models. Source: Adapted from Thanassoulis, E. (2001). Introduction to the theory and application of Data Envelopment Analysis: a foundation textwith integrated software. Dordrecht: Kluwer Academic Publishers.
As shown by the graph (a) of Figure 1, in which the concept of input orientation is
presented, for the observation D to be technically efficient, the level of inputs x1 and x2 has to
be reduced until D', where the efficient frontier is. From the four observations (A, B, C and
D), only two observations, A and B, are efficient. The observation C lies on the isoquant but
its x1 input level needs to be reduced to become efficient, reaching the same level of input of
observation B.
In graph (b) of Figure 1, where the output orientation concept is displayed, there is the
same situation. That is, only A and B are efficient and the observation D needs to increase its
level of outputs y1 and y2 until D' to become efficient.
One of the main advantages of non-parametric methods, such as DEA, is related to the
fact that, unlike parametric methods (e.g., stochastic frontiers), it does not require neither
prior specification of a functional form for the production function nor the admission of
numerous assumptions. Another important aspect of the method is related to the fact that this
is a border technique, i.e., a technique that identifies the most extreme observations (best
practices) (Figure 2) and not an average adjustment technique, such as in the case of single or
multiple linear regressions. The DEA method also makes it possible to identify peers for each
observation and their target values (targets).
Figure 2. Efficient Frontier and Efficient and Inefficient Observations.
Input Orientation Output Orientation
FIGuRe 1 – Orientation of DEA models.Source: Adapted from Thanassoulis, E. (2001). Introduction to the theory and application of Data Envelopment Analysis: a foundation textwith integrated software. Dordrecht: Kluwer Academic Publishers.
As shown by the graph (a) of Figure 1, in which the concept of input orientation is presented, for the observation D to be technically efficient, the level of inputs x1 and x2 has to be reduced until D’, where the efficient frontier is. From the four observations (A, B, C and D), only two observations, A and B, are efficient. The observation C lies on the isoquant but its x1 input level needs to be reduced to become efficient,
reaching the same level of input of observation B. In graph (b) of Figure 1, where the output
orientation concept is displayed, there is the same situation. That is, only A and B are efficient and the observation D needs to increase its level of outputs y1 and y2 until D’ to become efficient.
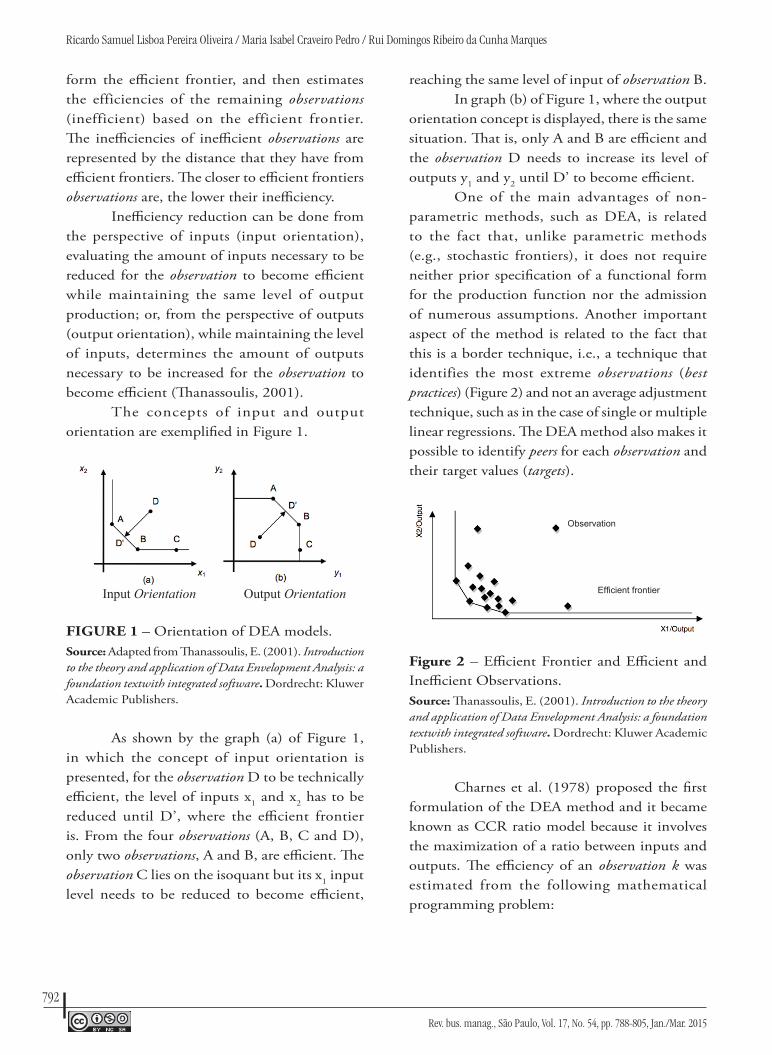
One of the main advantages of non-parametric methods, such as DEA, is related to the fact that, unlike parametric methods (e.g., stochastic frontiers), it does not require neither prior specification of a functional form for the production function nor the admission of numerous assumptions. Another important aspect of the method is related to the fact that this is a border technique, i.e., a technique that identifies the most extreme observations (best practices) (Figure 2) and not an average adjustment technique, such as in the case of single or multiple linear regressions. The DEA method also makes it possible to identify peers for each observation and their target values (targets).
7
is a border technique, i.e., a technique that identifies the most extreme observations (best
practices) (Figure 2) and not an average adjustment technique, such as in the case of single or
multiple linear regressions. The DEA method also makes it possible to identify peers for each
observation and their target values (targets).
Figure 2. Efficient Frontier and Non-efficient Observations. Source: Thanassoulis, E. (2001). Introduction to the theory and application of Data Envelopment Analysis: a foundation textwith integrated software. Dordrecht: Kluwer Academic Publishers.
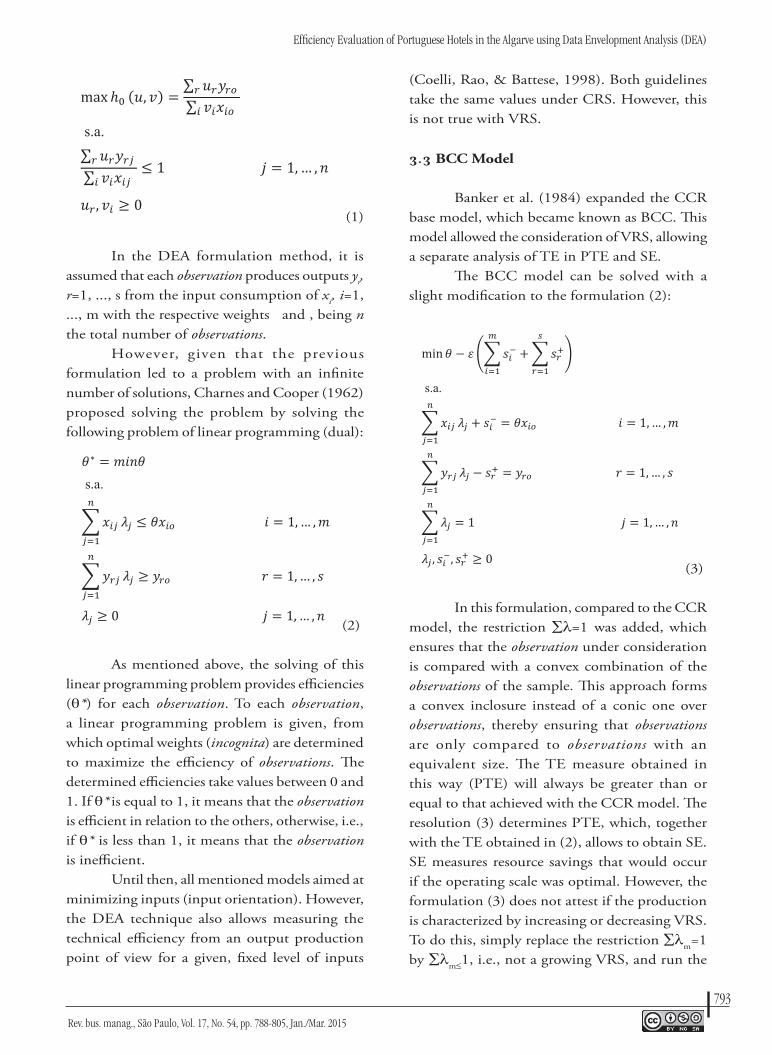
Charnes et al. (1978) proposed the first formulation of the DEA method and it became
known as CCR ratio model because it involves the maximization of a ratio between inputs
and outputs. The efficiency of an observation k was estimated from the following
mathematical programming problem:
s.a.
(1)
In the DEA formulation method, it is assumed that each observation produces outputs
yr, r=1, ..., s from the input consumption of xi, i=1, ..., m with the respective weights and
, being n the total number of observations.
However, given that the previous formulation led to a problem with an infinite number
of solutions, Charnes and Cooper (1962) proposed solving the problem by solving the
following problem of linear programming (dual):
s.a.
Observation
Efficient frontier
Figure 2 – Efficient Frontier and Efficient and Inefficient Observations.Source: Thanassoulis, E. (2001). Introduction to the theory and application of Data Envelopment Analysis: a foundation textwith integrated software. Dordrecht: Kluwer Academic Publishers.
Charnes et al. (1978) proposed the first formulation of the DEA method and it became known as CCR ratio model because it involves the maximization of a ratio between inputs and outputs. The efficiency of an observation k was estimated from the following mathematical programming problem:
793
Rev. bus. manag., São Paulo, Vol. 17, No. 54, pp. 788-805, Jan./Mar. 2015
Efficiency Evaluation of Portuguese Hotels in the Algarve using Data Envelopment Analysis (DEA)
Source: Thanassoulis, E. (2001). Introduction to the theory and application of Data Envelopment Analysis: a foundation textwith integrated software. Dordrecht: Kluwer Academic Publishers.
Charnes et al. (1978) proposed the first formulation of the DEA method and it became
known as CCR ratio model because it involves the maximization of a ratio between inputs
and outputs. The efficiency of an observation k was estimated from the following
mathematical programming problem:
s.a.
In the DEA formulation method, it is assumed that each observation produces outputs
yr, r=1, ..., s from the input consumption of xi, i=1, ..., m with the respective weights and
, being n the total number of observations.
However, given that the previous formulation led to a problem with an infinite number
of solutions, Charnes and Cooper (1962) proposed solving the problem by solving the
following problem of linear programming (dual):
s.a.
As mentioned above, the solving of this linear programming problem provides
efficiencies ( *) for each observation. To each observation, a linear programming problem is
given, from which optimal weights (incognita) are determined to maximize the efficiency of
observations. The determined efficiencies take values between 0 and 1. If * is equal to 1, it
(1)
In the DEA formulation method, it is assumed that each observation produces outputs yr, r=1, ..., s from the input consumption of xi, i=1, ..., m with the respective weights and , being n the total number of observations.
However, given that the previous formulation led to a problem with an infinite number of solutions, Charnes and Cooper (1962) proposed solving the problem by solving the following problem of linear programming (dual):
Source: Thanassoulis, E. (2001). Introduction to the theory and application of Data Envelopment Analysis: a foundation textwith integrated software. Dordrecht: Kluwer Academic Publishers.
Charnes et al. (1978) proposed the first formulation of the DEA method and it became
known as CCR ratio model because it involves the maximization of a ratio between inputs
and outputs. The efficiency of an observation k was estimated from the following
mathematical programming problem:
s.a.
In the DEA formulation method, it is assumed that each observation produces outputs
yr, r=1, ..., s from the input consumption of xi, i=1, ..., m with the respective weights and
, being n the total number of observations.
However, given that the previous formulation led to a problem with an infinite number
of solutions, Charnes and Cooper (1962) proposed solving the problem by solving the
following problem of linear programming (dual):
s.a.
As mentioned above, the solving of this linear programming problem provides
efficiencies ( *) for each observation. To each observation, a linear programming problem is
given, from which optimal weights (incognita) are determined to maximize the efficiency of
observations. The determined efficiencies take values between 0 and 1. If * is equal to 1, it
(2)
As mentioned above, the solving of this linear programming problem provides efficiencies (θ*) for each observation. To each observation, a linear programming problem is given, from which optimal weights (incognita) are determined to maximize the efficiency of observations. The determined efficiencies take values between 0 and 1. If θ* is equal to 1, it means that the observation is efficient in relation to the others, otherwise, i.e., if θ* is less than 1, it means that the observation is inefficient.
Until then, all mentioned models aimed at minimizing inputs (input orientation). However, the DEA technique also allows measuring the technical efficiency from an output production point of view for a given, fixed level of inputs
(Coelli, Rao, & Battese, 1998). Both guidelines take the same values under CRS. However, this is not true with VRS.
3.3BCC Model
Banker et al. (1984) expanded the CCR base model, which became known as BCC. This model allowed the consideration of VRS, allowing a separate analysis of TE in PTE and SE.
The BCC model can be solved with a slight modification to the formulation (2):
means that the observation is efficient in relation to the others, otherwise, i.e., if * is less
than 1, it means that the observation is inefficient.
Until then, all mentioned models aimed at minimizing inputs (input orientation).
However, the DEA technique also allows measuring the technical efficiency from an output
production point of view for a given, fixed level of inputs (Coelli, Rao, & Battese, 1998).
Both guidelines take the same values under CRS. However, this is not true with VRS.
3.3 BCC Model
Banker et al. (1984) expanded the CCR base model, which became known as BCC. This
model allowed the consideration of VRS, allowing a separate analysis of TE in PTE and SE.
The BCC model can be solved with a slight modification to the formulation (2):
s.a.
In this formulation, compared to the CCR model, the restriction =1 was added,
which ensures that the observation under consideration is compared with a convex
combination of the observations of the sample. This approach forms a convex inclosure
instead of a conic one over observations, thereby ensuring that observations are only
compared to observations with an equivalent size. The TE measure obtained in this way
(PTE) will always be greater than or equal to that achieved with the CCR model. The
resolution (3) determines PTE, which, together with the TE obtained in (2), allows to obtain
SE. SE measures resource savings that would occur if the operating scale was optimal.
However, the formulation (3) does not attest if the production is characterized by increasing
(3)
In this formulation, compared to the CCR model, the restriction ∑λ=1 was added, which ensures that the observation under consideration is compared with a convex combination of the observations of the sample. This approach forms a convex inclosure instead of a conic one over observations, thereby ensuring that observations are only compared to observations with an equivalent size. The TE measure obtained in this way (PTE) will always be greater than or equal to that achieved with the CCR model. The resolution (3) determines PTE, which, together with the TE obtained in (2), allows to obtain SE. SE measures resource savings that would occur if the operating scale was optimal. However, the formulation (3) does not attest if the production is characterized by increasing or decreasing VRS. To do this, simply replace the restriction ∑λm=1 by ∑λm≤1, i.e., not a growing VRS, and run the
794
Rev. bus. manag., São Paulo, Vol. 17, No. 54, pp. 788-805, Jan./Mar. 2015
Ricardo Samuel Lisboa Pereira Oliveira / Maria Isabel Craveiro Pedro / Rui Domingos Ribeiro da Cunha Marques
two formulations with ∑λm=1 and with ∑λm≤1. If the PTE signal is equivalent, the arbitrated case is correct; otherwise, the reverse hypothesis is valid: an increasing VRS.
4 PReSeNtAtION AND DISCuSSION OF ReSuLtS
4.1 Sample
All companies owing 4 and 5-star hotels that have their headquarters in the Algarve constituted this study’s population, which will henceforth be called “hotel companies.”
The information was collected from the Library Automation System (SABI) database (Iberian Balance Sheet Analysis System, 2005-2007) from the Bureau van Dijk Electronic Publishing and from the Hotels and Tourist Enterprises Association of the Algarve - AHETA, 2010, comprising the years 2005, 2006 and 2007.
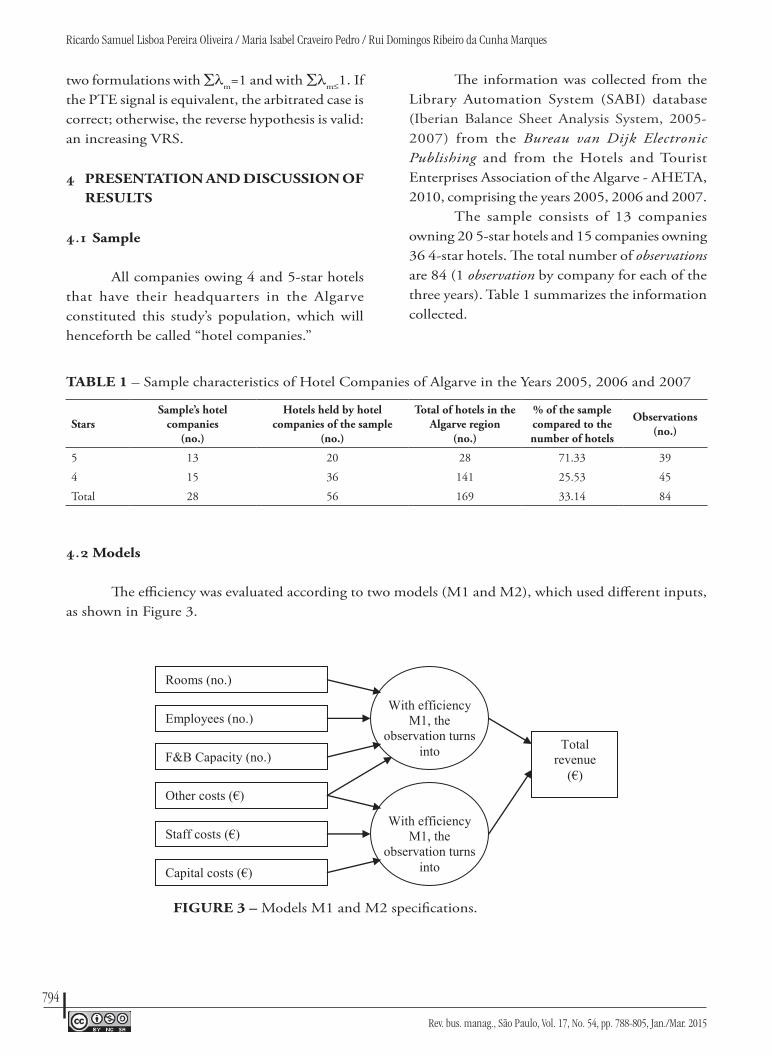
The sample consists of 13 companies owning 20 5-star hotels and 15 companies owning 36 4-star hotels. The total number of observations are 84 (1 observation by company for each of the three years). Table 1 summarizes the information collected.
tABLe 1 – Sample characteristics of Hotel Companies of Algarve in the Years 2005, 2006 and 2007
StarsSample’s hotel
companies(no.)
hotels held by hotel companies of the sample
(no.)
total of hotels in the Algarve region
(no.)
% of the sample compared to the number of hotels
Observations(no.)
5 13 20 28 71.33 39
4 15 36 141 25.53 45
Total 28 56 169 33.14 84
4.2Models
The efficiency was evaluated according to two models (M1 and M2), which used different inputs, as shown in Figure 3.
10
Total 28 56 169 33.14 84
4.2 Models
The efficiency was evaluated according to two models (M1 and M2), which used
different inputs, as shown in Figure 3.
Figure 3. Models M1 and M2 specifications.
The model M1 considers inputs using units in numbers (Turner, 2008) and is used to
assess the ability of companies in terms of service and occupation for the resources available
(5 variables: 4 inputs and 1 output).
The model M2 considers all variables using monetary units (Turner, 2008) and is used
to assess the extent to which hotel companies of the Algarve may decrease their costs while
maintaining total revenues (4 variables: 3 inputs and 1 output).
Table 2 shows the main statistical parameters of the variables adopted in the two
models.
Table 2
Statistical Characterization of the Variables (Models M1 and M2)
Variable Mean Santard Deviation Minimum Maximum Rooms (no.) 377 260.7 96 1,151 Employees (no.) 205 131.9 38 561 F&B Capacity (no.) 399 247.9 110 900 Other costs (€) 10,660,899 9,816,586 691,057 54,868,846 Staff costs (€) 3,856,988 3,061,628 7,944 10,649,727 Capital costs (€) 1,975,096 2,118,830 8,440 9,153,684 Total revenue (€) 11,134,053 10,160,297 954,369 71,023,628
Rooms (no.)
Employees (no.)
F&B Capacity (no.)
Other costs (€)
Staff costs (€)
Capital costs (€)
Total revenue
(€)
With efficiency M1, the
observation turns into
With efficiency M1, the
observation turns into
FIGuRe 3 – Models M1 and M2 specifications.
795
Rev. bus. manag., São Paulo, Vol. 17, No. 54, pp. 788-805, Jan./Mar. 2015
Efficiency Evaluation of Portuguese Hotels in the Algarve using Data Envelopment Analysis (DEA)
The model M1 considers inputs using units in numbers (Turner, 2008) and is used to assess the ability of companies in terms of service and occupation for the resources available (5 variables: 4 inputs and 1 output).
The model M2 considers all variables using monetary units (Turner, 2008) and is used
to assess the extent to which hotel companies of the Algarve may decrease their costs while maintaining total revenues (4 variables: 3 inputs and 1 output).
Table 2 shows the main statistical parameters of the variables adopted in the two models.
tABLe 2 – Statistical Characterization of the Variables (Models M1 and M2)
variable Mean Santard Deviation Minimum Maximum
Rooms (no.) 377 260.7 96 1,151
Employees (no.) 205 131.9 38 561
F&B Capacity (no.) 399 247.9 110 900
Other costs (€) 10,660,899 9,816,586 691,057 54,868,846
Staff costs (€) 3,856,988 3,061,628 7,944 10,649,727
Capital costs (€) 1,975,096 2,118,830 8,440 9,153,684
Total revenue (€) 11,134,053 10,160,297 954,369 71,023,628
To analyze the efficiency of hotel companies, according to the two models, input and output orientations were adopted and CRS and VRS technologies were used.
Mainly two types of costs characterize hotel services: investment costs, which are reflected in the number of rooms, and operating costs, which are related to demand. In terms of revenue, two sources of funds can be considered: room revenues and F&B (food) revenues. The inefficiency may be seen as the non-optimal use of these strategic resources.
“Number of rooms” is an important variable because it reflects a high initial investment and is a determinant of revenues. Some authors, such as Barros (2005) and Barros and Mascarenhas (2005), prefer to use hotel’s account value as a cost of investment. Others, such as Anderson et al. (2000), Johns, Howcroft & Drake (1997), Hwang & Chang (2003) and Sigala et al. (2005), due to data accessibility reasons, prefer to use the number of rooms as a representation of the investment cost.
“Number of employees” is an important input because hotel services is a predominantly intensive-labor sector. This input was considered in
studies such as those conducted by Barros (2005) and Chang & Hwang (2003). Other authors used staff costs to measure the “labor” input (Brida et al., 2011; Morey & Ditman, 1995; among others).
“F&B capacity” physically expresses economic costs, representing from 25% to 30% of the total of operating costs (Turner, 2008).
“Capital costs” represents the cost of depreciation plus interest costs associated with investing. This variable was used, for example, by Marques & Simões (2009). “Other costs” represent all other costs other than staff or capital costs.
In terms of output, a wide range of authors, including Anderson et al. (2000), Barros (2005), Chen et al. (2006) and Barros et al. (2011), used “total revenue”.
5 ReSuLtS 5.1 Introductory note
Table 3 shows the results, by hotel company, of efficiencies for the year 2007, taking into account the two models and input and output orientations.

796
Rev. bus. manag., São Paulo, Vol. 17, No. 54, pp. 788-805, Jan./Mar. 2015
Ricardo Samuel Lisboa Pereira Oliveira / Maria Isabel Craveiro Pedro / Rui Domingos Ribeiro da Cunha Marques
In Annex A, it is possible to verify the correspondence between company name and the number allocated to it for the purposes of this study.
tABLe 3 – Efficiencies of Hotel Companies of Algarve for the Year 2007 (Models M1 and M2)
M1 - inputs M2 - inputs M1 - output M2 - output
Company te Pte Se te Pte Se te Pte Se te Pte Se
1 0.325 0.713 0.455 0.413 0.635 0.651 0.325 0.418 0.777 0.413 0.513 0.805
2 0.379 0.847 0.448 0.414 0.692 0.599 0.379 0.703 0.540 0.414 0.560 0.740
3 0.492 0.657 0.748 0.534 0.606 0.882 0.492 0.578 0.851 0.534 0.559 0.956
4 0.694 0.889 0.781 0.697 0.739 0.943 0.694 0.846 0.821 0.697 0.722 0.965
5 0.512 0.522 0.981 0.546 0.578 0.945 0.512 0.529 0.967 0.546 0.548 0.996
6 0.465 1.000 0.465 0.573 0.627 0.914 0.465 1.000 0.465 0.573 0.578 0.991
7 1.000 1.000 1.000 1.000 1.000 1.000 1.000 1.000 1.000 1.000 1.000 1.000
8 0.433 0.456 0.949 0.615 0.630 0.977 0.433 0.443 0.977 0.615 0.624 0.986
9 0.528 1.000 0.528 0.580 0.901 0.644 0.528 1.000 0.528 0.580 0.834 0.695
10 0.541 0.544 0.993 0.715 0.730 0.978 0.541 0.549 0.985 0.715 0.859 0.832
11 0.897 0.994 0.903 1.000 1.000 1.000 0.897 0.992 0.904 1.000 1.000 1.000
12 0.528 0.574 0.920 0.523 0.535 0.978 0.528 0.543 0.973 0.523 0.524 0.999
13 0.461 0.556 0.830 0.461 0.478 0.964 0.461 0.465 0.992 0.461 0.462 0.999
14 0.591 0.830 0.712 0.621 0.685 0.906 0.591 0.753 0.784 0.621 0.662 0.938
15 0.638 0.684 0.934 0.465 0.468 0.994 0.638 0.658 0.970 0.465 0.472 0.986
16 0.511 0.547 0.933 0.801 0.846 0.947 0.511 0.513 0.995 0.801 0.961 0.834
17 0.447 0.630 0.710 0.433 0.449 0.966 0.447 0.469 0.954 0.433 0.444 0.976
18 0.622 1.000 0.622 0.725 0.749 0.968 0.622 1.000 0.622 0.725 0.729 0.995
19 0.464 0.532 0.871 0.526 0.584 0.900 0.464 0.484 0.958 0.526 0.548 0.959
20 0.398 0.990 0.402 0.884 0.970 0.912 0.398 0.854 0.466 0.884 0.903 0.979
21 0.544 0.635 0.857 0.500 0.501 0.999 0.544 0.563 0.966 0.500 0.535 0.935
22 0.579 1.000 0.579 0.407 0.434 0.938 0.579 1.000 0.579 0.407 0.412 0.988
23 0.481 0.647 0.743 0.459 0.477 0.962 0.481 0.553 0.869 0.459 0.461 0.995
24 0.582 0.712 0.817 0.582 0.607 0.958 0.582 0.656 0.887 0.582 0.594 0.979
25 0.653 0.902 0.724 0.648 0.668 0.970 0.653 0.763 0.855 0.648 0.658 0.985
26 0.576 0.812 0.709 0.679 0.815 0.833 0.576 0.745 0.772 0.679 0.754 0.901
27 1.000 1.000 1.000 1.000 1.000 1.000 1.000 1.000 1.000 1.000 1.000 1.000
28 0.595 0.930 0.640 0.737 1.000 0.737 0.595 0.855 0.696 0.737 1.000 0.737
It is noted that, for the year 2007, the companies 7 and 27 had maximum efficiencies in the two models and in the three types of efficiency.
5.2Discussion of the model M1
Table 4 shows obtained results and statistical parameters of efficiency of hotel
companies in the Algarve considering input and output orientations for the years 2005, 2006 and 2007 and the model M1 (4 inputs and 1output).

797
Rev. bus. manag., São Paulo, Vol. 17, No. 54, pp. 788-805, Jan./Mar. 2015
Efficiency Evaluation of Portuguese Hotels in the Algarve using Data Envelopment Analysis (DEA)
tABLe 4 – Efficiency of Algarve Hotels Using Orientation Input and Output (2005-2007)
Input Orientation Output Orientation
te Pte Se te Pte Se
Mean 0.519 0.729 0.741 1.923 1.534 1.201
Maximum 1.000 1.000 1.000 1.000 1.000 1.000
Minimum 0.319 0.444 0.389 3.135 2.786 2.309
Stantard Deviation 0.125 0.188 0.177 0.439 0.477 0.355
Median 0.495 0.684 0.768 2.020 1.776 2.015
Efficient hotel companies 2 9 2 2 9 2
Efficient hotel companies in all 3 years 1 1
Overall, hotel companies expressed high levels of inefficiency in the model M1.
Analyzing the type of orientation, it is verified that in CRS (optimum scale), TE has a 0.519 mean in input orientation and 1.923 in output orientation. This means that, in the input orientation, the inputs rooms (no.), staff (no.), F&B places (no.) and other costs (€) can be reduced by 48.1% and still maintain the same level of outputs (revenues). As for output orientation, the outputs (revenue) can be expanded by 92.3% maintaining the same level of inputs.
According to the input orientation in VRS, the PTE has a value of 0.729, i.e., 27.1% of inputs can be reduced while maintaining the same level of outputs. It also has the potential to increase their outputs by 53.4%.
SE levels are 0.741 and 1.201, respectively, for input and output orientations, meaning that
their inputs can be reduced by 25.9% while maintaining the same level of outputs, or increase outputs by 20.1% while maintaining the same level of inputs. Most of the companies has an increasing VRS.
The importance of the scale in explaining efficiency must be highlighted.
The number of efficient hotel companies is 2 for CRS and 9 for VRS.
There is only 1 hotel company with a maximum efficiency in the three years considered. The minimum indicators achieved were (TE) 0.319 and 3.135 and (PTE) 0.444 and 2.786 for input and output orientations and CRS and VRS technologies, respectively.
Figure 5 illustrates inefficiencies intervals for Algarve hotel companies according to input and output orientations.
FIGuRe 5 – Inefficiency intervals to Algarve Hotel Companies (Model M1).

798
Rev. bus. manag., São Paulo, Vol. 17, No. 54, pp. 788-805, Jan./Mar. 2015
Ricardo Samuel Lisboa Pereira Oliveira / Maria Isabel Craveiro Pedro / Rui Domingos Ribeiro da Cunha Marques
To identify outliers, the concept of super-efficiency (Andersen & Petersen, 1993) and peer count (Charnes et al., 1978) were applied. Although they presented some extreme observations, they did not significantly influence their peers and are probably best practices.
5.3Discussion of the model M2
Table 5 shows the results obtained for the model M2 (3 inputs e 1 output) considering input and output orientations and the years 2005, 2006 and 2007.
tABLe 5 – Efficiency of Algarve Hotel Companies Using Input and Output Orientations (2005-2007)
Input Orientation Orientation Output
te Pte Se te Pte Se
Mean 0.614 0.685 0.901 1.748 1.617 1.088
Maximum 1.000 1.000 1.000 3.277 3.252 1.439
Minimum 0.305 0.332 0.592 1.000 1.000 1.000
Stantard Deviation 0.170 0.173 0.112 0.465 0.443 0.117
Median 0.580 0.650 0.943 1.724 1.639 1.034
Efficient hotel companies 6 7 6 6 7 6
Efficient hotel companies in all 3 years 0 0 0 0 0 0
According to Table 5, in the input orientation there are low levels of efficiency in TE (0.614), corresponding to a 38.6% TE level and to PTE (0.685), which corresponds to a 31.5% PTE. SE had a better situation (0.901), corresponding to a 9.9% SE.
In the output orientation, low levels of TE and PTE were also verified. In this orientation, the TE level (1,748) suggests that, maintaining the same use of inputs, there is a potential to increase its outputs by 74.8%. With PTE level (1.617), the potential of use improvements of inputs is 61.7%,
while to SE it will be only 8.8%. In short, it is possible to state that PTE is the portion that can contribute the most to an improved efficiency.
The number of efficient hotel companies in both orientations is reduced, confirming the indicators mentioned above. There are no hotels with a maximum efficiency level in the three years considered.
Figure 6 illustrates the efficiency intervals for hotel companies of the Algarve according to input and output orientations.
FIGuRe 6 – Inefficiency Intervals to Hotel Companies of Algarve (Model M2)

799
Rev. bus. manag., São Paulo, Vol. 17, No. 54, pp. 788-805, Jan./Mar. 2015
Efficiency Evaluation of Portuguese Hotels in the Algarve using Data Envelopment Analysis (DEA)
5.4Slacks
Slacks are additional sources of inefficiencies, reflecting the extent to which inputs can be reduced after radial frontier contractions have been made. In theory, a company is efficient only if efficiency is equal to 1 and slacks are equal to 0.
Table 6 shows radial movements to the frontier, slacks and the projected point (target) at the frontier. Their analysis suggests the presence of slacks in both models, with emphasis on the variable “other costs”, which has the highest values in all estimations, except in the M2-CRS model, where capital costs have higher values. Noteworthy is the fact that slacks for the two models have a higher value in the output-orientated VRS technology. These are higher than in input VRS and these in turn are higher than in input CRS.
In the model M1, with CRS, all 28 companies may reduce (radial contraction) the number of rooms, in average, by 181 to be on the efficient frontier. After the radial contraction
of this input-vector (number of rooms) as much as possible to the frontier (for a given amount of outputs - total revenue - which still belongs to the production technology), an average of 70 rooms can still be reduced to achieve a peer (reference-pair), thus reducing further the consumption of resources (number of rooms).
For example, the company 28, under CRS, with 138 rooms and a TE of 0.565, can reduce inefficiency by 43.5% (60 rooms) maintaining the same output (total revenue) through radial contraction to the efficient frontier, where the 78-rooms target is. This means that a considerable reduction of resource consumption (rooms) may be made obtaining the same result (total revenue). Besides that, it can reduce further the number of rooms by 10, moving in the border to the closest peer, maintaining fixed other inputs (number of employees, F&B capacity and other costs). This individual reduction of the company’s inputs in the 10-room frontier is called input slack (slack of “number of rooms” input).
tABLe 6 – Companies’ Slacks
Model M1
CRS vRS: input vRS: output
Variable RM SM T RM SM T RM SM T
Rooms (no.) -181 -70 126 -128 -55 194 0 -142 235
Employees (no.) -97 -13 94 -66 -12 127 0 -27 177
F&B Capacity (no.) -193 -117 89 -139 -97 164 0 -204 195
Other costs (€) -5,133 -674 4,854 -3,507 -1,202 5,952 0 -1,698 8,963
Model M2
CRS vRS: input vRS: output
Variable RM SM T RM SM T RM SM T
Staff costs (€) -1.510.058 -35.793 2.311.137 -1.313.917 -47.045 2.496.026 0 -209.508 3.647.480
Other costs (€) -871.180 -169.040 942.496 -792.029 -105.166 1.085.521 0 -259.347 1.723.369
Capital costs (€) -3.809.333 -25.381 6.826.185 -3.250.432 -252.773 7.157.694 0 -337.974 10.322.925
Note. Caption: RM - Radial movement; SM - Slack movement; T - Target
5.5Peers
Although the number of inefficient companies is not too high, a significant number
can improve their levels of performance as to efficiency both in input orientation and in output orientation. Table 7 contains peer companies (best practices or benchmarks) to other companies, that

800
Rev. bus. manag., São Paulo, Vol. 17, No. 54, pp. 788-805, Jan./Mar. 2015
Ricardo Samuel Lisboa Pereira Oliveira / Maria Isabel Craveiro Pedro / Rui Domingos Ribeiro da Cunha Marques
is, companies that serve as a reference for other companies with which benchmarking actions towards higher levels of efficiency may occur. Moreover, as can be seen in Table 7, the companies 7 and 27 are peers to other companies in the two models and in the two types of orientation.
For example, in the M1-CRS-input-oriented model, the company 28, with a 0.565 TE, which is distant from the 0.465 frontier, should be compared with the “peer” company 27 (or “reference-pair”) in order to be able to increase its efficiency.
tABLe 7 – Companies’ Peers
Company (no.)Input Orientation Orientation Output
M1-CRS M1-vRS M2-CRS M2-vRS M1-CRS M2-vRS
6 23 7
7 66 33 55 70 46 65
9 63 6 46 49 31
11 49 45 45
20 22 7 29 22 26
22 2 2
27 82 65 71 66 70 77
28 4 8
6 FINAL CONSIDeRAtIONS
This article used data envelopment analysis (DEA) to estimate the efficiency of higher standard hotel companies (4 and 5 stars) in the Algarve region, Portugal. This region is one of the most touristic areas of Europe and the most important of Portugal, being therefore very relevant to assess its performance.
Two models were used, one based on variables with quantitative units (model M1) and the other with monetary units (model M2).
Comparing the results of the two models, it is verified that the model M2 has higher levels of efficiency in CRS (TE) and VRS (SE) in both input and output orientations, the opposite being verified with VRS (PTE) for the model M1. This means that the use of variables with monetary units (other costs, personnel costs and capital costs) in this application suggests a more productive use of the resources adopted (inputs and outputs) tending to operate closer to the frontier.
The lowest number of inputs used in model M2 also suggests higher efficiency levels
(Brida et al., 2011) and the advantage of using these inputs (financial) lies in the fact that cost levels are similar among hotels from the database. The nature of DEA methodology suggests that estimatives of efficiency are based on the input-output comparison in relation to a subset of efficient organizations, being highly sensitive to changes and to the nature of the data.
Peers (reference-pairs) have a higher expression in the model M2 in input CRS and VRS. “Other costs” shows, in general, higher values of slacks with a higher expression in VRS, which would also be expected given its greater variation.
The question that is placed, i.e., knowing what is the best model, will suggest a difficult answer, since these are two resource approaches different in general, two different starting points to the same point of arrival.
Explanations for efficiency differences of results are related to the quality of management, specifically its style and its good or bad practices, organizational culture, poor use of infrastructure (low season), seasonality in itself and contextual and institutional environments. In short, the

801
Rev. bus. manag., São Paulo, Vol. 17, No. 54, pp. 788-805, Jan./Mar. 2015
Efficiency Evaluation of Portuguese Hotels in the Algarve using Data Envelopment Analysis (DEA)
choice of inputs and outputs, as well as orientation or adopted technology, does not fully explain the results. However, it allows its quantification.
As the main limitation of this study, the sample used corresponds to only 33.2% of Algarve hotels and therefore it would be preferable that the dimension was greater and more representative. Unfortunately, more data were not available. For future research, analyses using DEA extensions and its comparison with the use of parametric tools, such as stochastic frontiers, are suggested.
ReFeReNCeS
Amado, C., & Dyson, R. (2003). On comparing the performance of primary care providers. European journal operational research, 185(3), 915-932. doi: 10.1016/j.ejor.2006.02.052
Andersen, P., & Petersen, N. (1993). A procedure for ranking efficient units in data envelopment analysis. Management Science, 39(10), 1261-1264. doi: 10.1287/mnsc.39.10.1261
Anderson, R., Fok, R., & Scott, J. (2000). Hotel industry efficiency: an advanced programming examination. American Business Review, 18(1), 40-48.
Assaf, A., & Cvelbar, L. (2010). The performance of the Slovenian hotel industry: evaluation post-privatization. International Journal of Tourism Research, 12(5), 462-471. doi: 10.1002/jtr.765
Banker, R., Charnes, A., & Cooper, W. (1984). Some models for the estimation of technical and scale inefficiencies in data envelopment analysis. Management Science, 30, 1078-1092. doi: 10.1287/mnsc.30.9.1078
Barros, C. (2005). Measuring efficiency in the hotel sector. Annals of Tourism Research, 32(2), 456-477. doi: 10.1016/j.annals.2004.07.011
Barros, C., & Mascarenhas, M. (2005). Technical and allocative efficiency in a chain of small hotels. International Journal of Hospitality and
Management, 24(3), 415-436. doi: 10.1016/j.ijhm.2004.08.007
Barros, C., & Santos, C. (2006). The measurement of efficiency in Portuguese hotels with DEA. Journal of Hospitality and Tourism Research, 30(3), 378-400. doi: 10.1177/1096348006286798
Barros, C., Botti , L. , Peypoch, N., & Solonandrasana, B. (2011). Managerial efficiency and hospitality industry: the Portuguese case. Applied Economics, 43(22), 2895-2905. doi: 10.1080/00036840802600145
Brida J., Detotto, C., & Pulina, M. (2011). How efficient is the Italian hospitality sector? A window DEA and truncated-Tobit analysis. [Working Paper CRENoS 20110]. Centre for North South Economic Research, University of Cagliari and Sassari, Sardinia.
Charnes, A., & Cooper, W. (1962). Programming with linear fractional functionals. Naval Research Logistics Quarterly, 9(3-4), 181-186. doi: 10.1002/nav.3800090303
Charnes, A., Cooper, W., & Rhodes, E. (1978). Measuring the efficiency of decision making units. European Journal of Operational Research, 2(6), 429-441. doi: 10.1016/0377-2217(78)90138-8
Chen, Y., Liang, L., Yang, F., & Zhu, J. (2006). Evaluation of information technology investment: a data envelopment analysis approach. Computers Operational Research, 33(5), 1368-1379. doi: 10.1016/j.cor.2004.09.021
Chiang, W., Tsai, M., & Wang, L. (2004). A DEA evaluation of Taipei hotels. Annals of Tourism Research, 31(3), 712-715. doi: 10.1016/j.annals.2003.11.001
Claver-Cortés, E., Molina-Azorín, J., & Pereira-Moliner, J. (2006). Strategic groups in the hospitality industry: intergroup and intragroup performance differences in Alicante, Spain. Tourism Management, 27(6), 1101-1116. doi: 10.1016/j.tourman.2005.11.006

802
Rev. bus. manag., São Paulo, Vol. 17, No. 54, pp. 788-805, Jan./Mar. 2015
Ricardo Samuel Lisboa Pereira Oliveira / Maria Isabel Craveiro Pedro / Rui Domingos Ribeiro da Cunha Marques
Coelli, T., Rao, P., & Battese, G. (1998). An introduction to efficiency and productivity analysis. Boston: Kluver Academic Publishers.
Cooper, W., Seiford, L., & Tone, K. (2000). Data Envelopment Analysis: a comprehensive text with models, applications, references and DEA-Solver Software. Boston: Kluwer Academic Publishers.
De Witte, K., & Marques, R. (2010). Designing performance incentives, an international benchmark study in the water sector. Central European Journal of Operation Research, 18(2), 189-220. doi: 10.1007/s10100-009-0108-0
Farrell, M. (1957). The measurement of productive efficiency. Journal of the Royal Statistical Society, 120(3), 253-281.
Fayos, E. (1996). Tourism policy: a midsummer night’s dream? Tourism Management, 17(6), 405-412. doi: 10.1016/0261-5177(96)00061-1
Haas, D. (2003). Productive efficiency of english football teams: a data envelopment analysis approach. Managerial and decision economics, 24(5), 403-410. doi: 10.1002/mde.1105
Holjevac, I. (2003). A vision of tourism and the hotel industry in the 21st Century. International Journal of Hospitality Management, 22(2), 129-134. doi: 10.1016/S0278-4319(03)00021-5
Hsieh, L., & Lin, L. (2010). A performance evaluation model for international tourist hotels in Taiwan: an application of the relational network DEA. International Journal of Hospitality Management, 29(1), 14–24. doi: 10.1016/j.ijhm.2009.04.004
Hwang, S., & Chang T. (2003). Using data envelopment analysis to measure hotel managerial efficiency change in Taiwan. Tourism Management, 24(4), 357-369. doi: 10.1016/S0261-5177(02)00112-7
Instituto Nacional de Estatística. (2012). Estatística do turismo - 2011. Recuperado de http://www.ine.pt/xportal/xmain?xpid=INE&xpgid=ine_
publicacoes&PUBLICACOESpub_boui=143016014&PUBLICACOESmodo=2
Johns, N., Howcroft, B., & Drake, L. (1997). The use of Data Envelopment Analysis to monitor hotel productivity. Progress in Tourism and Hospitality Research, 3(2), 119-127. doi: 10.1002/(SICI)1099-1603(199706)3:2<119::AID-PTH74>3.3.CO;2-U
Kumar, S., & Gulati, R. (2008). Evaluation of technical efficiency and ranking of public sector banks in India: an analysis from cross-sectional perspective. International Journal of Productivity and Performance Management, 57(7), 540-568. doi: 10.1108/17410400810904029
Leibenstein, H. (1966). Allocative efficiency vs X-efficiency. American Economic Review, 56(3), 392-414.
Marques, R. (2006). A yardstick competition model for Portuguese water and sewerage services regulation. Utilities Policy, 14(3), 175-184. doi: 10.1016/j.jup.2006.03.004
Marques, R., & Silva, D. (2006). Inferência estatística dos estimadores de eficiência obtidos com a técnica fronteira não paramétrica de DEA: uma metodologia de Bootstrap. Investigação Operacional, 26(1), 89-110.
Marques, R., & Simões, P. (2009). Incentive regulation and performance measurement of the Portuguese solid waste management services. Waste Management & Research, 27(2)188-196. doi: 10.1177/0734242X08095025
Mcintosh, R., & Goeldner, C. (1986). Tourism: principles, practices, philosophies. (5th ed.). New York: Willey.
Morey, R., & Dittman, D. (1995). Evaluating a hotel GM’s performance: a case study in benchmarking. Cornell Hotel and Restaurant Administration Quarterly , 36(5), 30-35. doi: 10.1016/S0010-8804(03)90107-8

803
Rev. bus. manag., São Paulo, Vol. 17, No. 54, pp. 788-805, Jan./Mar. 2015
Efficiency Evaluation of Portuguese Hotels in the Algarve using Data Envelopment Analysis (DEA)
Sigala, M., Jones, P., Lockwood, A., & Airey, D. (2005). Productivity in hotels: a stepwise Data Envelopment Analysis of hotels’ rooms division processes. Service Industries Journal, 25(1), 61-81. doi: 10.1080/0264206042000302414
Smeral, E. (1998). The impact of globalization on small and medium enterprises. New challenges for tourism policies in European Countries. Tourism Management, 19(4), 371-380. doi: 10.1016/S0261-5177(98)00036-3
Tavares, G. (2002, January). A bibliography of Data Envelopment Analysis (1978-2001) (Rutcor Research Report RRR 01-02), New Jersey, RUTCOR, Rutgers Center for Operations Research, Rutgers University.
Thanassoulis, E. (2001). Introduction to the theory and application of Data Envelopment Analysis: a foundation text with integrated software. Dordrecht: Kluwer Academic Publishers.
Tumer, N. (2008). Measuring efficiency of hotel industry in Turky using Data Envelopment Analysis (Doctoral thesis). Avrupa Birli’i Enstitüsü, Marmara Universitesi, Kadıköy, İstanbul, Türkiye.
Tyagi, P., Yadav, S., & Singh, S. (2009). Relative performance of academic departments using DEA with sensitivity analysis. Evaluation and Program Planning, 32(2), 168-177. doi: 10.1016/j.evalprogplan.2008.10.002

804
Rev. bus. manag., São Paulo, Vol. 17, No. 54, pp. 788-805, Jan./Mar. 2015
Ricardo Samuel Lisboa Pereira Oliveira / Maria Isabel Craveiro Pedro / Rui Domingos Ribeiro da Cunha Marques
ANNeX A – Hotel companies and hotels that they own
Company no. Company hotels No. of
Stars
1 Júpiter Investimentos, S.A. Hotel Júpiter 4
2 Sociedade Hotel da Rocha, S.A. Hotel da Rocha 4
3 Lunahoteis – Empreendimentos e Investimento Hoteleiro, S.A.
Luna Hotel Luz Bay 4
Olympus Vilamoura Hotel 4
Luna Alvor Village 4
Luna Olympus Vilamoura Suites 4
4 Solpleno – Hotelaria e Turismo, S.A.
Hotel Sol e Mar 4
Aura Mar Beach Resort 4
Vila Recife Hotel 4
5 Varandoteis – Gestão de Estabelecimentos Hoteleiros, Lda
Hotel Paraiso 4
Hotel Balaia Atlântico 4
Hotel Porta Nova 4
6 FSCC – Gestão e Exploração Turística, SU, Lda Four Seasons Club Hotel 4
7 Sociedade Hoteleira da Balaia, S.A. Balaia Golf Hotel 4
8 Sociedade de Gestão Financeira Central da Oura, Lda
Hotel Praia Oura 4
Oura Praia Hotel & SPA 4
Oura View Beach Hotel 4
9 Convau – Construções do Vau, Lda Vau Hotel 4
Vau Beach Hotel 4
10 Dom Pedro – Investimentos Turisticos, S.A.
Dom Pedro Golf Resort 4
Dom Pedro Marina 4
Dom Pedro Portobel 4
Dom Pedro Meia Praia Beach Hotel 4
11 RIUSA II, S.A. (Sucursal Portugal), Lda Hotel Riu Palace Algarve 4
12 Marinoteis - Sociedade de Promoção e Construção de Hotéis, S.A.Tivoli Carvoeiro Hotel 4
The Residence at Victoria Hotel 4
13 LTI - Alfamar Hotel, S.A.Hotel Alfamar 4
Hotel Algarve Garden 4
14 Forte de S. João –Sociedade Imobiliária e Turística, S.A. Monica Isabel Beach Club Hotel 4
15 Salvor – Sociedade de Investimentos Hoteleiros, S.A.
Pestana Viking Resort 4
Pestana Palm Gardens 4
Pestana Levante 4
Pestana Dom João II 4
Pestana Dom João Villas 4
Pestana Alvor Hotel 4
Pestana Delfim 4
16 ADMITUR - Administração de Apartamentos Turísticos, LDA.Hotel Real Bella Vista 5
Grand Hotel Real Santa Eulália 5
17 Sociedade Turística da Penina, S.A. Le Meridien Penina Resort & Golfe 5
18 LUSOTEL – Indústria Hoteleira, Lda Hotel D. Filipa 5
19 Hotelagos, S.A.Hotel Tivoli Lagos 5
Hotel Tivoli Marina 5
20 Soc. de Investimentos Imobiliários da Praia da Rocha, SA. Algarve Casino Hotel 5

805
Rev. bus. manag., São Paulo, Vol. 17, No. 54, pp. 788-805, Jan./Mar. 2015
Efficiency Evaluation of Portuguese Hotels in the Algarve using Data Envelopment Analysis (DEA)
Company no. Company hotels No. of
Stars
21 Montechoro – Empresa de Investimentos Turísticos, S.A. Hotel Montechoro 5
22 Prifalésia – Construção e Gestão de Hotéis, S.A. The Lake Resort 5
23 Marope Algarve – Hotéis de Portugal, S.A.Vilamoura Beach Hotel 5
Hotel Atlantis Vilamoura 5
24 Vale do Garrão – Urbanização e Construção, LDA
Ria Park Hotel & SPA 5
Ria Park Garden Hotel 5
Vale Garrão Villas Hotel 5
25 Grampiam – Investimentos Hoteleiros, S.A. Hotel Quinta do Lago 5
26 Monte da Quinta Club - Atividades Hoteleiras, S.A.Monte da Quinta Hotel 5
Monte da Quinta Suites 5
27 United Investments (Portugal), Empreendimentos Turísticos, S.ASheraton Algarve Hotel 5
Pine Cliffs Resort Hotel 5
28 Vila Vita (Portugal)-Atividades Turísticas e Hoteleiras, LDA. Vila Vita Park 5