Role of Graphene Oxide on the Mechanical Behaviour of ...
14
DOI: https://doi.org/10.1590/1980-5373-MR-2020-0586 Materials Research. 2021; 24(3): e20200586 Role of Graphene Oxide on the Mechanical Behaviour of Polycarbonate-Urethane/ Graphene Oxide Composites L. M. D. Maestrelli a , H. T. T. Oyama b , P. A. R. Muñoz a , I. A. Cestari b , G. J. M. Fechine a* a Universidade Presbiteriana Mackenzie, Mackenzie Instituto de Pesquisa em Grafeno e Nanotecnologias, São Paulo, SP, Brasil b Universidade de São Paulo, Faculdade de Medicina, Hospital das Clínicas - HCFMUSP, Instituto do Coração, Laboratório de Bioengenharia, São Paulo, SP, Brasil Received: December 22, 2020; Revised: February 19, 2021; Accepted: April 01, 2021 A new generation of carbon-based materials such as graphene and graphene oxide (GO) have been widely studied due to their potential in a variety of applications including biomedical materials and devices. This work investigates the appropriate GO morphology and content to be used as a filler for a poly(carbonate urethane) (PCU) polymer in order to mechanical properties improvements. Two graphene oxides with different levels of oxidation and morphology were blended into a PCU matrix to obtain high mechanical performance and good flexibility. Nanocomposites of PCU and GO were produced with a filler content of 0.2 wt%, 0.4 wt%, and 2.0 wt%. Polymeric membranes were obtained using solvent evaporation and characterised by their thermal properties (Differential Scanning Calorimetry), thermo-mechanical (Dynamic-Mechanical Thermal Analysis), and mechanical test results (tensile). The results indicated that GO platelets tend to interact strongly with the hard segments (HS) of PCU chains due to the polar chemical similarity of GO and HS structures. Two mechanical behaviours were found for the PCU/GO-2 nanocomposites, at small and large deformations. Improvements in the Secant Modulus and values of stress until 350% of strain are observed for low filler content while high filler content is needed for improvements at break point (stress and strain). PCU/GO nanocomposites with high mechanical performance can be produced by adjusting the GO content and characteristics to reach different application possibilities. Keywords: Poly(carbonate urethane), graphene oxide, biomaterial, mechanical performance. 1. Introduction Carbon-based materials such as solid carbons include a wide range of disordered anisotropic crystalline network structures with a high level of hydrogen and oxygen content to progressively more pure orderly materials such as coal families and perfectly organised materials such as graphite and graphene 1 . The first experimental research on graphene was published by researchers, Kostya Novoselov and André Geim, at the University of Manchester in 2004 2 culminating in the Nobel Prize in Physics in 2010 due to their research. Graphene is a nanomaterial arranged in a two-dimensional layer of carbon atoms with sp 2 hybridization that are connected in a hexagonal lattice structure, with superlative properties: high surface area (2630 m 2 g -1 ), Young’s modulus (~ 1.0 TPa), and thermal conductivity (5000 W / m K at 25 °C) leading to the replacement of conventional materials and promoting the exploration of its intense potential in diverse fields 3,4 . Applications of graphene and its derivatives have emerged in several areas including graphene-coated substrates for stem cell differentiation, biosensors, cartilage repairs, flexible electronics, light-emitting diodes, water purification membranes, and high-performance polymer nanocomposites for the industry in general and medical applications 5-12 . Graphene is part of a vast family of nanomaterials produced from graphite when up to 10 layers are stacked, formed by hexagonally arranged aromatic carbons 13 . ISO / TS 80004-13: 2017 standardises the terminology for graphene and its derivatives. According to ISO / TS 80004-13: 2017 13 , these derivatives include graphene oxide (GO) and reduced graphene oxide (rGO). GO is normally defined as a chemically modified graphene, prepared by the extensive oxidation of its plane. rGO is a form of graphene oxide with reduced oxygen content. Graphene and its derivatives (rGO and GO) are materials that have unique properties, primarily very high mechanical and tear strength, lightness, flexibility, excellent thermal conductivity, and some possess high electrical conductivity (graphene and rGO). However, the loss of GO electrical properties in relation to graphene and rGO is due to the introduction of oxygenated groups in its structure and the reduced aromaticity resulting in a semiconductor material sometimes classified as an insulator 14-16 . Graphene is equipped with a system of connected π orbitals with delocalized electrons, which creates surface that does not allow good interface adhesion. There is also a huge difference in surface energy between polymer matrix and graphene, leading to the agglomeration of this nanoparticle 17 . This agglomeration is also supported by the planar morphology of the nanoparticles. The functional groups present in GO increase its surface energy, reducing the effects of chemical inertia facilitating dispersion in many polymeric matrices. GO has abundant oxygen in its structure, *e-mail: [email protected]
Transcript of Role of Graphene Oxide on the Mechanical Behaviour of ...
DOI: https://doi.org/10.1590/1980-5373-MR-2020-0586Materials Research. 2021; 24(3): e20200586
Role of Graphene Oxide on the Mechanical Behaviour of Polycarbonate-Urethane/Graphene Oxide Composites
L. M. D. Maestrellia, H. T. T. Oyamab, P. A. R. Muñoza, I. A. Cestarib, G. J. M. Fechinea*
aUniversidade Presbiteriana Mackenzie, Mackenzie Instituto de Pesquisa em Grafeno e Nanotecnologias, São Paulo, SP, Brasil
bUniversidade de São Paulo, Faculdade de Medicina, Hospital das Clínicas - HCFMUSP, Instituto do Coração, Laboratório de Bioengenharia, São Paulo, SP, Brasil
Received: December 22, 2020; Revised: February 19, 2021; Accepted: April 01, 2021
A new generation of carbon-based materials such as graphene and graphene oxide (GO) have been widely studied due to their potential in a variety of applications including biomedical materials and devices. This work investigates the appropriate GO morphology and content to be used as a filler for a poly(carbonate urethane) (PCU) polymer in order to mechanical properties improvements. Two graphene oxides with different levels of oxidation and morphology were blended into a PCU matrix to obtain high mechanical performance and good flexibility. Nanocomposites of PCU and GO were produced with a filler content of 0.2 wt%, 0.4 wt%, and 2.0 wt%. Polymeric membranes were obtained using solvent evaporation and characterised by their thermal properties (Differential Scanning Calorimetry), thermo-mechanical (Dynamic-Mechanical Thermal Analysis), and mechanical test results (tensile). The results indicated that GO platelets tend to interact strongly with the hard segments (HS) of PCU chains due to the polar chemical similarity of GO and HS structures. Two mechanical behaviours were found for the PCU/GO-2 nanocomposites, at small and large deformations. Improvements in the Secant Modulus and values of stress until 350% of strain are observed for low filler content while high filler content is needed for improvements at break point (stress and strain). PCU/GO nanocomposites with high mechanical performance can be produced by adjusting the GO content and characteristics to reach different application possibilities.
Keywords: Poly(carbonate urethane), graphene oxide, biomaterial, mechanical performance.
1. IntroductionCarbon-based materials such as solid carbons include
a wide range of disordered anisotropic crystalline network structures with a high level of hydrogen and oxygen content to progressively more pure orderly materials such as coal families and perfectly organised materials such as graphite and graphene1. The first experimental research on graphene was published by researchers, Kostya Novoselov and André Geim, at the University of Manchester in 20042 culminating in the Nobel Prize in Physics in 2010 due to their research. Graphene is a nanomaterial arranged in a two-dimensional layer of carbon atoms with sp2 hybridization that are connected in a hexagonal lattice structure, with superlative properties: high surface area (2630 m2 g-1), Young’s modulus (~ 1.0 TPa), and thermal conductivity (5000 W / m K at 25 °C) leading to the replacement of conventional materials and promoting the exploration of its intense potential in diverse fields3,4. Applications of graphene and its derivatives have emerged in several areas including graphene-coated substrates for stem cell differentiation, biosensors, cartilage repairs, flexible electronics, light-emitting diodes, water purification membranes, and high-performance polymer nanocomposites for the industry in general and medical applications5-12.
Graphene is part of a vast family of nanomaterials produced from graphite when up to 10 layers are stacked,
formed by hexagonally arranged aromatic carbons13. ISO / TS 80004-13: 2017 standardises the terminology for graphene and its derivatives. According to ISO / TS 80004-13: 201713, these derivatives include graphene oxide (GO) and reduced graphene oxide (rGO). GO is normally defined as a chemically modified graphene, prepared by the extensive oxidation of its plane. rGO is a form of graphene oxide with reduced oxygen content. Graphene and its derivatives (rGO and GO) are materials that have unique properties, primarily very high mechanical and tear strength, lightness, flexibility, excellent thermal conductivity, and some possess high electrical conductivity (graphene and rGO). However, the loss of GO electrical properties in relation to graphene and rGO is due to the introduction of oxygenated groups in its structure and the reduced aromaticity resulting in a semiconductor material sometimes classified as an insulator14-16. Graphene is equipped with a system of connected π orbitals with delocalized electrons, which creates surface that does not allow good interface adhesion. There is also a huge difference in surface energy between polymer matrix and graphene, leading to the agglomeration of this nanoparticle17. This agglomeration is also supported by the planar morphology of the nanoparticles. The functional groups present in GO increase its surface energy, reducing the effects of chemical inertia facilitating dispersion in many polymeric matrices. GO has abundant oxygen in its structure, *e-mail: [email protected]
Maestrelli et al.2 Materials Research
mainly from the hydroxyl functional groups, epoxy groups on the basal plane, and carbonyl and carboxyl groups on the side vertices. The presence of functional groups containing oxygen in graphene oxide (GO), which are highly polar and reactive promote interaction and compatibility with polar polymeric matrices14.
GO is currently preferred for the manufacture of nanocomposites with various polymers such as polyethylene terephthalate (PET), poly (L-lactic acid) (PLLA), polyacrylamide (PAM), epoxy resin, poly (vinyl alcohol) (PVA), poly (methyl methacrylate) (PMMA), polypropylene (PP), poly(ethylene), and polyurethane elastomers such as poly(carbonate-urethane) (PCU)17-23. Common processing techniques, such as melt compounding, solution mixing, in-situ polymerisation, and latex mixing have been widely used for the fabrication of GO-polymer nanocomposites24-26.
The PU elastomers are considered the materials that present the best biological and mechanical performance when compared with other medical grade biostable polymers27-30. Medical-grade PU and PCU are not biodegradable and have been applied in the manufacture of a wide range of biomedical devices, such as: vascular grafts and patches, cardiac-assist pumps, bladders and tubing, catheters, heart valves, blood bags and closure fittings, hemodialysis-tubing, heart pacemaker-connectors, coatings, insulators, fixation devices, and endotracheal tubes. The durability, biocompatibility, and biostability characteristics, as well as excellent flexural strength, impact resistance, and high resilience properties are essential for these devices. However, the chemical composition (hard and soft segment contents) and the resulting morphology determines the biostability of polyurethanes. Due to the difference in the chemical structure between the rigid or hard (HS) and flexible or soft (SS) chain segments present, phase separation in polyurethane easily occurs due to the immiscibility of the soft and rigid microphases. The rigid segments then form microdomains due to mutual attraction involving intermolecular hydrogen bonds and provides cohesive strength to the segmented PU. Although a wide range of PU types are produced by the combination of diisocyanates, chain extenders, and macrodiols only a few grades are stable in the biological environment and allowed to be used for implantable medical applications31. The requirements for most of these applications are to combine soft formulations for easy handling, good mechanical properties, hydrolytic and oxidative stability to prevent degradation, and the consequent leaking of toxic substances into the body. Sometimes, soft formulations and high mechanical performance of medical-grade PU are conflicting requirements, and it may represent a limitation on the use of polyurethane, especially for long term applications and when resistance to dynamic stress is mandatory as in the case of pulsatile devices.
Due to the characteristics of GO and PU, nanocomposites based on these materials are strong candidates to be used in biomedical devices when mechanical strength is required without drastically reducing the original flexibility of the matrix. Very few articles have been dedicated to the study of nanocomposites based on PCU and GO, however, the articles found in the specialized literature are dedicated to the use of high content of fillers or do not assess the real influence
of the GO in the morphological structure of the segments present in the PCU and its consequences on mechanical and/or themal properties of the nanocomposites32,33. The main goal of this work is to evaluate the impact on thermo and thermo-mechanical properties as well as the tensile properties of a soft formulation of medical grade poly(carbonate urethane) (PCU) when two distinct GOs with different levels of oxidation and morphology (number of layers and lateral size) are added using the solution blending process. Correctly choosing the GO characteristics (purity, level of oxidation, and aspect ratio) can be crucial in achieving the best performance of the nanocomposite, thus being able to move towards the design of cardiovascular devices. To be suitable for this, GOs were prepared using a modified Hummers method applying two different oxidation times. The nanocomposites using PCU as a matrix were prepared using two types of GO with three different filler concentrations: 0.2wt%, 0.4wt%, and 2.0wt%. The physical-chemical characterisation of GO (X-ray diffraction – DRX, Thermogravimetric Analysis - TGA, Raman Spectroscopy, Infrared Spectroscopy, X-ray photoelectron spectroscopy – XPS, and Atomic Force Microscopy - AFM) is presented to show the oxidisation level and morphological characteristics of the nanoparticles.
Differential Scanning Calorimetry - DSC, thermo-mechanical behaviour (Dynamic Mechanical Analysis - DMA), and uniaxial mechanical properties (tensile test), Optical Microscopy (OM), and Transmission Electron Microscopy (TEM) were used to evaluate the properties of polymer nanocomposites (PCU-GO) and compare to neat polymer (PCU).
2. Experimental
2.1. Graphite oxidation synthesisGraphite powder was oxidised using a modified Hummers
method3,34-36. For the first synthesis of graphite oxide, H2SO4 was slowly added to graphite (Sigma-Aldrich powder ref. 496596, size < 45 μm, purity ≥ 99.99% trace metals basis), under moderate magnetic stirring in an ice bath, followed by the gradual addition of potassium permanganate (KMnO4) at a ratio of 1:3,5 (graphite bulk to KMnO4). The ice bath was removed, and the mixture was left under stirring for two and a half hours at room temperature (this sample was named GrO-2). A second batch of graphite oxide was prepared with a modified oxidation reaction time, increased from two and a half hours to 4 hours; this sample was named GrO-4. During this second GrO production, the oxidising agent was slowly added and for 30 minutes; twice the time when compared to the GrO-2 preparation. The next step was the addition of deionised water, an aqueous solution of H2O2 (30%) and again the reactions were conducted under low temperature (in an ice bath) and mild stirring for another 15 min. The ice bath was then removed, and the system was left to sediment overnight. The supernatant excess, containing inorganic salts was removed. To remove water-soluble impurities from the precipitated samples, they were suspended in deionised water and then centrifuged for 5 min at 2,000 rpm; this process was repeated until the water ran clear. Then the graphite oxides were washed by filtering, following this sequence of solvents: aqueous HCl solution (20%), ethanol, acetone,
3Role of Graphene Oxide on the Mechanical Behaviour of Polycarbonate-Urethane/Graphene Oxide Composites
and deionised water. The sediment was dried in an air oven for 24 h at 80° C.
2.2. Nanocomposite production (Solution blending)
Chronoflex® AR/LT resin from Advan Source Biomaterials Corporation was used as a polymeric matrix for solution blending with synthesised graphene oxides, GO-2 and GO-4. The thermoplastic poly(carbonate urethane) (PCU) resin Chronoflex® AR/LT is medical-grade available in solution, containing a final solid concentration of 22 wt% supplied in a dimethylacetamide (DMAc) solvent. GO dispersions in PCU was also conducted in DMAc via solvent blending. Firstly, GrO powder was dispersed in DMAc using an ultrasound bath for 1 hour at room temperature in a 300 W power ultrasound Elmasonic P model at an amplitude of 100% and a frequency of 37 kHz. After that, the PCU solution was slowly added to the GrO/DMAc dispersion; the mixture was sonicated for an additional 2h. The GrOs (2 and 4) weight and PCU/DMAc solution volume were incorporated into the mixtures to prepare nanocomposites with final concentrations of 2.0 wt%, 0.4 wt%, and 0.2 wt%. The nanocomposites were obtained by casting, producing thin membranes with 0.6 mm thickness. Membranes were built layer by layer (12 layers to reach a thickness of 0.6 mm) in a constant temperature of 57 °C and a controlled atmosphere in a cleanroom. For proper solvent evaporation, the membranes were dried in a circulating air oven at 80 °C overnight. Then the membranes were boiled in deionised water for about 1h to remove solvent residues and dried again in an air circulating oven for ~ 4 h at 80 ° C. These membranes were later used for nanocomposite characterisation.
2.3. Characterisation of graphite oxide (Gr-O) and graphene oxide (GO)
a) Xray Diffraction (XRD): Gr-O XRD characterisation was performed on a Rigaku MiniFlex II diffractometer with CuKα radiation (λ = 1,42 Å). Data was collected using 2θ from 1.5 ° to 80 ° and a scan rate of 2 °/min.
b) Thermogravimetric Analysis (TGA): Analyses were performed on a TA Instruments model SDT Q600. The heating profile registered from 0 to 800 °C at the rate of 5 °C/min under an inert nitrogen atmosphere (flow rate = 100 mL/min).
c) Infrared spectroscopy: Transmission FTIR spectra were performed using a Shimadzu spectrophotometer, model IRAffinity-1. Accumulations of 50 spectra were collected from 4000 to 400 cm-1 for each measurement. Tablets were made from a mixture of 1 mg of Gr-O and 200 mg of KBr were used for the analyses after being pressed under an 80KN vacuum for 10 minutes. KBr was previously dried at 300 °C for 1 day; Gr-O powder samples were dried in a vacuum oven at 60 °C for 3 hours.
d) Raman spectroscopy: Analyses were performed on a WiTec Alpha 300R confocal Raman spectrometer. A 532 nm wavelength laser (green laser) with a power of 1 mW was used. The GO dispersions were deposited on a silicon wafer, and at least 10 spectra from different regions were collected. The
ID/IG ratio was calculated based on the D and G band intensities obtained by deconvolution of the Raman spectrum.
e) X ray photoelectron spectroscopy (XPS): Samples were prepared from aqueous dispersions of GrO-2 and GrO-4 at a concentration of 1 mg/mL-, sonicated for 3h, dripped onto a silicon substrate and dried for 24 h in a laminar airflow booth at room temperature. Thermo Scientific equipment, model K-Alpha XPS was used for the analyses. The experiments were carried out with an Al-anode monochromatic X-ray source Kα = 1486 eV, 300 µm2 beam area, using 200 eV energy step for a wide scan spectra and 50 eV for high-resolution spectra (short scan). Resolutions of 1 eV for the wide scan and 0.01 eV for the short scan were used, with a power range of 0 to 1300 eV. The results were treated using the Oxford Instruments, Nanoanalysis software, HKL Channel 5, version 2010.
f) Atomic Force Microscopy (AFM): Drop casting of the GO dispersion was prepared on top of fresh mica and analysed in an Icon Dimension (Bruker) equipped with an RTESPA. In order to obtain a good statistic, more than 500 particles were counted and measured using Gwyddion Software.
g) Optical Microscopy: Neat PCU and all PCU/GO nanocomposites films sections were observed through Nikon, Eclipse optical microscope of transmitted light, and the particle size measurements were conducted using Gwyddion software.
h) Transmission Electron Microscopy (TEM): The nanocomposites films were punctured on disks 3.5 mm in diameter and exposed in 2mL of 1% aqueous osmium tetroxide (OsO4) solution and left for 1 hour in this solution. Aqueous washing solution based on sodium chloride was used to eliminate osmium excess. The specimens were then dehydrated in acetone baths and embedded in an araldite resin, dried in air circulating oven at 60°C for 72hrs. Ultrathin sections were obtained with a Reichert ultratome. Micrographs were obtained with a Jeol JEM 1010 electron microscope.
2.4. TPU/GO nanocomposites characterisationa) Differential scanning calorimetry (DSC): Samples
were cooled to -60 °C and maintained for 5 min at isotherm for stabilisation and then heated to 250 ° C, left again for 5 min and then cooled to room temperature (25 °C). The analyses were conducted under an inert atmosphere in the presence of nitrogen with a heating ramp of 10 °C/min. The calorimeter used was a DSC brand NETZSCH, model DSC 200 F3 Maia.
b) Dynamic mechanical thermal analysis (DMTA): Analysis was performed on a Perkin Elmer equipment, model DMA 8000. Samples were analysed from -135 to 5 °C at a heating rate of 2 °C/min. The amplitude and frequency of dynamic oscillatory loading were 50µm and 1 Hz, respectively. Samples
Maestrelli et al.4 Materials Research
(12mm x 6mm x 0.60mm) were analysed with a single cantilever loading mode.
c) Mechanical test: Tensile tests were performed according to ASTM D638 for neat PCU and PCU/GO nanocomposites. The specimens were stamped from thin membranes obtained by casting with thicknesses varying between 0.5-0.6 mm, length of 50 mm, and a width/thickness ratio of at least 8, according to ASTM D882. An Instron 3365 machine was used, with a 100 N load cell with an attached optical extensometer and a test speed of 25 mm/min.
3. Results and Discussion
3.1. Filler characterisationX ray diffraction (XRD) was used to assist in identifying
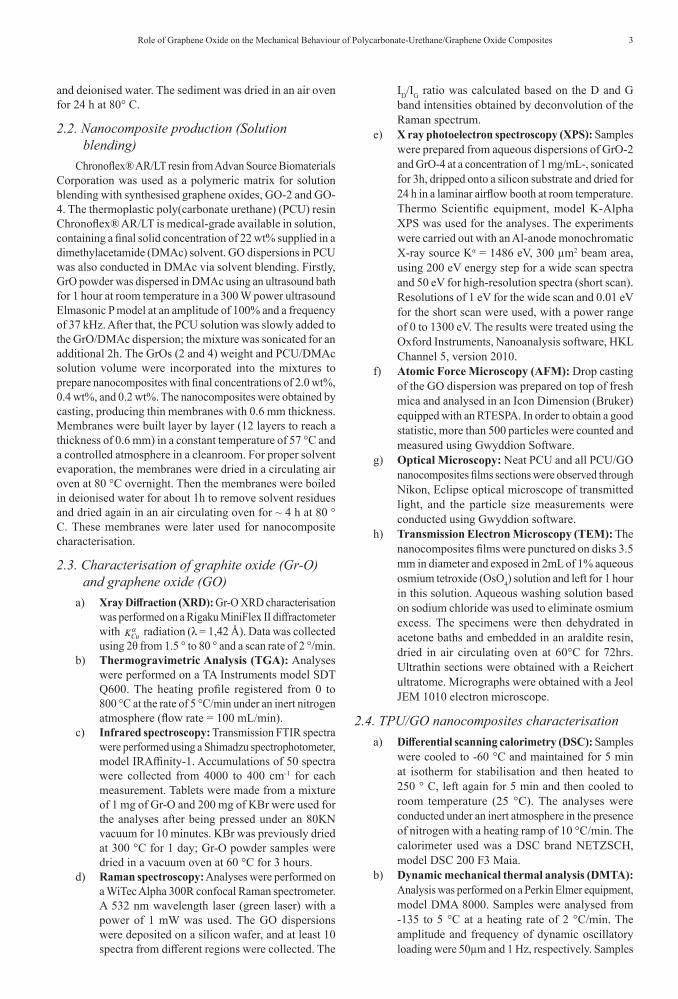
changes in carbon crystalline structure of pristine graphite after oxidation process. The Xray diffraction curves of graphite and graphite oxides are shown in Figure 1.
Figure 1 shows that graphite has a crystal structure with an intense narrow peak that is well defined at 26.4° referring to the plane (002) of the graphite structure (interplanar distance, d002 = 0.337nm). The intensity of the peak indicates high crystallinity37. Considering the crystalline plane (002), the GrO-2 and GrO-4 samples present a broad diffraction peak in the range of 20-25 °. The greater number of intercalated structures or functional groups present in GrO generated by the oxidation is one of the factors that determine the
diffraction curves with respect to prominent or widening peaks for structures that do not form a perfect crystal. When this occurs, the Bragg’s angle is more widely spread and the diffractogram of this type of sample results in broad peaks and poorly defined positions37-39. X ray diffraction patterns of GrOs indicate a reduction of peak intensities at 26.4 ° for both samples and also reveals peaks at 10.8 ° and 12.8°, for GrO-2 and GrO-4 respectively, referring to the crystalline plane (001). The interlayer spacing of 0.80 nm for GrO2 and 0.69 nm for GrO-4 was calculated using Bragg’s law for plane (001) and shows the greater expansion between crystalline planes that occurred for the structure of the GrO-2 sample. This peak is typical for graphite oxide and comes from the expansion of the basal plane’s distance that causes the Bragg angle displacement from 26.4° of the original graphite crystalline structure18,19,34,37. Higher displacement, better definition, and the higher distance of the basal planes were found at 2θ = 11° peak for GrO-2 than for GrO-4, strongly suggesting the GrO-2 possess a higher oxidisation level37,39. Also, the peak at 26.4° showed a significant reduction in its intensity for the GrO-2 diffractogram leading to the conclusion that only a few parts of the graphite were not altered. The diffraction curves of the oxidised samples were significantly different suggesting that longer chemical treatments (> = 4 hours) can generate a higher number of defects and a certain degree of structure amorphisation, as shown in the X ray diffraction pattern for GrO-4 with a peak around 2θ = 24° which was enlarged and less defined.
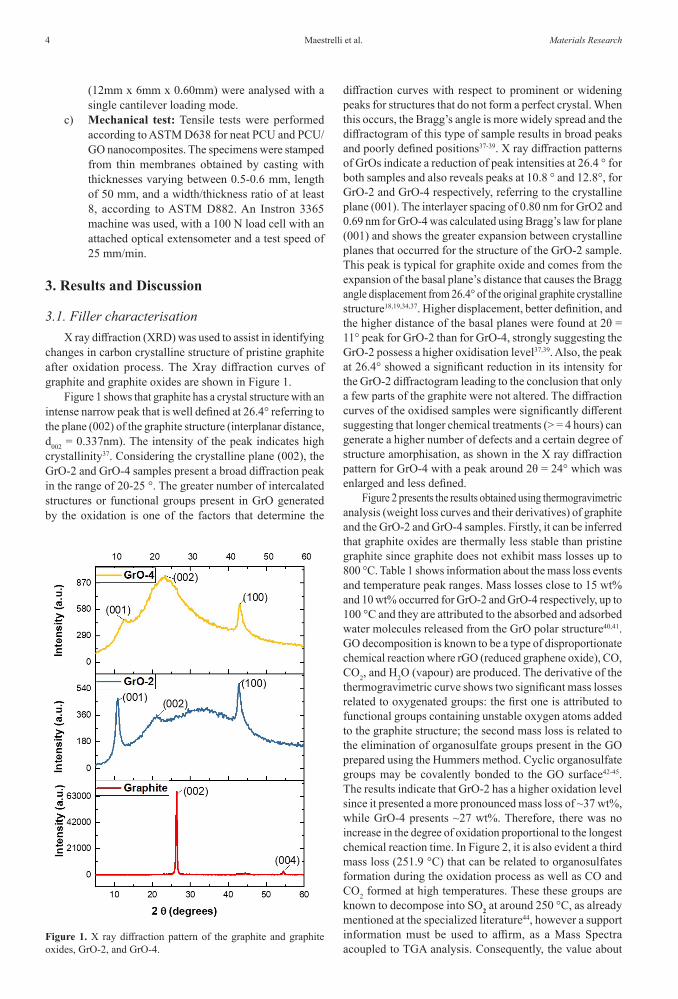
Figure 2 presents the results obtained using thermogravimetric analysis (weight loss curves and their derivatives) of graphite and the GrO-2 and GrO-4 samples. Firstly, it can be inferred that graphite oxides are thermally less stable than pristine graphite since graphite does not exhibit mass losses up to 800 °C. Table 1 shows information about the mass loss events and temperature peak ranges. Mass losses close to 15 wt% and 10 wt% occurred for GrO-2 and GrO-4 respectively, up to 100 °C and they are attributed to the absorbed and adsorbed water molecules released from the GrO polar structure40,41. GO decomposition is known to be a type of disproportionate chemical reaction where rGO (reduced graphene oxide), CO, CO2, and H2O (vapour) are produced. The derivative of the thermogravimetric curve shows two significant mass losses related to oxygenated groups: the first one is attributed to functional groups containing unstable oxygen atoms added to the graphite structure; the second mass loss is related to the elimination of organosulfate groups present in the GO prepared using the Hummers method. Cyclic organosulfate groups may be covalently bonded to the GO surface42-45. The results indicate that GrO-2 has a higher oxidation level since it presented a more pronounced mass loss of ~37 wt%, while GrO-4 presents ~27 wt%. Therefore, there was no increase in the degree of oxidation proportional to the longest chemical reaction time. In Figure 2, it is also evident a third mass loss (251.9 °C) that can be related to organosulfates formation during the oxidation process as well as CO and CO2 formed at high temperatures. These these groups are known to decompose into SO2 at around 250 °C, as already mentioned at the specialized literature44, however a support information must be used to affirm, as a Mass Spectra acoupled to TGA analysis. Consequently, the value about
Figure 1. X ray diffraction pattern of the graphite and graphite oxides, GrO-2, and GrO-4.
5Role of Graphene Oxide on the Mechanical Behaviour of Polycarbonate-Urethane/Graphene Oxide Composites
the percentage of mass loss event be the sum of everything (CO, CO2 and SO2 elimination). The extensive washing and centrifugation steps were not sufficient to eliminate these groups, leading to the belief that they are covalently linked to the structure of both GrOs and in a greater quantity for
the longest oxidation reaction time, ~17 wt% and ~10 wt%, for GrO-2 and GrO-4, respectively. All thermal events are summarised in Table 1.
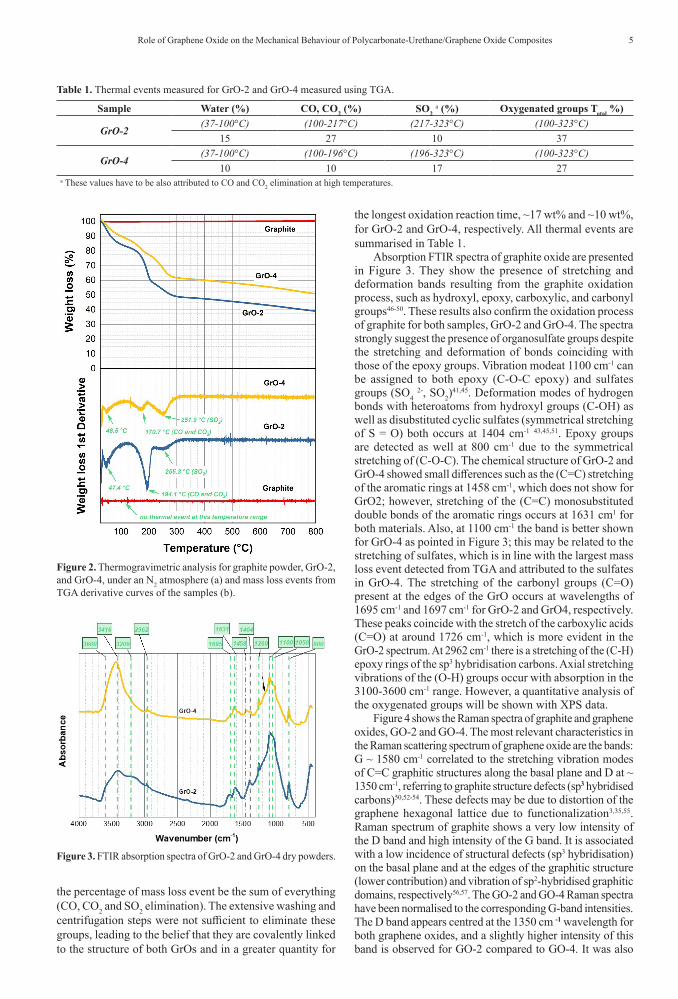
Absorption FTIR spectra of graphite oxide are presented in Figure 3. They show the presence of stretching and deformation bands resulting from the graphite oxidation process, such as hydroxyl, epoxy, carboxylic, and carbonyl groups46-50. These results also confirm the oxidation process of graphite for both samples, GrO-2 and GrO-4. The spectra strongly suggest the presence of organosulfate groups despite the stretching and deformation of bonds coinciding with those of the epoxy groups. Vibration modeat 1100 cm-1 can be assigned to both epoxy (C-O-C epoxy) and sulfates groups (SO4
2-, SO2)41,45. Deformation modes of hydrogen
bonds with heteroatoms from hydroxyl groups (C-OH) as well as disubstituted cyclic sulfates (symmetrical stretching of S = O) both occurs at 1404 cm-1 43,45,51. Epoxy groups are detected as well at 800 cm-1 due to the symmetrical stretching of (C-O-C). The chemical structure of GrO-2 and GrO-4 showed small differences such as the (C=C) stretching of the aromatic rings at 1458 cm-1, which does not show for GrO2; however, stretching of the (C=C) monosubstituted double bonds of the aromatic rings occurs at 1631 cm1 for both materials. Also, at 1100 cm-1 the band is better shown for GrO-4 as pointed in Figure 3; this may be related to the stretching of sulfates, which is in line with the largest mass loss event detected from TGA and attributed to the sulfates in GrO-4. The stretching of the carbonyl groups (C=O) present at the edges of the GrO occurs at wavelengths of 1695 cm-1 and 1697 cm-1 for GrO-2 and GrO4, respectively. These peaks coincide with the stretch of the carboxylic acids (C=O) at around 1726 cm-1, which is more evident in the GrO-2 spectrum. At 2962 cm-1 there is a stretching of the (C-H) epoxy rings of the sp3 hybridisation carbons. Axial stretching vibrations of the (O-H) groups occur with absorption in the 3100-3600 cm-1 range. However, a quantitative analysis of the oxygenated groups will be shown with XPS data.
Figure 4 shows the Raman spectra of graphite and graphene oxides, GO-2 and GO-4. The most relevant characteristics in the Raman scattering spectrum of graphene oxide are the bands: G ~ 1580 cm-1 correlated to the stretching vibration modes of C=C graphitic structures along the basal plane and D at ~ 1350 cm-1, referring to graphite structure defects (sp3 hybridised carbons)50,52-54. These defects may be due to distortion of the graphene hexagonal lattice due to functionalization3,35,55. Raman spectrum of graphite shows a very low intensity of the D band and high intensity of the G band. It is associated with a low incidence of structural defects (sp3 hybridisation) on the basal plane and at the edges of the graphitic structure (lower contribution) and vibration of sp2-hybridised graphitic domains, respectively56,57. The GO-2 and GO-4 Raman spectra have been normalised to the corresponding G-band intensities. The D band appears centred at the 1350 cm -1 wavelength for both graphene oxides, and a slightly higher intensity of this band is observed for GO-2 compared to GO-4. It was also
Figure 2. Thermogravimetric analysis for graphite powder, GrO-2, and GrO-4, under an N2 atmosphere (a) and mass loss events from TGA derivative curves of the samples (b).
Table 1. Thermal events measured for GrO-2 and GrO-4 measured using TGA.
Sample Water (%) CO, CO2 (%) SO2 a (%) Oxygenated groups Total %)
GrO-2(37-100°C) (100-217°C) (217-323°C) (100-323°C)
15 27 10 37
GrO-4(37-100°C) (100-196°C) (196-323°C) (100-323°C)
10 10 17 27a These values have to be also attributed to CO and CO2 elimination at high temperatures.
Figure 3. FTIR absorption spectra of GrO-2 and GrO-4 dry powders.
Maestrelli et al.6 Materials Research
possible to qualitatively estimate the defects in the structure, generated by the original graphite oxidation, calculating the ratio between the D and G bands. Value of ID/IG for GO-2 and GO-4 are 1.13 and 1.09, respectively. It may represent higher oxidation at the periphery of the graphene oxide sheet (this result is consistent with the XRD, TGA, and FTIR data presented) and/or due to the nanoplatelet’s smaller lateral sizes for GO-2 which generate more edges (sp3 hybridised carbons).
Functional groups added to the graphite structure after the oxidation process include hydroxyl (OH), epoxy (C–O–C), carbonyl (C=O), and carboxylic (HO–C=O) that dissociate with well-defined energies from the main structure, (C–C) and (C=C), in the XPS spectra58. Figure 5 shows the XPS survey spectra of the GO-2 and GO-4, showing that they are composed of carbon (C) and oxygen (O) elements, therefore,
traces of sulphur (S) can also be seen. This is a confirmation of the sulphur presence, however, as mentioned before from TGA results, the third mass loss event is not only attributed to SO2 elimination. The signal of S atoms indicates the presence of organosulfate groups. The atomic percentage of O obtained from the survey data is higher in GO-2 (38.3 at%) than in GO-4 (27.3 at%). Another elementar analysis the EDS X ray (Energy Dispersive X ray Spectroscopy) were also carried out and corroborates the XPS and the TGA results trend. The O/C ratio extracted from the XPS survey spectra (which is the ratio of the atomic percentage between the elements O 1s and C 1s) result is 0.77 for GO-2 confirming a higher oxidation level than found for GO-4 (0.39). As predicted in the TGA data, the presence of S atoms using XPS data was more intense for GO-4 (3.6 at%) than GO-2 (~ 1.0 at%). In order to confirm these results Energy Dispersive X ray (EDX) analysis were carried out with the GO-2 and GO-4 samples (Supplementary Information). Beyond C and O, the results confirm the presence of S in both samples, 1.5 at% and 1.7 at% for GO-2 and GO-4, respectively. The the atomic percentages of oxygen for both samples from EDS X ray data are lower (GO-2 = 30.2 at% and GO-4 = 22.9 at%) than ones calculated by XPS survey data resulting also in different values of O/C ratio (GO-2 = 0.5 and GO-4 = 0.3). The trend is keeping the same, GO-2 is more oxidized than GO-4, however, the oxygen amount was superstimated by XPS analysis, probably due to the substrate interference, silicon wafer with a thin oxydized layer.
The XPS C 1s emission for high resolution spectrum (Figure 6a) of GO-2 shows two main peaks at about 285.1 and 287.2 eV, which can be attributed to C-C and C−O bonds, respectively. The C 1s XPS signal of GO-2 was deconvoluted considering many contributions: sp2 carbon bonds at 284.4 eV, sp3 carbon bonds at 285.2 eV, C−OH
Figure 4. Raman Scattering Spectrum of graphite and graphite oxides, GO-2 and GO-4.
Figure 5. XPS spectra for GO-2 (a) and GO-4 (b) samples: survey scan.
Figure 6. Deconvoluted spectra for high-resolution XPS C 1s peaks of: a) GO-2 and b) GO-4.
7Role of Graphene Oxide on the Mechanical Behaviour of Polycarbonate-Urethane/Graphene Oxide Composites
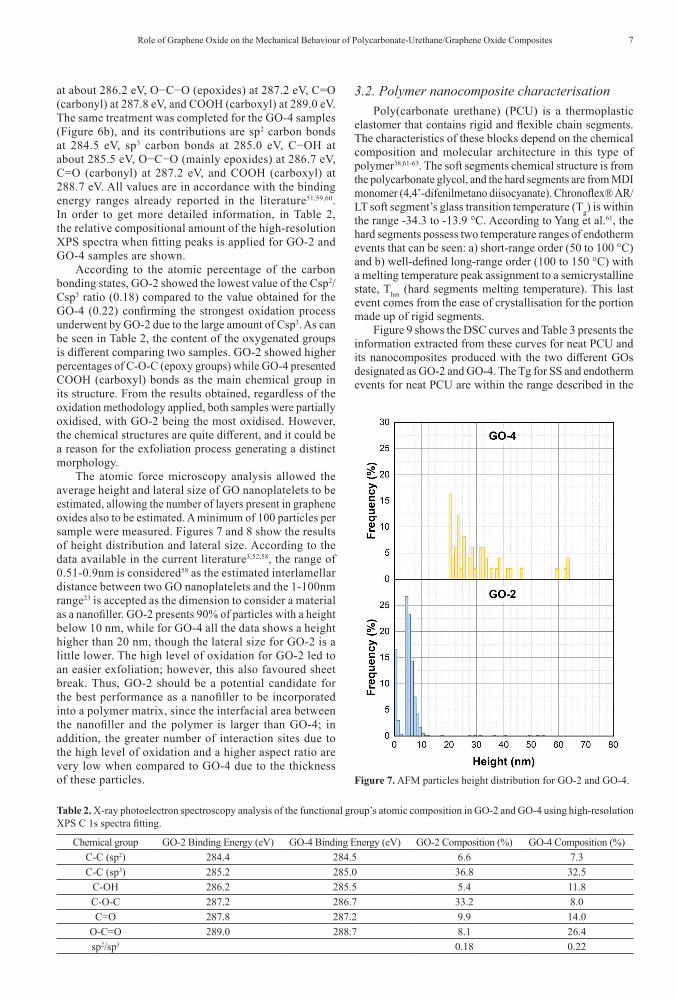
at about 286.2 eV, O−C−O (epoxides) at 287.2 eV, C=O (carbonyl) at 287.8 eV, and COOH (carboxyl) at 289.0 eV. The same treatment was completed for the GO-4 samples (Figure 6b), and its contributions are sp2 carbon bonds at 284.5 eV, sp3 carbon bonds at 285.0 eV, C−OH at about 285.5 eV, O−C−O (mainly epoxides) at 286.7 eV, C=O (carbonyl) at 287.2 eV, and COOH (carboxyl) at 288.7 eV. All values are in accordance with the binding energy ranges already reported in the literature51,59,60. In order to get more detailed information, in Table 2, the relative compositional amount of the high-resolution XPS spectra when fitting peaks is applied for GO-2 and GO-4 samples are shown.
According to the atomic percentage of the carbon bonding states, GO-2 showed the lowest value of the Csp2/Csp3 ratio (0.18) compared to the value obtained for the GO-4 (0.22) confirming the strongest oxidation process underwent by GO-2 due to the large amount of Csp3. As can be seen in Table 2, the content of the oxygenated groups is different comparing two samples. GO-2 showed higher percentages of C-O-C (epoxy groups) while GO-4 presented COOH (carboxyl) bonds as the main chemical group in its structure. From the results obtained, regardless of the oxidation methodology applied, both samples were partially oxidised, with GO-2 being the most oxidised. However, the chemical structures are quite different, and it could be a reason for the exfoliation process generating a distinct morphology.
The atomic force microscopy analysis allowed the average height and lateral size of GO nanoplatelets to be estimated, allowing the number of layers present in graphene oxides also to be estimated. A minimum of 100 particles per sample were measured. Figures 7 and 8 show the results of height distribution and lateral size. According to the data available in the current literature3,52,58, the range of 0.51-0.9nm is considered58 as the estimated interlamellar distance between two GO nanoplatelets and the 1-100nm range23 is accepted as the dimension to consider a material as a nanofiller. GO-2 presents 90% of particles with a height below 10 nm, while for GO-4 all the data shows a height higher than 20 nm, though the lateral size for GO-2 is a little lower. The high level of oxidation for GO-2 led to an easier exfoliation; however, this also favoured sheet break. Thus, GO-2 should be a potential candidate for the best performance as a nanofiller to be incorporated into a polymer matrix, since the interfacial area between the nanofiller and the polymer is larger than GO-4; in addition, the greater number of interaction sites due to the high level of oxidation and a higher aspect ratio are very low when compared to GO-4 due to the thickness of these particles.
3.2. Polymer nanocomposite characterisationPoly(carbonate urethane) (PCU) is a thermoplastic
elastomer that contains rigid and flexible chain segments. The characteristics of these blocks depend on the chemical composition and molecular architecture in this type of polymer38,61-63. The soft segments chemical structure is from the polycarbonate glycol, and the hard segments are from MDI monomer (4,4’-difenilmetano diisocyanate). Chronoflex® AR/LT soft segment’s glass transition temperature (Tg) is within the range -34.3 to -13.9 °C. According to Yang et al.61, the hard segments possess two temperature ranges of endotherm events that can be seen: a) short-range order (50 to 100 °C) and b) well-defined long-range order (100 to 150 °C) with a melting temperature peak assignment to a semicrystalline state, Thm (hard segments melting temperature). This last event comes from the ease of crystallisation for the portion made up of rigid segments.
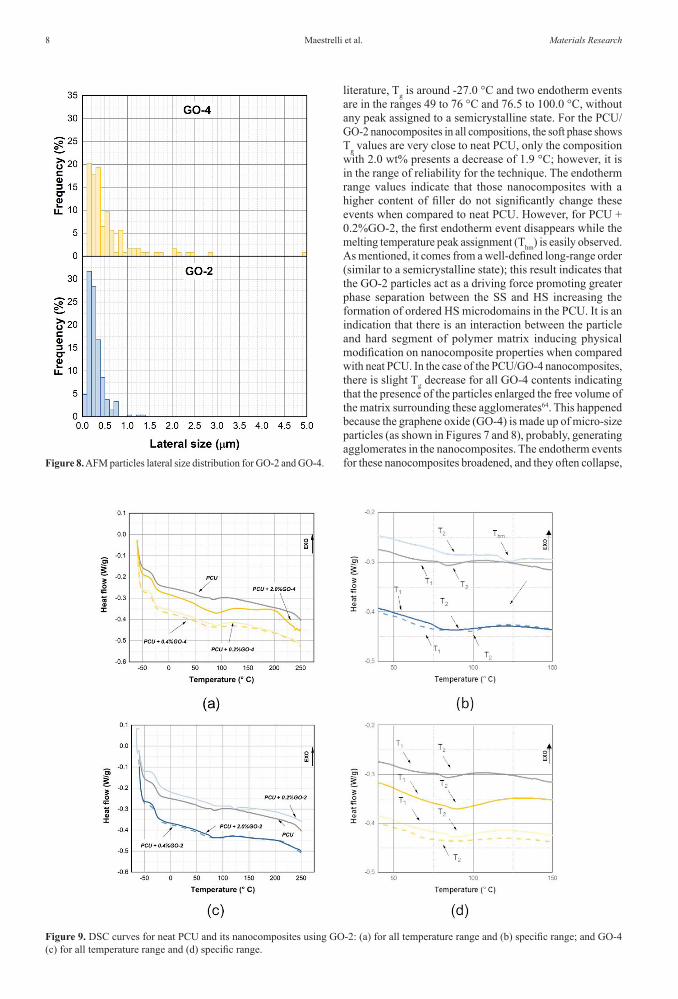
Figure 9 shows the DSC curves and Table 3 presents the information extracted from these curves for neat PCU and its nanocomposites produced with the two different GOs designated as GO-2 and GO-4. The Tg for SS and endotherm events for neat PCU are within the range described in the
Table 2. X-ray photoelectron spectroscopy analysis of the functional group’s atomic composition in GO-2 and GO-4 using high-resolution XPS C 1s spectra fitting.
Chemical group GO-2 Binding Energy (eV) GO-4 Binding Energy (eV) GO-2 Composition (%) GO-4 Composition (%)C-C (sp2) 284.4 284.5 6.6 7.3C-C (sp3) 285.2 285.0 36.8 32.5
C-OH 286.2 285.5 5.4 11.8C-O-C 287.2 286.7 33.2 8.0C=O 287.8 287.2 9.9 14.0
O-C=O 289.0 288.7 8.1 26.4sp2/sp3 0.18 0.22
Figure 7. AFM particles height distribution for GO-2 and GO-4.
Maestrelli et al.8 Materials Research
literature, Tg is around -27.0 °C and two endotherm events are in the ranges 49 to 76 °C and 76.5 to 100.0 °C, without any peak assigned to a semicrystalline state. For the PCU/GO-2 nanocomposites in all compositions, the soft phase shows Tg values are very close to neat PCU, only the composition with 2.0 wt% presents a decrease of 1.9 °C; however, it is in the range of reliability for the technique. The endotherm range values indicate that those nanocomposites with a higher content of filler do not significantly change these events when compared to neat PCU. However, for PCU + 0.2%GO-2, the first endotherm event disappears while the melting temperature peak assignment (Thm) is easily observed. As mentioned, it comes from a well-defined long-range order (similar to a semicrystalline state); this result indicates that the GO-2 particles act as a driving force promoting greater phase separation between the SS and HS increasing the formation of ordered HS microdomains in the PCU. It is an indication that there is an interaction between the particle and hard segment of polymer matrix inducing physical modification on nanocomposite properties when compared with neat PCU. In the case of the PCU/GO-4 nanocomposites, there is slight Tg decrease for all GO-4 contents indicating that the presence of the particles enlarged the free volume of the matrix surrounding these agglomerates64. This happened because the graphene oxide (GO-4) is made up of micro-size particles (as shown in Figures 7 and 8), probably, generating agglomerates in the nanocomposites. The endotherm events for these nanocomposites broadened, and they often collapse, Figure 8. AFM particles lateral size distribution for GO-2 and GO-4.
Figure 9. DSC curves for neat PCU and its nanocomposites using GO-2: (a) for all temperature range and (b) specific range; and GO-4 (c) for all temperature range and (d) specific range.

9Role of Graphene Oxide on the Mechanical Behaviour of Polycarbonate-Urethane/Graphene Oxide Composites
generating only one event, and do not show a Thm peak. The micro size of the GO4 particles does not interfere in the crystallisation process of the hard segments that can indicate a low level of interaction between them and the PCU chains. The difference in the oxidation level and particle size between the GO-2 and GO-4 particles induced a distinct interface with the PCU. Consequently, nano-size particles (high aspect ratio) and a high oxidation level could lead to better PCU/GO-2 nanocomposite performance. The high surface area of the nanoparticles allowed a considerable interaction with the
polymer. In contrast, the good interaction between GO-2 and the hard segment is due to the high polarity of both.
The dependence of the storage modulus, E’, loss modulus, E”, dissipation factor, and Tan δ (E”/E’ ratio) also called damping, for neat PCU and nanocomposites produced with GO-2 and GO-4 as a function of temperature (from -125 °C to 0 °C) are shown in Figure 10. The experiments were carried out at temperatures below zero, indicating that the DMA results are more correlated with the interaction between the SS and GO nanoparticle. For all compositions, with GO-2 and GO-4, values
Table 3. Thermal properties for neat PCU and its nanocomposites, measured using DSC and DMA.
SampleTemperature peak and ranges
Tg (°C) DSC Tg (°C) DMA T1 (°C) T2 (°C) Thm (°C)Neat PCU -27.0 -25.6 49.0 – 76.0 76.5 – 100.0 —
PCU + 0.2% GO-2 -27.5 -27.5 — 75.4 – 97.5 115.0 – 134.5PCU + 0.4% GO-2 -27.2 -21.3 52.0 – 91.0 92.7 – 120.0 —PCU + 2.0% GO-2 -28.9 -25.6 48.9 – 71.6 74.1 – 117.2 —PCU + 0.2% GO-4 -28.5 -30.4 49.0 – 82.0 82.5 – 117.0 —PCU + 0.4% GO-4 -29.4 -21.6 — 60.0 – 120.0 —PCU + 2.0% GO-4 -28.8 -28.6 48.8 – 82.1 82.6 – 125.0 —
Figure 10. DMTA curves for: storage module - E’ (a) and (b), loss module - E” (c) and (d), energy dissipation factor - Tan δ (e) and (f), as a function of temperature for neat PCU and its nanocomposites with GO-2 and GO-4.
Maestrelli et al.10 Materials Research
of E’ and E” are higher than neat PCU before the Tg. Therefore, at -50 °C the improvements in E’ and E” are higher for PCU/GO-2, indicating that GO-2 is acting to increase the stiffness and capacity of energy dissipation at the glassy state region.
It is easy to visualise from the storage modulus curves that the stiffness decay starts earlier (around -50 °C) for the GO-4 nanocomposites when compared to neat PCU and even the GO-2 nanocomposites (both around -30 °C). The stiffness decay displacement for the SS is attributed to the separation of the SS and HS leading to a decrease in the SS Tg up to a maximum of 5°C as shown in Table 3 from the DMA-SS data23,65. No PCU/GO-2 nanocomposites present any significant Tg modification, indicating that the particles have no interaction or a very weak interaction with the polyurethane soft segment phase.
The Tg was obtained from the loss modulus results, that is from the position of the maximum value of the curve.
Similar results were observed using DSC. PCU/GO-4 data shows that the Tg values for the nanocomposites are slightly lower than neat TPU, as shown in the DSC results. However, the Tan δ for all nanocomposites are higher than neat PCU around the glassy temperature of SS. Notwithstanding the superior values of E’ and E” for PCU/GO-2 nanocomposites, the higher values of Tan δ indicate that these particles did not lead a restriction in the polymer’s chain mobility (soft segments) provided by geometric confinements from polymer/filler interactions66,67. These results indicate, also observed from the DSC results, that the stronger interaction of the GO particles is not with the SS segments.
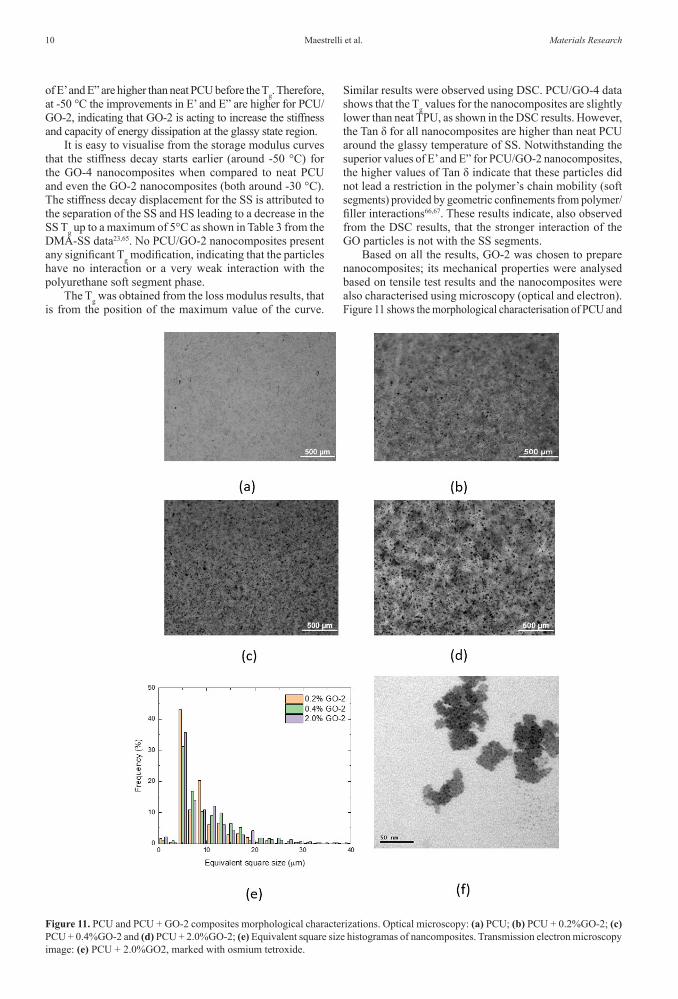
Based on all the results, GO-2 was chosen to prepare nanocomposites; its mechanical properties were analysed based on tensile test results and the nanocomposites were also characterised using microscopy (optical and electron). Figure 11 shows the morphological characterisation of PCU and
Figure 11. PCU and PCU + GO-2 composites morphological characterizations. Optical microscopy: (a) PCU; (b) PCU + 0.2%GO-2; (c) PCU + 0.4%GO-2 and (d) PCU + 2.0%GO-2; (e) Equivalent square size histogramas of nancomposites. Transmission electron microscopy image: (e) PCU + 2.0%GO2, marked with osmium tetroxide.
11Role of Graphene Oxide on the Mechanical Behaviour of Polycarbonate-Urethane/Graphene Oxide Composites
PCU + GO-2 composites. As can be observed in Figure 11a, neat PCU presents a marble-like surface, resulting from HS and SS phase separation. The microphase separation degree has a profound effect on the physical and mechanical properties of segmented PUs. Figure 11b to Figure 11d show PCU + GO-2 composites, and it is possible to observe the presence of GO-2 microdomains along the PCU matrix. GO clusters bonded by secondary forces form these microdomains, and the number and size tend to increase with the increases in GO-2 content. It can be better understanding by particle size data extracted from Figures 11b to 11d (Figure 11e) how the increase of GO-2 content change the microdomais along the PCU matrix. Bellow 10 μm of lateral size there is higher frequency of particles for nanocomposites with lower content of GO-2 while values > 10 μm is observed an inversion. It means that how much more GO was added the clusters becomes bigger. Another interesting observation has to be made, the size of the particles inside the PCU matrix (90% between 5-20 μm) is larger than observed by AFM (0.1 to 1.0 μm), indicating that during the nanocomposite preparation occurred partiles agglomeration. Figure 11f shows a TEM image of small GO clusters observed in the PCU + 2.0%GO-2 sample.
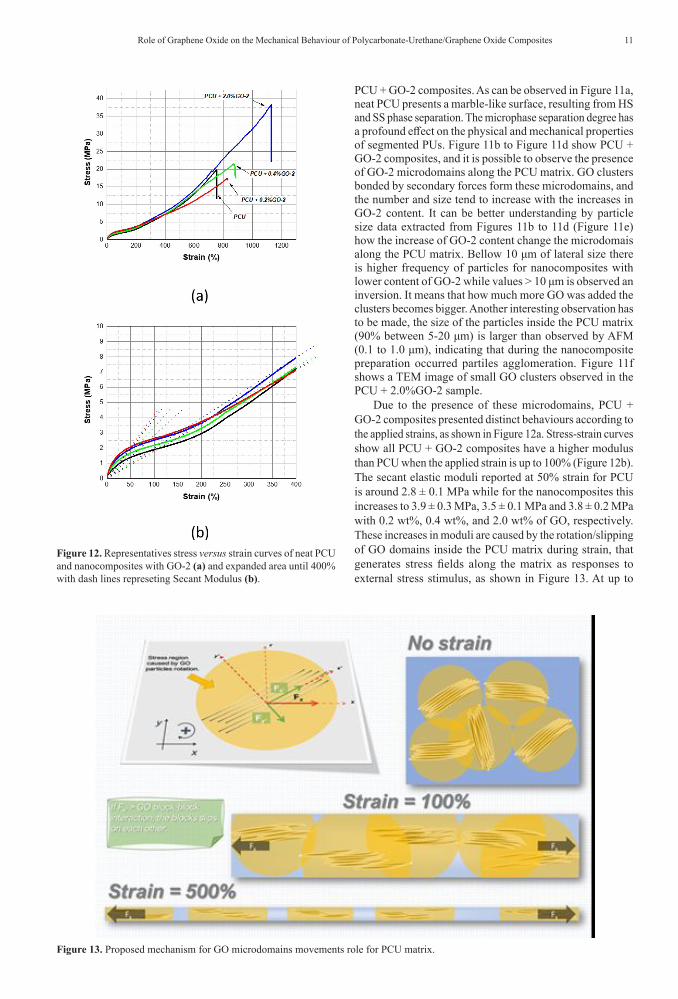
Due to the presence of these microdomains, PCU + GO-2 composites presented distinct behaviours according to the applied strains, as shown in Figure 12a. Stress-strain curves show all PCU + GO-2 composites have a higher modulus than PCU when the applied strain is up to 100% (Figure 12b). The secant elastic moduli reported at 50% strain for PCU is around 2.8 ± 0.1 MPa while for the nanocomposites this increases to 3.9 ± 0.3 MPa, 3.5 ± 0.1 MPa and 3.8 ± 0.2 MPa with 0.2 wt%, 0.4 wt%, and 2.0 wt% of GO, respectively. These increases in moduli are caused by the rotation/slipping of GO domains inside the PCU matrix during strain, that generates stress fields along the matrix as responses to external stress stimulus, as shown in Figure 13. At up to
Figure 12. Representatives stress versus strain curves of neat PCU and nanocomposites with GO-2 (a) and expanded area until 400% with dash lines represeting Secant Modulus (b).
Figure 13. Proposed mechanism for GO microdomains movements role for PCU matrix.
Maestrelli et al.12 Materials Research
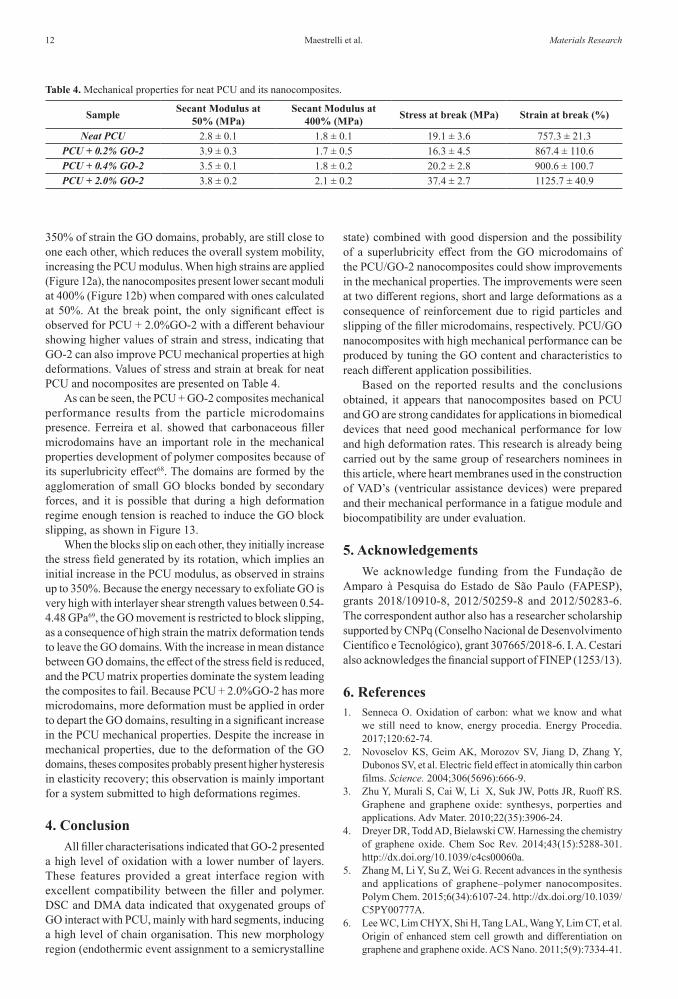
350% of strain the GO domains, probably, are still close to one each other, which reduces the overall system mobility, increasing the PCU modulus. When high strains are applied (Figure 12a), the nanocomposites present lower secant moduli at 400% (Figure 12b) when compared with ones calculated at 50%. At the break point, the only significant effect is observed for PCU + 2.0%GO-2 with a different behaviour showing higher values of strain and stress, indicating that GO-2 can also improve PCU mechanical properties at high deformations. Values of stress and strain at break for neat PCU and nocomposites are presented on Table 4.
As can be seen, the PCU + GO-2 composites mechanical performance results from the particle microdomains presence. Ferreira et al. showed that carbonaceous filler microdomains have an important role in the mechanical properties development of polymer composites because of its superlubricity effect68. The domains are formed by the agglomeration of small GO blocks bonded by secondary forces, and it is possible that during a high deformation regime enough tension is reached to induce the GO block slipping, as shown in Figure 13.
When the blocks slip on each other, they initially increase the stress field generated by its rotation, which implies an initial increase in the PCU modulus, as observed in strains up to 350%. Because the energy necessary to exfoliate GO is very high with interlayer shear strength values between 0.54-4.48 GPa69, the GO movement is restricted to block slipping, as a consequence of high strain the matrix deformation tends to leave the GO domains. With the increase in mean distance between GO domains, the effect of the stress field is reduced, and the PCU matrix properties dominate the system leading the composites to fail. Because PCU + 2.0%GO-2 has more microdomains, more deformation must be applied in order to depart the GO domains, resulting in a significant increase in the PCU mechanical properties. Despite the increase in mechanical properties, due to the deformation of the GO domains, theses composites probably present higher hysteresis in elasticity recovery; this observation is mainly important for a system submitted to high deformations regimes.
4. ConclusionAll filler characterisations indicated that GO-2 presented
a high level of oxidation with a lower number of layers. These features provided a great interface region with excellent compatibility between the filler and polymer. DSC and DMA data indicated that oxygenated groups of GO interact with PCU, mainly with hard segments, inducing a high level of chain organisation. This new morphology region (endothermic event assignment to a semicrystalline
state) combined with good dispersion and the possibility of a superlubricity effect from the GO microdomains of the PCU/GO-2 nanocomposites could show improvements in the mechanical properties. The improvements were seen at two different regions, short and large deformations as a consequence of reinforcement due to rigid particles and slipping of the filler microdomains, respectively. PCU/GO nanocomposites with high mechanical performance can be produced by tuning the GO content and characteristics to reach different application possibilities.
Based on the reported results and the conclusions obtained, it appears that nanocomposites based on PCU and GO are strong candidates for applications in biomedical devices that need good mechanical performance for low and high deformation rates. This research is already being carried out by the same group of researchers nominees in this article, where heart membranes used in the construction of VAD’s (ventricular assistance devices) were prepared and their mechanical performance in a fatigue module and biocompatibility are under evaluation.
5. AcknowledgementsWe acknowledge funding from the Fundação de
Amparo à Pesquisa do Estado de São Paulo (FAPESP), grants 2018/10910-8, 2012/50259-8 and 2012/50283-6. The correspondent author also has a researcher scholarship supported by CNPq (Conselho Nacional de Desenvolvimento Científico e Tecnológico), grant 307665/2018-6. I. A. Cestari also acknowledges the financial support of FINEP (1253/13).
6. References1. Senneca O. Oxidation of carbon: what we know and what
we still need to know, energy procedia. Energy Procedia. 2017;120:62-74.
2. Novoselov KS, Geim AK, Morozov SV, Jiang D, Zhang Y, Dubonos SV, et al. Electric field effect in atomically thin carbon films. Science. 2004;306(5696):666-9.
3. Zhu Y, Murali S, Cai W, Li X, Suk JW, Potts JR, Ruoff RS. Graphene and graphene oxide: synthesys, porperties and applications. Adv Mater. 2010;22(35):3906-24.
4. Dreyer DR, Todd AD, Bielawski CW. Harnessing the chemistry of graphene oxide. Chem Soc Rev. 2014;43(15):5288-301. http://dx.doi.org/10.1039/c4cs00060a.
5. Zhang M, Li Y, Su Z, Wei G. Recent advances in the synthesis and applications of graphene–polymer nanocomposites. Polym Chem. 2015;6(34):6107-24. http://dx.doi.org/10.1039/C5PY00777A.
6. Lee WC, Lim CHYX, Shi H, Tang LAL, Wang Y, Lim CT, et al. Origin of enhanced stem cell growth and differentiation on graphene and graphene oxide. ACS Nano. 2011;5(9):7334-41.
Table 4. Mechanical properties for neat PCU and its nanocomposites.
Sample Secant Modulus at 50% (MPa)
Secant Modulus at 400% (MPa) Stress at break (MPa) Strain at break (%)
Neat PCU 2.8 ± 0.1 1.8 ± 0.1 19.1 ± 3.6 757.3 ± 21.3PCU + 0.2% GO-2 3.9 ± 0.3 1.7 ± 0.5 16.3 ± 4.5 867.4 ± 110.6PCU + 0.4% GO-2 3.5 ± 0.1 1.8 ± 0.2 20.2 ± 2.8 900.6 ± 100.7PCU + 2.0% GO-2 3.8 ± 0.2 2.1 ± 0.2 37.4 ± 2.7 1125.7 ± 40.9
13Role of Graphene Oxide on the Mechanical Behaviour of Polycarbonate-Urethane/Graphene Oxide Composites
7. Liao JF, Qu Y, Chu B, Zhang X, Qian Z. Biodegradable CSMA/PECA/graphene porous hybrid scaffold for cartilage tissue engineering. Sci Rep. 2015;5:1-16. http://dx.doi.org/10.1038/srep09879.
8. Han TH, Kim H, Kwon SJ, Lee TW. Graphene-based flexible electronic devices. Mater Sci Eng Rep. 2017;118:1-43. http://dx.doi.org/10.1016/j.mser.2017.05.001.
9. Han TH, Lee Y, Choi MR, Woo SH, Bae SH, Hong BH, et al. Extremely efficient flexible organic light-emitting diodes with modified graphene anode. Nat Photonics. 2012;6(2):105-10. http://dx.doi.org/10.1038/nphoton.2011.318.
10. Han Y, Xu Z, Gao C. Ultrathin graphene nanofiltration membrane for water purification. Adv Funct Mater. 2013;23(29):3693-700. http://dx.doi.org/10.1002/adfm.201202601.
11. Mittal V. Functional polymer nanocomposites with graphene: a review. Macromol Mater Eng. 2014;299(8):906-31. http://dx.doi.org/10.1002/mame.201300394.
12. Xie H, Cao T, Rodríguez-Lozano FJ, Luong-Van EK, Rosa V. Graphene for the development of the next-generation of biocomposites for dental and medical applications. Dent Mater. 2017;33(7):765-74. http://dx.doi.org/10.1016/j.dental.2017.04.008.
13. ISO: International Organization for Standardization. ISO/TS 80004-13:2017: Nanotechnologies - Vocabulary-Part 13: Graphene and Related Two Dimensional (2D) materials. Geneva: ISO; 2017.
14. Pinto AM, Goncąlves C, Sousa DM, Ferreira AR, Moreira JA, Goncąlves IC, et al. Smaller particle size and higher oxidation improves biocompatibility of graphene-based materials. Carbon N. Y. 2016;99:318-29. http://dx.doi.org/10.1016/j.carbon.2015.11.076.
15. Thompson BC, Murray E, Gordon GW. Grafite oxide to grapheme - biomaterials to bionics. Adv Mater. 2015;27:7563-82.
16. Yang K, Feng L, Hong H, Cai W, Liu Z. Preparation and functionalization of graphene nanocomposites for biomedical applications. Nat Protoc. 2013;8(12):2392-403. http://dx.doi.org/10.1038/nprot.2013.146.
17. Zhang M, Li Y, Su Z, Wei G. Recent advances in the synthesis and applications of graphene-polymer nanocomposites. Polym Chem. 2015;6(34):6107-24. http://dx.doi.org/10.1039/c5py00777a.
18. Pokharel P, Lee DS. High performance polyurethane nanocomposite films prepared from a masterbatch of graphene oxide in polyether polyol. Chem Eng J. 2014;253:356-65. http://dx.doi.org/10.1016/j.cej.2014.05.046.
19. de Oliveira CFP, Muñoz PAR, dos Santos MCC, Medeiros GS, Simionato A, Nagaoka DA, et al. Tuning of surface properties of poly(vinyl alcohol)/graphene oxide nanocomposites. Polym Compos. 2017;40(S1):E312-20. http://dx.doi.org/10.1002/pc.24659.
20. Khan U, May P, O’Neill A, Coleman JN. Development of stiff, strong, yet tough composites by the addition of solvent exfoliated graphene to polyurethane. Carbon N. Y. 2010;48(14):4035-41. http://dx.doi.org/10.1016/j.carbon.2010.07.008.
21. Fu S, Sun Z, Huang P, Li Y, Hu N. Some basic aspects of polymer nanocomposites: a critical review. Nano Mater. Sci. 2019;1(1):2-30. http://dx.doi.org/10.1016/j.nanoms.2019.02.006.
22. Yousefi N, Lin X, Zheng Q, Shen X, Pothnis JR, Jia J, et al. Simultaneous in situ reduction, self-alignment and covalent bonding in graphene oxide/epoxy composites. Carbon N. Y. 2013;59:406-17. http://dx.doi.org/10.1016/j.carbon.2013.03.034.
23. Aoyama S, Ismail I, Park YT, Macosko CW, Ougizawa T. Higher-order structure in amorphous poly(ethylene terephthalate)/graphene nanocomposites and its correlation with bulk mechanical properties. ACS Omega. 2019;4(1):1228-37. http://dx.doi.org/10.1021/acsomega.8b03280.
24. Potts JR, Dreyer DR, Bielawski CW, Ruoff RS. Graphene-based polymer nanocomposites. Polymer (Guildf). 2011;52(1):5-25. http://dx.doi.org/10.1016/j.polymer.2010.11.042.
25. Mukhopadhyay P, Gupta RK. Graphite, graphene, and their polymer nanocomposites. Boca Raton: CRC Press; 2012. https://doi.org/10.1201/b13051.
26. Cassagnau P. Linear viscoelasticity and dynamics of suspensions and molten polymers filled with nanoparticles of different aspect ratios. Polym. (United Kingdom). 2013;54(18):4762-75. http://dx.doi.org/10.1016/j.polymer.2013.06.012.
27. Szycher M. High performance biomaterials- a comprehensive guide to medical and pharmaceutical applications. Lancaster, USA: Technomic Publishing AG; 1991.
28. Kankala RK, Zhu K, Sun XN, Liu CG, Wang SB, Chen AZ. Cardiac tissue engineering on the nanoscale. Biomater. Sci. Eng. 2018;4(3):800-18. http://dx.doi.org/10.1021/acsbiomaterials.7b00913.
29. Abraham GA, Frontini PM, Cuadrado TR. Physical and mechanical behavior of sterilized biomedical segmented polyurethanes. J Appl Polym Sci. 1996;65(6):1193-203. http://dx.doi.org/10.1002/(SICI)1097-4628(19970808)65:6<1193:AID-APP15>3.0.CO;2-V.
30. Visai L, Rindi S, Speziale P. In vitro interactions of macrophages and bacterial cells. J Biomater Appl. 2002;2002:16.
31. Gunatillake PA, Martin DJ, Meijs GF, McCarthy SJ, Adhikari R. Designing biostable polyurethane elastomers for biomedical implants. Aust J Chem. 2003;56(6):545. http://dx.doi.org/10.1071/CH02168.
32. Thampi S, Muthuvijayan V, Parameswaran R. Silanization induced inherent strain in graphene based filler influencing mechanical properties of polycarbonate urethane nanocomposite membranes. RSC Advances. 2016;6(106):104235-45. http://dx.doi.org/10.1039/c6ra21436c.
33. Thampi S, Muthuvijayan V, Parameswaran R. Mechanical characterization of high-performance graphene oxide incorporated aligned fibroporous poly(carbonate urethane) membrane for potential biomedical applications. J Appl Polym Sci. 2015;132(16):1-8. http://dx.doi.org/10.1002/app.41809.
34. Mehl H, Matos CF, Neiva EGC, Domingues SH. The effect of variation of reactional parameters in the preparation of graphene by oxidation and reduction of graphite. Quim Nova. 2014;37(10):1639-45.
35. Guerrero-Contreras J, Caballero-Briones F. Graphene oxide powders with different oxidation degree, prepared by synthesis variations of the hummers method. Mater Chem Phys. 2015;153:209-20.
36. Hummers WS Jr, Offeman RE. Preparation of graphitic oxide. J Am Chem Soc. 1958;80(6):1339-1339. http://dx.doi.org/10.1021/ja01539a017.
37. Cullity BD, Stock SR. Elements of X-ray diffraction. New Jersey: Prentice Hall; 2001.
38. Anandhan S, Lee HS. Influence of organically modified clay mineral on domain structure and properties of segmented thermoplastic polyurethane elastomer. J Elastomers Plast. 2014;46(3):1-16.
39. McCusker LB, von Dreele RB, Cox DE, Louër D, Scardi P. Rietveld refinement guidelines. J. Appl. Christallography. 1999;32(1):36-50.
40. Shen J, Shi M, Li N, Yan B, Ma H, Hu Y, et al. Facile synthesis and application of ag-chemically converted graphene nanocomposite. Nano Res. 2010;3(5):339-49. http://dx.doi.org/10.1007/s12274-010-1037-x.
41. Domingues SH. Filmes finos transparentes e condutores baseados em grafeno. Curitiba: Departamento de Química, Universidade do Paraná; 2013.
42. Dreyer DR, Park S, Bielawski CW, Ruoff RS. The chemistry of graphene oxide. Chem Soc Rev. 2010;39:228-40.
43. Dimiev AM, Eigler S. Graphene oxide: fundamentals and applications; UK: John Wiley & Sons Ltd:; 2016.
44. Chen J, Zhang Y, Zhang M, Yao B, Li Y, Huang L, et al. Chemical science water-enhanced oxidation of graphite to
Maestrelli et al.14 Materials Research
graphene. Chem Sci (Camb). 2016;7:1874-81. http://dx.doi.org/10.1039/C5SC03828F.
45. Eigler S, Dotzer C, Hof F, Bauer W, Hirsch A. Sulfur species in graphene oxide. EurJOC. 2013;19(4):9490-6. https://doi.org/10.1002/chem.201300387.
46. Ma H, Su W, Tai Z, Sun D, Yan X, Liu B, et al. Preparation and cytocompatibility of polylactic acid/hydroxyapatite/graphene oxide nanocomposite fibrous membrane. Chin Sci Bull. 2012;57(23):3051-8. http://dx.doi.org/10.1007/s11434-012-5336-3.
47. Lee EJ, Lee JH, Shin YC, Hwang D, Kim JS, Jin OS, et al. Graphene oxide-decorated PLGA/collagen hybrid fiber sheets for application to tissue engineering scaffolds. Biomater Res. 2014;18(1):18-24.
48. Orth ES, Ferreira JGL, Fonsaca JES, Blaskievicz SF, Domingues SH, Dasgupta A, et al. PKa determination of graphene-like materials: validating chemical functionalization. J Colloid Interface Sci. 2016;467:239-44. http://dx.doi.org/10.1016/j.jcis.2016.01.013.
49. Landel RF, Nielsen LE. Mechanical properties of polymers and composites. 2nd ed. Vol. 1. New York: Marcel Dekker Inc.; 1993.
50. Mehl H, Matos CF, Neiva EGC, Domingues SH. Efeito da variação dos parâmetros reacionais na preparação do grafeno via oxidaçao e redução do grafite. Quim Nova. 2014;37(10):1639-45.
51. Krishnamoorthy K, Veerapandian M, Yun K, Kim SJ. The chemical and structural analysis of graphene oxide with different degrees of oxidation. Carbon N. Y. 2013;53:38-49. http://dx.doi.org/10.1016/j.carbon.2012.10.013.
52. Malard LM, Pimenta MA, Dresselhaus G, Dresselhaus MS. Raman spectroscopy in graphene. Phys Rep. 2009;473(5-6):51-87. http://dx.doi.org/10.1016/j.physrep.2009.02.003.
53. Pinto AM, Moreira S, Gonçalves IC, Gama FM, Mendes AM, Magalhães FD. Biocompatibility of poly(lactic acid) with incorporated graphene-based materials. Colloids Surf B Biointerfaces. 2013;104:229-38. http://dx.doi.org/10.1016/j.colsurfb.2012.12.006.
54. Chatterjee N, Yang JS, Park K, Oh SM, Park J, Choi J. Screening of toxic potential of graphene family nanomaterials using in vitro and alternative in vivo toxicity testing systems. Environ Health Toxicol. 2015;30:e2015007.
55. Ferrari AC. Raman spectroscopy of graphene and graphite : disorder, electron – phonon coupling. Doping and Nonadiabatic Effects. 2007;143(1-2):47-57. http://dx.doi.org/10.1016/j.ssc.2007.03.052.
56. Ferrari AC, Meyer JC, Scardaci V, Casiraghi C, Lazzeri M, Mauri F, et al. Raman spectrum of graphene and graphene layers. Phys Rev Lett. 2006;97(18):187401.
57. Ferrari AC. Raman spectroscopy of graphene and graphite: disorder, electron–phonon coupling, doping and nonadiabatic
effects. Solid State Commun. 2007;143:47-57. http://dx.doi.org/10.1016/j.ssc.2007.03.052.
58. Gao W. Synthesis, structure, and characterizations. Cham: Springer; 2015. p. 1-28. https://doi.org/10.1007/978-3-319-15500-5.
59. Dreyer DR, Park S, Bielawski CW, Ruoff RS. The chemistry of graphene oxide. Chem Soc Rev. 2010;39(1):228-40. http://dx.doi.org/10.1039/b917103g.
60. D’Angelo D, Bongiorno C, Amato M, Deretzis I, La Magna A, Fazio E, et al. Oxygen functionalities evolution in thermally treated graphene oxide featured by EELS and DFT calculations. J Phys Chem C. 2017;121(9):5408-14. http://dx.doi.org/10.1021/acs.jpcc.7b00239.
61. Yang M, Zhang Z, Hahn C, Laroche G, King MW, Guidoin R. Totally implantable artificial hearts and left ventricular assist devices: selecting impermeable polycarbonate urethane to manufacture ventricles. J Biomed Mater Res. 1999;48(1):13-23. http://dx.doi.org/10.1002/(SICI)1097-4636(1999)48:1<13:AID-JBM4>3.0.CO;2-4.
62. Abraham GA, Frontini PM, Cuadrado TR. Physical and mechanical behavior of sterilized biomedical. J Appl Polym Sci. 1996;65(6):1193-203. http://dx.doi.org/10.1002/(SICI)1097-4628(19970808)65:6<1193:AID-APP15>3.0.CO;2-V.
63. Cai D, Yusoh K, Song M. The mechanical properties and morphology of a graphite oxide nanoplatelet/polyurethane composite. Nanotechnology. 2009;20(8). http://dx.doi.org/10.1088/0957-4484/20/8/085712.
64. Xiong M, Gu G, You B, Wu L. Preparation and characterization of poly (styrene butylacrylate) latex/Nano-ZnO nanocomposites. J Appl Polym Sci. 2003;90(7):1923-31.
65. Weir MP, Johnson DW, Boothroyd SC, Savage RC, Thompson RL, King SM, et al. Distortion of chain conformation and reduced entanglement in polymer-graphene oxide nanocomposites. ACS Macro Lett. 2016;5(4):430-4. http://dx.doi.org/10.1021/acsmacrolett.6b00100.
66. Lavoratti A, Zattera AJ, Amico SC. Mechanical and dynamic‐mechanical proper-ties of silane‐treated graphite nanoplatelet/epoxy composites. J Appl Polym Sci. 2018;135(45):46724.
67. Jabbar A, Militký J, Wiener J, Kale BM, Ali U, Rwawiire S. Nanocellulose coated woven jute/green epoxy composites: characterization of mechanical and dynamic mechanical behavior. Compos Struct. 2017;161:340-9.
68. Ferreira EHC, Lima LP, Fechine GJM. The “ Superlubricity State ” of carbonaceous fillers on polymer composites. Macromol. Chem. Phys. 2020;221(16):2000192. https://doi.org/10.1002/macp.202000192.
69. Ferreira EHC, Andrade RJE, Fechine GJM. The “Superlubricity State” of carbonaceous fillers on polyethylene-based composites in a Molten State. Macromolecules. 2019;52(24):9620-31. http://dx.doi.org/10.1021/acs.macromol.9b01746.


![Epitaxial Ultrathin Organic Crystals on Graphene for High ... · taxy of ultrathin organic crystals on graphene and boron nitride (BN) for electronic device applications.[13,14] The](https://static.fdocumentos.com/doc/165x107/5fdb7aabcacd653b0d17fb50/epitaxial-ultrathin-organic-crystals-on-graphene-for-high-taxy-of-ultrathin.jpg)