São Paulo, 24 de julho de 2013 A Natura Cosméticos S.A ... · Esta intensificação nos...
40
Comentário de Desempenho 2T13 São Paulo, 24 de julho de 2013 – A Natura Cosméticos S.A. (BM&FBOVESPA: NATU3) anuncia hoje os resultados do segundo trimestre de 2013 (2T13). As informações financeiras e operacionais a seguir, exceto onde indicado o contrário, são apresentadas em base consolidada, de acordo com as normas internacionais de relatório financeiro IFRS.
Transcript of São Paulo, 24 de julho de 2013 A Natura Cosméticos S.A ... · Esta intensificação nos...

Comentário de Desempenho 2T13
0
São Paulo, 24 de julho de 2013 – A Natura Cosméticos S.A. (BM&FBOVESPA:
NATU3) anuncia hoje os resultados do segundo trimestre de 2013 (2T13). As
informações financeiras e operacionais a seguir, exceto onde indicado o contrário,
são apresentadas em base consolidada, de acordo com as normas internacionais de
relatório financeiro IFRS.

Comentário de Desempenho 2T13
1
Operações Internacionais mantêm crescimento robusto de receita e lucratividade, e no
Brasil perspectiva de aceleração do crescimento ao longo do segundo semestre
No segundo trimestre de 2013, a receita líquida consolidada da Natura cresceu 6,7% frente ao
mesmo período.o do ano anterior, o EBITDA1 cresceu 4,7% e o lucro líquido 11,7%.
No Brasil, o crescimento da receita no trimestre ficou abaixo de nossas expectativas principalmente
em junho, em função de uma menor frequência de pedidos de nossas consultoras, além de um
menor impacto no conjunto dos lançamentos ao longo do período.
Reafirmamos nossa convicção de que ao longo dos próximos meses teremos uma aceleração em
nosso crescimento em função de nosso plano de inovação e de maiores investimentos em marketing.
Na primeira quinzena de julho, lançamos os sabonetes líquidos e os hidratantes corporais da linha
SOU que, com uma proposta inovadora e diferenciada de consumo consciente, permitem a nossa
entrada em um espaço de mercado em que ainda não atuávamos, com um potencial relevante de
receita incremental para a Natura. Além da linha SOU, na segunda metade do ano, teremos outros
lançamentos nas categorias de cosméticos e fragrâncias que aumentarão nossa competitividade no
mercado.
Adicionalmente, intensificaremos os investimentos em marketing de maneira a aumentar a
frequência nos pedidos de nossas consultoras. Essa providência se soma às iniciativas implantadas ao
longo dos últimos meses que objetivam aumentar a cesta de compras dos nossos consumidores,
como o Programa MAIS Natura, no qual recentemente fizemos alguns ajustes para estimular os
pedidos das consultoras com menor volume de vendas. Esta intensificação nos investimentos será
financiada por nosso programa de eficiência de custos.
Nas Operações Internacionais, apresentamos um crescimento robusto de receita e expressiva
evolução da lucratividade (margem EBITDA de 16,6% no 2T13 versus 5,3% no ano anterior)2. O
grupo de países em consolidação apresentou crescimento na receita líquida de 38,9% em moeda local
no 2T13, com destaque para os excelentes indicadores de canal em nossa Operação na Argentina. As
Operações em Implantação apresentaram crescimento de 19,7% em moeda local no 2T13, mostrando
a retomada no México, fruto das recentes melhorias feitas no modelo Rede de Relações Sustentáveis.
Seguimos também confiantes com o avanço dos projetos que nos permitirão, por um lado, evoluir e
modernizar as relações de nossa rede com a utilização dos meios digitais e, por outro, expandir a
oferta de valor por meio de novas marcas e categorias conectadas com o bem estar bem, ampliando
a proposta de valor e os espaços de atuação da nossa empresa.
1 Considera EBITDA pró- forma 2 Margem EBITDA das operações em consolidação e implantação sem considerar a estrutura corporativa na Argentina, operação da França e a Aesop

Comentário de Desempenho 2T13
2
Em fevereiro,
concluímos a aquisição
da empresa Australiana
AESOP. Para fins de
melhor comparação, o
quadro ao lado não
inclui os efeitos da
consolidação desta
operação e dos custos
desta transação.
O quadro ao lado apresenta os
dados consolidados incluindo os
efeitos da consolidação da AESOP e
os custos com a aquisição,
concluída em fevereiro de 2013.
A margem EBITDA consolidada no trimestre sofreu uma pequena retração de 50 pontos base. A
menor diluição das despesas fixas e os maiores investimentos em marketing no Brasil foram
parcialmente mitigados por efeitos não recorrentes e pelo resultado positivo das Operações
Internacionais.
A geração interna de caixa no primeiro semestre de 2013 foi de R$ 508,7 milhões, com crescimento
de 12% frente ao mesmo período anterior. Esta geração interna de caixa foi aplicada em uma maior
necessidade de capital de giro e em investimentos em imobilizado e intangível. Houve aumento do
capital de giro em função da elevação pontual dos estoques e um parcelamento diferente das faturas
do ciclo de vendas de Namorados, aumentando atipicamente o saldo do contas a receber. Com
relação aos investimentos em imobilizado e intangível, em 2013 tivemos um faseamento diferente ao
observado em 2012 com uma maior concentração no primeiro semestre (R$ 186,2 milhões no 1S13
versus R$ 97,1 milhões no 1S12). Reafirmamos o guidance de R$ 450,0 milhões para 2013 (R$ 437,4
milhões em 2012). A combinação destes fatores resultou em uma geração livre de caixa de R$ 12,2
milhões (R$ 432,9 milhões em 2012).
2T13 2T12 1S13 1S12
Receita Bruta Brasil 1.981,9 1.928,0 2,8 3.578,6 3.468,1 3,2
Receita Bruta Internacionais 302,9 220,7 37,3 528,1 392,7 34,5
Receita Bruta ex. Aesop 2.284,8 2.148,7 6,3 4.106,6 3.860,8 6,4
Receita Líquida Brasil 1.450,7 1.434,3 1,1 2.615,2 2.574,5 1,6
Receita Líquida Internacionais* 236,6 174,0 36,0 412,8 309,6 33,3
Receita Líquida ex. Aesop 1.687,3 1.608,3 4,9 3.028,0 2.884,1 5,0
% Participação Receita Líquida Internacionais 14,0% 10,8% 3,2 pp 13,6% 10,7% 2,9 pp
EBITDA Brasil pró-forma 395,6 401,9 (1,6) 665,1 686,8 (3,1)
% Margem EBITDA Brasil 27,3% 28,0% (0,8) pp 25,4% 26,7% (1,2) pp
EBITDA Internacionais pró-forma 12,1 (10,3) (217,2) 9,0 (23,0) (139,2)
% Margem EBITDA Internacionais 5,1% (5,9)% 11,0 pp 2,2% (7,4)% 9,6 pp
EBITDA ex. Aesop 407,7 391,6 4,1 674,2 663,7 1,6
% Margem EBITDA ex. Aesop 24,2% 24,3% (0,2) pp 22,3% 23,0% (0,7) pp
*Crescimento em Moeda Local: 31,5% em 2T13 vs. 2T12 e 25,1% em 1S13 vs. 1S12
Valores em R$ milhões
2T13 2T12 1S13 1S12
Receita Líquida Consolidada 1.715,8 1.608,3 6,7 3.067,1 2.884,1 6,3
EBITDA Consolidado 409,9 391,6 4,7 671,9 663,7 1,2
% Margem EBITDA Consolidado 23,9% 24,3% (0,5) pp 21,9% 23,0% (1,1) pp
Lucro Líquido Consolidado 240,2 215,1 11,7 364,8 366,6 (0,5)
% Margem Líquida Consolidada 14,0% 13,4% 0,6 pp 11,9% 12,7% (0,8) pp
Geração Interna de Caixa 310,1 264,1 17,4 508,7 454,1 12,0
Geração de Caixa Livre 122,3 305,3 (60,0) 12,2 432,9 (97,2)
Dívida Líquida / EBITDA n/a n/a n/a 0,75 0,43
Valores em R$ milhões

Comentário de Desempenho 2T13
3
1. mercado de higiene pessoal, perfumaria e
cosméticos (HPPC)
Segundo os dados da SIPATESP/ABHIPEC3 disponíveis para o acumulado até abril de 2013, o mercado
alvo cresceu 13,0%, com destaque para as categorias de cabelos, sabonetes, desodorantes e
perfumaria. Nesse período, o market share da Natura foi de 21,4%, apresentando uma queda de 180
pontos base versus o mesmo período de 2012.
Nas categorias de Higiene Pessoal, nossos concorrentes seguiram investindo fortemente em
marketing e em lançamentos. Já nas categorias de Cosméticos e Fragrâncias, que são mais
tradicionais da venda direta, tivemos uma retração mais acentuada de market share, concentrada no
2º bimestre de 2013.
Estamos confiantes que o mercado brasileiro de higiene pessoal, perfumaria e cosméticos seguirá
com um nível de crescimento vigoroso ao longo dos próximos anos, e que nossas inciativas, já em
execução, nos permitirão elevar nossa competitividade no mercado ao longo do segundo semestre de
2013.
3 Sipatesp/Abihpec:Sindicato da Indústria de Perfumarias de Artigos de Toucador no Estado de São Paulo / Associação Brasileira da Indústria de Higiene Pessoal, Perfumaria e Cosméticos.
4M13 4M12 Var. 4M13 4M12 Var.
Cosméticos e Fragrâncias 3.403 3.072 10,8% 34,7% 37,6% (2,9) pp
Higiene Pessoal 4.493 3.914 14,8% 11,3% 11,9% (0,6) pp
Total 7.897 6.987 13,0% 21,4% 23,2% (1,8) pp
Fonte: Sipatesp
* Valores de 2012 recalculados pela Associação
BrasilTamanho de Mercado
(R$ Milhões)Market Share Natura (%)

Comentário de Desempenho 2T13
4
2. destaques socioambientais
Em Julho, a Natura foi premiada pelo IR Magazine Awards Brazil como “Melhor sustentabilidade
socioambiental” pelo sexto ano consecutivo. Nesta que é uma das premiações promovidas ao redor
do mundo pela IR Magazine/Cross Border e busca reconhecer as melhores práticas de relacionamento
com o mercado de capitais, os vencedores são selecionados por meio de pesquisas com os
profissionais de investimentos.
Apresentamos abaixo as metas socioambientais para 2013 com os respectivos resultados até o 2T13:
Resultado de mudanças climáticas ficou em linha com o planejado para o trimestre. Para o segundo
semestre de 2013, esperamos que as emissões relativas sejam menores que a do primeiro semestre,
resultado da venda de produtos com menor emissão relativa, como por exemplo a linha SOU.
O bom resultado de geração de resíduos no trimestre se deve, principalmente, pela menor
destruição de produtos. Os demais indicadores apresentam resultados em linha com o planejado.
Indicador
* Resultado do 1T13, dados do 2T13 serão disponibilizados no próximo trimestre
** Indicador composto principalmente por repartição de benefícios e valores pagos pela compra de matéria-prima.
*** Considera a Natura e outros parceiros
R$ 6,5 milhões
Compromisso 2013
Reduzir 33% as emissões relativas de GEE, vs 2006
Volume de negócios na região amazônica*** R$ 121,8 milhõesAumentar em 56,0% o volume de negócios na região amazônica,
chegando a R$ 190 milhões em 2013
Destinar R$ 13,6 milhões em riquezas para as comunidades
fornecedoras.
R$ 78 milhões
Resultado 2012
Redução de 28,4% vs.
2006
0,40 litro / unidade
produzida
25,56 gramas / unidade
produzida
Resultado 2T13
Redução de
28,3% vs 2006*
0,39 litro / unidade
produzida
20,99 gramas/unidade
produzida
R$ 5,9 milhões
R$ 12,8 milhões
R$ 12,1 milhões
Gases de efeito estufa
(Mudanças Climáticas)
Consumo de Água
Geração de Resíduos
Arrecadação Crer para Ver
(Educação)
Reduzir o consumo de água para 0,39 litro por unidade
produzida no Brasil
Reduzir para 24,70 gramas por unidade produzida a quantidade
de resíduos gerada no Brasil
Arrecadar R$ 14,0 milhões com a venda dos produtos
Crer para Ver no Brasil
Recursos Destinados às
Comunidades Fornecedoras **
Comentário de Desempenho 2T13
5
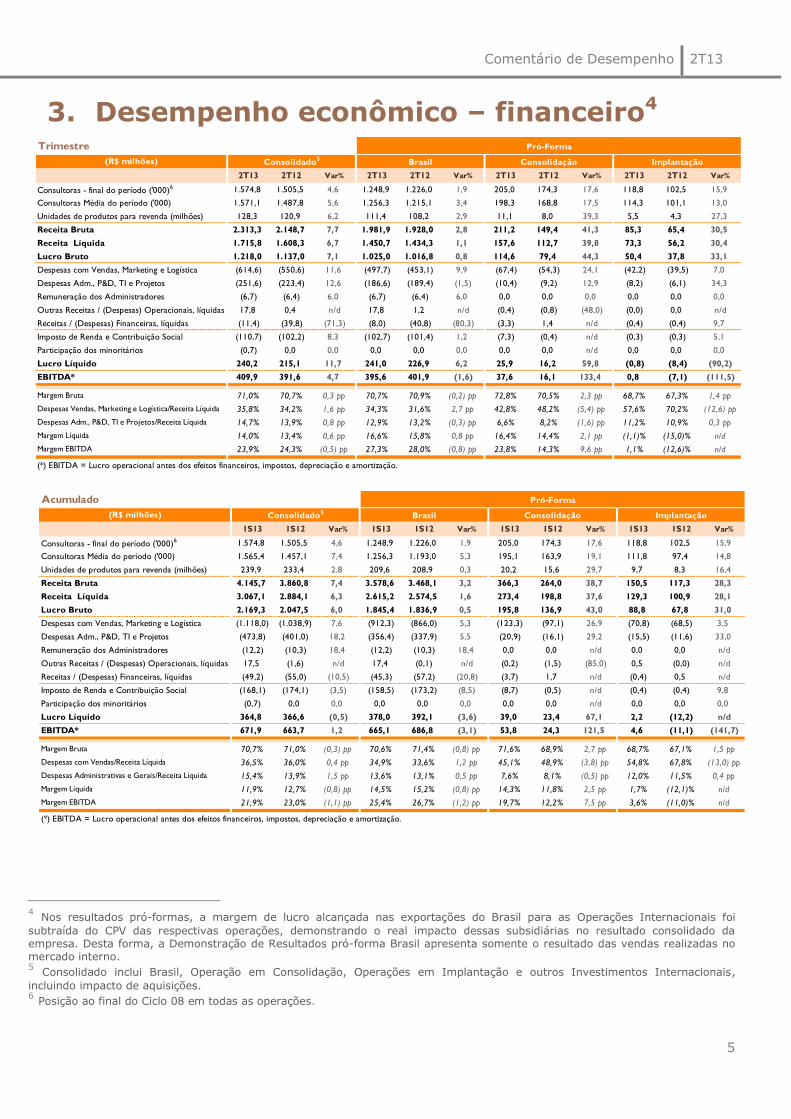
3. Desempenho econômico – financeiro456
4 Nos resultados pró-formas, a margem de lucro alcançada nas exportações do Brasil para as Operações Internacionais foi
subtraída do CPV das respectivas operações, demonstrando o real impacto dessas subsidiárias no resultado consolidado da empresa. Desta forma, a Demonstração de Resultados pró-forma Brasil apresenta somente o resultado das vendas realizadas no mercado interno. 5 Consolidado inclui Brasil, Operação em Consolidação, Operações em Implantação e outros Investimentos Internacionais,
incluindo impacto de aquisições. 6 Posição ao final do Ciclo 08 em todas as operações.
Trimestre Pró-Forma Pró-Forma
(R$ milhões) Consolidado5 Brasil Consolidação Implantação Novos Negócios
2T13 2T12 Var% 2T13 2T12 Var% 2T13 2T12 Var% 2T13 2T12 Var%
Consultoras - final do período ('000)6 1.574,8 1.505,5 4,6 1.248,9 1.226,0 1,9 205,0 174,3 17,6 118,8 102,5 15,9
Consultoras Média do período ('000) 1.571,1 1.487,8 5,6 1.256,3 1.215,1 3,4 198,3 168,8 17,5 114,3 101,1 13,0
Unidades de produtos para revenda (milhões) 128,3 120,9 6,2 111,4 108,2 2,9 11,1 8,0 39,3 5,5 4,3 27,3
Receita Bruta 2.313,3 2.148,7 7,7 1.981,9 1.928,0 2,8 211,2 149,4 41,3 85,3 65,4 30,5
Receita Líquida 1.715,8 1.608,3 6,7 1.450,7 1.434,3 1,1 157,6 112,7 39,8 73,3 56,2 30,4
Lucro Bruto 1.218,0 1.137,0 7,1 1.025,0 1.016,8 0,8 114,6 79,4 44,3 50,4 37,8 33,1
Despesas com Vendas, Marketing e Logística (614,6) (550,6) 11,6 (497,7) (453,1) 9,9 (67,4) (54,3) 24,1 (42,2) (39,5) 7,0
Despesas Adm., P&D, TI e Projetos (251,6) (223,4) 12,6 (186,6) (189,4) (1,5) (10,4) (9,2) 12,9 (8,2) (6,1) 34,3
Remuneração dos Administradores (6,7) (6,4) 6,0 (6,7) (6,4) 6,0 0,0 0,0 0,0 0,0 0,0 0,0
Outras Receitas / (Despesas) Operacionais, líquidas 17,8 0,4 n/d 17,8 1,2 n/d (0,4) (0,8) (48,0) (0,0) 0,0 n/d
Receitas / (Despesas) Financeiras, líquidas (11,4) (39,8) (71,3) (8,0) (40,8) (80,3) (3,3) 1,4 n/d (0,4) (0,4) 9,7
Imposto de Renda e Contribuição Social (110,7) (102,2) 8,3 (102,7) (101,4) 1,2 (7,3) (0,4) n/d (0,3) (0,3) 5,1
Participação dos minoritários (0,7) 0,0 0,0 0,0 0,0 0,0 0,0 0,0 n/d 0,0 0,0 0,0
Lucro Líquido 240,2 215,1 11,7 241,0 226,9 6,2 25,9 16,2 59,8 (0,8) (8,4) (90,2)
EBITDA* 409,9 391,6 4,7 395,6 401,9 (1,6) 37,6 16,1 133,4 0,8 (7,1) (111,5)
Margem Bruta 71,0% 70,7% 0,3 pp 70,7% 70,9% (0,2) pp 72,8% 70,5% 2,3 pp 68,7% 67,3% 1,4 pp
Despesas Vendas, Marketing e Logística/Receita Líquida 35,8% 34,2% 1,6 pp 34,3% 31,6% 2,7 pp 42,8% 48,2% (5,4) pp 57,6% 70,2% (12,6) pp
Despesas Adm., P&D, TI e Projetos/Receita Líquida 14,7% 13,9% 0,8 pp 12,9% 13,2% (0,3) pp 6,6% 8,2% (1,6) pp 11,2% 10,9% 0,3 pp
Margem Líquida 14,0% 13,4% 0,6 pp 16,6% 15,8% 0,8 pp 16,4% 14,4% 2,1 pp (1,1)% (15,0)% n/d
Margem EBITDA 23,9% 24,3% (0,5) pp 27,3% 28,0% (0,8) pp 23,8% 14,3% 9,6 pp 1,1% (12,6)% n/d
(*) EBITDA = Lucro operacional antes dos efeitos financeiros, impostos, depreciação e amortização.
Acumulado Pró-Forma Pró-Forma
(R$ milhões) Consolidado5 Brasil Consolidação Implantação Novos Negócios
1S13 1S12 Var% 1S13 1S12 Var% 1S13 1S12 Var% 1S13 1S12 Var%
Consultoras - final do período ('000)6 1.574,8 1.505,5 4,6 1.248,9 1.226,0 1,9 205,0 174,3 17,6 118,8 102,5 15,9
Consultoras Média do período ('000) 1.565,4 1.457,1 7,4 1.256,3 1.193,0 5,3 195,1 163,9 19,1 111,8 97,4 14,8
Unidades de produtos para revenda (milhões) 239,9 233,4 2,8 209,6 208,9 0,3 20,2 15,6 29,7 9,7 8,3 16,4
Receita Bruta 4.145,7 3.860,8 7,4 3.578,6 3.468,1 3,2 366,3 264,0 38,7 150,5 117,3 28,3
Receita Líquida 3.067,1 2.884,1 6,3 2.615,2 2.574,5 1,6 273,4 198,8 37,6 129,3 100,9 28,1
Lucro Bruto 2.169,3 2.047,5 6,0 1.845,4 1.836,9 0,5 195,8 136,9 43,0 88,8 67,8 31,0
Despesas com Vendas, Marketing e Logística (1.118,0) (1.038,9) 7,6 (912,3) (866,0) 5,3 (123,3) (97,1) 26,9 (70,8) (68,5) 3,5
Despesas Adm., P&D, TI e Projetos (473,8) (401,0) 18,2 (356,4) (337,9) 5,5 (20,9) (16,1) 29,2 (15,5) (11,6) 33,0
Remuneração dos Administradores (12,2) (10,3) 18,4 (12,2) (10,3) 18,4 0,0 0,0 n/d 0,0 0,0 n/d
Outras Receitas / (Despesas) Operacionais, líquidas 17,5 (1,6) n/d 17,4 (0,1) n/d (0,2) (1,5) (85,0) 0,5 (0,0) n/d
Receitas / (Despesas) Financeiras, líquidas (49,2) (55,0) (10,5) (45,3) (57,2) (20,8) (3,7) 1,7 n/d (0,4) 0,5 n/d
Imposto de Renda e Contribuição Social (168,1) (174,1) (3,5) (158,5) (173,2) (8,5) (8,7) (0,5) n/d (0,4) (0,4) 9,8
Participação dos minoritários (0,7) 0,0 0,0 0,0 0,0 0,0 0,0 0,0 n/d 0,0 0,0 0,0
Lucro Líquido 364,8 366,6 (0,5) 378,0 392,1 (3,6) 39,0 23,4 67,1 2,2 (12,2) n/d
EBITDA* 671,9 663,7 1,2 665,1 686,8 (3,1) 53,8 24,3 121,5 4,6 (11,1) (141,7)
Margem Bruta 70,7% 71,0% (0,3) pp 70,6% 71,4% (0,8) pp 71,6% 68,9% 2,7 pp 68,7% 67,1% 1,5 pp
Despesas com Vendas/Receita Líquida 36,5% 36,0% 0,4 pp 34,9% 33,6% 1,2 pp 45,1% 48,9% (3,8) pp 54,8% 67,8% (13,0) pp
Despesas Administrativas e Gerais/Receita Líquida 15,4% 13,9% 1,5 pp 13,6% 13,1% 0,5 pp 7,6% 8,1% (0,5) pp 12,0% 11,5% 0,4 pp
Margem Líquida 11,9% 12,7% (0,8) pp 14,5% 15,2% (0,8) pp 14,3% 11,8% 2,5 pp 1,7% (12,1)% n/d
Margem EBITDA 21,9% 23,0% (1,1) pp 25,4% 26,7% (1,2) pp 19,7% 12,2% 7,5 pp 3,6% (11,0)% n/d
(*) EBITDA = Lucro operacional antes dos efeitos financeiros, impostos, depreciação e amortização.

Comentário de Desempenho 2T13
6
3.1 receita líquida No Brasil, o crescimento da receita no
trimestre ficou abaixo de nossas expectativas
principalmente em junho, em função de uma
menor frequência de pedidos de nossas
consultoras, além de um menor impacto no
conjunto dos lançamentos ao longo do
período.
Neste trimestre, a menor frequência de
compra impactou diretamente o número de
consultoras disponíveis7 e seu respectivo
crescimento. A produtividade8 das
consultoras apresentou uma queda de 60
pontos base (R$ 2.254 no 2T13 vs. R$ 2.267 no 2T12).
No 2T13, como descrito na tabela ao lado e
também relatado nos trimestres anteriores, o
crescimento da receita líquida inferior ao
crescimento da receita bruta foi resultado do
aumento da carga tributária – elevação da MVA9
de São Paulo desde 1 de agosto de 2012.
Esperamos que esta condição esteja normalizada a
partir do quarto trimestre de 2013.
As Operações Internacionais, sem impacto de aquisições (Aesop), representaram 14,0% da receita
líquida consolidada no trimestre (13,6% nos 1S13). A continuidade do crescimento acelerado é
resultado do expansão da base de consultoras e do aumento da frequência de compra das mesmas.
Nas Operações em Consolidação o crescimento foi de 38,9% em moeda local no 2T13 versus o ano
anterior (31,9% no 1S13), reflexo do crescimento da base de consultoras na ordem de 17,5% no
trimestre (19,1% no acumulado) e aumento de produtividade, com destaque para o bom
7 Consideramos como disponíveis todas as consultoras que fazem ao menos um pedido num período de 4 ciclos de vendas consecutivos. 8 Produtividade a preços de varejo = (receita bruta do período/número de consultoras média do período)/(1- %lucro da consultora) 9 MVA (Margem de Valor Agregado): percentual utilizado para estimar a margem média praticada pelas consultoras, parâmetro para a formação da base de cálculo do ICMS-ST (substituição tributária).
-5,7%
-2,6%
1,4%2,9%
-3,8%
-0,6%
1T12 2T12 3T12 4T12 1T13 2T13
Produtividade (% vs ano anterior)
Brasil
1.179 1.226 1.227 1.268 1.258 1.249
158 174 184 191 189 20595 103 105 111 108 1191.435 1.506 1.518 1.573 1.557 1.575
16,3% 16,2% 11,5% 10,7% 8,5% 4,6%
1T12 2T12 3T12 4T12 1T13 2T13
Consultoras - posição final do período
Brasil em Consolidação
em Implantação
Cresc. Consolidado YOY
Brasil (R$ milhões) 2T12 1T13 2T132T13 vs.
2T12
Receita Bruta 1.928,0 1.596,7 1.981,9 2,8%
Impostos 493,7 432,1 531,2 7,6%
Carga Tributária 25,6% 27,1% 26,8% 1,2 pp
Receita Líquida 1.434,3 1.164,5 1.450,7 1,1%
11,3%15,4% 14,8%
12,2%
5,9% 6,7%
8,3%12,5% 11,4% 8,9%
2,1% 1,1%
45,5%48,6% 48,9%
46,4%
31,3%36,7%
1T12 2T12 3T12 4T12 1T13 2T13
Crescimento Receita Líquida (R$ - % vs ano anterior)
Consolidado Brasil Operações em Consolidação e Implantação

Comentário de Desempenho 2T13
7
desempenho da Argentina. Relembramos que no 2T12 a operação na Argentina foi impactada pela
alta indisponibilidade dos estoques, reflexo das dificuldades de importação naquele período. Nas
Operações em Implantação, que apresentaram 19,7% de crescimento em moeda local no trimestre
(15,1% no 1S13), os ajustes feitos desde o 1T13 no modelo de Rede de Relações Sustentáveis do
México já permitiram um aumento da frequência de compra das consultoras.
3.2 inovação & produtos
O índice de inovação10, com base em junho
de 2013, ficou ligeiramente abaixo dos
trimestres anteriores, porém dentro do
patamar esperado. Na segunda metade do
2T13 relançamos a linha de maquiagem
Aquarela e alguns produtos da linha de
cabelos Plant. No 1S13, investimos 2,6% da
receita líquida em P&D versus 2,5% no 1S12.
3.3 margem bruta
No trimestre a margem bruta consolidada apresentou avanço de 30 pontos base frente ao 2T12. A
expansão de 210 pontos base nas Operações Internacionais, resultado de condições cambiais
favoráveis e maior eficiência promocional, compensaram a queda de 20 pontos base na margem
bruta no Brasil.
No Brasil, a retração mencionada ainda foi impactada negativamente pelo aumento da carga
tributária ocorrido em agosto de 2012, porém quase que totalmente compensado pela relação
positiva preço-custo.
O quadro abaixo exibe o custo aberto em seus principais componentes:
10 Índice de Inovação: participação nos últimos 12 meses da venda dos produtos lançados nos últimos 24 meses.
67,0% 67,9% 67,3% 67,2%65,0% 65,3%
1T12 2T12 3T12 4T12 1T13 2T13
Inovação (%RL)
71,4%70,7%
71,3%
69,3%
70,4% 71,0%
71,9%
70,9%71,5%
69,3%
70,5%
70,7%
66,8%
69,4%
70,4%
69,2%
69,6%
71,5%
1T12 2T12 3T12 4T12 1T13 2T13
Margem Bruta (%RL)
Consolidado Brasil Operações em Consolidação e Implantação
2T13 2T12 1S13 1S12
81,9 83,4 81,2 81,6
9,6 8,6 10,1 9,9
2,4 2,5 2,6 2,7
6,1 5,5 6,0 5,8
Total 100,0 100,0 100,0 100,0
*Matéria - Prima, Material de Embalagem e Produto Acabado
MP / ME / PA*
Mão de Obra
Depreciação
Outros

Comentário de Desempenho 2T13
8
3.4 despesas operacionais
No Brasil, o aumento relativo à receita líquida
das despesas com vendas, marketing e
logística foi resultado de uma menor diluição
de despesas, do incremento em despesas com
armazenagem pela venda abaixo das
expectativas, além de maiores investimentos
em marketing, como o início das iniciativas de
lançamento da linha SOU. Já nas Operações
Internacionais, a redução relativa das
despesas com vendas, marketing e logística é
resultado da maior diluição das despesas fixas dessas operações e de um faseamento diferente das
despesas de marketing.
No Brasil, as despesas administrativas, P&D, TI e Projetos ficaram estáveis no 2T13. O
aumento planejado de investimentos em
P&D acima do crescimento das vendas e o
aumento da depreciação, reflexo dos
investimentos já realizados em TI, foram
compensados por ganhos de eficiência em
despesas discricionárias, além de créditos
de impostos do primeiro semestre. Nas
Operações Internacionais, a redução
relativa das despesas administrativas foi
resultado de uma maior alavancagem que
compensou os investimentos em sistemas
no México, necessários para gerir o modelo
Rede de Relações Sustentáveis.
3.5 outras despesas e receitas operacionais
No 2T13, contemplando o Brasil e as Operações Internacionais, tivemos receita de R$ 17,8 milhões
frente à receita de R$ 0,4 milhão no 2T12 (1S13 receita de R$ 17,5 milhões versus despesa de R$ 1,6
milhão no 1S12). No Brasil, este resultado reflete principalmente a venda de um imóvel em
Itapecerica da Serra e créditos extemporâneos de impostos.
3.6 outros investimentos internacionais
Os outros investimentos internacionais, que dizem respeito à operação na França, à estrutura
corporativa internacional baseada em Buenos Aires e à operação AESOP acrescidos dos custos
relacionados à aquisição, registraram prejuízo (EBITDA) de R$ 24,1 milhões no 2T13 (prejuízo de R$
19,3 milhões no 2T12) e no 1S13 o prejuízo foi de R$ 51,6 milhões (prejuízo de R$ 36,2 milhões no
1S12). O aumento destes investimentos tem como principal motivo a inflação na Argentina que
impactou as despesas corporativas.
31,6% 33,6%
55,5% 55,3%
34,3% 34,9%
47,5% 48,2%
Trimestre Acumulado Trimestre Acumualdo
Despesas com Vendas, Marketing e Logística (%RL)
2012 2013
BrasilOperações em Consolidação e
Implatação
13,6% 13,5%
9,1% 9,3%
13,3% 14,1%
8,1%9,0%
Trimestre Acumulado Trimestre Acumualdo
Despesas Administrativas, P&D, TI, Projetos, PLR e
Remuneração dos Administradores (%RL)
2012 2013
BrasilOperações em Consolidação e
Implatação

Comentário de Desempenho 2T13
9
3.7 EBITDA
No 2T13, o EBITDA consolidado totalizou R$ 409,9 milhões e cresceu 4,7% frente ao mesmo período
de 2012 (margem EBITDA de 23,9% no 2T13 versus 24,3% no 2T12). No Brasil houve redução de
1,6% do EBITDA, resultado das vendas abaixo das expectativas e do aumento das despesas com
vendas. Esta redução foiparcialmente compensada por efeitos não recorrentes – venda de imóvel em
Itapecerica da Serra e créditos tributários. Além disso, o resultado das Operações Internacionais
contribuiu positivamente para o EBITDA consolidado.
EBITDA (R$ milhões)11 Dados contemplam operação e custo de transação da AESOP
EBITDA pró-forma por bloco de operações (R$ milhões) Dados contemplam operação e custo de transação da AESOP
3.8 lucro líquido
O crescimento do lucro líquido no trimestre
foi de 11,7%, com expansão da margem
líquida de 0,6pp. A redução de 71,3% do
resultado financeiro compensou os efeitos,
explicados anteriormente, que impactaram
negativamente no EBITDA.
11 Ajuste no 2T13 referente a Participação de Minoritários do 1T13 que foi divulgado na linha de “outras receitas e despesas” na época e agora corretamente discriminada na linha de participação de minoritários.
2T13 2T12 Var % 1S13 1S12 Var %
Brasil 395,6 401,9 (1,6) 665,1 686,8 (3,1)
Argentina, Chile e Peru 37,6 16,1 133,4 53,8 24,3 121,5
México, Colômbia 0,8 (7,1) n/d 4,6 (11,1) n/d
Outros Investimentos (24,1) (19,3) 24,6 (51,6) (36,2) 42,6
EBITDA 409,9 391,6 4,7 671,9 663,7 1,2
11,9%
13,4%
15,0%13,7%
9,2%
14,0%
1T12 2T12 3T12 4T12 1T13 2T13
Margem Líquida (%RL)
2T13 2T12 Var % 1S13 1S12 Var %
Receita Líquida 1.715,8 1.608,3 6,7 3.067,1 2.884,1 6,3
(-) Custos e Despesas 1.352,9 1.251,3 8,1 2.484,3 2.288,5 8,6
EBIT 363,0 357,0 1,7 582,8 595,7 (2,2)
Ajustes de Participação dos minoritários (0,2) 0,0 0,0 0,0 0,0 0,0
(+) Depreciação / amortização 47,1 34,6 36,2 89,2 68,1 31,0
EBITDA 409,9 391,6 4,7 671,9 663,7 1,2
Comentário de Desempenho 2T13
10
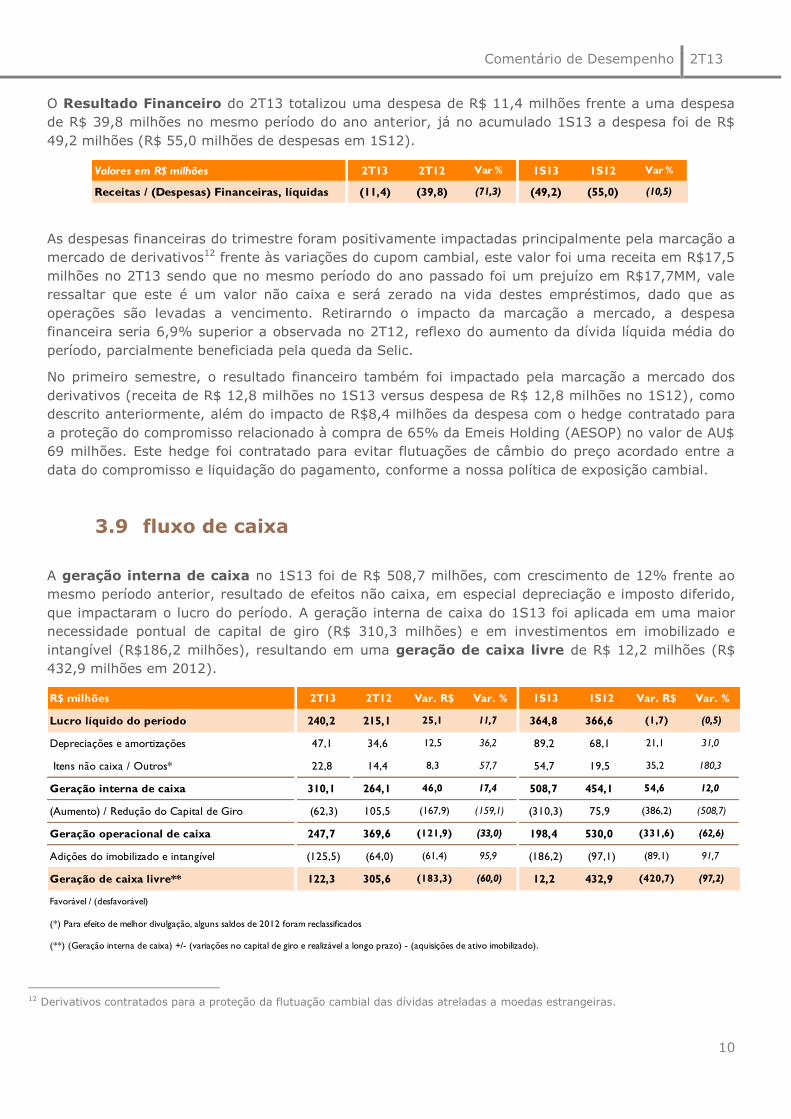
O Resultado Financeiro do 2T13 totalizou uma despesa de R$ 11,4 milhões frente a uma despesa
de R$ 39,8 milhões no mesmo período do ano anterior, já no acumulado 1S13 a despesa foi de R$
49,2 milhões (R$ 55,0 milhões de despesas em 1S12).
As despesas financeiras do trimestre foram positivamente impactadas principalmente pela marcação a
mercado de derivativos12 frente às variações do cupom cambial, este valor foi uma receita em R$17,5
milhões no 2T13 sendo que no mesmo período do ano passado foi um prejuízo em R$17,7MM, vale
ressaltar que este é um valor não caixa e será zerado na vida destes empréstimos, dado que as
operações são levadas a vencimento. Retirarndo o impacto da marcação a mercado, a despesa
financeira seria 6,9% superior a observada no 2T12, reflexo do aumento da dívida líquida média do
período, parcialmente beneficiada pela queda da Selic.
No primeiro semestre, o resultado financeiro também foi impactado pela marcação a mercado dos
derivativos (receita de R$ 12,8 milhões no 1S13 versus despesa de R$ 12,8 milhões no 1S12), como
descrito anteriormente, além do impacto de R$8,4 milhões da despesa com o hedge contratado para
a proteção do compromisso relacionado à compra de 65% da Emeis Holding (AESOP) no valor de AU$
69 milhões. Este hedge foi contratado para evitar flutuações de câmbio do preço acordado entre a
data do compromisso e liquidação do pagamento, conforme a nossa política de exposição cambial.
3.9 fluxo de caixa
A geração interna de caixa no 1S13 foi de R$ 508,7 milhões, com crescimento de 12% frente ao
mesmo período anterior, resultado de efeitos não caixa, em especial depreciação e imposto diferido,
que impactaram o lucro do período. A geração interna de caixa do 1S13 foi aplicada em uma maior
necessidade pontual de capital de giro (R$ 310,3 milhões) e em investimentos em imobilizado e
intangível (R$186,2 milhões), resultando em uma geração de caixa livre de R$ 12,2 milhões (R$
432,9 milhões em 2012).
12 Derivativos contratados para a proteção da flutuação cambial das dívidas atreladas a moedas estrangeiras.
R$ milhões 2T13 2T12 Var. R$ Var. % 1S13 1S12 Var. R$ Var. %
Lucro líquido do período 240,2 215,1 25,1 11,7 364,8 366,6 (1,7) (0,5)
Depreciações e amortizações 47,1 34,6 12,5 36,2 89,2 68,1 21,1 31,0
Itens não caixa / Outros* 22,8 14,4 8,3 57,7 54,7 19,5 35,2 180,3
Geração interna de caixa 310,1 264,1 46,0 17,4 508,7 454,1 54,6 12,0
(Aumento) / Redução do Capital de Giro (62,3) 105,5 (167,9) (159,1) (310,3) 75,9 (386,2) (508,7)
Geração operacional de caixa 247,7 369,6 (121,9) (33,0) 198,4 530,0 (331,6) (62,6)
Adições do imobilizado e intangível (125,5) (64,0) (61,4) 95,9 (186,2) (97,1) (89,1) 91,7
Geração de caixa livre** 122,3 305,6 (183,3) (60,0) 12,2 432,9 (420,7) (97,2)
Favorável / (desfavorável)
(*) Para efeito de melhor divulgação, alguns saldos de 2012 foram reclassificados
(**) (Geração interna de caixa) +/- (variações no capital de giro e realizável a longo prazo) - (aquisições de ativo imobilizado).
Valores em R$ milhões 2T13 2T12 Var % 1S13 1S12 Var %
Receitas / (Despesas) Financeiras, líquidas (11,4) (39,8) (71,3) (49,2) (55,0) (10,5)

Comentário de Desempenho 2T13
11
Houve aumento do capital de giro em função da elevação dos estoques por vendas abaixo das
expectativas e um parcelamento diferente das faturas do ciclo de vendas de Namorados, aumentando
atipicamente o contas a receber. Adicionalmente, destacamos que quando comparamos a variação
entre junho de 2013 e dezembro de 2012, a posição nesta última data estava favorecida em cerca de
R$ 80 milhões por uma maior concentração de gastos com mídia e capex naquele período, conforme
comentamos no 1T13. Lembramos também que a variação do capital de giro do 1S12 foi beneficiada
pela posição desfavorável no final de 2011, devido a não provisão de PLR, créditos de impostos de
PIS/COFINS sobre serviços, além de uma maior cobertura dos estoques.
Alguns fatores que contribuíram para o aumento da posição de capital de giro no 2T13 serão
revertidos ao longo dos próximos meses.
Com relação aos investimentos em imobilizado e intangível, em 2013 tivemos um faseamento
diferente do observado em 2012 com uma maior concentração no primeiro semestre (R$ 186,2
milhões no 1S13 versus R$ 97,1 milhões no 1S12), com destaque para os investimentos em nossas
fábricas no Pará e em Cajamar, além de moldes para lançamentos e tecnologia da informação.
Mantemos o guidance de R$ 450,0 milhões para 2013 (R$ 437,4 milhões em 2012).
3.10 endividamento
O aumento do endividamento total e da dívida líquida reflete a necessidade pontual de investimento
em capital de giro, os investimentos em imobilizado e intangíveis e a aquisição de 65% da AESOP.
Neste trimestre, observamos um alongamento da dívida com vencimentos mais concentrados em
2015. Em maio/2013 liquidamos a debenture com principal de aproximadamente R$ 350 milhões e
contratamos novas linhas de crédito para o longo prazo.
4. dividendos
O Conselho de Administração da companhia, em reunião realizada em 24 de julho de 2013, aprovou
proposta da diretoria para o pagamento, em 15 de agosto de 2013, de dividendos referentes aos
resultados auferidos no primeiro semestre de 2013 e juros sobre o capital próprio referentes ao
período de 1º de janeiro de 2013 a 24 de julho de 2013, no montante de R$ 337,3 milhões e R$ 27,5
milhões (R$ 23,4 milhões, líquidos de imposto de renda na fonte), respectivamente.
Esses dividendos e juros sobre o capital próprio, somados, referentes ao primeiro semestre de 2013
representarão uma remuneração líquida de R$ 0,8384 por ação a serem pagos em 15 de agosto de
2013 para os acionistas na posição de 31 de julho de 2013, sendo que, a partir de 01 de agosto de
2013, as ações da companhia serão negociadas “ex” dividendos e “ex” JCP. Os juros sobre o capital
próprio serão contabilizados em julho de 2013.
Endividamento R$ Mil jun/13 Part (%) jun/12 Part (%) Var. (%)
Curto Prazo 404,7 21,1 1.088,8 75,4 (62,8)
Longo Prazo 1.892,7 98,5 476,4 33,0 297,3
Instrumentos financeiros derivativos (141,0) (7,3) (65,7) (4,6) 114,5
Arrendamentos Mercantis - Financeiros (235,1) (12,2) (56,0) (3,9) 319,9
Total da Dívida 1.921,3 100,0 1.443,5 100,0 33,1
(-) Caixa e Aplicações Financeiras 778,8 803,3 (3,0)
(=) Endividamento Líquido - Caixa Líquido 1.142,5 640,2 78,5
Dívida Líquida / Ebitda 0,75 0,43
Total Dívida / Ebitda 1,26 0,96
Comentário de Desempenho 2T13
12
5. desempenho
NATU3
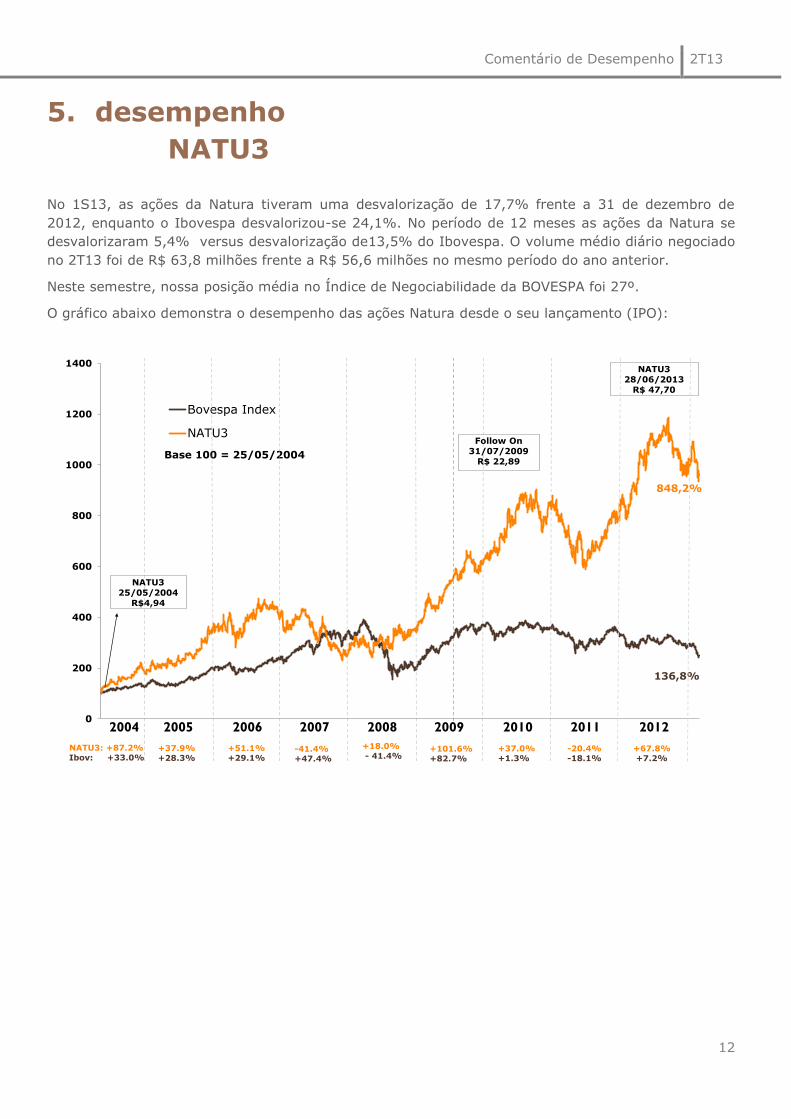
No 1S13, as ações da Natura tiveram uma desvalorização de 17,7% frente a 31 de dezembro de
2012, enquanto o Ibovespa desvalorizou-se 24,1%. No período de 12 meses as ações da Natura se
desvalorizaram 5,4% versus desvalorização de13,5% do Ibovespa. O volume médio diário negociado
no 2T13 foi de R$ 63,8 milhões frente a R$ 56,6 milhões no mesmo período do ano anterior.
Neste semestre, nossa posição média no Índice de Negociabilidade da BOVESPA foi 27º.
O gráfico abaixo demonstra o desempenho das ações Natura desde o seu lançamento (IPO):
848,2%
0
200
400
600
800
1000
1200
1400
Base 100 = 25/05/2004
Bovespa Index
NATU3
NATU3: +87.2%
Ibov: +33.0%+37.9%
+28.3%
+51.1%
+29.1%-41.4%
+47.4%
+18.0%
- 41.4%+101.6%
+82.7%
+37.0%
+1.3%
NATU3
25/05/2004
R$4,94
2004 2005 2006 2007 2008 2009 2010
NATU3
28/06/2013
R$ 47,70
136,8%
Follow On
31/07/2009
R$ 22,89
2011
-20.4%
-18.1%
2012
+67.8%
+7.2%

Comentário de Desempenho 2T13
13
teleconferência
& webcast
PORTUGUÊS: Sexta-feira, 26 de julho de 2013
10h00 – horário de Brasília
INGLÊS: Sexta-feira, 26 de julho de 2013
12h00 – horário de Brasília
Participantes do Brasil: +55 11 4688 6341
Participantes dos EUA: Toll Free + 1 855 281 6021
Participantes de outros países: +1 786 924 6977
Senha para os participantes: Natura
Transmissão ao vivo pela internet:
www.natura.net/investidor
relações
com investidores
Telefone: (11) 4196-1421
Fabio Cefaly, [email protected]
Tatiana Bravin, [email protected]
Taísa Hernandez, [email protected]
Yakatherine Menendez, [email protected]

Comentário de Desempenho 2T13
14
balanços
patrimoniais em junho de 2013 e dezembro de 2012 (em milhões de reais - R$)
ATIVO jun/13 dez/12 PASSIVO jun/13 dez/12
CIRCULANTE CIRCULANTE
Caixa e equivalentes de caixa 592,4 1.144,4 Empréstimos e financiamentos 404,7 999,5
Títulos e valores mobiliários 186,4 498,7 Fornecedores e outras contas a pagar 620,9 649,9
Contas a receber de clientes 687,6 651,4 Salários, participações nos resultados e encargos sociais 194,2 211,8
Estoques 836,4 700,7 Obrigações tributárias 464,4 501,5
Impostos a recuperar 185,0 144,5 Outras obrigações 62,0 52,0
Instrumentos financeiros derivativos 141,0 80,9 Dividendos e juros sobre o capital próprio a pagar 0,0 0,0
Outros ativos circulantes 200,2 157,8 Total do passivo circulante 1.746,1 2.414,7
Total do ativo circulante 2.828,9 3.378,3
NÃO CIRCULANTE NÃO CIRCULANTE
Realizável a longo prazo: Empréstimos e financiamentos 1.892,7 1.325,1
Impostos a recuperar 170,4 151,4 Obrigações tributárias 198,9 177,3
Imposto de renda e contribuição social diferidos 203,7 214,2 Provisão para riscos tributários, cíveis e trabalhistas 63,3 63,3
Depósitos judiciais 385,8 349,5 Outras provisões 199,0 89,0
Outros ativos não circulantes 37,2 41,3 Total do passivo não circulante 2.353,8 1.654,6
Imobilizado 1.257,7 1.012,1
Intangível 368,4 228,5 PATRIMÔNIO LÍQUIDO
Total do ativo não circulante 2.423,2 1.997,1 Capital social 427,1 427,1
Reservas de capital 149,9 155,9
Reservas de lucros 597,9 308,1
Ações em tesouraria (34,7) (66,1)
Dividendo adicional proposto 0,0 491,3
Outros resultados abrangentes (7,1) (10,2)
Reserva para aquisição de não controladores 0,0 0,0
Total do patrimônio líquido - acionistas controladores 1.133,1 1.306,1
Participação dos acionistas não controladores no patrimônio
líquido das controladas
Total do patrimônio líquido 1.152,2 1.306,1
TOTAL DO ATIVO 5.252,1 5.375,4 TOTAL DO PASSIVO E PATRIMÔNIO LÍQUIDO 5.252,1 5.375,4
19,1 0,0

Comentário de Desempenho 2T13
15
demonstrações
dos resultados para os exercícios findos em 30 de junho de 2013 e de 2012
(R$ milhões) 2T13 2T12 1S13 1S12
RECEITA LÍQUIDA 1.715,8 1.608,3 3.067,1 2.884,1
Custo dos produtos vendidos (497,8) (471,3) (897,8) (836,6)
LUCRO BRUTO 1.218,0 1.137,0 2.169,3 2.047,5
(DESPESAS) RECEITAS OPERACIONAIS
Com vendas (614,6) (550,6) (1.118,0) (1.038,9)
Administrativas e gerais (251,6) (223,5) (473,8) (401,0)
Remuneração dos administradores (6,7) (6,4) (12,2) (10,3)
Outras receitas (despesas) operacionais, líquidas 18,0 0,4 17,5 (1,6)
Receitas financeiras 122,4 59,2 188,6 94,3
Despesas financeiras (133,8) (98,9) (237,8) (149,3)
Imposto de renda e contribuição social (110,7) (102,1) (168,1) (174,1)
Não controladores (0,8) 0,0 (0,7) 0,0
LUCRO LÍQUIDO 240,2 215,1 364,8 366,6
ATRIBUÍVEL A
Acionistas da Sociedade 240,2 215,1 364,8 366,6
Não controladores 0,8 0,0 0,7 0,0
241,0 215,1 365,5 366,6
540,7LUCRO ANTES DO IMPOSTO DE RENDA E
DA CONTRIBUIÇÃO SOCIAL
595,6
317,2351,7
LUCRO OPERACIONAL ANTES DO
RESULTADO FINANCEIRO
363,1 357,0 582,8
533,6

Comentário de Desempenho 2T13
16
demonstrações
dos fluxos de caixa para os exercícios findos em 30 de junho de 2013 e de 2012
(R$ milhões) 1S13 1S12
FLUXO DE CAIXA DAS ATIVIDADES OPERACIONAIS
Lucro líquido do período 364,8 366,6
Depreciações e amortizações 89,2 68,1
Reversão decorrente dos contratos de operações com derivativos "swap" e "forward" (49,6) (37,1)
Provisões para riscos tributários, cíveis e trabalhistas 2,5 9,3
Atualização monetária de depósitos judiciais (8,3) (10,3)
Imposto de renda e contribuição social 168,1 174,1
Resultado na venda e baixa de ativo imobilizado e intangível (8,7) (1,3)
Resultado de equivalência patrimonial 0,0 0,0
Juros e variação cambial sobre empréstimos e financiamentos 141,5 83,0
Variação cambial sobre outros ativos e passivos 4,2 11,0
Despesas com planos de outorga de opções de compra de ações 5,4 6,3
Reversão deságio na alienação de créditos de ICMS (3,5) 0,0
Provisão para créditos de liquidação duvidosa 15,1 7,8
Provisão (Reversão) para perdas nos estoques 8,8 (3,5)
Lucro líquido do período atribuível a não controladores 0,7 0,0
Provisão com plano de assistência médica e créditos carbono 0,6 12,1
Reconhecimento de crédito tributário extemporâneo (6,8) (3,5)
723,9 682,5
(AUMENTO) REDUÇÃO DOS ATIVOS
Contas a receber de clientes (51,3) 79,7
Estoques (144,5) (38,2)
Impostos a recuperar (49,4) 15,3
Outros ativos (38,3) 2,6
Subtotal (283,4) 59,4
AUMENTO (REDUÇÃO) DOS PASSIVOS
Fornecedores nacionais e estrangeiros (30,3) (31,5)
Salários, participações nos resultados e encargos sociais, líquidos (17,6) 36,3
Obrigações tributárias (47,9) 8,5
Outros passivos 2,0 21,9
Provisão para riscos tributários, cíveis e trabalhistas (2,5) (3,0)
Subtotal (96,4) 32,3
CAIXA GERADO PELAS ATIVIDADES OPERACIONAIS 344,1 774,2
Ajustes para reconciliar o lucro líquido do exercício com o caixa líquido gerado pelas atividades
operacionais:

Comentário de Desempenho 2T13
17
OUTROS FLUXOS DE CAIXA DAS ATIVIDADES OPERACIONAIS
Pagamentos de imposto de renda e contribuição social (125,1) (187,7)
Pagamentos de recursos por liquidação de operações com derivativos (10,5) (7,9)
Pagamento de juros sobre empréstimos e financiamentos (50,4) (26,4)
CAIXA LÍQUIDO GERADO PELAS ATIVIDADES OPERACIONAIS 158,1 552,2
FLUXO DE CAIXA DAS ATIVIDADES DE INVESTIMENTO
Adições de imobilizado e intangível (186,2) (97,1)
Imobilizado incorporado pela Compra AESOP (129,1) 0,0
Recebimento pela venda de ativo imobilizado e intangível 21,2 3,1
Aplicação em títulos e valores mobiliários (2.725,1) (832,8)
Regate de títulos e valores mobiliários 3.037,3 131,9
Pagamento de depósitos judiciais (28,0) (24,2)
Caixa adquirido na combinação de negócios 19,1 0,0
CAIXA LÍQUIDO UTILIZADO NAS ATIVIDADES DE INVESTIMENTO 9,3 (819,1)
FLUXO DE CAIXA DAS ATIVIDADES DE FINANCIAMENTO
Amortização de empréstimos e financiamentos - principal (688,9) (88,3)
Captações de empréstimos e financiamentos 433,0 410,2
Utilização de ações em tesouraria pelo exercício de opções de compra de ações 27,4 23,3
Pagamento de dividendos e juros sobre capital próprio (491,3) (491,0)
CAIXA LÍQUIDO GERADO (UTILIZADO) NAS ATIVIDADES DE FINANCIAMENTO (719,8) (145,8)
Efeito de variação cambial sobre o caixa e equivalentes de caixa 0,3 (0,6)
AUMENTO (REDUÇÃO) NO CAIXA E EQUIVALENTES DE CAIXA (552,0) (413,3)
Saldo inicial do caixa e equivalentes de caixa 1.144,4 515,6
Saldo final do caixa e equivalentes de caixa 592,4 102,4
AUMENTO (REDUÇÃO) NO CAIXA E EQUIVALENTES DE CAIXA (552,0) (413,3)
Informações adicionais às demonstrações dos fluxos de caixa:
Numerários com utilização restrita 0,0 6,9
Limites de contas garantidas sem utilização 117,9 235,5
As notas explicativas são parte integrante das demonstrações contábeis consolidadas condensadas.

Comentário de Desempenho 2T13
18
Glossário
_CDI: Certificado de depósito interbancário.
_CN: Revendedoras autônomas, que não têm relação de emprego com a Natura, também chamadas Consultoras Natura.
_CNO: Revendedoras autônomas, que não têm relação de emprego conosco, e apoiam as Gerentes de Relacionamento em
suas atividades, também chamadas de Consultoras Natura Orientadoras.
_Comunidades Fornecedoras: Comunidades de agricultores familiares e extrativistas de diversas localidades do Brasil –
majoritariamente da Região Amazônica que extraem de forma sustentável insumos da sociobiodiversidade utilizados em nossos
produtos. Estabelecemos com essas comunidades cadeias produtivas que se pautam pelo preço justo, repartição de benefícios
pelo acesso ao patrimônio genético e aos conhecimentos tradicionais associados e apoio a projetos de desenvolvimento
sustentável local. Esse modelo de negócio tem se mostrado efetivo na geração de valor social, econômico e ambiental para a
Natura e para as comunidades.
_GEE: Gases de Efeito Estufa.
_Índice de Inovação: Participação nos últimos 12 meses da venda dos produtos lançados nos últimos 24 meses.
_Instituto Natura: é uma organização sem fins lucrativos criada em 2010 para fortalecer e ampliar nossas iniciativas de
Investimento Social Privado. Sua criação nos permitiu potencializar os esforços e investimentos em ações que contribuam para
a melhoria da qualidade do ensino público.
_Mercado Alvo: Referente aos dados de mercado alvo da SIPATESP/Abihpec. Considera somente os segmentos nos quais a
Natura opera. Exclui fraldas, itens de higiene oral, tintura para cabelo, esmaltes, absorventes dentre outros.
_Operações em Consolidação: Agrupamento das operações: Argentina, Chile e Peru.
_Operações em Implantação: Agrupamento das Operações: Colômbia e México.
_PLR: Participação nos Lucros e Resultados.
_Programa Natura Crer Para Ver: Linha especial de produtos não cosméticos, cujo lucro é revertido para o Instituto Natura,
no Brasil, e investido pela Natura em ações sociais nos demais países onde operamos. Nossas consultoras e consultores se
engajam nas vendas em prol de seu benefício social, sem obter ganhos.
_Rede de Relações Sustentáveis: Modelo Comercial adotado no México que contempla oito etapas de avanço da consultora:
Consultora Natura, Consultora Natura Empreendedora, Formadora Natura 1 e 2, Transformadora Natura 1 e 2, Inspiradora
Natura e Associada Natura. Para ascender na atividade, é preciso atender a critérios de volume de vendas, atração de novas
consultoras e – como diferencial dos demais modelos existentes no país – desenvolvimento pessoal e de relações
socioambientais na comunidade.
_Repartição de Benefícios: Com base na Política Natura de Uso Sustentável da Biodiversidade e do Conhecimento
Tradicional Associado, é utilizada a premissa de repartir benefícios sempre que percebermos diferentes formas de valor nos
acessos que realizamos. Sendo assim, uma das práticas que definem a forma como esses recursos serão divididos é associar
pagamentos ao número de matérias-primas produzidas a partir de cada planta e ao sucesso comercial dos produtos para os
quais essas matérias-primas servem de insumo.
_Sipatesp/Abihpec: Sindicato da Indústria de Perfumarias de Artigos de Toucador do Estado de São Paulo / Associação
Brasileira da Indústria de Higiene Pessoal, Perfumaria e Cosméticos.
reapresentações
_Produtividade com nova metodologia de cálculo: a preços de varejo = (receita bruta/número de consultoras media)/ (1- % lucro da consultora). _Composição do Custo: Reapresentação dos valores do quadro com a abertura entre: Matéria Prima e Embalagem, Mão de Obra, depreciação e outros, referentes ao 2T12 e 1S12.
Comentário de Desempenho 2T13
19
O EBITDA não é uma medida utilizada nas práticas contábeis adotadas no Brasil, não representando o
fluxo de caixa para os períodos apresentados. Também não deve ser considerado como uma
alternativa ao lucro líquido na qualidade de indicador do desempenho operacional ou uma alternativa
ao fluxo de caixa na qualidade de indicador de liquidez. O EBITDA não tem um significado
padronizado e sua definição na Sociedade, eventualmente, pode não ser comparável ao LAJIDA ou
EBITDA definido por outras companhias. Ainda que o EBITDA não forneça, de acordo com as práticas
contábeis adotadas no Brasil, uma medida do fluxo de caixa, a Administração o utiliza para mensurar
o desempenho operacional da Sociedade. Adicionalmente, entendemos que determinados investidores
e analistas financeiros utilizam o EBITDA como indicador do desempenho operacional de uma
companhia e/ou de seu fluxo de caixa.
Este relatório contém informações futuras. Tais informações não são apenas fatos históricos, mas
refletem os desejos e as expectativas da direção da Natura. As palavras “antecipa”, “deseja”,
“espera”, “prevê”, “pretende”, “planeja”, “prediz”, “projeta”, “almeja” e similares, pretendem
identificar afirmações que, necessariamente, envolvem riscos conhecidos e desconhecidos. Riscos
conhecidos incluem incertezas, que não são limitadas ao impacto da competitividade dos preços e
produtos, aceitação dos produtos no mercado, transições de produto da Companhia e seus
competidores, aprovação regulamentar, moeda, flutuação da moeda, dificuldades de fornecimento e
produção e mudanças na venda de produtos, dentre outros riscos. Este relatório também contém
algumas informações “pró-forma”, elaboradas pela Companhia a título exclusivo de informação e
referência, portanto, são grandezas não auditadas. Este relatório está atualizado até a presente data
e a Natura não se obriga a atualizá-lo mediante novas informações e/ou acontecimentos futuros.

Earnings Release 2Q13
0
São Paulo, July 24, 2013 – Natura Cosméticos S.A. (BM&FBOVESPA: NATU3)
announces today its results for the second quarter of 2013 (2Q13). Except where
stated otherwise, the financial and operating information in this release is presented
on a consolidated basis, in accordance with International Financial Reporting
Standards (IFRS).
Earnings Release 2Q13
1
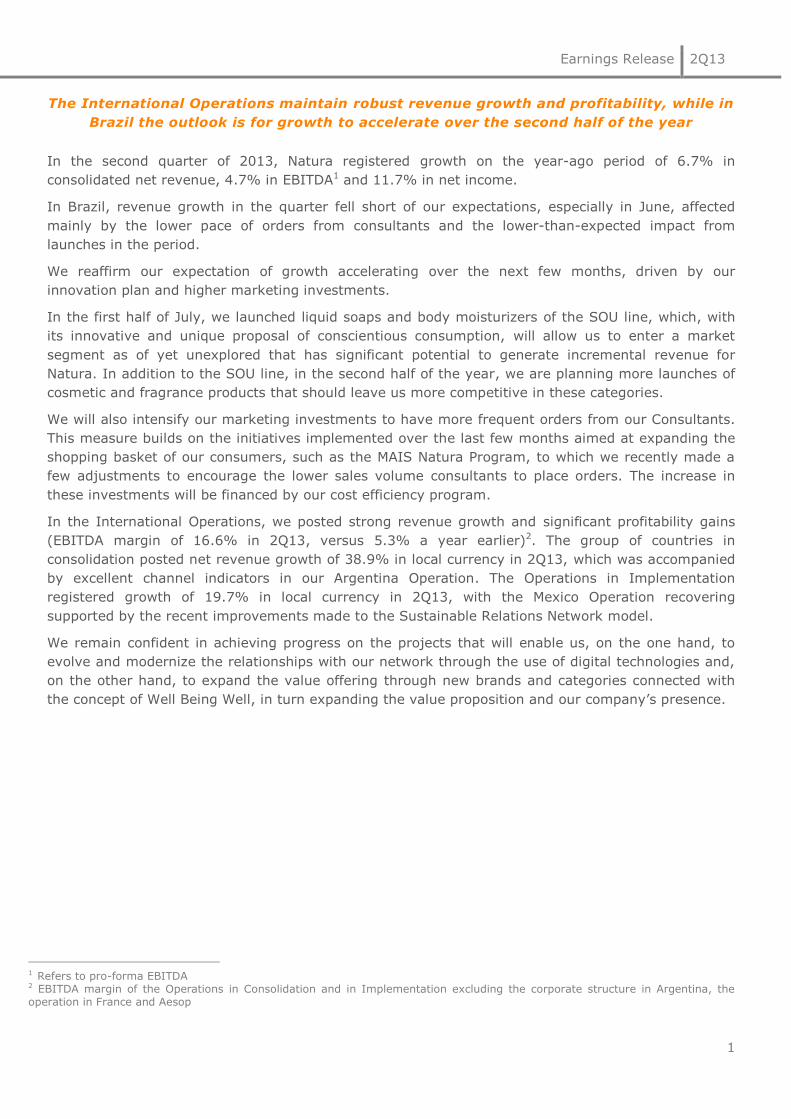
The International Operations maintain robust revenue growth and profitability, while in
Brazil the outlook is for growth to accelerate over the second half of the year
In the second quarter of 2013, Natura registered growth on the year-ago period of 6.7% in
consolidated net revenue, 4.7% in EBITDA1 and 11.7% in net income.
In Brazil, revenue growth in the quarter fell short of our expectations, especially in June, affected
mainly by the lower pace of orders from consultants and the lower-than-expected impact from
launches in the period.
We reaffirm our expectation of growth accelerating over the next few months, driven by our
innovation plan and higher marketing investments.
In the first half of July, we launched liquid soaps and body moisturizers of the SOU line, which, with
its innovative and unique proposal of conscientious consumption, will allow us to enter a market
segment as of yet unexplored that has significant potential to generate incremental revenue for
Natura. In addition to the SOU line, in the second half of the year, we are planning more launches of
cosmetic and fragrance products that should leave us more competitive in these categories.
We will also intensify our marketing investments to have more frequent orders from our Consultants.
This measure builds on the initiatives implemented over the last few months aimed at expanding the
shopping basket of our consumers, such as the MAIS Natura Program, to which we recently made a
few adjustments to encourage the lower sales volume consultants to place orders. The increase in
these investments will be financed by our cost efficiency program.
In the International Operations, we posted strong revenue growth and significant profitability gains
(EBITDA margin of 16.6% in 2Q13, versus 5.3% a year earlier)2. The group of countries in
consolidation posted net revenue growth of 38.9% in local currency in 2Q13, which was accompanied
by excellent channel indicators in our Argentina Operation. The Operations in Implementation
registered growth of 19.7% in local currency in 2Q13, with the Mexico Operation recovering
supported by the recent improvements made to the Sustainable Relations Network model.
We remain confident in achieving progress on the projects that will enable us, on the one hand, to
evolve and modernize the relationships with our network through the use of digital technologies and,
on the other hand, to expand the value offering through new brands and categories connected with
the concept of Well Being Well, in turn expanding the value proposition and our company’s presence.
1 Refers to pro-forma EBITDA 2 EBITDA margin of the Operations in Consolidation and in Implementation excluding the corporate structure in Argentina, the operation in France and Aesop
Earnings Release 2Q13
2
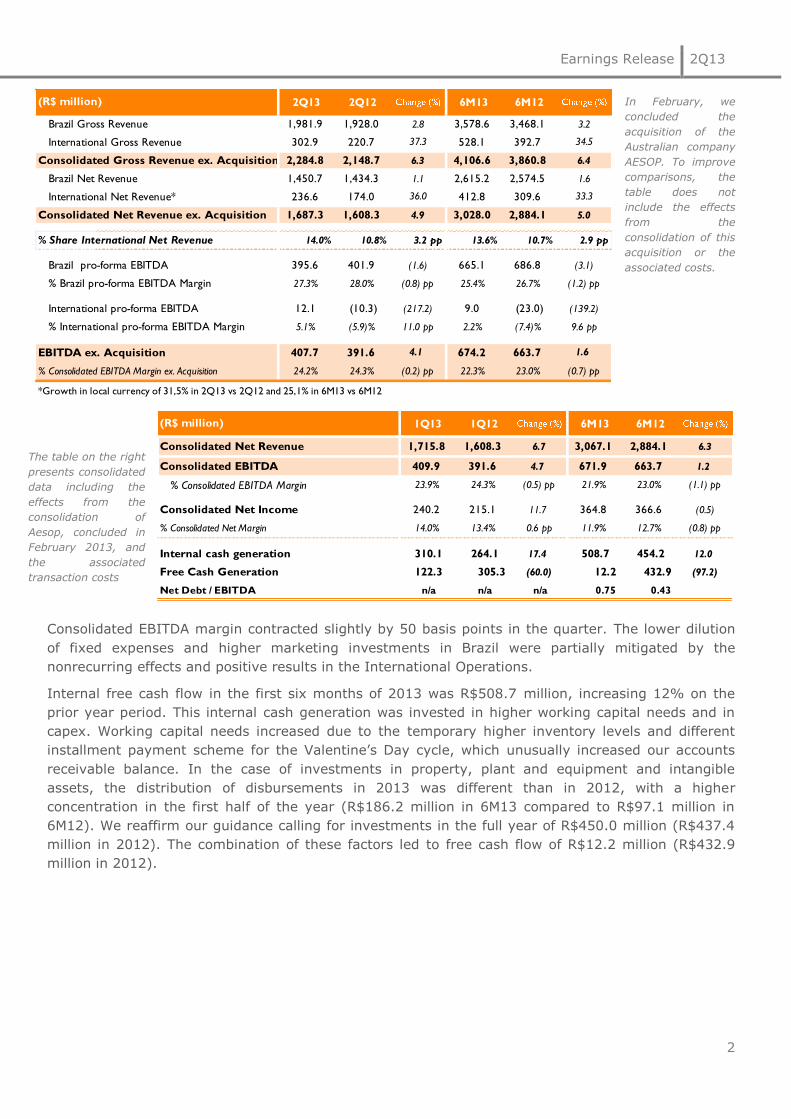
In February, we
concluded the
acquisition of the
Australian company
AESOP. To improve
comparisons, the
table does not
include the effects
from the
consolidation of this
acquisition or the
associated costs.
The table on the right
presents consolidated
data including the
effects from the
consolidation of
Aesop, concluded in
February 2013, and
the associated
transaction costs
Consolidated EBITDA margin contracted slightly by 50 basis points in the quarter. The lower dilution
of fixed expenses and higher marketing investments in Brazil were partially mitigated by the
nonrecurring effects and positive results in the International Operations.
Internal free cash flow in the first six months of 2013 was R$508.7 million, increasing 12% on the
prior year period. This internal cash generation was invested in higher working capital needs and in
capex. Working capital needs increased due to the temporary higher inventory levels and different
installment payment scheme for the Valentine’s Day cycle, which unusually increased our accounts
receivable balance. In the case of investments in property, plant and equipment and intangible
assets, the distribution of disbursements in 2013 was different than in 2012, with a higher
concentration in the first half of the year (R$186.2 million in 6M13 compared to R$97.1 million in
6M12). We reaffirm our guidance calling for investments in the full year of R$450.0 million (R$437.4
million in 2012). The combination of these factors led to free cash flow of R$12.2 million (R$432.9
million in 2012).
2Q13 2Q12 6M13 6M12
Brazil Gross Revenue 1,981.9 1,928.0 2.8 3,578.6 3,468.1 3.2
International Gross Revenue 302.9 220.7 37.3 528.1 392.7 34.5
Consolidated Gross Revenue ex. Acquisition 2,284.8 2,148.7 6.3 4,106.6 3,860.8 6.4
Brazil Net Revenue 1,450.7 1,434.3 1.1 2,615.2 2,574.5 1.6
International Net Revenue* 236.6 174.0 36.0 412.8 309.6 33.3
Consolidated Net Revenue ex. Acquisition 1,687.3 1,608.3 4.9 3,028.0 2,884.1 5.0
% Share International Net Revenue 14.0% 10.8% 3.2 pp 13.6% 10.7% 2.9 pp
Brazil pro-forma EBITDA 395.6 401.9 (1.6) 665.1 686.8 (3.1)
% Brazil pro-forma EBITDA Margin 27.3% 28.0% (0.8) pp 25.4% 26.7% (1.2) pp
International pro-forma EBITDA 12.1 (10.3) (217.2) 9.0 (23.0) (139.2)
% International pro-forma EBITDA Margin 5.1% (5.9)% 11.0 pp 2.2% (7.4)% 9.6 pp
EBITDA ex. Acquisition 407.7 391.6 4.1 674.2 663.7 1.6
% Consolidated EBITDA Margin ex. Acquisition 24.2% 24.3% (0.2) pp 22.3% 23.0% (0.7) pp
*Growth in local currency of 31,5% in 2Q13 vs 2Q12 and 25,1% in 6M13 vs 6M12
(R$ million)
1Q13 1Q12 6M13 6M12
Consolidated Net Revenue 1,715.8 1,608.3 6.7 3,067.1 2,884.1 6.3
Consolidated EBITDA 409.9 391.6 4.7 671.9 663.7 1.2
% Consolidated EBITDA Margin 23.9% 24.3% (0.5) pp 21.9% 23.0% (1.1) pp
Consolidated Net Income 240.2 215.1 11.7 364.8 366.6 (0.5)
% Consolidated Net Margin 14.0% 13.4% 0.6 pp 11.9% 12.7% (0.8) pp
Internal cash generation 310.1 264.1 17.4 508.7 454.2 12.0
Free Cash Generation 122.3 305.3 (60.0) 12.2 432.9 (97.2)
Net Debt / EBITDA n/a n/a n/a 0.75 0.43
(R$ million)
Earnings Release 2Q13
3
1. cosmetics, fragrance and toiletries
industry
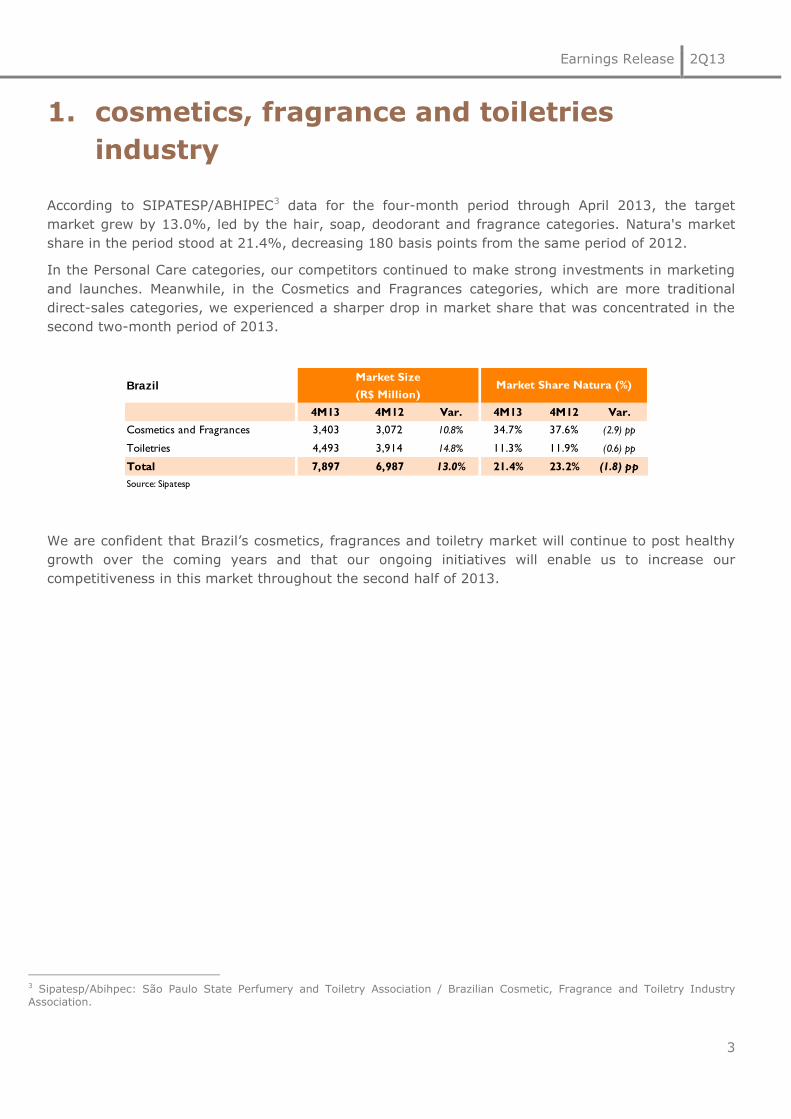
According to SIPATESP/ABHIPEC3 data for the four-month period through April 2013, the target
market grew by 13.0%, led by the hair, soap, deodorant and fragrance categories. Natura's market
share in the period stood at 21.4%, decreasing 180 basis points from the same period of 2012.
In the Personal Care categories, our competitors continued to make strong investments in marketing
and launches. Meanwhile, in the Cosmetics and Fragrances categories, which are more traditional
direct-sales categories, we experienced a sharper drop in market share that was concentrated in the
second two-month period of 2013.
We are confident that Brazil’s cosmetics, fragrances and toiletry market will continue to post healthy
growth over the coming years and that our ongoing initiatives will enable us to increase our
competitiveness in this market throughout the second half of 2013.
3 Sipatesp/Abihpec: São Paulo State Perfumery and Toiletry Association / Brazilian Cosmetic, Fragrance and Toiletry Industry Association.
4M13 4M12 Var. 4M13 4M12 Var.
Cosmetics and Fragrances 3,403 3,072 10.8% 34.7% 37.6% (2.9) pp
Toiletries 4,493 3,914 14.8% 11.3% 11.9% (0.6) pp
Total 7,897 6,987 13.0% 21.4% 23.2% (1.8) pp
Source: Sipatesp
BrazilMarket Size
(R$ Million)Market Share Natura (%)
Earnings Release 2Q13
4
2. social and environmental highlights
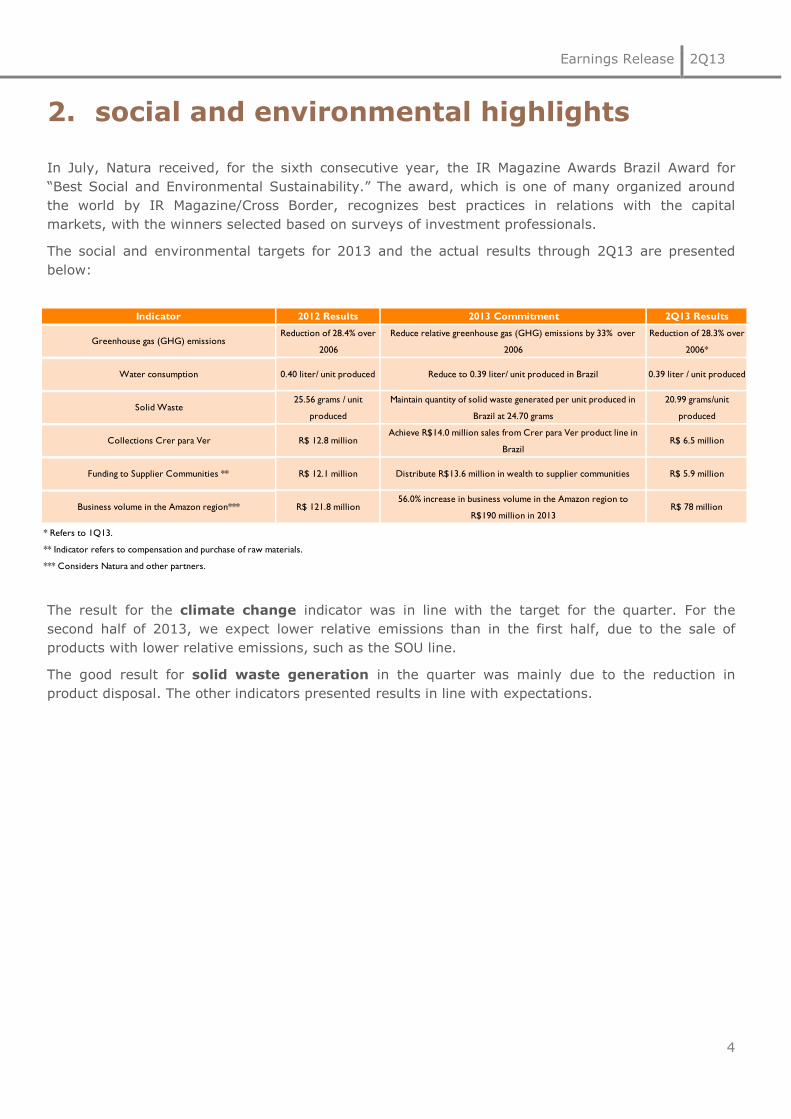
In July, Natura received, for the sixth consecutive year, the IR Magazine Awards Brazil Award for
“Best Social and Environmental Sustainability.” The award, which is one of many organized around
the world by IR Magazine/Cross Border, recognizes best practices in relations with the capital
markets, with the winners selected based on surveys of investment professionals.
The social and environmental targets for 2013 and the actual results through 2Q13 are presented
below:
The result for the climate change indicator was in line with the target for the quarter. For the
second half of 2013, we expect lower relative emissions than in the first half, due to the sale of
products with lower relative emissions, such as the SOU line.
The good result for solid waste generation in the quarter was mainly due to the reduction in
product disposal. The other indicators presented results in line with expectations.
Indicator
* Refers to 1Q13.
** Indicator refers to compensation and purchase of raw materials.
*** Considers Natura and other partners.
2012 Results 2013 Commitment 2Q13 Results
Greenhouse gas (GHG) emissionsReduction of 28.4% over
2006
Reduce relative greenhouse gas (GHG) emissions by 33% over
2006
Reduction of 28.3% over
2006*
Water consumption 0.40 liter/ unit produced Reduce to 0.39 liter/ unit produced in Brazil 0.39 liter / unit produced
Solid Waste25.56 grams / unit
produced
Maintain quantity of solid waste generated per unit produced in
Brazil at 24.70 grams
20.99 grams/unit
produced
Collections Crer para Ver R$ 12.8 millionAchieve R$14.0 million sales from Crer para Ver product line in
BrazilR$ 6.5 million
Funding to Supplier Communities ** R$ 12.1 million Distribute R$13.6 million in wealth to supplier communities R$ 5.9 million
Business volume in the Amazon region*** R$ 121.8 million56.0% increase in business volume in the Amazon region to
R$190 million in 2013R$ 78 million

Earnings Release 2Q13
5
3. Economic-financial performance456
4 In the pro-forma results, the profit margin obtained on exports from Brazil to the international operations was subtracted from
the COGS of the respective operations in order to show the actual impact of these subsidiaries on the company’s consolidated results. Accordingly, the pro-forma income statement for the Brazilian operations considers only the sales made in the domestic market. 5 Consolidated figures include the Brazil Operations, the Operations in Consolidation, the Operations in Implementation and other
International Investments and consider the impact from acquisitions. 6 Position at end of Cycle 8 in all operations.
Quarter Pro-Forma Pro-Forma
(R$ million) Consolidated5 Brazil Consolidation Implementation Novos Negócios
2Q13 2Q12 Change% 2Q13 2Q12 Change% 2Q13 2Q12 Change% 2Q13 2Q12 Change%
Total Consultants - end of period ('000)6 1,574.8 1,505.5 4.6 1,248.9 1,226.0 1.9 205.0 174.3 17.6 118.8 102.5 15.9
Total Consultants - average of period ('000) 1,571.1 1,487.8 5.6 1,256.3 1,215.1 3.4 198.3 168.8 17.5 114.3 101.1 13.0
Units sold – items for resale 128.3 120.9 6.2 111.4 108.2 2.9 11.1 8.0 39.3 5.5 4.3 27.3
Gross Revenue 2,313.3 2,148.7 7.7 1,981.9 1,928.0 2.8 211.2 149.4 41.3 85.3 65.4 30.5
Net Revenue 1,715.8 1,608.3 6.7 1,450.7 1,434.3 1.1 157.6 112.7 39.8 73.3 56.2 30.4
Gross Profit 1,218.0 1,137.0 7.1 1,025.0 1,016.8 0.8 114.6 79.4 44.3 50.4 37.8 33.1
Selling, Marketing and Logistics Expenses (614.6) (550.6) 11.6 (497.7) (453.1) 9.9 (67.4) (54.3) 24.1 (42.2) (39.5) 7.0
Administrative, R&D, IT and Projects Expenses (251.6) (223.4) 12.6 (186.6) (189.4) (1.5) (10.4) (9.2) 12.9 (8.2) (6.1) 34.3
Management compensation (6.7) (6.4) 6.0 (6.7) (6.4) 6.0 0.0 0.0 0.0 0.0 0.0 0.0
Other Operating Income / (Expenses), net 17.8 0.4 n/a 17.8 1.2 n/a (0.4) (0.8) (48.0) (0.0) 0.0 n/a
Financial Income / (Expenses), net (11.4) (39.8) (71.3) (8.0) (40.8) (80.3) (3.3) 1.4 n/a (0.4) (0.4) 9.7
Income Tax and Social Contribution (110.7) (102.2) 8.3 (102.7) (101.4) 1.2 (7.3) (0.4) n/a (0.3) (0.3) 5.1
Noncontrolling (0.7) 0.0 0.0 0.0 0.0 0.0 0.0 0.0 n/a 0.0 0.0 0.0
Net Income 240.2 215.1 11.7 241.0 226.9 6.2 25.9 16.2 59.8 (0.8) (8.4) (90.2)
EBITDA* 409.9 391.6 4.7 395.6 401.9 (1.6) 37.6 16.1 133.4 0.8 (7.1) (111.5)
Gross Margin 71.0% 70.7% 0.3 pp 70.7% 70.9% (0.2) pp 72.8% 70.5% 2.3 pp 68.7% 67.3% 1.4 pp
Sales Expenses/Net Revenue 35.8% 34.2% 1.6 pp 34.3% 31.6% 2.7 pp 42.8% 48.2% (5.4) pp 57.6% 70.2% (12.6) pp
General and Admin. Expenses/Net Revenue 14.7% 13.9% 0.8 pp 12.9% 13.2% (0.3) pp 6.6% 8.2% (1.6) pp 11.2% 10.9% 0.3 pp
Net Margin 14.0% 13.4% 0.6 pp 16.6% 15.8% 0.8 pp 16.4% 14.4% 2.1 pp (1.1)% (15.0)% n/a
EBITDA Margin 23.9% 24.3% (0.5) pp 27.3% 28.0% (0.8) pp 23.8% 14.3% 9.6 pp 1.1% (12.6)% n/a
(*) EBITDA = Income from operations before financial effects + depreciation & amortization.
Year to date Pro-Forma Pro-Forma
(R$ million) Consolidated5 Brazil Consolidation Implementation Novos Negócios
6M13 6M12 Change% 6M13 6M12 Change% 6M13 6M12 Change% 6M13 6M12 Change%
Total Consultants - end of period ('000)6 1,574.8 1,505.5 4.6 1,248.9 1,226.0 1.9 205.0 174.3 17.6 118.8 102.5 15.9
Total Consultants - average of period ('000) 1,565.4 1,457.1 7.4 1,256.3 1,193.0 5.3 195.1 163.9 19.1 111.8 97.4 14.8
Units sold – items for resale 239.9 233.4 2.8 209.6 208.9 0.3 20.2 15.6 29.7 9.7 8.3 16.4
Gross Revenue 4,145.7 3,860.8 7.4 3,578.6 3,468.1 3.2 366.3 264.0 38.7 150.5 117.3 28.3
Net Revenue 3,067.1 2,884.1 6.3 2,615.2 2,574.5 1.6 273.4 198.8 37.6 129.3 100.9 28.1
Gross Profit 2,169.3 2,047.5 6.0 1,845.4 1,836.9 0.5 195.8 136.9 43.0 88.8 67.8 31.0
Selling, Marketing and Logistics Expenses (1,118.0) (1,038.9) 7.6 (912.3) (866.0) 5.3 (123.3) (97.1) 26.9 (70.8) (68.5) 3.5
Administrative, R&D, IT and Projects Expenses (473.8) (401.0) 18.2 (356.4) (337.9) 5.5 (20.9) (16.1) 29.2 (15.5) (11.6) 33.0
Management compensation (12.2) (10.3) 18.4 (12.2) (10.3) 18.4 0.0 0.0 n/a 0.0 0.0 n/a
Other Operating Income / (Expenses), net 17.5 (1.6) n/a 17.4 (0.1) n/a (0.2) (1.5) (85.0) 0.5 (0.0) n/a
Financial Income / (Expenses), net (49.2) (55.0) (10.5) (45.3) (57.2) (20.8) (3.7) 1.7 n/a (0.4) 0.5 n/a
Income Tax and Social Contribution (168.1) (174.1) (3.5) (158.5) (173.2) (8.5) (8.7) (0.5) n/a (0.4) (0.4) 9.8
Noncontrolling (0.7) 0.0 0.0 0.0 0.0 0.0 0.0 0.0 n/a 0.0 0.0 0.0
Net Income 364.8 366.6 (0.5) 378.0 392.1 (3.6) 39.0 23.4 67.1 2.2 (12.2) n/a
EBITDA* 671.9 663.7 1.2 665.1 686.8 (3.1) 53.8 24.3 121.5 4.6 (11.1) (141.7)
Gross Margin 70.7% 71.0% (0.3) pp 70.6% 71.4% (0.8) pp 71.6% 68.9% 2.7 pp 68.7% 67.1% 1.5 pp
Sales Expenses/Net Revenue 36.5% 36.0% 0.4 pp 34.9% 33.6% 1.2 pp 45.1% 48.9% (3.8) pp 54.8% 67.8% (13.0) pp
General and Admin. Expenses/Net Revenue 15.4% 13.9% 1.5 pp 13.6% 13.1% 0.5 pp 7.6% 8.1% (0.5) pp 12.0% 11.5% 0.4 pp
Net Margin 11.9% 12.7% (0.8) pp 14.5% 15.2% (0.8) pp 14.3% 11.8% 2.5 pp 1.7% (12.1)% n/a
EBITDA Margin 21.9% 23.0% (1.1) pp 25.4% 26.7% (1.2) pp 19.7% 12.2% 7.5 pp 3.6% (11.0)% n/a
(*) EBITDA = Income from operations before financial effects + depreciation & amortization.

Earnings Release 2Q13
6
3.1 net revenue
In Brazil, revenue growth in the quarter
fell short of our expectations, especially in
June, affected mainly by the lower pace of
orders from consultants and the lower-
than-expected incremental sales from
launches in the period.
This quarter, the lower buying frequency
had a direct impact on the number of
available consultants7 and their respective
growth. Consultant productivity8 decreased
by 60 basis points (R$2,254 in 2Q13,
versus R$2,267 in 2Q12).
In 2Q13, as detailed in the following table and
also reported in previous quarters, the lag in net
revenue growth in relation to gross revenue
growth reflects the increase in the tax rate (due
to the hike in the value added margin – MVA9 in
the state of São Paulo as of August 1, 2012). We
expect this situation to normalize as of the
fourth quarter of 2013.
Excluding the impact from acquisitions (Aesop), the International Operations accounted for 14.0%
of consolidated net revenue in the quarter (13.6% in 6M13). Growth has continued to accelerate
driven by the expansion in the consultant base and the increase in buying frequency. In the
Operations in Consolidation, the net revenue growth of 38.9% in local currency in 2Q13 compared to
the prior year (31.9% in 6M13) was driven by the 17.5% expansion in the consultant base in the
quarter (19.1% in 6M13) and by higher productivity, led by the solid performance in Argentina. Take
7 We consider as available all consultants who have placed at least one order within a period of four consecutive sales cycles. 8 Productivity at retail prices = (gross revenue/average number of consultants in the period) / (1%-consultant profit) 9 Value Added Margin (MVA): percentage used to estimate the average margin practiced by consultants, which is a parameter used to form the base for calculating the payment of state value added tax (ICMS) owed by Natura’s clients, known as ICMS-ST (tax substitution).
11.3%15.4% 14.8%
12.2%
5.9% 6.7%
8.3%12.5% 11.4% 8.9%
2.1% 1.1%
45.5%48.6% 48.9%
46.4%
31.3%
36.7%
1Q12 2Q12 3Q12 4Q12 1Q13 2Q13
Net Revenue Growth (R$ - % Year over Year)
Consolidated
Brazil
Consolidation and Implementation Operations
Brazil (R$ million) 2Q12 1Q13 2Q132Q13 vs.
2Q122T12 1T13 2T13
Gross Revenue 1,928.0 1,596.7 1,981.9 2.8%
Taxes on sales 493.7 432.1 531.2 7.6%
Taxes on sales rate (%) 25.6% 27.1% 26.8% 1.2 pp
Net Revenue 1,434.3 1,164.5 1,450.7 1.1%
-5.7%
-2.6%
1.4%2.9%
-3.8%
-0.6%
1Q12 2Q12 3Q12 4Q12 1Q13 2Q13
Productivity (% Year over Year)
Brazil
1,179 1,226 1,227 1,268 1,258 1,249
158 174 184 191 189 20595 103 105 111 108 1191,435 1,506 1,518 1,573 1,557 1,575
16.3% 16.2% 11.5% 10.7% 8.5% 4.6%
1Q12 2Q12 3Q12 4Q12 1Q13 2Q13
Consultants - end of period
Brazil Consolidation
Implementation
YOY Consolidated Growth

Earnings Release 2Q13
7
into account that in 2Q12, the Argentina operation was impacted by high levels of out-of-stock
products caused by import difficulties in that period. In the Operations in Implementation, which
posted net revenue growth of 19.7% in local currency in the quarter (15.1% in 6M13), the
adjustments made since 1Q13 to Mexico’s Sustainable Relations Network have already leveraged an
increase in buying frequency by consultants.
3.2 innovation & products
In June 2013, the innovation index10 stood
slightly below the level of prior quarters,
although within the expected level. In the
second half of the quarter we re-launched
the Aquarela make up line and some
products form our hair care line Plant. In
6M13, R&D investments corresponded to
2.6% of net revenue, compared to 2.5% in
6M12.
3.3 gross margin
In the quarter, consolidated gross margin expanded by 30 basis points from 2Q12. The expansion of
210 basis points in the International Operations, which is explained by the favorable foreign exchange
effect and the higher efficiency of promotions, offset the gross margin contraction of 20 basis points
in Brazil.
In Brazil, this margin contraction was also negatively impacted by the hike in the tax rate in August
2012, although this impact was almost fully offset by the better cost-benefit trade-off.
The following table presents the main components of COGS:
10 Innovation Index: share in the last 12 months of the sale of products launched in the last 24 months.
67.0% 67.9% 67.3% 67.2%65.0% 65.3%
1Q12 2Q12 3Q12 4Q12 1Q13 2Q13
Innovation (%NV)
2Q13 2Q12 6M13 6M12
81.9 83.4 81.2 81.6
9.6 8.6 10.1 9.9
2.4 2.5 2.6 2.7
6.1 5.5 6.0 5.8
Total 100.0 100.0 100.0 100.0
*Raw materials, packaging materials and finished products.
RM / PM / FP*
Labor
Depreciation
Other
71.4%
70.7%71.3%
69.3%
70.4%71.0%
71.9%
70.9%71.5%
69.3%
70.5%
70.7%
66.8%
69.4%
70.4%
69.2%69.6%
71.5%
1Q12 2Q12 3Q12 4Q12 1Q13 2Q13
Gross Margin (%NR)
Consolidated
Brazil
Consolidation and Implementation Operations

Earnings Release 2Q13
8
3.4 operating expenses
In Brazil, the increase in selling,
marketing and logistics expenses in
relation to net revenue is explained by
the lower dilution of expenses, the
higher storage expenses arising from the
lower-than-expected sales and the
higher investments in marketing, such as
the start of initiatives for the launch of
the SOU line. In the International
Operations, the reduction in selling,
marketing and logistics expenses in
relation to net revenue was due to the
higher dilution of fixed expenses, as well
as to a different phasing of marketing
expenses.
In Brazil, administrative, R&D, IT and project expenses were stable in 2Q13. The planned
increase in R&D investments at a rate
above sales growth and the increase in
depreciation, reflecting the investments
already made in IT, were offset by
efficiency gains in discretionary expenses
and tax credits in the first half of the year.
In the International Operations, the
relative decrease in administrative
expenses is explained by the higher
leverage, which offset the investments in
systems needed to manage the
Sustainable Relations Network model in
Mexico.
3.5 other operating expenses and revenues
In 2Q13, considering the Brazil Operations and the International Operations, we registered other
revenue of R$17.8 million, compared to the other revenue of R$0.4 million in 2Q12 (revenue of
R$17.5 million in 6M13, compared to an expense of R$1.6 million in 6M12). In Brazil, this result was
mainly due to the divestment of a property in Itapecerica da Serra and to the recognition of tax
credits from prior periods.
3.6 other international investments
Other international investments, which are related to the operation in France, the international
corporate structure based in Buenos Aires and the AESOP operation and associated acquisition costs,
recorded EBITDA losses of R$24.1 million in 2Q13 (loss of R$19.3 million in 2Q12) and R$51.6 million
in 6M13 (loss of R$36.2 million in 6M12). This increase in investments mainly reflects the level of
inflation in Argentina, which impacted corporate expenses.
31.6% 33.6%
55.5% 55.3%
34.3% 34.9%
47.5% 48.2%
Quarter Year to Date Quarter Year to Date
Selling Expenses (%NR)
2012 2013
BrazilConsolidation and
Implementation Operations
13.6% 13.5%
9.1% 9.3%
13.3% 14.1%
8.1%9.0%
Quarter Year to Date Quarter Year to Date
Administrative, R&D, IT and Projects Expenses,
Employee profit sharing and Management compensation (%NR)
2011 2012
BrazilConsolidation and
Implementation Operations
Earnings Release 2Q13
9
3.7 EBITDA
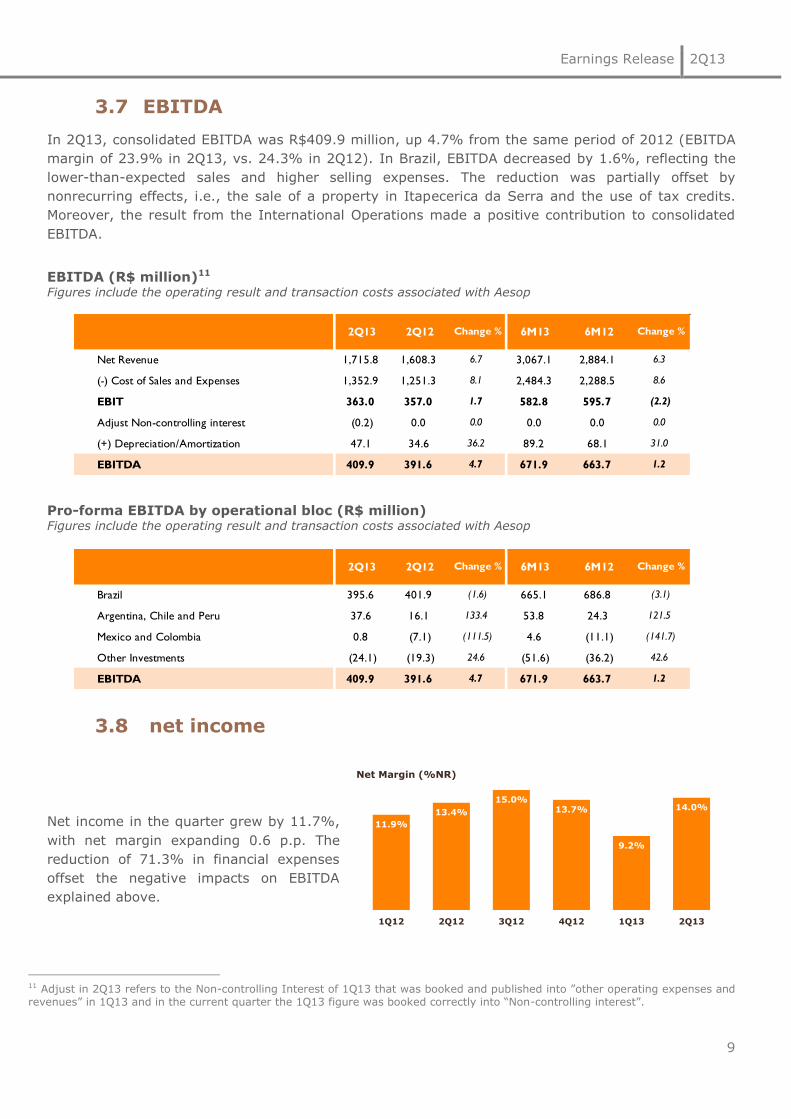
In 2Q13, consolidated EBITDA was R$409.9 million, up 4.7% from the same period of 2012 (EBITDA
margin of 23.9% in 2Q13, vs. 24.3% in 2Q12). In Brazil, EBITDA decreased by 1.6%, reflecting the
lower-than-expected sales and higher selling expenses. The reduction was partially offset by
nonrecurring effects, i.e., the sale of a property in Itapecerica da Serra and the use of tax credits.
Moreover, the result from the International Operations made a positive contribution to consolidated
EBITDA.
EBITDA (R$ million)11 Figures include the operating result and transaction costs associated with Aesop
Pro-forma EBITDA by operational bloc (R$ million) Figures include the operating result and transaction costs associated with Aesop
3.8 net income
Net income in the quarter grew by 11.7%,
with net margin expanding 0.6 p.p. The
reduction of 71.3% in financial expenses
offset the negative impacts on EBITDA
explained above.
11 Adjust in 2Q13 refers to the Non-controlling Interest of 1Q13 that was booked and published into ”other operating expenses and revenues” in 1Q13 and in the current quarter the 1Q13 figure was booked correctly into “Non-controlling interest”.
2Q13 2Q12 Change % 6M13 6M12 Change %
Net Revenue 1,715.8 1,608.3 6.7 3,067.1 2,884.1 6.3
(-) Cost of Sales and Expenses 1,352.9 1,251.3 8.1 2,484.3 2,288.5 8.6
EBIT 363.0 357.0 1.7 582.8 595.7 (2.2)
Adjust Non-controlling interest (0.2) 0.0 0.0 0.0 0.0 0.0
(+) Depreciation/Amortization 47.1 34.6 36.2 89.2 68.1 31.0
EBITDA 409.9 391.6 4.7 671.9 663.7 1.2
2Q13 2Q12 Change % 6M13 6M12 Change %
Brazil 395.6 401.9 (1.6) 665.1 686.8 (3.1)
Argentina, Chile and Peru 37.6 16.1 133.4 53.8 24.3 121.5
Mexico and Colombia 0.8 (7.1) (111.5) 4.6 (11.1) (141.7)
Other Investments (24.1) (19.3) 24.6 (51.6) (36.2) 42.6
EBITDA 409.9 391.6 4.7 671.9 663.7 1.2
11.9%
13.4%
15.0%13.7%
9.2%
14.0%
1Q12 2Q12 3Q12 4Q12 1Q13 2Q13
Net Margin (%NR)
Earnings Release 2Q13
10
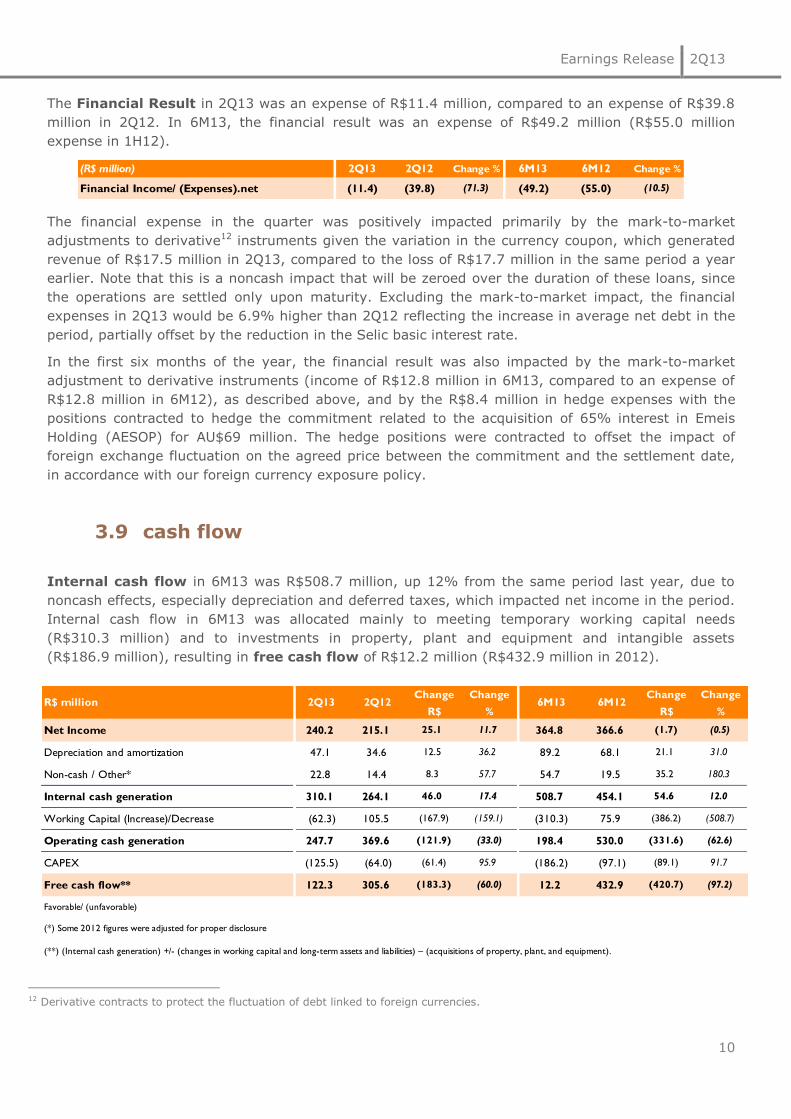
The Financial Result in 2Q13 was an expense of R$11.4 million, compared to an expense of R$39.8
million in 2Q12. In 6M13, the financial result was an expense of R$49.2 million (R$55.0 million
expense in 1H12).
The financial expense in the quarter was positively impacted primarily by the mark-to-market
adjustments to derivative12 instruments given the variation in the currency coupon, which generated
revenue of R$17.5 million in 2Q13, compared to the loss of R$17.7 million in the same period a year
earlier. Note that this is a noncash impact that will be zeroed over the duration of these loans, since
the operations are settled only upon maturity. Excluding the mark-to-market impact, the financial
expenses in 2Q13 would be 6.9% higher than 2Q12 reflecting the increase in average net debt in the
period, partially offset by the reduction in the Selic basic interest rate.
In the first six months of the year, the financial result was also impacted by the mark-to-market
adjustment to derivative instruments (income of R$12.8 million in 6M13, compared to an expense of
R$12.8 million in 6M12), as described above, and by the R$8.4 million in hedge expenses with the
positions contracted to hedge the commitment related to the acquisition of 65% interest in Emeis
Holding (AESOP) for AU$69 million. The hedge positions were contracted to offset the impact of
foreign exchange fluctuation on the agreed price between the commitment and the settlement date,
in accordance with our foreign currency exposure policy.
3.9 cash flow
Internal cash flow in 6M13 was R$508.7 million, up 12% from the same period last year, due to
noncash effects, especially depreciation and deferred taxes, which impacted net income in the period.
Internal cash flow in 6M13 was allocated mainly to meeting temporary working capital needs
(R$310.3 million) and to investments in property, plant and equipment and intangible assets
(R$186.9 million), resulting in free cash flow of R$12.2 million (R$432.9 million in 2012).
12 Derivative contracts to protect the fluctuation of debt linked to foreign currencies.
R$ million 2Q13 2Q12Change
R$
Change
%6M13 6M12
Change
R$
Change
%
Net Income 240.2 215.1 25.1 11.7 364.8 366.6 (1.7) (0.5)
Depreciation and amortization 47.1 34.6 12.5 36.2 89.2 68.1 21.1 31.0
Non-cash / Other* 22.8 14.4 8.3 57.7 54.7 19.5 35.2 180.3
Internal cash generation 310.1 264.1 46.0 17.4 508.7 454.1 54.6 12.0
Working Capital (Increase)/Decrease (62.3) 105.5 (167.9) (159.1) (310.3) 75.9 (386.2) (508.7)
Operating cash generation 247.7 369.6 (121.9) (33.0) 198.4 530.0 (331.6) (62.6)
CAPEX (125.5) (64.0) (61.4) 95.9 (186.2) (97.1) (89.1) 91.7
Free cash flow** 122.3 305.6 (183.3) (60.0) 12.2 432.9 (420.7) (97.2)
Favorable/ (unfavorable)
(**) (Internal cash generation) +/- (changes in working capital and long-term assets and liabilities) – (acquisitions of property, plant, and equipment).
(*) Some 2012 figures were adjusted for proper disclosure
(R$ million) 2Q13 2Q12 Change % 6M13 6M12 Change %
Financial Income/ (Expenses).net (11.4) (39.8) (71.3) (49.2) (55.0) (10.5)
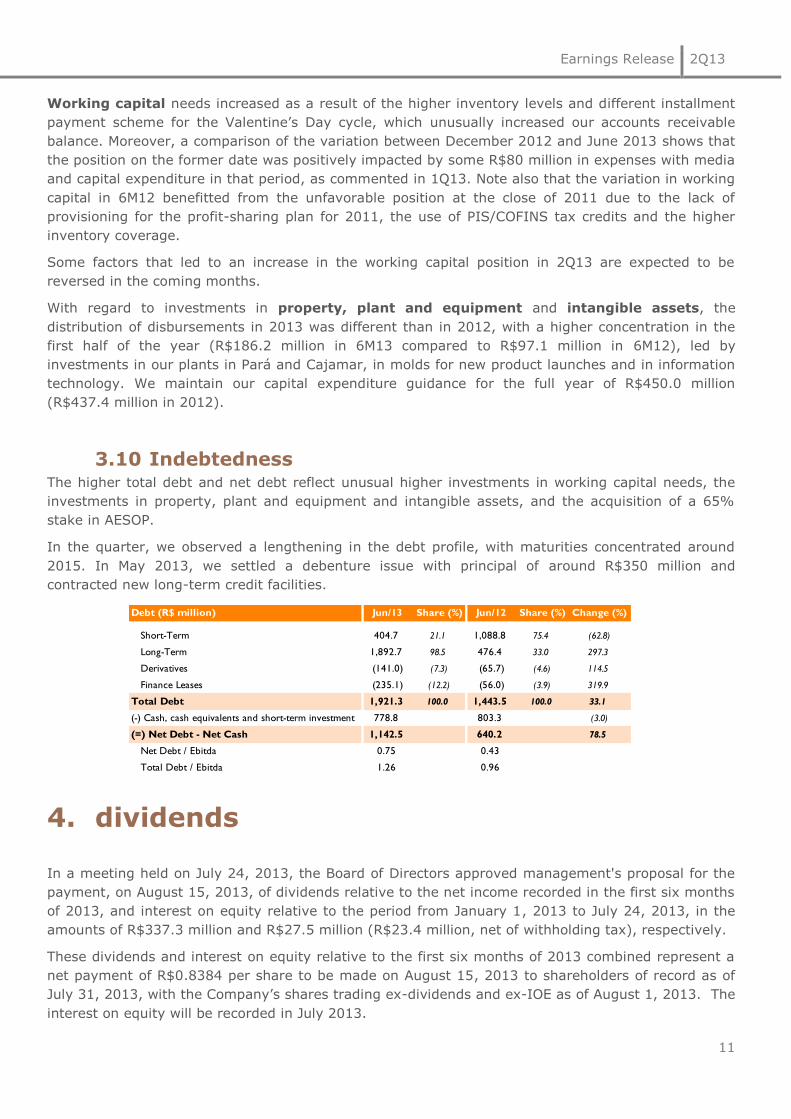
Earnings Release 2Q13
11
Working capital needs increased as a result of the higher inventory levels and different installment
payment scheme for the Valentine’s Day cycle, which unusually increased our accounts receivable
balance. Moreover, a comparison of the variation between December 2012 and June 2013 shows that
the position on the former date was positively impacted by some R$80 million in expenses with media
and capital expenditure in that period, as commented in 1Q13. Note also that the variation in working
capital in 6M12 benefitted from the unfavorable position at the close of 2011 due to the lack of
provisioning for the profit-sharing plan for 2011, the use of PIS/COFINS tax credits and the higher
inventory coverage.
Some factors that led to an increase in the working capital position in 2Q13 are expected to be
reversed in the coming months.
With regard to investments in property, plant and equipment and intangible assets, the
distribution of disbursements in 2013 was different than in 2012, with a higher concentration in the
first half of the year (R$186.2 million in 6M13 compared to R$97.1 million in 6M12), led by
investments in our plants in Pará and Cajamar, in molds for new product launches and in information
technology. We maintain our capital expenditure guidance for the full year of R$450.0 million
(R$437.4 million in 2012).
3.10 Indebtedness The higher total debt and net debt reflect unusual higher investments in working capital needs, the
investments in property, plant and equipment and intangible assets, and the acquisition of a 65%
stake in AESOP.
In the quarter, we observed a lengthening in the debt profile, with maturities concentrated around
2015. In May 2013, we settled a debenture issue with principal of around R$350 million and
contracted new long-term credit facilities.
4. dividends
In a meeting held on July 24, 2013, the Board of Directors approved management's proposal for the
payment, on August 15, 2013, of dividends relative to the net income recorded in the first six months
of 2013, and interest on equity relative to the period from January 1, 2013 to July 24, 2013, in the
amounts of R$337.3 million and R$27.5 million (R$23.4 million, net of withholding tax), respectively.
These dividends and interest on equity relative to the first six months of 2013 combined represent a
net payment of R$0.8384 per share to be made on August 15, 2013 to shareholders of record as of
July 31, 2013, with the Company’s shares trading ex-dividends and ex-IOE as of August 1, 2013. The
interest on equity will be recorded in July 2013.
Debt (R$ million) Jun/13 Share (%) Jun/12 Share (%) Change (%)
Short-Term 404.7 21.1 1,088.8 75.4 (62.8)
Long-Term 1,892.7 98.5 476.4 33.0 297.3
Derivatives (141.0) (7.3) (65.7) (4.6) 114.5
Finance Leases (235.1) (12.2) (56.0) (3.9) 319.9
Total Debt 1,921.3 100.0 1,443.5 100.0 33.1
(-) Cash, cash equivalents and short-term investment 778.8 803.3 (3.0)
(=) Net Debt - Net Cash 1,142.5 640.2 78.5
Net Debt / Ebitda 0.75 0.43
Total Debt / Ebitda 1.26 0.96
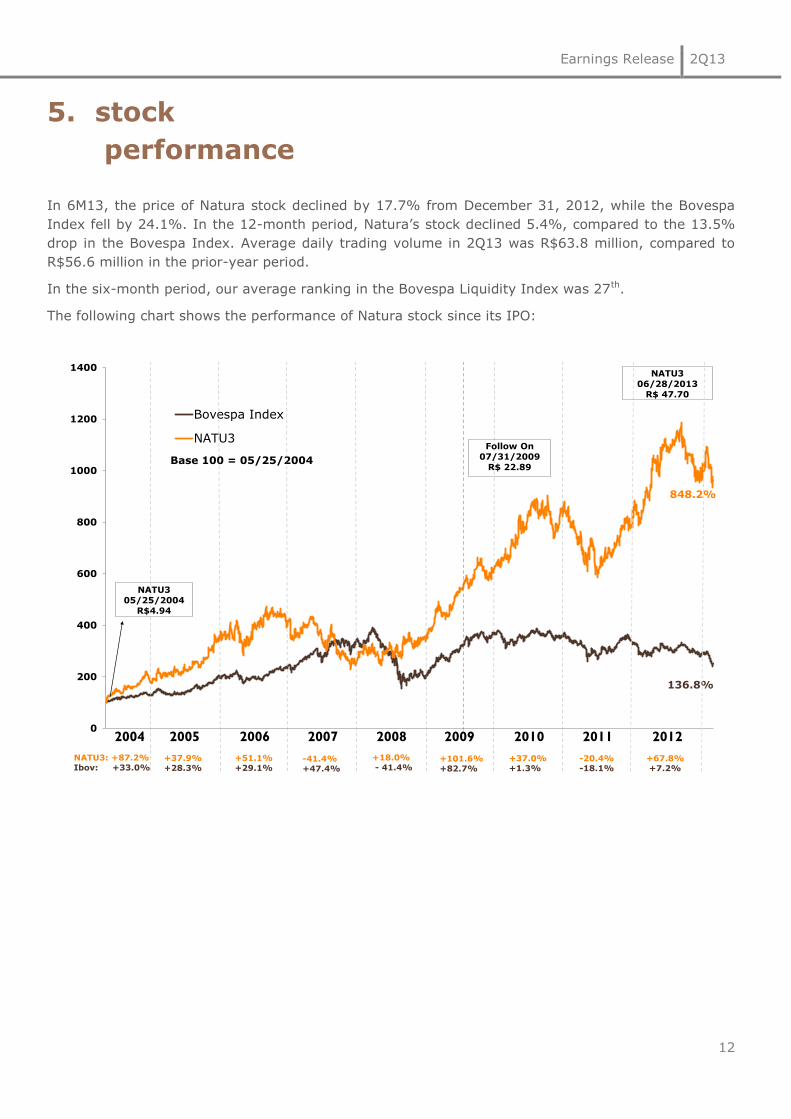
Earnings Release 2Q13
12
5. stock
performance
In 6M13, the price of Natura stock declined by 17.7% from December 31, 2012, while the Bovespa
Index fell by 24.1%. In the 12-month period, Natura’s stock declined 5.4%, compared to the 13.5%
drop in the Bovespa Index. Average daily trading volume in 2Q13 was R$63.8 million, compared to
R$56.6 million in the prior-year period.
In the six-month period, our average ranking in the Bovespa Liquidity Index was 27th.
The following chart shows the performance of Natura stock since its IPO:
848.2%
0
200
400
600
800
1000
1200
1400
Base 100 = 05/25/2004
Bovespa Index
NATU3
NATU3: +87.2%
Ibov: +33.0%+37.9%
+28.3%
+51.1%
+29.1%-41.4%
+47.4%
+18.0%
- 41.4%+101.6%
+82.7%
+37.0%
+1.3%
NATU3
05/25/2004
R$4.94
2004 2005 2006 2007 2008 2009 2010
NATU3
06/28/2013
R$ 47.70
136.8%
Follow On
07/31/2009
R$ 22.89
2011
-20.4%
-18.1%
2012
+67.8%
+7.2%

Earnings Release 2Q13
13
conference call
& webcast
PORTUGUESE: Friday, July 26, 2013
10:00 a.m. (Brasília time)
ENGLISH: Friday, July 26, 2013
12:00 p.m. (Brasília time)
From Brazil: +55 11 4688 6341
From the U.S. (toll free): + 1 855 281 6021
From other countries: +1 786 924 6977
Code: Natura
Live webcast:
www.natura.net/investidor
investor
relations
Phone: +55 (11) 4196-1421
Fabio Cefaly, [email protected]
Tatiana Bravin, [email protected]
Taísa Hernandez, [email protected]
Yakatherine Menendez, [email protected]

Earnings Release 2Q13
14
balance
sheets at June 2013 and December 2012 (in millions of Brazilian real - R$)
ASSETS Jun/13 Dec/12 LIABILITIES AND SHAREHOLDERS' EQUITY Jun/13 Dec/12
CURRENT ASSETS CURRENT LIABILITIES
Cash and cash equivalents 592.4 1,144.4 Borrowings and financing 404.7 999.5
Short-term investments 186.4 498.7 Trade and other payables 620.9 649.9
Trade receivables 687.6 651.4 Payroll, profit sharing and related taxes 194.2 211.8
Inventories 836.4 700.7 Taxes payable 464.4 501.5
Recoverable taxes 185.0 144.5 Other payables 62.0 52.0
Derivatives 141.0 80.9 Total current liabilities 1,746.1 2,414.7
Other receivables 200.2 157.8
Total current assets 2,828.9 3,378.3
NONCURRENT ASSETS NONCURRENT LIABILITIES
Long-term assets: Borrowings and financing 1,892.7 1,325.1
Recoverable taxes 170.4 151.4 Taxes payable 198.9 177.3
Deferred income tax and social contribution 203.7 214.2 Provision for tax, civil and labor risks 63.3 63.3
Escrow deposits 385.8 349.5 Others provisions 199.0 89.0
Other noncurrent assets 37.2 41.3 Total noncurrent liabilities 2,353.8 1,654.6
Property, plant and equipment 1,257.7 1,012.1
Intangible assets 368.4 228.5 SHAREHOLDERS' EQUITY
Total noncurrent assets 2,423.2 1,997.1 Capital 427.1 427.1
Capital reserves 149.9 155.9
Earnings reserves 597.9 308.1
Treasury shares (34.7) (66.1)
Proposed additional dividend 0.0 491.3
Other comprehensive losses (7.1) (10.2)
Total equity attributable to owners of the Company 1,133.1 1,306.1
Non- controlling interests 19.1 0.0
Total equity 1,152.2 1,306.1
TOTAL ASSETS 5,252.1 5,375.4 TOTAL LIABILITIES AND SHAREHOLDERS' EQUITY 5,252.1 5,375.4
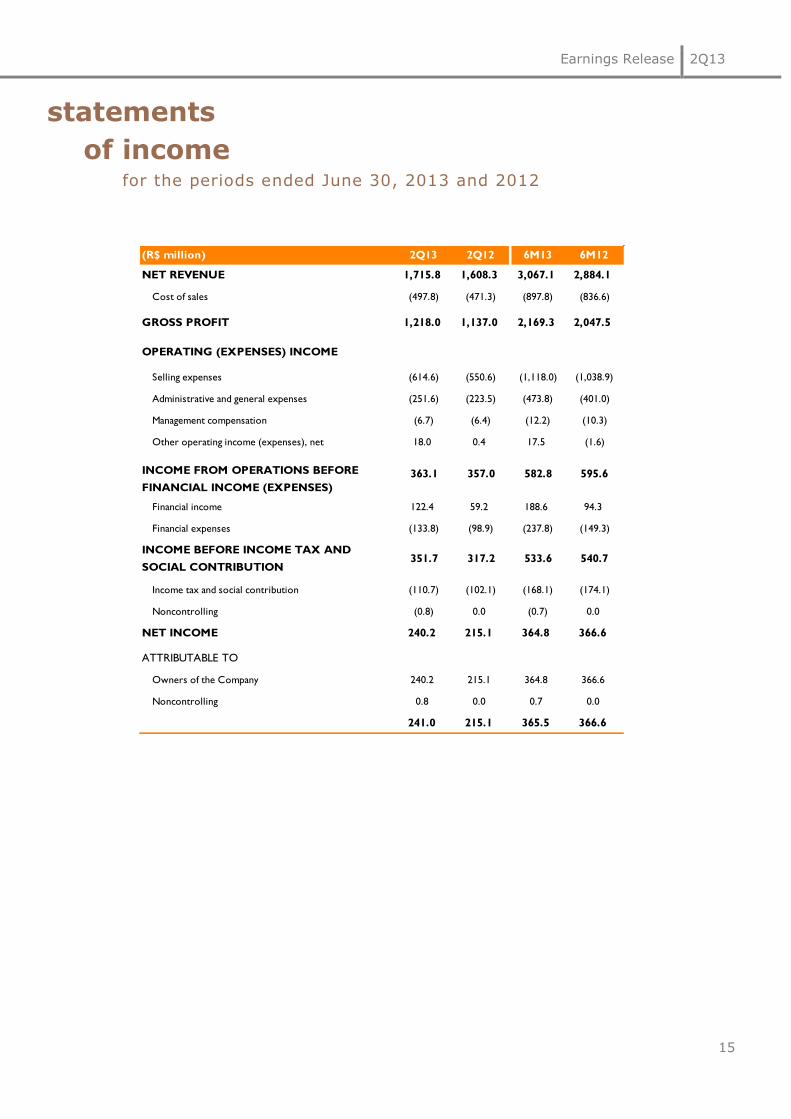
Earnings Release 2Q13
15
statements
of income for the periods ended June 30, 2013 and 2012
(R$ million) 2Q13 2Q12 6M13 6M12
NET REVENUE 1,715.8 1,608.3 3,067.1 2,884.1
Cost of sales (497.8) (471.3) (897.8) (836.6)
GROSS PROFIT 1,218.0 1,137.0 2,169.3 2,047.5
OPERATING (EXPENSES) INCOME
Selling expenses (614.6) (550.6) (1,118.0) (1,038.9)
Administrative and general expenses (251.6) (223.5) (473.8) (401.0)
Management compensation (6.7) (6.4) (12.2) (10.3)
Other operating income (expenses), net 18.0 0.4 17.5 (1.6)
Financial income 122.4 59.2 188.6 94.3
Financial expenses (133.8) (98.9) (237.8) (149.3)
Income tax and social contribution (110.7) (102.1) (168.1) (174.1)
Noncontrolling (0.8) 0.0 (0.7) 0.0
NET INCOME 240.2 215.1 364.8 366.6
Owners of the Company 240.2 215.1 364.8 366.6
Noncontrolling 0.8 0.0 0.7 0.0
241.0 215.1 365.5 366.6
363.1 357.0 582.8 595.6INCOME FROM OPERATIONS BEFORE
FINANCIAL INCOME (EXPENSES)
351.7 317.2 533.6 540.7INCOME BEFORE INCOME TAX AND
SOCIAL CONTRIBUTION
ATTRIBUTABLE TO
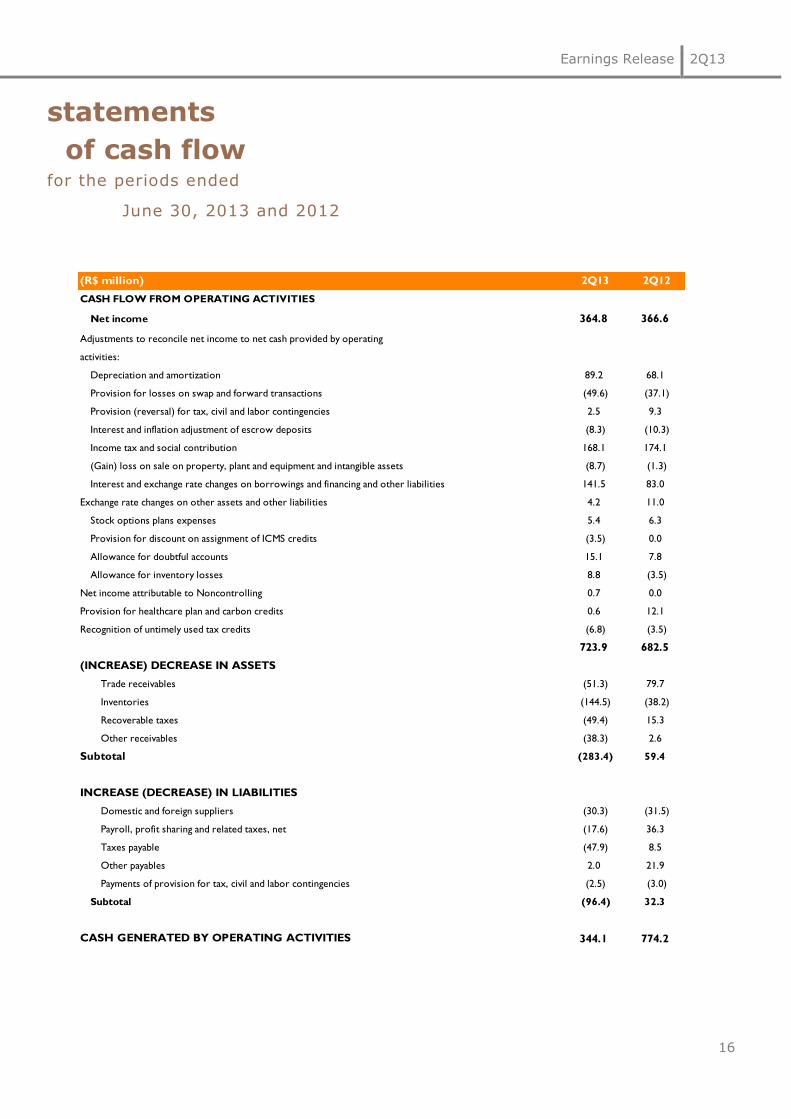
Earnings Release 2Q13
16
statements
of cash flow for the periods ended
June 30, 2013 and 2012
(R$ million) 2Q13 2Q12
CASH FLOW FROM OPERATING ACTIVITIES
Net income 364.8 366.6
Depreciation and amortization 89.2 68.1
Provision for losses on swap and forward transactions (49.6) (37.1)
Provision (reversal) for tax, civil and labor contingencies 2.5 9.3
Interest and inflation adjustment of escrow deposits (8.3) (10.3)
Income tax and social contribution 168.1 174.1
(Gain) loss on sale on property, plant and equipment and intangible assets (8.7) (1.3)
Interest and exchange rate changes on borrowings and financing and other liabilities 141.5 83.0
Exchange rate changes on other assets and other liabilities 4.2 11.0
Stock options plans expenses 5.4 6.3
Provision for discount on assignment of ICMS credits (3.5) 0.0
Allowance for doubtful accounts 15.1 7.8
Allowance for inventory losses 8.8 (3.5)
Net income attributable to Noncontrolling 0.7 0.0
Provision for healthcare plan and carbon credits 0.6 12.1
Recognition of untimely used tax credits (6.8) (3.5)
723.9 682.5
(INCREASE) DECREASE IN ASSETS
Trade receivables (51.3) 79.7
Inventories (144.5) (38.2)
Recoverable taxes (49.4) 15.3
Other receivables (38.3) 2.6
Subtotal (283.4) 59.4
INCREASE (DECREASE) IN LIABILITIES
Domestic and foreign suppliers (30.3) (31.5)
Payroll, profit sharing and related taxes, net (17.6) 36.3
Taxes payable (47.9) 8.5
Other payables 2.0 21.9
Payments of provision for tax, civil and labor contingencies (2.5) (3.0)
Subtotal (96.4) 32.3
CASH GENERATED BY OPERATING ACTIVITIES 344.1 774.2
Adjustments to reconcile net income to net cash provided by operating
activities:

Earnings Release 2Q13
17
OTHER CASH FLOWS FROM OPERATING ACTIVITIES
Payments of income tax and social contribution (125.1) (187.7)
Payments of derivatives (10.5) (7.9)
Payment of interest on borrowings and financing (50.4) (26.4)
NET CASH GENERATED BY OPERATING ACTIVITIES 158.1 552.2
CASH FLOW FROM INVESTING ACTIVITIES
Acquisition of property, plant and equipment and intangible assets (186.2) (97.1)
Property, plant and equipment incorporated by acquisition AESOP (129.1) 0.0
Proceeds from sale of property, plant and equipment and intangible assets 21.2 3.1
Short-term investments (2,725.1) (832.8)
Redemption of short-term investments 3,037.3 131.9
Withdrawal (payment) of escrow deposits (28.0) (24.2)
Noncontrolling interest 19.1 0.0
NET CASH USED IN INVESTING ACTIVITIES 9.3 (819.1)
CASH FLOW FROM INVESTING ACTIVITIES
Repayments of borrowings and financing - principal (688.9) (88.3)
Proceeds from borrowings and financing 433.0 410.2
Sale of treasury shares due to exercise of stock options 27.4 23.3
Payment of dividends and interest on capital (491.3) (491.0)
NET CASH GENERATED (USED) IN FINANCING ACTIVITIES (719.8) (145.8)
Gains (losses) arising on translating foreign currency cash and cash equivalents 0.3 (0.6)
INCREASE (DECREASE) IN CASH AND CASH EQUIVALENTS (552.0) (413.3)
Cash and cash equivalents at the beginning of the year/period 1,144.4 515.6
Cash and cash equivalents at the end of the year/period 592.4 102.4
INCREASE IN CASH AND CASH EQUIVALENTS (552.0) (413.3)
Additional Statements of Cash Flows Information:
Restricted cash 0.0 6.9
Bank overdrafts - unused 117.9 235.5
The Notes are an integral part of the consolidated financial statements

Earnings Release 2Q13
18
Glossary
_Benefit Sharing: based on Natura’s Policy for the Sustainable Use of Biodiversity and Associated Traditional Knowledge, benefits are shared whenever we perceive various forms of value in the access gained to biodiversity. Therefore, one of the practices that defines the way in which these resources will be shared is to associate payments with the number of raw materials produced from each plant as well as the commercial success of the products in which these raw materials are used.
_CDI: the overnight rate for interbank deposits.
_GHG: Greenhouse gases.
_Innovation Index: the percentage of revenue earned in the last 12 months from the sale of products launched in the last 24 months.
_Natura Crer Para Ver Program: Crer Para Ver, which translates literally as “Believing is Seeing”, is a special line of non-cosmetic products whose profits are transferred to the Natura Institute. Neither Natura nor Consultants earn money from sales of this line.
_Natura Consultant (CN): independent sales representatives who do not have a formal labor relationship with Natura.
_Natura Institute: is a non-profit organization created in 2010 to strengthen and expand our private social investment initiatives. The institute has enabled us to leverage our efforts and investments in actions that contribute to the quality of public education.
_Natura Super Consultant (CNO): independent sales representatives who do not have a formal labor relationship with Natura and support the Relationship Managers in their activities;
_Operations in Consolidation: grouping of operations: Argentina, Chile and Peru
_Operations in Implementation: grouping of operations: Colombia and Mexico
_Profit Sharing: the share of profit allocated to employees under the profit-sharing program.
_Sipatesp/Abihpec: São Paulo State Perfumery and Toiletry Association / Brazilian Cosmetics, Fragrance and Toiletry Industry Association.
_Supplier Communities: the communities of people engaged in small-scale farming and extraction activities in a variety of locations in Brazil, especially in the Amazon Region, from which the inputs used in our products are extracted from the local social and biodiversity. We form production chains with these communities that are based on fair prices, the sharing of benefits gained from access to the genetic heritage and associated traditional knowledge and support for local sustainable development projects. This business model has proven effective in generating social, economic and environmental value for Natura and for the communities.
_Sustainable Relations Network: sales model adopted in Mexico that features eight stages in a consultant’s development: Natura Consultant, Natura Consultant Entrepreneur, Natura Trainer 1 and 2, Natura Transformer 1 and 2, Natura Inspirer and Natura Associate. To advance through the stages consultants must meet targets for sales volume and attracting new consultants and (unlike the models adopted in other countries) also for personal development and social and environmental engagement in the community.
_Target Market: refers to the market data published by Sipatesp/Abihpec. Considers only the segments in which Natura operates. Excludes diapers, oral hygiene products, hair dyes, nail polish, feminine hygiene products as well as other products.
restated figures
_Productivity (new calculation method): at retail prices = (gross revenue/average number of consultants in the period) /
(1%-consultant profit).
_Breakdown of Cost: Restatement of values of the frame with the gap between: Raw Material and Packaging, Labor,
depreciation and others regarding the 2Q12 and 6M12.

Earnings Release 2Q13
19
EBITDA is not a measure under BR GAAP and does not represent cash flow for the periods presented.
EBITDA should not be considered an alternative to net income as an indicator of operating
performance or an alternative to cash flow as an indicator of liquidity. EBITDA does not have a
standardized meaning and the definition of EBITDA used by Natura may not be comparable with that
used by other companies. Although EBITDA does not provide under BR GAAP a measure of cash flow,
Management has adopted its use to measure the Company’s operating performance. Natura also
believes that certain investors and financial analysts use EBITDA as an indicator of performance of its
operations and/or its cash flow.
This report contains forward-looking statements. These forward-looking statements are not historical
fact, but rather reflect the wishes and expectations of Natura’s management. Words such as
"anticipate", "wish", "expect", "foresee", "intend", "plan", "predict", "project", "desire" and similar
terms identify statements that necessarily involve known and unknown risks. Known risks include
uncertainties that are not limited to the impact of price and product competitiveness, the acceptance
of products by the market, the transitions of the Company’s products and those of its competitors,
regulatory approval, currency fluctuations, supply and production difficulties and changes in product
sales, among other risks. This report also contains certain pro forma data, which are prepared by the
Company exclusively for informational and reference purposes and as such are unaudited. This report
is updated up to the present date and Natura does not undertake to update it in the event of new
information and/or future events.