
Structure and hydrogeochemical functioning of a sparkling natural mineral water system determined...
22
Structure and hydrogeochemical functioning of a sparkling natural mineral water system determined using a multidisciplinary approach: a case study from southern France J. C. Maréchal & P. Lachassagne & B. Ladouche & B. Dewandel & S. Lanini & P. Le Strat & E. Petelet-Giraud Abstract Natural mineral waters (NMW), often used to produce bottled water, are of high socio-economic interest and need appropriate management to ensure the sustainability of the resource. A complex sparkling NMW system at La Salvetat, southern France, was investigated using a multidis- ciplinary approach. Geological and geophysical investiga- tions, pumping test analyses, time-series signal processing, hydrogeochemical and isotopic data (both stable and radio- genic), and numerical modelling provided complementary information on the geometry, hydrodynamic characteristics and functioning of this mineral system. The conceptual model consists of a compartmentalized reservoir character- ized by two subvertical, parallel deeply rooted hydraulically independent permeable structures that are fed by deep CO 2 - rich crustal fluids. The non-mineralized shallow aquifer system corresponds to a fissured layer within the weathered zone that is recharged by leakage from the overlying saprolite. This surficial aquifer responds rapidly to recharge (40–80days), whereas the deep system’ s response to recharge is much longer (up to 120days). This research demonstrates the need for multidisciplinary approaches and modelling (quantity, hydrochemistry) for understanding complex NMW systems. This knowledge is already being applied by the bottling company that manages the resource at La Salvetat, and would be useful for conceptualising other NMW sites. Keywords Thermal conditions . CO 2 . Fractured rock . Natural mineral water . France Introduction Sparkling natural mineral waters, and more generally natural mineral waters (NMW), often used to produce bottled water, are of socio-economic interest. In order to sustain these resources, appropriate management is needed that is well informed by local hydrogeological understanding. Hydrothermal systems comprise the following three main geological components: water, heat and permeability (Clemente and Villadolid-Abrigo 1993; Lachassagne et al. 2009). Sparkling natural mineral water systems comprise water, CO 2 and permeability so water and gas can flow and rise to the land’ s surface. Geogenic CO 2 may originate from three sources: metamorphism of carbonate rocks in the Earth (Kerrick and Caldeira 1998); transformation of organic matter during oil, gas and coal formation (Battani et al. 2000); or degassing of the mantle (Shipton et al. 2005). Consequently, in most cases, CO 2 is of deep origin. In crystalline rocks, deep fractures create the required perme- ability to bring the CO 2 to the surface, often as springs. At a relatively shallow depth (tens to hundreds of meters), these structures also constitute the drilling targets for safely abstracting the NMW. Therefore, the identification of the geometry, hydrodynamic properties, extent (both laterally and with depth), and thickness of such permeable structures are the key factors for correctly understanding, tapping, managing, and protecting the mineral water system. In crystalline rocks, the hydrodynamic properties of shallow (0–100 m) aquifers, and their relationships with weathering processes are now well characterized, with comprehensive conceptual models (Dewandel et al. 2006, 2011; Lachassagne et al. 2011). Deeper, nuclear waste storage projects have achieved very precise characterisation Received: 10 March 2013 / Accepted: 30 October 2013 Published online: 7 December 2013 * Springer-Verlag Berlin Heidelberg 2013 Published in the theme issue “Hydrogeology of Shallow Thermal Systems” J. C. Maréchal ()) I B. Ladouche I B. Dewandel I S. Lanini I E. Petelet-Giraud BRGM, 1039 rue de Pinville, 34000, Montpellier, France e-mail: [email protected] URL: http://www.brgm.fr P. Lachassagne Danone Waters - Evian Volvic World Sources, BP 87, 11 av. Général Dupas, 74503, Evian-les-Bains Cedex, France e-mail: [email protected] P. Le Strat 19, chemin du champ Juvénal, 34170, Castelnau-le-Lez, France Hydrogeology Journal (2014) 22: 47–68 DOI 10.1007/s10040-013-1073-1
Transcript of Structure and hydrogeochemical functioning of a sparkling natural mineral water system determined...

Structure and hydrogeochemical functioning of a sparkling naturalmineral water system determined using a multidisciplinary approach:a case study from southern France
J. C. Maréchal & P. Lachassagne & B. Ladouche &
B. Dewandel & S. Lanini & P. Le Strat &E. Petelet-Giraud
Abstract Natural mineral waters (NMW), often used toproduce bottled water, are of high socio-economic interestand need appropriate management to ensure the sustainabilityof the resource. A complex sparkling NMW system at LaSalvetat, southern France, was investigated using a multidis-ciplinary approach. Geological and geophysical investiga-tions, pumping test analyses, time-series signal processing,hydrogeochemical and isotopic data (both stable and radio-genic), and numerical modelling provided complementaryinformation on the geometry, hydrodynamic characteristicsand functioning of this mineral system. The conceptualmodel consists of a compartmentalized reservoir character-ized by two subvertical, parallel deeply rooted hydraulicallyindependent permeable structures that are fed by deep CO2-rich crustal fluids. The non-mineralized shallow aquifersystem corresponds to a fissured layer within the weatheredzone that is recharged by leakage from the overlyingsaprolite. This surficial aquifer responds rapidly to recharge(40–80days), whereas the deep system’s response to rechargeis much longer (up to 120days). This research demonstratesthe need for multidisciplinary approaches and modelling
(quantity, hydrochemistry) for understanding complex NMWsystems. This knowledge is already being applied by thebottling company that manages the resource at La Salvetat,and would be useful for conceptualising other NMW sites.
Keywords Thermal conditions . CO2 . Fractured rock .Natural mineral water . France
Introduction
Sparkling natural mineral waters, and more generally naturalmineral waters (NMW), often used to produce bottled water,are of socio-economic interest. In order to sustain theseresources, appropriate management is needed that is wellinformed by local hydrogeological understanding.
Hydrothermal systems comprise the following three maingeological components: water, heat and permeability(Clemente and Villadolid-Abrigo 1993; Lachassagne et al.2009). Sparkling natural mineral water systems comprisewater, CO2 and permeability so water and gas can flow andrise to the land’s surface. Geogenic CO2 may originate fromthree sources: metamorphism of carbonate rocks in the Earth(Kerrick and Caldeira 1998); transformation of organicmatter during oil, gas and coal formation (Battani et al.2000); or degassing of the mantle (Shipton et al. 2005).Consequently, in most cases, CO2 is of deep origin. Incrystalline rocks, deep fractures create the required perme-ability to bring the CO2 to the surface, often as springs. At arelatively shallow depth (tens to hundreds of meters), thesestructures also constitute the drilling targets for safelyabstracting the NMW. Therefore, the identification of thegeometry, hydrodynamic properties, extent (both laterallyand with depth), and thickness of such permeable structuresare the key factors for correctly understanding, tapping,managing, and protecting the mineral water system.
In crystalline rocks, the hydrodynamic properties ofshallow (0–100 m) aquifers, and their relationships withweathering processes are now well characterized, withcomprehensive conceptual models (Dewandel et al. 2006,2011; Lachassagne et al. 2011). Deeper, nuclear wastestorage projects have achieved very precise characterisation
Received: 10 March 2013 /Accepted: 30 October 2013Published online: 7 December 2013
* Springer-Verlag Berlin Heidelberg 2013
Published in the theme issue “Hydrogeology of Shallow ThermalSystems”
J. C. Maréchal ()) I B. Ladouche I B. Dewandel I S. Lanini IE. Petelet-GiraudBRGM, 1039 rue de Pinville, 34000, Montpellier, Francee-mail: [email protected]: http://www.brgm.fr
P. LachassagneDanone Waters - Evian Volvic World Sources, BP 87, 11 av.Général Dupas, 74503, Evian-les-Bains Cedex, Francee-mail: [email protected]
P. Le Strat19, chemin du champ Juvénal, 34170, Castelnau-le-Lez, France
Hydrogeology Journal (2014) 22: 47–68DOI 10.1007/s10040-013-1073-1

of the (low permeability) fractured network of crystallinerocks, but in areas specifically chosen to avoid deepfracturing (Gustafson et al. 2009; Morosini and Rhen2000). Thus, it appears that the precise characterisation ofdeep permeable structures is very rare, and often based onconjecture and/or uncertain assumptions. This research isdevoted to characterising such complex NMW structures.
Another objective of the research was to show thatsuch complex natural mineral water systems requiremultidisciplinary approaches, combining several techni-ques, in order to propose an appropriate precise, realisticand robust conceptual model to tackle this complexity.The approach used combines geological, geophysical,hydrodynamic and time-series analysis, hydrogeochemicaland isotopic data, and a comprehensive numerical modelin order to characterize and simulate the permeablereservoir of a NMW system in crystalline rocks. Thisapproach is applied to the La Salvetat sparkling naturalmineral water system in southern France which is bottled.The knowledge about the structure and functioning of thismineral water system is of high interest for the bottlingcompany for the development, sustainable managementand protection of its spring. Developing a realisticconceptualisation for a well characterized site is also ofbroad interest in order to inspire conceptualisations ofother NMW sites.
Study area
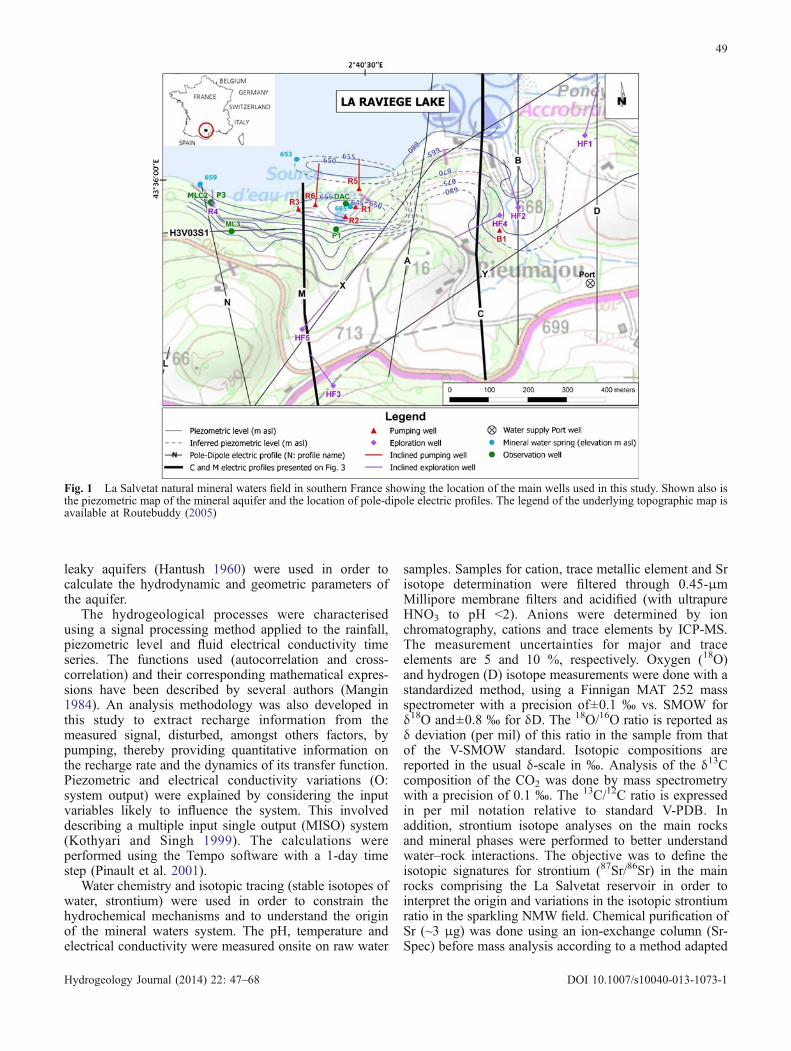
The sparkling water spring at La Salvetat (Hérault region,southern France) has been known at least since the MiddleAges, particularly by the Santiago de Compostellapilgrims who rested and bathed at the Rieumajou spring.The spring has been operated for NMW bottling by theDanone group (Evian Volvic World Sources, DanoneWaters France) since the early 1990s, and is now, togetherwith forestry and traditional mountain agriculture, one ofthe key drivers of the local economy and employment.This NMW spring emerges in a bedrock region composedprimarily of metamorphic rocks without obvious visibletectonic structures at the surface. The field is located southof the Raviège hydropower lake dam within France’s largesouth-eastern CO2 region (an area where numerouscarbonate-rich springs occur), which is part of the largerCO2 Alpine foreland (Blavoux and Dazy 1990). Thereservoir is currently exploited by six wells (B1, R1, R2,R3, R5 and R6, Fig. 1). Observation boreholes (R4inoperative well, P1, P3, MLC2, ML3, Pz1 to 7) are usedfor reservoir monitoring. Recently, five new cored 200-m-long exploration boreholes were drilled (HF1 to HF5).The data from numerous older wells, now closed, are alsoavailable.
The local climate is predominantly Mediterranean witha strong mountainous (“Cévenole”) influence. During the1993–2008 period, the mean annual rainfall was1,444 mm with a mean annual potential evapotranspira-tion of 806 mm. A reservoir model (B. Ladouche, BRGM,unpublished data, 2013), calibrated using the daily
time series of shallow aquifer water table fluctuations(water supply Port well) and runoff (at the 48 km2
Agout River crystalline watershed scale), providesestimates of effective rainfall (920 mm/year), rechargeto the shallow aquifer (169 mm/year) and runoff(751 mm/year).
Methodology
The multidisciplinary approach, implemented to charac-terize the permeable reservoir of La Salvetat NMW field,comprised four stages. The first involved a detailedgeological study (lithology, weathering, sequence stratig-raphy, structural geology, fissure and fracture identifica-tion) and a field hydrogeological study. The geologicalapproach combined a pole-dipole geophysical survey (14mostly north–south profiles with an investigation depthof about 120 m totaling about 16.5 km performed in2011, Fig. 1), and geological field investigation,involving a comprehensive survey of the outcropsand their comparison to local lithotypes to complementthe 1:50,000 scale BRGM geological map (Demange etal. 1995). The geological field investigation alsocomprised the geological reinterpretation of all avail-able cores (11 boreholes), cuttings (3 boreholes), andexisting geological logs for those boreholes where thecuttings and cores were no longer available, along withmacroscopic and microscopic (thin section) analysis. Inthe studied area (Fig. 1), due to the weathering, theoutcrops are small in size (less than a few squaremeters), and mostly restricted to granite veins thatappear to be less weathered than the nearby geologicalformations. There the fracturing is mostly linked toweathering processes.
The field hydrogeological approach was primarilyfocused on characterising the springs (freshwater andNMW), particularly during the La Raviège Lake’s low-water-level period. To characterize the hydrodynamicproperties of the aquifer, pumping tests and interferencetests between production wells were analyzed. Theinterpretation of pumping tests in crystalline aquifers is adifficult task, as groundwater flow can be fractionalized(Black 1994), i.e. controlled by the hydraulic conductivityof fractures, fracture density and orientation, their rela-tionship with the low-hydraulic-conductivity blocks ormatrix (Maréchal et al. 2004), and the geometry of thefaults or intrusive bodies acting as permeable or impervi-ous structures (Dewandel et al. 2011). To reveal thevarious aspects of the hydrogeological properties of such acomplex hydrogeological system, and particularly thegeometry of fractured zones tapped by NMW pumpingwells, careful attention was paid to diagnosing the testresponses prior to modelling with an analytical solution.Diagnoses were based on the analysis of derivativedrawdown curves on log-log plots, which allows flow-regime identification (Ehlig-Economides 1988; Renard etal. 2009). According to the results of the diagnosis,suitable analytical models for partitioned (Nind 1965) or
48
Hydrogeology Journal (2014) 22: 47–68 DOI 10.1007/s10040-013-1073-1
leaky aquifers (Hantush 1960) were used in order tocalculate the hydrodynamic and geometric parameters ofthe aquifer.
The hydrogeological processes were characterisedusing a signal processing method applied to the rainfall,piezometric level and fluid electrical conductivity timeseries. The functions used (autocorrelation and cross-correlation) and their corresponding mathematical expres-sions have been described by several authors (Mangin1984). An analysis methodology was also developed inthis study to extract recharge information from themeasured signal, disturbed, amongst others factors, bypumping, thereby providing quantitative information onthe recharge rate and the dynamics of its transfer function.Piezometric and electrical conductivity variations (O:system output) were explained by considering the inputvariables likely to influence the system. This involveddescribing a multiple input single output (MISO) system(Kothyari and Singh 1999). The calculations wereperformed using the Tempo software with a 1-day timestep (Pinault et al. 2001).
Water chemistry and isotopic tracing (stable isotopes ofwater, strontium) were used in order to constrain thehydrochemical mechanisms and to understand the originof the mineral waters system. The pH, temperature andelectrical conductivity were measured onsite on raw water
samples. Samples for cation, trace metallic element and Srisotope determination were filtered through 0.45-μmMillipore membrane filters and acidified (with ultrapureHNO3 to pH <2). Anions were determined by ionchromatography, cations and trace elements by ICP-MS.The measurement uncertainties for major and traceelements are 5 and 10 %, respectively. Oxygen (18O)and hydrogen (D) isotope measurements were done with astandardized method, using a Finnigan MAT 252 massspectrometer with a precision of±0.1 ‰ vs. SMOW forδ18O and±0.8 ‰ for δD. The 18O/16O ratio is reported asδ deviation (per mil) of this ratio in the sample from thatof the V-SMOW standard. Isotopic compositions arereported in the usual δ-scale in ‰. Analysis of the δ13Ccomposition of the CO2 was done by mass spectrometrywith a precision of 0.1 ‰. The 13C/12C ratio is expressedin per mil notation relative to standard V-PDB. Inaddition, strontium isotope analyses on the main rocksand mineral phases were performed to better understandwater–rock interactions. The objective was to define theisotopic signatures for strontium (87Sr/86Sr) in the mainrocks comprising the La Salvetat reservoir in order tointerpret the origin and variations in the isotopic strontiumratio in the sparkling NMW field. Chemical purification ofSr (~3 μg) was done using an ion-exchange column (Sr-Spec) before mass analysis according to a method adapted
Fig. 1 La Salvetat natural mineral waters field in southern France showing the location of the main wells used in this study. Shown also isthe piezometric map of the mineral aquifer and the location of pole-dipole electric profiles. The legend of the underlying topographic map isavailable at Routebuddy (2005)
49
Hydrogeology Journal (2014) 22: 47–68 DOI 10.1007/s10040-013-1073-1
from Pin and Bassin (1992), with total < 1 ng for theentire chemical procedure. After chemical separation,around 150 ng of Sr was loaded onto a tungsten filamentwith a tantalum activator and analysed with a FinniganMAT 262 multi-collector mass spectrometer. The 87Sr/86Srratios were normalized to 86Sr/88Sr ratio of 0.1194. Anaverage internal precision of ±10×10−6 (2σm) wasobtained and the reproducibility of the 87Sr/86Sr ratiomeasurements was tested by repeated analyses of theNBS987 standard, for which a mean value of 0.710230±18×10−6 (2σ, n=12) was obtained.
To determine the theoretical isotopic signature of waterinteracting with a given rock, a theoretical dissolutionmodel must be used (Bullen et al. 1997). Such adissolution model has been developed (Negrel et al.2001) assuming that most of the Sr released by weatheringcomes from the following three main minerals: plagio-clase, K-feldspar and biotite. Model parameters are: (1) Srcontent in the main mineral phases (plagioclase, K-feldspar and biotite), (2) their isotopic Sr composition(87Sr/86Sr), (3) the proportion of each of these minerals inthe studied rock and, (4) the weatherability of each ofthese minerals (Petelet Giraud et al. 2003). The total rocksample and separate minerals were analysed for Rb and Srcontent and 87Sr/86Sr isotopic ratio. The separation of K-feldspars, plagioclases and biotite was performed byparticle-size (on the 50–400-μm fraction), densimetric(K-feldspars, plagioclases and part of biotite) and mag-netic separation (rest of biotite). The nature of theplagioclases was analysed by electronic microprobingand can be classified as oligoclase (An90-70Ab10–30)and andesine (An30–50Ab70–50). Calcite separation inthe Cipolin marble sample (R6 149.1) was performed byrock stripping (thin sections and hand samples) using amicrogrinder. The results of these dissolution models werethen compared to the water samples from the wells toexplain their origin.
Finally, a hydrodynamic and reactive hydrogeochem-ical numerical model was developed to dynamicallysimulate the functioning of the NMW system. It wasused to integrate all the information provided by themultidisciplinary study, and to validate the conceptualmodel. The modelling method selected is the networkedreservoir and chemical reactor methodology (Collon etal. 2002). It is based on the main assumption thatpiezometric levels and chemical concentrations areuniform within each reservoir. The system modelled isthen described by a set of ordinary coupled differentialequations translating water storage and chemical ele-ments in each of the variable volume reactors. Thewater–rock interactions were taken into account byintroducing aqueous phase chemical kinetics for certainreactive chemical elements. The relevance of the modelto reflect the system studied lies in the choice of thenumber of reservoirs, the way they are connected, thelaws chosen to describe the water and matter ex-changed amongst the reservoirs, and the choice of thereactive chemical elements and the related chemicalkinetics.
Results
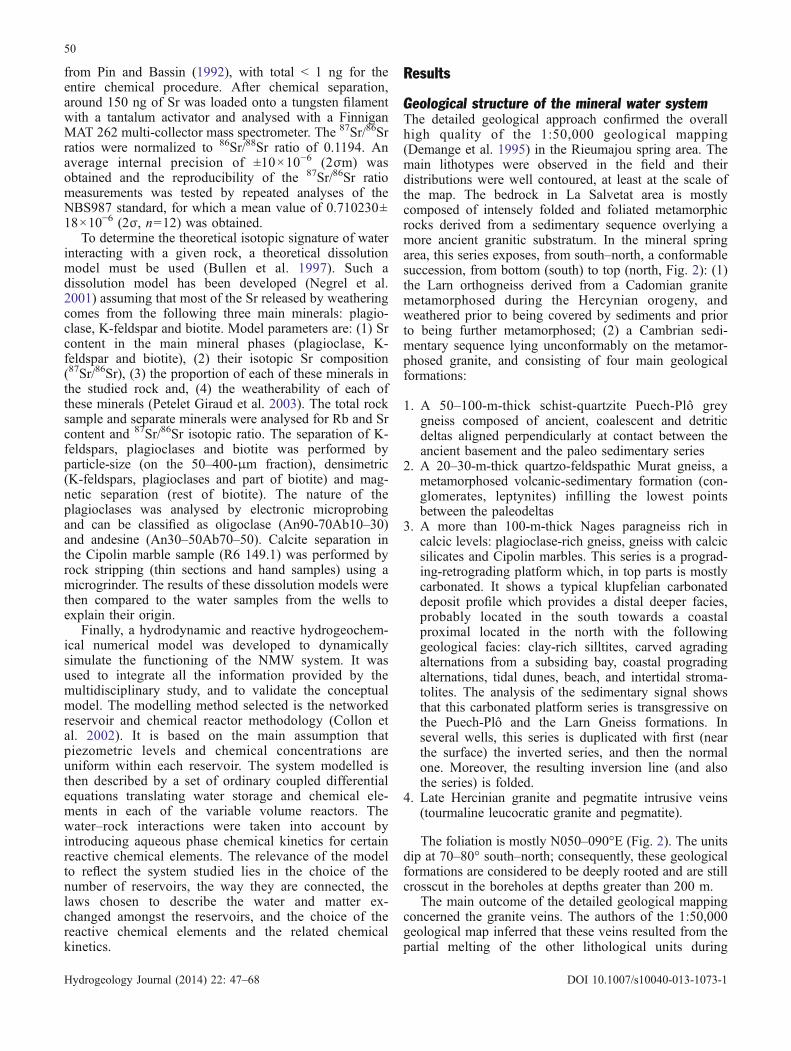
Geological structure of the mineral water systemThe detailed geological approach confirmed the overallhigh quality of the 1:50,000 geological mapping(Demange et al. 1995) in the Rieumajou spring area. Themain lithotypes were observed in the field and theirdistributions were well contoured, at least at the scale ofthe map. The bedrock in La Salvetat area is mostlycomposed of intensely folded and foliated metamorphicrocks derived from a sedimentary sequence overlying amore ancient granitic substratum. In the mineral springarea, this series exposes, from south–north, a conformablesuccession, from bottom (south) to top (north, Fig. 2): (1)the Larn orthogneiss derived from a Cadomian granitemetamorphosed during the Hercynian orogeny, andweathered prior to being covered by sediments and priorto being further metamorphosed; (2) a Cambrian sedi-mentary sequence lying unconformably on the metamor-phosed granite, and consisting of four main geologicalformations:
1. A 50–100-m-thick schist-quartzite Puech-Plô greygneiss composed of ancient, coalescent and detriticdeltas aligned perpendicularly at contact between theancient basement and the paleo sedimentary series
2. A 20–30-m-thick quartzo-feldspathic Murat gneiss, ametamorphosed volcanic-sedimentary formation (con-glomerates, leptynites) infilling the lowest pointsbetween the paleodeltas
3. A more than 100-m-thick Nages paragneiss rich incalcic levels: plagioclase-rich gneiss, gneiss with calcicsilicates and Cipolin marbles. This series is a prograd-ing-retrograding platform which, in top parts is mostlycarbonated. It shows a typical klupfelian carbonateddeposit profile which provides a distal deeper facies,probably located in the south towards a coastalproximal located in the north with the followinggeological facies: clay-rich silltites, carved agradingalternations from a subsiding bay, coastal progradingalternations, tidal dunes, beach, and intertidal stroma-tolites. The analysis of the sedimentary signal showsthat this carbonated platform series is transgressive onthe Puech-Plô and the Larn Gneiss formations. Inseveral wells, this series is duplicated with first (nearthe surface) the inverted series, and then the normalone. Moreover, the resulting inversion line (and alsothe series) is folded.
4. Late Hercinian granite and pegmatite intrusive veins(tourmaline leucocratic granite and pegmatite).
The foliation is mostly N050–090°E (Fig. 2). The unitsdip at 70–80° south–north; consequently, these geologicalformations are considered to be deeply rooted and are stillcrosscut in the boreholes at depths greater than 200 m.
The main outcome of the detailed geological mappingconcerned the granite veins. The authors of the 1:50,000geological map inferred that these veins resulted from thepartial melting of the other lithological units during
50
Hydrogeology Journal (2014) 22: 47–68 DOI 10.1007/s10040-013-1073-1
metamorphism, and consequently, that they are conform-able (same dip) with the main foliation of the lithologicalunits and effectively are sills “invading” the otherlithological units. However, the field survey clearlyshowed that the granite is much younger and occurs assubvertical N110–N160°E-oriented veins that are metersto tens of meters thick and tens to hundreds of meterslong. These veins are not conformable with the otherrocks as they cross-cut all the other lithologies (Fig. 2).
These formations are deeply weathered with an up to30-m-thick cover of unconsolidated saprolite. Differentialweathering has resulted in higher relief granite veins (withseveral outcrops), whereas the Nages formation rocksoutcrop only very locally. As a consequence, in the springarea, the outcrops are quite poor and do not allowperforming a detailed structural analysis. As far as faultscan be identified on cores, the drillings crosscut severalfracture zones which mostly seem to be dilational (nocompressive tectoglyphs). Several fractures comprisebreccias that in places are cemented with calcite and/orsilica and can show signs of hydrothermal activity. It was
possible to characterize the orientation and dip of 15 openor mineralized fractures observed on the cores. Thesefractures were oriented, using the foliation measured in thewell as a geometric reference. The following main resultswere obtained: fracture orientation in the wells is mostlyN100–110°E (n=9), and then N130–140°E (n=3), andN020–030°E (n=3).
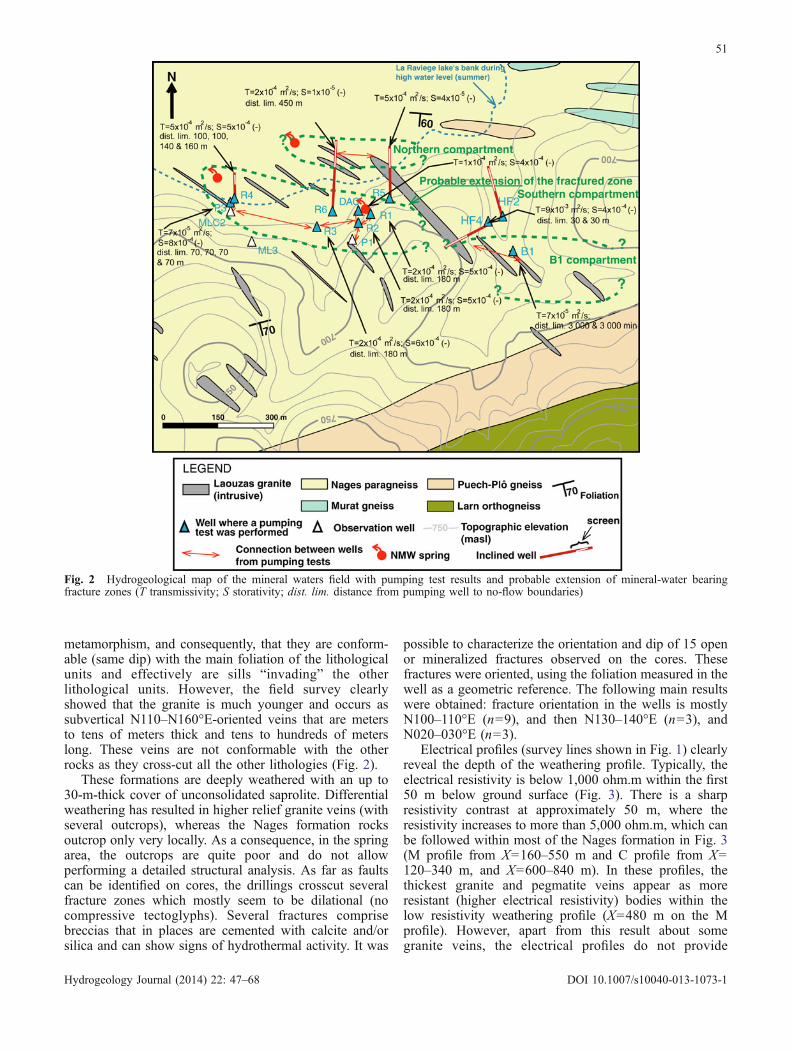
Electrical profiles (survey lines shown in Fig. 1) clearlyreveal the depth of the weathering profile. Typically, theelectrical resistivity is below 1,000 ohm.m within the first50 m below ground surface (Fig. 3). There is a sharpresistivity contrast at approximately 50 m, where theresistivity increases to more than 5,000 ohm.m, which canbe followed within most of the Nages formation in Fig. 3(M profile from X=160–550 m and C profile from X=120–340 m, and X=600–840 m). In these profiles, thethickest granite and pegmatite veins appear as moreresistant (higher electrical resistivity) bodies within thelow resistivity weathering profile (X=480 m on the Mprofile). However, apart from this result about somegranite veins, the electrical profiles do not provide
Fig. 2 Hydrogeological map of the mineral waters field with pumping test results and probable extension of mineral-water bearingfracture zones (T transmissivity; S storativity; dist. lim. distance from pumping well to no-flow boundaries)
51
Hydrogeology Journal (2014) 22: 47–68 DOI 10.1007/s10040-013-1073-1
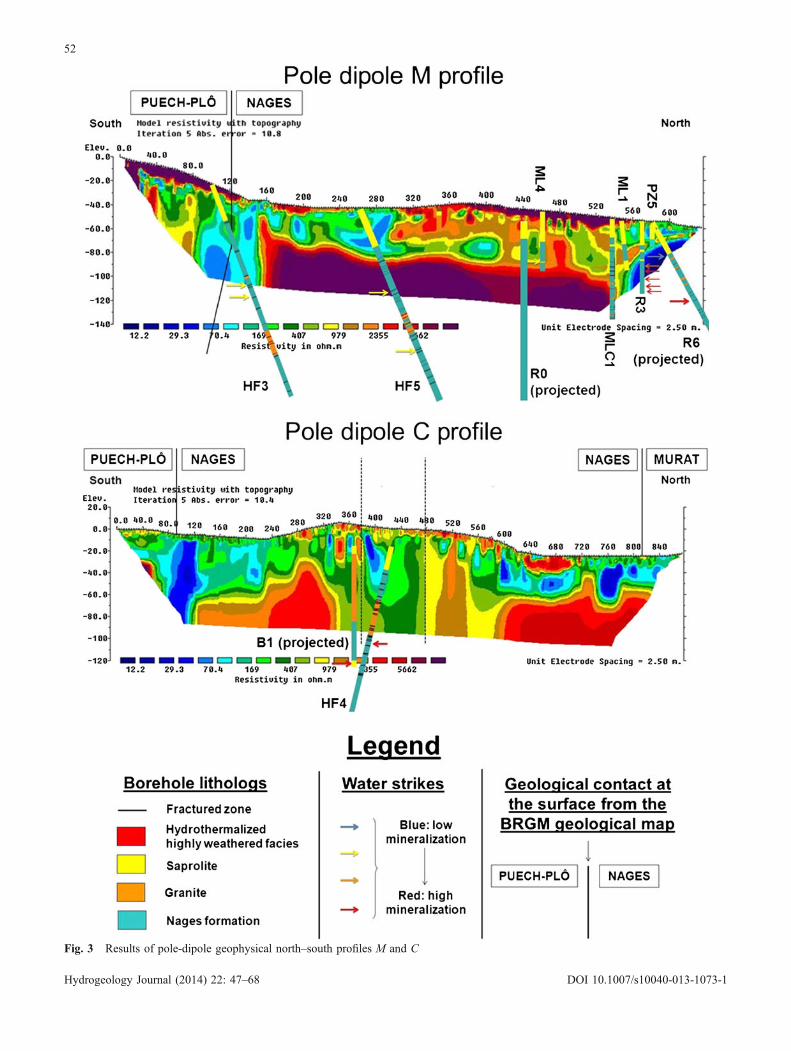
Fig. 3 Results of pole-dipole geophysical north–south profiles M and C
52
Hydrogeology Journal (2014) 22: 47–68 DOI 10.1007/s10040-013-1073-1
unambiguous information about the lithology, notablybelow the weathering profile. The electrical profiles alsoreveal enhanced weathering (or past hydrothermalism)along some lithological contacts, particularly the southernPuech-Plô/Murat and Nages contact (subvertical, about150 m wide, locally much wider, 50–70-ohm.m structurethat can be followed on most of the north–south electricalprofiles; Fig. 3, M profile from X=90–155 m and C profilefrom X=60–120 m). The most interesting results from thegeophysical survey are the deep (more than 100–120 m)subvertical conductive structures (locally down to about10 ohm.m, but more frequently between 150 and200 ohm.m; Fig. 3 , M profile from X=550 m and Cprofile from X=340–480 m). These structures are 30 tomore than 50 m wide, are oriented N100–110°E, andcoincide with the fractured zones in wells producingNMW (see the dotted green curves on Fig. 2). One ofthese structures, the southern one, identified on five north–south electrical profiles, seems to link the R4 area (west)at least to HF4 and B1 wells (east). The second structure,the northern one, only identified on two profiles due to thepresence of the lake (which limited the geophysicalmeasurements), links the area of R5 (west) with the HF2area (east). These structures (HF2, HF4 boreholes) andsome other conductive anomalies (HF1, HF3, HF5 bore-holes) were targeted during the last drilling campaign, andonly the HF2 and HF4 boreholes successfully tappedpermeable NMW bearing fracture zones in the “southern”and “northern” structures.
Preliminary hydrodynamic approachThe synthesis of blowing discharge measurements per-formed during down-hole-hammer drilling shows that thefissured zone of the Puech-Plô formation is much lessproductive than the Nages formation, with mean dis-charges 3–4 times lower. The productivity of the Nagesformation is nearly nil within the saprolite (first 20–30 mbelow ground surface) and is relatively higher within theunderlying 30–40-m-thick fissured zone. Productivity isnil within the deeper unweathered rock, except where theborehole crosscuts a deep NMW bearing fracture.
Piezometric measurements available from the wellstapping the NMW bearing fractures show two east–westslight piezometric depressions corresponding to the twostructures identified from geological and geophysical data(Fig. 1). These depressions appear to be related to thenatural flow within the mineral aquifer and to the pumpingin the wells. The first piezometric depression extends fromR4 to R1 (pumping in R1, R2, R3). The second onecorresponds to R5 and R6 pumping. Most of the formerlyflowing or still-existing NMW springs appear to belocated at the intersection between the two east–weststructures and the topographical low points (Figs. 1 and2). One main location is west of each structure, at theirlowest topographical point. The second one is a smallnorth–south valley in the vicinity of R1 and R2 wellswhere the main NMW spring was located. There is nosignificant NMW outflow in the HF4-B1 area, which is
interpreted as a consequence of the low permeability ofthe geological cover in this valley, as piezometric levels inthe mineral aquifer in that area are above ground level.Consequently, from these data, it can be inferred that thenatural mineral water may have flowed naturally (1)upwards and then westward from the B1 area toward themain NMW spring (between R1 and R2) and then to R4,and (2) from R5 (or even from HF2) to the springs locatedeast of R6.
Hydrodynamic parameters and aquifer structurefrom pumping testsData from 30 pumping tests, a few hours to severalmonths in duration, and performed on ten of theRieumajou area wells were interpreted to establishinterferences between the wells, and to evaluate thegeometry of the permeable formations and their hydrody-namic parameters. Except well R5, in which the screenedpart mainly crosscuts a granite vein, all others are sitedwithin the Nages gneiss. The tests were performedbetween 1990 and 2011 at the time of well drilling.During the pumping tests, water-level changes in nearbywells and piezometers were also observed.
One example of a 10-day pumping test performed onwell R4 in 2010 is presented (Fig. 4). R4 is 63.3 m deepand screened between 46.2 and 57.0 m into the NMWbearing fractures. The derivative curve is complex, butillustrates various typical flow regimes (Fig. 4):
– From the beginning of the test to 20 min durationdescribes the wellbore storage effect
– From 20 to 50 min, the flat trend of the derivativecurve is typical of infinite radial flow from whichaquifer transmissivity can be calculated (T=5.4×10⁻⁴ m2/s),
– From 50 to 400 min, the derivative curve tends to ahalf slope, and the drawdown reaches two parallel no-flow boundaries,
– From 400 to about 6,000 min, the derivative curvefollows a unit slope typical of bounded aquifers (atleast two additional no-flow boundaries),
– Finally, from 6,000 min to the end of the test,drawdown tends to stabilize, and the decrease of thederivative suggests leakage from shallow aquifers.Such a leakage effect was only observed in this well
This diagnostic shows that R4 is located in a boundedaquifer, the boundaries of which are close to the well(between 50 and 400 min). In addition, the aquifer isconnected to another aquifer (most probably the shallowaquifer) by leakage: consequently, this well is notexploited, as pumping might induce shallow aquifer waterinflow. This test was interpreted using a rectangularaquifer model with seepage (Hantush 1960) with fourorthogonal no-flow boundaries, wellbore storage effectand well skin (Fig. 4, black curves). The evaluated aquifersurface is 0.09 km2 (about 400 m length by 200 m wide).
53
Hydrogeology Journal (2014) 22: 47–68 DOI 10.1007/s10040-013-1073-1

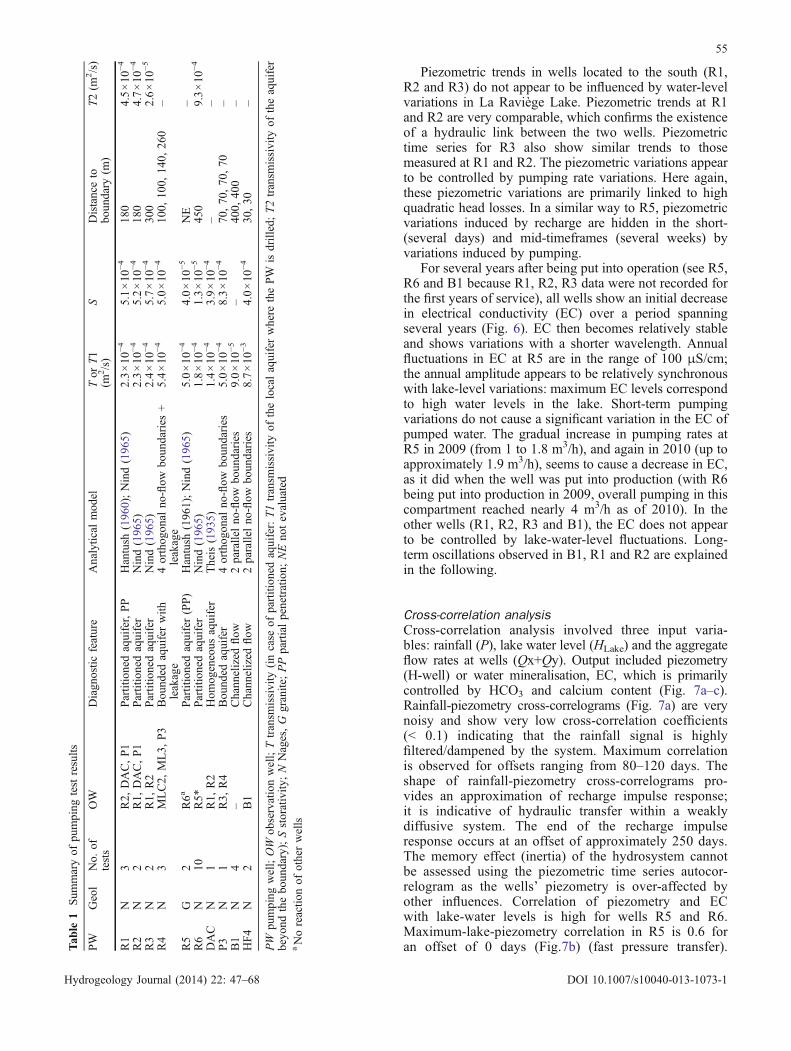
Test diagnosis and modelling were carried out to interpretthe 29 other pumping tests, the main results of which aresummarized in Fig. 2 and Table 1. In summary, theinterference tests clearly demonstrate that the site ispartitioned into two approximately east–west directioncompartments: a northern one (R5 and R6) and a southernone (R1-R2-R3-R4-P3-DAC). This result is supported bymost of the test diagnoses. It is also highly consistent withthe geophysical and piezometric data. Diagnostic andpumping test modelling also provide information about theaquifer geometry. The southern compartment is character-ized by a permeable (fractured) zone, about 0.1 km2 area(200×400 m approximately) and oriented in a near east–west direction (N105°E). Its eastern limit, however, is notwell constrained. Its transmissivity is about 3×10⁻⁴ m2/s andis relatively constant from one well to another. Its storativityis about 5×10⁻⁴. The northern compartment is alsoelongated in a near east–west direction and is probablysmaller than the southern one; however, pumping tests werenot long enough to reach all the boundaries. Transmissivityis similar to that of the southern compartment, but storativityis less, 2×10⁻⁵.
Two of the pumping tests, at B1 and HF4, could notdemonstrate any interference despite seeming to belong,geometrically and geologically, to the eastern continuation ofthe southern compartment. Nevertheless, interferences showthat the two wells belong to the same fractured system (“B1”compartment). HF4 yielded a high transmissivity (8×10⁻³ m2/s) corresponding to a zone a few meters wide. Thegeometry of compartment B1 is not well constrained, butfrom pumping tests, two parallel no-flow boundaries arereached relatively late after the start of the pumping(3,000 min). This leads to the interpretation of an apparently(depending on assumption of S) very large fractured zone(about 800 m wide); the orientation of this fractured zonewas not constrained by the modelling of the pumping tests,but it was by the geophysical data. As discussed in section
‘Multiple input single output’ in the following, the piezo-metric time-series analysis confirms that the HF4-B1compartment is the eastern prolongation of the R4-R1compartment. Several pumping tests show evidence ofpartial penetration (Table 1), suggesting that the fracturedzone extends much deeper than the bottom of the wells,which generally do not exceed 100–120 m depth.
Hydrogeological functioning of the systemfrom time-series analysis
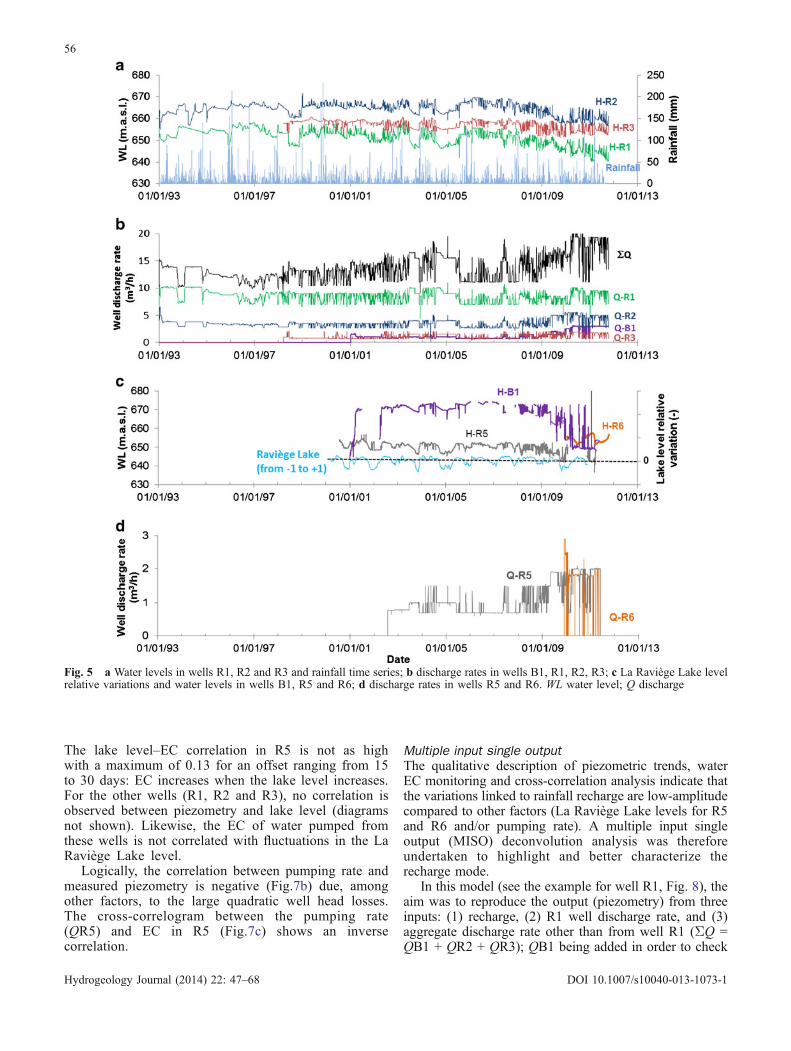
Preliminary description of hydrological time seriesFlow rate variations in the pumping wells (Fig. 5b)generally follow the same pattern, i.e., because of theconstraints dictated by NMW production, flow rates are allincreased or lowered synchronously. Very few periodsexist in which differential flow rate variation is available.
Piezometry trends measured at R5 in the northerncompartment show a correlation with lake-water level,which, according to dam management records, is lowduring the winter energy production season and high insummer during the tourist season. For R6, time series aretoo short to provide a basis for conclusion. The head in theaquifer is thus affected by the surface hydraulic headimposed by the lake surface. At daily time scale,piezometric fluctuations at R5 are impacted by pumpingbut it is not possible to identify whether this is only due topumping at R5 or also at neighbouring wells. The veryshort-term piezometric fluctuations are due to the highquadratic (non-linear) head losses in the R5 well visible in2004 and 2008–2009 when pumping rates are variable.Piezometric variability therefore appears to be essentiallycontrolled by pumping rates and by variations in the lake-water level, while piezometric variations linked to rainfall(recharge) appear to be negligible on short- and mid-timeframes (several days to several weeks).
Fig. 4 A 10-day pumping test on R4 with its diagnostic curve and modelling using an analytical solution for a rectangular aquifer withleakage effect. Flow rate 9 m3/h. Model parameters: T: 5.5×10⁻⁴ m2/s, S: 5×10⁻⁴ (−), rectangular aquifer: 0.09 km2, transmissivity of theaquitard: 10−6 m2/s
54
Hydrogeology Journal (2014) 22: 47–68 DOI 10.1007/s10040-013-1073-1
Piezometric trends in wells located to the south (R1,R2 and R3) do not appear to be influenced by water-levelvariations in La Raviège Lake. Piezometric trends at R1and R2 are very comparable, which confirms the existenceof a hydraulic link between the two wells. Piezometrictime series for R3 also show similar trends to thosemeasured at R1 and R2. The piezometric variations appearto be controlled by pumping rate variations. Here again,these piezometric variations are primarily linked to highquadratic head losses. In a similar way to R5, piezometricvariations induced by recharge are hidden in the short-(several days) and mid-timeframes (several weeks) byvariations induced by pumping.
For several years after being put into operation (see R5,R6 and B1 because R1, R2, R3 data were not recorded forthe first years of service), all wells show an initial decreasein electrical conductivity (EC) over a period spanningseveral years (Fig. 6). EC then becomes relatively stableand shows variations with a shorter wavelength. Annualfluctuations in EC at R5 are in the range of 100 μS/cm;the annual amplitude appears to be relatively synchronouswith lake-level variations: maximum EC levels correspondto high water levels in the lake. Short-term pumpingvariations do not cause a significant variation in the EC ofpumped water. The gradual increase in pumping rates atR5 in 2009 (from 1 to 1.8 m3/h), and again in 2010 (up toapproximately 1.9 m3/h), seems to cause a decrease in EC,as it did when the well was put into production (with R6being put into production in 2009, overall pumping in thiscompartment reached nearly 4 m3/h as of 2010). In theother wells (R1, R2, R3 and B1), the EC does not appearto be controlled by lake-water-level fluctuations. Long-term oscillations observed in B1, R1 and R2 are explainedin the following.
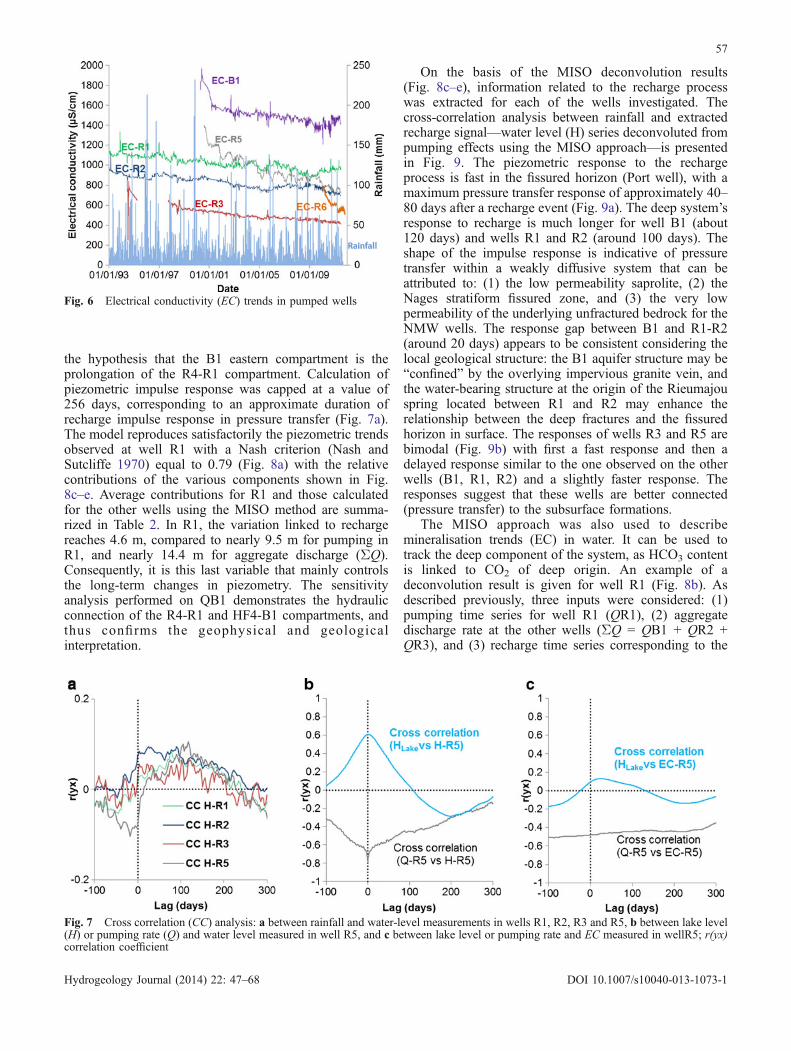
Cross-correlation analysisCross-correlation analysis involved three input varia-bles: rainfall (P), lake water level (HLake) and the aggregateflow rates at wells (Qx+Qy). Output included piezometry(H-well) or water mineralisation, EC, which is primarilycontrolled by HCO3 and calcium content (Fig. 7a–c).Rainfall-piezometry cross-correlograms (Fig. 7a) are verynoisy and show very low cross-correlation coefficients(< 0.1) indicating that the rainfall signal is highlyfiltered/dampened by the system. Maximum correlationis observed for offsets ranging from 80–120 days. Theshape of rainfall-piezometry cross-correlograms pro-vides an approximation of recharge impulse response;it is indicative of hydraulic transfer within a weaklydiffusive system. The end of the recharge impulseresponse occurs at an offset of approximately 250 days.The memory effect (inertia) of the hydrosystem cannotbe assessed using the piezometric time series autocor-relogram as the wells’ piezometry is over-affected byother influences. Correlation of piezometry and ECwith lake-water levels is high for wells R5 and R6.Maximum-lake-piezometry correlation in R5 is 0.6 foran offset of 0 days (Fig.7b) (fast pressure transfer).T
able
1Sum
maryof
pumping
testresults
PW
Geol
No.
oftests
OW
Diagn
ostic
feature
Analytical
mod
elTor
T1
(m2/s)
SDistanceto
boun
dary
(m)
T2(m
2/s)
R1
N3
R2,
DAC,P1
Partitionedaquifer,PP
Hantush
(196
0);Nind(196
5)2.3×10
−45.1×10
−418
04.5×10
−4
R2
N2
R1,
DAC,P1
Partitionedaquifer
Nind(196
5)2.3×10
−45.2×10
−418
04.7×10
−4
R3
N2
R1,
R2
Partitionedaquifer
Nind(196
5)2.4×10
−45.7×10
−430
02.6×10
−5
R4
N3
MLC2,
ML3,
P3
Bou
nded
aquiferwith
leakage
4orthog
onal
no-flow
boun
daries
+leakage
5.4×10
−45.0×10
−410
0,10
0,14
0,26
0–
R5
G2
R6a
Partitionedaquifer(PP)
Hantush
(196
1);Nind(196
5)5.0×10
−44.0×10
−5NE
–R6
N10
R5*
Partitionedaquifer
Nind(196
5)1.8×10
−41.3×10
−545
09.3×10
−4
DAC
N1
R1,
R2
Hom
ogeneous
aquifer
Theis(193
5)1.4×10
−43.9×10
−4–
–P3
N1
R3,
R4
Bou
nded
aquifer
4orthog
onal
no-flow
boun
daries
5.0×10
−48.3×10
−470
,70
,70
,70
–B1
N4
–Chann
elized
flow
2parallelno
-flow
boun
daries
9.0×10
−5–
400,
400
–HF4
N2
B1
Chann
elized
flow
2parallelno
-flow
boun
daries
8.7×10
−34.0×10
−430
,30
–
PW
pumping
well;OW
observationwell;Ttransm
issivity
(incase
ofpartition
edaquifer:T1transm
issivity
ofthelocalaquiferwhere
thePW
isdrilled;T2transm
issivity
oftheaquifer
beyo
ndthebo
undary);Sstorativity
;NNages,G
granite;PPpartialpenetration;
NEno
tevaluated
aNoreactio
nof
otherwells
55
Hydrogeology Journal (2014) 22: 47–68 DOI 10.1007/s10040-013-1073-1
The lake level–EC correlation in R5 is not as highwith a maximum of 0.13 for an offset ranging from 15to 30 days: EC increases when the lake level increases.For the other wells (R1, R2 and R3), no correlation isobserved between piezometry and lake level (diagramsnot shown). Likewise, the EC of water pumped fromthese wells is not correlated with fluctuations in the LaRaviège Lake level.
Logically, the correlation between pumping rate andmeasured piezometry is negative (Fig.7b) due, amongother factors, to the large quadratic well head losses.The cross-correlogram between the pumping rate(QR5) and EC in R5 (Fig.7c) shows an inversecorrelation.
Multiple input single outputThe qualitative description of piezometric trends, waterEC monitoring and cross-correlation analysis indicate thatthe variations linked to rainfall recharge are low-amplitudecompared to other factors (La Raviège Lake levels for R5and R6 and/or pumping rate). A multiple input singleoutput (MISO) deconvolution analysis was thereforeundertaken to highlight and better characterize therecharge mode.
In this model (see the example for well R1, Fig. 8), theaim was to reproduce the output (piezometry) from threeinputs: (1) recharge, (2) R1 well discharge rate, and (3)aggregate discharge rate other than from well R1 (ΣQ =QB1 + QR2 + QR3); QB1 being added in order to check
Fig. 5 a Water levels in wells R1, R2 and R3 and rainfall time series; b discharge rates in wells B1, R1, R2, R3; c La Raviège Lake levelrelative variations and water levels in wells B1, R5 and R6; d discharge rates in wells R5 and R6. WL water level; Q discharge
56
Hydrogeology Journal (2014) 22: 47–68 DOI 10.1007/s10040-013-1073-1
the hypothesis that the B1 eastern compartment is theprolongation of the R4-R1 compartment. Calculation ofpiezometric impulse response was capped at a value of256 days, corresponding to an approximate duration ofrecharge impulse response in pressure transfer (Fig. 7a).The model reproduces satisfactorily the piezometric trendsobserved at well R1 with a Nash criterion (Nash andSutcliffe 1970) equal to 0.79 (Fig. 8a) with the relativecontributions of the various components shown in Fig.8c–e. Average contributions for R1 and those calculatedfor the other wells using the MISO method are summa-rized in Table 2. In R1, the variation linked to rechargereaches 4.6 m, compared to nearly 9.5 m for pumping inR1, and nearly 14.4 m for aggregate discharge (ΣQ).Consequently, it is this last variable that mainly controlsthe long-term changes in piezometry. The sensitivityanalysis performed on QB1 demonstrates the hydraulicconnection of the R4-R1 and HF4-B1 compartments, andthus confirms the geophysical and geologicalinterpretation.
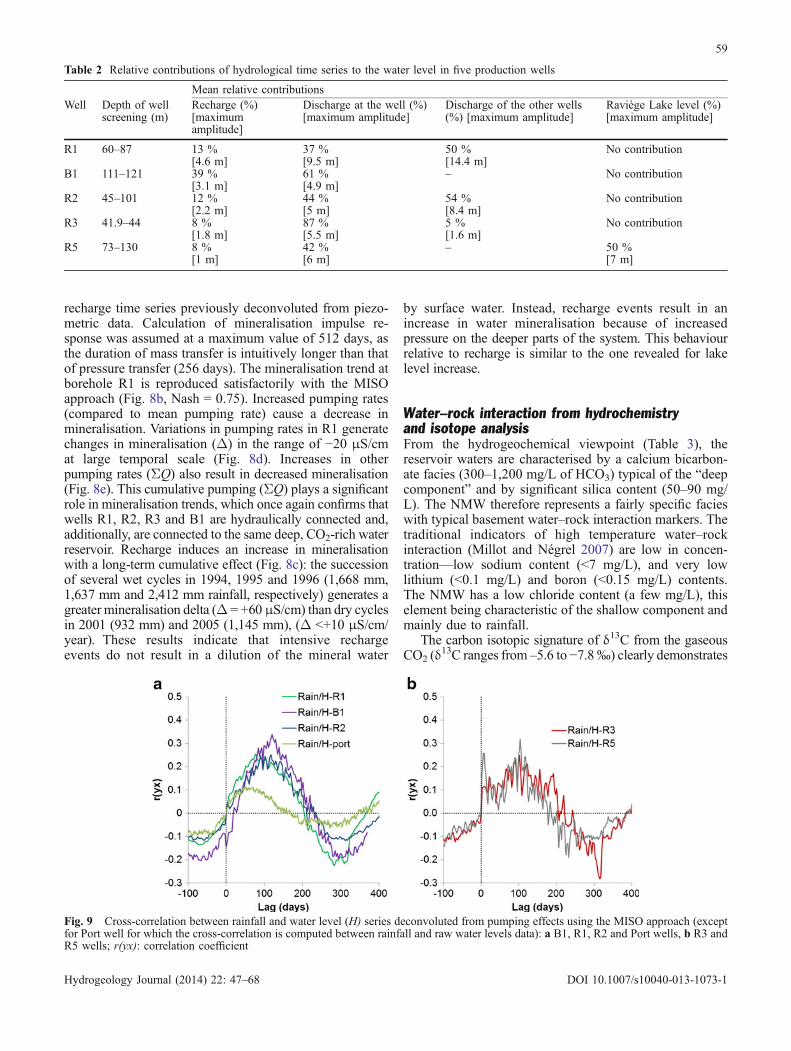
On the basis of the MISO deconvolution results(Fig. 8c–e), information related to the recharge processwas extracted for each of the wells investigated. Thecross-correlation analysis between rainfall and extractedrecharge signal—water level (H) series deconvoluted frompumping effects using the MISO approach—is presentedin Fig. 9. The piezometric response to the rechargeprocess is fast in the fissured horizon (Port well), with amaximum pressure transfer response of approximately 40–80 days after a recharge event (Fig. 9a). The deep system’sresponse to recharge is much longer for well B1 (about120 days) and wells R1 and R2 (around 100 days). Theshape of the impulse response is indicative of pressuretransfer within a weakly diffusive system that can beattributed to: (1) the low permeability saprolite, (2) theNages stratiform fissured zone, and (3) the very lowpermeability of the underlying unfractured bedrock for theNMW wells. The response gap between B1 and R1-R2(around 20 days) appears to be consistent considering thelocal geological structure: the B1 aquifer structure may be“confined” by the overlying impervious granite vein, andthe water-bearing structure at the origin of the Rieumajouspring located between R1 and R2 may enhance therelationship between the deep fractures and the fissuredhorizon in surface. The responses of wells R3 and R5 arebimodal (Fig. 9b) with first a fast response and then adelayed response similar to the one observed on the otherwells (B1, R1, R2) and a slightly faster response. Theresponses suggest that these wells are better connected(pressure transfer) to the subsurface formations.
The MISO approach was also used to describemineralisation trends (EC) in water. It can be used totrack the deep component of the system, as HCO3 contentis linked to CO2 of deep origin. An example of adeconvolution result is given for well R1 (Fig. 8b). Asdescribed previously, three inputs were considered: (1)pumping time series for well R1 (QR1), (2) aggregatedischarge rate at the other wells (ΣQ = QB1 + QR2 +QR3), and (3) recharge time series corresponding to the
Fig. 7 Cross correlation (CC) analysis: a between rainfall and water-level measurements in wells R1, R2, R3 and R5, b between lake level(H) or pumping rate (Q) and water level measured in well R5, and c between lake level or pumping rate and EC measured in wellR5; r(yx)correlation coefficient
Fig. 6 Electrical conductivity (EC) trends in pumped wells
57
Hydrogeology Journal (2014) 22: 47–68 DOI 10.1007/s10040-013-1073-1
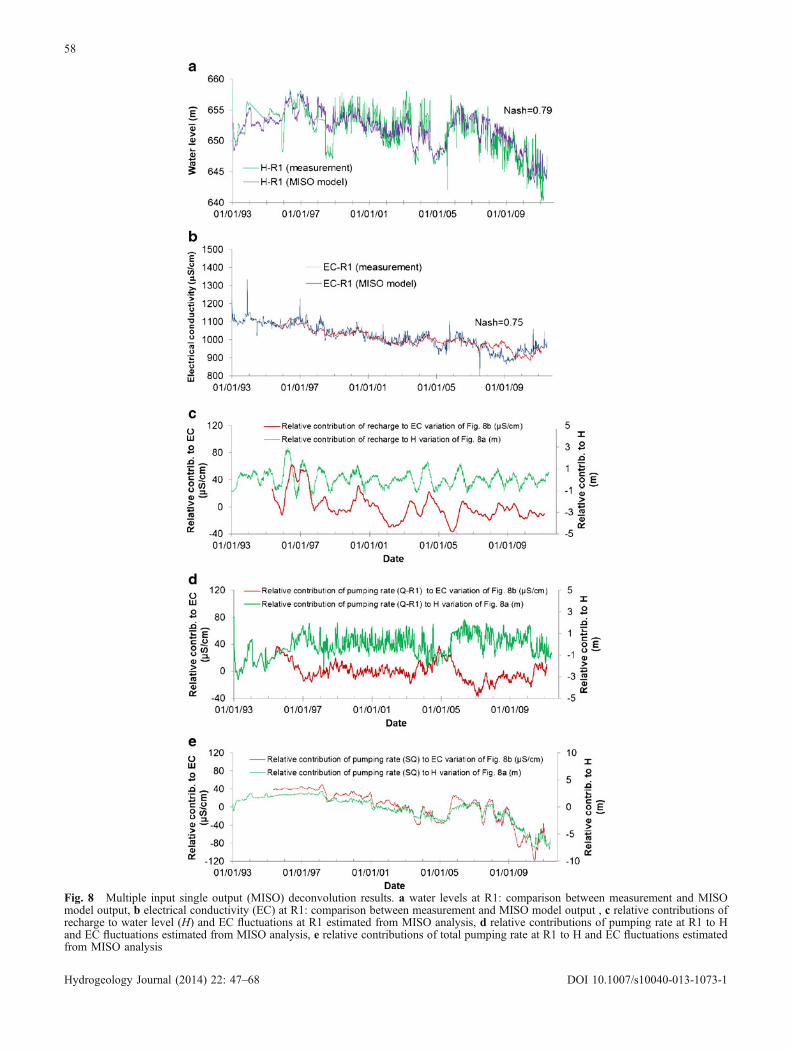
Fig. 8 Multiple input single output (MISO) deconvolution results. a water levels at R1: comparison between measurement and MISOmodel output, b electrical conductivity (EC) at R1: comparison between measurement and MISO model output , c relative contributions ofrecharge to water level (H) and EC fluctuations at R1 estimated from MISO analysis, d relative contributions of pumping rate at R1 to Hand EC fluctuations estimated from MISO analysis, e relative contributions of total pumping rate at R1 to H and EC fluctuations estimatedfrom MISO analysis
58
Hydrogeology Journal (2014) 22: 47–68 DOI 10.1007/s10040-013-1073-1
recharge time series previously deconvoluted from piezo-metric data. Calculation of mineralisation impulse re-sponse was assumed at a maximum value of 512 days, asthe duration of mass transfer is intuitively longer than thatof pressure transfer (256 days). The mineralisation trend atborehole R1 is reproduced satisfactorily with the MISOapproach (Fig. 8b, Nash = 0.75). Increased pumping rates(compared to mean pumping rate) cause a decrease inmineralisation. Variations in pumping rates in R1 generatechanges in mineralisation (Δ) in the range of −20 μS/cmat large temporal scale (Fig. 8d). Increases in otherpumping rates (ΣQ) also result in decreased mineralisation(Fig. 8e). This cumulative pumping (ΣQ) plays a significantrole in mineralisation trends, which once again confirms thatwells R1, R2, R3 and B1 are hydraulically connected and,additionally, are connected to the same deep, CO2-rich waterreservoir. Recharge induces an increase in mineralisationwith a long-term cumulative effect (Fig. 8c): the successionof several wet cycles in 1994, 1995 and 1996 (1,668 mm,1,637 mm and 2,412 mm rainfall, respectively) generates agreater mineralisation delta (Δ = +60 μS/cm) than dry cyclesin 2001 (932 mm) and 2005 (1,145 mm), (Δ <+10 μS/cm/year). These results indicate that intensive rechargeevents do not result in a dilution of the mineral water
by surface water. Instead, recharge events result in anincrease in water mineralisation because of increasedpressure on the deeper parts of the system. This behaviourrelative to recharge is similar to the one revealed for lakelevel increase.
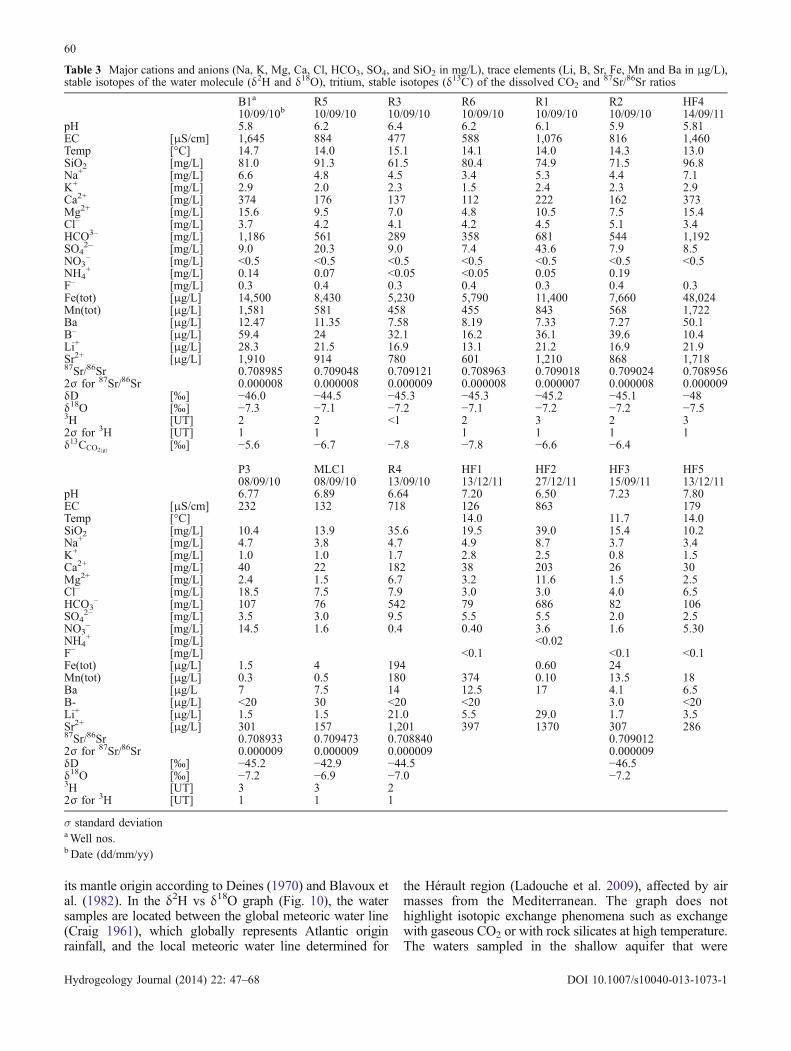
Water–rock interaction from hydrochemistryand isotope analysisFrom the hydrogeochemical viewpoint (Table 3), thereservoir waters are characterised by a calcium bicarbon-ate facies (300–1,200 mg/L of HCO3) typical of the “deepcomponent” and by significant silica content (50–90 mg/L). The NMW therefore represents a fairly specific facieswith typical basement water–rock interaction markers. Thetraditional indicators of high temperature water–rockinteraction (Millot and Négrel 2007) are low in concen-tration—low sodium content (<7 mg/L), and very lowlithium (<0.1 mg/L) and boron (<0.15 mg/L) contents.The NMW has a low chloride content (a few mg/L), thiselement being characteristic of the shallow component andmainly due to rainfall.
The carbon isotopic signature of δ13C from the gaseousCO2 (δ
13C ranges from –5.6 to −7.8‰) clearly demonstrates
Table 2 Relative contributions of hydrological time series to the water level in five production wells
Mean relative contributionsWell Depth of well
screening (m)Recharge (%)[maximumamplitude]
Discharge at the well (%)[maximum amplitude]
Discharge of the other wells(%) [maximum amplitude]
Raviège Lake level (%)[maximum amplitude]
R1 60–87 13 %[4.6 m]
37 %[9.5 m]
50 %[14.4 m]
No contribution
B1 111–121 39 %[3.1 m]
61 %[4.9 m]
– No contribution
R2 45–101 12 %[2.2 m]
44 %[5 m]
54 %[8.4 m]
No contribution
R3 41.9–44 8 %[1.8 m]
87 %[5.5 m]
5 %[1.6 m]
No contribution
R5 73–130 8 %[1 m]
42 %[6 m]
– 50 %[7 m]
Fig. 9 Cross-correlation between rainfall and water level (H) series deconvoluted from pumping effects using the MISO approach (exceptfor Port well for which the cross-correlation is computed between rainfall and raw water levels data): a B1, R1, R2 and Port wells, b R3 andR5 wells; r(yx): correlation coefficient
59
Hydrogeology Journal (2014) 22: 47–68 DOI 10.1007/s10040-013-1073-1
its mantle origin according to Deines (1970) and Blavoux etal. (1982). In the δ2H vs δ18O graph (Fig. 10), the watersamples are located between the global meteoric water line(Craig 1961), which globally represents Atlantic originrainfall, and the local meteoric water line determined for
the Hérault region (Ladouche et al. 2009), affected by airmasses from the Mediterranean. The graph does nothighlight isotopic exchange phenomena such as exchangewith gaseous CO2 or with rock silicates at high temperature.The waters sampled in the shallow aquifer that were
Table 3 Major cations and anions (Na, K, Mg, Ca, Cl, HCO3, SO4, and SiO2 in mg/L), trace elements (Li, B, Sr, Fe, Mn and Ba in μg/L),stable isotopes of the water molecule (δ2H and δ18O), tritium, stable isotopes (δ13C) of the dissolved CO2 and
87Sr/86Sr ratios
B1a R5 R3 R6 R1 R2 HF410/09/10b 10/09/10 10/09/10 10/09/10 10/09/10 10/09/10 14/09/11
pH 5.8 6.2 6.4 6.2 6.1 5.9 5.81EC [μS/cm] 1,645 884 477 588 1,076 816 1,460Temp [°C] 14.7 14.0 15.1 14.1 14.0 14.3 13.0SiO2 [mg/L] 81.0 91.3 61.5 80.4 74.9 71.5 96.8Na+ [mg/L] 6.6 4.8 4.5 3.4 5.3 4.4 7.1K+ [mg/L] 2.9 2.0 2.3 1.5 2.4 2.3 2.9Ca2+ [mg/L] 374 176 137 112 222 162 373Mg2+ [mg/L] 15.6 9.5 7.0 4.8 10.5 7.5 15.4Cl– [mg/L] 3.7 4.2 4.1 4.2 4.5 5.1 3.4HCO3– [mg/L] 1,186 561 289 358 681 544 1,192SO4
2– [mg/L] 9.0 20.3 9.0 7.4 43.6 7.9 8.5NO3
– [mg/L] <0.5 <0.5 <0.5 <0.5 <0.5 <0.5 <0.5NH4
+ [mg/L] 0.14 0.07 <0.05 <0.05 0.05 0.19F– [mg/L] 0.3 0.4 0.3 0.4 0.3 0.4 0.3Fe(tot) [μg/L] 14,500 8,430 5,230 5,790 11,400 7,660 48,024Mn(tot) [μg/L] 1,581 581 458 455 843 568 1,722Ba [μg/L] 12.47 11.35 7.58 8.19 7.33 7.27 50.1B– [μg/L] 59.4 24 32.1 16.2 36.1 39.6 10.4Li+ [μg/L] 28.3 21.5 16.9 13.1 21.2 16.9 21.9Sr2+ [μg/L] 1,910 914 780 601 1,210 868 1,71887Sr/86Sr 0.708985 0.709048 0.709121 0.708963 0.709018 0.709024 0.7089562σ for 87Sr/86Sr 0.000008 0.000008 0.000009 0.000008 0.000007 0.000008 0.000009δD [‰] −46.0 −44.5 −45.3 −45.3 −45.2 −45.1 −48δ18O [‰] −7.3 −7.1 −7.2 −7.1 −7.2 −7.2 −7.53H [UT] 2 2 <1 2 3 2 32σ for 3H [UT] 1 1 1 1 1 1δ13CCO2ðgÞ [‰] −5.6 −6.7 −7.8 −7.8 −6.6 −6.4
P3 MLC1 R4 HF1 HF2 HF3 HF508/09/10 08/09/10 13/09/10 13/12/11 27/12/11 15/09/11 13/12/11
pH 6.77 6.89 6.64 7.20 6.50 7.23 7.80EC [μS/cm] 232 132 718 126 863 179Temp [°C] 14.0 11.7 14.0SiO2 [mg/L] 10.4 13.9 35.6 19.5 39.0 15.4 10.2Na+ [mg/L] 4.7 3.8 4.7 4.9 8.7 3.7 3.4K+ [mg/L] 1.0 1.0 1.7 2.8 2.5 0.8 1.5Ca2+ [mg/L] 40 22 182 38 203 26 30Mg2+ [mg/L] 2.4 1.5 6.7 3.2 11.6 1.5 2.5Cl– [mg/L] 18.5 7.5 7.9 3.0 3.0 4.0 6.5HCO3
– [mg/L] 107 76 542 79 686 82 106SO4
2– [mg/L] 3.5 3.0 9.5 5.5 5.5 2.0 2.5NO3
– [mg/L] 14.5 1.6 0.4 0.40 3.6 1.6 5.30NH4
+ [mg/L] <0.02F– [mg/L] <0.1 <0.1 <0.1Fe(tot) [μg/L] 1.5 4 194 0.60 24Mn(tot) [μg/L] 0.3 0.5 180 374 0.10 13.5 18Ba [μg/L 7 7.5 14 12.5 17 4.1 6.5B- [μg/L] <20 30 <20 <20 3.0 <20Li+ [μg/L] 1.5 1.5 21.0 5.5 29.0 1.7 3.5Sr2+ [μg/L] 301 157 1,201 397 1370 307 28687Sr/86Sr 0.708933 0.709473 0.708840 0.7090122σ for 87Sr/86Sr 0.000009 0.000009 0.000009 0.000009δD [‰] −45.2 −42.9 −44.5 −46.5δ18O [‰] −7.2 −6.9 −7.0 −7.23H [UT] 3 3 22σ for 3H [UT] 1 1 1
σ standard deviationaWell nos.b Date (dd/mm/yy)
60
Hydrogeology Journal (2014) 22: 47–68 DOI 10.1007/s10040-013-1073-1
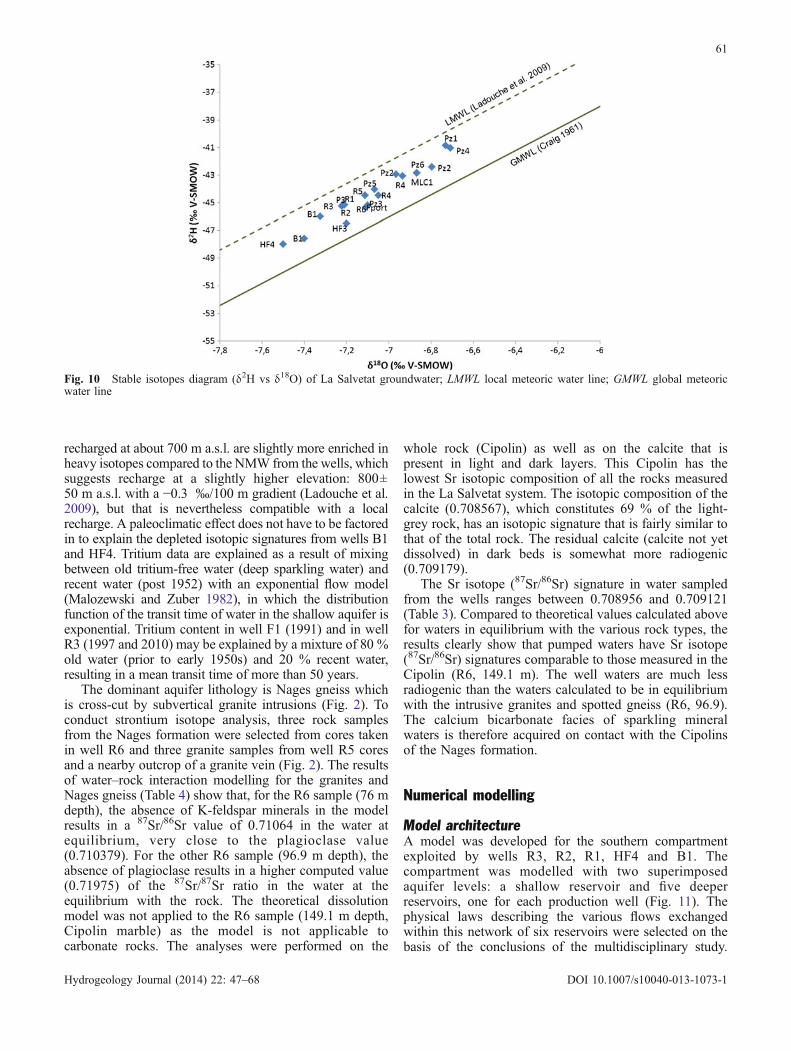
recharged at about 700 m a.s.l. are slightly more enriched inheavy isotopes compared to the NMW from the wells, whichsuggests recharge at a slightly higher elevation: 800±50 m a.s.l. with a −0.3 ‰/100 m gradient (Ladouche et al.2009), but that is nevertheless compatible with a localrecharge. A paleoclimatic effect does not have to be factoredin to explain the depleted isotopic signatures from wells B1and HF4. Tritium data are explained as a result of mixingbetween old tritium-free water (deep sparkling water) andrecent water (post 1952) with an exponential flow model(Malozewski and Zuber 1982), in which the distributionfunction of the transit time of water in the shallow aquifer isexponential. Tritium content in well F1 (1991) and in wellR3 (1997 and 2010) may be explained by a mixture of 80 %old water (prior to early 1950s) and 20 % recent water,resulting in a mean transit time of more than 50 years.
The dominant aquifer lithology is Nages gneiss whichis cross-cut by subvertical granite intrusions (Fig. 2). Toconduct strontium isotope analysis, three rock samplesfrom the Nages formation were selected from cores takenin well R6 and three granite samples from well R5 coresand a nearby outcrop of a granite vein (Fig. 2). The resultsof water–rock interaction modelling for the granites andNages gneiss (Table 4) show that, for the R6 sample (76 mdepth), the absence of K-feldspar minerals in the modelresults in a 87Sr/86Sr value of 0.71064 in the water atequilibrium, very close to the plagioclase value(0.710379). For the other R6 sample (96.9 m depth), theabsence of plagioclase results in a higher computed value(0.71975) of the 87Sr/87Sr ratio in the water at theequilibrium with the rock. The theoretical dissolutionmodel was not applied to the R6 sample (149.1 m depth,Cipolin marble) as the model is not applicable tocarbonate rocks. The analyses were performed on the
whole rock (Cipolin) as well as on the calcite that ispresent in light and dark layers. This Cipolin has thelowest Sr isotopic composition of all the rocks measuredin the La Salvetat system. The isotopic composition of thecalcite (0.708567), which constitutes 69 % of the light-grey rock, has an isotopic signature that is fairly similar tothat of the total rock. The residual calcite (calcite not yetdissolved) in dark beds is somewhat more radiogenic(0.709179).
The Sr isotope (87Sr/86Sr) signature in water sampledfrom the wells ranges between 0.708956 and 0.709121(Table 3). Compared to theoretical values calculated abovefor waters in equilibrium with the various rock types, theresults clearly show that pumped waters have Sr isotope(87Sr/86Sr) signatures comparable to those measured in theCipolin (R6, 149.1 m). The well waters are much lessradiogenic than the waters calculated to be in equilibriumwith the intrusive granites and spotted gneiss (R6, 96.9).The calcium bicarbonate facies of sparkling mineralwaters is therefore acquired on contact with the Cipolinsof the Nages formation.
Numerical modelling
Model architectureA model was developed for the southern compartmentexploited by wells R3, R2, R1, HF4 and B1. Thecompartment was modelled with two superimposedaquifer levels: a shallow reservoir and five deeperreservoirs, one for each production well (Fig. 11). Thephysical laws describing the various flows exchangedwithin this network of six reservoirs were selected on thebasis of the conclusions of the multidisciplinary study.
Fig. 10 Stable isotopes diagram (δ2H vs δ18O) of La Salvetat groundwater; LMWL local meteoric water line; GMWL global meteoricwater line
61
Hydrogeology Journal (2014) 22: 47–68 DOI 10.1007/s10040-013-1073-1
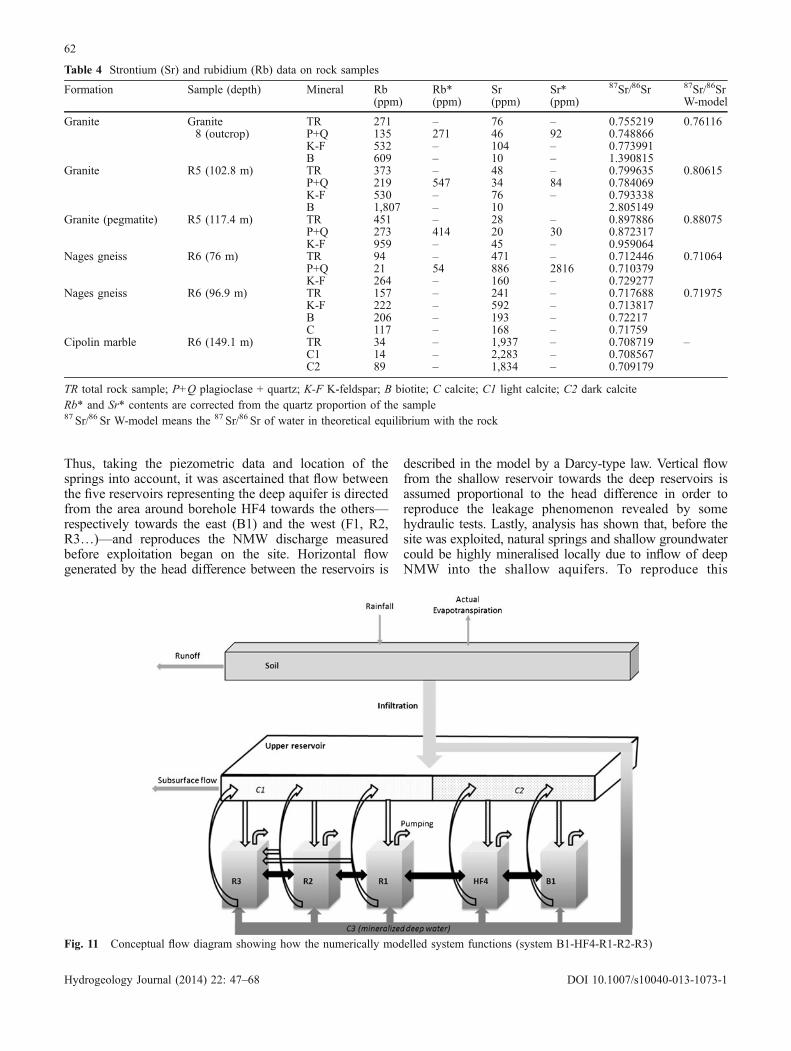
Thus, taking the piezometric data and location of thesprings into account, it was ascertained that flow betweenthe five reservoirs representing the deep aquifer is directedfrom the area around borehole HF4 towards the others—respectively towards the east (B1) and the west (F1, R2,R3…)—and reproduces the NMW discharge measuredbefore exploitation began on the site. Horizontal flowgenerated by the head difference between the reservoirs is
described in the model by a Darcy-type law. Vertical flowfrom the shallow reservoir towards the deep reservoirs isassumed proportional to the head difference in order toreproduce the leakage phenomenon revealed by somehydraulic tests. Lastly, analysis has shown that, before thesite was exploited, natural springs and shallow groundwatercould be highly mineralised locally due to inflow of deepNMW into the shallow aquifers. To reproduce this
Table 4 Strontium (Sr) and rubidium (Rb) data on rock samples
Formation Sample (depth) Mineral Rb(ppm)
Rb*(ppm)
Sr(ppm)
Sr*(ppm)
87Sr/86Sr 87Sr/86SrW-model
Granite Granite8 (outcrop)
TR 271 – 76 – 0.755219 0.76116P+Q 135 271 46 92 0.748866K-F 532 – 104 – 0.773991B 609 – 10 – 1.390815
Granite R5 (102.8 m) TR 373 – 48 – 0.799635 0.80615P+Q 219 547 34 84 0.784069K-F 530 – 76 – 0.793338B 1,807 – 10 2.805149
Granite (pegmatite) R5 (117.4 m) TR 451 – 28 – 0.897886 0.88075P+Q 273 414 20 30 0.872317K-F 959 – 45 – 0.959064
Nages gneiss R6 (76 m) TR 94 – 471 – 0.712446 0.71064P+Q 21 54 886 2816 0.710379K-F 264 – 160 – 0.729277
Nages gneiss R6 (96.9 m) TR 157 – 241 – 0.717688 0.71975K-F 222 – 592 – 0.713817B 206 – 193 – 0.72217C 117 – 168 – 0.71759
Cipolin marble R6 (149.1 m) TR 34 – 1,937 – 0.708719 –C1 14 – 2,283 – 0.708567C2 89 – 1,834 – 0.709179
TR total rock sample; P+Q plagioclase + quartz; K-F K-feldspar; B biotite; C calcite; C1 light calcite; C2 dark calciteRb* and Sr* contents are corrected from the quartz proportion of the sample87 Sr/86 Sr W-model means the 87 Sr/86 Sr of water in theoretical equilibrium with the rock
Fig. 11 Conceptual flow diagram showing how the numerically modelled system functions (system B1-HF4-R1-R2-R3)
62
Hydrogeology Journal (2014) 22: 47–68 DOI 10.1007/s10040-013-1073-1
mineralisation, the deep reservoirs were forced to empty intothe shallow reservoir according to a decreasing exponential(emptying time 5–10 days depending on the reservoir) whichterminates below a certain piezometric threshold.
A “soil” module in the model calculates the partition-ing of rainwater into evapotranspiration, runoff, andinfiltration according to the Thornthwaite classical model.Runoff flows towards the La Raviège Lake outside themodelled system. Infiltration comprises two components,with given chemical composition. The first component hasa “shallow” type geochemical signature and is imposed asinput to the shallow reservoir. The chemical compositionof water is not calculated by the model but rather is aboundary condition, constant over time. In order toreproduce the observed inflow of NMW in the shallowaquifer (reservoir), this boundary condition was spatial-ized. Consequently, the chemical composition of water inthe shallow reservoir could vary from one reservoir to theother. Thus, a composition C1 (Fig. 11) is imposed fortransfers from the shallow reservoir feeding R1, R2 andR3 reservoirs, and a more mineralised composition C2 isimposed as input for feeding B1 and HF4. This con-ceptualisation allows for reproduction of a higher chem-ical inertia of B1 and HF4 wells as compared to R1, R2and R3. The second component feeding the deepreservoirs is the deep geochemical signature C3. All theseimposed compositions are chosen among available resultsof surface- or deep-water analyses. These two componentsare imposed at the reservoir input with a time lag relativeto the rainfall that generated them. This is used tointroduce inertia into the model on the basis of amaximum lag of 80–130 days as highlighted by time-series analysis.
The chemical composition of the water in each of thefive reservoirs is calculated by the model according to amixing process due to flow exchange between thereservoirs. Water–rock geochemical reactions are alsotaken into account where necessary. The chemicalheterogeneous reactions that produce or consume calcium,carbon and silica in aqueous phase are described by first-order kinetic laws. The other chemical elements areconsidered non-reactive.
The model was numerically transposed usingMATLAB and Simulink software with a 1-day time step.The physical parameters of the model were determinedaccording to the results of the multidisciplinary study. Inthis way, the dimensions of the five deep reservoirs aresuch that they form a deeply rooted lens-shaped structure50 m wide and 600 m long. As defined by the model,these reservoirs are unconfined. An effective porosity of1 %, a classical value in the shallow weathered-fracturedzone of crystalline rocks (Marechal et al. 2006; Maréchalet al. 2004), leads, at an equivalent water head, to a bodyof water of the same order of magnitude as that stored inthe natural confined aquifer (storage coefficient estimatedat 5 × 10⁻⁴) including wells R3, R2, R1, HF4 and B1. Thereservoir time constants are fitted so that, withoutpumping, flow is within an order of magnitude ofthe estimated discharge of natural springs before
production, mainly to the west (R3) and to a muchlower extent to the east (B1). In order to estimate theother model parameters, time series of productiondischarge, daily piezometric data and weekly chem-ical analyses are available on a 10–22 years period.A long transient period was needed for initialisationbecause, owing to the inertia of the hydrogeologicalsystem, the observed system is never in a stationaryregime. The area of the upper reservoir’s catchmentzone was determined during fitting, at 0.6 km2. Thisvalue is in agreement with the 18O data and thephysical geography of the site, and corresponds tothree quarters of the surface catchment area. Lastly, tomost accurately reflect the concentrations of chemicalspecies observed in the water from the different wells,the chemical reactivity of calcium, carbon and silicawere considered. For the other chemical elements consideredby the model, the perfect tracer hypothesis is acceptable (i.e.the chemical species are considered un-reactive).
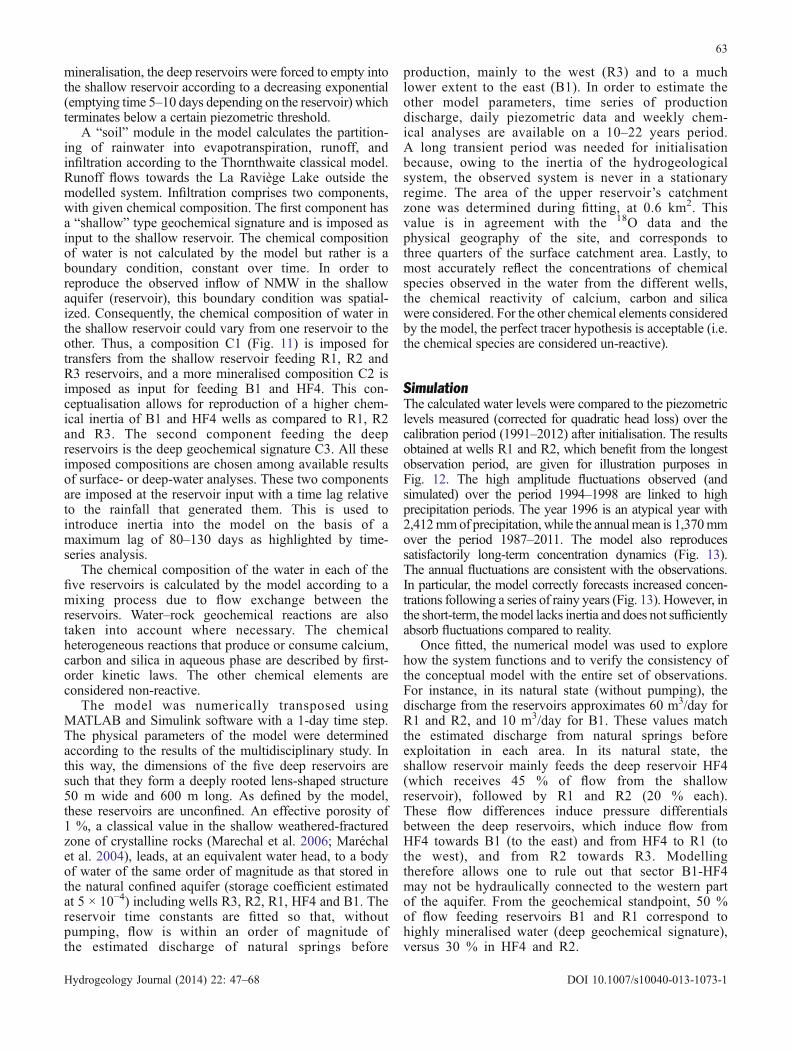
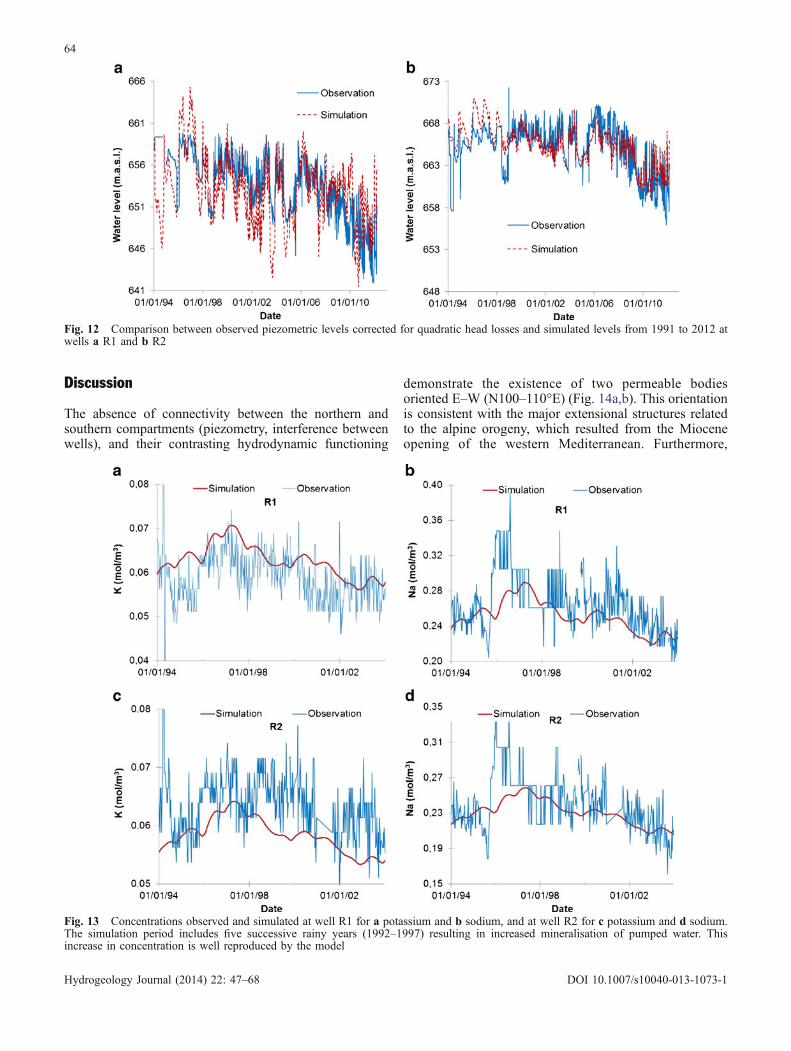
SimulationThe calculated water levels were compared to the piezometriclevels measured (corrected for quadratic head loss) over thecalibration period (1991–2012) after initialisation. The resultsobtained at wells R1 and R2, which benefit from the longestobservation period, are given for illustration purposes inFig. 12. The high amplitude fluctuations observed (andsimulated) over the period 1994–1998 are linked to highprecipitation periods. The year 1996 is an atypical year with2,412mmof precipitation, while the annualmean is 1,370mmover the period 1987–2011. The model also reproducessatisfactorily long-term concentration dynamics (Fig. 13).The annual fluctuations are consistent with the observations.In particular, the model correctly forecasts increased concen-trations following a series of rainy years (Fig. 13). However, inthe short-term, themodel lacks inertia and does not sufficientlyabsorb fluctuations compared to reality.
Once fitted, the numerical model was used to explorehow the system functions and to verify the consistency ofthe conceptual model with the entire set of observations.For instance, in its natural state (without pumping), thedischarge from the reservoirs approximates 60 m3/day forR1 and R2, and 10 m3/day for B1. These values matchthe estimated discharge from natural springs beforeexploitation in each area. In its natural state, theshallow reservoir mainly feeds the deep reservoir HF4(which receives 45 % of flow from the shallowreservoir), followed by R1 and R2 (20 % each).These flow differences induce pressure differentialsbetween the deep reservoirs, which induce flow fromHF4 towards B1 (to the east) and from HF4 to R1 (tothe west), and from R2 towards R3. Modellingtherefore allows one to rule out that sector B1-HF4may not be hydraulically connected to the western partof the aquifer. From the geochemical standpoint, 50 %of flow feeding reservoirs B1 and R1 correspond tohighly mineralised water (deep geochemical signature),versus 30 % in HF4 and R2.
63
Hydrogeology Journal (2014) 22: 47–68 DOI 10.1007/s10040-013-1073-1
Discussion
The absence of connectivity between the northern andsouthern compartments (piezometry, interference betweenwells), and their contrasting hydrodynamic functioning
demonstrate the existence of two permeable bodiesoriented E–W (N100–110°E) (Fig. 14a,b). This orientationis consistent with the major extensional structures relatedto the alpine orogeny, which resulted from the Mioceneopening of the western Mediterranean. Furthermore,
Fig. 12 Comparison between observed piezometric levels corrected for quadratic head losses and simulated levels from 1991 to 2012 atwells a R1 and b R2
Fig. 13 Concentrations observed and simulated at well R1 for a potassium and b sodium, and at well R2 for c potassium and d sodium.The simulation period includes five successive rainy years (1992–1997) resulting in increased mineralisation of pumped water. Thisincrease in concentration is well reproduced by the model
64
Hydrogeology Journal (2014) 22: 47–68 DOI 10.1007/s10040-013-1073-1
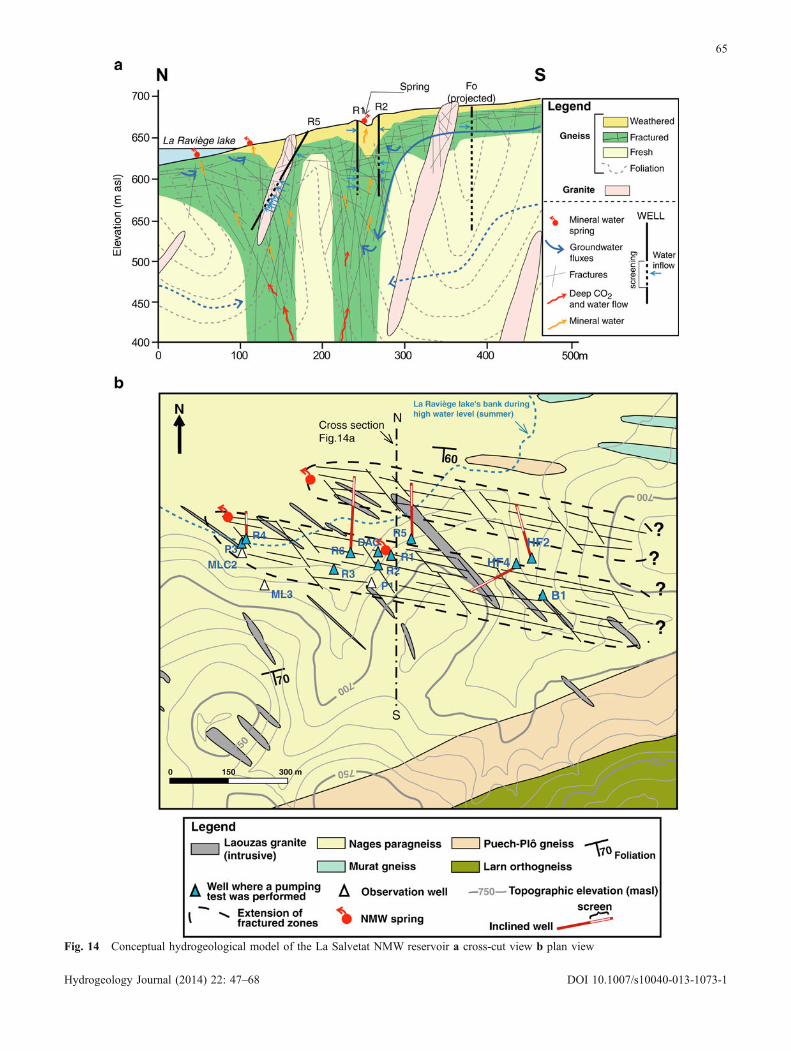
Fig. 14 Conceptual hydrogeological model of the La Salvetat NMW reservoir a cross-cut view b plan view
65
Hydrogeology Journal (2014) 22: 47–68 DOI 10.1007/s10040-013-1073-1
signal treatment and modelling demonstrated the continu-ity of the southern compartment towards the east until atleast B1 well. These hydraulic data agree with thegeological structure deduced from the geophysics andcalibrated against the geological data from the wells andthe basic data such as topography, location of NMWsprings, and piezometry. The geology alone, however, wasnot clear enough to be demonstrative. Based on thesefindings, it appears that the granite veins do not explainthe permeability of the La Salvetat mineral aquifer. Watermineralisation is primarily acquired at depth on contactwith the Cipolin marbles which must, consequently, bedeeply rooted, while the granites form fairly thin localveins, which are not deeply rooted. Analysis of pumpingand interference tests between production wells, inaddition to the structure (two distinct permeable bodies)and the characterisation of their hydrodynamic parameters,highlights the existence of three major hydraulic boundaryconditions.
First, the presence of a leakage effect for several wells,correlated with the existence of a discontinuous aquifer inthe stratiform fissured layer, shows that it is drained perdescensum by leakage into the deep fractures intersectedby the wells. In this type of crystalline rock, this aquifercorresponds to the middle part of the weathering profileformed by a fissured layer in the Nages gneiss, itselfsupplied through leakage from overlying weatheredproducts (saprolite). The relationship between the deepaquifer tapped by the wells and this aquifer is confirmedby the hydrochemistry and, above all, by the numericalmodel, which requires this type of vertical exchange tocorrectly reproduce piezometric trends and the waterchemical composition.
Second, no-flow boundary conditions show that thedeep fractures drain a spatially closed aquifer with a width(north–south) of about 50–200 m (pumping tests, geo-physics) and a length of about 600 m (west–east, from R4at least to B1), which is realistic considering the pumpingtest and modelling data. Well data (discrete water bearingstructures separated by impermeable formations) showthat within this subvertical fractured strip, only a smallpart of the volume (about one percent in volume) isfractured and permeable.
Third, the partial penetration of the wells is confirmedby modelling which requires at least a depth of 600 m foreach reservoir to account for the high inertia of themineral system, most of the pumped water flowingupward from this great depth. This suggests that eachpermeable structure is very deeply rooted with a fissuredzone along main faults. Both of these two faults appear tobe tension joints. Data currently available do not provide abasis for determining whether other joints exist furthernorth or south; in addition, the available geophysics doesnot suggest it. Nevertheless, new drillings are scheduled atthe eastern tip of the southern structure (east of B1) inorder to check its potential eastern continuation.
Another similar structure in the Nages gneiss givesrise to a mineral spring (Font Rouge), 6 km west of theinvestigation site with a similar hydrochemical
composition. It is the only such spring within a radiusof about 50 km around La Salvetat; thus, such permeablestructures are not common and cannot be identified onlyby simple means (lineament analysis, for instance). Suchfractures are mostly revealed by NMW outflow wherethey cross-cut a topographical low. Other similar frac-tures not cross-cutting a topographical low probablyexist, but they are not identifiable at the surface by aNMW spring.
Signal processing on piezometric and geochemical datalogically shows the existence of two types of groundwaterflow: (1) a “fast” recharge corresponding to local flowpath (40–80 days), within the non-mineralized shallowaquifer of the fissured layer, and (2) the increase of theNMW component hydraulic head (80–130 days) itselfresulting in an increase in mineralisation. High waterlevels in the shallow aquifer (related to rainfall or to lakelevel variations) give rise to an increase in the mineralcomponent. The inertia of the system is such that severalsuccessive wet years induce a continuous increase in thismineral component. Modelling also shows that R3 (andparticularly R4) is apparently not directly supplied by thedeep permeable structure, but results from mixing betweenoverflow from mineral water coming from the east (B1,HF4, R1, R2) and ancient waters (without tritium) fromthe shallow fissured aquifer. Additional modelling of thenorthern compartment (R6, R5, HF2) scheduled for thesecond phase of the project will undoubtedly fine-tune thisconceptual model, particularly the possible relationshipsbetween the two systems through the fissured layer, andthe recharge evaluation.
This investigation showed the importance of character-ising initial flow conditions (and geochemistry) before thesystem went into production in order to understand howthese hydrothermal systems function. In fact, theseelements were essential for reliably fitting the hydrody-namic model. Such a characterisation should systemati-cally be performed in detail prior to beginning to pump ina NMW system. The study also illustrates the need forsuitable analytical models for modelling pumping testswhere it is necessary to consider, among other parameters,the anisotropy in hydraulic conductivity of a faulted zone,and the partial penetration of wells within such a faultedaquifer. This could be particularly helpful for bettercharacterisation of the B1 compartment to improve thesystem geometry, and also to better constrain the depth ofthe fracture or, at least, if it is very deep, to assess it. Infact, it is probable that at B1 the far no-flow boundariesappear very late after the start of the pumping because ofsuch a very strong anisotropy of the pumped fracturedzone, and also as a consequence of the very deep root ofthe fractured zone.
Conclusion
A detailed characterisation of a complex NMW system atLa Salvetat (France) was made possible through the use ofa combination of techniques. Two neighbouring fractured
66
Hydrogeology Journal (2014) 22: 47–68 DOI 10.1007/s10040-013-1073-1

zones in the Nages gneiss constitute the main pathwaysfor deep CO2 and NMW to rise to the land’s surface.Geological investigations, pumping test analysis, time-series signal processing, hydrogeochemical and isotopesapproaches, and numerical modelling provided comple-mentary information on the geometry and hydrodynamiccharacteristics of the permeable structure, and on thefunctioning of this mineral system. This applied researchinvestigation demonstrates the need of multidisciplinaryapproaches and modelling (quantity, quality) as a tool forunderstanding complex NMW systems. Only through acombination of evidences, each obtained from onediscipline, which on its own did not lend sufficientinsight, was it possible to build a representative concep-tual model. This model then allowed determining, with anacceptable degree of certainty, the geometry of thepermeable structure at the origin of the mineral system,whereas most classical studies, mainly based only on astructural geology approach, do not generally exhibit thisdegree of reliability and are merely speculative. Themultidisciplinary approach also allowed a more thoroughunderstanding of the hydrodynamic and hydrogeochem-ical functioning of the system from a rather great depth (afew hundred meters) to the surface. This knowledge aboutthe structure and functioning of such a sparkling NMWsystem is of interest as it may provide a conceptual modelthat could be used at other NMW sites. The knowledge ofthe system is also of high interest for the bottling companythat is already applying it for the sustainable managementof the spring, to program additional hydrogeologicalsurveys aimed at increasing the available resource, andto implement protection policies on its watershed. It alsoopens up perspectives for a complete spatialized deter-ministic 3-D modelling of such complex hydrosystems.
Acknowledgements This study was conducted under a researchagreement between Evian Volvic World Sources (Danone WatersFrance) and BRGM. The constructive reviews of the guest editorand three anonymous reviewers were highly appreciated.
References
Battani A, Sarda P, Prinzhofer A (2000) Basin scale natural gassource, migration and trapping traced by noble gases and majorelements: the Pakistan Indus basin. Earth Planet Sci Lett181:229–249. doi:10.1016/s0012-821x(00)00188-6
Black JH (1994) Hydrogeology of fractured rocks: a question ofuncertainty about geometry. Appl Hydrogeol 2:56–70.doi:10.1007/s100400050049
Blavoux B, Dazy J (1990) Characterization of a CO2 province in theSoutheastern basin of France. Hydrogéologie 4:241–252
Blavoux B, Dazy J, Sarrot-Reynauld J (1982).Information about theorigin of thermomineral waters and gaz by means of environ-mental isotopes in eastern Azerbaijan, IRAN, and southeastFrance. J Hydrol 56:23–38
Bullen TD, White AF, Blum AE, Harden JW, Schulz MS (1997)Chemical weathering of a soil chronosequence on granitoidalluvium: II, mineralogic and isotopic constraints on thebehavior of strontium. Geochim Cosmochim Acta 61:291–306. doi:10.1016/S0016-7037(96)00344-4
Clemente WC, Villadolid-Abrigo FL (1993) The Bulalo geothermalfield, Philippines: reservoir characteristics and response toproduction. Geothermics 22:381–394. doi:10.1016/0375-6505(93)90026-J
Collon P, Fabriol R, Vaute L, Pinault JL, Bues M (2002) Modellingchanges in sulphate concentration in discharge water from theabandoned iron mine of Saizerais. SWEMP 2002 - InternationalSymposium on Environmental issues and Waste Management inEnergy and Mineral Production, 7th edn. Cagliari, Italy, October2002
Craig H (1961) Isotopic variations in meteoric waters. Science133:1702–1703. doi:10.1126/science.133.3465.1702
Deines P (1970) Mass spectrometer correction factors for thedetermination of small isotopic composition variations ofcarbon and oxygen. Int J Mass Spectrom Ion Phys 4:283–295
Demange M, Guérangé-Lozes J, Guérangé B (1995) Carte géol.France (1/50 000) feuille Lacaune [Geological map of France(1/50 000): sheet Lacaune] BRGM, Orléans, France
Dewandel B, Lachassagne P, Wyns R, Marechal JC, KrishnamurthyNS (2006) A generalized 3-D geological and hydrogeologicalconceptual model of granite aquifers controlled by single ormultiphase weathering. J Hydrol 330:260–284. doi:10.1016/j.jhydrol.2006.03.026
Dewandel B, Lachassagne P, Zaidi FK, Chandra S (2011) Aconceptual hydrodynamic model of a geological discontinuity inhard rock aquifers: example of a quartz reef in granitic terrain inSouth India. J Hydrol 405:474–487. doi:10.1016/j.jhydrol.2011.05.050
Ehlig-Economides C (1988) Use of the pressure derivative fordiagnosing pressure-transient behavior. J Pet Technol 1280–1282 doi: 10.2118/18594-PA
Gustafson G, Gylling B, Selroos J-O (2009) The Aespoe Task Forceon groundwater flow and transport of solutes: bridging the gapbetween site characterization and performance assessment forradioactive waste disposal in fractured rocks. Hydrogeol J17:1031–1033. doi:10.1007/s10040-008-0419-6
Hantush MS (1960) Aquifer tests on partially penetrating wells. JGeophys Res 65, 2495
Kerrick DM, Caldeira K (1998) Metamorphic CO2 degassing fromorogenic belts. Chem Geol 145:213–232. doi:10.1016/s0009-2541(97)00144-7
Kothyari UC, Singh VP (1999) A multiple-input single-outputmodel for flow forecasting. J Hydrol 220:12–26. doi:10.1016/S0022-1694(99)00055-4
Lachassagne P, Maréchal J, Sanjuan B (2009) Hydrogeologicalmodel of a high-energy geothermal field (Bouillante area,Guadeloupe, French West Indies). Hydrogeol J 17:1589–1606.doi:10.1007/s10040-009-0486-3
Lachassagne P, Wyns R, Dewandel B (2011) The fracturepermeability of hard rock aquifers is due neither to tectonics,nor to unloading, but to weathering processes. Terra Nova 23:145–161 doi:10.1111/j.1365-3121.2011.00998.x
Ladouche B, Aquilina L, Dörfliger N (2009) Chemical and isotopicinvestigation of rainwater in southern France (1996–2002):potential use as input signal for karst functioning investigation.J Hydrol 367:150–160. doi:10.1016/j.jhydrol.2009.01.012
Maloszewski P, Zuber A (1982) Determining the turnover time ofgroundwater systems with the aid of environmental tracers: 1.Models and their applicability. J Hydrol 57:207–231
Mangin A (1984) The use of autocorrelation and spectral analysesto obtain a better understanding of hydrological systems[Pour une meilleure connaissance des systemes hydrologi-ques a partir des analyses corelatoire et spectrale]. J Hydrol67:25–43
Maréchal JC, Dewandel B, Subrahmanyam K (2004) Use of hydraulictests at different scales to characterize fracture networkproperties in the weathered-fractured layer of a hard rockaquifer. Water Resour Res 40 doi: 10.1029/2004wr003137
Maréchal JC, Dewandel B, Ahmed S, Galeazzi L, Zaidi FK (2006)Combined estimation of specific yield and natural recharge in asemi-arid groundwater basin with irrigated agriculture. J Hydrol329:281–293. doi:10.1016/j.jhydrol.2006.02.022
67
Hydrogeology Journal (2014) 22: 47–68 DOI 10.1007/s10040-013-1073-1
Millot R, Négrel P (2007). Multi-isotopic tracing (δ7Li, δ11B, 87Sr/86Sr) and chemical geothermometry: evidence from hydro-geothermal systems in France. Chemical Geology, 244: 664–678
Morosini M, Rhen I (2000) Hydrogeological characterization offractured rock for Sweden’s nuclear waste storage. Proceedingsof the XXX IAH Congress on Groundwater, Cape Town, SouthAfrica, 26 November–1 December 2000, pp 785–789
Nash JE, Sutcliffe JV (1970) River flow forecasting throughconceptual models part I: a discussion of principles. J Hydrol10:282–290. doi:10.1016/0022-1694(70)90255-6
Negrel P, Casanova J, Aranyossy J-F (2001) Strontium isotopesystematics used to decipher the origin of groundwaterssampled from granitoids: the Vienne case (France). Chem Geol177:287–308. doi:10.1016/S0009-2541(00)00414-9
Nind T (1965) Influences of absolute and partial hydrologic barrierson pump test results. Can J Earth Sci 2:309–323. doi:10.1139/e65-025
Petelet Giraud E, Negrel P, Casanova J (2003) Variability of Sr-87/Sr-86 in water draining granite revealed after a doublecorrection for atmospheric and anthropogenic inputs. HydrolSci J 48:729–742
Pin C, Bassin C (1992) Evaluation of a strontium specific extractionchromatographic method for isotopic analysis in geologicalmaterials. Anal Chim Acta 269:249–255. doi:10.1016/0003-2670(92)85409-Y
Pinault J-L, Plagnes V, Aquilina L, Bakalowicz M (2001) Inversemodeling of the hydrological and the hydrochemical behaviorof hydrosystems: characterization of karst system functioning.Water Resour Res 37:2191–2204. doi:10.1029/2001WR900018
Renard P, Glenz D, Mejias M (2009) Understanding diagnosticplots for well-test interpretation. Hydrogeol J 17:589–600.doi:10.1007/s10040-008-0392-0
Routebuddy (2005) http://www.routebuddy.com/routebuddy/route-buddy-manual/useful-links-incl-map-keys/ign-25k-map-key.Accessed November 2013
Shipton ZK, Evans JP, Dockerill B, Heath J, Williams A, KirchenerD, Kolesar PT (2005) Natural leaking CO2-charged systems asanalogs for failed geologic storage reservoirs. In: Benson SM(ed) Carbon dioxide capture for storage in deep geologicalformations. Elsevier, Amsterdam, pp 699–712
Theis CV (1935) The relation between the lowering of the piezometricsurface and the rate and duration of discharge of a well usinggroundwater storage. Trans Am Geophys Union 16: 519–524
68
Hydrogeology Journal (2014) 22: 47–68 DOI 10.1007/s10040-013-1073-1