Study of wet precipitation and its chemical composition in ...
15
Anais da Academia Brasileira de Ciências (2008) 80(2): 381-395 (Annals of the Brazilian Academy of Sciences) ISSN 0001-3765 www.scielo.br/aabc Study of wet precipitation and its chemical composition in South of Brazil ELBA C. TEIXEIRA 1 , DANIELA MIGLIAVACCA 2 , SADI PEREIRA FILHO 1 , ANDRÉA C.M. MACHADO 1 and JULIANA B. DALLAROSA 2 1 Fundação Estadual de Proteção Ambiental, Rua Carlos Chagas, 55/802 – 90030-020 Porto Alegre, RS, Brasil 2 Programa de Pós-Graduação em Ecologia, Universidade Federal do Rio Grande do Sul Av. Bento Gonçalves, 9500, 91540-000 Porto Alegre, RS, Brasil Manuscript received on August 17, 2006; accepted for publication on August 29, 2007; presented by ALCIDES N. SIAL ABSTRACT The purpose of this study is to analyze the chemical composition of wet precipitation in samples collected at three stations in the Candiota region in the Brazilian state of Rio Grande do Sul (RS). Samples were collected in 2004. Variables analyzed in wet precipitation were pH, conductivity, and concentration of Cl − , NO − 3 , SO 2− 4 F − , Na + , Ca 2+ , Mg 2+ ,K + , NH + 4 , Cu, Zn, Fe, Mn, Pb, Ni, Cd, Co, and Cr. SO 2 and NO 2 distribution over the time were also evaluated. Results have showed that pH < 5.6 are found mostly at Candiota airport (85%), followed by Aceguá (72%) and Três Lagoas (65%). Enrichment Factor of the studied ions in wet deposition revealed higher Ca 2+ and SO 2− 4 enrichment in Três Lagoas. Factor Analysis applied to metals and major ions allowed identifying the major sources. While Cl − , Na + , Mg 2+ are of marine origin, SO 2− 4 , NO − 3 , NH + 4 ,F − come from anthropogenic sources. Except for Fe and Mn originating from the soil dust, the metals studied showed to have anthropogenic influence The average SO 2 and NO 2 concentration, as well as SO 2− 4 and NO − 3 in wet precipitation in the Candiota region showed higher concentrations during the warmer months. Key words: wet precipitation, metals, factor analysis. INTRODUCTION The increase in industrialization levels, as well as the growth of urban population, has increased the demand for energy, which in turn caused greater emission of at- mospheric pollutants (SO 2 , NO x , VOCs and aerosols). Compounds like SO 2 and NO x are responsible for acid rain in the environment. It is known that large quantities of pollutants includ- ing SO 2 are emitted from coal burning and other indus- trial activities. Many studies confirm that the amount of sulfur released by the emissions of coal combustion pro- cess is higher than that of other fossil fuels (e.g., Isobe et al. 2005). The acid deposition resulting from such source processes is currently considered as a potential damage; transformation of such chemicals into more sta- Correspondence to: Elba Calesso Teixeira E-mail: [email protected] ble end products, sulfuric acid, while posing a threat to vegetation and aquatic life in ecologically sensitive areas (Park et al. 2000), can also cause human organ damages (Pandey et al. 2005). Precipitation is the most effective scavenging factor for the removal of particulate matter and gaseous pollu- tants dissolved in the atmosphere. Atmospheric precipitation is slightly acid due to the presence in the air of natural occurrences of sulfur, ni- trogen and carbon dioxide. However, an increase in its acidity, as well as alteration in its ionic composition, has been found. The chemical composition of rain, influenced by natural and anthropogenic sources, is the result of the incorporation of pollutants and particles in the air into the raindrops. Although it is difficult to study experi- mentally both emission sources, the determination of the An Acad Bras Cienc (2008) 80 (2)
Transcript of Study of wet precipitation and its chemical composition in ...
Anais da Academia Brasileira de Ciências (2008) 80(2): 381-395(Annals of the Brazilian Academy of Sciences)ISSN 0001-3765www.scielo.br/aabc
Study of wet precipitation and its chemical composition in South of Brazil
ELBA C. TEIXEIRA1, DANIELA MIGLIAVACCA2, SADI PEREIRA FILHO1,ANDRÉA C.M. MACHADO1 and JULIANA B. DALLAROSA2
1Fundação Estadual de Proteção Ambiental, Rua Carlos Chagas, 55/802 – 90030-020 Porto Alegre, RS, Brasil2Programa de Pós-Graduação em Ecologia, Universidade Federal do Rio Grande do Sul
Av. Bento Gonçalves, 9500, 91540-000 Porto Alegre, RS, Brasil
Manuscript received on August 17, 2006; accepted for publication on August 29, 2007;presented by ALCIDES N. SIAL
ABSTRACT
The purpose of this study is to analyze the chemical composition of wet precipitation in samples collected at three
stations in the Candiota region in the Brazilian state of Rio Grande do Sul (RS). Samples were collected in 2004.
Variables analyzed in wet precipitation were pH, conductivity, and concentration of Cl−, NO−3 , SO
2−4 F−, Na+, Ca2+,
Mg2+, K+, NH+4 , Cu, Zn, Fe, Mn, Pb, Ni, Cd, Co, and Cr. SO2 and NO2 distribution over the time were also
evaluated. Results have showed that pH < 5.6 are found mostly at Candiota airport (85%), followed by Aceguá (72%)
and Três Lagoas (65%). Enrichment Factor of the studied ions in wet deposition revealed higher Ca2+ and SO2−4enrichment in Três Lagoas. Factor Analysis applied to metals and major ions allowed identifying the major sources.
While Cl−, Na+, Mg2+ are of marine origin, SO2−4 , NO−3 , NH
+4 , F
− come from anthropogenic sources. Except for FeandMn originating from the soil dust, the metals studied showed to have anthropogenic influence The average SO2 and
NO2 concentration, as well as SO2−4 and NO−
3 in wet precipitation in the Candiota region showed higher concentrations
during the warmer months.
Key words: wet precipitation, metals, factor analysis.
INTRODUCTION
The increase in industrialization levels, as well as the
growth of urban population, has increased the demand
for energy, which in turn caused greater emission of at-
mospheric pollutants (SO2, NOx, VOCs and aerosols).
Compounds like SO2 and NOx are responsible for acid
rain in the environment.
It is known that large quantities of pollutants includ-
ing SO2 are emitted from coal burning and other indus-
trial activities. Many studies confirm that the amount of
sulfur released by the emissions of coal combustion pro-
cess is higher than that of other fossil fuels (e.g., Isobe
et al. 2005). The acid deposition resulting from such
source processes is currently considered as a potential
damage; transformation of such chemicals into more sta-
Correspondence to: Elba Calesso TeixeiraE-mail: [email protected]
ble end products, sulfuric acid, while posing a threat to
vegetation and aquatic life in ecologically sensitive areas
(Park et al. 2000), can also cause human organ damages
(Pandey et al. 2005).
Precipitation is the most effective scavenging factor
for the removal of particulate matter and gaseous pollu-
tants dissolved in the atmosphere.
Atmospheric precipitation is slightly acid due to the
presence in the air of natural occurrences of sulfur, ni-
trogen and carbon dioxide. However, an increase in its
acidity, as well as alteration in its ionic composition, has
been found.
The chemical composition of rain, influenced by
natural and anthropogenic sources, is the result of the
incorporation of pollutants and particles in the air into
the raindrops. Although it is difficult to study experi-
mentally both emission sources, the determination of the
An Acad Bras Cienc (2008) 80 (2)
382 ELBA C. TEIXEIRA et al.
chemical composition of the rain, as well as the meteo-
rological conditions, may help to understand the cause
for its acidification (Sanusi et al. 1996).
Acidification and the ion concentration in the pre-
cipitation depend on the constituents of the pollution
source, on its physical constitution in the hydrologic sys-
tem, on the chemical transformation during the cloud
development, and on the scavenging below the cloud
(Kulshrestha et al. 2003).
The chemical characterization of precipitations con-
tinues to be under considerable investigation due to the
increase in atmospheric inputs of substances and their
effects upon earth, surface water, vegetation, and mate-
rials (Bravo et al. 2000).
The subject of acid precipitation and associated
environmental problems has received special attention in
recent decades and has been submitted to extensive in-
vestigation in several countries (Al-Momani et al. 1995).
Some studies have shown the environmental im-
pact of the burning of fossil fuels, like coal, on atmo-
spheric precipitation (Alastuery et al. 1999 and Flues
et al. 2002). In the Candiota area, Rio Grande do Sul,
Brazil, some research has been done to determine the
existence of acid rain originated from the emissions of
the biggest coal-fired power station located in Rio
Grande do Sul (Migliavacca et al. 2004a, b). These stud-
ies measured bulk precipitation and wet precipitation
at specific sites, and obtained partial data. The present
study complements the study on wet precipitation
at other sites under the influence of the power station
and at the international border between Brazil and
Uruguay, since acid rain possibly brought about by the
coal-fired power station located in the area is reason
of great concern of the governments of both countries.
As a result, the present study aims at identifying phys-
ical and chemical parameters (pH, conductivity, major
ions and trace elements) in samples of wet precipitation
collected in Candiota in order to evaluate the influence
of the main anthropogenic sources in the area. SO2 and
NO2 distribution over the time were also evaluated in
the Candiota region.
STUDY AREA
The Candiota area, situated in the Southwest of the State
of Rio Grande do Sul, Brazil – geographical coordinates
54◦10’58”/ 53◦18’35” West longitude and 31◦17’35”/31◦02’41” South latitude – about 420 km from the Statecapital of Porto Alegre, comprises totally or in part the
counties of Aceguá, Bagé, Candiota, Herval, Hulha Ne-
gra, Pedras Altas and Pinheiro Machado (Fig. 1).
The biggest coal-fired power plant of Rio Grande
do Sul, Usina Termoelétrica PresidenteMédici (UPME),
is located in Candiota. It is operated by Companhia de
Geração Térmica de Energia Elétrica (CGTEE). There
are plans to expand its capacity from 350 to 500 MW.
In terms of climate, the Candiota area is under the
influence of tropical, as well as polar air masses from
the sea. The wind blows predominantly from the NE
quadrant all year round, although west winds are also
present in all directions (Braga et al. 2004).
MATERIALS AND METHODS
SAMPLING SITES
The sampling sites for atmospheric precipitation (Ace-
guá,CandiotaAirport andTrêsLagoas)were chosenwith
the help of 1:50.000 cartographic charts, field job and
GPS (Global Positioning System). The choice of the
sampling sites followed some criteria, according to the
ASTMD 5111 Standards (ASTM 1996a). These criteria
were: i) predominant wind direction; ii) distance from
polluting sources (approximately a radius of 50 km from
UPME); iii) the distance from obstacles that could inter-
fere in sampling (twice the height of obstacles); and iv)
logistics (security, access, electric power supply).
WET PRECIPITATION SAMPLER
The sampler for collecting wet precipitation consisted
of a metallic protection box and a polyethylene collect-
ing flask of 5-liter capacity, coupled to an acrylic funnel
topped by a lid of the same material. The lid opens only
during wet precipitation, closing after the precipitation
has stopped. It runs on electric power or, in case of power
failure, on a 12V battery.
SAMPLING PERIOD
The cleaning of sampling and storing flasks was done
with mil-Q water (type I) (conductivity < 2 µS.cm−1)(ASTM 1996b), rinsing several times (twice to 3 times)
and leaving them stored with this water for at least
24 hours.
An Acad Bras Cienc (2008) 80 (2)

WET PRECIPITATION AND CHEMICAL COMPOSITION IN SOUTH OF BRAZIL 383
Fig. 1 – Map of the Candiota area.
An Acad Bras Cienc (2008) 80 (2)
384 ELBA C. TEIXEIRA et al.
Each sample was divided in the amounts required
by the specific analytical methods to be performed. Un-
filtered samples were used to determine pH, conductiv-
ity and alkalinity. Some sample amounts were filtered
through a 0.22 µm membrane and divided into aliquots.
The first aliquot, preserved in chloroform, was used to
determine anions and cations. The second, preserved
in HNO3 (Merck) superpure at pH < 2.0, to determine
metals. Both aliquots were stored at 4◦C until chemi-cally analyzed.
CHEMICAL ANALYSIS
The unfiltered samples were determined in situ for pH
(Mettler Toledo M 90 potentiometer, precision ± 0.01)
and conductivity (Orion Model 105 Plus, readings range
0-100 µS.cm−1).At the laboratory, the volume of the samples was
determined, as well as the pH and conductivity of un-
filtered aliquots. The pH was determined with a digital
pHmeter (Digimed DM-20, precision ± 0.01), and con-ductivitywith an electric conductivimeter (DigimedDM-
31), showing a 1% precision and range of 0-20µS.cm−1.The major ions were determined through ionic
chromatography (Dionex DX 500 with electric conduc-
tivity detector). The columns used were AS4A-SC
CS12A (Dionex) to analyze anions (Cl−, NO−3 , SO
2−4
and F−) and cations (Na+, Ca 2+, Mg 2+, K+ and NH+4 ),
respectively. A cationic column CS12A with a H2SO421.7 mmol L−1 solution at a flow of 1.5 mL min−1was used to analyze the cations (Na+, Ca2+, Mg2+,K+ and NH+
4 ). The chromatographic conditions and the
optimization of analytical methods are described in the
studies of Barrionuevo et al. (2004).
Detection limits were: 0.061 µg/L for F−;0.051 µg/L for Cl−; 0.28 µg/L for NO−
3 ; SO2−4 ; Na
+;0.26 µg/L for NH+
4 ; 0.35 µg/L for K+; 0.21 µg/L
for Mg2+; 0.17 µg/L for Ca2+.To evaluate the ionic balance, the sum of anions and
cations was done. The calculation showed higher values
for cations (64.1 µeq/L) than for anions (29.5 µeq/L).
The deficit in anions is explained by the exclusion of
some ionic species, likeHCOO−, CH3COO− andHCO−3
that were not analyzed in the present work. The twomain
sources of organic acids in the atmosphere, the oxidized
hydrocarbons emitted by the vegetation and the direct
emission by industrial sources, both originating organic
ions and bicarbonate, could have contributed with sig-
nificant amounts to the wet precipitation samples of the
Candiota area (Mouli et al. 2005).
The analysis of metals Cu, Zn, Fe, Mn, Pb, Ni, Cd,
Co, Crwas done through the PlasmaEmission Spectrom-
etry method, Jobin Yvon, 38 S, coupled to an Ultrasonic
Nebulizator. Certified standard solutions (PURE) were
used.
Detection limits were: 0.5 µg/L for Cu, Ni, Cd, Co,
Cr and 1.0 µg/L for Fe, Mn, Pb, Zn.
SO2 AND NOX
Data were collected by SO2 continuous samplers and an-
alyzers (Horiba), model APSA 360, and NOx continuous
samplers and analyzers, model APNA 360, which are the
property of the Companhia de Geração Térmica de En-
ergia Elétrica – CGTEE. The SO2 continuous samplers
were installed at three sites in Candiota (Candiota Air-
port, Três Lagoas, and Dario Lassance), while the NOxsampler was installed at one site (Candiota Airport). The
data obtained for SO2 and NOx are the average for the
Candiota region.
ENRICHMENT FACTOR
The Enrichment Factor (EF) was calculated according to
the method suggested by several authors, and described
in Keene et al. (1986).
EF = (X/C)precipitation
(X/C)reference material(1)
where X is the concentration of the ion of interest and Cis the concentration of the reference ion. In the present
study, Na was used as the element of reference.
STATISTICAL TREATMENT
In order to make the interpretation of data easier, statis-
tical analysis was applied to the chemical variables. It
also helped to determine the influence of natural and an-
thropogenic sources on the atmospheric precipitation of
the area under study. The software SPSS for WindowsV.9.01 was used with the Factor Analysis technique.
The raw data was used to generate a correlation
matrix (Pearson), which in turn was used to determine a
new set of synthetic variables (common Factors) based
on the interrelations of the original data. These resulting
factors are associated to the characteristic roots > 1.0.
An Acad Bras Cienc (2008) 80 (2)

WET PRECIPITATION AND CHEMICAL COMPOSITION IN SOUTH OF BRAZIL 385
TABLE IChemical composition (average, minimum and maximum) and average concentration pondered by the volume of
ions (µeq L−1) in the wet precipitation at Candiota region in 2004.Station pH Cond H+ K+ Ca2+ Mg2+ Na+ NH+
4 SO2−4 NO−3 Cl− F−
Aceguáaverage 5.63 7.51 3.18 2.42 7.79 5.41 15.2 31.4 11.7 2.15 14.7 3.18
n=23minimum 4.91 2.60 0.26 0.73 2.42 1.03 1.99 1.91 0.25 0.25 0.87 0.003
maximum 6.59 22.4 12.3 5.97 30.3 14.9 61.9 210 33.5 7.37 73.3 24.5
MPV – 3.63 11.4 7.98 21.7 49.7 17.4 4.74 20.2 6.69
Três Lagoasaverage 5.46 8.36 5.95 2.14 8.85 3.05 8.95 27.6 14.1 1.99 5.67 3.70
n=25minimum 4.40 2.70 0.46 0.76 2.21 1.06 2.35 0.63 0.73 0.33 0.66 0.003
maximum 6.34 34.5 39.8 5.82 27.2 5.32 49.8 225 48.4 7.83 22.1 26.8
MPV – 3.88 17.7 6.95 18.5 41.6 38.5 3.81 12.8 16.1
Airportaverage 5.47 8.11 4.23 2.42 9.37 4.39 11.3 40.5 15.9 2.63 9.47 3.98
n=19minimum 4.92 1.80 0.48 0.83 3.01 1.31 2.44 2.27 1.10 0.34 0.67 0.003
maximum 6.32 25.4 12.0 6.34 21.0 8.18 25.4 234 48.5 7.84 24.9 10.9
MPV – 2.98 11.7 5.61 14.4 48.2 20.2 3.31 11.9 5.71
Spearman correlation was applied to the data of
chemical elements using log-normal and normal distri-
bution to measure the correlation between the ordinal
variables. The values of each variable were ordered from
lowest to highest for each selected case.
RESULTS AND DISCUSSION
MAJOR IONS
Table I shows average, minimum and maximum valuesof chemical composition and the average concentrationpondered by the volume of major ions (µeq.L−1) in sam-ples of wet precipitation from the sites of Aceguá, TrêsLagoas and Airport at Candiota, from January, 2004 toNovember, 2004.
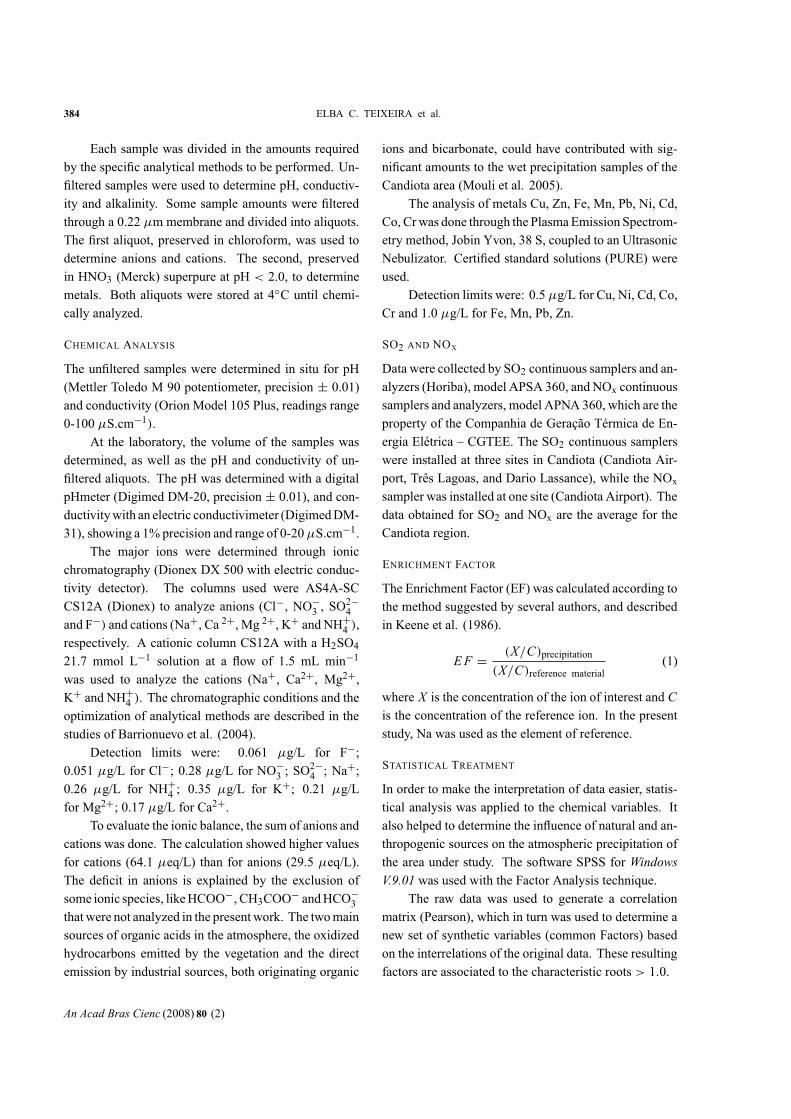
The average pH value of the precipitation sampleswas lower than 5.6 at the three Candiota sites: Aceguá(pH = 5.32), Três Lagoas (pH = 5.46) and Airport (pH =5.44). This indicates a slightly acid pH of the precipita-tion at Candiota area.
The pH data shows that rain with pH values be-low 5.6 occurs in higher percentages at Candiota Air-port (85%), followed by Aceguá (72%) and Três Lagoas(65%).
Figures 2a, 2b, and 2c show the pH frequency forthe three sites studied. Over 70% of events showed pHvalues below that for acid rain (pH<5.6), and about 15%of events were in the range of pH = 4.5-5.5. The pHvalue found at Aceguá is slightly higher than those de-termined in previous studies. However, this value is still
lower than those found by Zunckel et al. (2003) at theborder with Uruguay (Aceguá-Uruguay) between 1999and 2000. The values found at the time were higherthan 5.6.
The average conductivity for the three sites was7.25 (1.80-34.5) µS.cm−1 and the maximum value foreach site was 17.70, 34.5 and 15.60 µS.cm−1, respec-tively, for Aceguá, Três Lagoas and Airport in Candiotaarea.
The average values for conductivity were similar tothose found in other studies done on the same area, notshowing significant variation (Migliavacca et al. 2004a,2005).
The major ions presence (Table I) indicates that thepresence of Cl in Candiota could be due to sea influence.In fact, this element is in higher concentration than thosefound in other studies for the Aceguá area Migliavaccaet al. 2004b, 2005.
As the SO2−4 concentrations are far more significantthan those of NO−
3 (Table I), H2SO4 is probably the com-ponent responsible for the acidity in the precipitations inthe Candiota area.
The higher average percentage of NH+4 presented
at Candiota Airport can be due to the direct influenceof agricultural and cattle raising activities in the region.According toBlume (1992) the highNH+
4 concentrationsfound in rainwater might be related to ammonium gas(NH3) introduced into the atmosphere mainly by cattlefarming by the use of fertilizers (17%) and by industrialactivities.
An Acad Bras Cienc (2008) 80 (2)
386 ELBA C. TEIXEIRA et al.
(a) pH
6,506,256,005,755,505,255,00
Aceguá
Nu
mb
er
of
eve
nts
14
12
10
8
6
4
2
0
(b)
(c) pH
6,256,005,755,505,255,004,754,50
Três Lagoas
Nu
mb
er
of
eve
nts
14
12
10
8
6
4
2
0
Fig. 2a – Histogram of pH values of the wet precipitation – Aceguá site. Fig. 2b – Histogram of pH values of the wet precipitation – Candiota
Airport site. Fig. 2c – Histogram of pH values of the wet precipitation – Três Lagoas site.
TheFactorAnalysis explained 77%of total variance
(Table II). Factor 1 shows significant values for variables
NO−3 , NH
+4 , K
+. As Candiota is an agricultural area,the use of fertilizers and animal excrements may have
contributed to NH+4 increase. The high biogenic activity
may be the cause for the relatively high load of NH+4
and K+ (Migliavacca et al. 2004a, 2005). The presenceof ions NO−
3 e SO2−4 is characteristic of anthropogenic
influence, probably the contribution of the power plants.
Ammonia usually occurs in the atmosphere as
(NH4)2SO4 and NH4NO3, and thus may be related to
SO2−4 and NO−3 , suggesting the influence of agricultural
activity (Seinfeld and Pandis 1998).
Cape and Leith (2002), in their experiments, found
that the quantity of SO2 deposited on the surface of the
wet funnel was related to the quantity of NH3 deposited,
attributing the fact to the oxidation of dissolved SO2 that
reacts with dissolved SO2 producing (NH4)2SO4 salts,
non volatile during water evaporation.
As there are limestone mines in the area, Ca2+, al-though showing load < 5, could be associated to this
Factor.
Although H2SO4 and HNO3 contribute to the acid-
ification of rain water in this area, the presence of Ca2+results in diminished acidity. This element became evi-
dent through the Enrichment Factor.
Through Factor 2, 26% of the total variance of the
raw data is explained. It shows higher loads for Cl−,
An Acad Bras Cienc (2008) 80 (2)

WET PRECIPITATION AND CHEMICAL COMPOSITION IN SOUTH OF BRAZIL 387
TABLE IIMatrix of factorial loads resulting from varimaxrotation, applied to the wet precipitation –
Candiota region (2004).
VariablesFactors
1 2 3
H+ –0.284 0.00782 0.872
F− 0.153 0.120 0.796
Cl− –0.0264 0.949 0.0424
NO−3 0.909 –0.0642 –0.0479
SO2−4 0.641 0.0714 0.650
Na+ –0.0286 0.933 0.0247
NH+4 0.903 –0.0582 –0.0342
K+ 0.882 0.167 0.0465
Mg2+ 0.299 0.882 0.144
Ca2+ 0.535 0.135 0.0462
Extraction (%) 33 26 18
Na+ and Mg+, probably indicating sea salt contributionin the area. This contribution could be explained mainly
by Na+ and Cl−, originating in maritime tropical air andmaritime polar air masses that exert influence on the area
(Lee et al. 2000, Mello 2001, Lara et al. 2001). Other
studies done in Candiota have shown the maritime con-
tribution on this area (Migliavacca et al. 2004a, Braga et
al. 2004). This last author demonstrated the influence of
the sea breeze of SW direction in relation to the emission
source, which is confirmed through the findings of the
present study.
Factor 3 showed a variance of 19% characterized
by the ions SO2−4 H+ and F−. Fluorides emission at thecoal-fired power plant at Candiota were reported in some
studies (Fiedler et al. 1990).
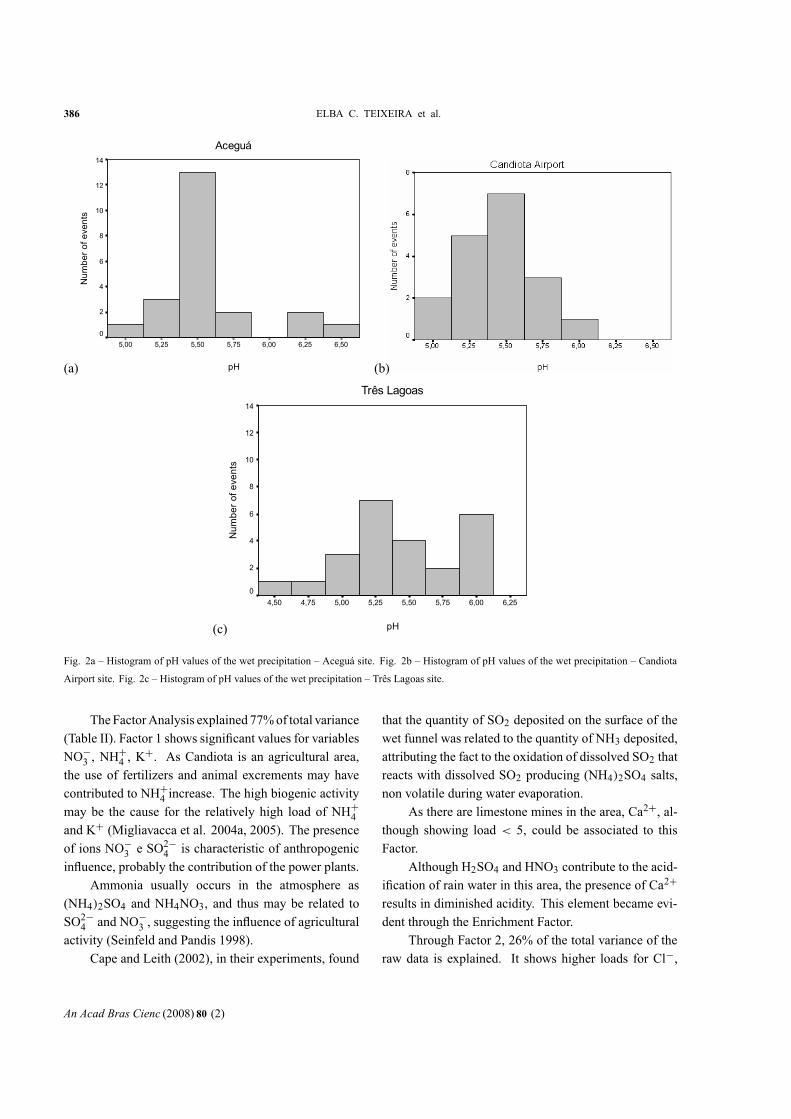
Figure 3a shows the scores distribution at the Três
Lagoas site. The association of H+, F− and SO2−4 in Fac-
tor 3 explains the acid pH values (4.67 and 4.40) occurred
at Três Lagoas site on January 21, 2004 and January 24,
2004, respectively. On these occasions the concentra-
tions of F− e SO2−4 were the highest during all the period
under study.
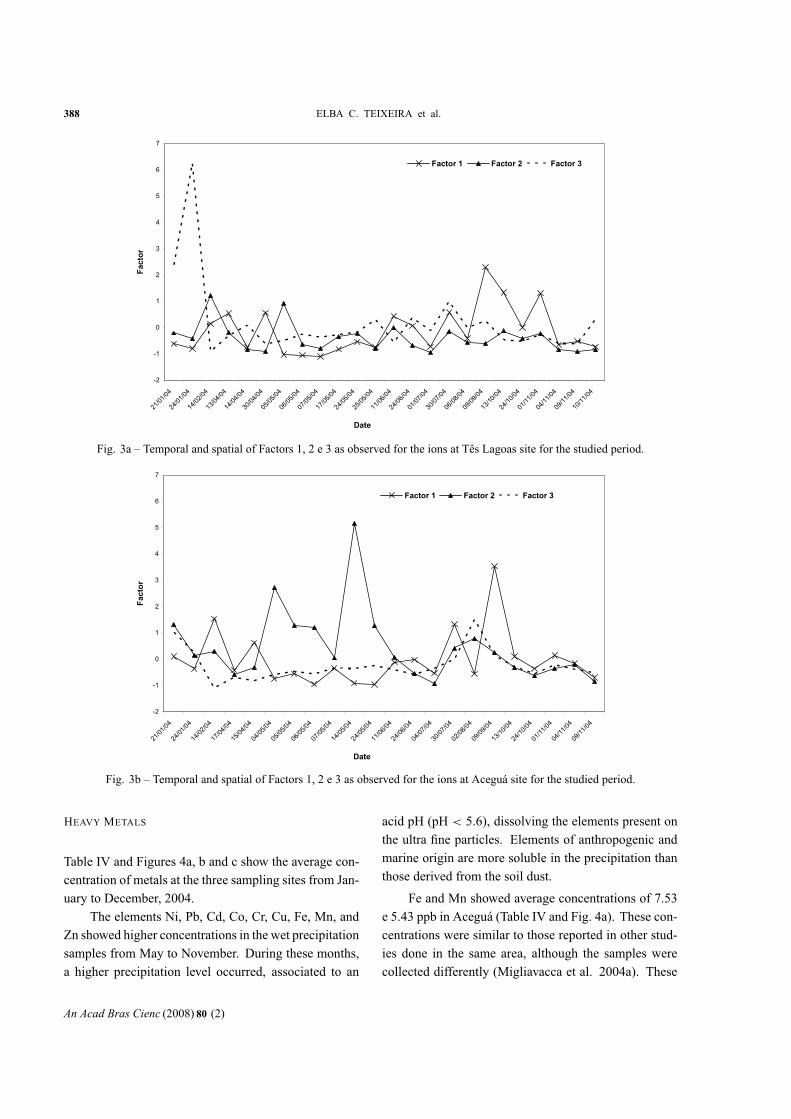
At Aceguá site, there is a higher influence of ions
of maritime origin. It shows higher scores for Factor 2
(Na, Cl andMg). This result is confirmed by the fact that
the highest concentrations for these ions were found at
this site. Similar findings were obtained by Migliavacca
et al. (2005) and Zunckel et al. 2003) in studies at the
same site. As for Factors 1 and 3 (Fig. 3b), no significant
variation was obtained; values in the range of –0,95 a
3,53, can be considered homogeneous.
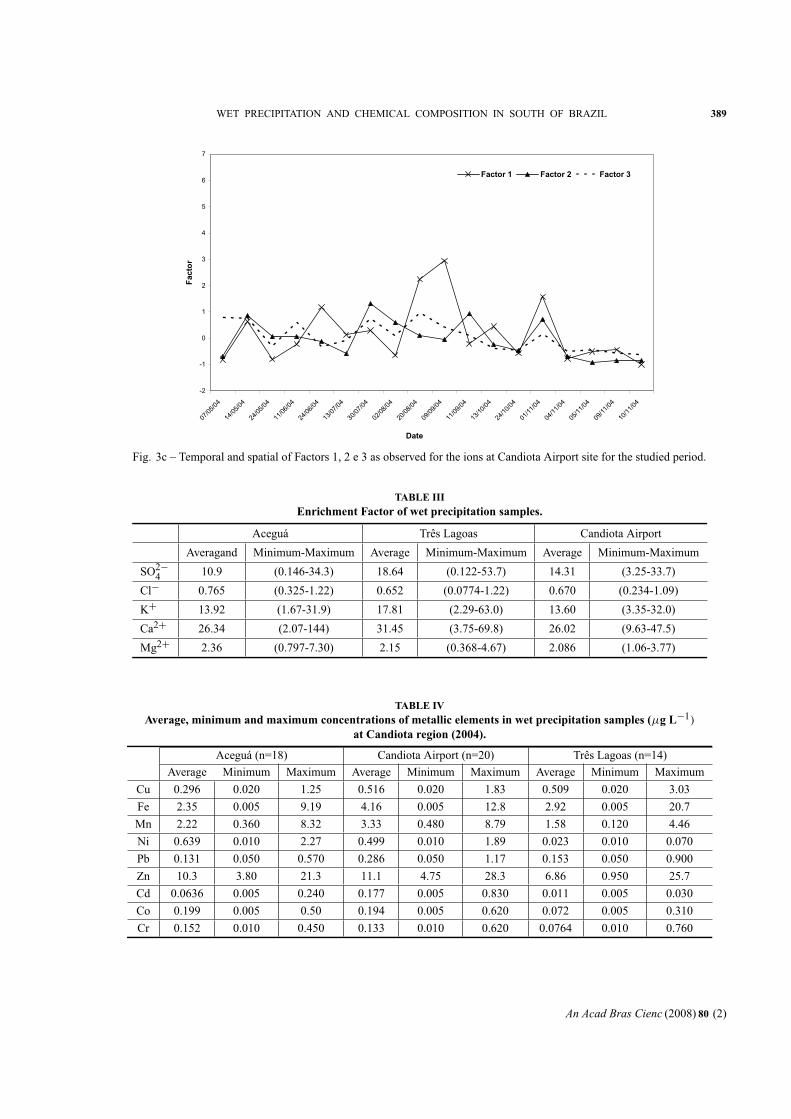
At Candiota Airport site, the scores were more ho-
mogeneous, values varying from–0,976 a2,94, (Fig. 3c).
The highest value found was for Factor 1 (NO3, NH4, K,
Ca,SO4) on September 21, 2004, when an alkaline pH
(6.32) and a high value for NH4 ions (234 µeq/L) were
determined.
ENRICHMENT FACTOR
Table III shows the average, minimum and maximum
values of EF. The highest values of EF were obtained
for Ca2+, SO2−4 and K+ ions at Três Lagoas site. Theexplanation for this may be the fact that the sampling site
is located in the main wind direction (NE-E).
However, Ca2+ showshigh values forEF at the threesites, a strong influence of the limestone mines in the
area. The ion Ca2+ could be neutralizing acidity, whichcould explain the fact that the pH of the atmospheric
precipitation in the area is not as acid as in others. Fur-
thermore, the ion Ca2+ could be an original componentfrom earth or dust (particulate material).
SO2−4 showed EF averages of 9.85; 18.64; 14.31 for
Aceguá, Três Lagoas and Airport, respectively, in sam-
ples of wet precipitation. The coal fired power plant in
the area produces SO2; the major atmospheric oxidation
of SO2 occurs in the drop, either in the cloud or in the
rain, when SO2 dissociates to HSO3. The latter is then
quickly oxidized by H2O2 in the liquid phase, producing
reaction of HO2.
Studies on acid rain done in the area and other areas
further south near coal fired power plants, showed sig-
nificant concentrations of sulfate in deposition samples
(Migliavacca et al. 2004a, Fiedler et al. 1990).
Just as other ions, K+ also showed higher averagevalues for EF at Três Lagoas site (EF: 17.8). At Aceguá
and Airport the average values for EF were practically
the same (EF: 14.0). The source that could explain the
enrichment in K+ is earth particles, quite significant inthe area. Other studies done in the area and in a nearby
State showed significant quantities for K+ (Migliavaccaet al. 2004b, Zunckel et al. 2003).
An Acad Bras Cienc (2008) 80 (2)
388 ELBA C. TEIXEIRA et al.
-2
-1
0
1
2
3
4
5
6
7
21/0
1/04
24/0
1/04
14/0
2/04
13/0
4/04
14/0
4/04
30/0
4/04
05/0
5/04
06/0
5/04
07/0
5/04
17/0
5/04
24/0
5/04
25/0
5/04
11/0
6/04
24/0
6/04
01/0
7/04
30/0
7/04
06/0
8/04
09/0
9/04
13/1
0/04
24/1
0/04
01/1
1/04
04/1
1/04
09/1
1/04
10/1
1/04
Date
Facto
r
Factor 1 Factor 2 Factor 3
Fig. 3a – Temporal and spatial of Factors 1, 2 e 3 as observed for the ions at Tês Lagoas site for the studied period.
-2
-1
0
1
2
3
4
5
6
7
21/0
1/04
24/0
1/04
14/0
2/04
17/0
4/04
15/0
4/04
04/0
5/04
05/0
5/04
06/0
5/04
07/0
5/04
14/0
5/04
24/0
5/04
11/0
6/04
24/0
6/04
04/0
7/04
30/0
7/04
02/0
8/04
09/0
9/04
13/1
0/04
24/1
0/04
01/1
1/04
04/1
1/04
09/1
1/04
Date
Facto
r
Factor 1 Factor 2 Factor 3
Fig. 3b – Temporal and spatial of Factors 1, 2 e 3 as observed for the ions at Aceguá site for the studied period.
HEAVY METALS
Table IV and Figures 4a, b and c show the average con-
centration of metals at the three sampling sites from Jan-
uary to December, 2004.
The elements Ni, Pb, Cd, Co, Cr, Cu, Fe, Mn, and
Zn showed higher concentrations in the wet precipitation
samples from May to November. During these months,
a higher precipitation level occurred, associated to an
acid pH (pH < 5.6), dissolving the elements present on
the ultra fine particles. Elements of anthropogenic and
marine origin are more soluble in the precipitation than
those derived from the soil dust.
Fe and Mn showed average concentrations of 7.53
e 5.43 ppb in Aceguá (Table IV and Fig. 4a). These con-
centrations were similar to those reported in other stud-
ies done in the same area, although the samples were
collected differently (Migliavacca et al. 2004a). These
An Acad Bras Cienc (2008) 80 (2)
WET PRECIPITATION AND CHEMICAL COMPOSITION IN SOUTH OF BRAZIL 389
-2
-1
0
1
2
3
4
5
6
7
07/0
5/04
14/0
5/04
24/0
5/04
11/0
6/04
24/0
6/04
13/0
7/04
30/0
7/04
02/0
8/04
20/0
8/04
09/0
9/04
11/0
9/04
13/1
0/04
24/1
0/04
01/1
1/04
04/1
1/04
05/1
1/04
09/1
1/04
10/1
1/04
Date
Facto
r
Factor 1 Factor 2 Factor 3
Fig. 3c – Temporal and spatial of Factors 1, 2 e 3 as observed for the ions at Candiota Airport site for the studied period.
TABLE IIIEnrichment Factor of wet precipitation samples.
Aceguá Três Lagoas Candiota Airport
Averagand Minimum-Maximum Average Minimum-Maximum Average Minimum-Maximum
SO2−4 10.9 (0.146-34.3) 18.64 (0.122-53.7) 14.31 (3.25-33.7)
Cl− 0.765 (0.325-1.22) 0.652 (0.0774-1.22) 0.670 (0.234-1.09)
K+ 13.92 (1.67-31.9) 17.81 (2.29-63.0) 13.60 (3.35-32.0)
Ca2+ 26.34 (2.07-144) 31.45 (3.75-69.8) 26.02 (9.63-47.5)
Mg2+ 2.36 (0.797-7.30) 2.15 (0.368-4.67) 2.086 (1.06-3.77)
TABLE IVAverage, minimum and maximum concentrations of metallic elements in wet precipitation samples (µg L−1)
at Candiota region (2004).
Aceguá (n=18) Candiota Airport (n=20) Três Lagoas (n=14)
Average Minimum Maximum Average Minimum Maximum Average Minimum Maximum
Cu 0.296 0.020 1.25 0.516 0.020 1.83 0.509 0.020 3.03
Fe 2.35 0.005 9.19 4.16 0.005 12.8 2.92 0.005 20.7
Mn 2.22 0.360 8.32 3.33 0.480 8.79 1.58 0.120 4.46
Ni 0.639 0.010 2.27 0.499 0.010 1.89 0.023 0.010 0.070
Pb 0.131 0.050 0.570 0.286 0.050 1.17 0.153 0.050 0.900
Zn 10.3 3.80 21.3 11.1 4.75 28.3 6.86 0.950 25.7
Cd 0.0636 0.005 0.240 0.177 0.005 0.830 0.011 0.005 0.030
Co 0.199 0.005 0.50 0.194 0.005 0.620 0.072 0.005 0.310
Cr 0.152 0.010 0.450 0.133 0.010 0.620 0.0764 0.010 0.760
An Acad Bras Cienc (2008) 80 (2)

390 ELBA C. TEIXEIRA et al.
5 6 7 8 9 10 112004
Time (months)
0
5
10
15
20
Cd
Co
Cr
Cu
Fe
Mn
Ni
Pb
Zn
Concentration, ppb
Fig. 4a – Concentration of metallic elements varying with time in wet precipitation at Aceguá – Candiota region (2004).
4 5 6 7 8 92004
Time (months)
0
2
4
6
8
10
12
14
16
Cd
Co
Cr
Cu
Fe
Mn
Ni
Pb
Zn
Concentration,ppb
Fig. 4b – Concentration of metallic elements varying with time in wet precipitation at Três Lagoas site – Candiota region (2004).
5 6 7 8 9 10 112004
Time (months)
0
5
10
15
20
Cd
Co
Cr
Cu
Fe
Mn
Ni
Pb
Zn
Concentration. ppb
Fig. 4c – Concentration of metallic elements varying with time in wet precipitation at Candiota Airport site – Candiota region (2004).
An Acad Bras Cienc (2008) 80 (2)
WET PRECIPITATION AND CHEMICAL COMPOSITION IN SOUTH OF BRAZIL 391
elements and others which have a major crustal compo-
nent tend to have a lower solubility, although they show
a variable characteristic in the precipitation (Spokes and
Jickels 1995). However, the anthropogenic metals tend
to show a higher solubility under most of the conditions
(Spokes and Jickels 1995), as it is dependent on the type
of aerosol and on the pH, important variables controlling
solubility.
Zn was the element that showed the highest con-
centration during the period under study (Figs. 4a, b
and c). This data confirm the findings of other stud-
ies in Candiota, which report high concentrations of Zn
(Migliavacca et al. 2004a). This indicates strong emis-
sion of Zn from anthropogenic source (coal fired power
plant).
Elements Cu and Zn, removed through precipita-
tion, and their concentrations may depend on the sam-
pling site, as well on collection weather. On rainy days,
there was higher solubilization of the elements adsorbed
to the fine particles, enhanced also by the acid pH of the
rain (pH < 5.6). At the Aceguá and Três Lagoas sites,
the highest concentration of the anthropogenicmetals oc-
curred during the rainy period in themonth of September.
The Correlation of Spearman was applied to the
whole set of data of the chemical elements, synthesiz-
ing the whole data into three Factors, representing a total
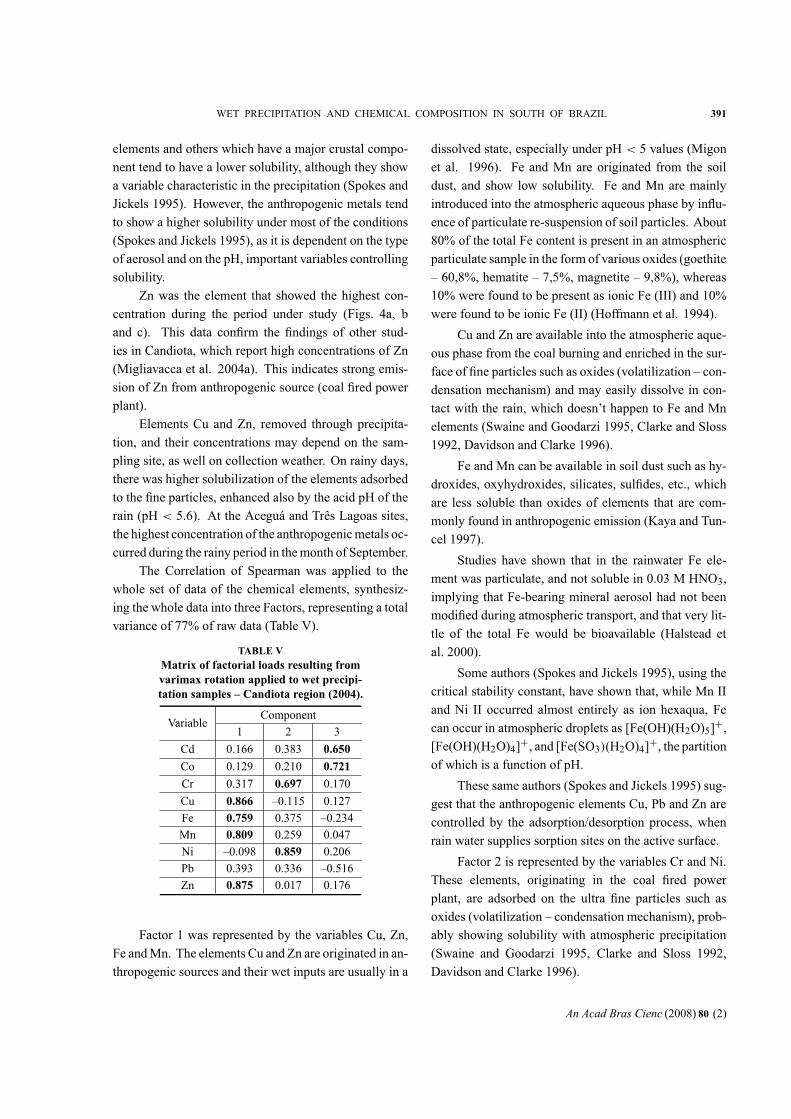
variance of 77% of raw data (Table V).
TABLE VMatrix of factorial loads resulting fromvarimax rotation applied to wet precipi-tation samples – Candiota region (2004).
VariableComponent
1 2 3
Cd 0.166 0.383 0.650
Co 0.129 0.210 0.721
Cr 0.317 0.697 0.170
Cu 0.866 –0.115 0.127
Fe 0.759 0.375 –0.234
Mn 0.809 0.259 0.047
Ni –0.098 0.859 0.206
Pb 0.393 0.336 –0.516
Zn 0.875 0.017 0.176
Factor 1 was represented by the variables Cu, Zn,
Fe andMn. The elements Cu and Zn are originated in an-
thropogenic sources and their wet inputs are usually in a
dissolved state, especially under pH < 5 values (Migon
et al. 1996). Fe and Mn are originated from the soil
dust, and show low solubility. Fe and Mn are mainly
introduced into the atmospheric aqueous phase by influ-
ence of particulate re-suspension of soil particles. About
80% of the total Fe content is present in an atmospheric
particulate sample in the form of various oxides (goethite
– 60,8%, hematite – 7,5%, magnetite – 9,8%), whereas
10% were found to be present as ionic Fe (III) and 10%
were found to be ionic Fe (II) (Hoffmann et al. 1994).
Cu and Zn are available into the atmospheric aque-
ous phase from the coal burning and enriched in the sur-
face of fine particles such as oxides (volatilization – con-
densation mechanism) and may easily dissolve in con-
tact with the rain, which doesn’t happen to Fe and Mn
elements (Swaine and Goodarzi 1995, Clarke and Sloss
1992, Davidson and Clarke 1996).
Fe and Mn can be available in soil dust such as hy-
droxides, oxyhydroxides, silicates, sulfides, etc., which
are less soluble than oxides of elements that are com-
monly found in anthropogenic emission (Kaya and Tun-
cel 1997).
Studies have shown that in the rainwater Fe ele-
ment was particulate, and not soluble in 0.03 M HNO3,
implying that Fe-bearing mineral aerosol had not been
modified during atmospheric transport, and that very lit-
tle of the total Fe would be bioavailable (Halstead et
al. 2000).
Some authors (Spokes and Jickels 1995), using the
critical stability constant, have shown that, while Mn II
and Ni II occurred almost entirely as ion hexaqua, Fe
can occur in atmospheric droplets as [Fe(OH)(H2O)5]+,[Fe(OH)(H2O)4]+, and [Fe(SO3)(H2O)4]+, the partitionof which is a function of pH.
These same authors (Spokes and Jickels 1995) sug-
gest that the anthropogenic elements Cu, Pb and Zn are
controlled by the adsorption/desorption process, when
rain water supplies sorption sites on the active surface.
Factor 2 is represented by the variables Cr and Ni.
These elements, originating in the coal fired power
plant, are adsorbed on the ultra fine particles such as
oxides (volatilization – condensation mechanism), prob-
ably showing solubility with atmospheric precipitation
(Swaine and Goodarzi 1995, Clarke and Sloss 1992,
Davidson and Clarke 1996).
An Acad Bras Cienc (2008) 80 (2)
392 ELBA C. TEIXEIRA et al.
The solubility of anthropogenic elements agrees
with that reported in various studies, in which the ma-
jority classifies Zn as the most soluble. Other elements
like Ni, Cr, Cu and Pb, however, are reported to show
variable solubility, either high or moderate, and authors
refer to a variety of influencing conditions, as pH of the
rain and the type of particle these elements are associated
to in the atmosphere (Al-Momani et al. 1995, Chester et
al. 1993). The solubility of elements is higher in sam-
ples of pH < 5. However, highly soluble elements are
not significantly affected by the pH, because they usually
may be soluble in water.
The pH value of the cloud and of the rain drop can
be extremely low. In the cloud occurs the oxidation of
SO2 and NOx, which can be catalyzed by the transition
metals. Falconer and Falconer (1980) reported pHvalues
of rain water below 2.2, and suggest that wet aerosols can
show values of up to 0.1 (Zhu et al. 1993). That means
that the ultimate pH of the precipitation (between 4 and
6) may not reflect the pH conditions to which the aerosol
is subjected in the atmosphere.
Factor 3 is represented by variables Cd and Co.
These are elements of anthropogenic origin (burning of
coal), and are controlled by the adsorption/desorption
process dependent on pH.
SO2 AND NO2
The area under study is highly influenced by the burning
of coal that throws particulate matter in the atmosphere
as well as great quantities of acidity generating gases,
SO2 and NOx, which contribute to the development of
acid rain. These acidity developing gases are dissolved
in the clouds, generating sulfuric and nitric acid.
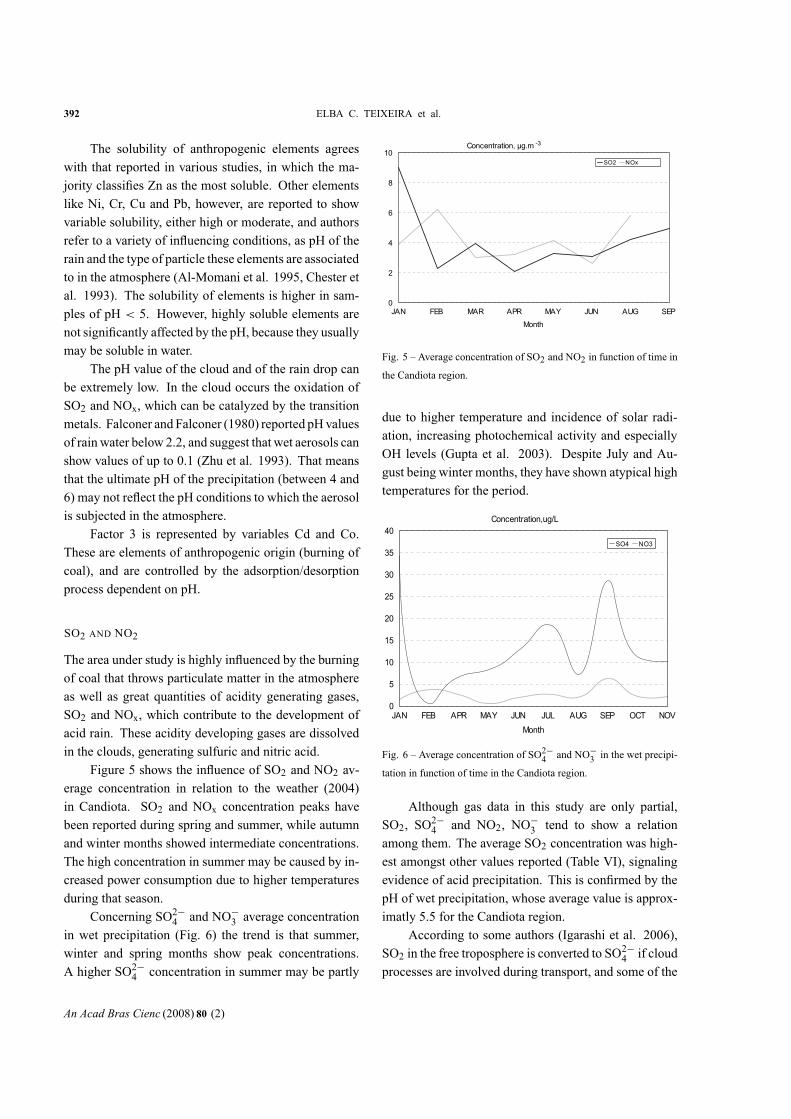
Figure 5 shows the influence of SO2 and NO2 av-
erage concentration in relation to the weather (2004)
in Candiota. SO2 and NOx concentration peaks have
been reported during spring and summer, while autumn
and winter months showed intermediate concentrations.
The high concentration in summer may be caused by in-
creased power consumption due to higher temperatures
during that season.
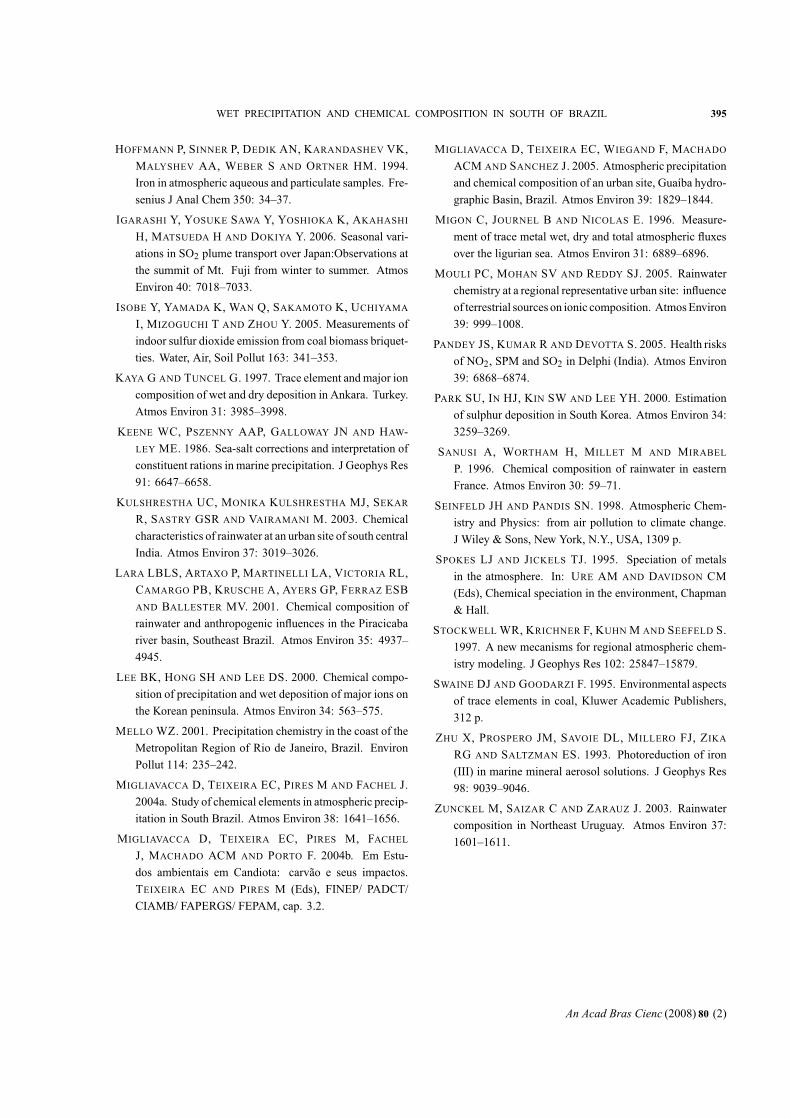
Concerning SO2−4 and NO−3 average concentration
in wet precipitation (Fig. 6) the trend is that summer,
winter and spring months show peak concentrations.
A higher SO2−4 concentration in summer may be partly
JAN FEB MAR APR MAY JUN AUG SEP
Month
0
2
4
6
8
10SO2 NOx
Concentration, µg.m -3
Fig. 5 – Average concentration of SO2 and NO2 in function of time in
the Candiota region.
due to higher temperature and incidence of solar radi-
ation, increasing photochemical activity and especially
OH levels (Gupta et al. 2003). Despite July and Au-
gust being winter months, they have shown atypical high
temperatures for the period.
JAN FEB APR MAY JUN JUL AUG SEP OCT NOV
Month
0
5
10
15
20
25
30
35
40
SO4 NO3
Concentration,ug/L
Fig. 6 – Average concentration of SO2−4 and NO−3 in the wet precipi-
tation in function of time in the Candiota region.
Although gas data in this study are only partial,
SO2, SO2−4 and NO2, NO
−3 tend to show a relation
among them. The average SO2 concentration was high-
est amongst other values reported (Table VI), signaling
evidence of acid precipitation. This is confirmed by the
pH of wet precipitation, whose average value is approx-
imatly 5.5 for the Candiota region.
According to some authors (Igarashi et al. 2006),
SO2 in the free troposphere is converted to SO2−4 if cloud
processes are involved during transport, and some of the
An Acad Bras Cienc (2008) 80 (2)

WET PRECIPITATION AND CHEMICAL COMPOSITION IN SOUTH OF BRAZIL 393
TABLE VIComparison of average concentration of gaseous SO2. NO2 (µg/m
3).
Site SO2 NO2 Reference
Candiota 8.91 4.33 Present study
Nguyen; Kim 3.7 7.3 Gupta et al. 2003
Turkey (coastal ) 2.03 – Erduran and Tuncel 2001
sulfate is likely to be removed from the polluted air by
precipitation.
SO2 may react with hydroxyl radical in the atmo-
sphere to produce SO−3 , which in turn reacts with water
vapor to produce sulfuric acid. SO2 may react with hy-
droxyl radical in the atmosphere to produce SO−3 , which
in turn reacts with water vapor to produce sulfuric acid.
The oxides of nitrogen, NOx mainly emitted in the
atmosphere as NO, which is subsequently transformed
into NO2 and other nitrogenous species are very impor-
tant constituents of air pollution. During daytime the
most important source of nitric acid is the reaction ofNO2with hydroxyl radical. During the night NO3 free radical
is the source of tropospheric HNO3. NO3 is relatively
unimportant during daylight as it is destroyed through its
rapid photolysis in sunlight and by its rapid reaction with
NO (Stockwell et al. 1997).
Table VI shows SO2 and NO2data compared with
other studies. The data showing a higher SO2 concen-
tration reveals the influence of the coal power station.
CONCLUSIONS
Results showed that over 70% of events had pH values
below 5.6 (below the limit for acid rain), and about 15%
of them presented pH between 4.5 and 5.0. Thus, it is
not unreasonable to say that the pH of the atmospheric
precipitation around the area of Candiota is acidified.
The major ions, through the statistical analysis,
showed that NO−3 (Factor1), F
− and H+ (Factor 3), andSO2−4 in both Factors (Factors 1 and 3) characterized
the anthropogenic influence, probably originating in
the coal fired power plant. Ca2+ (Factor 1) is originated,probably, in the limestone mines. Besides, this ion as
NH+4 and K, respectively, might depend on the use of
fertilizer or of soil neutralizers (frequently CaCO3), on
the soil composition itself, through re-suspension, or on
the deposition of the coal plant fly ash. Cl−, Na+ and
Mg2+ are due to marine influence.The highest EF in the wet precipitation being rep-
resented by Ca2+, confirms the strong influence of thelimestone mines, earth and dust (particulate matter) on
the area.
The wet precipitation tends to easily remove Ni,
Pb, Cd, Co, Cr, Cr, Cu and Zn of anthropogenic ori-
gin than Fe and Mn elements originated from soil dust.
Metals of anthropogenic origin, especially Zn, showed
high concentration levels which are controlled by the ad-
sorption/desorption processes and pH. Metals soil dust
are mainly associated to minerals and its precipitation
removal is essentially pH controlled.
Candiota area shows problems with acid precipita-
tion and the contribution of ions sulfate and metals in
the precipitation. This tendency will probably get worse
with the implantation of the Candiota III power plant.
More ions will be emitted and metals will be adsorbed
to ultra fine particulate matter that escapes the control
equipment.
The average SO2 and NO2 concentration, as well as
SO2−4 and NO−3 in wet precipitation in the Candiota re-
gion showed higher concentrations during the warmer
months. Nevertheless, gases should be studied for a
longer period to better assess distribution of SO2 and
NO2 over the time in relation to ions (SO2−4 and NO−
3 )
in wet precipitation.
ACKNOWLEDGMENTS
We thank Conselho Nacional de Desenvolvimento Cien-
tífico e Tecnológico (CNPq) and Fundação de Amparo à
Pesquisa do Estado do Rio Grande do Sul (FAPERGS)
for the financial support. We also thank the Sampling
Service of Fundação Estadual de Proteção Ambiental
(FEPAM) and Companhia de Geração Térmica de Ener-
gia Elétrica (CGTEE) for their contribution to the study.
An Acad Bras Cienc (2008) 80 (2)

394 ELBA C. TEIXEIRA et al.
RESUMO
O objetivo deste estudo é analisar a composição química da
precipitação úmida em amostras coletadas em três estações na
região deCandiota no Estado doRioGrande do Sul (RS)Brasil.
Amostras foram coletadas em 2004. Variáveis analisadas na
precipitação úmida foram pH, condutividade e concentração
de Cl−, NO−3 , SO
2−4 F−, Na+, Ca2+, Mg2+, K+, NH+
4 , Cu,
Zn, Fe, Mn, Pb, Ni, Cd, Co e Cr. Distribuição no tempo de SO2e NO2 também foi avaliada. Resultados mostraram que pH <
5,6 são encontrados em sua maioria no aeroporto de Candiota
(85%), seguidos pelo Aceguá (72%) e Três Lagoas (65%). Fa-
tor de Enriquecimento dos íons estudados na deposição úmida
revelou maior enriquecimento de Ca2+ e SO24 em Três Lagoas.Análise Fatorial aplicada aos metais e íons maiores permitiu
identificação de fontes maiores. Enquanto Cl−, Na+, Mg2+são de origem marinha, SO2−4 , NO−
3 , NH+4 , F
− são prove-
nientes de fontes antropogênicas. Exceto Fe e Mn originários
de poeira do solo, os metais estudados mostraram ter influência
antropogênica. A média da concentração de SO2 e NO2, bem
como SO2−4 e NO−3 na precipitação úmida na região de Can-
diota mostrou maiores concentrações durante os meses mais
quentes.
Palavras-chave: precipitação úmida, metais, análise fatorial.
REFERENCES
ALASTUERY A, QUEROL X, AURA CHAVES CR, CARRA-
TALA A AND LOPEZ-SOLER A. 1999. Bulk deposition in
rural area located around a large coal-fired power station,
Northeast Spain. Environ Pollut 106: 359–367.
AL-MOMANI IF, ATAMAN OY, ANWARI AM, TUNCEL S,
KÖSE C AND TUNCEL G. 1995. Chemical composition
of precipitation near an industrial area at Izmir, Turkey.
Atmos Environ 29: 1131–1143.
ASTM. 1996a. Standard guide for choosing locations and
sampling methods to monitor atmospheric deposition at
non-urban locations: D 5111, West Conshohocken, PA.
ASTM. 1996b. Standard guide for preparation of material
used for the collection and preservation of atmospheric
wet deposition: D 5012. West Conshohocken, PA 11:
387–391.
BARRIONUEVO S, NASCIMENTO RSH, MACHADO ACM
AND PIRES M. 2004. Caracterização química da precipi-
tação atmosférica por cromatografia iônica. In: TEIXEIRA
EC AND PIRES M (Eds), Estudos ambientais em Can-
diota: carvão e seus impactos. 1a ed., FINEP/PADCT/
CIAMB/FAPERGS/FEPAM, Porto Alegre, RS, Brasil,
p. 193–200.
BLUME HP. 1992. Handbuch des Bodenschutzes. Ecomed,
Munchen, p. 247–248.
BRAGA CF, TEIXEIRA EC, YONEMA ML AND DIAS JF.
2004. Study of the elemental composition of aerosols in
the Candiota region of Brazil using the PIXE technique.
Nuclear Instruments and Methods in Physics Res B 225:
561–571.
BRAVO HA, SAAVEDRA MIR, SÁNCHEZ PA, TORRES RJ
AND GRANADA LMM. 2000. Chemical composition of
precipitation in a Mexican Maya region. Atmos Environ
34: 1197–1204.
CAPE JN AND LEITH ID. 2002. The contribution of dry de-
posited ammonia and sulphur dioxide to the composition
of precipitation from continuously open gauges. Atmos
Environ 36: 5983–5992.
CHESTER R, MURPHY KJ, LIN FJ, BERRY AS, BRAD-
SHOW GF AND CORCORAN PA. 1993. Factors control-
ling the solubilities of trace elements from non-marine
aerosols deposited to the sea surface by the dry deposition
mode. Mar Chem 42: 107–126.
CLARKE LB AND SLOSS LL. 1992. Trace elements-emis-
sions from coal combustion and gasification, IEACR/49.
IEA Coal Research, London, 111 p.
DAVIDSON RM AND CLARKE LB. 1996. Trace elements in
coal. Kluwer Academic Publishers, 59 p.
ERDURAN MS AND TUNCEL SG. 2001. Gaseous and par-
ticulate air pollutants in the Northeastern Mediterranean
Coast. Sci Total Enviro 281: 205–215.
FALCONER RE AND FALCONER PDJ. 1980. Determination
of cloud water acidity at a mountain observatory in the
Adirondack Mountains of New York State. J Geophys
Res 85: 7465–7470.
FIEDLER HD, MARTINS AF AND SOLARI J. 1990. Meio
ambiente e complexos carboeletriocs: oCadodeCandiota,
Ciência Hoje 12 (68): 38–45.
FLUES M, HAMMA P, LEMES MJL, DANTAS ESK AND
FORNARO A. 2002. Evaluation of the rainwater acidity
of a rural region due to a coal-fired power plant in Brazil.
Atmos Environ 36: 2397–2404.
GUPTA A, KUMAR R, KUMARI KM AND SRIVASTAVA SS.
2003. Measurements of NO2, HNO3, NH3 and SO2 and
related particles matter at a rural site in Rampur, India.
Atmos Environ 37: 4837–4846.
HALSTEAD MJR, CUNNINGHAME RG AND HUNTER KA.
2000. Wet deposition of trace metals to a remote site in
Fiordland, New Zealand. Atmos Environ 34: 665–676.
An Acad Bras Cienc (2008) 80 (2)
WET PRECIPITATION AND CHEMICAL COMPOSITION IN SOUTH OF BRAZIL 395
HOFFMANN P, SINNER P, DEDIK AN, KARANDASHEV VK,
MALYSHEV AA, WEBER S AND ORTNER HM. 1994.
Iron in atmospheric aqueous and particulate samples. Fre-
senius J Anal Chem 350: 34–37.
IGARASHI Y, YOSUKE SAWA Y, YOSHIOKA K, AKAHASHI
H, MATSUEDA H AND DOKIYA Y. 2006. Seasonal vari-
ations in SO2 plume transport over Japan:Observations at
the summit of Mt. Fuji from winter to summer. Atmos
Environ 40: 7018–7033.
ISOBE Y, YAMADA K, WAN Q, SAKAMOTO K, UCHIYAMA
I, MIZOGUCHI T AND ZHOU Y. 2005. Measurements of
indoor sulfur dioxide emission from coal biomass briquet-
ties. Water, Air, Soil Pollut 163: 341–353.
KAYA G AND TUNCEL G. 1997. Trace element andmajor ion
composition of wet and dry deposition in Ankara. Turkey.
Atmos Environ 31: 3985–3998.
KEENE WC, PSZENNY AAP, GALLOWAY JN AND HAW-
LEY ME. 1986. Sea-salt corrections and interpretation of
constituent rations in marine precipitation. J Geophys Res
91: 6647–6658.
KULSHRESTHA UC, MONIKA KULSHRESTHA MJ, SEKAR
R, SASTRY GSR AND VAIRAMANI M. 2003. Chemical
characteristics of rainwater at an urban site of south central
India. Atmos Environ 37: 3019–3026.
LARA LBLS, ARTAXO P, MARTINELLI LA, VICTORIA RL,
CAMARGO PB, KRUSCHE A, AYERS GP, FERRAZ ESB
AND BALLESTER MV. 2001. Chemical composition of
rainwater and anthropogenic influences in the Piracicaba
river basin, Southeast Brazil. Atmos Environ 35: 4937–
4945.
LEE BK, HONG SH AND LEE DS. 2000. Chemical compo-
sition of precipitation and wet deposition of major ions on
the Korean peninsula. Atmos Environ 34: 563–575.
MELLO WZ. 2001. Precipitation chemistry in the coast of the
Metropolitan Region of Rio de Janeiro, Brazil. Environ
Pollut 114: 235–242.
MIGLIAVACCA D, TEIXEIRA EC, PIRES M AND FACHEL J.
2004a. Study of chemical elements in atmospheric precip-
itation in South Brazil. Atmos Environ 38: 1641–1656.
MIGLIAVACCA D, TEIXEIRA EC, PIRES M, FACHEL
J, MACHADO ACM AND PORTO F. 2004b. Em Estu-
dos ambientais em Candiota: carvão e seus impactos.
TEIXEIRA EC AND PIRES M (Eds), FINEP/ PADCT/
CIAMB/ FAPERGS/ FEPAM, cap. 3.2.
MIGLIAVACCA D, TEIXEIRA EC, WIEGAND F, MACHADO
ACM AND SANCHEZ J. 2005. Atmospheric precipitation
and chemical composition of an urban site, Guaíba hydro-
graphic Basin, Brazil. Atmos Environ 39: 1829–1844.
MIGON C, JOURNEL B AND NICOLAS E. 1996. Measure-
ment of trace metal wet, dry and total atmospheric fluxes
over the ligurian sea. Atmos Environ 31: 6889–6896.
MOULI PC, MOHAN SV AND REDDY SJ. 2005. Rainwater
chemistry at a regional representative urban site: influence
of terrestrial sources on ionic composition. AtmosEnviron
39: 999–1008.
PANDEY JS, KUMAR R AND DEVOTTA S. 2005. Health risks
of NO2, SPM and SO2 in Delphi (India). Atmos Environ
39: 6868–6874.
PARK SU, IN HJ, KIN SW AND LEE YH. 2000. Estimation
of sulphur deposition in South Korea. Atmos Environ 34:
3259–3269.
SANUSI A, WORTHAM H, MILLET M AND MIRABEL
P. 1996. Chemical composition of rainwater in eastern
France. Atmos Environ 30: 59–71.
SEINFELD JH AND PANDIS SN. 1998. Atmospheric Chem-
istry and Physics: from air pollution to climate change.
J Wiley & Sons, New York, N.Y., USA, 1309 p.
SPOKES LJ AND JICKELS TJ. 1995. Speciation of metals
in the atmosphere. In: URE AM AND DAVIDSON CM
(Eds), Chemical speciation in the environment, Chapman
& Hall.
STOCKWELL WR, KRICHNER F, KUHN M AND SEEFELD S.
1997. A new mecanisms for regional atmospheric chem-
istry modeling. J Geophys Res 102: 25847–15879.
SWAINE DJ AND GOODARZI F. 1995. Environmental aspects
of trace elements in coal, Kluwer Academic Publishers,
312 p.
ZHU X, PROSPERO JM, SAVOIE DL, MILLERO FJ, ZIKA
RG AND SALTZMAN ES. 1993. Photoreduction of iron
(III) in marine mineral aerosol solutions. J Geophys Res
98: 9039–9046.
ZUNCKEL M, SAIZAR C AND ZARAUZ J. 2003. Rainwater
composition in Northeast Uruguay. Atmos Environ 37:
1601–1611.
An Acad Bras Cienc (2008) 80 (2)