THE INTERNATIONALIZATION OF CHINESE RMB
43
FUNDAÇÃO GETULIO VARGAS ESCOLA DE ECONOMIA DE SÃO PAULO WEI SU THE INTERNATIONALIZATION OF CHINESE RMB São Paulo 2017
Transcript of THE INTERNATIONALIZATION OF CHINESE RMB

FUNDAÇÃO GETULIO VARGAS ESCOLA DE ECONOMIA DE SÃO PAULO
WEI SU
THE INTERNATIONALIZATION OF CHINESE RMB
São Paulo 2017

WEI SU
THE INTERNATIONALIZATION OF CHINESE RMB
São Paulo 2017
Dissertação apresentada à Escola de Economia de São Paulo, da Fundação Getúlio Vargas, como parte dos requisitos para a obtenção do título de Mestre em Economia. Área de concentração: Macroeconomia ORIENTADOR: Nelson Marconi

SU, Wei. The Internationalization of Chinese RMB / Wei SU. - 2017. 42 f. Orientador: Nelson Marconi Dissertação (mestrado) - Escola de Economia de São Paulo. 1. Relações econômicas internacionais. 2. Macroeconomia. 3. Política monetária - China. I. Marconi, Nelson. II. Dissertação (mestrado) - Escola de Economia de São Paulo. III. Título.
CDU 339.9.012(510)

WEI SU
THE INTERNATIONALIZATION OF CHINESE RMB
intern
São Paulo 2017
Dissertação apresentada à Escola de Economia de São Paulo, da Fundação Getúlio Vargas, como parte dos requisitos para a obtenção do título de Mestre em Economia. Área de concentração: Macroeconomia Data de aprovação: / / Banca Examinadora: Prof. Dr. Nelson Marconi (Orientador) EESP – FGV Prof. Dr. Paulo Sérgio de Oliveira Simões Gala EESP – FGV Prof. Dr. Luiz Fernando de Paula UERJ

Resumo
Com a ascensão da China nos últimos 30 anos, sua moeda RMB está ganhando mais presença no comércio internacional. O governo chinês tem vindo a enviar sinais positivos para a internacionalização da sua moeda na década recente, mas ainda permanece uma questão que como ele iria executar o processo. Esta dissertação centra-se em discutir como um governo deve internacionalizar sua moeda, se é no seu interesse e o que isso implica para o governo chinês. Primeiro olhamos para a situação atual da internacionalização de RMB. Em seguida, analisamos a teoria da moeda de Frankel (2014) e três fatores importantes para a internacionalização da moeda: o tamanho da economia, a profundidade e a abertura do mercado financeiro e a confiança no valor da moeda. Em seguida, coletamos dados para examinar esta teoria. Em seguida, analisamos o efeito positivo e o efeito negativo da internacionalização da moeda e como a China desenvolveu políticas coordenadas em diferentes períodos. Nesta dissertação, a teoria de Frankel (2014) foi provada em uma abordagem diferente. Selecionamos diferentes variáveis e período para retificar o teste. Concluímos que a internacionalização de sua moeda é importante, mas não priorizada para a China. Palavras-chave: RMB, Internationalização, China, Governo.

Abstract
With the rise of China for the last 30 years, its currency RMB is gaining more presence in the international trading. The Chinese government has been sending positive signals for internationalizing its currency in the recent decade but it still remains a question how it would execute the process. This dissertation focuses on discussing how a government should internationalize its currency, if it is in its interest and what it implies for Chinese government. We first look into the current situation for RMB internationalization. Then we look into Frankel (2014)’s currency theory and three important factors for the currency internationalization: the size of economy, the depth and openness of a country’s financial market, and the confidence in the value of the currency. Then we collect data to exam this theory. We then analyze the positive effect and negative effect of currency internationalization and how China developed coordinate policies in different periods In this dissertation, Frankel (2014) `s theory was proved in a different approach. We selected different variables and period to redid the test. We concluded that the internationalization of its currency is important but not prioritized for China. Keywords: RMB, Internationalization, China, Government.

List of Graphs
Graph 1 18 Graph 2 19 Graph 3 19 Graph 4 20 Graph 5 21 Graph 6 22 Graph 7 31 Graph 8 32 Graph 9 34 Graph 10 34 Graph 11 36 Graph 12 36 Graph 13 39

List of Tables
Table 1 20 Table 2 22 Table 3 23 Table 4 24 Table 5 25 Table 6 28 Table 7 29

Summary
1. Introduction 9 2. The Current Situation of RMB Internationalization 11
2.1 Infiltration the international finance system 11 2.2 Chinese Investment Overseas 12
3. Briefing of Previous Studies on RMB Internationalization 13 4. Theoretical Background 17
4.1 Briefing of Global Currency 17 4.2 The Factors for Currency Internationalization 18
4.2.1 Fundamental determinants 18 4.2.2 A country’s financial market 20 4.2.3 Confidence in the value of the currency 24 4.2.4 Network Externalities 24
5. Modeling 25 5.1 Comparison of Frankel (2014) ‘s test 25 5.2 Selection of Data for test 27 5.3 First Regression 27 5.4 Second Regression 28
6. Initiatives to Internationalize its currency 31 7. China`s road to internationalize its currency 34 8. Conclusion and the outlook for the Chinese Government 40 9. References 41

9
1. Introduction
As the largest manufacturing economy in the world already, the internationalization of its currency seems like a natural next step for China. In order to acquire the status of a global currency, the basic character is the large amount of exchange amount in the international market. Based on the "Triennial Central Bank Survey - Global foreign exchange market turnover in 2016" by Bank for International Settlements, RMB is still a very small proportion of it, only 202 billion US dollar every day, counted as 4 percent of the total 5.088 trillion US dollar foreign exchange turn-over. But the future looks promising, starting from October 2016, RMB is to be included in the basket of currencies which make up the IMF’s Special Drawing Right, or SDR. The new SDR would be set as 41.73% for the U.S. dollar; 30.93% for the euro; 10.92% for the Chinese RMB; 8.33% for the Japanese yen, and 8.09% for the British pound. But where is this going? Is there any possibility that RMB become the major international transaction currency? There are two questions to be asked, first, if the Chinese Government has the intention to do so, and second, how to get there. For the first question, all the signs showed by the Chinese, from academic papers to the tone of Chinese officials, seem to be sending positive signals. Starting from 2015, People’s Bank of China (the central Bank of China) starts to release annual report of the Internationalization of RMB. The report of 2016 confirmed determination of the internationalization of RMB, but it also emphasizes the importance of a steady exchange rate, the safety of domestic finance market and real economy, and the control of finance market. The article referred to Germany and Japan as examples, stating that during the internationalization process of German Mark, it took strict control of capital flow to stabilize the exchange rate and monetary policy, while Japan has opened its capital market too soon and underestimated the effect of appreciation of Yen on economy and harmed the real economy. So it seems that China is going to follow Germany’s path – opening its capital cautiously while maintaining the exchange rate. The advantage of acquiring the international status for RMB seems obvious – to avoid the exchange rate risk in international trade. China is the biggest exporter in the world, so whenever there is some fluctuation in the exchange rate, the export would be severely affected. To have the right to settle price in international trade obviously is in Chinese Government’s interest. So now we get the determination from the government and the people, how can China get there? A strong economy seems like an obvious answer, also a more open economy would help accelerate the process. But it is not that simple, even though China has the urge to prove itself as an international player, they would not disregard the side effect of the internationalizing process. The main oppose force comes from the manufacturing sector. Made in China is still a thing, and it absorbs a large part of its labor force. China has almost 1.4 billion of population and 1 billion working force. Once the RMB gets appreciated, its Made in China goods would lose its biggest advantage as low prices, as a consequence, the

10
manufacturing would be harmed. To shift this huge amount of labor force would be great difficulty for the government. So as the Chinese government, it should balance these two opposite forces. The objective of this dissertation is to understand Chinese government`s behavior in this process.

11
2. The current situation of RMB internationalization So far, China’s RMB has become the main currency (around 31%) for payments between China (including Hong Kong) and the rest of Asia-Pacific region, more than tripling in use over the past three years and outstripping Japanese Yen, US dollar and Hong Kong Dollar, according to data from Swift. Singapore, Taiwan and South Korea are already using RMB as the main payment with China. Chinese Government has rigorously tried to improve the usage of RMB internationally, by infiltrating the international finance system and increase Chinese investment overseas. 2.1 Infiltrating the international finance system 2.1.1 Setting up clearing bank overseas Besides from Hong Kong, there are 14 countries and regions having set up RMB offshore clearing bank, they are (by the order of date setting up) Macau, Taiwan, Singapore, UK, Germany, South Korea, France, Luxembourg, Qatar, Canada, Australia, Thailand, Malaysia, Chile; Hong Kong, undoubtedly, is developed as an offshore RMB exchange center and the interbank borrowing rate among Hong Kong banks are developed as RMB HIBOR (USD LIBOR equivalent). 2.1.2 Signing RMB Bilateral Swap Agreement China has entered into more than 30 bilateral currency swap agreements since December 2008. As of May 15, 2015, the total value of effective currency swap agreements was RMB 2.9 trillion (US$ 468 billion). In 2014, an equivalent of RMB 1.13 trillion (US$ 182 billion) of swaps were conducted under these swap agreements. [1] 2.1.3 Cross-Border Inter-Bank Payments System Shorted for CIPS. It is the China Interbank Payment system. On 8th October 2015, CIPS (Phase I) went live. On 25th March 2016, CIPS signed an Moue with SWIFT with mutual understanding of deploying SWIFT as a secure, efficient and reliable communication channel for CIPS’s connection with SWIFT’s members.[2] 2.1.4 Foundation of AIIB and NDB In January 16th 2014, Asian Infrastructure Investment Bank (AIIB) was launched in Beijing, aiming to support the building of infrastructure in the Asia-Pacific Region. The capital of the bank is $100 billion, equivalent to 2⁄3 of the capital of the Asian Development Bank and about half that of the World Bank. The bank is treated the regional rival of Asian Development Bank, led by Japan. [3] The New Development Bank (NDB), formerly referred to as the BRICS Development Bank, is a multilateral development bank established by the BRICS states (Brazil,

12
Russia, India, China and South Africa). It is widely seen as the Chinese World Bank equivalent. 2.1.5 Inclusion in IMF’s Special Drawing Right Basket RMB is to be included in the basket of currencies which make up the IMF’s Special Drawing Right, or SDR. The new SDR would be set as 41.73% for the U.S. dollar; 30.93% for the euro; 10.92% for the Chinese RMB; 8.33% for the Japanese yen, and 8.09% for the British pound. According to IMF, RMB met the two criteria for inclusion in the basket: that the issuing country is among the largest exporters in the world and that its currency is “freely usable.” (widely used to make payments for international transactions and widely traded in the principal exchange markets). [4] 2.2 Chinese Investment overseas Since 1999, Chinese government initiated the Go Out Policy, which encourage companies to invest abroad. China will become one of the world’s biggest cross-border investors by the end of this decade, with global offshore assets tripling from $6.4tn now to nearly $20tn by 2020. Europe’s energy, automotive, food and real estate sectors attracted the most Chinese money. [5] In 2013, China’s President announced the One Belt One Road strategy, that focuses on connectivity and cooperation among countries primarily between the People's Republic of China and the rest of Eurasia, which consists of two main components, the land-based "Silk Road Economic Belt" (SREB) and oceangoing "Maritime Silk Road" (MSR). The strategy underlines China's push to take a bigger role in global affairs, and its need to export China's production capacity in areas of overproduction such as steel manufacturing.
13
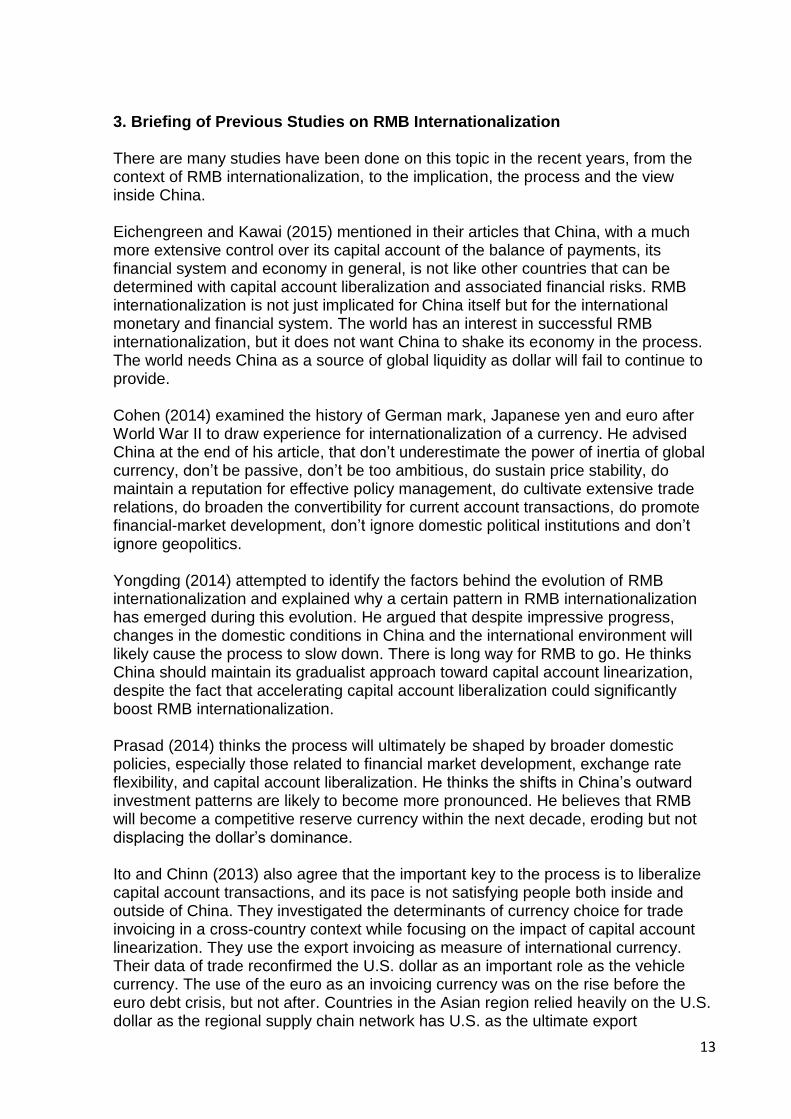
3. Briefing of Previous Studies on RMB Internationalization There are many studies have been done on this topic in the recent years, from the context of RMB internationalization, to the implication, the process and the view inside China. Eichengreen and Kawai (2015) mentioned in their articles that China, with a much more extensive control over its capital account of the balance of payments, its financial system and economy in general, is not like other countries that can be determined with capital account liberalization and associated financial risks. RMB internationalization is not just implicated for China itself but for the international monetary and financial system. The world has an interest in successful RMB internationalization, but it does not want China to shake its economy in the process. The world needs China as a source of global liquidity as dollar will fail to continue to provide. Cohen (2014) examined the history of German mark, Japanese yen and euro after World War II to draw experience for internationalization of a currency. He advised China at the end of his article, that don’t underestimate the power of inertia of global currency, don’t be passive, don’t be too ambitious, do sustain price stability, do maintain a reputation for effective policy management, do cultivate extensive trade relations, do broaden the convertibility for current account transactions, do promote financial-market development, don’t ignore domestic political institutions and don’t ignore geopolitics. Yongding (2014) attempted to identify the factors behind the evolution of RMB internationalization and explained why a certain pattern in RMB internationalization has emerged during this evolution. He argued that despite impressive progress, changes in the domestic conditions in China and the international environment will likely cause the process to slow down. There is long way for RMB to go. He thinks China should maintain its gradualist approach toward capital account linearization, despite the fact that accelerating capital account liberalization could significantly boost RMB internationalization. Prasad (2014) thinks the process will ultimately be shaped by broader domestic policies, especially those related to financial market development, exchange rate flexibility, and capital account liberalization. He thinks the shifts in China’s outward investment patterns are likely to become more pronounced. He believes that RMB will become a competitive reserve currency within the next decade, eroding but not displacing the dollar’s dominance. Ito and Chinn (2013) also agree that the important key to the process is to liberalize capital account transactions, and its pace is not satisfying people both inside and outside of China. They investigated the determinants of currency choice for trade invoicing in a cross-country context while focusing on the impact of capital account linearization. They use the export invoicing as measure of international currency. Their data of trade reconfirmed the U.S. dollar as an important role as the vehicle currency. The use of the euro as an invoicing currency was on the rise before the euro debt crisis, but not after. Countries in the Asian region relied heavily on the U.S. dollar as the regional supply chain network has U.S. as the ultimate export

14
destination. Such Asian dollar bloc stands a large challenge to RMB’s regional expansion. RMB, despite the rapid increase, is still far behind the Japanese yen and the euro as an invoicing currency. Their data proved that countries with more developed and larger financial markets tend to invoice less in the U.S. dollar. And countries with more open capital accounts tend to invoice in either euro or their home currency. In this way, they proved the importance of financial development and openness. Kawai and Pontines (2014) used Frankel-Wei regression equation and showed RMB has become more flexible together with other east Asian currencies, reflecting the underlying trend toward more open financial markets. But the changes of RMB are still marginal, which shows a limited degree of liberalization. They discovered that the role of the RMB in the exchange rate policies of East Asian emerging economies has become increasingly important as the China’s economy, trade volumes and economic influence on their economies have grown. Cheung (2014) discussed the role of offshore financial centers in the process of RMB internationalization. He argued that an active offshore markets such as Eurodollar markets are essential for a currency to realize its role in the international money system. China illustrates both potentials and limitations of the policy-driven approach to promoting the extraterritorial use of RMB in the evolution of the offshore RMB markets, led by Hong Kong. He anticipated that the offshore RMB market will grow at a healthy pace in the foreseeable future, a pace that is directed and dictated by China’s authorities. China will assume an active role in designing the offshore market development and be very sensitive to any adverse influences on its under-developed finance sector. The role of offshore markets is complementary in the sense that it helps RMB achieve its potential as a global currency, but offshore market conditions or requirements will not be allowed to force changes in domestic policies. Rhee and Sumulong (2014) argued that establishment of regional settlement currencies can contribute positively to the reform of the international financial architecture. In particular, extending the local currency trade settlement schemes such as the RMB trade settlement scheme between China and Hong Kong to the rest of Asian and combining it with government securities payment and settlement scheme, can be a practical solution. Building proper settlement infrastructure should be the first step. Cruz, Gao and Song (2014) explored China’s Finance Markets and inspected its conditions for RMB internationalization. They concluded that China’s financial depth is similar to those of other economies such as Japan, the Republic of Korea, Brazil and the Russian Federation when they were at similar level of economic development as China is now. But China’s financial markets are not as deep and liquid as were Germany’s, Japan’s, the Republic of Korea’s when they started to internationalize their currencies; they are shallow and much less liquid than the financial markets with international currencies, like Germany and Japan’s markets. In particular, capital market development lags far behind the international-currency economies, contemporaneously and historically. China’s financial market only has the banking system, without the development of bond market. The financial system is not transparent enough for foreign investors and state-owned banks and state-owned enterprises dominate the financial sector. As to internationalize its currency, China’s

15
government need to further deregulate the financial sector while guarantee the financial stability. China needs the market liquidity. They also advocated the market-determined interest rates. They observed that Chinese authorities have recently adopted market force as the decisive role in determine financial prices, such as interest rates, exchange rates and bond yields. They were positive about the new round of economic reforms. Huang, Wang and Fan Gang (2014) characterized China’s strategy as two-track approach: the first track aims at increasing the international use of the currency, starting with regional use for trade and investment settlement and establishment of the offshore currency market in Hong Kong; the second track tackles the capital account convertibility issue, allowing greater cross-border capital mobility, encouraging holding of RMB asset by non-residents, and providing instruments for hedging currency risks. Most of China’s authorities’ recent policy actions are related to the first track. They did a regression of country’s share in global GDP, country’s share in global trade, total market capitalization, inflation differential vis-à-vis the OECD average, exchange rate volatility, currency appreciation and capital account liberalization index, market capitalization relative to GDP, economic freedom index as independent variables on Currency Composition of Official Foreign Exchange Reserves with the period 1999 to 2011. They used the result to prove that the main obstacles for the RMB to become an international reserve currency are policy restrictions and institutional barriers. They also agreed upon the three important factors for currency internationalization: 1. Share of global GDP and trade; 2. Openness and depth of financial market; 3. Credibility of economic and legal systems. They advocated China to continue pushing the currency’s use in international transactions, add RMB to IMF’s SDR basket (this already happened in 2016) and introduce a new mechanism for intraregional cross-holding of reserve currencies in Asia. Zhang and Tao (2014) investigated the impact of currency internationalization on Financial Development, they discussed the benefits and costs of internationalizing RMB. By comparison, they thought the pros of internationalization overweighed the cons. It is important China maintain strong and sustainable growth and a competitive trade sector in the coming decades. It is vital to accelerate domestic financial reforms, though this should be done in a cautious manner. China also should reform its exchange rate and strengthen global and regional financial cooperation. So among the researches that have been done upon RMB internationalization, there are some most focused points: Chinese Government should internationalize its currency and the world also need it to provide liquidity; financial markets liberation is the centre piece in this process, and Chinese government should treat it with caution. It has been make an effort to approach this issue in this paper. Among the works from the researchers who participate in the study, it was chosen the paper of Frankel (2014) as our start point. This paper summarizes the basic characters of global currency, along with some quantitative work. We will illustrate his theory, try to empirically prove it and also develop our own model with more theory inputs. It is necessary to emphasize here that the choice of Frankel (2014)’s paper was made not because of the uniqueness of his work, but the representativeness of his

16
work. The theory he presented in his paper could be found or tested in the other papers, including the ones we cited above.

17
4. Theoretical Background
4.1 Briefing of Global Currency
The first currency with the global currency character could arguably be the Spanish dollar. In the 17th and 18th century, due to the political supremacy of Spain and its important commercial routes across the Atlantic and the Pacific. It has the international sense, especially in its oversea territories. During the most of the 19th century, weights of gold represented the denomination of international trade. Due to the range of usage, some argue that gold was the first global currency. Then British Pound Sterling came to prominence due to the expansion of British empire in the 19th Century. Historians estimate that, at the end of 19th century, around two third of the world trade was invoiced in sterling. The share of pounds in known foreign exchange holdings of official institutions was in the same proportions. The French franc and German mark, as runner-ups, did not even amount to the half of it. By 1917, the dollar emerged from the fourth place to a major international currency. Even prior to this year, the U.S. economy had surpassed the UK one for about 40 years. The U.S.s was lacking a developed financial system. For example, it did not even establish a central bank until 1913. With the development of its financial market, the international role of the dollar also followed up. World War I accelerated the transformation. Until World War II, British Sterling still made its comeback from time to time, but after this period, dollar fully supplant the pound. Later on, the dollar became the standard for Bretton Woods system and remained dominant until today. The Deutsche mark gained much confidence at the latter part of 20th century. Years of steady and strong monetary policies helped mark’s currency share teach almost one fifth in 1989 by the foreign exchange reserve measure. In 1999, Euro, inherited the status from mark, came to existence and became the second most used currency globally until today. It now has share the global currency status with the U.S. dollar, and actually, as of December 2016, it surpassed the dollar in the combined value of cash in circulation. And as the World Trade Organization reported, in 2016, 60% of the worlds energy, food and services trade were made in the US dollar and the rest were made by euro. Japanese Yen enjoyed a peak in the 1980s and reached its all-time high in exchange reserves as 9% in 1991. This has to do with its outward exportation economy after World War II. As a summary, the current composition of global currencies could be roughly treated as USD, EUR, JPY and GBP, they all make up the basket of currencies of the IMF’s Special Drawing Right we mentioned above. The new member in this basket is RMB but as we can see from the data from last 20 years, USD, EUR, JPY and GBP are indeed the strong currencies with global currency value. But RMB is far from prominence as its peers.

18
Graph 1: The Usage of some major currencies in percentage Source: “Triennial Central Bank Survey of foreign exchange and OTC derivatives markets”, 2016, Bank for International Settlement.
4.2 The Factors for Currency Internationalization
Frankel (2014) illustrates four factors to be considered for a currency to be suited to International status:
- Fundamental determinants. - A country’s financial markets. - Confidence in the value of the currency. - Network Externalities
We will exam these factors focusing on four major currencies: US Dollar, Eurozone Euro, UK Sterling, Japan Yen, and Chinese RMB.
4.2.1 Fundamental determinants.
For fundamental determinants, we have list of factors like the size of the country in terms of population and territory, the scale of economies and the participation in trade. United States, Eurozone, Japan and UK are all scoring high in these factors. We choose to see some of them.
3.5 4.5 4.2 4.3 5.3 4.67.1 6.0 6.0 6.8 6.3 5.2
0.0 0.0 0.1 0.5 0.9 2.2
37.9 37.4 37.039.1
33.4
11.013.0
16.5 14.912.9 11.8
21.723.5
20.817.2
19.023.1
86.889.9
88.085.6 84.9
87.0
0.0
10.0
20.0
30.0
40.0
50.0
60.0
70.0
80.0
90.0
100.0
1998 2001 2004 2007 2010 2013
The usage of some major currencies in percentage
CAD CHF CNY EUR GBP JPY USD

19
Graph 2: GDP of some major economies Source: GPD, the World Bank, 2016
In terms of GDP, China no doubt is catching up within the years; it already out performed Japan and UK in the 21st century.
Graph 3: Participation of Trade in GDP in percentage for each region Source: The World Bank, 2016
9.09
10.62
12.27
14.4814.96
16.66
7.156.59
10.15
12.88 12.6413.18
3.91 4.164.66 4.36
5.504.91
1.54 1.542.30
2.972.40 2.71
1.03 1.331.94
3.52
6.04
9.49
0
2
4
6
8
10
12
14
16
18
1998 2001 2004 2007 2010 2013
Trill
ion
s
GDP
USA Euro Zone Japan UK China
22.8 22.8 24.328.0 28.2 30.2
61.4
69.1 68.1
77.2 76.2
83.2
19.7 20.324.5
33.829.2
35.2
51.354.5
51.6 54.0
59.9 62.0
31.6
38.3
59.462.3
49.4 47.1
0.0
10.0
20.0
30.0
40.0
50.0
60.0
70.0
80.0
90.0
1998 2001 2004 2007 2010 2013
Participation of Trade in GDP in Percentage for each region
USA Euro Zone Japan UK China

20
Graph 4: Trade Volume for some major economies Source: Trade, the World Bank, 2016
All these countries including China have a high performance in trade, especially Eurozone. The size of the country potentially decides how far its economy could go:
Population Territory
USA 324 million (2017 est.) 9,833,520 sq. km
Eurozone 340 million (2017 est.) 2,677,841 sq. km
China 1376 million (2015) 9,596,961 sq. km
Japan 127 million (2015) 377,972 sq. km
UK 65 million (2016 est.) 242,495 sq. km Table 1: Population and territory size of some major economies Source: The United Nations, 2015
It is truly tremendous what Japan and UK have achieved, considered their population and territory comparing with other three. It is understandable that it would be really hard for these two countries’ economies to reach the size of the other three. China has a large population and similar territory size to USA. So in the long run, if Chinese workers’ productivity could catch up with its peers in USA and Eurozone, we should expect an economy size of China as large as USA.
4.2.2 A country’s financial market To attain the status of a global currency, the finance market of the home country not only need to be open and free of controls, but also deep and well-developed.
2.072.42
2.98
4.05 4.22
5.034.39 4.56
6.91
9.94 9.63
10.96
0.77 0.84 1.141.47 1.61 1.73
0.79 0.841.19
1.60 1.44 1.68
0.32 0.511.15
2.19
2.98
4.47
0
2
4
6
8
10
12
1998 2001 2004 2007 2010 2013
Trill
ion
sTrade Volume
USA Euro Zone Japan Britain China
21
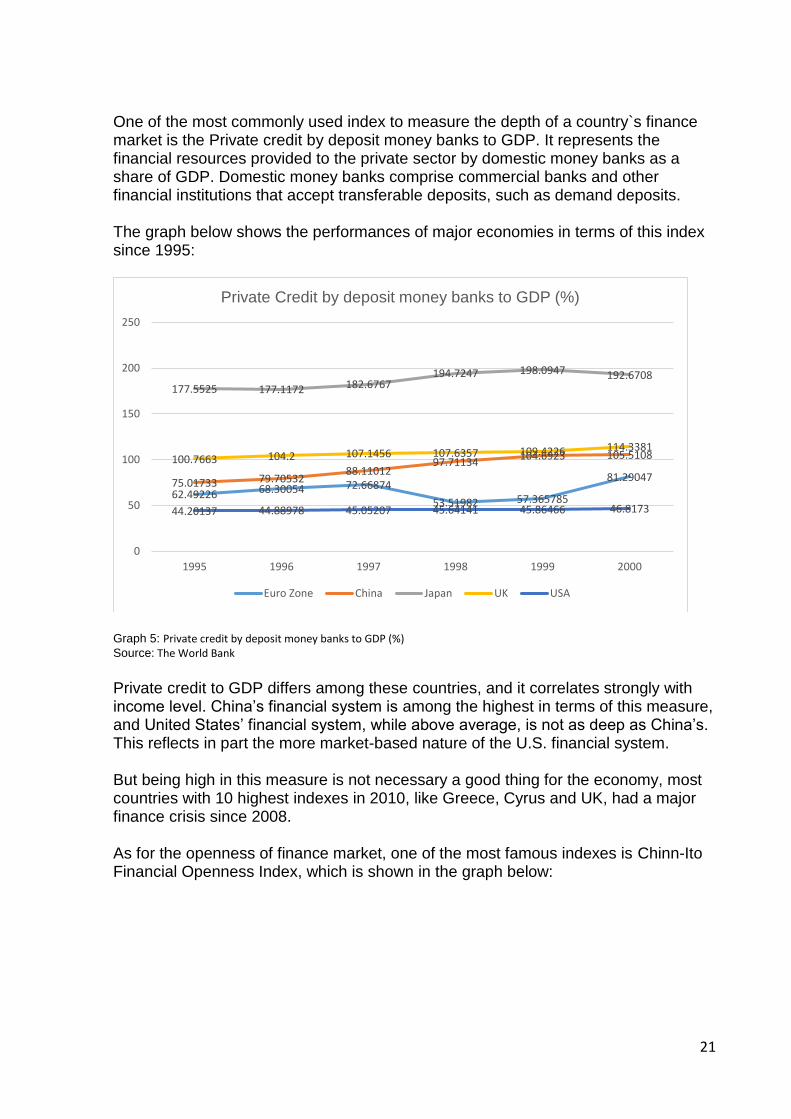
One of the most commonly used index to measure the depth of a country`s finance market is the Private credit by deposit money banks to GDP. It represents the financial resources provided to the private sector by domestic money banks as a share of GDP. Domestic money banks comprise commercial banks and other financial institutions that accept transferable deposits, such as demand deposits. The graph below shows the performances of major economies in terms of this index since 1995:
Graph 5: Private credit by deposit money banks to GDP (%) Source: The World Bank
Private credit to GDP differs among these countries, and it correlates strongly with income level. China’s financial system is among the highest in terms of this measure, and United States’ financial system, while above average, is not as deep as China’s. This reflects in part the more market-based nature of the U.S. financial system. But being high in this measure is not necessary a good thing for the economy, most countries with 10 highest indexes in 2010, like Greece, Cyrus and UK, had a major finance crisis since 2008. As for the openness of finance market, one of the most famous indexes is Chinn-Ito Financial Openness Index, which is shown in the graph below:
62.49226 68.30054 72.66874
53.51982 57.365785
81.2904775.01733 79.7053288.11012
97.71134104.6923 105.5108
177.5525 177.1172 182.6767194.7247 198.0947 192.6708
100.7663 104.2 107.1456 107.6357 109.4226 114.3381
44.20137 44.88978 45.05207 45.64141 45.86466 46.8173
0
50
100
150
200
250
1995 1996 1997 1998 1999 2000
Private Credit by deposit money banks to GDP (%)
Euro Zone China Japan UK USA

22
Graph 6: Chinn-Ito Financial Openness Index Source: A New Measure of Financial Openness, Chinn & Ito (2007)
The Chinn-Ito index (KAOPEN) is an index measuring a country’s degree of capital account openness. The index was initially introduced in Chinn and Ito (Journal of Development Economics, 2006). KAOPEN is based on the binary dummy variables that codify the tabulation of restrictions on cross-border financial transactions reported in the IMF’s Annual Report on Exchange Arrangements and Exchange Restrictions (AREAER). Currently, the index is updated to 2014. The index ranges from 0 to 1, 0 as the most controlled capital account and 1 as the most open capital account. China remains very in this index for the last 20 years comparing to the other major economies. Most of the developed countries have very open financial market. Another way to look into the openness and development of finance markets is if there is a major financial center serving the region. When a region has a more sophisticated finance market, it most likely would form a well-developed finance center. In recent years, we have two most relevant indexes to measure the financial centers:
a. Global Financial Centers Index
RANK CHANGE CENTRE RATING
1 0 London 795
2 0 New York City 794
3 0 Singapore 752
4 0 Hong Kong 748
5 0 Tokyo 734
6 +2 San Francisco 720
0
0.1
0.2
0.3
0.4
0.5
0.6
0.7
0.8
0.9
1
1995 1996 1997 1998 1999 2000 2001 2002 2003 2004 2005 2006 2007 2008 2009 2010 2011 2012 2013
Chinn-Ito Financial Openness Index
China Germany France UK Japan USA
0.939
0.165

23
7 +2 Boston 719
8 +3 Chicago 718
9 +3 Zurich 716
10 +3 Washington, D.C. 713 Table 2: Global Financial Centers Index Source: GFCI 19 The Overall Rankings, September 2016
It is compiled and published twice a year by Z/Yen Group and sponsored by the Qatar Financial Centre Authority. It is widely quoted as a source for ranking financial centers.
b. International Financial Centers Development Index
Rank Change Centre Rating
1 Steady United States New York City 87.72
2 Steady United Kingdom London 86.64
3 Increase 1 Japan Tokyo 84.57
4 Increase 1 Singapore Singapore 77.23
5 Decrease 2 Hong Kong Hong Kong 77.1
5 Steady China Shanghai 77.1
7 Steady France Paris 64.83
8 Steady Germany Frankfurt 60.27
9 Increase 2 China Beijing 59.98
10 Decrease 1 United States Chicago 58.22
Table 3: International Financial Centers Development Index Source: "Xinhua-Dow Jones International Financial Centers Development Index - 2014"
This index is compiled annually by the Xinhua News Agency of China with the Chicago Mercantile Exchange and Dow Jones & Company of the United States, and is known as the Xinhua-Dow Jones International Financial Centers Development Index. Regardless of the difference of methodology, we can roughly draw the conclusion here that, New York, London, Hong Kong, Singapore and Tokyo are the top financial centers which represents the financial development of USA, UK, Hong Kong, Singapore and Japan. For Eurozone, it has two cities -- Frankfurt and Paris as its financial centers. They are not as developed as the five financial centers above, but with the openness of Europe Union market, many Eurozone finance companies and institutes have their presence in London, which in one hand, helps push London’s status as finance center and in the other hand, represents the development of finance market in Eurozone. Due to the independent financial system of Hong Kong, it could not whole represent the financial development of Chinese domestic financial market development. In the recent years, Chinese government intentionally develops Hong Kong as RMB`s offshore center, so if USD has London, RMB has Hong Kong.

24
Shanghai, as a financial center on the rise, has many domestic financial policies to incentivize its development as financial center. For example, China (Shanghai) Pilot Free Trade Zone was founded in 2013 as the test zone for a series of policy reforms including China finance reforms. So as a conclusion, USA, UK, Japan and Eurozone have developed and open finance markets but China is developing a lot these years but still under performs.
4.2.3 Confidence in the value of the currency As a currency is also used as a form to hold assets, the value of a currency could not fluctuate erratically. In other words, confidence in the stability of the value of the currency, especially in the future, is critical. One key factor here is inflation. A good track record of low inflation is a good indicator for the value of the currency. The table below shows the inflation rate of the regions we consider: 1998 2001 2004 2007 2010 2013 VARIANCE
USA 1.552279 2.826171 2.677237 2.852672 1.640043 1.464833 0.385596
EUROZONE 2.227707 1.977056 2.286217 2.372493 2.381258 -0.40005 0.9927
JAPAN 0.663269 -0.80338 -0.00828 0.057952 -0.71978 0.359472 0.283702
UK 1.588924 1.235895 1.344596 2.321036 3.285714 2.554547 0.537969
CHINA -0.84463 0.722903 3.884183 4.750297 3.314546 2.627119 3.659072
Variance is the variance of the inflation rate of the 6 years listed. Table 4: The inflation rate of some major economies Source: The World Bank
USA, Eurozone, Japan and UK all have low variation in the low inflation rate in the last 20 years. China’s inflation rate was not stable in the same period, but it seems to have the tendency to stabilize in the last decade.
4.2.4 Network Externalities The global currency derives its value from the usage of others. So it is a classic instance of network externalities. It first suggests the nonlinearity of its measures (there could be tipping point when one currency surpasses the other). It further suggests the inertia of its usage (people tend to use a currency because it is used in the past). So as a result, small changes in all the factors mentioned before would not generate immediate change in the usage number for one certain currency. For example, the replacement of sterling with dollar as a dominant global currency went through some back and forth, instead of an over-night result. All these factors would be our key factors to be tested in our next section.

25
5. Modeling In this section, we will develop our test from Frankel (2014)’s test. He believed that shares in central banks` foreign exchange reserve holdings are the most important measure of international currency status as well as the most easily measured. His objective of the test was to ascertain empirically how quickly foreign exchange reserve holdings adjust to economic fundamentals, during the period which the mark and the ten rose to true international currency status (1975 – 90), surpassing the pound and Swiss franc for the number 2 and number 3 slots. In our modelling, we will revalidate that the usage of currency would be affected by economic fundamentals but we don`t simply look into the foreign exchange rate, we directly use the data of currency usage volume. We also want to prove the existence of restrictions in the Frankel (2014) `s model. 5.1. Comparison of Frankel (2014)’s test In Frankel (2014)’s paper, he uses the volume of turnover in the foreign exchange market as a measure of depth of the countries’ finance markets. Furthermore, he measures confidence in the currency’s value using trend inflation, trend depreciation, exchange rate volatility, and international asset positions. The period he adopted, was 1973 – 1998, when the rise of mark and yen was included. He collected the data of dollar, mark, yen, pound, Swiss franc in this period. He briefly examined the relationship between the currency shares and GDP at market rate (GDP in PPP terms). He concluded that GDP in PPP term is not essential, also, the relationship between currency shares and GDP shares is nonlinear. Then he did the panel regression for determination of currency shares and the results are shown below:
Table 5: The result in the paper of Frankel(2014)

26
Source: Frankel (2014)
In this table, he did the regression of the variables he selected on a functional form of currency shares in reserve holdings. The functional form that seems to fit the data well is called a logit. It allows a change in fundamentals from 50 percent to 51 percent to have a far bigger effect on currency shares than a change from 0 to 1 percent. This functional form captured tipping phenomenon, one manifestation of network externalities in the choice of an international currency. The fundamental factors of GDP, the inflation differential, and exchange rate variability all appear statistically significant. Foreign exchange turnover is also of the hypothesized sign, but is not significant in this particular. So his result showed that the size of economy and fundamental indicators for the economy, like inflation would affect the use of currency significantly. But it seems that we can`t an independent variable that sufficiently represent the depth and openness of economy in his model. Also the period he selected for data source is not very current (1973 – 1998), we could question if his model has the modern application. So in order to make his model more solid and modernly significant, we will make some adjustment in his model. We want to put some financial market indicator in the model also address the not updated test period issue. There are also some other changes in selection of variables explained as following: First, the reserve shares of each currency is not quite accurate for the measures of usage of one currency. We will change it with the real usage of one currency in our test. Second, volume of turnover in the foreign exchange market as a measure of depth and openness of the countries’ finance markets is also doubtful. There are many aspects as measures for a finance market, like the variation of financial products, the activity of foreign capitals, etc. Using the turnover of foreign exchange might be too narrow. Since we mainly want to investigate the depth and openness of the finance market, we will use the two indexes which are commonly used in theses measures – Chinn-Ito Indexes for openness and private credit to GDP for depth. Third, trend inflation, trend depreciation, exchange rate volatility, and international asset positions have very high possibility to be correlated. It would cause multicollinearity. This renders his result to be less valid. We will simplify the confidence of currency indicator to inflation. We also want to add one factors – trade in GDP. Trading volume shows how much interaction a country`s economy has with the world. A high activity in trading indicates a high usage of currency exchange. Fourth, the period he chose is not recent, which has less indication for the currencies situation nowadays. The period excluded euro, one of the most important global

27
currency nowadays. We move the test period from 1973 – 1998 to 1998 – 2013 to test the model in the current situation of currency usage. Fifth, he only chose five major currencies in his test. To generalize and also include Chinese RMB, we broaden the choose to 37 currencies. 5.2. Selection of Data for Test We use the data from World Bank and the Bank for International Settlement. We first start from data of exchange volume from the Back for International Settlement triennial report. we use the 2016 version “Triennial Central Bank Survey of foreign exchange and OTC derivatives markets”. To be exact, the sheet “OTC foreign exchange turnover by currency in April 1995 - 2016, "net-net" basis”. We chose the years and region which have most of the data. The data from years 1998, 2001, 2004, 2007, 2010, 2013 for 38 regions were selected. Then we collect the GDP, Inflation Rate, Trade Volume and Private credit by deposit money banks to GDP data for these correspondent regions and years from the website of world bank. Among which, TWD Taiwan New Dollar is excluded because the lack of data from the same source of World Bank. Finally, we added the data of Chinn-Ito indexes from the updated data in their website. The selected data and its format for these data are: Usage of Currency: Volume of usage of a certain day for the chosen year, in percentage of total in a determined currency. Because there are two currencies involved in each transaction, the sum of the percentage shares of individual currencies totals 200% instead of 100%. GDP: For a whole year, in percentage of the GDP of United States of the same year. Inflation: The real inflation rate multiplied by 100 for the correspondent year. Trade: % of GPD -- The sum of exports and imports of goods and services measured as a share of gross domestic product. Obviously the volume of trade is proportional to the size of economy, so in order to measure the scale of foreign trade, we use the percentage of trade in GDP. KAOPEN: The Chinn-Ito Indexes. Bank Credit to GDP: The Ratio of Private credit by deposit money banks to GDP multiplied by 100. 5.3. First Regression Dynamic panel data model with Stata is adopted to conduct the test.

28
The dynamic panel data can include the inertia of usage of currency. The results are shown as following: . xtabond UsageofCurrency GDP Inflation TradeofGDP kaopen bankcredittogdp
Arellano-Bond dynamic panel-data estimation Number of obs = 111
Group variable: currencynum Number of groups = 36
Time variable: Year_Num
Obs per group: min = 1
avg = 3.083333
max = 4
Number of instruments = 16 Wald chi2(6) = 18.33
Prob > chi2 = 0.0055
One-step results
---------------------------------------------------------------------------------
UsageofCurrency | Coef. Std. Err. z P>|z| [95% Conf. Interval]
----------------+----------------------------------------------------------------
UsageofCurrency |
L1. | .1158009 .1419402 0.82 0.415 -.1623967 .3939985
|
GDP | 11.96702 3.488734 3.43 0.001 5.129228 18.80482
Inflation | .013578 .0386006 0.35 0.725 -.0620777 .0892338
TradeofGDP | -.0075161 .0058586 -1.28 0.200 -.0189988 .0039665
kaopen | -.485805 .2774408 -1.75 0.080 -1.029579 .057969
bankcredittogdp | -.0015509 .002277 -0.68 0.496 -.0060136 .0029118
_cons | 4.981084 1.00422 4.96 0.000 3.012849 6.949318
---------------------------------------------------------------------------------
Instruments for differenced equation
GMM-type: L(2/.).UsageofCurrency
Standard: D.GDP D.Inflation D.TradeofGDP D.kaopen D.bankcredittogdp
Instruments for level equation
Standard: _cons
. estat sargan
Sargan test of overidentifying restrictions
H0: overidentifying restrictions are valid
chi2(9) = 79.63557
Prob > chi2 = 0.0000
Table 6: The test result of first regression
As we can tell from the result above, the usage of currency is highly and positively correlated with GDP, it is so significant that other variables become insignificant comparing to it, including the lag (1) usage of currency. However, this proves the first factor of Frankel (2014)’s assumption, the usage of one currency is highly correlated with the GDP of the currency’s country. 5.4. Second Regression Now we look into the other factors, in order to investigate factors other than GDP, we need to find way to take out the influence of GDP in the usage of currency. In order to do this, we divide usage of currency (in percentage) by GDP (in percentage of USA GDP) and note it as currency_in_GDP. This transformation has its economic significance, actually, it has been used in some economic reports by governments. It represents how much money is used for each unit of GDP the country or region

29
generates. And since the usage of money is correlated with the GDP, we would like to measure, how the correlation between the usage of money and GDP is influenced by other factors. So we defined Currency_in_GDP as the dependent variable and the others as the independent variable. The results are: . xtabond Currency_in_GDP Inflation TradeofGDP kaopen bankcredittogdp
Arellano-Bond dynamic panel-data estimation Number of obs = 111
Group variable: currencynum Number of groups = 36
Time variable: Year_Num
Obs per group: min = 1
avg = 3.083333
max = 4
Number of instruments = 15 Wald chi2(5) = 186.49
Prob > chi2 = 0.0000
One-step results
---------------------------------------------------------------------------------
Currency_in_GDP | Coef. Std. Err. z P>|z| [95% Conf. Interval]
----------------+----------------------------------------------------------------
Currency_in_GDP |
L1. | -.3537914 .0509549 -6.94 0.000 -.4536611 -.2539217
|
Inflation | -138.1369 18.14392 -7.61 0.000 -173.6984 -102.5755
TradeofGDP | 10.26562 2.683868 3.82 0.000 5.005337 15.52591
kaopen | 165.3847 131.0525 1.26 0.207 -91.47342 422.2428
bankcredittogdp | .0474825 1.047996 0.05 0.964 -2.006552 2.101517
_cons | -.1852197 298.9158 -0.00 1.000 -586.0494 585.679
---------------------------------------------------------------------------------
Instruments for differenced equation
GMM-type: L(2/.).Currency_in_GDP
Standard: D.Inflation D.TradeofGDP D.kaopen D.bankcredittogdp
Instruments for level equation
Standard: _cons
. estat sargan
Sargan test of overidentifying restrictions
H0: overidentifying restrictions are valid
chi2(9) = 186.4567
Prob > chi2 = 0.0000
Table 7: The test result of second regression
Inflation and Trade Volume in GDP are significant but financial market indexes are not. The coefficient for inflation is negative and for Trade of GDP is positive. A low inflation rate and high weight of trading in economy would be have positive effect on the internationalization. A high inflation rate indicates an unhealthy economy, which would diminish the confidence in a currency. A high volume of trade indicates a high level of integration of a country`s economy in the world economy, which encourages wider use of a country`s currency and incentivizes the internationalization of the currency. All the strong currencies nowadays have very outward economies as support, like USA, Japan and Euro Zone.

30
So we prove that the confidence of a currency that asks for low inflation rate and high proportion of trade, would increase the usage of currency. Frankel (2014)’s third factor – the confidence in the value of the currency is proved as crucial. We notice that currency_in_GDP is negatively auto-correlated. But comparing to the other coefficients of the model, the coefficient for auto-correlation is small, so we can ignore the effect of auto-correlation. The insignificance of the financial market indexes showed that they don’t influent the usage of currency very much. To verify this result, we actually redid the regression with total bank asset to GDP, another measure of the depth of finance market, instead of total credit to GDP. This result showed the same conclusion. This result shows that finance market’s development would not influence the usage of the currency emitted by the region. If we look at the world’s finance market. We can find countries with developed finance market with low usage of its currency internationally or countries with not so developed finance market where the usage of currency is high. For example, Hong Kong a very developed and open finance market than mainland China, but its currency HKD usage still fell behind RMB in 2016. In conclusion, GDP, inflation and trading activity are the most important factors for the internationalization of one’s currency, its finance market is not playing such a crucial rule here. Most of the countries in the world usually would not prioritize the development of finance market in front the health of their economies. The development of finance market, especially opening its finance market usually would bring banking risk which would potentially endanger the economy. So for any government, including Chinese government, has the question to balance the internationalization of its currency and the development of its economy.
31
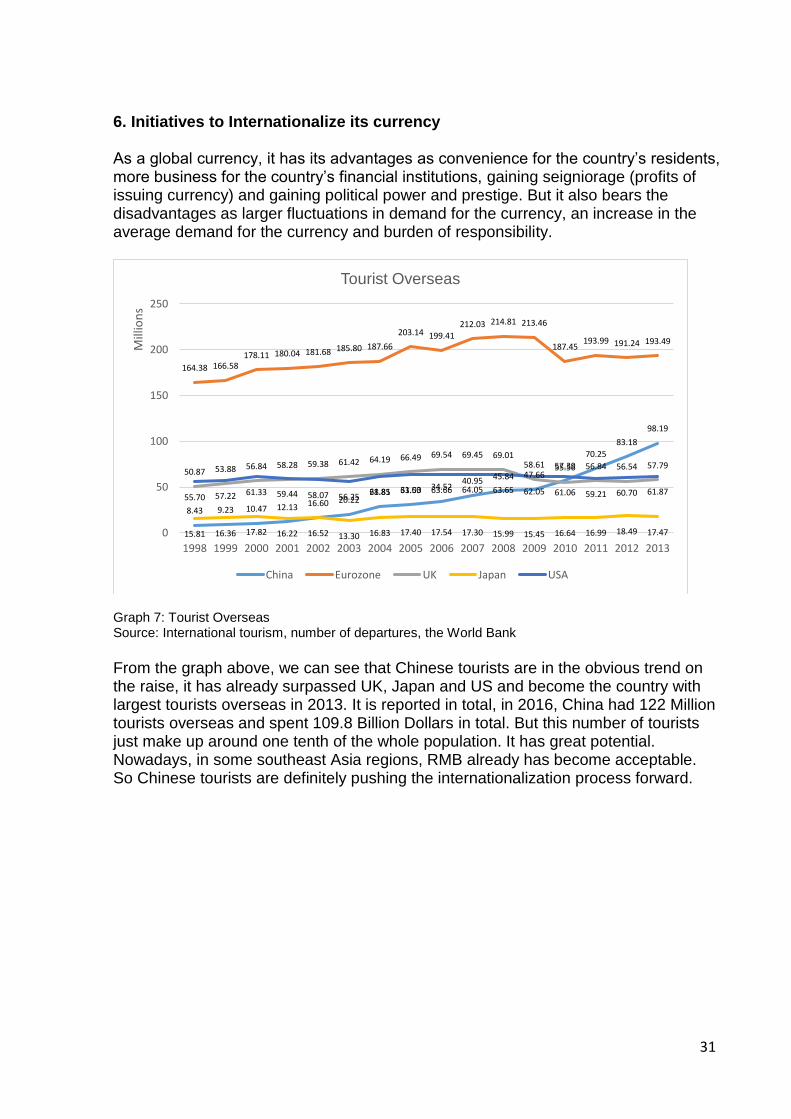
6. Initiatives to Internationalize its currency As a global currency, it has its advantages as convenience for the country’s residents, more business for the country’s financial institutions, gaining seigniorage (profits of issuing currency) and gaining political power and prestige. But it also bears the disadvantages as larger fluctuations in demand for the currency, an increase in the average demand for the currency and burden of responsibility.
Graph 7: Tourist Overseas Source: International tourism, number of departures, the World Bank
From the graph above, we can see that Chinese tourists are in the obvious trend on the raise, it has already surpassed UK, Japan and US and become the country with largest tourists overseas in 2013. It is reported in total, in 2016, China had 122 Million tourists overseas and spent 109.8 Billion Dollars in total. But this number of tourists just make up around one tenth of the whole population. It has great potential. Nowadays, in some southeast Asia regions, RMB already has become acceptable. So Chinese tourists are definitely pushing the internationalization process forward.
8.43 9.23 10.47 12.13 16.60 20.2228.85 31.03 34.52
40.95 45.84 47.6657.39
70.25
83.18
98.19
164.38 166.58178.11 180.04 181.68 185.80 187.66
203.14 199.41212.03 214.81 213.46
187.45193.99 191.24 193.49
50.87 53.88 56.84 58.28 59.38 61.42 64.19 66.49 69.54 69.45 69.0158.61 55.56 56.84 56.54 57.79
15.81 16.36 17.82 16.22 16.52 13.30 16.83 17.40 17.54 17.30 15.99 15.45 16.64 16.99 18.49 17.47
55.70 57.22 61.33 59.44 58.07 56.2561.81 63.50 63.66 64.05 63.65 62.05 61.06 59.21 60.70 61.87
0
50
100
150
200
250
1998 1999 2000 2001 2002 2003 2004 2005 2006 2007 2008 2009 2010 2011 2012 2013
Mill
ion
s
Tourist Overseas
China Eurozone UK Japan USA

32
Graph 8: Investment Overseas Source: Foreign direct investment, net inflows (BoP, current US$), the World Bank
China’s foreign direct investment was not very significant comparing to the others before 2010. But after 2010, it has a clear trend going up. This explains the set-up of various RMB clearing and settlement bank for RMB overseas. The establishment of clearing banks will promote the growth of renminbi activity overseas and help accommodate an increase in volumes and demand for renminbi products and services. With larger and larger presence in the world economics, China is exposing itself more and more to the currency risk, which are the risks arising from the change in price of one currency in relations to another. Nowadays, most of the cross boarder goods and services are noted in Dollar, as the second largest trade participant (after Eurozone), China definitely wants to get the right of pricing to reduce this risk. So as a conclusion, the global status of China`s currency is helping the expansion of its economy and influence, and the increasing power, in turn, also pushes the global status of its currency. But when a currency is more in the demand in the market, usually it would appreciate the currency. But for most developing countries, a depreciated currency is beneficial because it motivates exports, and further more helps the economy develop. At the end, a conscious government focuses more on maintaining a good and sustainable economy for the country. To achieve this, the internationalization of its currency might be one of its many economic policies to adopt. The willingness of a government to internationalize its currency, totally depends on how the internationalization would contribute to the country`s economic development.
-200
0
200
400
600
800
1,000
1,200
1,400
1,600
19
98
19
99
20
00
20
01
20
02
20
03
20
04
20
05
20
06
20
07
20
08
20
09
20
10
20
11
20
12
20
13
20
14
20
15
Bill
ion
sInvestment Overseas
China Eurozone UK Japan USA

33
The conflict between the economic development and the currency internationalization could be seen from the change of exchange rate. Gala (2008) fully illustrate how the exchange rate would influence the economic development. Investment and technology change are two important channels that Gala mentioned in his paper by which long-term growth is affected by exchange rate levels. A relatively undervalued currency meaning higher tradable prices, lower real wage levels, higher profit margins and investment. Over-valuation in term would reduce employment and investment. In a developing economy, the whole industries would risk being shut down by overvaluation of its currency. To be more specific, overvaluation would block low-earning and low-productivity jobs from migrating to high-earning and high-productivity jobs. And as a result, the relocation of abundant labor is stopped. So an adequate exchange rate which guarantees the currency`s competitively would contribute to capital accumulation by stimulating investment. It would help the country develop industries other than tradable sectors, and furthermore encourage the country to change structurally in its economy and climb up the technological ladder. At the end, real wages also would increase and level off the low wages for workers due to a weak currency. At the end of his paper, he compared Latin America and East Asia to demonstrate how competitive exchange rates, along with subsidies, help East and Southeast Asian countries to pursue an export-led growth strategy. While Latin America focused on an inward-looking industrialization strategy with a strong bias for currency appreciation. So as a conclusion, for a developing country like China, the best strategy is still to maintain the competiveness of its currency. So now China is facing a dilemma: how to internationalize its currency while still keeping the exchange rate low? We will look into the recent history of Chinese monetary polices for the last thirty years in next section, and then try to answer this question.

34
7. China`s road to internationalize its currency
We would like to exam two questions for China in terms of internationalization of its currency: 1. When did the internationalization of its currency become a part of policy making of Chinese company; 2. Does the country have the condition to internationalize its currency. We look into the change of exchange rate for RMB for the last 30 years.
Graph 9: The exchange rate of RMB for the last 30 years Source: The World Bank
Graph 10: The Inflation of Trade in GDP for China for the last 30 years Source: The World Bank
2.94
3.453.72 3.72 3.77
4.78
5.32 5.515.76
8.628.35 8.31 8.29 8.28 8.28 8.28 8.28 8.28 8.28 8.28 8.19
7.977.61
6.95 6.83 6.776.46 6.31 6.20 6.14 6.23
0.00
1.00
2.00
3.00
4.00
5.00
6.00
7.00
8.00
9.00
10.00
19
85
19
86
19
87
19
88
19
89
19
90
19
91
19
92
19
93
19
94
19
95
19
96
19
97
19
98
19
99
20
00
20
01
20
02
20
03
20
04
20
05
20
06
20
07
20
08
20
09
20
10
20
11
20
12
20
13
20
14
20
15
Exchange Rate
Exchange Rate
22.8625.0325.4825.3124.32
29.6233.0033.69
31.73
42.06
38.44
33.7233.9531.63
33.15
39.3638.25
42.46
51.61
59.4562.90
64.7762.28
56.80
43.59
49.3851.14
48.6747.14
45.09
41.20
-10
0
10
20
30
40
50
60
70
19
85
19
86
19
87
19
88
19
89
19
90
19
91
19
92
19
93
19
94
19
95
19
96
19
97
19
98
19
99
20
00
20
01
20
02
20
03
20
04
20
05
20
06
20
07
20
08
20
09
20
10
20
11
20
12
20
13
20
14
20
15
Inflation Rate and Trade in GDP, China (%)
Inflation TradeofGDP

35
The first period (before 1994) -- Devaluing its currency: The Period was the beginning of the Chinese then leader Deng Xiaoping`s Reform and Opening economic policy. China started to decentralize and privatize its industry. In this period China had some high inflation and also for some years, a stronger need of importation than exportation, this generated higher demand for dollar and devalued a lot of RMB, which went from 2.80:1 to dollar to almost 8.70 to dollar at the end of this period. In this period China also had a double exchange rate system – an official rate and a market rate. The government adjusted the official rate several times to made up the gap between the rates. As what we can tell from the graph below, before 1994, China was still not a strong exporting country. Even in some years, China faced trade deficit. At the same period, China`s inflation rate was not stable, it reached more than 20% at the end of this period. China`s GDP only entered the top 10 in the rank at the end in this period. Also, this was the first decade of China`s economy reform, there were many restructuring and privatization. The period also came with political turmoil in China. So it is fair to say, China was no way even near to fulfill the conditions of internationalization of its currency. There were still many internal problems to be fixed inside. Also due to the strict capital control also sanctions from the outside world, China received little amount of foreign investment in this period. In this period, Chinese companies and capital almost had no presence in the international stage. China`s economy was still not integrated with the world economy. So for the Chinese government, it had no intention had at to internationalize its currency at this period.

36
The exportation outweighed importation only in years 1990, 1991, 1992. And for the rest years,
exportation played a bigger role in China`s trade.
Graph 11: Exports of goods and services minus imports of goods and services of China Source: The World Bank.
Graph 12: Foreign Direct Investment in China, net inflows Source: The World Bank
The second period (1994 – 2005) – Fixing the devalued value:
-4.97
-4.04
-1.19-1.91
-1.43
2.191.96
0.86
-1.97
0.95
2.30
1.42
4.224.24
2.692.001.69
2.081.531.66
4.50
6.53
7.59
6.59
3.883.68
2.412.742.472.753.55
-6
-4
-2
0
2
4
6
8
10
19
85
19
86
19
87
19
88
19
89
19
90
19
91
19
92
19
93
19
94
19
95
19
96
19
97
19
98
19
99
20
00
20
01
20
02
20
03
20
04
20
05
20
06
20
07
20
08
20
09
20
10
20
11
20
12
20
13
20
14
20
15
Exports of goods and services minus Imports of goods and services (% of GDP)
External balance on goods and services (% of GDP)
0.4
30
.64
1.2
61
.66
1.8
82
.31
3.1
93
.39
3.4
94
.37
11
.16
27
.52
33
.79
35
.85
40
.18
44
.24
43
.75
38
.75
42
.10
47
.05
53
.07
57
.90
68
.12 1
04
.11
13
3.2
71
56
.25
17
1.5
31
31
.06
24
3.7
0 28
0.0
72
41
.21 2
90
.93
26
8.1
02
49
.86
0.00
50.00
100.00
150.00
200.00
250.00
300.00
350.00
Year
19
83
19
85
19
87
19
89
19
91
19
93
19
95
19
97
19
99
20
01
20
03
20
05
20
07
20
09
20
11
20
13
20
15
Bill
ion
s
Foreign direct investment, net inflows (BoP, current US$)
Series1

37
Starting from 1994, China unified the exchange rate to the banking system in this period and used its huge foreign reserve to stabilize the exchange rate. China pegged RMB to dollar at the rate of 8.70 and let it only fluctuate in a very small scale in this period. This helped China form an exportation-led economy mode. In this period, China started the stabilize its inflation rate and the trading volume was increasing steadily along the years. China`s GDP also made into the top 5. So this was a period of stable development. China gradually to gain its presence in the world economy. The high light event of this period was when China joined the World Trade Organization in 2001. The competitive exchange rate helped China to keep its Made in China Product competitive and develop a whole and complete industrial chain. So even with the increasing oversea Chinese investment and tourists, Chinese government still to keep its exchange rate low. So even though it seemed that China has the conditions to internationalize its currency, the government chose not to invest on this policy. The third period (2005 until today) -- Valuing with small scale: On July 21st of 2005, People’s Bank of China announced to change the exchange rate to 8.11 and stop pegging dollar. China adopted a basket of currencies system, meaning that China would consider all the major trading partners and their currencies as the reference for exchange rate. Within the years, China gradually broaden the daily fluctuation limit for RMB exchange rate. China licensed more and more institutes and agencies to become the participants in the exchange market. After 2005, internationalizing RMB becomes an objective more and more clear for the Chinese government, with the large percent of Trade in GDP and a low inflation rate, China starts to slightly appreciate its currency.
Nowadays China has already achieved the two factors to internationalize its currency – the economic size and confidence in the value of its currency represented by its performance indicators. China now has the second biggest economy in the world and its indicators for economy has been in good performance in decades already. There has been news going around about the slowdown of the economy but if we put it into comparison with other major economies around the world, it is still reasonably good. But Chinese government has long been very cautious about the flow of capital across border. It is understandable, first of all, the internationalization of its currency would not be prioritized before the sustainable development of its economy, and second, as we tested above, the development of finance market would not influence the internationalization of RMB very much. The important factors to focus here in terms of internationalization of currency are GDP, inflation rate and trade volume, which come together with the sustainability of economic development. So for a very long time, RMB had been solely a domestic used money. Only in 2003, People’s Bank of China (PBoC, China Central Bank) began to offer RMB clearing

38
service in Hong Kong and therefore, kicked off the RMB offshore market. For the last ten years before 2003, RMB was loosely pegged to dollar between 8.27 and 8.28. In July 21st of 2005, PBoC announced the change of RMB exchange rate from 8.27 to 8.11 and abolished the unitary dollar-pegged policy. PBoC started to use a basket of currencies as its rate reference and changed the fixed rate to floating rate. In 2010, PBoC allowed Hong Kong banks to trade RMB without the clearing bank. CNH, the offshore RMB exchange rate was formed, differentiated from the onshore RMB exchange rate CNY. Therefore, the demand of the currency is reflected in CNH, and derivatives products are also based on this rate. PBoC monitors the spread of CNH and CNY to avoid huge difference and volatility. In November 17th of 2014, Shanghai-Hong Kong Stock Connect was launched. The program allows investors in each market able to trade shares on the other market using their local brokers and clearing houses. Till today, PBoC still limits the flow of RMB across border. Offshore Trading of RMB is allowed for import and export use. And Chinese companies can use RMB as an investment tool overseas. For foreign capitals, the major available investment tool used to be just RMB offshore, concentrated in Hong Kong (around 70% of total offshore RMB in 2013). The offshore onshore RMB rate is 1 to 100, much lower than the US Dollar offshore onshore rate, 30 to 100. With the opening of Shanghai – Hong Kong Stock Connect, the high yield in the domestic Chinese bonds market, attracts many foreign investors. But foreign investors currently hold only a tiny share, at 1.9 per cent, of China’s total onshore bond market, suggesting ample room to boost their involvement providing that Beijing approves sufficient investment quotas. All these policies, could be interpreted as a way for Chinese government to gradually open its market, but still keep its currency competitive. As China is going through the relocation of its huge labor from the low-earning and low-productivity jobs to high-earning and high-productivity jobs, a competitive currency is necessary to accompany this process. To answer the question from last section, when facing the dilemma, Chinese government seems to prioritize development its economy. The internationalization of its currency also must serve to the development of its currency. Chinese government has a large Foreign Exchange reserve, so it has the power to stabilize its exchange rate. For example, RMB has strong downward pressure in the recent years, due to the concern over the slow-down of Chinese economy and the raise of dollar interest rate. There were huge capital outflows so the Chinese government keeps selling its foreign reserve to shore up its exchange rate.

39
Graph 13: China Foreign Exchange Reserves Source: The People’s Bank of China
In the annual report of internationalization of RMB of 2016 made by the Chinese government, it clearly cited Germany as positive example and Japan as negative example in terms of internationalization of its currency. Germany took very strong control over capital, slowed down the development of its finance market and interfered the market with foreign reserve to guarantee the advantage of trading, competitiveness of its industry and the development of real economy. These policies sustained the growth of mark in the long term. On contrast, Japan was too aggressive in the Yen internationalization process. It overestimated the resistance of real economy towards valuation of currency and did not stabilize the exchange rate of yen. In addition to the mishaps over macro economy policy, he harmed the real economy and did not maintain the growth of Yen.

40
8. The Conclusion and the outlook for the Chinese Government In this dissertation, we revalidated the three crucial factors for a global currency – the size of the economy, inflation rate and volume of trading. The development of finance market would not influence much as the usage of the currency comparing to these three factors. We then discussed the dilemma that Chinese government is facing in the internationalization process. We briefed though Chinese recent monetary policy and concluded that, even internationalization of its currency is tempting, the government would not prioritize it in front the economic development. We can expect a continuing competitive (depreciated) RMB for the near future. China has made solid and cautious steps in internationalizing its currency. But there are still many endeavor needed. Here are some suggestions. First of all, the government should continuing keep its currency competitive while restructure its economy. First, China needs steady structure reform, especially upgrade in its industry. The key factor for made in china good nowadays is the price. Even though it always will play a key role, the government can take actions to reduce the sensibility of made in china goods to price. A viable path would be increasing the technology factor in the products. When a product is not easily replaced and has long duration, it would assure the solid demand for the goods, and high involvement of technology in products would help achieve this. Second, stick to free trade. By the time this dissertation was drafted, Donald Trump had recently become the new president of the United States. His inward and protectionism policy made many countries worry the situation of free trade of the world for the coming years. China, as the biggest participants in the world trade, should be the guardian of free trade, not just because it potentially helps to push up the usage of its currency, it also is good for the global economy. Third, maintain its competitive currency rate to safeguard the economic transformation and trade.
Note:
[1] http://www.frbsf.org/banking/asia-program/pacific-exchange-blog/banking-on-china-renminbi-currency-swap-agreements/ [2] http://www.cips.com.cn/cipsen/7052/7057/index.html [3] http://www.economist.com/blogs/economist-explains/2014/11/economist-explains-6 [4] http://www.imf.org/external/np/exr/facts/sdr.htm [5] https://www.ft.com/content/5136953a-1b3d-11e5-8201-cbdb03d71480

41
9. References
Cheung, Y.W. The Role of Offshore Financial Centers in the Process of Renminbi Internationalization. ADBI Working Paper 472. Tokyo: Asian Development Bank Institute. 2014. Available: http://www.adbi.org/workingpaper/2014/04/03/6226.process.renminbi.internationalization/ Cohen, B. Will History Repeat Itself? Lessons for the Yuan. ADBI Working Paper 453. Tokyo: Asian Development Bank Institute. 2014. Available: http://www.adbi.org/workingpaper/2014/01/17/6111.will.history.repeat.itself.lessons.rmb/ Cruz, P. C., Y. Gao, and L. L. Song. The People’s Republic of China’s Financial Markets: Are They Deep and Liquid Enough for Renminbi Internationalization? ADBI. Working Paper 477. Tokyo: Asian Development Bank Institute. 2014. Available:http://www.adbi.org/working-paper/2014/04/30/6239.prc.financial.markets/ Eichengreen, Barry & Kawai, Masahiro. Renminbi Internationalization: Achievements, Prospects, and Challenges. Asian Development Bank Institute & Brookings Institution Press, 2015. Page 1 – Page 26 Frankel, Frankel (2014). Internationalization of the RMB and Historical Precedents. Journal of Economic Integration, 2012. Huang. Y., D. Wang, and G. Fan. Paths to a Reserve Currency: Internationalization of the Renminbi and Its Implications. ADBI Working Paper 482. Tokyo: Asian Development Bank Institute. 2014. Available: http://www.adbi.org/workingpaper/2014/05/23/6268.paths.reserve.currency.renminbi/ Ito, Hiro & Chinn, Menzie. The Rise of the “Redback” and China’s Capital Account Liberalization: An Empirical Analysis on the Determinants of Invoicing Currencies. Paper prepared for the ADBI Conference “Currency Internationalization: Lessons and Prospects for the RMB”. August 8, 2013. Available: http://www.ssc.wisc.edu/~mchinn/Chinn-Ito_RMB.pdf Kawai, M., and Pontines, V. The Renminbi and Exchange Rate Regimes in East Asia. ADBI Working Paper 484. Tokyo: Asian Development Bank Institute. 2014. Available: http://www.adbi.org/working-paper/2014/05/30/6303.renminbi.exchange.rate/ Li, Y et al. Finance of New China for 60 Years. China Financial and Economic
Press. September 2009. (李扬等人. 新中国金融 60年. 中国财政经济出版社. 2009年
9月)
Menzie D. Chinn, Hiro Ito. A New Measure of Financial Openness. Journal of Comparative Policy Analysis: Research and Practice, Volume 10, 2008 – Issue 3 Available:
42
http://citeseerx.ist.psu.edu/viewdoc/download?doi=10.1.1.368.3507&rep=rep1&type=pdf Paulo Gala. Real Exchange Rate Levels and Economic Development: Theoretical Analysis and Econometric Evidence. Cambridge Journal of Economics, Vol. 32, No. 2, pp. 273-288, 2008. Available: http://joseluisoreiro.com.br/site/link/b8478df11ed1a5bc1dd48bd6993644831b7fd85c.pdf Prasad, E. Global Implications of the Renminbi’s Ascendance. ADBI Working Paper 469. Tokyo: Asian Development Bank Institute. 2014. Available: http://www.adbi.org/workingpaper/2014/03/25/6203.global.implications.renminbi.ascendance/ Rhee, C., and L. Sumulong. Regional Settlement Infrastructure and Currency Internationalization: The Case of Asia and the Renminbi. ADBI Working Paper 457. Tokyo: Asian Development Bank Institute. 2014. Available: http://www.adbi.org/workingpaper/2014/02/05/6130.regional.settlement.currency.internationalization/
RMB Internationalization Report 2016 · Press Release. International Monetary Institute, Renmin University, 2016. Available: http://www.imi.org.cn/en/wp-content/uploads/2016/10/%E3%80%90IMI-Research-Report-No.-1602-EN%E3%80%91RMB-Internationalization-Report-2016-Press-Release.pdf Triennial Central Bank Survey of foreign exchange and OTC derivatives markets in 2016. Bank for International Settlements. 2016. Available: http://www.bis.org/publ/rpfx16.htm Working Paper 481. Tokyo: Asian Development Bank Institute. 2014. Available: http://www.adbi.org/workingpaper/2014/05/19/6266.benefits.costs.renminbi.internationalization/ Yu, Yongding. How Far Can Renminbi Internationalization Go? ADBI Working Paper 461. Tokyo: Asian Development Bank Institute. 2014. Available: http://www.adbi.org/workingpaper/2014/02/13/6136.how.far.can.renminbi.internationalization.go/ Zhang, L., and K. Tao. The Benefits and Costs of Renminbi Internationalization. ADBI