Tracing protein evolutionary trajectory - run.unl.pt · ria, mas também pela alteração do seu...
170
Dissertation presented to obtain the Ph.D degree in Bioinformatics Instituto de Tecnologia Química e Biológica António Xavier | Universidade Nova de Lisboa Oeiras April, 2016 Tracing protein evolutionary trajectory Homology inference with specific molecular constraints Research work coordinated by: Jarosław Surkont
Transcript of Tracing protein evolutionary trajectory - run.unl.pt · ria, mas também pela alteração do seu...

Dissertation presented to obtain the Ph.D degree in BioinformaticsInstituto de Tecnologia Química e Biológica António Xavier | Universidade Nova de Lisboa
OeirasApril, 2016
Tracing protein evolutionarytrajectoryHomology inference with specificmolecular constraints
Research work coordinated by:
Jarosław Surkont
Cover: A cartoon representation of the Rab11b and cGMP-dependent proteinkinase II leucine zipper complex (A. S. Reger et al. (2014). Crystal Structureof the cGMP-dependent Protein Kinase II Leucine Zipper and Rab11b ProteinComplex Reveals Molecular Details of G-kinase-specific Interactions. Journal
of Biological Chemistry 289.37, 25393–25403).
Tracing protein evolutionary trajectory
Homology inference with specific molecular constraints
Jarosław Surkont, Computational Genomics Laboratory, Instituto Gulbenkian deCiência
Declaration: This dissertation is a result of my own research carried out betweenJune 2012 and March 2016 in the laboratory of Dr. José B. Pereira Leal, Ins-tituto Gulbenkian de Ciência in Oeiras, Portugal, within the PhD Programme inIntegrative Biomedical Sciences (edition 2011-2012).
Declaração: Esta dissertação é o resultado do meu próprio trabalho desenvolvidoentre Julho 2012 e Março 2016 no laboratório do Doutor José B. Pereira Leal,Instituto Gulbenkian de Ciência em Oeiras, Portugal, no âmbito do Programa deDoutoramento em Integrative Biomedical Sciences (edição 2011-2012).
Financial support: This dissertation had the financial support from Fundaçãopara a Ciência e a Tecnologia and European Social Found, through grant SFRH/BD/51880/2012 awarded to Jarosław Surkont, and Fundação Calouste Gulben-kian.
Apoio financeiro: Esta dissertação teve o apoio financeiro da Fundação para aCiência e a Tecnologia e do Fundo Social Europeu no âmbito do Quadro Comu-nitário de apoio através da bolsa de doutoramento SFRH/BD/51880/2012 e daFundação Calouste Gulbenkian.
Acknowledgements: I would like to thank my supervisor José Pereira Leal for his
guidance and support throughout my PhD. Special thanks to all of the past and
present members of the Computational Genomics Lab for their support, enthusi-
asm, and criticism that helped to develop the ideas presented in this thesis. I also
wanted to thank Thiago Carvalho for providing me with an opportunity to join
the PhD programme and the IGC community.
Summary
E volutionary processes can be considered at multiple levels of biological or-
ganization. The work developed in this thesis focuses on protein molecular
evolution. Although proteins are linear polymers composed from a basic set of
20 amino acids, they generate an enormous variety of form and function. Pro-
teins that have arisen by a common descent are classified into families; they often
share common properties including similarities in sequence, structure, and func-
tion. Multiple methods have been developed to infer evolutionary relationships
between proteins and classify them into families. Yet, those generic methods are
often inaccurate, especially when specific protein properties limit their applica-
tions. In this thesis, we analyse two protein classes that are often difficult for the
evolutionary analysis: the coiled-coils – repetitive protein domains defined by a
simple widespread peptide motif (chapters 2 and 3) and Rab small GTPases –
a large family of closely related proteins (chapters 4 and 5). In both cases, we
analyse the specific properties that determine protein structure and function and
use them to improve their evolutionary inference.
Coiled-coils are ubiquitous rod-like domains present in all living organisms
that comprise up to 10% of proteins encoded in a genome. They are involved
in multiple cellular processes, where they function as spaces separating func-
tional domains, or (and) interaction sites, often providing scaffolds for protein
complexes. Resolving evolutionary histories of coiled-coil proteins should shed
some light on the evolution of many intracellular processes and systems. Yet,
coiled-coils are considered difficult for evolutionary inference due to their low-
complexity: The domain consists of multiple repetitions of a simple peptide pat-
tern of seven amino acids. As a result, non-homologous coiled-coil domains can
converge to a similar sequence and structure; coiled-coils have independently
arisen multiple times in evolution.
In chapter 2 we analysed the evolutionary properties of coiled-coil sequences.
We showed that, despite the underlying simple pattern of hydrophobic and polar
residues, coiled-coil sequences are conserved and contain evolutionary relevant
information (similar to the globular domains). Yet, the patterns of amino acid
substitutions differ from those of globular domains. We developed a coiled-coil
i
specific model (CC) that reflects this substitution patterns. In the context of phy-
logenetic reconstruction of coiled-coil proteins, it outperforms general models,
often leading to different tree topologies. For multidomain proteins, consisting
of both coiled-coil and globular domains, model partitioning involving the CC
model and a general model yields more likely tree estimates than a single model.
Lastly, the new model improves search sensitivity of (sequence similarity-based)
homology detection methods for coiled-coil proteins.
Proteins evolve by altering the composition of their primary sequence but
also by changing their length. Hence, to complement the analysis of the substitu-
tion patterns in coiled-coil domains we also analysed their length evolution. The
number of sequence repeats (in repetitive proteins), and as a consequence protein
length, varies across homologues. Yet, given the structural role in the spacer and
scaffold formation, we hypothesized, in chapter 3, that the length of coiled-coil
domains is largely conserved in evolution. Indeed, we observed high conser-
vation of coiled-coil regions length throughout the tree of life, even when the
remaining parts of the protein, including globular domains, change. This length
conservation is independent of the conservation of the amino acid composition.
It reflects the conservation of the physical length of the domain; contrary to the
globular domains, the size of the coiled-coil domains changes proportionally to
the change in the sequence length. Length conservation is functionally specific,
suggesting that the domain size is constrained by its function.
The remaining chapters focus on the Rab GTPases, a large protein family of
closely related proteins that regulates membrane trafficking by providing speci-
ficity to the system. Rabs are short single-domain proteins with a complex evo-
lutionary history: They have been subject to multiple general and taxon-specific
duplications (and losses). The family structure, its size, and a high level of se-
quence similarity pose a challenge for evolutionary inference methods. In chap-
ter 4 we present Rabifier2, a new version of a bioinformatic pipeline for Rab
GTPase identification and classification. The new Rabifier outperforms the ini-
tial version in both the annotation accuracy and speed. It is available as a web
service (RabDB, which also includes pre-computed annotations for sequenced
eukaryotic genomes) and a stand-alone package. Rabifier is distributed as an
open source software, which should foster its further community-driven develop-
ii
ment.
Mounting evidence suggests that the Last Eukaryotic Common Ancestor
(LECA) was a complex organism with many features characteristic of extant
Eukaryotes, including a large array of Rab GTPases. Yet, it remains unknown
how such elaborate repertoire had emerged. In chapter 5 we analysed the ori-
gin of eukaryotic Rabs. Using the new Rabifier pipeline, we predicted putative
Rab-like GTPases in Archaea and specifically in Lokiarchaeaon – an archaeal
species that contains several eukaryotic signatures, including an expanded reper-
toire of small GTPases. The phylogenetic analysis was inconclusive about the
position of the archaeal Rab-like proteins within the small GTPase family. Yet,
a detailed sequence- and structure-based analysis revealed a strict conservation
of Rab-specific motifs that mediate interactions with Rab regulators. A sensitive
search revealed that, indeed, putative Rab-binding proteins exist in Archaea, sup-
porting the hypothesis that some components of the eukaryotic endomembrane
system evolved before LECA.
This thesis focuses on analysing protein properties in the evolutionary con-
text. The incorporation of such protein class-specific information can often result
in a better inference of the protein evolutionary trajectory. These improvements
are, however, not restricted to protein evolution. The presence of characteristic
marker proteins in an organism is a strong indicator for the presence of specific
cellular processes and structures; conversely, the absence of a protein suggests
a missing functionality. Hence, the improved tools for inferring evolutionary re-
lationships between proteins should ultimately help to uncover the evolution of
cellular components and functions.
iii

Sumário
O s processos evolutivos podem ser observados em vários níveis de organiza-
ção biológica. Neste contexto, o trabalho desenvolvido nesta tese centra-se
na evolução molecular de proteínas. Apesar de as proteínas serem polímeros li-
neares compostos por um conjunto básico de 20 aminoácidos, podem gerar uma
enorme variedade de formas e funções. Proteínas que surgiram de um descen-
dente comum são classificadas por famílias, que têm geralmente propriedades
comuns, incluindo similaridades na sequência, estrutura e função. Vários mé-
todos têm sido desenvolvidos para inferir relações evolutivas entre proteínas e
classificá-las em famílias. No entanto, esses métodos genéricos são muitas ve-
zes imprecisos, especialmente quando propriedades específicas das proteínas li-
mitam a sua aplicação. Nesta tese, analisámos duas classes de proteínas que
apresentam dificuldades para a análise evolutiva: as proteínas ‘coiled-coil’ – do-
mínios de proteínas repetitivas definidas por um motivo simples peptídico ge-
neralizado (capítulos 2 e 3) e pequenas GTPases Rab – uma família grande de
proteínas muito próximas evolutivamente (capítulos 4 e 5). Em ambos os casos,
analisamos as propriedades específicas que determinam a estrutura e função das
proteínas, e usamo-las para melhorar a sua inferência evolutiva.
Proteínas ‘coiled-coil’ são domínios do tipo ‘rod’ omnipresentes em todos os
seres vivos e que abrangem até 10% de proteínas codificadas num genoma. Estas
estão envolvidas em vários processos celulares, onde funcionam como espaçado-
res, separando domínios funcionais e/ou pontos de interação, muitas vezes for-
necendo o molde para complexos de proteínas. A resolução da história evolutiva
das proteínas coiled-coil permite contribuir para o esclarecimento da evolução
de muitos processos e sistemas intracelulares. No entanto, devido à sua baixa
complexidade, as proteínas coiled-coil, no contexto da inferência evolutiva são
consideradas difíceis: o domínio consiste em múltiplas repetições de um padrão
peptídeo simples de sete aminoácidos. Como resultado, os domínios não homólo-
gos das coiled-coils podem convergir para uma sequência e estrutura semelhante
e as coiled-coils surgiram por várias vezes na evolução de forma independente.
No capítulo 2, analisamos as propriedades evolutivas de sequências de coiled-
coils. Mostrámos que, apesar da existência do padrão subjacente de resíduos sim-
iv
ples, hidrófobos e polares, as sequências em coiled-coil são conservadas e con-
têm informação evolutiva relevante (semelhante aos domínios globulares). No
entanto, os padrões de substituições de aminoácidos diferem dos domínios glo-
bulares. Desenvolvemos um modelo específico de coiled-coil (CC) que reflete
esses padrões de substituição. Quando aplicado na reconstrução filogenética de
proteínas coiled-coil, supera os modelos gerais, levando muitas vezes a diferen-
tes topologias de árvores. Para proteínas com vários domínios, que consistam
em domínios coiled-coils e domínios globulares, o particionamento do modelo
envolvendo o modelo CC e um modelo geral produz estimativas de árvores com
uma maior probabilidade, do que um único modelo. Por último, o novo mo-
delo melhora a sensibilidade de busca (baseada em similaridade de sequência)
de métodos de detecção de homologia para proteínas coiled-coils.
As proteínas evoluem pela alteração da composição da sua sequência primá-
ria, mas também pela alteração do seu comprimento. Assim, para complementar
a análise dos padrões de substituição nos domínios coiled-coil, também anali-
sámos a evolução do seu comprimento. Entre homólogos varia o número de
elementos repetitivos (em proteínas repetitivas), e como consequência, o compri-
mento das proteínas. No entanto, dado o papel estrutural como espaçadores e
de esqueleto modular, formulamos a hipótese, no capítulo 3, de que o compri-
mento dos domínios coiled-coil é largamente conservado na sua evolução. De
facto, observou-se uma elevada conservação no comprimento das regiões coiled-
coil em toda a árvore da vida, mesmo quando mudam as restantes partes da
proteína, incluindo domínios globulares. Esta conservação de comprimento é
independente da conservação da composição em aminoácidos. A conservação
do comprimento físico dos domínios coiled-coils varia proporcionalmente à al-
teração no comprimento da sequência em oposição ao observado em domínios
globulares. A conservação do comprimento é específica da funcionalidade, o que
sugere que o tamanho do domínio é limitado pela sua função.
Os restantes capítulos focam as Rab GTPases, uma família numerosa de pro-
teínas evolutivamente muito próximas, que regulam o tráfico membranar, forne-
cendo especificidade a este sistema. As Rabs são proteínas de domínio único
com uma história evolutiva complexa: foram sujeitas a duplicações (e perdas)
gerais múltiplas e taxonomicamente específicas. A estrutura desta família, o seu
v
tamanho e um alto nível de similaridade de sequências representam um desafio
para os métodos de inferência evolutiva. No capítulo 4 apresentamos Rabifier2, a
versão atualizada de uma cadeia de comandos bioinformáticos para identificação
e classificação de Rab GTPases. O novo Rabifier supera a versão inicial, tanto
pela precisão na anotação como em velocidade. Está disponível como um ser-
viço web (RabDB, que também inclui anotações pré-analisadas para os genomas
eucarióticos já sequenciados) e um pacote ‘stand-alone’. O Rabifier é distribuído
como um software de código aberto, o que visa promover o seu desenvolvimento
pela da comunidade de utilizadores.
Evidências crescentes sugerem que o último ancestral comum de todos os
eucariotas (do inglês LECA) era um organismo complexo com muitas caracte-
rísticas típicas dos eucariotas atuais, incluindo uma grande variedade de Rab
GTPases. No entanto, continua a ser um mistério como terá emergido tal com-
plexidade. No capítulo 5, analisamos a origem das Rabs eucarióticas. Usando
a versão actualizada do Rabifier, previmos potenciais GTPases do tipo Rab em
Archaea e, especificamente, no Lokiarchaeaon – uma espécie de Archaea que
contém várias assinaturas eucarióticas, incluindo um repertório expandido de
pequenas GTPases. A análise filogenética foi inconclusiva sobre a posição das
proteínas Rab-like de Archaea, dentro da família das pequenas GTPases. No
entanto, uma análise detalhada baseada em estrutura e sequências revelou uma
conservação estrita de motivos específicos de Rab que medeiam as interações
com os reguladores Rab. Uma pesquisa fina revelou que, de facto, existem po-
tenciais proteínas de ligação a Rabs em Archaea, suportando a hipótese de que
alguns componentes do sistema endo-membranar eucariótico evoluíram antes do
LECA.
Esta tese centra-se na análise de propriedades de proteínas no contexto evo-
lutivo. A incorporação de informações específicas de classe de proteínas resulta
numa melhor dedução da trajetória evolutiva das proteínas. Estas melhorias, no
entanto, não são restritas à evolução de proteínas. A presença de proteínas de
características específicas num organismo são um forte indicador para a eventual
presença de processos e estruturas celulares específicas. Por outro lado, a ausên-
cia de uma proteína sugere uma funcionalidade perdida. Em última análise, a
disponibilização de melhores ferramentas para a aferição de relações evolutivas
vi

entre as proteínas deverá contribuir para a descoberta da evolução dos compo-
nentes e funções celulares.
vii

viii
Contents
1 Protein properties and evolution 1
1.1 Introduction . . . . . . . . . . . . . . . . . . . . . . . . . . . . 3
1.1.1 Biological classification: from organisms to molecules . 3
1.1.2 Motivation . . . . . . . . . . . . . . . . . . . . . . . . 5
1.2 Methods of molecular evolution . . . . . . . . . . . . . . . . . 6
1.2.1 Sequence search . . . . . . . . . . . . . . . . . . . . . 7
1.2.2 Sequence alignment . . . . . . . . . . . . . . . . . . . 10
1.2.3 Phylogeny reconstruction . . . . . . . . . . . . . . . . . 12
1.2.4 Applications . . . . . . . . . . . . . . . . . . . . . . . 16
1.2.5 Automatic methods . . . . . . . . . . . . . . . . . . . . 17
1.3 Protein space, constraints, and information content . . . . . . . 18
1.3.1 Protein space . . . . . . . . . . . . . . . . . . . . . . . 18
1.3.2 Structural constraints in protein evolution . . . . . . . . 21
1.3.3 Information content . . . . . . . . . . . . . . . . . . . . 23
1.4 Problems, limitations, and challenges in studying protein evolution 26
1.4.1 Problem type 1: Repetitive proteins – Coiled-coils . . . 27
1.4.2 Problem type 2: Large families of closely related pro-
teins – the Rab family of small GTPases . . . . . . . . . 30
1.5 Outline of the thesis . . . . . . . . . . . . . . . . . . . . . . . . 33
References . . . . . . . . . . . . . . . . . . . . . . . . . . . . . . . . 36
2 Evolutionary patterns in coiled-coils 51
2.1 Introduction . . . . . . . . . . . . . . . . . . . . . . . . . . . . 53
2.2 Materials and Methods . . . . . . . . . . . . . . . . . . . . . . 55
2.2.1 Data Sets . . . . . . . . . . . . . . . . . . . . . . . . . 55
2.2.2 Protein Sequence Alignment . . . . . . . . . . . . . . . 55
2.2.3 Protein Sequence Conservation . . . . . . . . . . . . . 56
ix
2.2.4 Model Estimation . . . . . . . . . . . . . . . . . . . . . 56
2.2.5 Model Validation . . . . . . . . . . . . . . . . . . . . . 58
2.2.6 Model Partitioning . . . . . . . . . . . . . . . . . . . . 58
2.2.7 Homology Detection . . . . . . . . . . . . . . . . . . . 59
2.3 Results . . . . . . . . . . . . . . . . . . . . . . . . . . . . . . . 60
2.3.1 Sequence Conservation of Coiled-Coils . . . . . . . . . 60
2.3.2 Substitution Model . . . . . . . . . . . . . . . . . . . . 62
2.3.3 Phylogenetic Inference with the CC Model . . . . . . . 65
2.3.4 Model Partitioning . . . . . . . . . . . . . . . . . . . . 66
2.3.5 Homology Detection . . . . . . . . . . . . . . . . . . . 67
2.4 Discussion . . . . . . . . . . . . . . . . . . . . . . . . . . . . . 72
References . . . . . . . . . . . . . . . . . . . . . . . . . . . . . . . . 76
Appendix . . . . . . . . . . . . . . . . . . . . . . . . . . . . . . . . 81
2.A Supplementary figures . . . . . . . . . . . . . . . . . . . . . . 81
3 Coiled-coil length: Size does matter 83
3.1 Introduction . . . . . . . . . . . . . . . . . . . . . . . . . . . . 85
3.2 Materials and Methods . . . . . . . . . . . . . . . . . . . . . . 87
3.2.1 Data . . . . . . . . . . . . . . . . . . . . . . . . . . . . 87
3.2.2 Coiled-coil prediction . . . . . . . . . . . . . . . . . . 87
3.2.3 Protein alignment . . . . . . . . . . . . . . . . . . . . . 87
3.2.4 Length variation . . . . . . . . . . . . . . . . . . . . . 87
3.2.5 Sequence conservation . . . . . . . . . . . . . . . . . . 87
3.2.6 Gene set enrichment analysis (GSEA) . . . . . . . . . . 88
3.3 Results . . . . . . . . . . . . . . . . . . . . . . . . . . . . . . . 88
3.3.1 Coiled-coil domain length is conserved . . . . . . . . . 88
3.3.2 Size conservation is weakly correlated with sequence sim-
ilarity . . . . . . . . . . . . . . . . . . . . . . . . . . . 92
3.3.3 Coiled-coil length conservation is widespread . . . . . . 92
3.3.4 Length conservation is functionally specific . . . . . . . 94
3.3.5 3D-size is conserved in coiled-coils . . . . . . . . . . . 95
3.4 Discussion . . . . . . . . . . . . . . . . . . . . . . . . . . . . . 96
References . . . . . . . . . . . . . . . . . . . . . . . . . . . . . . . . 99
Appendix . . . . . . . . . . . . . . . . . . . . . . . . . . . . . . . . 103
x
3.A Supplementary tables . . . . . . . . . . . . . . . . . . . . . . . 103
3.B Supplementary figures . . . . . . . . . . . . . . . . . . . . . . 103
4 Rabifier2 105
4.1 Introduction . . . . . . . . . . . . . . . . . . . . . . . . . . . . 107
4.2 Rabifier2 & RabDB2 . . . . . . . . . . . . . . . . . . . . . . . 107
4.2.1 Overview . . . . . . . . . . . . . . . . . . . . . . . . . 107
4.2.2 Improvements – performance . . . . . . . . . . . . . . 108
4.2.3 Improvements – access . . . . . . . . . . . . . . . . . . 109
4.3 Conclusions . . . . . . . . . . . . . . . . . . . . . . . . . . . . 110
References . . . . . . . . . . . . . . . . . . . . . . . . . . . . . . . . 111
Appendix . . . . . . . . . . . . . . . . . . . . . . . . . . . . . . . . 113
4.A Supplementary figures . . . . . . . . . . . . . . . . . . . . . . 113
5 Are there Rab GTPases in Archaea? 115
5.1 Introduction . . . . . . . . . . . . . . . . . . . . . . . . . . . . 117
5.2 Results . . . . . . . . . . . . . . . . . . . . . . . . . . . . . . . 119
5.2.1 Multiple Rab-like sequences in Archaea . . . . . . . . . 119
5.2.2 Inconclusive phylogenetic positioning of Archaeal Rab-
like sequences . . . . . . . . . . . . . . . . . . . . . . 119
5.2.3 Rab-like proteins contain typical eukaryotic Rab motifs . 122
5.2.4 Rab-like proteins are structurally similar to eukaryotic
Rabs . . . . . . . . . . . . . . . . . . . . . . . . . . . 123
5.2.5 A Rab Escort Protein/GDP Dissociation Inhibitor ances-
tor in Archaea . . . . . . . . . . . . . . . . . . . . . . . 126
5.3 Discussion . . . . . . . . . . . . . . . . . . . . . . . . . . . . . 129
5.4 Materials and Methods . . . . . . . . . . . . . . . . . . . . . . 133
5.4.1 Sequences . . . . . . . . . . . . . . . . . . . . . . . . . 133
5.4.2 Protein sequence alignments . . . . . . . . . . . . . . . 133
5.4.3 Phylogeny reconstruction . . . . . . . . . . . . . . . . . 133
5.4.4 Sequence analysis . . . . . . . . . . . . . . . . . . . . 134
5.4.5 Protein structure prediction . . . . . . . . . . . . . . . . 134
References . . . . . . . . . . . . . . . . . . . . . . . . . . . . . . . . 135
Appendix . . . . . . . . . . . . . . . . . . . . . . . . . . . . . . . . 141
xi

5.A Supplementary tables . . . . . . . . . . . . . . . . . . . . . . . 141
5.B Supplementary figures . . . . . . . . . . . . . . . . . . . . . . 141
6 Discussion 147
6.1 A brief summary . . . . . . . . . . . . . . . . . . . . . . . . . 149
6.2 Outlook . . . . . . . . . . . . . . . . . . . . . . . . . . . . . . 151
References . . . . . . . . . . . . . . . . . . . . . . . . . . . . . . . . 156
xii

Chapter 1
Protein properties and evolution
Abstract Chapter 1
P roteins, linear polymers built by a limited set of amino acids, gen-
erate an enormous variety of forms and functions. Many methods
have been developed to describe and catalogue this diversity. Yet, their
performance is often limited by neglecting protein-specific properties. In
this chapter, we introduce concepts related to protein classification by
evolutionary inference. We first review and discuss the basic methods
used in molecular evolution, that is, putative homology detection using
sequence similarity as a proxy, multiple sequence alignments, and phy-
logeny reconstruction, followed by their applications and a description
of automated methods. In the following section, we describe properties
that define the accessible space of protein evolution. The available space
of protein structures is virtually infinite, yet, the observed proteins cover
only its tiny fraction. It is a result of constraints imposed on the sequence,
necessary to preserve protein structure and function. The presence of
such restraints, specific to each protein, alters the information content of
a sequence that can be used for evolutionary inference. We conclude by
describing two ‘difficult’ protein classes, challenging for an evolutionary
analysis, that are the objects of studies in the remainder of this thesis.
Author contribution: I reviewed the literature and wrote the chapter.
1.1. Introduction 3
1.1 Introduction
P roteins are fundamental building blocks of life. They are involved in virtu-
ally all biological processes, their function ranges from catalyzing diverse
biochemical reactions to providing the internal structure of the cell. Since their
discovery, proteins are at a main focus of the molecular biology research. The ar-
rival of the insulin sequence in early 1950s (Sanger and Tuppy 1951a; Sanger
and Tuppy 1951b), the first full protein to be ever sequenced, demonstrated
that proteins can be characterized by a linear combination of amino acids, the
building blocks of every protein (reviewed by, Stretton 2002). In the following
years, Sanger and co-workers obtained insulin sequences from a few different
species allowing for a comparative sequence analysis, which revealed that the
interspecies amino acid differences are confined to a single short region (Harris
et al. 1956). Since then, millions of proteins have been sequenced1; for example,
more than 40 million unique proteins have been deposited in the UniProt data-
base (UniProt Consortium 2015). Continuous growth in the amount of sequence
information allowed for comparative protein analyses and, given sequences of
related proteins from different species, sequence-based evolutionary analyses
(molecular traits can be used to reconstruct phylogenetic trees similarly to the
morphological features). In this chapter, we review the literature and describe
the advances in the field of molecular evolution with a special focus on protein
evolution. We first describe the importance of the evolutionary analysis and the
common methods used for the evolutionary inference. We then focus on pro-
tein properties and discuss how they can influence the analysis. We conclude
the chapter by describing problems and challenges in evolutionary inference and
discuss two cases of ‘difficult’ protein classes, which are the subject of the re-
maining chapters.
1.1.1 Biological classification: from organisms to molecules
Humans have always been intrigued by the natural diversity of living things and
tried to catalogue this diversity by describing relationships between organisms.
1In contrast to the early approaches, protein sequences are generally predicted from the corre-sponding genomic DNA and mRNA sequences.

4 Chapter 1. Protein properties and evolution
The first major attempt to classify living things was proposed by Aristotle. He
grouped organisms based on their common features, for example, he separated
animals into two groups: ‘animals with blood’ and ‘animals without blood’, he
further divided the former into ‘live-bearing’ and ‘egg-bearing’. These groups
were arranged into a ranked linear structure based on their complexity of struc-
ture and function, scala naturae (‘ladder of life’), organisms ranked higher on
the ladder showed greater ability to move and sense. The first modern classifica-
tion system of living things was proposed by Carl Linnaeus in the 18th century.
In this system, each organism is represented by a list of ranked terms: Organ-
isms that share morphological similarities are grouped together into a taxon of a
given taxonomic rank; low-ranked taxa are then grouped into higher level taxa to
form a nested hierarchical structure, a taxonomy (reviewed, e.g., by Sivarajan and
Robson 1991; Ohl 2007). A major breakthrough in the biological classification
system came with the inception of the evolutionary theory. The incorporation of
the evolutionary theory into the biological classification created a modern system
based on the evolutionary relationships between species (both living and extinct)
rather than similarities in morphology. The theory introduced the temporal di-
mension to the taxonomy, which allowed asking questions not only about how
organisms are related to each other but also how distant they are, that is, when
(and what) was their common ancestor. In this system, species that share a com-
mon ancestor are organized into groups, called clades, that form a hierarchical
structure – a tree describing the evolutionary history of this group of organisms
(reviewed, e.g., by Queiroz and Gauthier 1994).
Predicting true evolutionary relationships between organisms using compara-
tive morphology can be especially challenging, for example, due to the presence
of analogous morphological traits (outcomes of convergent evolution) that group
together unrelated species. The recent revolution in molecular biology offers a
new set of features that can be used to infer evolutionary relationships between
species – nucleotide and peptide sequences. Sequences corresponding to the ho-
mologous genes, proteins or other fragments (e.g. RNA, non-coding DNA) in
multiple species can be treated as arrays of traits and used to build phylogenetic
trees representing relationships and distances between species. Molecular data
helped, for example, to solve the giant panda’s phylogeny (morphological data
1.1. Introduction 5
was inconclusive about panda’s classification with bears, raccoons or as a sepa-
rate family), placing it at the base of the Ursidae family (O’Brien et al. 1985).
The use of sequence data in building the biological classification of the liv-
ing things have largely replaced morphological information; it also marks the in-
ception of a new discipline, molecular evolution, whose applications go beyond
reconstructing species histories. Molecular evolution is an area of evolutionary
biology that studies evolutionary changes at the DNA, RNA and protein level
and the mechanisms that drive those changes (Li 1997). Proteins, similarly to
species, can be classified into hierarchical groups based on their common ances-
try, which is usually predicted from sequence similarities (related proteins often
share other similarities, e.g., structure, function). However, inferring protein evo-
lutionary histories is often challenging, due to a limited amount of information
present in the sequence and complex relationships between proteins (sequences
can arise not only by speciation but also by duplication events, they can be lost
from a genome or incorporated by horizontal gene transfer; reviewed, e.g., by
Koonin 2015). Hence, accurate methods are required to recover true relation-
ships between proteins.
1.1.2 Motivation
The methods of molecular evolution are not only suitable to resolve evolution-
ary histories of species or protein families, they also allow addressing a wide
range of biological questions. For example, to find mutations likely to be asso-
ciated with diseases (e.g., Fleming et al. 2003), in epidemiology to predict the
viral evolution (e.g., Bush 1999), to predict protein functional sites (e.g., La et
al. 2005), in drug design (reviewed by Searls 2003), to predict protein structure
and function (protein structure and function are usually conserved across homo-
logues, reviewed by Gabaldón and Koonin 2013). However, the final result of
those analyses depends on accurate detection of homologous sequences and cor-
rect mapping of evolutionary relationships between them. Many methods have
been developed to address these issues (a generic framework for molecular evo-
lutionary inference is the subject of section 1.2), which are successful in average
applications. Yet, the performance of generic methods can often be limited by
complex structures of protein families and specific molecular properties of dif-

6 Chapter 1. Protein properties and evolution
ferent protein classes, which impose specific constraints on sequence evolution
(e.g., intrinsically disordered proteins, Brown et al. 2010).
In this thesis, we analysed how specific molecular properties influence pro-
tein evolutionary trajectory by examining two protein classes that challenge the
existing methods for molecular evolution: the coiled-coils – widespread pro-
tein domains formed by a simple repetitive peptide motif; Rab small GTPases
– closely related proteins forming a large family with a complex structure. Based
on this analysis, we developed new tools and proposed changes to the existing
methods that improve homology detection and evolutionary analysis of coiled-
coil proteins and Rab GTPases. We used some of these developments to study
the origin of the eukaryotic endomembrane trafficking system.
1.2 Methods of molecular evolution
The methods of molecular evolution are used to describe the evolutionary process
that generates the observed molecular variation at the sequence level. A common
goal of an analysis is to identify proteins that originated from a common ancestor
(homologues) either in the species of interest or in all available sequence data.
Yet, even if the objective is more specific, detection of homologous sequences is
the necessary initial step, which determines the accuracy of the consecutive steps
of the analysis. In fact, each step of the analysis pipeline should be evaluated, as
any error will propagate to the subsequent steps of the pipeline and influence the
final result (e.g., Anisimova, Liberles, et al. 2013).
The classical phylogenetic analysis pipeline is usually divided into four steps
(Holder and Lewis 2003; Anisimova, Liberles, et al. 2013): identification of ho-
mologous sequences, construction of a multiple sequences alignment, tree es-
timation, and hypothesis testing on the constructed phylogeny. In this thesis
we mainly focus on two of these steps, that is, identification of the homolo-
gous/orthologous sequences and estimation of phylogenetic trees. We develop
dedicated models and tools to improve inference accuracy in the context of anal-
ysed protein classes. In this section, however, we describe and discuss all stages
of the molecular evolutionary analysis. Although we specifically focus on se-
quence evolution at the protein level, most of the techniques also apply to the
DNA sequences (some methods apply even to other types of data, for example,
1.2. Methods of molecular evolution 7
phylogenetic trees can be constructed based on sequences of morphological char-
acters, e.g., Lewis 2001).
1.2.1 Sequence search
The goal of the first step of an evolutionary analysis is the identification of pu-
tative homologous sequences. Proteins related by the common descent are ex-
pected to share common features, including similarities at the sequence level.
The premise of higher sequence similarity between related than unrelated pro-
teins is at the core of the homology detection methods. Arguably the most popu-
lar method is BLAST (Basic Local Alignment Search Tool, Altschul et al. 1990;
Altschul 1997; Camacho et al. 2009), a very fast search tool based on pairwise
local alignments, which allows scanning large sequence databases. However,
the algorithm loses sensitivity at larger evolutionary distances (high sequence
divergence); this deficiency can be improved by using multiple homologous se-
quences as a query instead of relying on pairwise comparisons (Park et al. 1998;
Madera 2002). Such sequences can be identified in an iterative search, where
the initial search detects similar sequences used to build a scoring profile that is
subsequently used to detect more distant sequences (e.g., PSI-BLAST, Altschul
1997). Even more sensitive methods (Madera 2002) use profile hidden Markov
models (pHMMs) that combine probabilities of both character substitutions and
insertion/deletion events at each position of a sequence to improve search accu-
racy (Krogh et al. 1994; Eddy 1996; Eddy 1998). This approach for similarity
search has been implemented in, for example, SAM (Hughey and Krogh 1996;
Karplus et al. 1998) and HMMER (http://hmmer.org). These similarity-based
methods identify putative homologues. Homologues are related to one another
in several ways (see fig. 1.1) and methods based solely on sequence similarity
comparisons can predict some of these relationships.
Orthologues are genes that originated from a single ancestral gene by spe-
ciation; (out)-paralogues are a product of a duplication event preceding a given
speciation event (Fitch 1970, fig. 1.1). This definition implies that orthologues
should be more similar to one another than to their paralogues (orthologues have
less time for divergence); hence, sequence similarity can be used to predict or-
thology. However, this assumption can be violated; for example, Koski and Gold-
8 Chapter 1. Protein properties and evolution
human �
human �'
platypus � x
mouse �
platypus �
human �
mouse �
x
in-paralogues
out-
para
logues
co-o
rtholo
gues
ort
holo
gues
hom
olo
gues
x
duplication
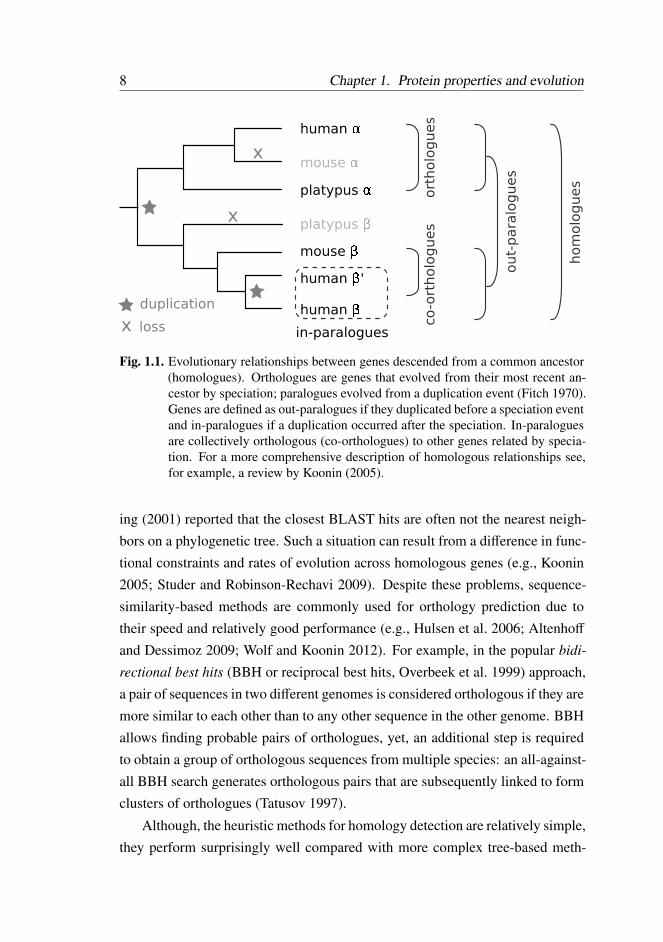
loss
Fig. 1.1. Evolutionary relationships between genes descended from a common ancestor(homologues). Orthologues are genes that evolved from their most recent an-cestor by speciation; paralogues evolved from a duplication event (Fitch 1970).Genes are defined as out-paralogues if they duplicated before a speciation eventand in-paralogues if a duplication occurred after the speciation. In-paraloguesare collectively orthologous (co-orthologues) to other genes related by specia-tion. For a more comprehensive description of homologous relationships see,for example, a review by Koonin (2005).
ing (2001) reported that the closest BLAST hits are often not the nearest neigh-
bors on a phylogenetic tree. Such a situation can result from a difference in func-
tional constraints and rates of evolution across homologous genes (e.g., Koonin
2005; Studer and Robinson-Rechavi 2009). Despite these problems, sequence-
similarity-based methods are commonly used for orthology prediction due to
their speed and relatively good performance (e.g., Hulsen et al. 2006; Altenhoff
and Dessimoz 2009; Wolf and Koonin 2012). For example, in the popular bidi-
rectional best hits (BBH or reciprocal best hits, Overbeek et al. 1999) approach,
a pair of sequences in two different genomes is considered orthologous if they are
more similar to each other than to any other sequence in the other genome. BBH
allows finding probable pairs of orthologues, yet, an additional step is required
to obtain a group of orthologous sequences from multiple species: an all-against-
all BBH search generates orthologous pairs that are subsequently linked to form
clusters of orthologues (Tatusov 1997).
Although, the heuristic methods for homology detection are relatively simple,
they perform surprisingly well compared with more complex tree-based meth-
1.2. Methods of molecular evolution 9
ods (reviewed by Kristensen et al. 2011). They offer several advantages over
tree-based methods (e.g., Kuzniar et al. 2008). They are usually much faster and
easier to automate, which makes them especially useful for large datasets. Being
based on pairwise comparisons, they avoid errors associated with the construc-
tion of multiple sequence alignments, gene, and species trees. Yet, similarity-
based methods have several limitations. For example, BBH is susceptible to
taxon-specific gene loss, where it can erroneously assign orthology relationships
(e.g., Dessimoz et al. 2006; Scannell et al. 2006); for instance, in the example
presented in figure 1.1, genes from the mouse and platypus pair would be clas-
sified as orthologous (as the most similar hits in both genomes) due the loss of
complementing paralogues. Similarly, BBH also fails to identify many ortho-
logues in duplication-rich taxa (e.g., Dalquen and Dessimoz 2013). Heuristic
similarity-based methods are generally more suited for comparative studies; they
are unable to provide a detailed description of the evolutionary process that gen-
erated observed sequences.
A more general problem in sequence similarity detection is about the search
sensitivity and specificity. Failing to identify the correct sequences and includ-
ing unrelated hits impairs both heuristic and tree-based methods for homology
assignment. Although finding the best compromise between search sensitivity
and specificity is a general problem, it is especially pronounced in some specific
cases. For example, an increase in search sensitivity of homologous proteins with
highly divergent sequences will also greatly increase the number of false posi-
tives. Homology detection in the ‘twilight zone’ of sequence similarity (20–35%
of sequence identity between protein sequences) is challenging (Rost 1999); ho-
mologous proteins may share little sequence similarity despite having highly con-
served structures, which greatly reduces the accuracy of sequence-based methods
(Brenner et al. 1998). A similar problem of low accuracy is caused by low-
complexity sequences often composed of amino acid repeats. High but random
sequence similarities between non-homologous low-complexity regions increase
the probability of finding unrelated proteins by chance (Forslund and Sonnham-
mer 2009). For that reason, low-complexity regions are often masked in the sim-
ilarity search, for example, in BLAST using the SEG algorithm (Wootton and
Federhen 1993). The removal of this dubious information should decrease the
10 Chapter 1. Protein properties and evolution
number of false hits, yet, it also reduces the search sensitivity, especially when
the low-complexity regions span a significant part of the protein.
1.2.2 Sequence alignment
Given a set of candidate homologous sequences, the next step in the analysis is
the construction of a multiple sequence alignment. An alignment of biological se-
quences is formed by inserting gaps of varying length into sequences to form an
array where each column contains homologous residues: a given column is a hy-
pothesis that all residues at this position descended from a common ancestor. The
problem of finding an optimal multiple sequence alignment (MSA) can be solved
with a dynamic programming algorithm. However, the computational complex-
ity grows exponentially with the number of sequences, O(ln) where l is the av-
erage sequence length (Carrillo and Lipman 1988). Many heuristic algorithms
have been developed over the years to address this issue. The most widely used
methods are based on a progressive approach developed by Hogeweg and Hes-
per (1984). This algorithm is based on a two-step procedure. In the initial step,
the pairwise distances are calculated between all sequences to form a similarity
matrix, which is subsequently used to construct a guide tree using a distance-
based method (distance-based methods for tree estimation are described in sec-
tion 1.2.3). In the second step, the sequences are successively pairwise-aligned,
according to the branching pattern of the guide tree, to form the final MSA. Pair-
wise alignments are calculated between two sequences, a sequence and a profile
or two profiles (for internal nodes) using the accurate Needleman-Wunsch global
dynamic programming algorithm (Needleman and Wunsch 1970). Thompson,
Higgins, et al. (1994) implemented this progressive algorithm in ClustalX, the
most widely used software for aligning multiple sequences (and one of the top-
cited research papers of all time, Van Noorden et al. 2014). The progressive
algorithm allows to quickly construct large alignments, yet, it does not guarantee
to find a globally optimal MSA; finding an optimal alignment for early branches
may prevent from reaching the global optimum for the entire MSA, where these
early branches align suboptimally (Thompson, Higgins, et al. 1994). One way
to correct this problem is to use an iterative approach, where a new guide tree
is constructed from the initial MSA to build a more accurate MSA, the two-step

1.2. Methods of molecular evolution 11
procedure is repeated until convergence (e.g., Katoh 2002; Edgar 2004). Sev-
eral other methods have been proposed to improve MSA accuracy, for example,
T-Coffee (Notredame et al. 2000), MUSCLE (Edgar 2004), Probalign (Roshan
and Livesay 2006), Clustal Omega (Sievers et al. 2014). These methods differ in
the accuracy of the estimated MSA and computation speed (slower methods usu-
ally produce more accurate alignments). In this thesis, we mainly used MAFFT
(Katoh and Standley 2013), a computationally efficient method that offers high
MSA accuracy (Ahola et al. 2006; Nuin et al. 2006; Sievers et al. 2014; Thomp-
son, Linard, et al. 2011).
Protein structure is generally better conserved than sequence. Hence, the pro-
cess of sequence alignment may benefit from including structural information.
An experimental structure(s) of a sufficiently similar protein can serve as a tem-
plate for the alignment; gap insertions at structure-altering positions should be
rejected. However, if direct experimental data is unavailable, the alignment esti-
mation may be reinforced with information from secondary structure predictions
(e.g., PSIPRED, Jones 1999) and 3D structures of homologous proteins (3DCof-
fee, O’Sullivan et al. 2004); both sets of information are used in PROMALS3D
(Pei et al. 2008).
Widely used aligners find an optimal MSA by maximizing similarities be-
tween sequences for a given set of scoring parameters (substitution and gap
penalty). However, such alignment may not reflect correct evolutionary relation-
ships between sequences. A different class of aligners referred to as ‘phylogeny-
aware aligners’, constructs instead an MSA that gives the most likely phylogeny.
For instance, PRANK (Loytynoja and Goldman 2005; Loytynoja and Goldman
2008), one of the first phylogeny-aware methods, distinguishes insertions from
deletions yielding more accurate MSAs that better reflect the underlying phy-
logeny. SATé (Liu, Raghavan, et al. 2009) improves the MSA accuracy by co-
estimation of a sequence alignment with a phylogenetic tree within the maxi-
mum likelihood framework. Similarly, BAli-Phy uses Bayesian inference for
simultaneous estimation of both alignment and phylogeny (Suchard and Redel-
ings 2006). These methods, do not solely minimize score penalties by reducing
the number of gaps, but rather bring gaps back into the evolutionary context to
reflect the insertion/deletion events.

12 Chapter 1. Protein properties and evolution
Multiple sequence alignments are central to many sequence-based analyses
including phylogenetics, domain characterization and motif search; the outcome
of these analyses is strongly dependent on the accuracy of the alignment. Hence,
it is important to determine the overall alignment quality and find unreliable,
highly variable often gap-rich, regions. In fact, removing such unreliable posi-
tions often leads to an improvement in the downstream analysis (Talavera and
Castresana 2007). Different methods have been developed to analyse sequence
alignments (measure its quality and robustness) and find low-quality regions (for
example, Castresana 2000; Capella-Gutierrez et al. 2009; Wu et al. 2012; Sela
et al. 2015).
1.2.3 Phylogeny reconstruction
The goal of the phylogenetic reconstruction is to find the most probable hypothe-
sis describing the evolution of a set of sequences – the phylogenetic tree. In this
section, we briefly describe the most popular methods for phylogenetic inference
and discuss their advantages and disadvantages.
A simple approach to determine the relationships between sequences is to use
the maximum parsimony optimality criterion. The maximum parsimony method
searches for the shortest possible (most parsimonious) tree, that is a tree that
accounts for the fewest possible changes between sequences (Fitch 1971). Al-
though it is easy to count the number of changes for a given tree topology, the
method requires exploring the entire topology space to find the most parsimo-
nious tree, which is impractical for large alignments2. This method is conceptu-
ally simple and does not require any model of molecular evolution. This, how-
ever, may be problematic as all substitutions have equal weight, which in many
cases can produce wrong results. Due to its design, the method always finds the
shortest tree, often underestimating the true number of substitutions between se-
quences (multiple substitutions can occur at a single position), especially at long
evolutionary distances (Saitou 1989).
A different class of methods is based on pairwise distances between sequences.
2The number of tree topologies grows exponentially with the number of sequences. Exhaustivesearch is possible only for a few sequences, for medium-sized alignments the “branch and bound”algorithm can be used to find the optimal tree. Yet, for even larger samples it is necessary to useheuristic algorithms that do not guarantee to find the best solution.
1.2. Methods of molecular evolution 13
In the simplest form, the distance can be expressed as the number of residue dif-
ferences, either nucleotide or amino acid, between two sequences. This approach
transforms a sequence alignment into a symmetric matrix of pairwise distances.
The distance matrix can be subsequently processed with widely used clustering
algorithms (e.g. UPGMA (Sokal and Michener 1958), Neighbor-Joining (Saitou
and Nei 1987)) to produce a hierarchical structure – a phylogenetic tree represent-
ing the relationships between the species. The branch lengths of the constructed
tree should approximate the pairwise distances of the distance matrix. Neighbor-
Joining (NJ) is a fast algorithm, it is especially suitable for large alignments or
for a bootstrap analysis, its execution time is proportional to the cube of the num-
ber of sequences, O(n3) (Studier and Keppler 1988). Distance based methods
have several problems and limitations. For example, the NJ algorithm does not
guarantee to construct tree branches with non-negative lengths if the distance
matrix is non-additive (Kuhner and Felsenstein 1994). NJ does not explore the
available topology space and compare different trees, compared to the methods
described below, its outcome is a single tree. Hence, it is not possible to analyse
other high-scoring trees that could support an alternative hypothesis about the
homologous relationships between sequences (see, e.g., Gascuel and Steel 2006,
for a review about NJ).
Assigning equal scores to all residue changes may result in incorrect phylo-
genies. The observed number of changes is often smaller than the real number,
especially at longer evolutionary distances or higher rates of evolution: mul-
tiple substitutions occurring at the same position in the sequence result in an
underestimation of the observed distance between sequences (Jukes and Can-
tor 1969). Both the stationary amino acid frequencies in protein sequences and
the substitution rates between them differ for each amino acid according to its
chemical and physical properties. For example, substitutions within polar, neg-
atively/positively charged, hydrophobic and aromatic groups are less prone to
influence structural and functional properties of a protein than substitutions be-
tween the groups. As a result, they are more frequent than the substitutions likely
to alter protein structure or function. To get a better estimate of the evolutionary
process that shapes protein sequences one needs to account for the patterns (fre-
quencies) of amino acid substitutions. This is achieved using substitution models
14 Chapter 1. Protein properties and evolution
that describe probabilities (rates) of changes for each pair of amino acids, or nu-
cleotides in the case of DNA (some models also exist for codon substitutions,
see e.g., Goldman and Yang 1994). Box 1.1 describes substitution models in a
greater detail. Substitution models can be used to compute distances between
sequences (Felsenstein 1989) to account for the type of the observed changes,
which should result in a more accurate estimation of the real evolutionary dis-
tance.
The probabilistic methods of phylogenetic inference, Maximum Likelihood
(ML) (Felsenstein 1981) and Bayesian inference (Rannala and Yang 1996; Yang
and Rannala 1997), offer many improvements over maximum parsimony and the
distance-based methods. Yet, the improvements provided by these methods come
at a much greater computational cost (only the recent growth of computational
power enabled the inference of large phylogenies in reasonable time). In the ma-
jority of cases, the probabilistic methods provide a more accurate estimate for
phylogenetic trees (see, e.g., Kuhner and Felsenstein 1994; Spencer 2005; Og-
den and Rosenberg 2006). ML and Bayesian methods infer phylogenetic trees di-
rectly using information contained in the sequence alignment in contrast with the
distance methods. As a result, no information is lost in the process of data trans-
formation from an alignment to pairwise distances between sequences. These
methods define probabilistic frameworks that are used to find the best tree for
the given alignment by exploring the available topology space. Every inspected
tree is scored, so the outcome of the analysis is, in fact, a collection of trees, each
with a confidence value assigned to it. Maximum Likelihood and Bayesian meth-
ods explore the parameter space to find the best set of parameters for the given
data. Tree topology and branch lengths are a subset of these parameters, arguably
the most interesting outcome of the analysis. However, other parameters must
be provided (or derived from the data) to compute the phylogeny. The crucial
set of parameters describe expected residue frequencies and the probabilities of
residue substitutions; it is defined by substitution models (Box 1.1). Many mod-
els have been defined for different protein classes to obtain optimal phylogenetic
estimates. Choosing an appropriate model is crucial; using a wrong model can
result in incorrect inference (Bruno and Halpern 1999). For example, Williams
and Embley (2014) showed that a poorly fitting substitution model can support

1.2. Methods of molecular evolution 15
a wrong hypothesis – Eukaryotes being a sister group to Archaea (Rinke et al.
2013). This demonstrates the importance of adjusting model parameters to ac-
count for specific sequence properties. Some additional parameters can also be
specified to improve inference. For example, positions in the alignment can be
divided into groups by their rate of evolution to account for the difference in
substitution rates along the sequence; this is usually accomplished by defining
several categories following the gamma distribution whose shape parameter (α)
can be co-estimated from the data (Yang 1996).
Box 1.1 Models of molecular evolution
Models of molecular evolution, or substitution models, describe the pro-
cess where one character replaces another (substitution) in a sequence of
characters of a given alphabet (e.g. nucleotides, amino acids). The mod-
els are usually represented in a form of a square transition matrix where
each element ai j describes the probability (rate) of change from the char-
acter i to j. The size of the matrix equals to the length of the alphabet.
Substitution models belong to two categories: mechanistic and empirical.
Parameters of mechanistic models are derived from the knowledge about
the fundamental processes that guide sequence evolution. Conversely,
parameter values of empirical models are estimated from alignments of
real sequences, without considering factors that led to the observed sub-
stitutions. A simple mechanistic model for DNA may define two parame-
ters that distinguish rates of transitions and transversions (Kimura 1980).
In the Maximum Likelihood framework, the values of both parameters
are simultaneously estimated with the parameters for tree topology and
branch lengths to maximize the probability of the model for the given
data. Mechanistic models are mostly defined for DNA and codons; at
the protein level, evolutionary processes are usually described with em-
pirical models. The first widely used model of amino acid substitution,
PAM (Point Accepted Mutation), was proposed by Dayhoff et al. (1978).
In this model, the substitution rates were estimated by counting changes
between closely related sequences. Yet, this approach ignores informa-
16 Chapter 1. Protein properties and evolution
tion from sequences separated by longer evolutionary distances. Recent
methods use the Maximum Likelihood framework to estimate substitu-
tion rates from large datasets covering different evolutionary distances.
For example, the widely used general WAG (Whelan and Goldman 2001)
and LG (Le and Gascuel 2008) models. Some models were designed to
address specific conditions, for example, a model for proteins encoded by
the mitochondrial DNA (Adachi and Hasegawa 1996) or even specifically
mitochondrial proteins from Arthropoda (Abascal et al. 2006).
Selecting a good model for given sequences can be difficult. How-
ever, it is possible, within the likelihood framework, to compare models
and select one that provides the best fit to the data. This can be achieved
by comparing likelihoods and the number of parameters for each model
using measures like AIC (Akaike information criterion, Akaike 1974) or
BIC (Bayesian information criterion, Schwarz 1978). The assumption
of independent evolution at each position in the sequence allows assign-
ing multiple best-fitting models to a protein (an approach named model
partitioning) to reflect a difference in the evolutionary process between
protein regions.
1.2.4 Applications
The final result of the phylogenetic reconstruction is an evolutionary tree – a
hypothesis describing the evolutionary process that generated the observed se-
quences from the common ancestor. Given the reconstructed gene/protein phy-
logeny and the corresponding species tree, it is possible to map homology re-
lationships (orthology, paralogy) between sequences in the process of tree rec-
onciliation (Goodman et al. 1979). In the parsimony framework, the process
minimizes the number of gene duplications and losses necessary to inscribe the
gene tree into the species tree (this and other algorithms for tree reconciliation
are described by Doyon et al. 2011).
Arguably the most common application of phylogenetic methods is the recon-
struction of species and gene/protein trees. Yet, these methods allow addressing
many other questions, below we briefly describe two further examples (see, e.g.,

1.2. Methods of molecular evolution 17
Holder and Lewis 2003, for more examples).
Trees inferred with Maximum Parsimony, Maximum Likelihood or Bayesian
methods (i.e. methods operating directly on sequence information, character-
based methods) contain estimates of the ancestral state at each of the internal
branches. This information presents an interesting opportunity to infer sequences
of ancient proteins. In fact, multiple reports describe not only theoretical predic-
tions but synthesis, or ‘resurrection’, of ancient proteins, based on the phyloge-
netic reconstruction, and subsequent exploration of their properties and function.
For example, Gaucher et al. (2008) showed higher thermostability of ancient
elongation factors, which coincided with Earth hotter environment. For more
examples and additional information see Thornton (2004).
Multiple substitution models can be compared to determine which one is
the best fit for the given sequence data. This approach can also be used for hy-
pothesis testing about the data. For instance, it is possible to detect selection by
comparing two nested models where one allows for sites under positive selec-
tion, another does not. If the more complex model, which includes selection, is
substantially better that the simpler one (as measured with likelihood ratio test,
AIC, or BIC) it is possible to conclude that some sites are under selection in
the analysed sequence (for more information see, e.g., Huelsenbeck et al. 1997;
Anisimova, Bielawski, et al. 2001; Yang 1998). For example, Gibbs and Rossiter
(2008) showed that venom coding genes in rattlesnakes are rapidly evolving by
positive selection; similarly, Bulmer and Crozier (2006) described positive selec-
tion in termite immunity genes.
1.2.5 Automatic methods
The traditional approach to the evolutionary analysis of sequence data involves
extensive manual interaction: each step (i.e. homology detection, sequence align-
ment, tree reconstruction) is run and validated by a human expert. The outcome
of such approach is expected to be more accurate than the result of an automatic
analysis. Yet, it often depends on subjective choices and is difficult to reproduce.
An alternative solution is to run the analysis using fully automated pipelines that
provide objective rules and verifiable results. Removing the ‘human factor’ from
the pipeline also enables to map evolutionary relationships between thousands of
18 Chapter 1. Protein properties and evolution
proteins across hundreds of species. Many tools and databases, which differ in
the applied methodology, taxonomic sampling, and performance, have been de-
veloped over the years. These methods can be divided into two categories: graph-
based methods that cluster orthologues based on their sequence similarities (e.g.,
COG, Tatusov (2000); EggNOG, Powell et al. (2014)) and phylogenetic tree-
based methods (e.g., PhylomeDB, Huerta-Cepas et al. 2014); hybrid approaches
combine both graph- and tree-based methods on different stages of the pipeline
(e.g., Ensembl Compara, Cunningham et al. 2015, generates sequence clusters
based on a BLAST-similarity-search graph, which are subsequently aligned and
used to build phylogenetic trees; finally the gene trees are reconciled with a
species tree to map duplication evens). Automatic methods allow annotating
full genomes, which is especially important given the recent developments in the
DNA sequencing technologies that greatly reduce the effort and time of obtaining
new genomes, often making the analysis and annotation the limiting step.
1.3 Protein space, constraints, and information content
The pipeline, described in the former section, provides a general framework for
a phylogenetic analysis. Yet, the details of an analysis may differ depending on
specific properties of a given protein. In this section we will describe factors
that may influence the evolutionary trajectory of a protein and as a consequence
require adjustments to the phylogenetic analysis.
1.3.1 Protein space
Theoretically, given that every position in a sequence can be occupied by one of
the 20 amino acids, the number of possible proteins grows exponentially with the
length (n) of the polypeptide chain (20n). For example, a relatively short peptide
of 100 residues can be built by 20100, or approximately 1.27 × 10130, different
sequences. This demonstrates that the ‘protein universe’, i.e. the space of all
possible proteins, is vast (Holm and Sander 1996). Yet, proteins are not free to
explore all possible states of their sequences; they are constrained by multiple
factors including structure, function, biophysical properties, interactions, local
and external environment. In the following sections, we describe how some of
1.3. Protein space, constraints, and information content 19
these factors influence protein evolution and, as a consequence, the challenges
they present to the evolutionary analysis. Yet, first, we describe the properties of
the observed protein space.
Proteins are composed of domains, continuous stretches of amino acids with
distinct structure, function and evolutionary history. A simple protein may con-
sist of only a single domain, yet, multi-domain proteins are more common (Te-
ichmann et al. 1998; Vogel et al. 2004). The same domain may exist in multiple
different proteins, its combinations with other domains form unique domain ar-
chitectures. Different architectures are formed by duplication, divergence, and
recombinations of existing domains (reviewed by Vogel et al. 2004). New protein
functions can arise from domain combinations, which differ from the functions of
single-domain proteins (Bashton and Chothia 2007). Domains are classified into
families: a domain family contains small single-domain proteins and fragments
of larger proteins that have arisen from the common ancestor. The distribution
of domain family sizes in individual genomes (and larger taxonomic groups) is
highly skewed, it follows the power-law distribution: a few families have many
members, the remaining families have only a few members. The family size dis-
tribution can be explained by a stochastic model of domain birth (duplication)
and death (loss) (see, e.g., Qian et al. 2001; Karev et al. 2002).
Most proteins require being properly folded into a three-dimensional struc-
ture in order to perform their function and interact with their partners (only 2-3%
of prokaryotic and 20-30% eukaryotic proteins contain long intrinsically disor-
dered regions, Dunker et al. 2001; Ward et al. 2004; Schlessinger et al. 2011).
Despite the enormous size of the universe of possible protein structures, a sur-
prisingly small space is used by nature. At the time of writing, the PDB database
(Protein Data Bank, http://www.rcsb.org) contains 36642 unique structures3, yet,
the total number of structural folds is estimated only in the order of thousands
(Wolf, Grishin, et al. 2000; Govindarajan et al. 1999) (for more information con-
cerning protein structural classification see Box 1.2). This implies that proteins
are restricted to a limited space of structural folds, which largely constrains their
sequence evolution. Indeed, the analysis of the available protein structures shows
that the observed protein folds occupy only four regions of the sparsely populated
3Non-redundant structures at 95% of sequence identity; at 70% the number of unique structuresdrops to 31986.
20 Chapter 1. Protein properties and evolution
protein structure space (Hou et al. 2003). These regions roughly correspond to
the four classes defined, in the SCOP classification, by their secondary structure
composition: all-α, all-β, α+β, α/β (see Box 1.2).
Box 1.2 Protein structural classification
Proteins are classified into different levels of organization that reflect
their structural and sequential similarities and evolutionary relatedness.
The SCOP (Structural Classification of Proteins) classification system
(Murzin et al. 1995), based on proteins with known three-dimensional
structures, provides a comprehensive description of structural and evolu-
tionary relationships between proteins. It classifies proteins into a number
of hierarchical levels, where family, superfamily, fold, and class are the
principal ones.
1. Family: Proteins classified at the family level are clearly evolu-
tionary related. They share high sequence similarity, the pairwise
sequence identity is usually greater than 30%. However, in some
cases, despite very low pairwise sequence similarity, proteins are
classified into a family based on similar function and high struc-
tural similarity, for example, globins.
2. Superfamily: Proteins are not necessarily related at the superfamily
level. Pairwise sequence similarities are low, yet, similarities in
structure and function suggest a common origin.
3. Fold: Proteins share a common fold if they have the same major
secondary structures in the same arrangement and the same topo-
logical connections. However, proteins with the same fold may
differ in peripheral secondary structure elements, which may com-
pose a substantial part of the entire protein. Despite the structural
similarity proteins that belong to a common fold, may not share a
common evolutionary origin, they may have evolved independently
to a similar fold as a consequence of similar physical and chemical
1.3. Protein space, constraints, and information content 21
conditions favoring certain structural arrangements.
4. Class: At the class level groups are formed based on the secondary
structure content and organization, that is, proteins formed only by
α-helices (all-α), only by β-strands (all-β), both α-helices and β-
strands that are largely segregated (α+β), and interspersed (α/β).
The SCOP classification is used by other services, for example, the SU-
PERFAMILY database (Gough et al. 2001) that builds hidden Markov
models based on SCOP superfamilies to annotate proteins in more than
2400 genomes. Alternative systems of protein structural classification
exist, for example, the CATH hierarchic classification of protein domain
structures (Orengo et al. 1997).
1.3.2 Structural constraints in protein evolution
Evolutionary processes that govern protein evolution are constrained by struc-
tural requirements of a protein to perform its function. Constraints differ not
only across protein families but also between different regions of a single pro-
tein. They depend on multiple factors that vary along the sequence (e.g., solvent
accessibility, local structure of the peptide chain) that define a local environment
of each residue in a folded protein, determining amino acid mutability at that
position (Overington, Johnson, et al. 1990; Overington, Donnelly, et al. 2008).
Regions of an amino acid sequence assemble into elements of secondary
structure that interact with each other, folding into a native, three-dimensional
protein structure. The most common secondary structure elements are classi-
fied into four types (α-helices, β-sheets, loops, and coils) based on the spatial
arrangement of the chain, defined by the dihedral angles of the peptide bond.
The space of energetically allowed dihedral angles differs for each amino acid;
it can be represented with the Ramachandran plot (Ramachandran et al. 1963).
To achieve a thermodynamically stable state, each class of secondary structure is
biased towards amino acids that allow angles required by the class. As a result,
amino acid substitution rates are constrained by the structural requirements of the
secondary structure. The difference in rates can be used to improve phylogenetic
22 Chapter 1. Protein properties and evolution
inference, for example, Thorne et al. (1996) developed a model that describes
the organization of the secondary structure along the sequence and substitution
rates for each structure.
Another factor that defines a local environment of an amino acid is solvent
accessibility. The rate of amino acid substitutions greatly varies between pro-
tein regions depending on their exposition to the solvent. The lowest rate of
substitution is in the solvent-inaccessible core of a protein and the most con-
served residues are polar residues buried inside the core (Overington, Donnelly,
et al. 2008). Information about solvent accessibility enriches the description of
protein local environments; it can be used to improve models of protein evolu-
tion. For example, Goldman, Thorne, et al. (1998) extended the earlier approach
(Thorne et al. 1996) to not only account for the difference in substitution patterns
between secondary structure elements but also for the solvent accessibility of
these elements.
The third major factor that determines the properties of a local environment
are side-chain interactions (both with the main-chain NH and CO groups and
other side chains), for example, the most ubiquitous hydrogen bonds. These in-
teractions are essential for correct folding and protein stability. The ability to
form a hydrogen bond with the main-chain groups restricts the set of possible
substitutions; residues with non-polar side chains are unable to form hydrogen
bonds. Hydrogen bonds reinforce the relative positions of secondary structure
elements in the three-dimensional space. The maintenance of the overall struc-
ture of a protein (for example, at the superfamily level) requires conservation
of crucial inter-chain interactions, which poses additional constraints on amino
acid substitutions at these positions. Side-chain hydrogen bonds contribute to the
maintenance of protein structure not only directly, by forming polar interactions
between chains, but also by improving atom packing density in the protein core.
Polar groups that are hydrogen bonded occupy a smaller volume than the groups
without the bond. This, in turn, reduces the distances between atoms, which in-
creases van der Waals interactions leading to even higher stability (Schell et al.
2005). Such buried polar residues provide a large contribution to protein stabil-
ity (Pace 2001); they are more conserved than their surface counterparts, buried
polar residues that are not hydrogen bonded and even buried non-polar residues

1.3. Protein space, constraints, and information content 23
(Worth and Blundell 2009).
Evolutionary constraints on protein structure are a consequence of its func-
tion: proteins need to fold into native three-dimensional structures to perform
their functions. However, specific functions (for example, catalytic activity or
interaction with other molecules) impose additional constraints on local amino
acid properties. Residues that are closer in space to the functional site are more
conserved (Chelliah et al. 2004). Proximity to the active site poses an additional
constraint on amino acid substitutions; it should be included in the description of
local environments.
Ultimately, the constraints that define a local environment, and limit amino
acid substitutions, are a product of the secondary structure, solvent accessibility,
features of the global protein architecture and functional requirements. A good
characterization of local environments may improve identification and classifica-
tion of protein family members, or help in predicting important regions (inter-
actions, catalytic activity) of unknown proteins. Using entire information about
amino acid local environments in an evolutionary analysis of a protein family
may not be practical or even possible. However, understanding specific con-
straints of a protein or, at least, its regions may improve the analysis.
1.3.3 Information content
Sequences of DNA, RNA and proteins are carriers of biological information.
The amount of information, or informativeness, can be measured in different
ways. However, one of the most commonly used descriptions comes from the
information theory developed by Claude Shannon (Shannon 1948) that measures
information in terms of entropy of an object4. Entropy describes an uncertainty
(how much is not known) about a state of an object (a random variable); it is
defined as a weighted sum of log-probabilities of possible states of a random
variable5.
4A different measure (Kolmogorov complexity) defines information as the length of the short-est computer program that produces the observed sequence.
5Entropy is a subjective measure that depends on a given definition of the state space of theobject.
24 Chapter 1. Protein properties and evolution
H(X) = −n∑
i=1
p(xi) log p(xi) (1.1)
Conversely, information describes the amount of knowledge about the ob-
ject’s state; it allows to make a better prediction, than by chance, about the state
of a random variable. It is defined as the difference between the maximal entropy
(i.e. when nothing is known about the object, before the measurement) and the
observed remaining entropy (after the measurement).
I = Hmax − H(X) (1.2)
Information theory found many applications in analysing biological sequences.
For instance, the difference in information patterns along a genome (horizontal
information) can be used to distinguish coding from non-coding regions (Grosse
et al. 2000). Sequence information can also be used to improve the sequence
assembly process by clustering sequences bases on their mutual informativeness
(Otu and Sayood 2003). Here, we focus on the sequence information across
genomes (vertical information) that describes the evolutionary process.
Per-site information content can be calculated given an alignment of homol-
ogous sequences. The resulting profile provides a measure of conservation of
each position and is commonly used to construct sequence logos (Schneider and
Stephens 1990): a graphical representation of the alignment, where each position
is represented as a character stack, the height of each character corresponds to its
frequency at a given position and the height of the entire stack to the position’s
informativeness. Sequence logos are widely used in analysis and visualization of
binding sites, conserved motifs, protein domains, and many other applications.
A certain level of sequence conservation is necessary for an accurate detec-
tion of putative homologous sequences and to construct a sequence alignment.
It is also necessary for phylogenetic inference, for example, to avoid tree recon-
struction artifacts like long-branch attraction (Felsenstein 1976). Yet, sequence
conservation is not a perfect measure of the sequence informativeness for a phy-
logenetic analysis; some divergence is necessary to determine relationships be-
tween sequences. The global difference is the rates of evolution have been used to
select appropriate genes to resolve polytomies at different evolutionary distances:
1.3. Protein space, constraints, and information content 25
highly conserved genes for ancient events and rapidly evolving for recent events.
Yet, the choice of those genes is often arbitrary, since the informativeness of the
genes is not quantified.
Townsend (2007) proposed a measure of phylogenetic informativeness: the
phylogenetic power to resolve evolutionary relationships at a given time during
evolution of a gene. A sequence needs to have parts that evolve at an appropri-
ate pace to resolve a branching pattern at a given time. Positions evolving too
slowly are unlikely to change on a given short internal branch, conversely, po-
sitions that are evolving too fast are likely to change also in one, or more, of
the descendant clades. Hence, the positions with the highest informativeness
for a given inner branch evolve at optimal intermediary rates that maximize the
probability of a change occurring at the branch and not at the tips. Phylogenetic
informativeness is ultimately a measure of the rate of character change at a given
time. For instance, codon positions differ in the substitution rates, the third (most
variable) position is the most informative about the recent events, first and sec-
ond about more ancient events (Townsend 2007). Phylogenetic informativeness
differs from the branch support estimates (e.g., bootstrap values, posterior prob-
ability); it measures the power of a set of characters to define clades at a given
evolutionary time, it does not show how much data support a particular clade.
The amount of phylogenetic information at a given time may also reveal if a short
branch is a result of a rapid radiation event or lack of appropriate data. High in-
formativeness and low branch support indicate rapid radiation, conversely, both
low informativeness and low support suggest insufficient data to resolve a given
polytomy.
Phylogenetic informativeness is a quantitative measure of the power of a set
of related sequences to resolve their evolutionary history. It can indicate possible
limitations to resolve events at a given range of temporal divergence, which can
help to redesign the analysis and interpret the result. It also provides means to
compare the informativeness of different protein families.

26 Chapter 1. Protein properties and evolution
1.4 Problems, limitations, and challenges in studying pro-
tein evolution
Last decades delivered numerous computational methods for evolutionary anal-
ysis which, combined with the ever-increasing computing power, largely im-
proved the accuracy of evolutionary inference of gene and protein family histo-
ries. However, there are still many limitation and problems. This section briefly
describes some of the major challenges and focuses specifically on problems re-
lated to the selected protein classes that are the subject of the following chapters.
Accurate homology prediction is essential for evolutionary analysis. A wide
array of computational tools has been developed to infer evolutionary relation-
ships between sequences. These methods provide general frameworks for homol-
ogy inference. Yet, they differ in many ways, including the underlying method-
ology, its accuracy, and taxonomic sampling, which often leads to different pre-
dictions. Efforts, like ‘The Quest for Orthologs’ (Kuzniar et al. 2008), have been
made to standardize, benchmark and ultimately advance homology (orthology)
prediction methods. However, the application of general methods is often lim-
ited, especially in some specific cases of ‘difficult’ proteins.
As described in the previous section (section 1.3.3), a certain minimal amount
of information is required for an accurate evolutionary inference. Hence, low-
complexity repetitive sequences are generally considered problematic for evo-
lutionary studies. Due to their low-informativeness, it is difficult to construct
accurate sequence alignments, resolve phylogenetic trees, and detect putative
homologues (unrelated proteins can converge into similar low-complexity repeti-
tive sequences). Another common source of low information content in proteins
is related to the level of sequence divergence; proteins lacking positions evolving
at optimal intermediate rates may not have enough information to resolve their
full evolutionary histories. This problem is especially pronounced in some large
protein families. Below we focus on two examples of those ‘difficult’ proteins
classes.

1.4. Problems, limitations, and challenges in studying protein evolution 27
1.4.1 Problem type 1: Repetitive proteins – Coiled-coils
Sequences of many proteins contain regions composed of multiple repetitions of
a peptide motif. Both the size of a single repetitive motif and its total number in a
protein can considerably vary across proteins. Sequence repeats are often consid-
ered challenging for evolutionary analysis due to their low complexity (Forslund
and Sonnhammer 2009). Here, we focus on one class of repetitive sequences,
the coiled-coils, motifs present in up to 10% of all proteins encoded in a genome
(Liu and Rost 2001).
Coiled-coils are relatively simple protein domains formed entirely by α-heli-
ces. Their sequence is built by a repetitive peptide pattern of seven amino acids
(a heptad motif), where two hydrophobic residues are separated by two and three
polar residues – (abcdefg)n, where a and d are hydrophobic while bcefg are po-
lar, (HPPHPPP)n. The length of a coiled-coil forming sequence can vary from
just three heptad repeats (21 residues) to thousands, forming the longest known
protein domains (e.g., giantin, Linstedt and Hauri 1993). The model of the coiled-
coil structure was first proposed in 1952 by Francis Crick in his seminal paper
(Crick 1952). In this model, two or more α-helices wrap around each other to
form a superhelix, the coiled-coil. The specificity of this interaction is an out-
come of the distinct nature of the coiled-coil motif: the coiled-coil sequence
folds into amphiphilic α-helical structures, a result of the preferential localiza-
tion of the hydrophobic residues (at the ad positions) only at a single side of
the helix (fig. 1.2a), such amphiphilic helices interact with each other via their
hydrophobic interfaces (in the hydrophilic environment of the cytoplasm). The
interaction is strengthened by the van der Waals contacts between site chains of
the hydrophobic residues at the a and d positions, known as knobs into holes
packing. The overall strength of the interaction can be further reinforced by
ionic bonds between charged side chains of amino acids at the e and g positions
(Burkhard et al. 2002). An example of a canonical coiled-coil domain, GNC4
leucine zipper, is shown in figure 1.2b. Although the heptad repeat is required
for the formation of the coiled-coil structure, it is often imperfect; polar residues
can occupy normally hydrophobic positions (e.g., in GCN4 eukaryotic transcrip-
tional activator protein, asparagine is located at a core a position), and vice versa
(see, e.g., Mason and Arndt 2004, for a review).
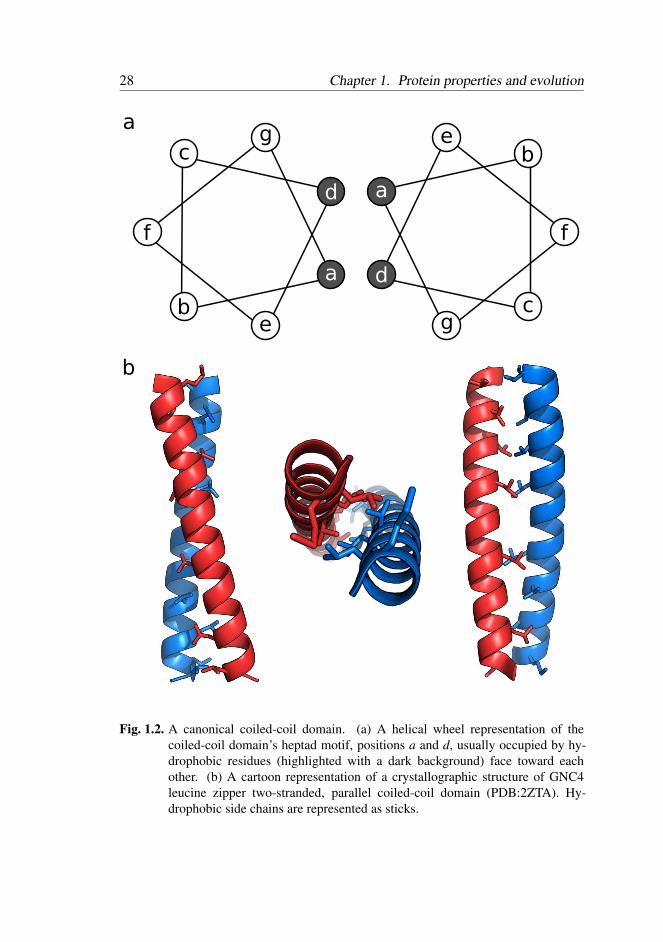
28 Chapter 1. Protein properties and evolution
a
a
d
gc
f
be
a
d
gc
f
be
b
Fig. 1.2. A canonical coiled-coil domain. (a) A helical wheel representation of thecoiled-coil domain’s heptad motif, positions a and d, usually occupied by hy-drophobic residues (highlighted with a dark background) face toward eachother. (b) A cartoon representation of a crystallographic structure of GNC4leucine zipper two-stranded, parallel coiled-coil domain (PDB:2ZTA). Hy-drophobic side chains are represented as sticks.
1.4. Problems, limitations, and challenges in studying protein evolution 29
The high prevalence of coiled-coils in proteins suggests that the domain is
involved in multiple molecular processes, for example, transcription regulation
(leucine zippers), chromatin dynamics (condensins, cohesins), endomembrane
trafficking (SNAREs, Golgins), motility (kinesins, dyneins, myosins), structur-
ing organelles (Bld10p and SAS-6 of the centrosome), among others. Coiled-coil
domains are often viewed as rigid rods that act as molecular spacers separating
functional domains, for example, the coiled-coil stalk domain of the motor pro-
teins that separates the motor domain (head) and the cargo-binding (tail) domain.
However, a coiled-coil region can be highly flexible, for example, in mitotic ki-
nesin centromere protein E (CENP-E) a very long (230nm) coiled-coil domain
provides a flexible, motile tether linking kinetochores to dynamic spindle micro-
tubules (Kim et al. 2008); long coiled-coils of the Golgi apparatus, important in
vesicle tethering, contribute to the specificity of the intracellular trafficking sys-
tem (Wong and Munro 2014). The structural properties of the coiled-coil domain
and its ability to form interactions with other proteins allow forming molecular
scaffolds of large complexes, for example, the cartwheel of the basal body.
The distinctive repetitive motif allows for a relatively easy detection of the
coiled-coil domain from the sequence data alone. The first computational method
for sequence-based coiled-coil domain prediction, COILS, was proposed by Lu-
pas et al. (1991). Later algorithms improved the accuracy of coiled-coil region
detection by applying more advanced tools, for example, hidden Markov mod-
els in MARCOIL (Delorenzi and Speed 2002), pairwise residue information in
Paircoil2 (McDonnell et al. 2006). Coiled-coil domains can be clustered based
on their topology, or oligomerization state, that is, the number of α-helices and
their orientation (parallel, anti-parallel). This criterion was used by Testa et al.
(2009) to create the ‘Periodic Table of Coiled-coil Structures’. Yet, such classi-
fication does not reflect the evolutionary relationships between proteins. Coiled-
coil structural data was further used, in a SUPERFAMILY-like approach, to de-
tect coiled-coil domains and predict their oligomeric states (SpiriCoil, Rackham
et al. 2010). SpiriCoil provides further improvements to the coiled-coil detection
problem. Although the method is restricted by the available structural data, it
provides some information about coiled-coil evolution: despite being build ac-
cording to the same principles, coiled-coil domains have independently arisen
30 Chapter 1. Protein properties and evolution
multiple times in evolution. The methods of coiled-coil region prediction use the
domain-specific properties to aid the prediction process. Yet, they do not provide
a comprehensive description of the unique properties of the heptad pattern (and
compare them with properties of other types of domains) that govern the evolu-
tionary process, which shapes the sequence and preserves the specific structure
of the domain. Such specific information should improve evolutionary inference
involving coiled-coil proteins. This is especially important for the accuracy of ho-
mology prediction; unrelated domains may evolve similar sequences, due to the
presence of similar constraints imposed by the simple heptad pattern, resulting
in incorrect homology assignments (e.g., Rose, Manikantan, et al. 2004; Rose,
Schraegle, et al. 2005; Zhang et al. 2009; Rackham et al. 2010; Walshaw et al.
2010; Azimzadeh et al. 2012).
1.4.2 Problem type 2: Large families of closely related proteins –
the Rab family of small GTPases
Sufficient amount of phylogenetic information is a prerequisite for an accurate
reconstruction of the evolutionary history of a protein family. To resolve a given
polytomy, sequences must contain positions evolving at appropriate rates (de-
scribed in section 1.3.3). Hence, the difficulty of an inference depends on se-
quence divergence, family structure, and its size (larger families require more
information to resolve more relationships). Here, we introduce the Rab family
of small GTPases, whose sequence properties and family structure challenge the
existing evolutionary methods.
Rabs are small (∼220 amino acid long) single-domain enzymes that belong
to the small GTPases of the Ras superfamily capable of binding and hydrolyzing
GTP (guanosine triphosphate) molecules. At the structural level, the small GT-
Pase domain is defined by the P-loop NTPase fold, a member of the α/β class:
the domain core formed mostly by parallel β-sheets is surrounded by α-helices
on both sides (fig. 1.3; see, e.g., Wennerberg et al. 2005, for a review about the
Ras superfamily). The P-loop NTPase fold, common to many families of GTP
and ATP-hydrolyzing enzymes, is the most widespread protein fold in most of
the cellular organisms, it is present in up to 18% of all proteins (Koonin et al.
2000). GTPases form a monophyletic group within P-loop NTPases which can

1.4. Problems, limitations, and challenges in studying protein evolution 31
be further divided into two groups, SIMBI (signal recognition particle, MinD,
and BioD) and TRAFAC (translation factors), each with a unique set of sequence
and structural signatures (Leipe et al. 2002). The Ras superfamily of small GT-
Pases belongs to the TRAFAC group. Ras-like proteins are present in all three
domains of life. Yet, they have largely expanded in Eukaryotes, where they are
usually divided into five major families (Arf, Rab, Ran, Ras, and Rho) involved
in signal transduction (see, e.g., Wuichet and Sogaard-Andersen 2015, for more
information about the prokaryotic small GTPases). Here, we focus on Rabs,
the largest family of small GTPases in Eukaryotes; the number of Rab coding
genes ranges from 7 in Schizosaccharomyces pombe, 11 in Saccharomyces cere-
visiae to approximately 60 in humans and Arabidopsis thaliana (Pereira-Leal
and Seabra 2001) and more than 100 in Entamoeba invadens (Nakada-Tsukui
et al. 2010).
Rab GTPases are key regulators of membrane trafficking in the eukaryotic
cell that provide specificity to the system: each Rab subfamily is associated with
a specific membrane compartment, its function is evolutionarily conserved (see,
e.g., Haubruck et al. (1989) and, for a review, Behnia and Munro (2005)). Rab
proteins cycle between the cytosol and their respective membrane compartment
(the ‘in’ and ‘out’ cycle) and switch between an ‘on’ (active, GTP-bound) and
‘off’ (inactive, GDP-bound) state. These two cycles regulate membrane traffick-
ing. After the translation, Rab protein binds to the REP chaperon (Rab Escort
Protein) which presents Rab to RabGGT (Rab geranylgeranyl transferase) that
catalyzes the addition of two geranylgeranyl (isoprenyl) lipid chains to the cys-
teine residues at the Rab C-terminus. It is subsequently anchored, with the iso-
prenyl chains, to the target membrane in its GDP-bound inactive state. GDP
is exchanged for GTP by GEF (guanine nucleotide exchange factor), which ac-
tivates the protein by changing the Rab conformation (the switch regions, see
fig. 1.3). This change is recognized by effector proteins that bind to Rab and
activate the respective pathway. Finally, Rab is inactivated by hydrolysing GTP
(the reaction is accelerated by GAP, GTPase-activating protein) and extracted
from the membrane by GDI (GDP dissociation inhibitor), REP homologue. For
more information concerning the Rab cycle regulation see, for example, Sten-
mark (2009), Kelly et al. (2012), and Pfeffer (2013).
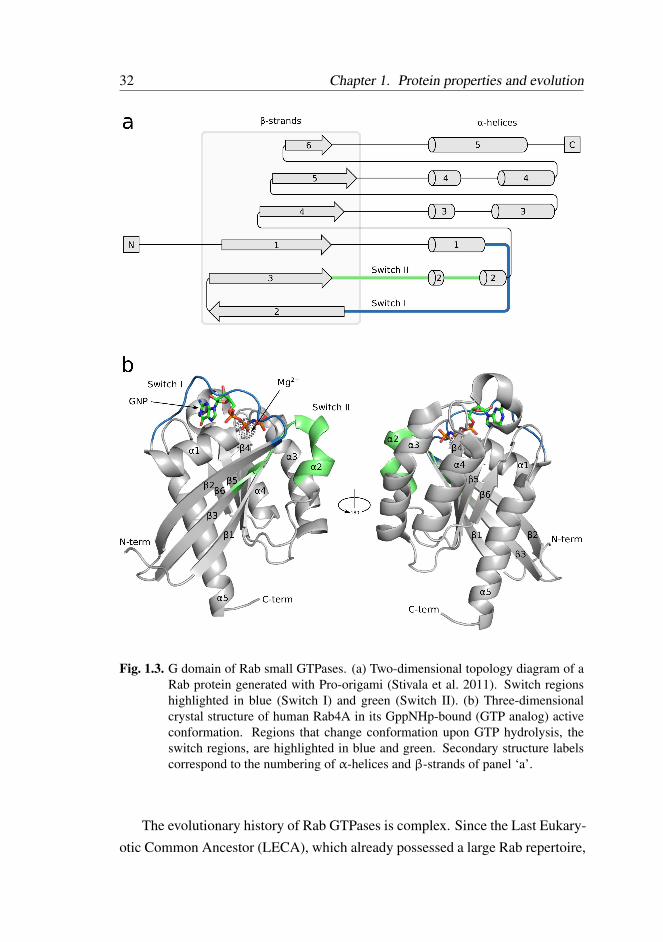
32 Chapter 1. Protein properties and evolution
180°
C-term
N-term
C-term
N-term
Switch I
Switch II
Mg2+
GNP
�1
�1 �1
�1
�2
�2
�3
�3
�2
�2�4 �4�3
�3
�5�5
�4
�4�6 �6
�5�5
Fig. 1.3. G domain of Rab small GTPases. (a) Two-dimensional topology diagram of aRab protein generated with Pro-origami (Stivala et al. 2011). Switch regionshighlighted in blue (Switch I) and green (Switch II). (b) Three-dimensionalcrystal structure of human Rab4A in its GppNHp-bound (GTP analog) activeconformation. Regions that change conformation upon GTP hydrolysis, theswitch regions, are highlighted in blue and green. Secondary structure labelscorrespond to the numbering of α-helices and β-strands of panel ‘a’.
The evolutionary history of Rab GTPases is complex. Since the Last Eukary-
otic Common Ancestor (LECA), which already possessed a large Rab repertoire,
1.5. Outline of the thesis 33
Rab-coding genes were a subject of multiple general and taxon-specific duplica-
tion and loss events (Diekmann et al. 2011; Elias et al. 2012). Rab sequences con-
tain both highly conserved central regions and variable flanking regions. Many
conserved positions correspond to regions critical for the nucleotide-binding and
catalytic activity (for example, the P-loop NTPases’ Walker motifs) that are com-
mon to all small GTPases. Yet, some conserved positions correspond to the
unique signatures of the Rab family, for example, the RabF (Rab Family) motifs
(Pereira-Leal and Seabra 2000). Despite sequence similarities, inferring evolu-
tionary relationships within small GTPases is difficult. Several studies attempted
to resolve the phylogeny of the Rab family and its position within the Ras su-
perfamily (Elias et al. 2012; Klöpper et al. 2012; Rojas et al. 2012). Yet, many
parts of the evolutionary tree of small GTPases remain unresolved, including
the relationships between Ras families and the early-branching Rab subfamilies
(low branch support, discrepancies between studies). This presents a problem for
protein classification into appropriate families and subfamilies of small GTPases,
that is, assigning correct orthology/paralogy relationships. These difficulties are
an outcome of an insufficient amount of information, for phylogenetic methods,
contained within the short sequence of the Rab protein: only a small number of
positions evolves at the optimal rate that is suitable to resolve ancient polytomies.
New approaches should be devised to address this issue. The improved methods
could, for example, improve the classification accuracy into Rab subfamilies (al-
lowing to predict the existence of specific trafficking pathways in a cell, which is
especially important for functional annotation of new genomes), and ultimately,
given enough data, shed light on the origin of Rabs (and the membrane traffick-
ing system) and other eukaryotic small GTPases.
1.5 Outline of the thesis
In this chapter, we have considered the problem of inferring protein evolution
in the context of their molecular properties. We reviewed the current state of
the available methods for analysing evolutionary histories of protein families,
discussed their problems and limitations. We also described the constraints im-
posed by structure and function on sequence evolution, which affect evolutionary
inference. Finally, we introduced two classes of ‘difficult’ proteins for an evolu-
34 Chapter 1. Protein properties and evolution
tionary analysis: coiled-coils, protein domains formed by a repetitive peptide
motif, that are often not evolutionarily related; Rab small GTPases, a family of
closely related proteins with a complicated history. In the following chapters,
we analyse the specific nature of these proteins in the evolutionary context. We
present improvements to existing models and methods that take into account
protein-specific properties, which increase the quality of the evolutionary analy-
sis and lead to interesting biological findings.
In chapter 2, we focus on the sequence evolution of coiled-coil proteins. We
begin the analysis by comparing coiled-coil domains with globular domains to
estimate the informativeness and evolutionary potential of the coiled-coil repet-
itive pattern. Subsequently, we develop a new model specifically tailored for
coiled-coil proteins, which allows comparing the unique substitution patterns of
coiled-coil repeats with those of globular domains. Lastly, we use the new model
to improve homology mapping of coiled-coil proteins.
We continue the study of coiled-coil domains in chapter 3, by complement-
ing the analysis of the sequence evolution with the analysis of structure evolution.
We test the hypothesis that the coiled-coil regions of a protein, unlike other struc-
tured elements, preserve their length in order to maintain the physical size of the
coiled-coil domain.
In chapter 4, we present an automatic pipeline for detection and classification
of Rab GTPases, the Rabifier2. This bioinformatic sequence-based classifier
uses a multiple-step procedure that, first, distinguishes Rabs from other small
GTPases and then assigns a specific subfamily to the predicted Rab. Rabifier2 is
a major update over the earlier work by Diekmann et al. (2011). It improves on
the annotation accuracy and delivers a substantial increase in speed, allowing to
quickly annotate hundreds of genomes.
The origin of the Rab family of small GTPases is unknown. We attempted
to shed some new light on the problem by predicting Rab GTPases in Archaea
(using the updated Rabifier pipeline), and specifically the recently sequenced
archaeal species, the Lokiarchaeaon, that possesses several eukaryotic features
(Spang et al. 2015). Chapter 5 describes a detailed analysis of Rab-like sequences
from Loki and other archaeal species. In this analysis, we combine sequence- and
structure-based methods to answer the question about the origin of Rab GTPases

1.5. Outline of the thesis 35
and the eukaryotic membrane-trafficking system.

36 Chapter 1. Protein properties and evolution
References
Abascal, F., Posada, D., and Zardoya, R. (2006). MtArt: A New Model of Amino
Acid Replacement for Arthropoda. Molecular Biology and Evolution 24, 1–
5.
Adachi, J. and Hasegawa, M. (1996). Model of amino acid substitution in pro-
teins encoded by mitochondrial DNA. Journal of Molecular Evolution 42,
459–468.
Ahola, V., Aittokallio, T., Vihinen, M., and Uusipaikka, E. (2006). No Title. BMC
Bioinformatics 7, 484.
Akaike, H. (1974). A new look at the statistical model identification. IEEE Trans-
actions on Automatic Control 19, 716–723.
Altenhoff, A. M. and Dessimoz, C. (2009). Phylogenetic and Functional Assess-
ment of Orthologs Inference Projects and Methods. PLoS Computational Bi-
ology 5, e1000262.
Altschul, S. F., Gish, W., Miller, W., Myers, E. W., and Lipman, D. J. (1990).
Basic local alignment search tool. Journal of Molecular Biology 215, 403–
410.
Altschul, S. (1997). Gapped BLAST and PSI-BLAST: a new generation of pro-
tein database search programs. Nucleic Acids Research 25, 3389–3402.
Anisimova, M., Bielawski, J. P., and Yang, Z. (2001). Accuracy and Power of the
Likelihood Ratio Test in Detecting Adaptive Molecular Evolution. Molecu-
lar Biology and Evolution 18, 1585–1592.
Anisimova, M., Liberles, D. a., Philippe, H., Provan, J., Pupko, T., and Haeseler,
A. von (2013). State-of the art methodologies dictate new standards for phy-
logenetic analysis. BMC Evolutionary Biology 13, 161.
Azimzadeh, J., Wong, M. L., Downhour, D. M., Alvarado, A. S., and Marshall,
W. F. (2012). Centrosome Loss in the Evolution of Planarians. Science 335,
461–463.
Bashton, M. and Chothia, C. (2007). The Generation of New Protein Functions
by the Combination of Domains. Structure 15, 85–99.
Behnia, R. and Munro, S. (2005). Organelle identity and the signposts for mem-
brane traffic. Nature 438, 597–604.
References 37
Brenner, S. E., Chothia, C., and Hubbard, T. J. P. (1998). Assessing sequence
comparison methods with reliable structurally identified distant evolutionary
relationships. Proceedings of the National Academy of Sciences 95, 6073–
6078.
Brown, C. J., Johnson, A. K., and Daughdrill, G. W. (2010). Comparing Models
of Evolution for Ordered and Disordered Proteins. Molecular Biology and
Evolution 27, 609–621.
Bruno, W. J. and Halpern, A. L. (1999). Topological bias and inconsistency of
maximum likelihood using wrong models. Molecular Biology and Evolution
16, 564–6.
Bulmer, M. S. and Crozier, R. H. (2006). Variation in positive selection in termite
GNBPs and relish. Molecular Biology and Evolution 23, 317–326.
Burkhard, P., Ivaninskii, S., and Lustig, A. (2002). Improving coiled-coil stability
by optimizing ionic interactions. Journal of Molecular Biology 318, 901–
910.
Bush, R. M. (1999). Predicting the Evolution of Human Influenza A. Science
286, 1921–1925.
Camacho, C., Coulouris, G., Avagyan, V., Ma, N., Papadopoulos, J., Bealer, K.,
and Madden, T. L. (2009). BLAST+: architecture and applications. BMC
Bioinformatics 10, 421.
Capella-Gutierrez, S., Silla-Martinez, J. M., and Gabaldon, T. (2009). trimAl: a
tool for automated alignment trimming in large-scale phylogenetic analyses.
Bioinformatics 25, 1972–1973.
Carrillo, H. and Lipman, D. (1988). The Multiple Sequence Alignment Problem
in Biology. SIAM Journal on Applied Mathematics 48, 1073–1082.
Castresana, J. (2000). Selection of Conserved Blocks from Multiple Alignments
for Their Use in Phylogenetic Analysis. Molecular Biology and Evolution
17, 540–552.
Chelliah, V., Chen, L., Blundell, T. L., and Lovell, S. C. (2004). Distinguishing
structural and functional restraints in evolution in order to identify interaction
sites. Journal of Molecular Biology 342, 1487–1504.
Crick, F. H. C. (1952). Is alpha-keratin a coiled coil? Nature 170, 882–883.
38 Chapter 1. Protein properties and evolution
Cunningham, F., Amode, M. R., Barrell, D., Beal, K., Billis, K., et al. (2015).
Ensembl 2015. Nucleic Acids Research 43, D662–D669.
Dalquen, D. a. and Dessimoz, C. (2013). Bidirectional Best Hits Miss Many Or-
thologs in Duplication-Rich Clades such as Plants and Animals. Genome
Biology and Evolution 5, 1800–1806.
Dayhoff, M., Schwartz, R., and Orcutt, B. (1978). A model of evolutionary change
in proteins. Atlas of Protein Sequence and Structure 5, 345–352.
Delorenzi, M. and Speed, T. (2002). An HMM model for coiled-coil domains and
a comparison with PSSM-based predictions. Bioinformatics 18, 617–625.
Dessimoz, C., Boeckmann, B., Roth, A. C. J., and Gonnet, G. H. (2006). Detect-
ing non-orthology in the COGs database and other approaches grouping or-
thologs using genome-specific best hits. Nucleic Acids Research 34, 3309–
3316.
Diekmann, Y., Seixas, E., Gouw, M., Tavares-Cadete, F., Seabra, M. C., and
Pereira-Leal, J. B. (2011). Thousands of Rab GTPases for the Cell Biologist.
PLoS Computational Biology 7, e1002217.
Doyon, J. P., Ranwez, V., Daubin, V., and Berry, V. (2011). Models, algorithms
and programs for phylogeny reconciliation. Briefings in Bioinformatics 12,
392–400.
Dunker, A. K., Lawson, J. D., Brown, C. J., Williams, R. M., Romero, P., Oh,
J. S., Oldfield, C. J., Campen, A. M., Ratliff, C. M., Hipps, K. W., Ausio, J.,
Nissen, M. S., Reeves, R., Kang, C., Kissinger, C. R., Bailey, R. W., Gris-
wold, M. D., Chiu, W., Garner, E. C., and Obradovic, Z. (2001). Intrinsically
disordered protein. Journal of Molecular Graphics and Modelling 19, 26–59.
Eddy, S. R. (1996). Hidden Markov models. Current Opinion in Structural Biol-
ogy 6, 361–365.
Eddy, S. R. (1998). Profile hidden Markov models. Bioinformatics 14, 755–763.
Edgar, R. C. (2004). MUSCLE: Multiple sequence alignment with high accuracy
and high throughput. Nucleic Acids Research 32, 1792–1797.
Elias, M., Brighouse, A., Gabernet-Castello, C., Field, M. C., and Dacks, J. B.
(2012). Sculpting the endomembrane system in deep time: high resolution
phylogenetics of Rab GTPases. Journal of Cell Science 125, 2500–2508.
References 39
Felsenstein, J. (1976). Cases in which Parsimony or Compatibility Methods Will
be Positively Misleading. Systematic Zoology 27, 401–410.
Felsenstein, J. (1981). Evolutionary trees from DNA sequences: A maximum
likelihood approach. Journal of Molecular Evolution 17, 368–376.
Felsenstein, J. (1989). PHYLIP - Phylogeny Inference Package (Version 3.2).
Cladistics 5, 163–166.
Fitch, W. M. (1970). Distinguishing Homologous from Analogous Proteins. Sys-
tematic Zoology 19, 99.
Fitch, W. M. (1971). Toward Defining the Course of Evolution: Minimum Change
for a Specific Tree Topology. Systematic Biology 20, 406–416.
Fleming, M. A., Potter, J. D., Ramirez, C. J., Ostrander, G. K., and Ostrander,
E. A. (2003). Understanding missense mutations in the BRCA1 gene: An
evolutionary approach. Proceedings of the National Academy of Sciences
100, 1151–1156.
Forslund, K. and Sonnhammer, E. L. L. (2009). Benchmarking homology detec-
tion procedures with low complexity filters. Bioinformatics 25, 2500–2505.
Gabaldón, T. and Koonin, E. V. (2013). Functional and evolutionary implications
of gene orthology. Nature Reviews Genetics 14, 360–366.
Gascuel, O. and Steel, M. (2006). Neighbor-joining revealed. Molecular Biology
and Evolution 23, 1997–2000.
Gaucher, E. a., Govindarajan, S., and Ganesh, O. K. (2008). Palaeotemperature
trend for Precambrian life inferred from resurrected proteins. Nature 451,
704–707.
Gibbs, H. L. and Rossiter, W. (2008). Rapid evolution by positive selection and
gene gain and loss: PLA 2 venom genes in closely related Sistrurus rat-
tlesnakes with divergent diets. Journal of Molecular Evolution 66, 151–166.
Goldman, N. and Yang, Z. (1994). A codon-based model of nucleotide substi-
tution for protein-coding DNA sequences. Molecular Biology and Evolution
11, 725–36.
Goldman, N., Thorne, J. L., and Jones, D. T. (1998). Assessing the impact of
secondary structure and solvent accessibility on protein evolution. Genetics
149, 445–58.
40 Chapter 1. Protein properties and evolution
Goodman, M., Czelusniak, J., Moore, G. W., Romero-Herrera, A. E., and Mat-
suda, G. (1979). Fitting the Gene Lineage into its Species Lineage, a Parsi-
mony Strategy Illustrated by Cladograms Constructed from Globin Sequences.
Systematic Biology 28, 132–163.
Gough, J., Karplus, K., Hughey, R., and Chothia, C. (2001). Assignment of ho-
mology to genome sequences using a library of hidden Markov models that
represent all proteins of known structure. Journal of Molecular Biology 313,
903–919.
Govindarajan, S., Recabarren, R., and Goldstein, R. a. (1999). Estimating the
total number of protein folds. Proteins 35, 408–414.
Grosse, I., Herzel, H., Buldyrev, S. V., and Stanley, H. E. (2000). Species inde-
pendence of mutual information in coding and noncoding DNA. Physical
Review E 61, 5624–5629.
Harris, J., Sanger, F., and Naughton, M. (1956). Species differences in insulin.
Archives of Biochemistry and Biophysics 65, 427–438.
Haubruck, H., Prange, R., Vorgias, C., and Gallwitz, D. (1989). The ras-related
mouse ypt1 protein can functionally replace the YPT1 gene product in yeast.
The EMBO Journal 8, 1427–1432.
Hogeweg, P. and Hesper, B. (1984). The alignment of sets of sequences and the
construction of phyletic trees: An integrated method. Journal of Molecular
Evolution 20, 175–186.
Holder, M. and Lewis, P. O. (2003). Phylogeny estimation: traditional and Bayesian
approaches. Nature Reviews Genetics 4, 275–284.
Holm, L. and Sander, C. (1996). Mapping the Protein Universe. Science 273,
595–602.
Hou, J., Sims, G. E., Zhang, C., and Kim, S.-H. (2003). A global representation
of the protein fold space. Proceedings of the National Academy of Sciences
100, 2386–2390.
Huerta-Cepas, J., Capella-Gutiérrez, S., Pryszcz, L. P., Marcet-Houben, M., and
Gabaldón, T. (2014). PhylomeDB v4: Zooming into the plurality of evolu-
tionary histories of a genome. Nucleic Acids Research 42, 897–902.
References 41
Huelsenbeck, J. P., Rannala, B., Felsenstein, J., Ou, C.-Y., Nichol, S. T., et al.
(1997). Phylogenetic Methods Come of Age: Testing Hypotheses in an Evo-
lutionary Context. Science 276, 227–232.
Hughey, R. and Krogh, A. (1996). Hidden Markov models for sequence analysis:
extension and analysis of the basic method. Bioinformatics 12, 95–107.
Hulsen, T., Huynen, M., Vlieg, J. de, and Groenen, P. (2006). Benchmarking
ortholog identification methods using functional genomics data. Genome Bi-
ology 7, R31.
Jones, D. T. (1999). Protein secondary structure prediction based on position-
specific scoring matrices. Journal of Molecular Biology 292, 195–202.
Jukes, T. H. and Cantor, C. R. (1969). Evolution of protein molecules. Mam-
malian Protein Metabolism. Vol. 3, 21–132.
Karev, G. P., Wolf, Y. I., Rzhetsky, A. Y., Berezovskaya, F. S., and Koonin, E. V.
(2002). Birth and death of protein domains: a simple model of evolution
explains power law behavior. BMC Evolutionary Biology 2, 18.
Karplus, K., Barrett, C., and Hughey, R. (1998). Hidden Markov models for
detecting remote protein homologies. Bioinformatics 14, 846–856.
Katoh, K. and Standley, D. M. (2013). MAFFT Multiple Sequence Alignment
Software Version 7: Improvements in Performance and Usability. Molecular
Biology and Evolution 30, 772–780.
Katoh, K. (2002). MAFFT: a novel method for rapid multiple sequence align-
ment based on fast Fourier transform. Nucleic Acids Research 30, 3059–
3066.
Kelly, E. E., Horgan, C. P., Goud, B., and McCaffrey, M. W. (2012). The Rab
family of proteins: 25 years on. Biochemical Society Transactions 40, 1337–
1347.
Kim, Y., Heuser, J. E., Waterman, C. M., and Cleveland, D. W. (2008). CENP-E
combines a slow, processive motor and a flexible coiled coil to produce an
essential motile kinetochore tether. The Journal of Cell Biology 181, 411–
419.
Kimura, M. (1980). A simple method for estimating evolutionary rates of base
substitutions through comparative studies of nucleotide sequences. Journal
of Molecular Evolution 16, 111–120.

42 Chapter 1. Protein properties and evolution
Klöpper, T. H., Kienle, N., Fasshauer, D., and Munro, S. (2012). Untangling the
evolution of Rab G proteins: implications of a comprehensive genomic anal-
ysis. BMC Biology 10, 71.
Koonin, E. V., Wolf, Y. I., and Aravind, L. (2000). Protein fold recognition us-
ing sequence profiles and its application in structural genomics. Advances in
Protein Chemistry 54, 245–75.
Koonin, E. V. (2005). Orthologs, paralogs, and evolutionary genomics. Annual
review of genetics 39, 309–38.
Koonin, E. V. (2015). Origin of eukaryotes from within archaea, archaeal eukary-
ome and bursts of gene gain: eukaryogenesis just made easier? Philosophical
Transactions of the Royal Society B: Biological Sciences 370, 20140333.
Koski, L. B. and Golding, G. B. (2001). The Closest BLAST Hit Is Often Not the
Nearest Neighbor. Journal of Molecular Evolution 52, 540–542.
Kristensen, D. M., Wolf, Y. I., Mushegian, A. R., and Koonin, E. V. (2011). Com-
putational methods for Gene Orthology inference. Briefings in Bioinformat-
ics 12, 379–391.
Krogh, A., Brown, M., Mian, I., Sjölander, K., and Haussler, D. (1994). Hidden
Markov Models in Computational Biology. Journal of Molecular Biology
235, 1501–1531.
Kuhner, M. K. and Felsenstein, J. (1994). A simulation comparison of phylogeny
algorithms under equal and unequal evolutionary rates. Molecular Biology
and Evolution 11, 459–468.
Kuzniar, A., Ham, R. C. van, Pongor, S., and Leunissen, J. A. (2008). The quest
for orthologs: finding the corresponding gene across genomes. Trends in Ge-
netics 24, 539–551.
La, D., Sutch, B., and Livesay, D. R. (2005). Predicting protein functional sites
with phylogenetic motifs. Proteins 58, 309–320.
Le, S. Q. and Gascuel, O. (2008). An Improved General Amino Acid Replace-
ment Matrix. Molecular Biology and Evolution 25, 1307–1320.
Leipe, D. D., Wolf, Y. I., Koonin, E. V., and Aravind, L. (2002). Classification
and evolution of P-loop GTPases and related ATPases. Journal of Molecular
Biology 317, 41–72.
References 43
Lewis, P. O. (2001). A Likelihood Approach to Estimating Phylogeny from Dis-
crete Morphological Character Data. Systematic Biology 50, 913–925.
Li, W. (1997). Molecular evolution, 487.
Linstedt, A. D. and Hauri, H. P. (1993). Giantin, a novel conserved Golgi mem-
brane protein containing a cytoplasmic domain of at least 350 kDa. Molecu-
lar Biology of the Cell 4, 679–693.
Liu, J. and Rost, B. (2001). Comparing function and structure between entire
proteomes. Protein Science 10, 1970–1979.
Liu, K., Raghavan, S., Nelesen, S., Linder, C. R., and Warnow, T. (2009). Rapid
and Accurate Large-Scale Coestimation of Sequence Alignments and Phylo-
genetic Trees. Science 324, 1561–1564.
Loytynoja, A. and Goldman, N. (2005). From The Cover: An algorithm for pro-
gressive multiple alignment of sequences with insertions. Proceedings of the
National Academy of Sciences 102, 10557–10562.
Loytynoja, A. and Goldman, N. (2008). Phylogeny-Aware Gap Placement Pre-
vents Errors in Sequence Alignment and Evolutionary Analysis. Science 320,
1632–1635.
Lupas, A., Van Dyke, M., and Stock, J. (1991). Predicting coiled coils from pro-
tein sequences. Science 252, 1162–1164.
Madera, M. (2002). A comparison of profile hidden Markov model procedures
for remote homology detection. Nucleic Acids Research 30, 4321–4328.
Mason, J. M. and Arndt, K. M. (2004). Coiled Coil Domains: Stability, Speci-
ficity, and Biological Implications. ChemBioChem 5, 170–176.
McDonnell, A. V., Jiang, T., Keating, A. E., and Berger, B. (2006). Paircoil2:
improved prediction of coiled coils from sequence. Bioinformatics 22, 356–
8.
Murzin, A. G., Brenner, S. E., Hubbard, T., and Chothia, C. (1995). SCOP: a
structural classification of proteins database for the investigation of sequences
and structures. Journal of Molecular Biology 247, 536–40.
Nakada-Tsukui, K., Saito-Nakano, Y., Husain, A., and Nozaki, T. (2010). Con-
servation and function of Rab small GTPases in Entamoeba: Annotation of
E. invadens Rab and its use for the understanding of Entamoeba biology. Ex-
perimental Parasitology 126, 337–347.
44 Chapter 1. Protein properties and evolution
Needleman, S. B. and Wunsch, C. D. (1970). A general method applicable to the
search for similarities in the amino acid sequence of two proteins. Journal of
Molecular Biology 48, 443–453.
Notredame, C., Higgins, D. G., and Heringa, J. (2000). T-coffee: a novel method
for fast and accurate multiple sequence alignment. Journal of Molecular Bi-
ology 302, 205–217.
Nuin, P. a. S., Wang, Z., and Tillier, E. R. M. (2006). The accuracy of several
multiple sequence alignment programs for proteins. BMC Bioinformatics 7,
471.
O’Brien, S. J., Nash, W. G., Wildt, D. E., Bush, M. E., and Benveniste, R. E. (1985).
A molecular solution to the riddle of the giant panda’s phylogeny. Nature 317,
140–144.
Ogden, T. H. and Rosenberg, M. S. (2006). Multiple sequence alignment accu-
racy and phylogenetic inference. Systematic biology 55, 314–28.
Ohl, M. (2007). Principles of taxonomy and classification: Current procedures
for naming and classifying organisms. Handbook of Paleoanthropology, 141–
166.
Orengo, C., Michie, A., Jones, S., Jones, D., Swindells, M., and Thornton, J.
(1997). CATH - a hierarchic classification of protein domain structures. Struc-
ture, 1093–1109.
O’Sullivan, O., Suhre, K., Abergel, C., Higgins, D. G., and Notredame, C. (2004).
3DCoffee: Combining protein sequences and structures within multiple se-
quence alignments. Journal of Molecular Biology 340, 385–395.
Otu, H. H. and Sayood, K. (2003). A divide-and-conquer approach to fragment
assembly. Bioinformatics 19, 22–29.
Overington, J., Donnelly, D., Johnson, M. S., Šali, A., and Blundell, T. L. (2008).
Environment-specific amino acid substitution tables: Tertiary templates and
prediction of protein folds. Protein Science 1, 216–226.
Overington, J., Johnson, M. S., Sali, A., and Blundell, T. L. (1990). Tertiary Struc-
tural Constraints on Protein Evolutionary Diversity: Templates, Key Residues
and Structure Prediction. Proceedings of the Royal Society B: Biological Sci-
ences 241, 132–145.
References 45
Overbeek, R., Fonstein, M., D’Souza, M., Pusch, G. D., and Maltsev, N. (1999).
The use of gene clusters to infer functional coupling. Proceedings of the
National Academy of Sciences 96, 2896–2901.
Pace, C. N. (2001). Polar group burial contributes more to protein stability than
nonpolar group burial. Biochemistry 40, 310–313.
Park, J., Karplus, K., Barrett, C., Hughey, R., Haussler, D., Hubbard, T., and
Chothia, C. (1998). Sequence comparisons using multiple sequences detect
three times as many remote homologues as pairwise methods. Journal of
Molecular Biology 284, 1201–1210.
Pei, J., Kim, B. H., and Grishin, N. V. (2008). PROMALS3D: A tool for multiple
protein sequence and structure alignments. Nucleic Acids Research 36, 2295–
2300.
Pereira-Leal, J. B. and Seabra, M. C. (2000). The mammalian Rab family of
small GTPases: definition of family and subfamily sequence motifs suggests
a mechanism for functional specificity in the Ras superfamily. Journal of
Molecular Biology 301, 1077–1087.
Pereira-Leal, J. B. and Seabra, M. C. (2001). Evolution of the Rab family of small
GTP-binding proteins. Journal of Molecular Biology 313, 889–901.
Pfeffer, S. R. (2013). Rab GTPase regulation of membrane identity. Current Opin-
ion in Cell Biology 25, 414–419.
Powell, S., Forslund, K., Szklarczyk, D., Trachana, K., Roth, A., Huerta-Cepas,
J., Gabaldón, T., Rattei, T., Creevey, C., Kuhn, M., Jensen, L. J., Mering, C.
von, and Bork, P. (2014). eggNOG v4.0: nested orthology inference across
3686 organisms. Nucleic Acids Research 42, D231–D239.
Qian, J., Luscombe, N. M., and Gerstein, M. (2001). Protein family and fold oc-
currence in genomes: power-law behaviour and evolutionary model. Journal
of Molecular Biology 313, 673–681.
Queiroz, K. de and Gauthier, J. (1994). Toward a phylogenetic system of biolog-
ical nomenclature. Trends in Ecology & Evolution 9, 27–31.
Rackham, O. J., Madera, M., Armstrong, C. T., Vincent, T. L., Woolfson, D. N.,
and Gough, J. (2010). The Evolution and Structure Prediction of Coiled Coils
across All Genomes. Journal of Molecular Biology 403, 480–493.
46 Chapter 1. Protein properties and evolution
Ramachandran, G., Ramakrishnan, C., and Sasisekharan, V. (1963). Stereochem-
istry of polypeptide chain configurations. Journal of Molecular Biology 7,
95–99.
Rannala, B. and Yang, Z. (1996). Probability distribution of molecular evolution-
ary trees: A new method of phylogenetic inference. Journal of Molecular
Evolution 43, 304–311.
Rinke, C., Schwientek, P., Sczyrba, A., Ivanova, N. N., Anderson, I. J., et al.
(2013). Insights into the phylogeny and coding potential of microbial dark
matter. Nature 499, 431–437.
Rojas, A. M., Fuentes, G., Rausell, A., and Valencia, A. (2012). The Ras protein
superfamily: Evolutionary tree and role of conserved amino acids. Journal
of Cell Biology 196, 189–201.
Rose, A., Manikantan, S., Schraegle, S. J., Maloy, M. A., Stahlberg, E. A., and
Meier, I. (2004). Genome-wide identification of Arabidopsis coiled-coil pro-
teins and establishment of the ARABI-COIL database. Plant Physiology 134,
927–939.
Rose, A., Schraegle, S. J., Stahlberg, E. a., and Meier, I. (2005). Coiled-coil pro-
tein composition of 22 proteomes–differences and common themes in sub-
cellular infrastructure and traffic control. BMC Evolutionary Biology 5, 66.
Roshan, U. and Livesay, D. R. (2006). Probalign: Multiple sequence alignment
using partition function posterior probabilities. Bioinformatics 22, 2715–2721.
Rost, B. (1999). Twilight zone of protein sequence alignments. Protein Engineer-
ing 12, 85–94.
Saitou, N. and Nei, M. (1987). The neighbor-joining method: a new method for
reconstructing phylogenetic trees. Molecular Biology and Evolution 4, 406–
25.
Saitou, N. (1989). A Theoretical Study of the Underestimation of Branch Lengths
by the Maximum Parsimony Principle. Systematic Biology 38, 1–6.
Sanger, F. and Tuppy, H. (1951a). The Amino-acid Sequence in the Phenylalanyl
Chain of Insulin 1. The Biochemical Journal 49, 463–81.
Sanger, F. and Tuppy, H. (1951b). The amino-acid sequence in the phenylalanyl
chain of insulin. 2. The investigation of peptides from enzymic hydrolysates.
The Biochemical Journal 49, 481–90.
References 47
Scannell, D. R., Byrne, K. P., Gordon, J. L., Wong, S., and Wolfe, K. H. (2006).
Multiple rounds of speciation associated with reciprocal gene loss in poly-
ploid yeasts. Nature 440, 341–345.
Schell, D., Tsai, J., Scholtz, J. M., and Pace, C. N. (2005). Hydrogen bonding in-
creases packing density in the protein interior. Proteins: Structure, Function,
and Bioinformatics 63, 278–282.
Schlessinger, A., Schaefer, C., Vicedo, E., Schmidberger, M., Punta, M., and
Rost, B. (2011). Protein disorder—a breakthrough invention of evolution?
Current Opinion in Structural Biology 21, 412–418.
Schneider, T. D. and Stephens, R. (1990). Sequence logos: a new way to display
consensus sequences. Nucleic Acids Research 18, 6097–6100.
Schwarz, G. (1978). Estimating the Dimension of a Model. The Annals of Statis-
tics 6, 461–464.
Searls, D. B. (2003). Pharmacophylogenomics: genes, evolution and drug targets.
Nature Reviews Drug Discovery 2, 613–623.
Sela, I., Ashkenazy, H., Katoh, K., and Pupko, T. (2015). GUIDANCE2: accurate
detection of unreliable alignment regions accounting for the uncertainty of
multiple parameters. Nucleic Acids Research 43, W7–W14.
Shannon, C. E. (1948). A mathematical theory of communication. The Bell Sys-
tem Technical Journal 27, 379–423.
Sievers, F., Wilm, A., Dineen, D., Gibson, T. J., Karplus, K., Li, W., Lopez, R.,
McWilliam, H., Remmert, M., Soding, J., Thompson, J. D., and Higgins,
D. G. (2014). Fast, scalable generation of high-quality protein multiple se-
quence alignments using Clustal Omega. Molecular Systems Biology 7, 539–
539.
Sivarajan, V. and Robson, N. (1991). Introduction to The Principles of Plant
Taxonomy. 292.
Sokal, R. R. and Michener, C. D. (1958). A statistical method for evaluating
systematic relationships. University of Kansas Scientific Bulletin 28, 1409–
1438.
Spang, A., Saw, J. H., Jørgensen, S. L., Zaremba-Niedzwiedzka, K., Martijn, J.,
Lind, A. E., Eijk, R. van, Schleper, C., Guy, L., and Ettema, T. J. G. (2015).
48 Chapter 1. Protein properties and evolution
Complex archaea that bridge the gap between prokaryotes and eukaryotes.
Nature 521, 173–179.
Spencer, M. (2005). Likelihood, Parsimony, and Heterogeneous Evolution. Molec-
ular Biology and Evolution 22, 1161–1164.
Stenmark, H. (2009). Rab GTPases as coordinators of vesicle traffic. Nature Re-
views Molecular Cell Biology 10, 513–525.
Stivala, A., Wybrow, M., Wirth, A., Whisstock, J. C., and Stuckey, P. J. (2011).
Automatic generation of protein structure cartoons with Pro-origami. Bioin-
formatics 27, 3315–3316.
Stretton, A. O. W. (2002). The first sequence. Fred Sanger and insulin. Genetics
162, 527–32.
Studer, R. A. and Robinson-Rechavi, M. (2009). How confident can we be that
orthologs are similar, but paralogs differ? Trends in Genetics 25, 210–216.
Studier, J. A. and Keppler, K. J. (1988). A note on the neighbor-joining algorithm
of Saitou and Nei. Molecular Biology and Evolution 5, 729–731.
Suchard, M. A. and Redelings, B. D. (2006). BAli-Phy: Simultaneous Bayesian
inference of alignment and phylogeny. Bioinformatics 22, 2047–2048.
Talavera, G. and Castresana, J. (2007). Improvement of Phylogenies after Re-
moving Divergent and Ambiguously Aligned Blocks from Protein Sequence
Alignments. Systematic Biology 56, 564–577.
Tatusov, R. L. (2000). The COG database: a tool for genome-scale analysis of
protein functions and evolution. Nucleic Acids Research 28, 33–36.
Tatusov, R. L. (1997). A Genomic Perspective on Protein Families. Science 278,
631–637.
Teichmann, S. A., Park, J., and Chothia, C. (1998). Structural Assignments to the
Mycoplasma Genitalium Proteins Show Extensive Gene Duplications and
Domain Rearrangements. Proceedings of the National Academy of Sciences
95, 14658–14663.
Testa, O. D., Moutevelis, E., and Woolfson, D. N. (2009). CC+: a relational data-
base of coiled-coil structures. Nucleic Acids Research 37, D315–D322.
Thompson, J. D., Linard, B., Lecompte, O., and Poch, O. (2011). A comprehen-
sive benchmark study of multiple sequence alignment methods: Current chal-
lenges and future perspectives. PLoS ONE 6.
References 49
Thompson, J. D., Higgins, D. G., and Gibson, T. J. (1994). CLUSTAL W: improv-
ing the sensitivity of progressive multiple sequence alignment through se-
quence weighting, position-specific gap penalties and weight matrix choice.
Nucleic Acids Research 22, 4673–4680.
Thorne, J. L., Goldman, N., and Jones, D. T. (1996). Combining protein evolution
and secondary structure. Molecular Biology and Evolution 13, 666–673.
Thornton, J. W. (2004). Resurrecting ancient genes: experimental analysis of ex-
tinct molecules. Nature Reviews Genetics 5, 366–375.
Townsend, J. P. (2007). Profiling Phylogenetic Informativeness. Systematic Biol-
ogy 56, 222–231.
UniProt Consortium (2015). UniProt: a hub for protein information. Nucleic
Acids Research 43, D204–D212.
Van Noorden, R., Maher, B., and Nuzzo, R. (2014). The top 100 papers. Nature
514, 550–553.
Vogel, C., Bashton, M., Kerrison, N. D., Chothia, C., and Teichmann, S. a. (2004).
Structure, function and evolution of multidomain proteins. Current Opinion
in Structural Biology 14, 208–216.
Walshaw, J., Gillespie, M. D., and Kelemen, G. H. (2010). A novel coiled-coil re-
peat variant in a class of bacterial cytoskeletal proteins. Journal of Structural
Biology 170, 202–215.
Ward, J. J., Sodhi, J. S., McGuffin, L. J., Buxton, B. F., and Jones, D. T. (2004).
Prediction and Functional Analysis of Native Disorder in Proteins from the
Three Kingdoms of Life. Journal of Molecular Biology 337, 635–645.
Wennerberg, K., Rossman, K. L., and Der, C. J. (2005). The Ras superfamily at
a glance. Journal of Cell Science 118, 843–846.
Whelan, S. and Goldman, N. (2001). A general empirical model of protein evo-
lution derived from multiple protein families using a maximum-likelihood
approach. Molecular Biology and Evolution 18, 691–699.
Williams, T. A. and Embley, T. M. (2014). Archaeal "Dark Matter" and the Ori-
gin of Eukaryotes. Genome Biology and Evolution 6, 474–481.
Wolf, Y. I., Grishin, N. V., and Koonin, E. V. (2000). Estimating the number of
protein folds and families from complete genome data. Journal of Molecular
Biology 299, 897–905.
50 Chapter 1. Protein properties and evolution
Wolf, Y. I. and Koonin, E. V. (2012). A tight link between orthologs and bidi-
rectional best hits in bacterial and archaeal genomes. Genome Biology and
Evolution 4, 1286–1294.
Wong, M. and Munro, S. (2014). The specificity of vesicle traffic to the Golgi is
encoded in the golgin coiled-coil proteins. Science 346, 1256898–1256898.
Wootton, J. C. and Federhen, S. (1993). Statistics of local complexity in amino
acid sequences and sequence databases. Computers & Chemistry 17, 149–
163.
Worth, C. L. and Blundell, T. L. (2009). Satisfaction of hydrogen-bonding po-
tential influences the conservation of polar sidechains. Proteins: Structure,
Function and Bioinformatics 75, 413–429.
Wu, M., Chatterji, S., and Eisen, J. A. (2012). Accounting For Alignment Uncer-
tainty in Phylogenomics. PLoS ONE 7. Ed. by M. Salemi, e30288.
Wuichet, K. and Sogaard-Andersen, L. (2015). Evolution and Diversity of the
Ras Superfamily of Small GTPases in Prokaryotes. Genome Biology and
Evolution 7, 57–70.
Yang, Z. and Rannala, B. (1997). Bayesian phylogenetic inference using DNA
sequences: a Markov Chain Monte Carlo Method. Molecular Biology and
Evolution 14, 717–724.
Yang, Z. (1996). Among-site rate variation and its impact on phylogenetic anal-
yses. Trends in Ecology & Evolution 11, 367–372.
Yang, Z. (1998). Likelihood ratio tests for detecting positive selection and appli-
cation to primate lysozyme evolution. Molecular Biology and Evolution 15,
568–573.
Zhang, H., Chen, J., Wang, Y., Peng, L., Dong, X., Lu, Y., Keating, A. E., and
Jiang, T. (2009). A Computationally Guided Protein-Interaction Screen Un-
covers Coiled-Coil Interactions Involved in Vesicular Trafficking. Journal of
Molecular Biology 392, 228–241.

Chapter 2
Evolutionary patterns in coiled-coils
Abstract Chapter 2
M odels of protein evolution are used to describe evolutionary pro-
cesses, for phylogenetic analyses and homology detection. Widely
used general models of protein evolution are biased toward globular do-
mains and lack resolution to describe evolutionary processes for other
protein types. As three-dimensional structure is a major constraint to
protein evolution, specific models have been proposed for other types of
proteins. Here, we consider evolutionary patterns in coiled-coil forming
proteins. Coiled-coils are widespread structural domains, formed by a
repeated motif of seven amino acids (heptad repeat). Coiled-coil form-
ing proteins are frequently rods and spacers, structuring both the intra-
cellular and the extracellular spaces that often form protein interaction
interfaces. We tested the hypothesis that due to their specific structure
the associated evolutionary constraints differ from those of globular pro-
teins. We showed that substitution patterns in coiled-coil regions are dif-
ferent than those observed in globular regions, beyond the simple heptad
repeat. Based on these substitution patterns we developed a coiled-coil
specific (CC) model that in the context of phylogenetic reconstruction
outperforms general models in tree likelihood, often leading to different
topologies. For multidomain proteins containing both a coiled-coil re-
gion and a globular domain, we showed that a combination of the CC
model and a general one gives higher likelihoods than a single model.
Finally, we showed that the model can be used for homology detection
to increase search sensitivity for coiled-coil proteins. The CC model,
software, and other supplementary materials are available at http://www.
evocell.org/cgl/resources.
This chapter has been published as: Jaroslaw Surkont and José B. Pereira-Leal.
(2015). Evolutionary Patterns in Coiled-Coils. Genome Biology and Evolution
7:545-556.
Author contribution: I conceived, designed and performed the experiments and
analysed the data. I wrote the paper together with José B. Pereira-Leal.
2.1. Introduction 53
2.1 Introduction
T he evolutionary trajectory of a protein is guided by structural and func-
tional requirements, resulting in constraints to its amino acid composition
and sequence. Thus, functional conservation often results in the conservation
of specific sequences. Conversely, multiple amino acid sequences can result in
the same three-dimensional (3D) structure, and thus proteins can accept muta-
tions without altering their biological function. This phenomenon is known as
protein structure designability, defined as the number of amino acid sequences
that have a single structure as their lowest-energy conformation (Emberly et al.
2002). As a result, certain amino acid substitutions are more likely to occur
than others in order to maintain a protein’s function and structure. Evolutionary
models, or substitution matrices, were developed to describe the probability of
one amino acid being replaced by another (reviewed in Thorne 2000). Descrip-
tive capabilities of a substitution model do not exhaust its applications. In the
classical phylogenetic analysis pipeline (Anisimova et al. 2013), an appropriate
model is essential for most if not all the stages: Identification of homologous
sequences, construction of a multiple sequence alignment, and phylogeny infer-
ence, which can be followed by more in-depth analyses like inference of sites
under selection. General empirical substitution models are mostly based on sol-
uble globular proteins. However, depending on the type of proteins under study,
different models are required, describing different constraints and evolutionary
trajectories. For example, Brown et al. (2010) show the difference between evo-
lution of proteins with well-defined 3D structure and disordered proteins, lacking
well-defined structure and long range interactions, by developing a model for un-
structured proteins. Another example is that of proteins encoded by organellar
genomes that share different genomic pressures from nuclear ones, prompting
Adachi and Hasegawa (1996) and Abascal et al. (2006) to propose models for
mitochondrial proteins; similarly Adachi, Waddell, et al. (2000) developed one
for chloroplasts. Yet another example is that of transmembrane proteins, where
the hydrophobic environment changes both amino acid composition and substitu-
tion patterns, requiring thus a specific evolutionary model (Ng et al. 2000). The
models mentioned above show improvements, in phylogeny reconstruction and
54 Chapter 2. Evolutionary patterns in coiled-coils
homology detection, over general models for their specific protein classes.
Here, we focus on evolutionary patterns governing the sequence evolution
of coiled-coil domains. The coiled-coil is an abundant peptide motif present in
all domains of life, which composes up to 10% of all proteins of a species (Liu
and Rost 2001). At the sequence level, it is defined by a repetitive heptad pattern
(abcdefg, (HPPHPPP)n) of two hydrophobic amino acids (H, at ad positions) sep-
arated by two and three polar amino acids (P, at bcefg positions). This leads to the
emergence of amphiphilic α-helices that interact between themselves by their hy-
drophobic interfaces through interlacing of side chains, known as knob-into-hole
packing (Crick 1952), to form a superhelix – the coiled-coil. Coiled-coils were
traditionally viewed as rod-like spacers separating functional domains; however,
growing evidence suggests that they frequently contain interaction sites and act
as protein effectors or scaffolds enabling protein–protein interactions (Zhang et
al. 2009; Munro 2011). Proteins containing coiled-coil domains play various bi-
ological roles, where the coiled-coil region can act as either (or both) a structural
or interacting component. They are involved in transcription regulation (leucine
zippers), chromatin and chromosome dynamics (condensins, cohesins); cell cy-
cle; recognition and transport in the endomembrane system (kinesins, dyneins,
SNAREs); motility (myosins); structuring organelles (golgins of the Golgi ap-
paratus, Bld10p and SAS-6 of the centrosome, the former was shown (Hiraki et
al. 2007) to alter the size and symmetry of the entire organelle when truncated)
among many others.
Coiled-coil motifs form well-defined 3D structures that appear in many oligo-
meric states, yet, they are dominated by simple dimers (Moutevelis and Woolfson
2009; Rackham et al. 2010) that usually form rod-like assemblies, for example,
stalks in motor proteins. Although coiled-coils are highly structured, they should
substantially differ from globular domains not only in the number of possible
folds (secondary structure is restricted just to the α-helix) but also in designabil-
ity: Presence of the heptad pattern limits the sequence space in comparison to an
unconstrained α-helix. Hence, we expect to observe different evolutionary pat-
terns in coiled-coil domains. However, it is also unclear how conserved coiled-
coil sequences are: Is the evolution governed solely by the requirement of the
heptad pattern per se, or is the identity of the specific amino acid also of impor-

2.2. Materials and Methods 55
tance? In the first case, we would expect to observe relatively low sequence con-
servation: Many different amino acid combinations can satisfy the pattern. White
and Erickson (2006) showed examples of coiled-coil proteins with different lev-
els of sequence conservation and hypothesized that the conservation depends on
the number of interactions along the coiled-coil. They also presented evidence
that positions bcefg are more constrained in skeletal muscle myosin whereas ad
positions are more constrained for the analyzed spacer rods. Yet, the general ten-
dency of sequence conservation in coiled-coil regions, compared with globular
domains, remains unclear. Here, we address these questions by characterizing
the evolutionary patterns of coiled-coil domains and its differences to globular
domains. We use this characterization to develop a CC model that shows an im-
proved performance over general models in phylogeny inference and homology
detection of coiled-coil proteins.
2.2 Materials and Methods
2.2.1 Data Sets
Proteomes of all (66) available species were downloaded from the Ensembl data-
base, release 75 (Flicek et al. 2014), which covers Metazoa (largely represented
by vertebrates) and Saccharomyces cerevisiae. Ensembl Compara was used to
retrieve homology information and as a gold set to assess the performance of
tested homology prediction methods. Coiled-coil regions were predicted with
Paircoil2 (McDonnell et al. 2006) using default parameters. Globular domains
were mapped according to the Superfamily database (Gough et al. 2001) using
Ensembl’s interface.
2.2.2 Protein Sequence Alignment
Protein multiple sequence alignments were built with MAFFT, version 7 (Katoh
and Standley 2013) with high accuracy mode (--genafpair --maxiterate 1000).
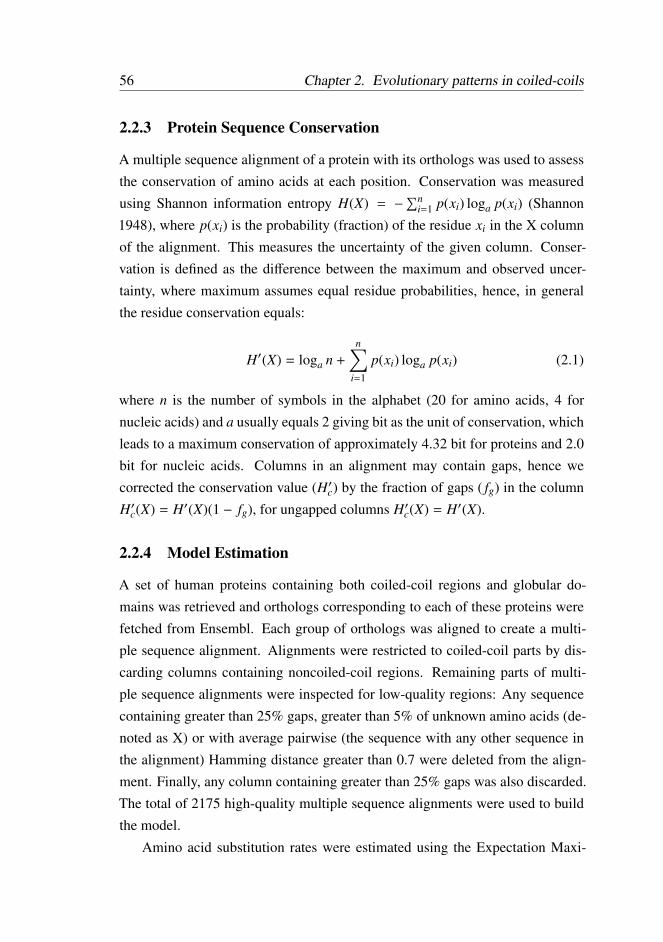
56 Chapter 2. Evolutionary patterns in coiled-coils
2.2.3 Protein Sequence Conservation
A multiple sequence alignment of a protein with its orthologs was used to assess
the conservation of amino acids at each position. Conservation was measured
using Shannon information entropy H(X) = −∑ni=1 p(xi) loga p(xi) (Shannon
1948), where p(xi) is the probability (fraction) of the residue xi in the X column
of the alignment. This measures the uncertainty of the given column. Conser-
vation is defined as the difference between the maximum and observed uncer-
tainty, where maximum assumes equal residue probabilities, hence, in general
the residue conservation equals:
H′(X) = loga n +
n∑
i=1
p(xi) loga p(xi) (2.1)
where n is the number of symbols in the alphabet (20 for amino acids, 4 for
nucleic acids) and a usually equals 2 giving bit as the unit of conservation, which
leads to a maximum conservation of approximately 4.32 bit for proteins and 2.0
bit for nucleic acids. Columns in an alignment may contain gaps, hence we
corrected the conservation value (H′c) by the fraction of gaps ( fg) in the column
H′c(X) = H′(X)(1 − fg), for ungapped columns H′c(X) = H′(X).
2.2.4 Model Estimation
A set of human proteins containing both coiled-coil regions and globular do-
mains was retrieved and orthologs corresponding to each of these proteins were
fetched from Ensembl. Each group of orthologs was aligned to create a multi-
ple sequence alignment. Alignments were restricted to coiled-coil parts by dis-
carding columns containing noncoiled-coil regions. Remaining parts of multi-
ple sequence alignments were inspected for low-quality regions: Any sequence
containing greater than 25% gaps, greater than 5% of unknown amino acids (de-
noted as X) or with average pairwise (the sequence with any other sequence in
the alignment) Hamming distance greater than 0.7 were deleted from the align-
ment. Finally, any column containing greater than 25% gaps was also discarded.
The total of 2175 high-quality multiple sequence alignments were used to build
the model.
Amino acid substitution rates were estimated using the Expectation Maxi-
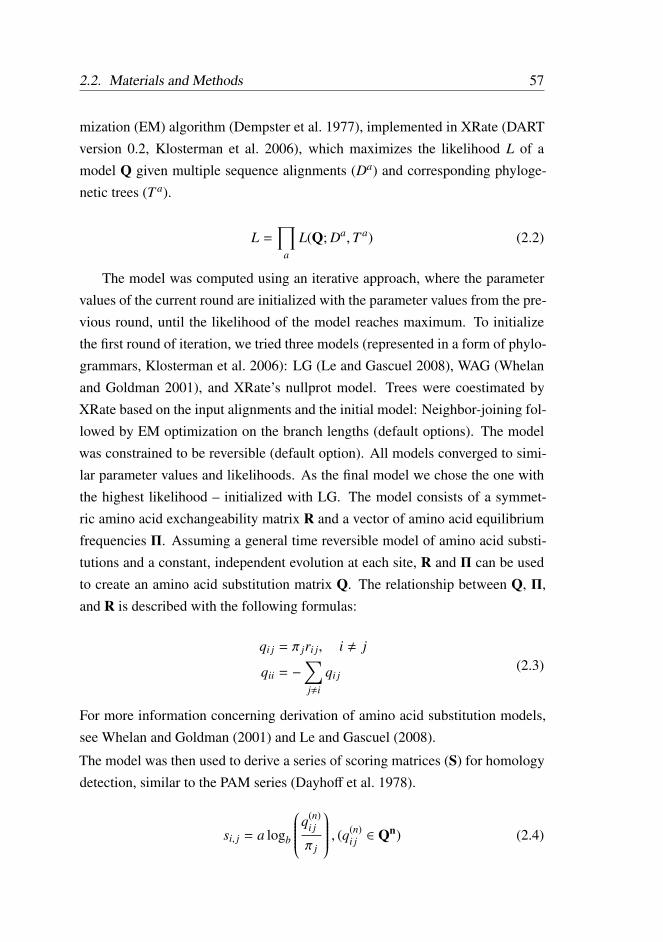
2.2. Materials and Methods 57
mization (EM) algorithm (Dempster et al. 1977), implemented in XRate (DART
version 0.2, Klosterman et al. 2006), which maximizes the likelihood L of a
model Q given multiple sequence alignments (Da) and corresponding phyloge-
netic trees (T a).
L =∏
a
L(Q; Da,T a) (2.2)
The model was computed using an iterative approach, where the parameter
values of the current round are initialized with the parameter values from the pre-
vious round, until the likelihood of the model reaches maximum. To initialize
the first round of iteration, we tried three models (represented in a form of phylo-
grammars, Klosterman et al. 2006): LG (Le and Gascuel 2008), WAG (Whelan
and Goldman 2001), and XRate’s nullprot model. Trees were coestimated by
XRate based on the input alignments and the initial model: Neighbor-joining fol-
lowed by EM optimization on the branch lengths (default options). The model
was constrained to be reversible (default option). All models converged to simi-
lar parameter values and likelihoods. As the final model we chose the one with
the highest likelihood – initialized with LG. The model consists of a symmet-
ric amino acid exchangeability matrix R and a vector of amino acid equilibrium
frequencies Π. Assuming a general time reversible model of amino acid substi-
tutions and a constant, independent evolution at each site, R and Π can be used
to create an amino acid substitution matrix Q. The relationship between Q, Π,
and R is described with the following formulas:
qi j = π jri j, i , j
qii = −∑
j,i
qi j(2.3)
For more information concerning derivation of amino acid substitution models,
see Whelan and Goldman (2001) and Le and Gascuel (2008).
The model was then used to derive a series of scoring matrices (S) for homology
detection, similar to the PAM series (Dayhoff et al. 1978).
si, j = a logb
q(n)i j
π j
, (q(n)i j∈ Qn) (2.4)

58 Chapter 2. Evolutionary patterns in coiled-coils
where n is the PAM distance; Qn denotes matrix exponentiation; a and b are
arbitrary constants (e.g., for PAM250 a = b = 10). Scores are rounded to the
nearest integers.
The entropy of a scoring matrix, average information per residue pair in the
alignment, was calculated as follows (Altschul 1991):
H =∑
i, j
q∗i j log2
q∗i j
πiπ j
(2.5)
where q∗i j= πiπ je
ln(2)si j , si j is calculated using equation 2.4 (a = 1, b = 2), which
gives q∗i j= πiq
(n)i j
.
2.2.5 Model Validation
The performance comparison, between the new model and the general one, in
phylogeny reconstruction was done using RAxML (Stamatakis 2006). The test
set consisted of 179 alignments of orthologous, coiled-coil rich (>25%, no glob-
ular domain) proteins that were not used for the model estimation. All models
included gamma-distributed rate categories, the shape parameter of the distribu-
tion was estimated from the data. The F option was used to adapt the model to the
empirical amino acid frequencies: The amino acid composition of the multiple
sequence alignment. To calculate the difference between obtained estimates, we
applied the approach proposed by Le and Gascuel (2008): Measure the Akaike
information criterion, AIC (Akaike 1974) for each alignment and use the non-
parametric paired sign test on the likelihood values, which are estimated per
alignment site, to assess the significance of the difference between models. The
average AIC per site is defined as the ratio of the sum of AIC for all alignments
given the model and the total number of sites:∑
a AIC(M,Da)/∑
a sa. The differ-
ence between tree topologies was calculated using the Robinson–Foulds distance
(Robinson and Foulds 1981).
2.2.6 Model Partitioning
For every orthologous group, in the selected subset of coiled-coil proteins, the
CC (coiled-coil specific) model was assigned to the alignment region based on
the coiled-coil prediction for the human protein, the LG model was used for the
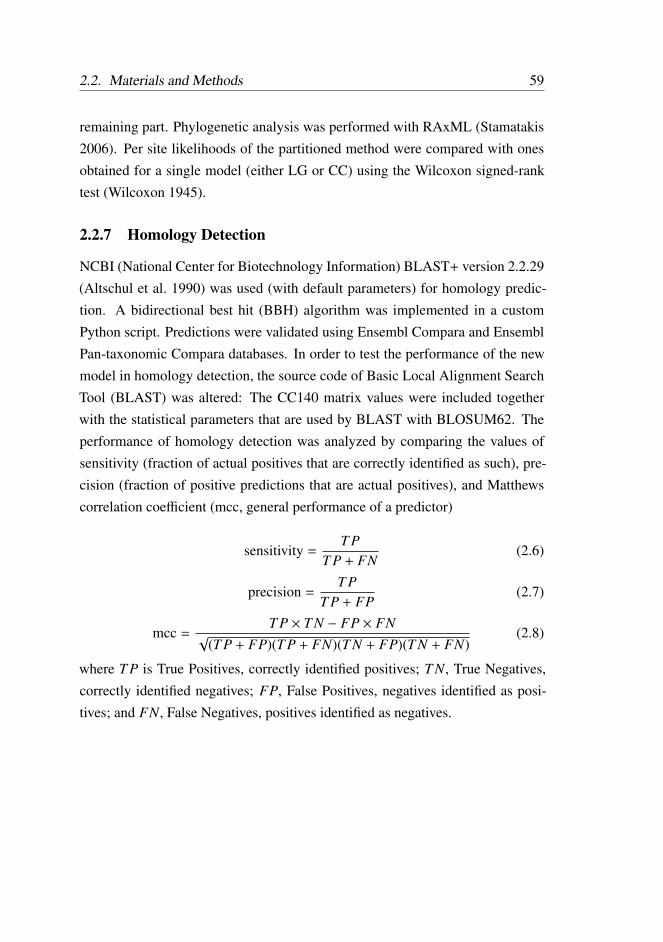
2.2. Materials and Methods 59
remaining part. Phylogenetic analysis was performed with RAxML (Stamatakis
2006). Per site likelihoods of the partitioned method were compared with ones
obtained for a single model (either LG or CC) using the Wilcoxon signed-rank
test (Wilcoxon 1945).
2.2.7 Homology Detection
NCBI (National Center for Biotechnology Information) BLAST+ version 2.2.29
(Altschul et al. 1990) was used (with default parameters) for homology predic-
tion. A bidirectional best hit (BBH) algorithm was implemented in a custom
Python script. Predictions were validated using Ensembl Compara and Ensembl
Pan-taxonomic Compara databases. In order to test the performance of the new
model in homology detection, the source code of Basic Local Alignment Search
Tool (BLAST) was altered: The CC140 matrix values were included together
with the statistical parameters that are used by BLAST with BLOSUM62. The
performance of homology detection was analyzed by comparing the values of
sensitivity (fraction of actual positives that are correctly identified as such), pre-
cision (fraction of positive predictions that are actual positives), and Matthews
correlation coefficient (mcc, general performance of a predictor)
sensitivity =T P
T P + FN(2.6)
precision =T P
T P + FP(2.7)
mcc =T P × T N − FP × FN
√(T P + FP)(T P + FN)(T N + FP)(T N + FN)
(2.8)
where T P is True Positives, correctly identified positives; T N, True Negatives,
correctly identified negatives; FP, False Positives, negatives identified as posi-
tives; and FN, False Negatives, positives identified as negatives.
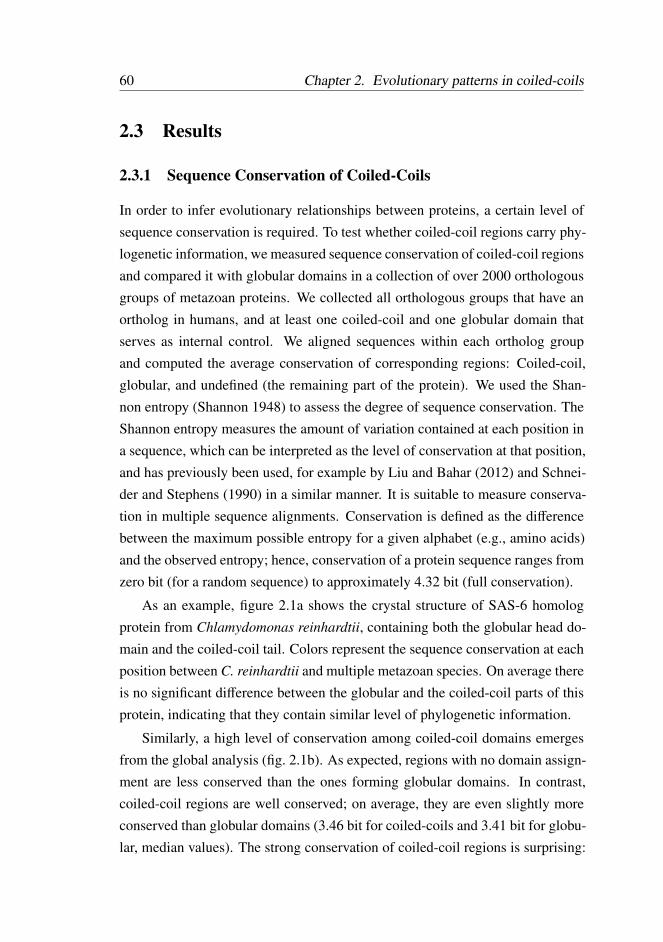
60 Chapter 2. Evolutionary patterns in coiled-coils
2.3 Results
2.3.1 Sequence Conservation of Coiled-Coils
In order to infer evolutionary relationships between proteins, a certain level of
sequence conservation is required. To test whether coiled-coil regions carry phy-
logenetic information, we measured sequence conservation of coiled-coil regions
and compared it with globular domains in a collection of over 2000 orthologous
groups of metazoan proteins. We collected all orthologous groups that have an
ortholog in humans, and at least one coiled-coil and one globular domain that
serves as internal control. We aligned sequences within each ortholog group
and computed the average conservation of corresponding regions: Coiled-coil,
globular, and undefined (the remaining part of the protein). We used the Shan-
non entropy (Shannon 1948) to assess the degree of sequence conservation. The
Shannon entropy measures the amount of variation contained at each position in
a sequence, which can be interpreted as the level of conservation at that position,
and has previously been used, for example by Liu and Bahar (2012) and Schnei-
der and Stephens (1990) in a similar manner. It is suitable to measure conserva-
tion in multiple sequence alignments. Conservation is defined as the difference
between the maximum possible entropy for a given alphabet (e.g., amino acids)
and the observed entropy; hence, conservation of a protein sequence ranges from
zero bit (for a random sequence) to approximately 4.32 bit (full conservation).
As an example, figure 2.1a shows the crystal structure of SAS-6 homolog
protein from Chlamydomonas reinhardtii, containing both the globular head do-
main and the coiled-coil tail. Colors represent the sequence conservation at each
position between C. reinhardtii and multiple metazoan species. On average there
is no significant difference between the globular and the coiled-coil parts of this
protein, indicating that they contain similar level of phylogenetic information.
Similarly, a high level of conservation among coiled-coil domains emerges
from the global analysis (fig. 2.1b). As expected, regions with no domain assign-
ment are less conserved than the ones forming globular domains. In contrast,
coiled-coil regions are well conserved; on average, they are even slightly more
conserved than globular domains (3.46 bit for coiled-coils and 3.41 bit for globu-
lar, median values). The strong conservation of coiled-coil regions is surprising:
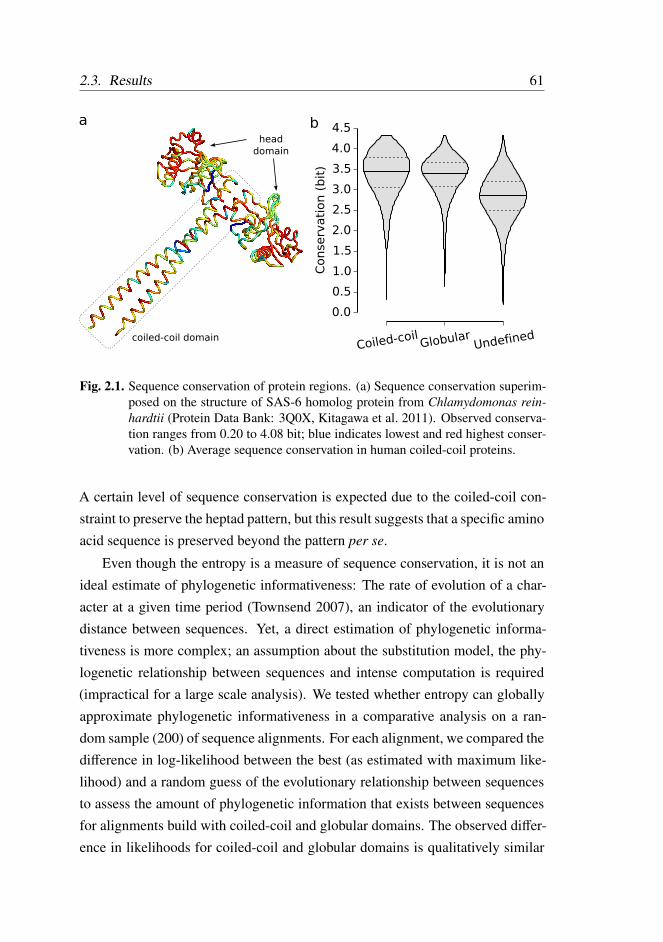
2.3. Results 61
a b
coiled-coil domain
head
domain
Fig. 2.1. Sequence conservation of protein regions. (a) Sequence conservation superim-posed on the structure of SAS-6 homolog protein from Chlamydomonas rein-
hardtii (Protein Data Bank: 3Q0X, Kitagawa et al. 2011). Observed conserva-tion ranges from 0.20 to 4.08 bit; blue indicates lowest and red highest conser-vation. (b) Average sequence conservation in human coiled-coil proteins.
A certain level of sequence conservation is expected due to the coiled-coil con-
straint to preserve the heptad pattern, but this result suggests that a specific amino
acid sequence is preserved beyond the pattern per se.
Even though the entropy is a measure of sequence conservation, it is not an
ideal estimate of phylogenetic informativeness: The rate of evolution of a char-
acter at a given time period (Townsend 2007), an indicator of the evolutionary
distance between sequences. Yet, a direct estimation of phylogenetic informa-
tiveness is more complex; an assumption about the substitution model, the phy-
logenetic relationship between sequences and intense computation is required
(impractical for a large scale analysis). We tested whether entropy can globally
approximate phylogenetic informativeness in a comparative analysis on a ran-
dom sample (200) of sequence alignments. For each alignment, we compared the
difference in log-likelihood between the best (as estimated with maximum like-
lihood) and a random guess of the evolutionary relationship between sequences
to assess the amount of phylogenetic information that exists between sequences
for alignments build with coiled-coil and globular domains. The observed differ-
ence in likelihoods for coiled-coil and globular domains is qualitatively similar
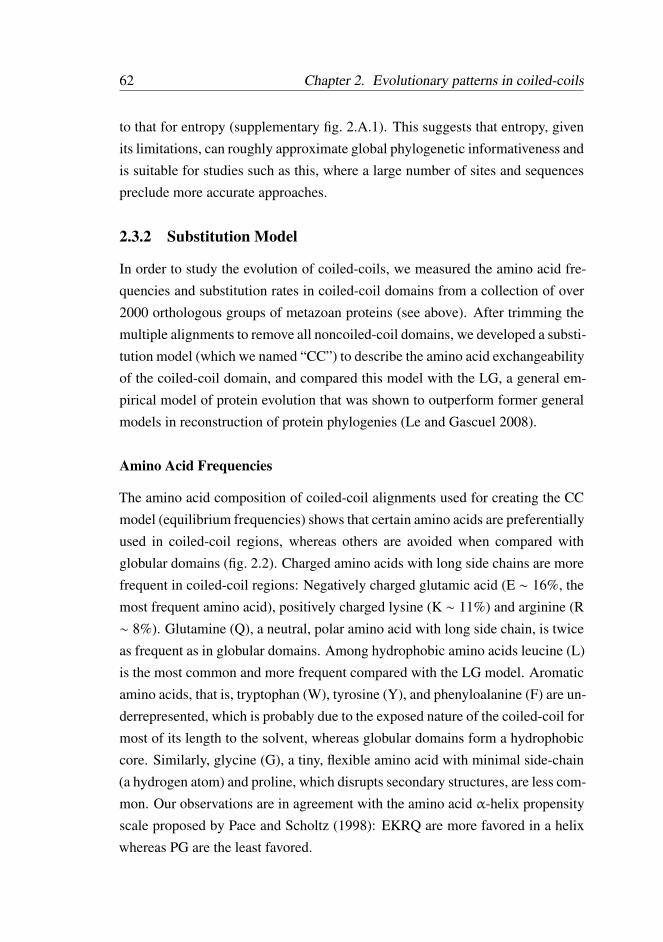
62 Chapter 2. Evolutionary patterns in coiled-coils
to that for entropy (supplementary fig. 2.A.1). This suggests that entropy, given
its limitations, can roughly approximate global phylogenetic informativeness and
is suitable for studies such as this, where a large number of sites and sequences
preclude more accurate approaches.
2.3.2 Substitution Model
In order to study the evolution of coiled-coils, we measured the amino acid fre-
quencies and substitution rates in coiled-coil domains from a collection of over
2000 orthologous groups of metazoan proteins (see above). After trimming the
multiple alignments to remove all noncoiled-coil domains, we developed a substi-
tution model (which we named “CC”) to describe the amino acid exchangeability
of the coiled-coil domain, and compared this model with the LG, a general em-
pirical model of protein evolution that was shown to outperform former general
models in reconstruction of protein phylogenies (Le and Gascuel 2008).
Amino Acid Frequencies
The amino acid composition of coiled-coil alignments used for creating the CC
model (equilibrium frequencies) shows that certain amino acids are preferentially
used in coiled-coil regions, whereas others are avoided when compared with
globular domains (fig. 2.2). Charged amino acids with long side chains are more
frequent in coiled-coil regions: Negatively charged glutamic acid (E ∼ 16%, the
most frequent amino acid), positively charged lysine (K ∼ 11%) and arginine (R
∼ 8%). Glutamine (Q), a neutral, polar amino acid with long side chain, is twice
as frequent as in globular domains. Among hydrophobic amino acids leucine (L)
is the most common and more frequent compared with the LG model. Aromatic
amino acids, that is, tryptophan (W), tyrosine (Y), and phenyloalanine (F) are un-
derrepresented, which is probably due to the exposed nature of the coiled-coil for
most of its length to the solvent, whereas globular domains form a hydrophobic
core. Similarly, glycine (G), a tiny, flexible amino acid with minimal side-chain
(a hydrogen atom) and proline, which disrupts secondary structures, are less com-
mon. Our observations are in agreement with the amino acid α-helix propensity
scale proposed by Pace and Scholtz (1998): EKRQ are more favored in a helix
whereas PG are the least favored.
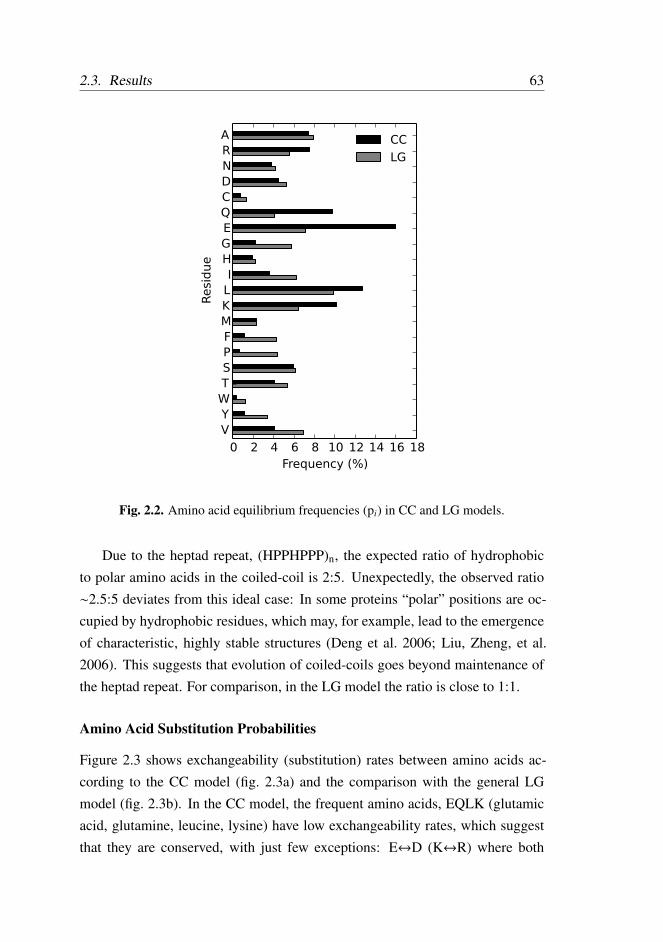
2.3. Results 63
Fig. 2.2. Amino acid equilibrium frequencies (pi) in CC and LG models.
Due to the heptad repeat, (HPPHPPP)n, the expected ratio of hydrophobic
to polar amino acids in the coiled-coil is 2:5. Unexpectedly, the observed ratio
∼2.5:5 deviates from this ideal case: In some proteins “polar” positions are oc-
cupied by hydrophobic residues, which may, for example, lead to the emergence
of characteristic, highly stable structures (Deng et al. 2006; Liu, Zheng, et al.
2006). This suggests that evolution of coiled-coils goes beyond maintenance of
the heptad repeat. For comparison, in the LG model the ratio is close to 1:1.
Amino Acid Substitution Probabilities
Figure 2.3 shows exchangeability (substitution) rates between amino acids ac-
cording to the CC model (fig. 2.3a) and the comparison with the general LG
model (fig. 2.3b). In the CC model, the frequent amino acids, EQLK (glutamic
acid, glutamine, leucine, lysine) have low exchangeability rates, which suggest
that they are conserved, with just few exceptions: E↔D (K↔R) where both
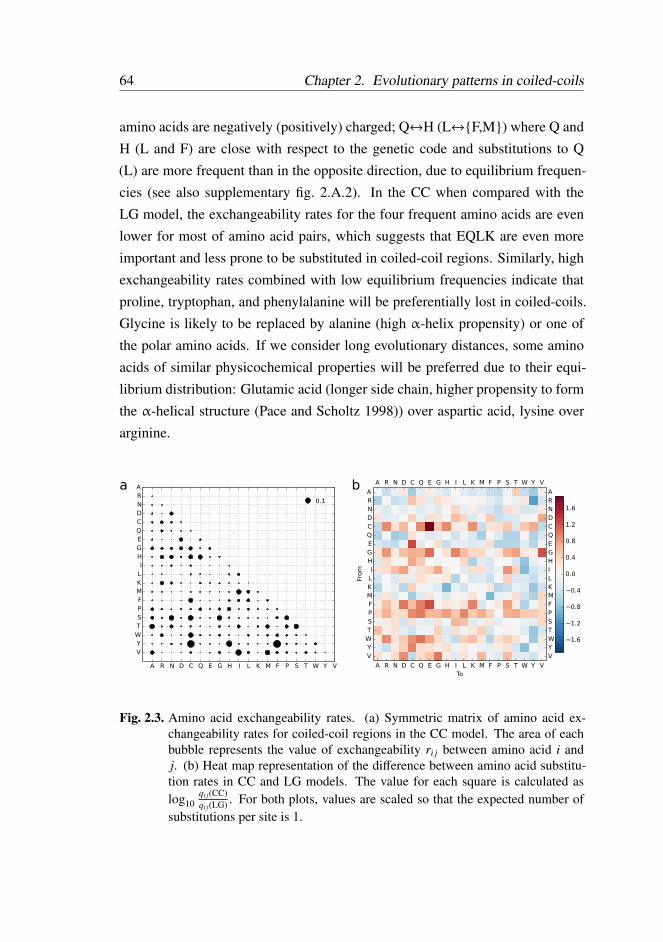
64 Chapter 2. Evolutionary patterns in coiled-coils
amino acids are negatively (positively) charged; Q↔H (L↔{F,M}) where Q and
H (L and F) are close with respect to the genetic code and substitutions to Q
(L) are more frequent than in the opposite direction, due to equilibrium frequen-
cies (see also supplementary fig. 2.A.2). In the CC when compared with the
LG model, the exchangeability rates for the four frequent amino acids are even
lower for most of amino acid pairs, which suggests that EQLK are even more
important and less prone to be substituted in coiled-coil regions. Similarly, high
exchangeability rates combined with low equilibrium frequencies indicate that
proline, tryptophan, and phenylalanine will be preferentially lost in coiled-coils.
Glycine is likely to be replaced by alanine (high α-helix propensity) or one of
the polar amino acids. If we consider long evolutionary distances, some amino
acids of similar physicochemical properties will be preferred due to their equi-
librium distribution: Glutamic acid (longer side chain, higher propensity to form
the α-helical structure (Pace and Scholtz 1998)) over aspartic acid, lysine over
arginine.
Fig. 2.3. Amino acid exchangeability rates. (a) Symmetric matrix of amino acid ex-changeability rates for coiled-coil regions in the CC model. The area of eachbubble represents the value of exchangeability ri j between amino acid i andj. (b) Heat map representation of the difference between amino acid substitu-tion rates in CC and LG models. The value for each square is calculated aslog10
qi j(CC)qi j(LG) . For both plots, values are scaled so that the expected number of
substitutions per site is 1.

2.3. Results 65
2.3.3 Phylogenetic Inference with the CC Model
Besides the descriptive capabilities, substitution models are also used for phy-
logenetic inference. Hence, we assessed the performance of the CC model on
phylogeny reconstruction by analyzing 179 orthologous groups of coiled-coil
rich proteins (defined as proteins where coiled-coil regions span >25% of the se-
quence and globular domains are absent) and compared the resulting trees with
those generated using the LG model, which outperforms previous general models
(Le and Gascuel 2008). To insure that we were not artificially improving scores
of the CC model over LG, we used different sets of orthologous groups to create
the CC model and to compare the performance of phylogeny reconstruction.
We analyzed the overall likelihood of a tree, differences in the tree length
and topology. We used the AIC (Akaike 1974) to measure the relative quality
of each model for the analyzed data; AIC compares likelihoods of two models
taking into account their complexity; hence, a model with more parameters is
not necessarily favored over a simpler one. To assess the statistical difference
between models, we used the nonparametric paired sign test, similarly to Le and
Gascuel (2008). To control for the influence of amino acid equilibrium frequen-
cies on tree estimation, we applied both models together with either the orig-
inal (model’s) frequencies or frequencies estimated from each of the analyzed
alignments (empirical frequencies, +F). Table 2.1 summarizes the results of the
analysis.
In most cases the CC model produces better trees (lower AIC) than the LG
model, even when empirical frequencies are used with LG (LG+F); CC+F model
is worse than LG (LG+F) in only 1 (2) case. We obtained similar results when
the CC model was compared with two other general empirical models: WAG
and JTT (data not shown). The CC model produces shorter trees than LG (∼14%
for CC/LG and ∼8% for CC+F/LG+F), indicating that the new model needs to
account for fewer hidden substitutions than the general model. Tree topologies
obtained with the CC model differ from their LG counterparts for most cases:
CC influences the likelihood of the tree, its length and also the shape. We also
compared predicted tree topologies with the reference (Ensembl Compara) and
observed that the topologies predicted with the CC model are closer to the ref-
erence in 42% of the cases, whereas the trees estimated with LG are closer to

66 Chapter 2. Evolutionary patterns in coiled-coils
Table 2.1. CC and LG model comparison with 179 test alignments of coiled-coil richproteins
M1 M2 ∆AIC(per site)
#M1AIC >
M2AIC
#M1>M2(p < 0.01)
#M2>M1(p < 0.01)
#T1>T2(p < 0.01)
#T2>T1(p < 0.01)
CC LG 0.57 143 104 23 98 23CC LG+F 0.95 154 118 13 113 13CC+F LG 0.90 161 145 1 140 1CC+F LG+F 1.28 175 148 2 141 2
Trees were estimated with RAxML under either LG or CC model (+F indicates use of empiricalamino acid frequencies), using gamma-distributed rate categories. ∆AIC average per site differ-ence in AIC between two models (M2 −M1), positive value M1 better than M2. #M1AIC > M2AIC
number of alignments where M1 has a better (lower) AIC value than M2. #M1 > M2 (p < 0.01)number of alignments where the AIC of M1 is significantly better (lower AIC, p-value < 0.01for paired sign test on per site likelihood values) than that of M2. #T1 > T2 (p < 0.01) numberof alignments where the AIC of M1 is significantly better than that of M2 and the tree topologydiffers.
the reference in 31% of the cases, even though the reference trees are themselves
biased toward general models used in the Ensembl pipeline. In 27% of the cases,
CC and LG models result in trees that are equally distant to the reference. As
a control, we tested the performance of the CC model on globular proteins, and
as expected tree likelihoods are worse than for the LG model (data not shown).
These results show that the CC model clearly outperforms the general model in
phylogeny reconstruction of coiled-coil rich proteins.
2.3.4 Model Partitioning
Proteins rich in coiled-coil regions but lacking other domains are just a subset of
the universe of all coiled-coil proteins. Although it is clear that the CC model
is a better choice for reconstructing the phylogeny of coiled-coil rich proteins,
selecting an appropriate model for multidomain proteins is more complicated.
In those cases model partitioning, assigning different models to specific parts
of a protein, should improve phylogenetic inference. We tested whether this
is indeed the case on a small set of proteins (that allowed manual inspection of
the partitioning scheme) representing different levels of sequence divergence and
coiled-coil content (13 proteins compiled in White and Erickson 2006). Model
partitioning gives significantly higher tree likelihoods, than either of the models
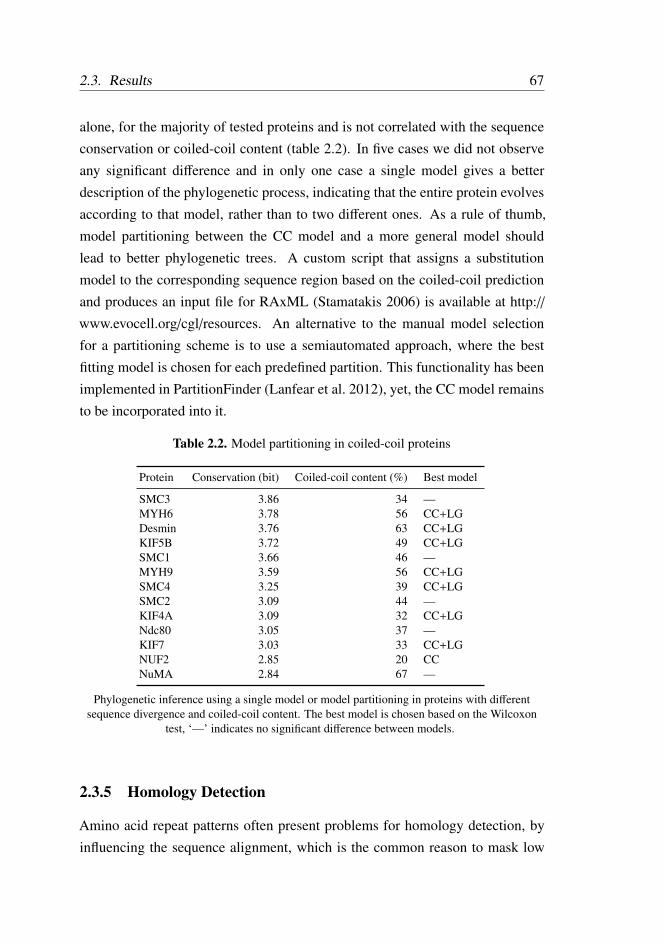
2.3. Results 67
alone, for the majority of tested proteins and is not correlated with the sequence
conservation or coiled-coil content (table 2.2). In five cases we did not observe
any significant difference and in only one case a single model gives a better
description of the phylogenetic process, indicating that the entire protein evolves
according to that model, rather than to two different ones. As a rule of thumb,
model partitioning between the CC model and a more general model should
lead to better phylogenetic trees. A custom script that assigns a substitution
model to the corresponding sequence region based on the coiled-coil prediction
and produces an input file for RAxML (Stamatakis 2006) is available at http://
www.evocell.org/cgl/resources. An alternative to the manual model selection
for a partitioning scheme is to use a semiautomated approach, where the best
fitting model is chosen for each predefined partition. This functionality has been
implemented in PartitionFinder (Lanfear et al. 2012), yet, the CC model remains
to be incorporated into it.
Table 2.2. Model partitioning in coiled-coil proteins
Protein Conservation (bit) Coiled-coil content (%) Best model
SMC3 3.86 34 —MYH6 3.78 56 CC+LGDesmin 3.76 63 CC+LGKIF5B 3.72 49 CC+LGSMC1 3.66 46 —MYH9 3.59 56 CC+LGSMC4 3.25 39 CC+LGSMC2 3.09 44 —KIF4A 3.09 32 CC+LGNdc80 3.05 37 —KIF7 3.03 33 CC+LGNUF2 2.85 20 CCNuMA 2.84 67 —
Phylogenetic inference using a single model or model partitioning in proteins with differentsequence divergence and coiled-coil content. The best model is chosen based on the Wilcoxon
test, ‘—’ indicates no significant difference between models.
2.3.5 Homology Detection
Amino acid repeat patterns often present problems for homology detection, by
influencing the sequence alignment, which is the common reason to mask low
68 Chapter 2. Evolutionary patterns in coiled-coils
complexity regions. Coiled-coils are based on a relatively simple pattern, hence,
it is unclear if the pattern itself is introducing ambiguities in homology detection
and deteriorating search performance, an issue raised by several authors (Rose,
Manikantan, et al. 2004; Rose, Schraegle, et al. 2005; Zhang et al. 2009; Rack-
ham et al. 2010; Walshaw et al. 2010; Azimzadeh et al. 2012). We set out to
examine to what extent the coiled-coil region influences homology detection,
and subsequently test whether the CC model can be used to improve homology
detection of coiled-coil proteins.
To analyze and quantify the influence of the coiled-coil repeat on homology
detection we split each sequence into coiled-coil and globular regions (by mask-
ing appropriate regions), and used these fragments (as well as the full length se-
quence for comparison) to detect homologs by performing a search with BLAST
(Altschul et al. 1990) against species present in the Ensembl database; predic-
tions were validated based on Ensembl Compara for a range of different e value
thresholds. We observed that both coiled-coil and globular regions have sim-
ilar performance (fig. 2.4). On average the overall sensitivity decreases when
the query is restricted to a single domain type, compared with the full sequence
query, and the difference is bigger when the coiled-coil is used (globular do-
main is masked). This effect is more pronounced at very low e value thresholds.
Interestingly, the change in precision depends on the e value threshold; at low
thresholds the difference is similar to that of sensitivity, yet, at high thresholds
we observed the opposite: Searching with a single domain increases precision
and the gain is bigger for the coiled-coil (i.e., when globular is masked). The
overall performance (mcc, Mathews correlation coefficient) of homology detec-
tion increases when information from both domain types is used, suggesting that
the frequent practice of masking coiled-coil domains leads to reduced accuracy
when searching for homologs.
Given a query, BLAST searches for similar sequences in a library and assigns
a score to putative homologs based on a scoring matrix; the most common ma-
trix used for proteins is BLOSUM62 (Henikoff and Henikoff 1992), the default
option in BLAST. Scoring matrices are closely related to substitution matrices:
A set of scoring matrices can be derived given a substitution model. The perfor-
mance of different scoring matrices can be directly compared if the entropy of
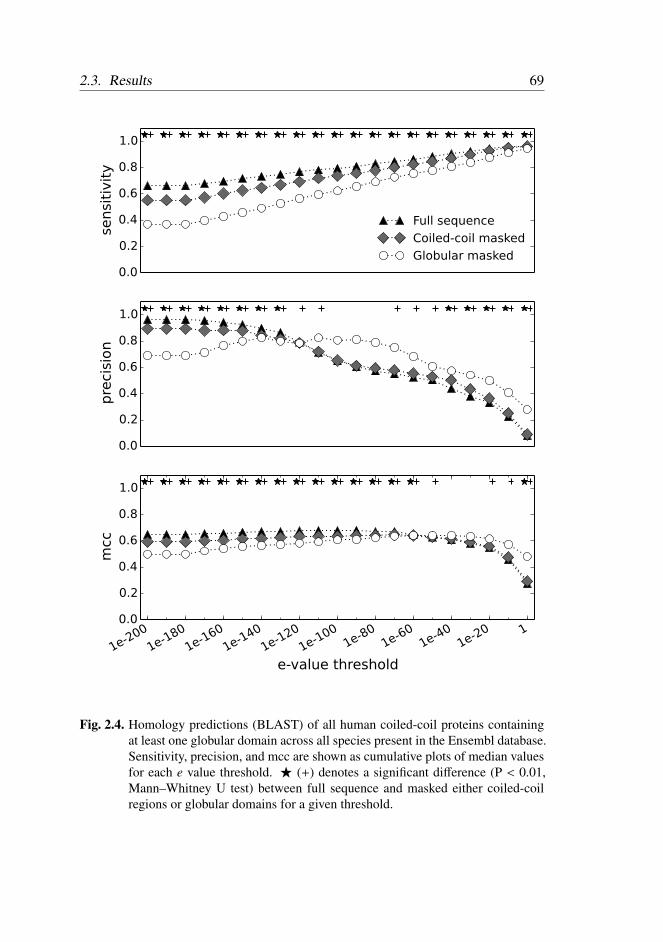
2.3. Results 69
Fig. 2.4. Homology predictions (BLAST) of all human coiled-coil proteins containingat least one globular domain across all species present in the Ensembl database.Sensitivity, precision, and mcc are shown as cumulative plots of median valuesfor each e value threshold. ⋆ (+) denotes a significant difference (P < 0.01,Mann–Whitney U test) between full sequence and masked either coiled-coilregions or globular domains for a given threshold.
70 Chapter 2. Evolutionary patterns in coiled-coils
matrices is similar, even if they were derived using different methods (Altschul
1991).
We decided to test whether using a scoring matrix derived from the CC model
can improve homology detection over the standard BLOSUM62 matrix. We cre-
ated a scoring matrix based on the CC model corresponding to the PAM distance
of 140 (Dayhoff et al. 1978), as this has a similar entropy to BLOSUM62, which
we will refer to as CC140. A set of CC scoring matrices and a script used to
derive them are available at our website (http://www.evocell.org/cgl/resources).
To analyze the influence of the scoring matrix on homology detection, we
restricted protein queries to coiled-coil regions by masking the remaining part of
the sequence and ran a BLAST search with a human sequence as a query against
all sequences available in the Ensembl database. In this way, we directly com-
pare the relative performance between matrices on the coiled-coil regions of the
sequence. Figure 2.5 shows the performance comparison between scoring matri-
ces at the e value threshold of 1e-08: The CC140 matrix significantly improves
both search sensitivity and precision (***P < 0.001, Mann–Whitney U test).
We observed similar gain at lower e value thresholds whereas at higher thresh-
olds precision decreases with increase in sensitivity (data not shown). Overall
(mmc), the new scoring matrix improves homology detection over BLOSUM62
when used with coiled-coil sequences, irrespectively of the e value threshold.
We further tested the performance of the new matrix by running orthology
prediction with the BBH heuristic (Overbeek et al. 1999) using coiled-coil re-
gions of human proteins against multiple eukaryotic species (present in Ensembl
Pan-taxonomic Compara). Similarly to the previous analysis we also observed
a significant increase in sensitivity (table 2.3), albeit of a smaller magnitude.
Surprisingly, the biggest difference between matrices occurs within the phylum
(Chordata) to which the query species belongs rather than between more distantly
related phyla. Subsequently, we tested whether the difference in performance is
affected by the length of the coiled-coil query (table 2.4). Indeed, for short coiled-
coil regions (<50 amino acids) the difference is bigger indicating that the new
model has relatively higher sensitivity given less signal; however, the gains are
still small. Will such small gains be relevant? The following example shows that
this is the case. We used BBH for ortholog detection of the human PBX4, where
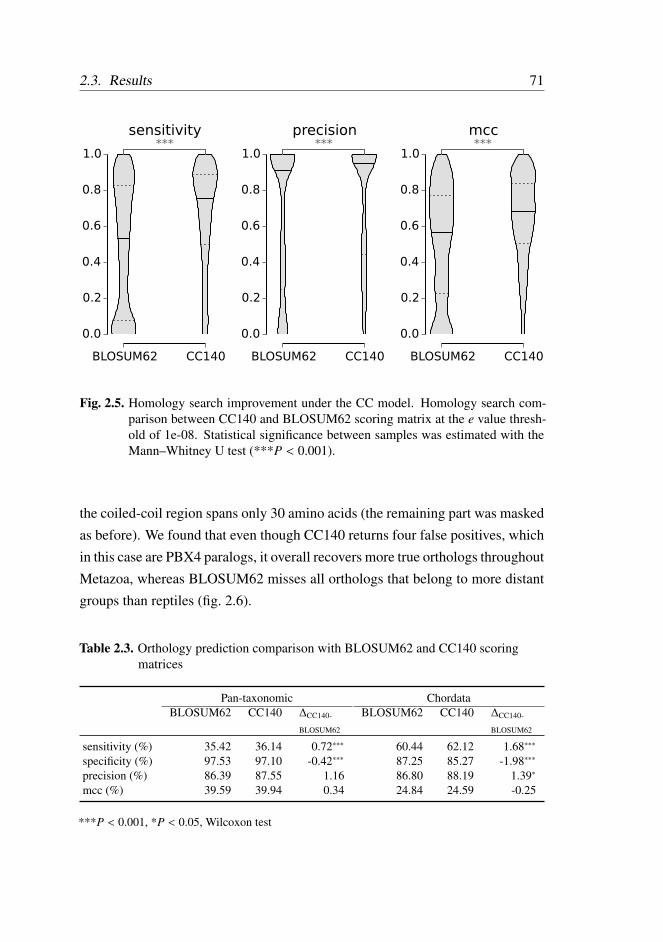
2.3. Results 71
Fig. 2.5. Homology search improvement under the CC model. Homology search com-parison between CC140 and BLOSUM62 scoring matrix at the e value thresh-old of 1e-08. Statistical significance between samples was estimated with theMann–Whitney U test (***P < 0.001).
the coiled-coil region spans only 30 amino acids (the remaining part was masked
as before). We found that even though CC140 returns four false positives, which
in this case are PBX4 paralogs, it overall recovers more true orthologs throughout
Metazoa, whereas BLOSUM62 misses all orthologs that belong to more distant
groups than reptiles (fig. 2.6).
Table 2.3. Orthology prediction comparison with BLOSUM62 and CC140 scoringmatrices
Pan-taxonomic ChordataBLOSUM62 CC140 ∆CC140-
BLOSUM62
BLOSUM62 CC140 ∆CC140-
BLOSUM62
sensitivity (%) 35.42 36.14 0.72∗∗∗ 60.44 62.12 1.68∗∗∗
specificity (%) 97.53 97.10 -0.42∗∗∗ 87.25 85.27 -1.98∗∗∗
precision (%) 86.39 87.55 1.16 86.80 88.19 1.39∗
mcc (%) 39.59 39.94 0.34 24.84 24.59 -0.25
***P < 0.001, *P < 0.05, Wilcoxon test
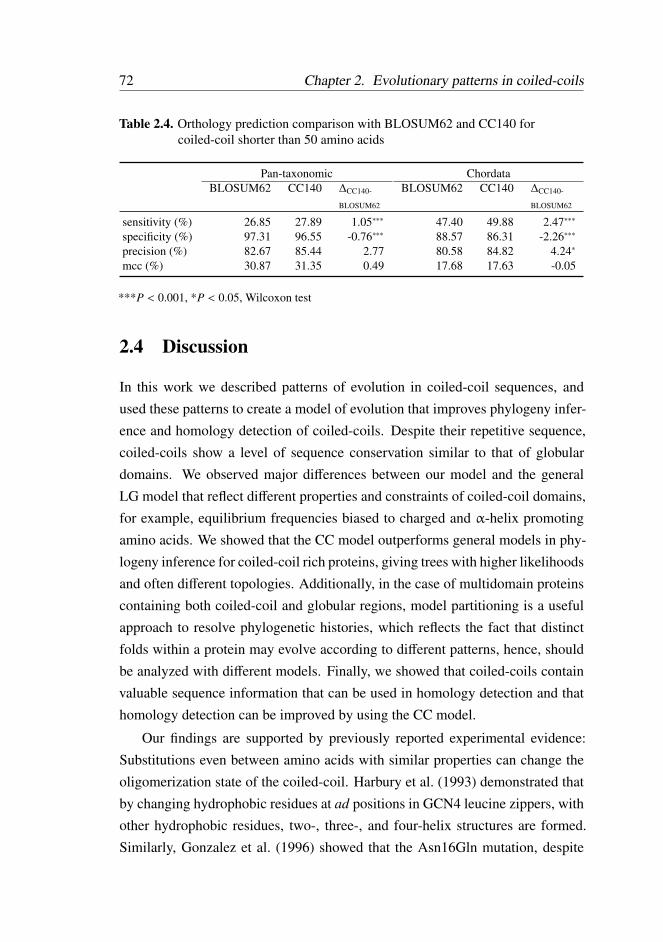
72 Chapter 2. Evolutionary patterns in coiled-coils
Table 2.4. Orthology prediction comparison with BLOSUM62 and CC140 forcoiled-coil shorter than 50 amino acids
Pan-taxonomic ChordataBLOSUM62 CC140 ∆CC140-
BLOSUM62
BLOSUM62 CC140 ∆CC140-
BLOSUM62
sensitivity (%) 26.85 27.89 1.05∗∗∗ 47.40 49.88 2.47∗∗∗
specificity (%) 97.31 96.55 -0.76∗∗∗ 88.57 86.31 -2.26∗∗∗
precision (%) 82.67 85.44 2.77 80.58 84.82 4.24∗
mcc (%) 30.87 31.35 0.49 17.68 17.63 -0.05
***P < 0.001, *P < 0.05, Wilcoxon test
2.4 Discussion
In this work we described patterns of evolution in coiled-coil sequences, and
used these patterns to create a model of evolution that improves phylogeny infer-
ence and homology detection of coiled-coils. Despite their repetitive sequence,
coiled-coils show a level of sequence conservation similar to that of globular
domains. We observed major differences between our model and the general
LG model that reflect different properties and constraints of coiled-coil domains,
for example, equilibrium frequencies biased to charged and α-helix promoting
amino acids. We showed that the CC model outperforms general models in phy-
logeny inference for coiled-coil rich proteins, giving trees with higher likelihoods
and often different topologies. Additionally, in the case of multidomain proteins
containing both coiled-coil and globular regions, model partitioning is a useful
approach to resolve phylogenetic histories, which reflects the fact that distinct
folds within a protein may evolve according to different patterns, hence, should
be analyzed with different models. Finally, we showed that coiled-coils contain
valuable sequence information that can be used in homology detection and that
homology detection can be improved by using the CC model.
Our findings are supported by previously reported experimental evidence:
Substitutions even between amino acids with similar properties can change the
oligomerization state of the coiled-coil. Harbury et al. (1993) demonstrated that
by changing hydrophobic residues at ad positions in GCN4 leucine zippers, with
other hydrophobic residues, two-, three-, and four-helix structures are formed.
Similarly, Gonzalez et al. (1996) showed that the Asn16Gln mutation, despite
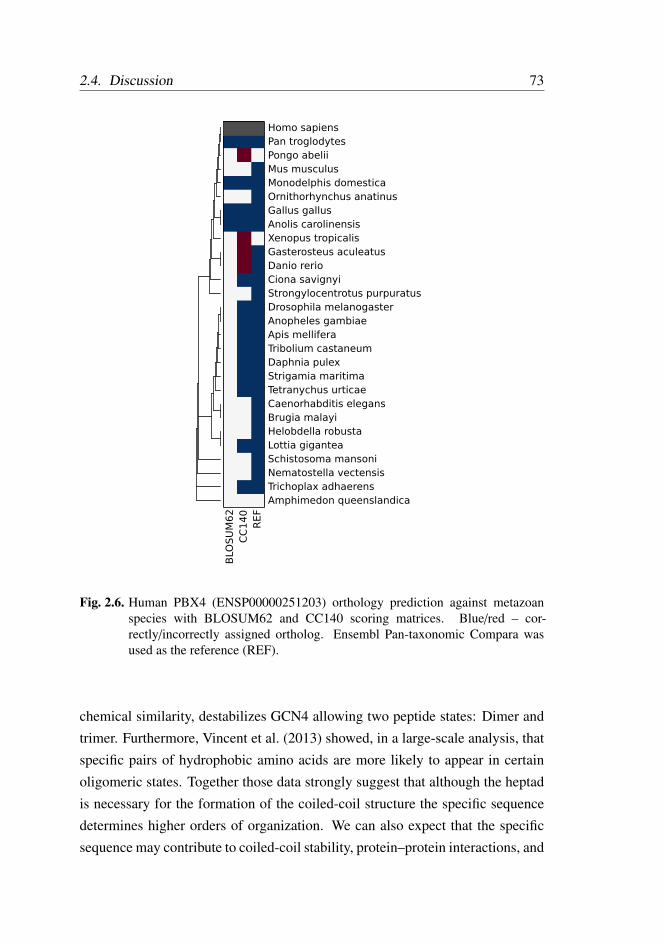
2.4. Discussion 73
Fig. 2.6. Human PBX4 (ENSP00000251203) orthology prediction against metazoanspecies with BLOSUM62 and CC140 scoring matrices. Blue/red – cor-rectly/incorrectly assigned ortholog. Ensembl Pan-taxonomic Compara wasused as the reference (REF).
chemical similarity, destabilizes GCN4 allowing two peptide states: Dimer and
trimer. Furthermore, Vincent et al. (2013) showed, in a large-scale analysis, that
specific pairs of hydrophobic amino acids are more likely to appear in certain
oligomeric states. Together those data strongly suggest that although the heptad
is necessary for the formation of the coiled-coil structure the specific sequence
determines higher orders of organization. We can also expect that the specific
sequence may contribute to coiled-coil stability, protein–protein interactions, and
74 Chapter 2. Evolutionary patterns in coiled-coils
possibly other factors.
In order to develop the CC model we used data from Ensembl, a compre-
hensive database containing sequence information for multiple species and evo-
lutionary relationships between them. The database consists mostly of metazoan
species, hence, the model is especially useful to describe the evolution of coiled-
coils in animals. Yet, our preliminary findings suggest that this model is also
applicable beyond the animal kingdom, and may therefore be a very general
model of coiled-coil evolution: 1) We tested the new model on homology de-
tection in plants (supplementary fig. 2.A.3) and observed a similar performance
improvement over BLOSUM62 to the one seen in animals (fig.e 2.5), and 2)
we developed another model, using the same approach, based on protein fami-
lies containing coiled-coils from Pfam database (Punta et al. 2012), which spans
throughout the tree of life and concluded that the model is qualitatively consis-
tent with CC (data not shown). However, in order to correctly define such a broad
model we will require a more comprehensive, and qualitatively better, collection
of homologous proteins.
An empirical substitution model, such as the one presented here, enables de-
scription and interpretation of a protein class by capturing its global biochemical
properties. Yet, like all other substitution models, it ignores local patterns within
a sequence; future avenues for improvement of the CC model may explore such
patterns. One approach could be to implement model partitioning by inferring
among-site variation from the alignment, for example, using a mixture model in
the context of a Bayesian framework, such as that developed by Lartillot (2004)
in PhyloBayes, where each site in the alignment falls into one of several classes
characterized by its own set of frequencies (CAT model). Although this approach
has shown some improvements in phylogenetic inference, especially in the pres-
ence of saturation, it is computationally expensive and mostly suited for long
alignments due to the necessity of inferring model parameters from the data. Al-
ternatively, in the case of coiled-coils it may be preferable to take advantage
of the repetitive nature of the sequence with hidden Markov models, where a
hidden state, representing position(s) of the heptad, has an associated phyloge-
netic model, such as in Thorne et al. (1996) or Goldman et al. (1998). These
approaches may bring further improvements in phylogenetic inference and ho-
2.4. Discussion 75
mology detection of coiled-coil proteins.
In this study, we showed that coiled-coils, due to their specific structure and
repetitive sequence pattern, differ from globular domains in evolutionary con-
straints. We used the underlying information contained within coiled-coil re-
gions to develop a new model that both describes evolutionary patterns in coiled-
coil sequences and provides an improvement over more general models; one
should consider using the CC model to improve the toolkit used in the classical
phylogenetic analysis pipeline for coiled-coil proteins.
Acknowledgments
The authors thank all members of the Computational Genomics Laboratory for
helpful discussions. Alekos Athanasiadis, Patrícia Beldade, Patrícia Brito, Yoan
Diekmann, and Marc Gouw for reading the manuscript. Cécile Ané, Jeff Thorne,
and an anonymous reviewer for constructive comments that helped to substan-
tially improve the manuscript. This work was supported by Fundação para a
Ciência e a Tecnologia (SFRH/BD/51880/2012) to J.S.
76 Chapter 2. Evolutionary patterns in coiled-coils
References
Abascal, F., Posada, D., and Zardoya, R. (2006). MtArt: A New Model of Amino
Acid Replacement for Arthropoda. Molecular Biology and Evolution 24, 1–
5.
Adachi, J., Waddell, P. J., Martin, W., and Hasegawa, M. (2000). Plastid genome
phylogeny and a model of amino acid substitution for proteins encoded by
chloroplast DNA. Journal of Molecular Evolution 50, 348–358.
Adachi, J. and Hasegawa, M. (1996). Model of amino acid substitution in pro-
teins encoded by mitochondrial DNA. Journal of Molecular Evolution 42,
459–468.
Akaike, H. (1974). A new look at the statistical model identification. IEEE Trans-
actions on Automatic Control 19, 716–723.
Altschul, S. F., Gish, W., Miller, W., Myers, E. W., and Lipman, D. J. (1990).
Basic local alignment search tool. Journal of Molecular Biology 215, 403–
410.
Altschul, S. F. (1991). Amino acid substitution matrices from an information the-
oretic perspective. Journal of Molecular Biology 219, 555–565.
Anisimova, M., Liberles, D. a., Philippe, H., Provan, J., Pupko, T., and Haeseler,
A. von (2013). State-of the art methodologies dictate new standards for phy-
logenetic analysis. BMC Evolutionary Biology 13, 161.
Azimzadeh, J., Wong, M. L., Downhour, D. M., Alvarado, A. S., and Marshall,
W. F. (2012). Centrosome Loss in the Evolution of Planarians. Science 335,
461–463.
Brown, C. J., Johnson, A. K., and Daughdrill, G. W. (2010). Comparing Models
of Evolution for Ordered and Disordered Proteins. Molecular Biology and
Evolution 27, 609–621.
Crick, F. H. C. (1952). Is alpha-keratin a coiled coil? Nature 170, 882–883.
Dayhoff, M., Schwartz, R., and Orcutt, B. (1978). A model of evolutionary change
in proteins. Atlas of Protein Sequence and Structure 5, 345–352.
Dempster, A., Laird, N., and Rubin, D. (1977). Maximum likelihood from in-
complete data via the EM algorithm. Journal of the Royal Statistical Society
39, 1–38.
References 77
Deng, Y., Liu, J., Zheng, Q., Eliezer, D., Kallenbach, N. R., and Lu, M. (2006).
Antiparallel Four-Stranded Coiled Coil Specified by a 3-3-1 Hydrophobic
Heptad Repeat. Structure 14, 247–255.
Emberly, E. G., Wingreen, N. S., and Tang, C. (2002). Designability of -helical
proteins. Proceedings of the National Academy of Sciences 99, 11163–11168.
Flicek, P., Amode, M. R., Barrell, D., Beal, K., Billis, K., et al. (2014). Ensembl
2014. Nucleic Acids Research 42, 749–755.
Goldman, N., Thorne, J. L., and Jones, D. T. (1998). Assessing the impact of
secondary structure and solvent accessibility on protein evolution. Genetics
149, 445–58.
Gonzalez, L., Woolfson, D. N., and Alber, T. (1996). Buried polar residues and
structural specificity in the GCN4 leucine zipper. Nature Structural Biology
3, 1011–1018.
Gough, J., Karplus, K., Hughey, R., and Chothia, C. (2001). Assignment of ho-
mology to genome sequences using a library of hidden Markov models that
represent all proteins of known structure. Journal of Molecular Biology 313,
903–919.
Harbury, P., Zhang, T., Kim, P., and Alber, T. (1993). A switch between two-,
three-, and four-stranded coiled coils in GCN4 leucine zipper mutants. Sci-
ence 262, 1401–1407.
Henikoff, S. and Henikoff, J. G. (1992). Amino acid substitution matrices from
protein blocks. Proceedings of the National Academy of Sciences 89, 10915–
10919.
Hiraki, M., Nakazawa, Y., Kamiya, R., and Hirono, M. (2007). Bld10p Consti-
tutes the Cartwheel-Spoke Tip and Stabilizes the 9-Fold Symmetry of the
Centriole. Current Biology 17, 1778–1783.
Katoh, K. and Standley, D. M. (2013). MAFFT Multiple Sequence Alignment
Software Version 7: Improvements in Performance and Usability. Molecular
Biology and Evolution 30, 772–780.
Kitagawa, D., Vakonakis, I., Olieric, N., Hilbert, M., Keller, D., Olieric, V., Bort-
feld, M., Erat, M. C., Flückiger, I., Gönczy, P., and Steinmetz, M. O. (2011).
Structural basis of the 9-fold symmetry of centrioles. Cell 144, 364–75.

78 Chapter 2. Evolutionary patterns in coiled-coils
Klosterman, P. S., Uzilov, A. V., Bendaña, Y. R., Bradley, R. K., Chao, S., Kosiol,
C., Goldman, N., and Holmes, I. (2006). XRate: a fast prototyping, training
and annotation tool for phylo-grammars. BMC bioinformatics 7, 428.
Lanfear, R., Calcott, B., Ho, S. Y. W., and Guindon, S. (2012). PartitionFinder:
Combined Selection of Partitioning Schemes and Substitution Models for
Phylogenetic Analyses. Molecular Biology and Evolution 29, 1695–1701.
Lartillot, N. (2004). A Bayesian Mixture Model for Across-Site Heterogeneities
in the Amino-Acid Replacement Process. Molecular Biology and Evolution
21, 1095–1109.
Le, S. Q. and Gascuel, O. (2008). An Improved General Amino Acid Replace-
ment Matrix. Molecular Biology and Evolution 25, 1307–1320.
Liu, J., Zheng, Q., Deng, Y., Cheng, C.-S., Kallenbach, N. R., and Lu, M. (2006).
A seven-helix coiled coil. Proceedings of the National Academy of Sciences
103, 15457–15462.
Liu, Y. and Bahar, I. (2012). Sequence Evolution Correlates with Structural Dy-
namics. Molecular Biology and Evolution 29, 2253–2263.
McDonnell, A. V., Jiang, T., Keating, A. E., and Berger, B. (2006). Paircoil2:
improved prediction of coiled coils from sequence. Bioinformatics 22, 356–
8.
Moutevelis, E. and Woolfson, D. N. (2009). A Periodic Table of Coiled-Coil Pro-
tein Structures. Journal of Molecular Biology 385, 726–732.
Munro, S. (2011). The Golgin Coiled-Coil Proteins of the Golgi Apparatus. Cold
Spring Harbor Perspectives in Biology 3, a005256–a005256.
Ng, P. C., Henikoff, J. G., and Henikoff, S. (2000). PHAT: a transmembrane-
specific substitution matrix. Bioinformatics 16, 760–766.
Overbeek, R., Fonstein, M., D’Souza, M., Pusch, G. D., and Maltsev, N. (1999).
The use of gene clusters to infer functional coupling. Proceedings of the
National Academy of Sciences 96, 2896–2901.
Pace, C. N. and Scholtz, J. M. (1998). A helix propensity scale based on experi-
mental studies of peptides and proteins. Biophysical Journal 75, 422–427.
Punta, M., Coggill, P. C., Eberhardt, R. Y., Mistry, J., Tate, J., Boursnell, C., Pang,
N., Forslund, K., Ceric, G., Clements, J., Heger, A., Holm, L., Sonnhammer,
References 79
E. L. L., Eddy, S. R., Bateman, A., and Finn, R. D. (2012). The Pfam protein
families database. Nucleic Acids Research 40, D290–D301.
Rackham, O. J., Madera, M., Armstrong, C. T., Vincent, T. L., Woolfson, D. N.,
and Gough, J. (2010). The Evolution and Structure Prediction of Coiled Coils
across All Genomes. Journal of Molecular Biology 403, 480–493.
Robinson, D. and Foulds, L. (1981). Comparison of phylogenetic trees. Mathe-
matical Biosciences 53, 131–147.
Rose, A., Manikantan, S., Schraegle, S. J., Maloy, M. A., Stahlberg, E. A., and
Meier, I. (2004). Genome-wide identification of Arabidopsis coiled-coil pro-
teins and establishment of the ARABI-COIL database. Plant Physiology 134,
927–939.
Rose, A., Schraegle, S. J., Stahlberg, E. a., and Meier, I. (2005). Coiled-coil pro-
tein composition of 22 proteomes–differences and common themes in sub-
cellular infrastructure and traffic control. BMC Evolutionary Biology 5, 66.
Schneider, T. D. and Stephens, R. (1990). Sequence logos: a new way to display
consensus sequences. Nucleic Acids Research 18, 6097–6100.
Shannon, C. E. (1948). A mathematical theory of communication. The Bell Sys-
tem Technical Journal 27, 379–423.
Stamatakis, A. (2006). RAxML-VI-HPC: maximum likelihood-based phyloge-
netic analyses with thousands of taxa and mixed models. Bioinformatics 22,
2688–2690.
Thorne, J. L., Goldman, N., and Jones, D. T. (1996). Combining protein evolution
and secondary structure. Molecular Biology and Evolution 13, 666–673.
Thorne, J. L. (2000). Models of protein sequence evolution and their applications.
Current Opinion in Genetics & Development 10, 602–605.
Townsend, J. P. (2007). Profiling Phylogenetic Informativeness. Systematic Biol-
ogy 56, 222–231.
Vincent, T. L., Green, P. J., and Woolfson, D. N. (2013). LOGICOIL - Multi-state
prediction of coiled-coil oligomeric state. Bioinformatics 29, 69–76.
Walshaw, J., Gillespie, M. D., and Kelemen, G. H. (2010). A novel coiled-coil re-
peat variant in a class of bacterial cytoskeletal proteins. Journal of Structural
Biology 170, 202–215.
80 Chapter 2. Evolutionary patterns in coiled-coils
Whelan, S. and Goldman, N. (2001). A general empirical model of protein evo-
lution derived from multiple protein families using a maximum-likelihood
approach. Molecular Biology and Evolution 18, 691–699.
White, G. E. and Erickson, H. P. (2006). Sequence divergence of coiled coils –
structural rods, myosin filament packing, and the extraordinary conservation
of cohesins. Journal of Structural Biology 154, 111–121.
Wilcoxon, F. (1945). Individual Comparisons by Ranking Methods. Biometrics
Bulletin 1, 80.
Zhang, H., Chen, J., Wang, Y., Peng, L., Dong, X., Lu, Y., Keating, A. E., and
Jiang, T. (2009). A Computationally Guided Protein-Interaction Screen Un-
covers Coiled-Coil Interactions Involved in Vesicular Trafficking. Journal of
Molecular Biology 392, 228–241.
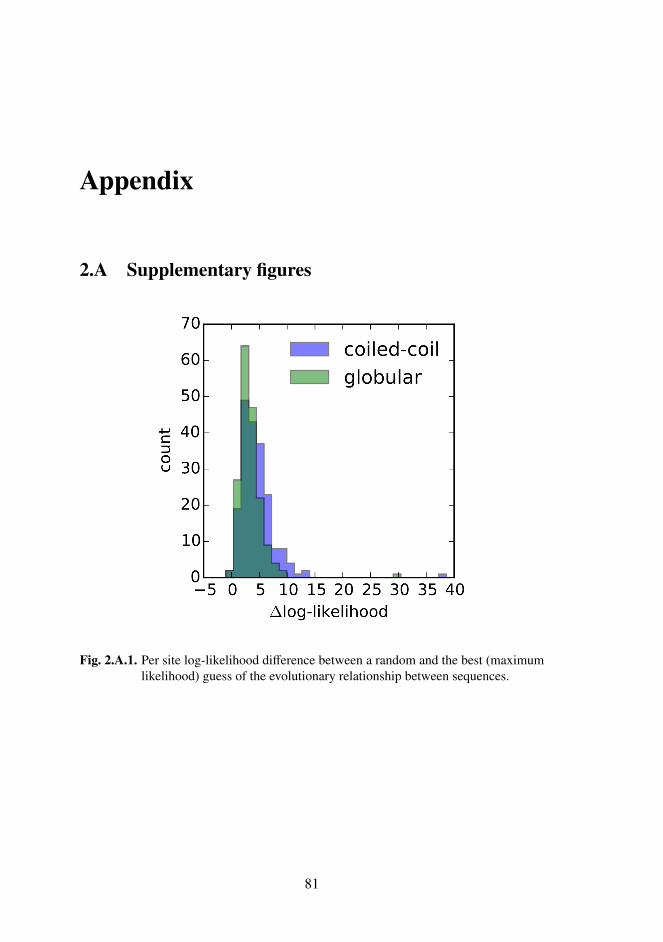
Appendix
2.A Supplementary figures
Fig. 2.A.1. Per site log-likelihood difference between a random and the best (maximumlikelihood) guess of the evolutionary relationship between sequences.
81
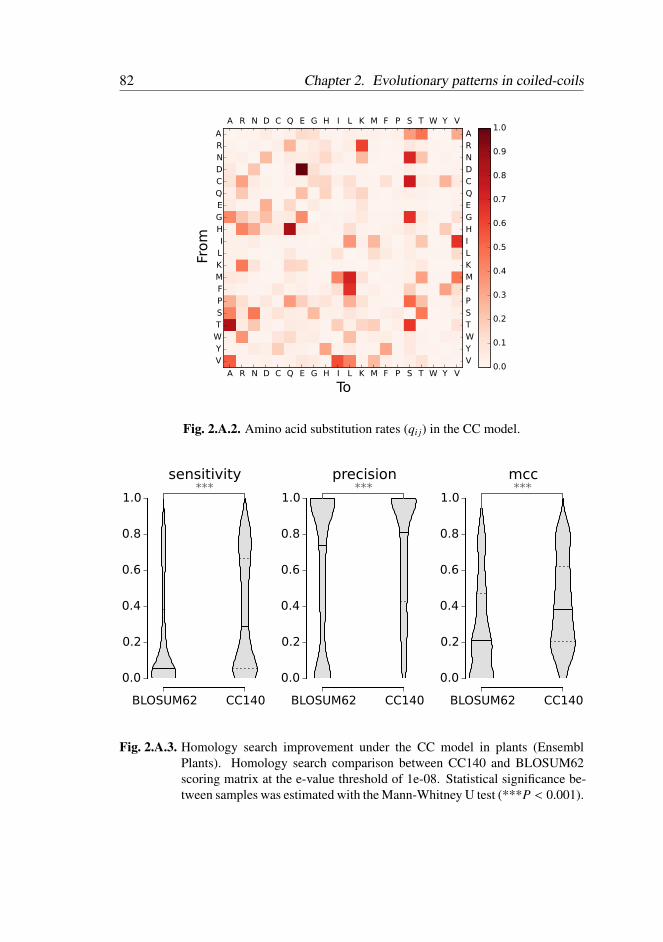
82 Chapter 2. Evolutionary patterns in coiled-coils
Fig. 2.A.2. Amino acid substitution rates (qi j) in the CC model.
Fig. 2.A.3. Homology search improvement under the CC model in plants (EnsemblPlants). Homology search comparison between CC140 and BLOSUM62scoring matrix at the e-value threshold of 1e-08. Statistical significance be-tween samples was estimated with the Mann-Whitney U test (***P < 0.001).
Chapter 3
Coiled-coil length: Size does matter
Abstract Chapter 3
P rotein evolution is governed by processes that alter primary sequence
but also the length of proteins. Protein length may change in differ-
ent ways, but insertions, deletions and duplications are the most common.
An optimal protein size is a trade-off between sequence extension, which
may change protein stability or lead to acquisition of a new function, and
shrinkage that decreases metabolic cost of protein synthesis. Despite the
general tendency for length conservation across orthologous proteins, the
propensity to accept insertions and deletions is heterogeneous along the
sequence. For example, protein regions rich in repetitive peptide motifs
are well known to extensively vary their length across species. Here,
we analyze length conservation of coiled-coils, domains formed by an
ubiquitous, repetitive peptide motif present in all domains of life, that
frequently plays a structural role in the cell. We observed that, despite
the repetitive nature, the length of coiled-coil domains is generally highly
conserved throughout the tree of life, even when the remaining parts of
the protein change, including globular domains. Length conservation is
independent of primary amino acid sequence variation, and represents a
conservation of domain physical size. This suggests that the conservation
of domain size is due to functional constraints.
This chapter has been published as: Jaroslaw Surkont, Yoan Diekmann, Pearl
V. Ryder, and José B. Pereira-Leal. Coiled-Coil Length: Size Does Matter. Pro-
teins: Structure, Function, and Bioinformatics 83:2162–2169.
Author contribution: Yoan Diekmann, Pearl V. Ryder performed preliminary ex-
periments. I conceived, designed and performed final experiments and analysed
the data. I wrote the paper together with José B. Pereira-Leal.

3.1. Introduction 85
3.1 Introduction
E volution shapes proteins via two fundamental processes: amino acid sub-
stitutions and insertion/deletion (indel) events. Any change in the primary
amino acid sequence may influence protein structure, stability, and function, yet
only indels alter sequence length. Sequence elongation can increase protein sta-
bility or improve its function, (Matsuura et al. 1999; Chow et al. 2003; Claverie
and Ogata 2003), but it also increases metabolic cost of protein synthesis (War-
ringer and Blomberg 2006); an optimal protein length is a trade-off between
sequence expansion and shrinkage that maximizes cell fitness. In contrast, non-
adaptive mechanisms contribute to sequence variation in general (Lynch 2007),
and may also contribute to protein length change. However, sequence length
is generally conserved across orthologous proteins (Zhang 2000; Wang 2004),
which suggests that within each group of orthologs the length has been largely
optimized. Likewise, length variation in the majority of globular domain families
is very limitedi (Sandhya et al. 2009). Given the general tendency to preserve
sequence length, it is interesting to observe high length variation in a number of
proteins, especially those containing repetitive motifs (e.g., leucine rich repeat,
tetratricopeptide repeat). Repeats primarily expand by internal tandem duplica-
tions (Andrade et al. 2001; Apic et al. 2001), their number can considerably
vary across orthologous proteins, greatly influencing the overall sequence length
and in turn protein size (Sandhya et al. 2009; Björklund, Ekman, et al. 2006),
which has been shown for KRAB zinc finger (Looman et al. 2002), LLR (Björk-
lund, Ekman, et al. 2006), and nebulin (Björklund, Light, et al. 2010) domains,
among others. For example in the case of Nebulin protein, the common ancestor
of human and chimpanzee underwent two tandem duplications that significantly
increased the number of nebulin domains and the overall length of the protein
by >1000 amino acids compared to other primates. Similar expansions were
observed in other branches of eukaryotes, which demonstrate, the propensity of
sequence repeats to rapidly change their overall length (Björklund, Light, et al.
2010). Less dramatic length changes, fewer amino acids in a single event are
caused by indel events. Contrary to domain duplications, where insertions of
long peptide chunks have global influence on protein structure, the impact of
86 Chapter 3. Coiled-coil length: Size does matter
indels is generally local (Birzele et al. 2008; Kim and Guo 2010). Indels oc-
cur ubiquitously within proteins; however, they do not usually occur everywhere,
for example, fewer indels (and substitutions) are expected within enzyme active
sites. The nonuniform indel distribution was partly addressed by Light et al. 2013
who observed higher indel frequency in proteins enriched in intrinsically disor-
dered regions in some eukaryotic groups, yet it is not an universal property. Con-
versely, Kenyon and Sabree 2014 observed, in obligate insect endosymbionts,
elevated length variation in both functional domains and unstructured linker re-
gions, which contradicts the expectation that functional structured domains are
less prone to changes. The nonuniform nature of indel distributions in sequences
still remains ambiguous.
Here, we focus on the length evolution of coiled-coil regions, ubiquitous
repetitive peptide motifs composing up to 10% of organism’s proteins, spread
throughout all domains of life (Liu and Rost 2001). The coiled-coil motif is a
heptad repeat of two hydrophobic amino acids separated by two and three polar
residues (HPPHPPPn) that predominantly forms rod-like structures comprising
two or more α-helices (Moutevelis and Woolfson 2009). Coiled-coil domains
often act as spacers that separate functional domains (e.g. motor proteins like
kinesins and myosins) or scaffolds of large complexes (e.g. the cartwheel of the
basal body), strongly influencing physical shapes, and sizes of both molecules
and organelles. Given the specific properties of coiled-coils, a repetitive α-
helical peptide motif likely forming rod-like structures, we expect that any change
in the number of residues forming the coiled-coil will impact the physical length
of the domain, while for a globular domain the effect on size (volume) would be
negligible. We hypothesize that unlike other repetitive sequences, coiled-coils
should be conserved due to constraints imposed by the physical shape and size
of the domain, crucial for the domain to perform its frequent structural roles;
any change in the number of amino acids will alter protein physical dimensions.
We addressed the hypothesis by (1) comparing length conservation of coiled-coil
and noncoiled-coil regions across the tree of life, (2) quantifying the relationship
between primary sequence length and physical size of the coiled-coil domains.
3.2. Materials and Methods 87
3.2 Materials and Methods
3.2.1 Data
All sequences were obtained from Ensembl (Flicek et al. 2014) (release 73),
eggNOG v4.0 (Powell et al. 2014) and GeneBank Benson et al. 2014. Ensembl
Compara was used for orthology mapping, unless explicitly stated otherwise.
Taxonomic information was obtained from NCBI Taxonomy database Benson
et al. 2014. Protein three-dimensional (3D) structures were downloaded from
Protein Data Bank Berman 2000.
3.2.2 Coiled-coil prediction
Sequence-based coiled-coil region prediction was done using Paircoil2 (McDon-
nell et al. 2006) and MARCOIL (Delorenzi and Speed 2002) with default pa-
rameters, the latter was used to confirm that the results are independent of the
coiled-coil prediction method (see discussion).
3.2.3 Protein alignment
MAFFT v7 (Katoh and Standley 2013) was used to build multiple sequence
alignments and needle (EMBOSS:6.5.7.0 Rice et al. 2000), which implements
the Needleman-Wunsch global alignment algorithm, for pairwise alignments.
3.2.4 Length variation
Given a set of orthologous proteins, coiled-coil regions were predicted in each
sequence and the total length was computed as the sum of the length of all re-
gions. Then the length variation was estimated as the standard deviation of the
length within a group of orthologs, values were log10-transformed. The length
of noncoiled-coil regions was calculated in a similar manner.
3.2.5 Sequence conservation
Sequence conservation of a protein region was calculated as the average Shannon
information entropy (Shannon 1948) of that region in a group of orthologous pro-
teins: a set of orthologous sequences was aligned and the entropy was calculated
88 Chapter 3. Coiled-coil length: Size does matter
for each column that belongs to the specified region. Conservation is defined as
the difference between the maximum and observed entropy, for more details see
Surkont and Pereira-Leal 2015.
3.2.6 Gene set enrichment analysis (GSEA)
Gorilla (Eden et al. 2009), a tool for identifying enriched GO terms (Ashburner
et al. 2000) in a ranked list of genes, was used to determine if coiled-coils with
the most/least conserved lengths share common biological functions. A sorted
list of genes, by coiled-coil length variation in the ascending/descending order,
was used as input.
3.3 Results
3.3.1 Coiled-coil domain length is conserved
We measured the level of coiled-coil domain length variation, defined as the stan-
dard deviation of the number of residues belonging to corresponding regions in
orthologous proteins, by comparing the length of coiled-coil and noncoiled-coil
regions in a set of metazoan species. To ensure that the result is independent
of the orthology prediction method, we used Ensembl Compara and eggNOG
databases, a phylogenetics-based and clustering-based method respectively. We
observed, for both orthology prediction methods, that the length of coiled-coil do-
mains is well conserved compared to non-coiled-coil regions (fig. 3.1a, Support-
ing Information fig. 3.B.1). On average (median values) length variation is ∼3.6
times lower in coiled-coils. To control for the influence of the underlying sec-
ondary structure on the length conservation of coiled-coil domain we compared
length variation of sequences forming α-helical structures inside and outside of
coiled-coil domains in a random sample of 500 groups of orthologous proteins;
PSIPRED (Jones 1999) was used for protein secondary structure prediction. We
observed that on average lengths of coiled-coil forming α-helices are signifi-
cantly more conserved compared to those outside of coiled-coil regions: median
variation of amino acid number is 13 and 17, respectively, (P values < 0.001,
Mann-Whitney test). This demonstrates that length of coiled-coil domains is
conserved beyond what would be expected solely from their secondary structure.
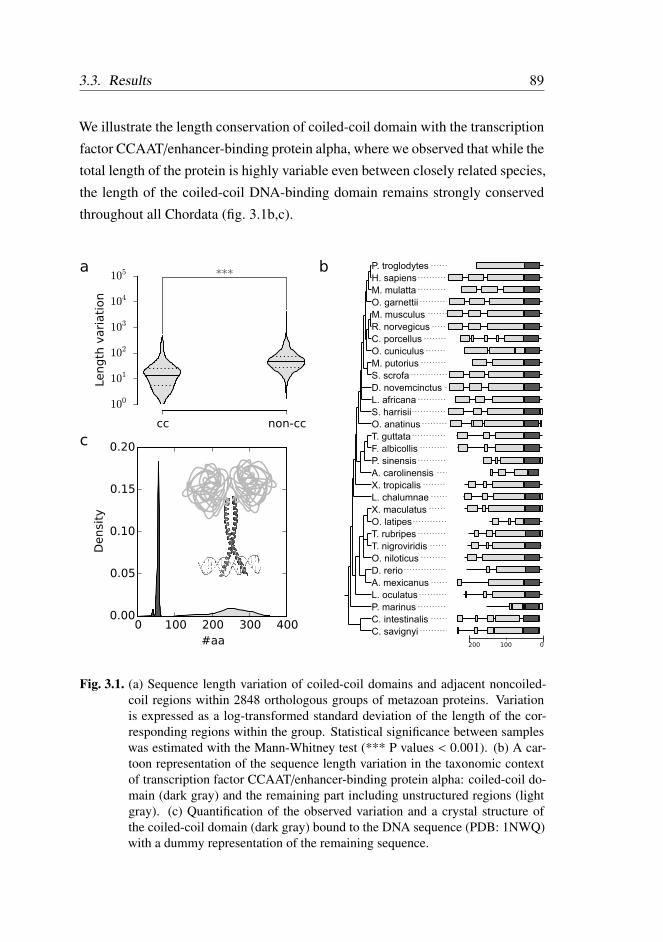
3.3. Results 89
We illustrate the length conservation of coiled-coil domain with the transcription
factor CCAAT/enhancer-binding protein alpha, where we observed that while the
total length of the protein is highly variable even between closely related species,
the length of the coiled-coil DNA-binding domain remains strongly conserved
throughout all Chordata (fig. 3.1b,c).
P. troglodytes
H. sapiens
M. mulatta
O. garnettii
M. musculus
R. norvegicus
C. porcellus
O. cuniculus
M. putorius
S. scrofa
D. novemcinctus
L. africana
S. harrisii
O. anatinus
T. guttata
F. albicollis
P. sinensis
A. carolinensis
X. tropicalis
L. chalumnae
X. maculatus
O. latipes
T. rubripes
T. nigroviridis
O. niloticus
D. rerio
A. mexicanus
L. oculatus
P. marinus
C. intestinalis
C. savignyi
200 0100
a b
c
Fig. 3.1. (a) Sequence length variation of coiled-coil domains and adjacent noncoiled-coil regions within 2848 orthologous groups of metazoan proteins. Variationis expressed as a log-transformed standard deviation of the length of the cor-responding regions within the group. Statistical significance between sampleswas estimated with the Mann-Whitney test (*** P values < 0.001). (b) A car-toon representation of the sequence length variation in the taxonomic contextof transcription factor CCAAT/enhancer-binding protein alpha: coiled-coil do-main (dark gray) and the remaining part including unstructured regions (lightgray). (c) Quantification of the observed variation and a crystal structure ofthe coiled-coil domain (dark gray) bound to the DNA sequence (PDB: 1NWQ)with a dummy representation of the remaining sequence.
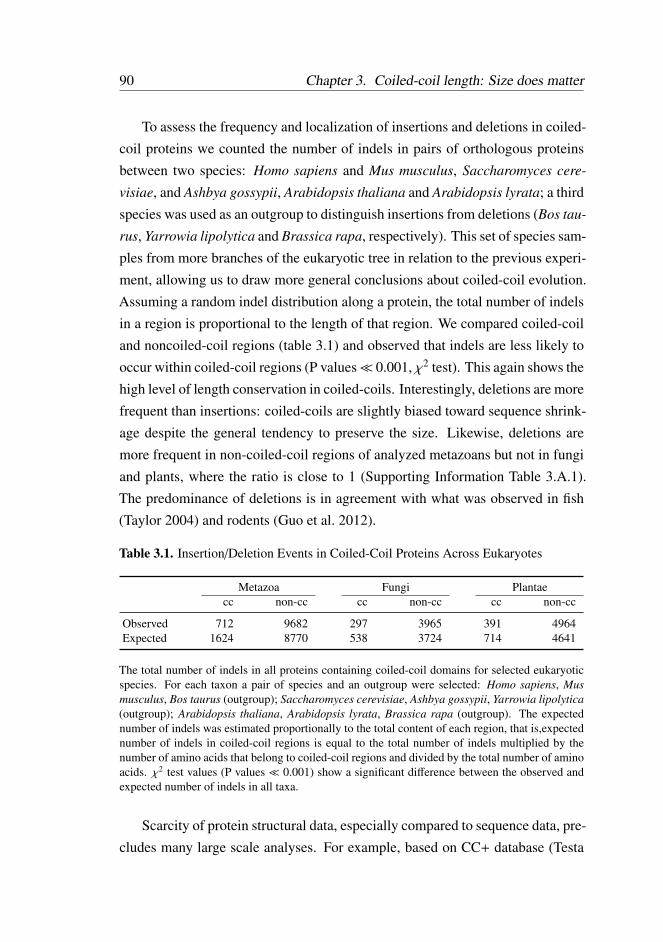
90 Chapter 3. Coiled-coil length: Size does matter
To assess the frequency and localization of insertions and deletions in coiled-
coil proteins we counted the number of indels in pairs of orthologous proteins
between two species: Homo sapiens and Mus musculus, Saccharomyces cere-
visiae, and Ashbya gossypii, Arabidopsis thaliana and Arabidopsis lyrata; a third
species was used as an outgroup to distinguish insertions from deletions (Bos tau-
rus, Yarrowia lipolytica and Brassica rapa, respectively). This set of species sam-
ples from more branches of the eukaryotic tree in relation to the previous experi-
ment, allowing us to draw more general conclusions about coiled-coil evolution.
Assuming a random indel distribution along a protein, the total number of indels
in a region is proportional to the length of that region. We compared coiled-coil
and noncoiled-coil regions (table 3.1) and observed that indels are less likely to
occur within coiled-coil regions (P values≪ 0.001, χ2 test). This again shows the
high level of length conservation in coiled-coils. Interestingly, deletions are more
frequent than insertions: coiled-coils are slightly biased toward sequence shrink-
age despite the general tendency to preserve the size. Likewise, deletions are
more frequent in non-coiled-coil regions of analyzed metazoans but not in fungi
and plants, where the ratio is close to 1 (Supporting Information Table 3.A.1).
The predominance of deletions is in agreement with what was observed in fish
(Taylor 2004) and rodents (Guo et al. 2012).
Table 3.1. Insertion/Deletion Events in Coiled-Coil Proteins Across Eukaryotes
Metazoa Fungi Plantaecc non-cc cc non-cc cc non-cc
Observed 712 9682 297 3965 391 4964Expected 1624 8770 538 3724 714 4641
The total number of indels in all proteins containing coiled-coil domains for selected eukaryoticspecies. For each taxon a pair of species and an outgroup were selected: Homo sapiens, Mus
musculus, Bos taurus (outgroup); Saccharomyces cerevisiae, Ashbya gossypii, Yarrowia lipolytica
(outgroup); Arabidopsis thaliana, Arabidopsis lyrata, Brassica rapa (outgroup). The expectednumber of indels was estimated proportionally to the total content of each region, that is,expectednumber of indels in coiled-coil regions is equal to the total number of indels multiplied by thenumber of amino acids that belong to coiled-coil regions and divided by the total number of aminoacids. χ2 test values (P values ≪ 0.001) show a significant difference between the observed andexpected number of indels in all taxa.
Scarcity of protein structural data, especially compared to sequence data, pre-
cludes many large scale analyses. For example, based on CC+ database (Testa
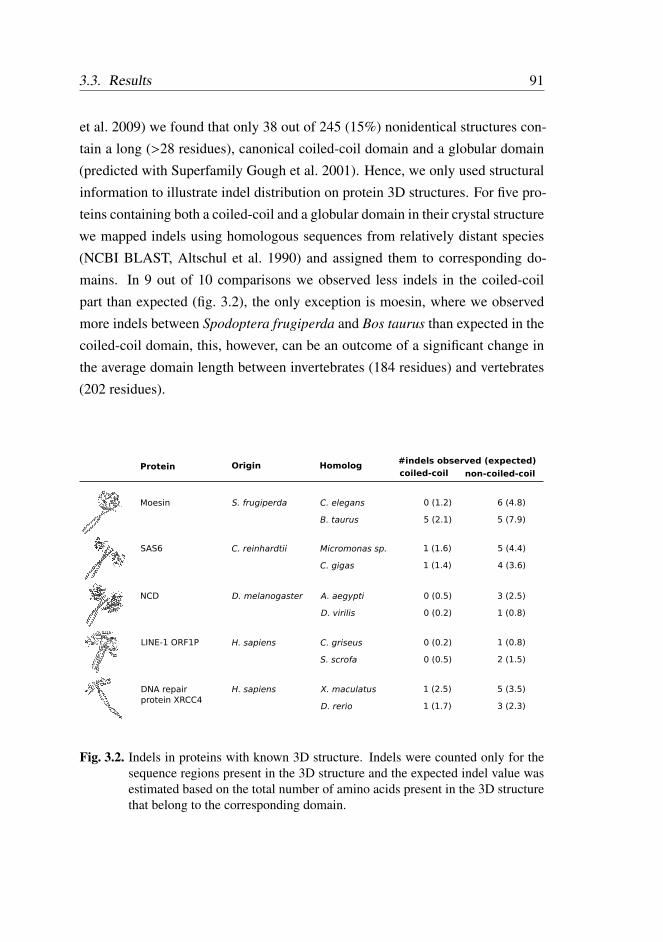
3.3. Results 91
et al. 2009) we found that only 38 out of 245 (15%) nonidentical structures con-
tain a long (>28 residues), canonical coiled-coil domain and a globular domain
(predicted with Superfamily Gough et al. 2001). Hence, we only used structural
information to illustrate indel distribution on protein 3D structures. For five pro-
teins containing both a coiled-coil and a globular domain in their crystal structure
we mapped indels using homologous sequences from relatively distant species
(NCBI BLAST, Altschul et al. 1990) and assigned them to corresponding do-
mains. In 9 out of 10 comparisons we observed less indels in the coiled-coil
part than expected (fig. 3.2), the only exception is moesin, where we observed
more indels between Spodoptera frugiperda and Bos taurus than expected in the
coiled-coil domain, this, however, can be an outcome of a significant change in
the average domain length between invertebrates (184 residues) and vertebrates
(202 residues).
Homolog#indels observed (expected)
coiled-coil non-coiled-coilOriginProtein
Moesin C. elegans
B. taurus
S. frugiperda
SAS6 Micromonas sp.
C. gigas
C. reinhardtii
NCD A. aegypti
D. virilis
D. melanogaster
LINE-1 ORF1P C. griseus
S. scrofa
H. sapiens
DNA repair
protein XRCC4
X. maculatus
D. rerio
H. sapiens
0 (1.2)
5 (2.1)
1 (1.6)
1 (1.4)
0 (0.5)
0 (0.2)
0 (0.2)
0 (0.5)
1 (2.5)
1 (1.7)
6 (4.8)
5 (7.9)
5 (4.4)
4 (3.6)
3 (2.5)
1 (0.8)
1 (0.8)
2 (1.5)
5 (3.5)
3 (2.3)
Fig. 3.2. Indels in proteins with known 3D structure. Indels were counted only for thesequence regions present in the 3D structure and the expected indel value wasestimated based on the total number of amino acids present in the 3D structurethat belong to the corresponding domain.
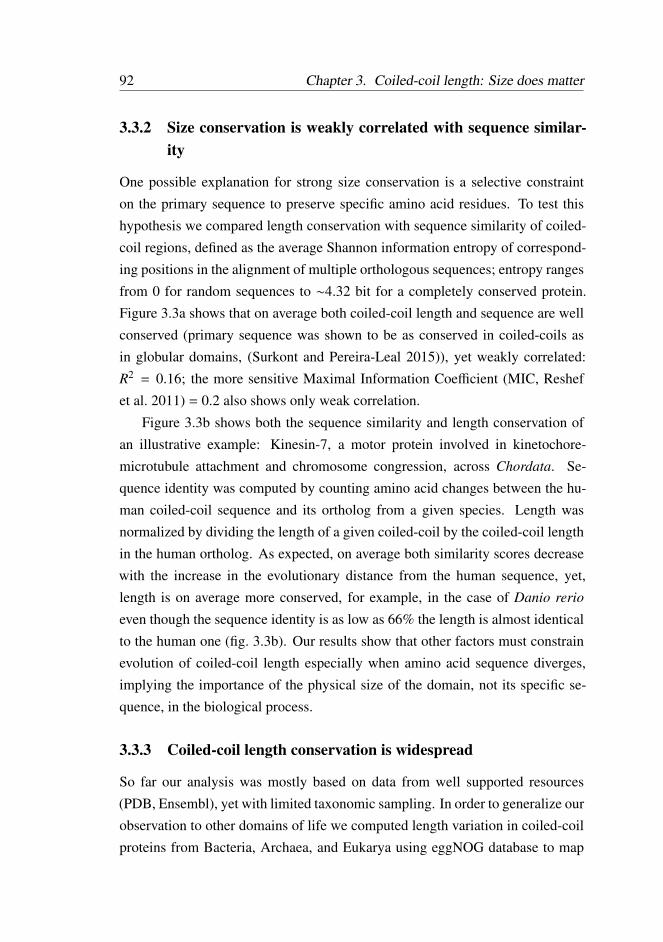
92 Chapter 3. Coiled-coil length: Size does matter
3.3.2 Size conservation is weakly correlated with sequence similar-
ity
One possible explanation for strong size conservation is a selective constraint
on the primary sequence to preserve specific amino acid residues. To test this
hypothesis we compared length conservation with sequence similarity of coiled-
coil regions, defined as the average Shannon information entropy of correspond-
ing positions in the alignment of multiple orthologous sequences; entropy ranges
from 0 for random sequences to ∼4.32 bit for a completely conserved protein.
Figure 3.3a shows that on average both coiled-coil length and sequence are well
conserved (primary sequence was shown to be as conserved in coiled-coils as
in globular domains, (Surkont and Pereira-Leal 2015)), yet weakly correlated:
R2 = 0.16; the more sensitive Maximal Information Coefficient (MIC, Reshef
et al. 2011) = 0.2 also shows only weak correlation.
Figure 3.3b shows both the sequence similarity and length conservation of
an illustrative example: Kinesin-7, a motor protein involved in kinetochore-
microtubule attachment and chromosome congression, across Chordata. Se-
quence identity was computed by counting amino acid changes between the hu-
man coiled-coil sequence and its ortholog from a given species. Length was
normalized by dividing the length of a given coiled-coil by the coiled-coil length
in the human ortholog. As expected, on average both similarity scores decrease
with the increase in the evolutionary distance from the human sequence, yet,
length is on average more conserved, for example, in the case of Danio rerio
even though the sequence identity is as low as 66% the length is almost identical
to the human one (fig. 3.3b). Our results show that other factors must constrain
evolution of coiled-coil length especially when amino acid sequence diverges,
implying the importance of the physical size of the domain, not its specific se-
quence, in the biological process.
3.3.3 Coiled-coil length conservation is widespread
So far our analysis was mostly based on data from well supported resources
(PDB, Ensembl), yet with limited taxonomic sampling. In order to generalize our
observation to other domains of life we computed length variation in coiled-coil
proteins from Bacteria, Archaea, and Eukarya using eggNOG database to map
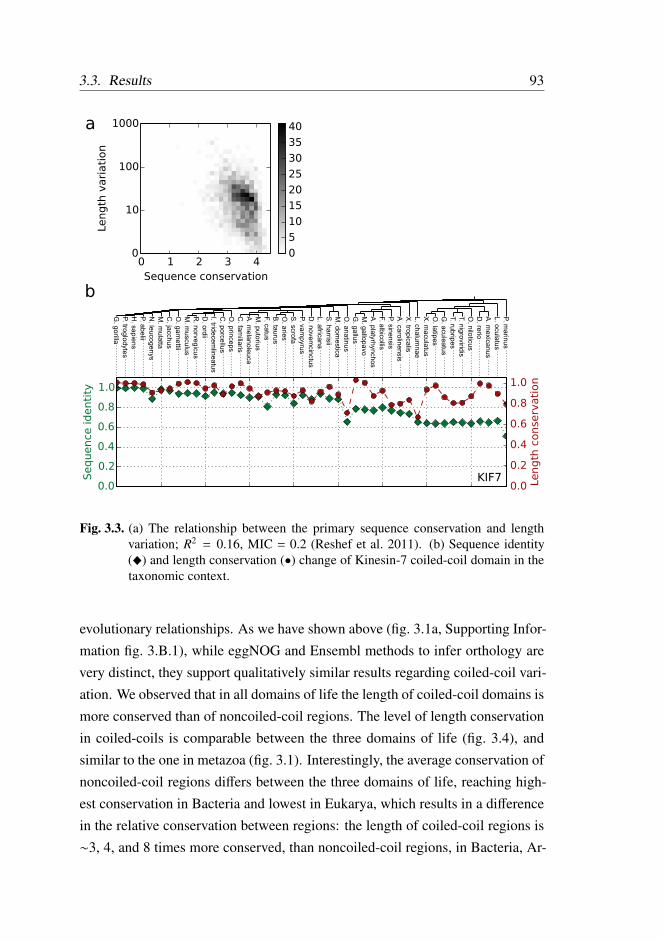
3.3. Results 93
a
b
P. m
arin
us
L. o
cula
tus
A. m
exic
an
us
D. re
rio
O. n
ilotic
us
T. n
igro
virid
is
T. ru
brip
es
G. a
cule
atu
s
O. la
tipes
X. m
acula
tus
L. c
halu
mn
ae
X. tro
pic
alis
A. c
aro
linensis
P. s
inensis
F. a
lbic
ollis
A. p
laty
rhyn
chos
M. g
allo
pavo
G. g
allu
s
O. a
natin
us
M. d
om
estic
a
S. h
arris
ii
L. a
fricana
D. n
ovem
cin
ctu
s
P. v
am
pyru
s
S. s
cro
fa
O. a
ries
B. ta
uru
s
F. c
atu
s
M. p
uto
rius
A. m
ela
nole
uca
C. fa
milia
ris
O. p
rinceps
C. p
orc
ellu
s
I. tridecem
lineatu
s
D. o
rdii
R. n
orv
egic
us
M. m
usculu
s
O. g
arn
ettii
C. ja
cchus
M. m
ula
tta
N. le
ucogen
ys
P. a
belii
H. s
apie
ns
P. tro
glo
dyte
s
G. g
orilla
KIF7
Fig. 3.3. (a) The relationship between the primary sequence conservation and lengthvariation; R2 = 0.16, MIC = 0.2 (Reshef et al. 2011). (b) Sequence identity(_) and length conservation (•) change of Kinesin-7 coiled-coil domain in thetaxonomic context.
evolutionary relationships. As we have shown above (fig. 3.1a, Supporting Infor-
mation fig. 3.B.1), while eggNOG and Ensembl methods to infer orthology are
very distinct, they support qualitatively similar results regarding coiled-coil vari-
ation. We observed that in all domains of life the length of coiled-coil domains is
more conserved than of noncoiled-coil regions. The level of length conservation
in coiled-coils is comparable between the three domains of life (fig. 3.4), and
similar to the one in metazoa (fig. 3.1). Interestingly, the average conservation of
noncoiled-coil regions differs between the three domains of life, reaching high-
est conservation in Bacteria and lowest in Eukarya, which results in a difference
in the relative conservation between regions: the length of coiled-coil regions is
∼3, 4, and 8 times more conserved, than noncoiled-coil regions, in Bacteria, Ar-
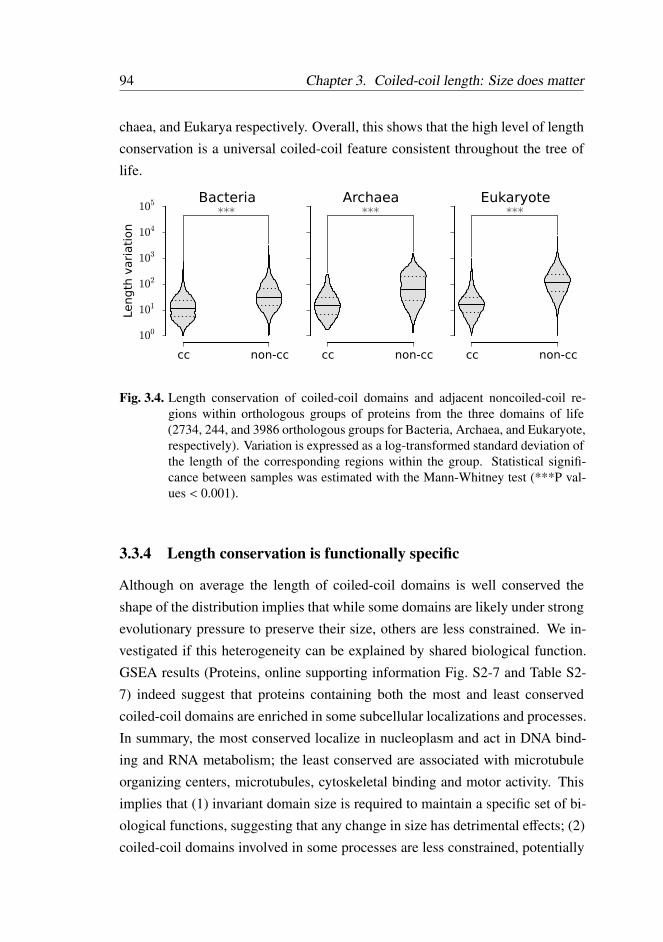
94 Chapter 3. Coiled-coil length: Size does matter
chaea, and Eukarya respectively. Overall, this shows that the high level of length
conservation is a universal coiled-coil feature consistent throughout the tree of
life.
Fig. 3.4. Length conservation of coiled-coil domains and adjacent noncoiled-coil re-gions within orthologous groups of proteins from the three domains of life(2734, 244, and 3986 orthologous groups for Bacteria, Archaea, and Eukaryote,respectively). Variation is expressed as a log-transformed standard deviation ofthe length of the corresponding regions within the group. Statistical signifi-cance between samples was estimated with the Mann-Whitney test (***P val-ues < 0.001).
3.3.4 Length conservation is functionally specific
Although on average the length of coiled-coil domains is well conserved the
shape of the distribution implies that while some domains are likely under strong
evolutionary pressure to preserve their size, others are less constrained. We in-
vestigated if this heterogeneity can be explained by shared biological function.
GSEA results (Proteins, online supporting information Fig. S2-7 and Table S2-
7) indeed suggest that proteins containing both the most and least conserved
coiled-coil domains are enriched in some subcellular localizations and processes.
In summary, the most conserved localize in nucleoplasm and act in DNA bind-
ing and RNA metabolism; the least conserved are associated with microtubule
organizing centers, microtubules, cytoskeletal binding and motor activity. This
implies that (1) invariant domain size is required to maintain a specific set of bi-
ological functions, suggesting that any change in size has detrimental effects; (2)
coiled-coil domains involved in some processes are less constrained, potentially

3.3. Results 95
being able to quickly diversify, emerging new functions or developing species-
specific properties. In fact, in centrosomes where coiled-coil length tends to be
less conserved, we recently showed that orthologous regulators were unable to
complement loss of function in other species, supporting the notion of species
specificity of the properties of these variable coiled-coils (Carvalho-Santos et al.
2010).
3.3.5 3D-size is conserved in coiled-coils
We showed that the lengths of amino acid sequences that compose coiled-coil
domains are conserved and the level of conservation is related to the biological
process. Given the coiled-coil propensity to form distinct rod-like 3D structures
we hypothesized that physical size was the determining factor, expecting thus a
correlation between the sequence length and the physical size/length. To quantify
this relationship we collected the full set of non-redundant (≤ 70%) 3D structures
containing long (>28 residues), canonical coiled-coil domains from the CC+
database (Testa et al. 2009), obtaining 221 proteins. All most common oligomer-
ization states (dimers, trimers and tetramers) were present among the structures,
the complete list of structures and their oligomeric states is included in the Online
Supporting Information (Table S8). Coiled-coil domain size (length), defined as
the Euclidean distance between outermost atoms that belong to the coiled-coil,
was measured based on coiled-coil annotations (SOCKET, Walshaw and Woolf-
son 2001) retrieved from the CC+ database. Figure 3.5 shows that the physi-
cal length of a coiled-coil domain is proportional to the number of amino acids
(R2 = 0.99); the average length of a single residue is 1.48 ± 0.02Å, so a single
heptade repeat is ∼ 1 nm long. The figure also illustrates the distribution of size
in a set of >200 nonredundant, randomly selected structures (from Protein Data
Bank) of noncoiled-coil domains. Here, domain size is approximated by radius
of gyration (an overall spread of a molecule); for a coiled-coil domain radius of
gyration is proportional to domain length (data not shown). The observed corre-
lation of domain size and sequence length in noncoiled-coil domains (R2 = 0.55)
is much lower compared with coiled-coils. Even though we restricted the anal-
ysis to coiled-coil domains formed by multiple peptide chains, we observed a
similar correlation (0.99) for domains formed with a single polypeptide chain

96 Chapter 3. Coiled-coil length: Size does matter
(minority of observed cases), yet with a smaller regression slope 0.73 (data not
shown). Irrespectively of the slope of the regression line, the analysis shows that
the number of residues forming the coiled-coil domain can serve as a proxy to
assess a physical quantity, the domain length. This implies that conservation of
sequence length corresponds to conservation of three-dimensional length of the
domain.
Fig. 3.5. Correlation of sequence length and physical size of protein domains. Coiled-coil size/length is defined as the distance between outermost atoms that formthe domain (black, •). Noncoiled-coil domain size is described by radius ofgyration (gray, ×).
3.4 Discussion
In this work, we analyzed sequence length evolution in coiled-coil proteins. We
showed that unlike other repeat domains the length of coiled-coil domains is
highly conserved and typically less variable than the remaining part of the pro-
tein, including globular domains. Unique coiled-coil properties, a repetitive hep-
tad pattern forming rod-like domains, result in the explicit relationship between
the primary sequence length and the physical size of the 3D domain structure.
This may explain high conservation of coiled-coils: any indel event affects not
3.4. Discussion 97
only the length of the primary sequence but also changes the physical size of the
domain, which in turn can influence the structure and interactions formed by the
domain, and as the consequence impair its function. For example, truncation of
Bld10p, a coiled-coil protein present in the basal body cartwheel, changes not
only the size of entire structure, but also its symmetry (Hiraki et al. 2007). In the
case of cytoplasmic dynein both shortening and lengthening of the stalk-forming
coiled-coil largely reduces the speed of the motor (Carter et al. 2008). Deletion or
insertion of coiled-coil repeats not only changes the size of that domain but can
even contribute to change in size of other, nonamino acid based polymers: in the
WbdA-WbdD bacterial complex the coiled-coil domain is a molecular ruler that
determines the length of the polysaccharide molecule synthesized by the com-
plex (Hagelueken et al. 2014). Length conservation is independent of primary
sequence conservation (sequence similarity), which means that even though the
amino acid sequence of a coiled-coil may significantly change across evolution
of orthologous proteins, the length is maintained. Our results are independent
of the methods used to detect coiled-coils, as both Paircoil2 (McDonnell et al.
2006) and MARCOIL (Delorenzi and Speed 2002) give the same results (data
not shown).
Previous studies demonstrated that while the primary sequence length of an
average protein is relatively conserved throughout evolution, the propensity to
accept indels is heterogeneous along the sequence. This is particularly evident
in regions containing repetitive motifs that are susceptible to frequent length
changes. Hence, it is very interesting to observe a high level of conservation
in the highly repetitive coiled-coil domains. This is probably due to the unique
relationship between primary sequence length and the physical size of the do-
main, and the common biological role of the coiled-coil as spacers and scaffolds.
To our knowledge, this is the first study that describes protein size evolution not
solely as the evolution of protein’s primary sequence length, but also its physical
size.
Acknowledgments
The authors thank all members of the Computational Genomics Laboratory for
helpful discussions. Swadhin Jana, Krzysztof Kus and Paula Ramos-Silva for
98 Chapter 3. Coiled-coil length: Size does matter
reading the manuscript. An anonymous reviewer for constructive comments that
helped to substantially improve the manuscript. Initial work was performed as an
Evolutionary Cell Biology project in the context of the 2012 Physiology Course
at the MBL. Financial support is thus also acknowledged by the MBL (J.P.L.,
Y.D., and P.R.) and Fundação Luso-Americana para o Desenvolvimento (J.P.L.)
References 99
References
Altschul, S. F., Gish, W., Miller, W., Myers, E. W., and Lipman, D. J. (1990).
Basic local alignment search tool. Journal of Molecular Biology 215, 403–
410.
Andrade, M. a., Petosa, C., O’Donoghue, S. I., Müller, C. W., and Bork, P. (2001).
Comparison of ARM and HEAT protein repeats. Journal of Molecular Biol-
ogy 309, 1–18.
Apic, G., Gough, J., and Teichmann, S. a. (2001). Domain combinations in ar-
chaeal, eubacterial and eukaryotic proteomes. Journal of Molecular Biology
310, 311–325.
Ashburner, M., Ball, C. A., Blake, J. A., Botstein, D., Butler, H., Cherry, J. M.,
Davis, A. P., Dolinski, K., Dwight, S. S., Eppig, J. T., Harris, M. A., Hill, D. P.,
Issel-Tarver, L., Kasarskis, A., Lewis, S., Matese, J. C., Richardson, J. E.,
Ringwald, M., Rubin, G. M., and Sherlock, G. (2000). Gene Ontology: tool
for the unification of biology. Nature Genetics 25, 25–29.
Benson, D. a., Clark, K., Karsch-Mizrachi, I., Lipman, D. J., Ostell, J., and Say-
ers, E. W. (2014). GenBank. Nucleic Acids Research 42, D32–D37.
Berman, H. M. (2000). The Protein Data Bank. Nucleic Acids Research 28, 235–
242.
Birzele, F., Csaba, G., and Zimmer, R. (2008). Alternative splicing and protein
structure evolution. Nucleic Acids Research 36, 550–558.
Björklund, Å. K., Ekman, D., and Elofsson, A. (2006). Expansion of Protein Do-
main Repeats. PLoS Computational Biology 2, e114.
Björklund, Å. K., Light, S., Sagit, R., and Elofsson, A. (2010). Nebulin: A Study
of Protein Repeat Evolution. Journal of Molecular Biology 402, 38–51.
Carter, A. P., Garbarino, J. E., Wilson-Kubalek, E. M., Shipley, W. E., Cho, C.,
Milligan, R. a., Vale, R. D., and Gibbons, I. R. (2008). Structure and Func-
tional Role of Dynein’s Microtubule-Binding Domain. Science 322, 1691–
1695.
Carvalho-Santos, Z., Machado, P., Branco, P., Tavares-Cadete, F., Rodrigues-
Martins, A., Pereira-Leal, J. B., and Bettencourt-Dias, M. (2010). Stepwise
evolution of the centriole-assembly pathway. Journal of Cell Science 123,
1414–1426.
100 Chapter 3. Coiled-coil length: Size does matter
Chow, C. C., Chow, C., Raghunathan, V., Huppert, T. J., Kimball, E. B., and
Cavagnero, S. (2003). Chain length dependence of apomyoglobin folding:
structural evolution from misfolded sheets to native helices. Biochemistry
42, 7090–9.
Claverie, J.-M. and Ogata, H. (2003). The insertion of palindromic repeats in the
evolution of proteins. Trends in Biochemical Sciences 28, 75–80.
Delorenzi, M. and Speed, T. (2002). An HMM model for coiled-coil domains and
a comparison with PSSM-based predictions. Bioinformatics 18, 617–625.
Eden, E., Navon, R., Steinfeld, I., Lipson, D., and Yakhini, Z. (2009). GOrilla:
a tool for discovery and visualization of enriched GO terms in ranked gene
lists. BMC Bioinformatics 10, 48.
Flicek, P., Amode, M. R., Barrell, D., Beal, K., Billis, K., et al. (2014). Ensembl
2014. Nucleic Acids Research 42, 749–755.
Gough, J., Karplus, K., Hughey, R., and Chothia, C. (2001). Assignment of ho-
mology to genome sequences using a library of hidden Markov models that
represent all proteins of known structure. Journal of Molecular Biology 313,
903–919.
Guo, B., Zou, M., and Wagner, A. (2012). Pervasive Indels and Their Evolu-
tionary Dynamics after the Fish-Specific Genome Duplication. Molecular
Biology and Evolution 29, 3005–3022.
Hagelueken, G., Clarke, B. R., Huang, H., Tuukkanen, A., Danciu, I., Svergun,
D. I., Hussain, R., Liu, H., Whitfield, C., and Naismith, J. H. (2014). A coiled-
coil domain acts as a molecular ruler to regulate O-antigen chain length in
lipopolysaccharide. Nature Structural &Molecular Biology 22, 50–56.
Hiraki, M., Nakazawa, Y., Kamiya, R., and Hirono, M. (2007). Bld10p Consti-
tutes the Cartwheel-Spoke Tip and Stabilizes the 9-Fold Symmetry of the
Centriole. Current Biology 17, 1778–1783.
Jones, D. T. (1999). Protein secondary structure prediction based on position-
specific scoring matrices. Journal of Molecular Biology 292, 195–202.
Katoh, K. and Standley, D. M. (2013). MAFFT Multiple Sequence Alignment
Software Version 7: Improvements in Performance and Usability. Molecular
Biology and Evolution 30, 772–780.
References 101
Kenyon, L. J. and Sabree, Z. L. (2014). Obligate Insect Endosymbionts Exhibit
Increased Ortholog Length Variation and Loss of Large Accessory Proteins
Concurrent with Genome Shrinkage. Genome Biology and Evolution 6, 763–
775.
Kim, R. and Guo, J.-t. (2010). Systematic analysis of short internal indels and
their impact on protein folding. BMC Structural Biology 10, 24.
Light, S., Sagit, R., Sachenkova, O., Ekman, D., and Elofsson, A. (2013). Pro-
tein Expansion Is Primarily due to Indels in Intrinsically Disordered Regions.
Molecular Biology and Evolution 30, 2645–2653.
Liu, J. and Rost, B. (2001). Comparing function and structure between entire
proteomes. Protein Science 10, 1970–1979.
Looman, C., Abrink, M., Mark, C., and Hellman, L. (2002). KRAB zinc finger
proteins: an analysis of the molecular mechanisms governing their increase
in numbers and complexity during evolution. Molecular Biology and Evolu-
tion 19, 2118–2130.
Lynch, M. (2007). The frailty of adaptive hypotheses for the origins of organ-
ismal complexity. Proceedings of the National Academy of Sciences 104,
8597–8604.
Matsuura, T., Miyai, K., Trakulnaleamsai, S., Yomo, T., Shima, Y., Miki, S., Ya-
mamoto, K., and Urabe, I. (1999). Evolutionary molecular engineering by
random elongation mutagenesis. Nature Biotechnology 17, 58–61.
McDonnell, A. V., Jiang, T., Keating, A. E., and Berger, B. (2006). Paircoil2:
improved prediction of coiled coils from sequence. Bioinformatics 22, 356–
8.
Moutevelis, E. and Woolfson, D. N. (2009). A Periodic Table of Coiled-Coil Pro-
tein Structures. Journal of Molecular Biology 385, 726–732.
Powell, S., Forslund, K., Szklarczyk, D., Trachana, K., Roth, A., Huerta-Cepas,
J., Gabaldón, T., Rattei, T., Creevey, C., Kuhn, M., Jensen, L. J., Mering, C.
von, and Bork, P. (2014). eggNOG v4.0: nested orthology inference across
3686 organisms. Nucleic Acids Research 42, D231–D239.
Reshef, D. N., Reshef, Y. A., Finucane, H. K., Grossman, S. R., McVean, G., Turn-
baugh, P. J., Lander, E. S., Mitzenmacher, M., and Sabeti, P. C. (2011). De-
tecting Novel Associations in Large Data Sets. Science 334, 1518–1524.
102 Chapter 3. Coiled-coil length: Size does matter
Rice, P., Longden, I., and Bleasby, A. (2000). EMBOSS: The European Molecu-
lar Biology Open Software Suite. Trends in Genetics 16, 276–277.
Sandhya, S., Rani, S. S., Pankaj, B., Govind, M. K., Offmann, B., Srinivasan,
N., and Sowdhamini, R. (2009). Length Variations amongst Protein Domain
Superfamilies and Consequences on Structure and Function. PLoS ONE 4,
e4981.
Shannon, C. E. (1948). A mathematical theory of communication. The Bell Sys-
tem Technical Journal 27, 379–423.
Surkont, J. and Pereira-Leal, J. B. (2015). Evolutionary patterns in coiled-coils.
Genome Biology and Evolution 7, 545–556.
Taylor, M. S. (2004). Occurrence and Consequences of Coding Sequence Inser-
tions and Deletions in Mammalian Genomes. Genome Research 14, 555–
566.
Testa, O. D., Moutevelis, E., and Woolfson, D. N. (2009). CC+: a relational data-
base of coiled-coil structures. Nucleic Acids Research 37, D315–D322.
Walshaw, J. and Woolfson, D. N. (2001). Socket: a program for identifying and
analysing coiled-coil motifs within protein structures. Journal of Molecular
Biology 307, 1427–1450.
Wang, D. (2004). A General Tendency for Conservation of Protein Length Across
Eukaryotic Kingdoms. Molecular Biology and Evolution 22, 142–147.
Warringer, J. and Blomberg, A. (2006). Evolutionary constraints on yeast protein
size. BMC Evolutionary Biology 6, 61.
Zhang, J. (2000). Protein-length distributions for the three domains of life. Trends
in Genetics 16, 107–109.
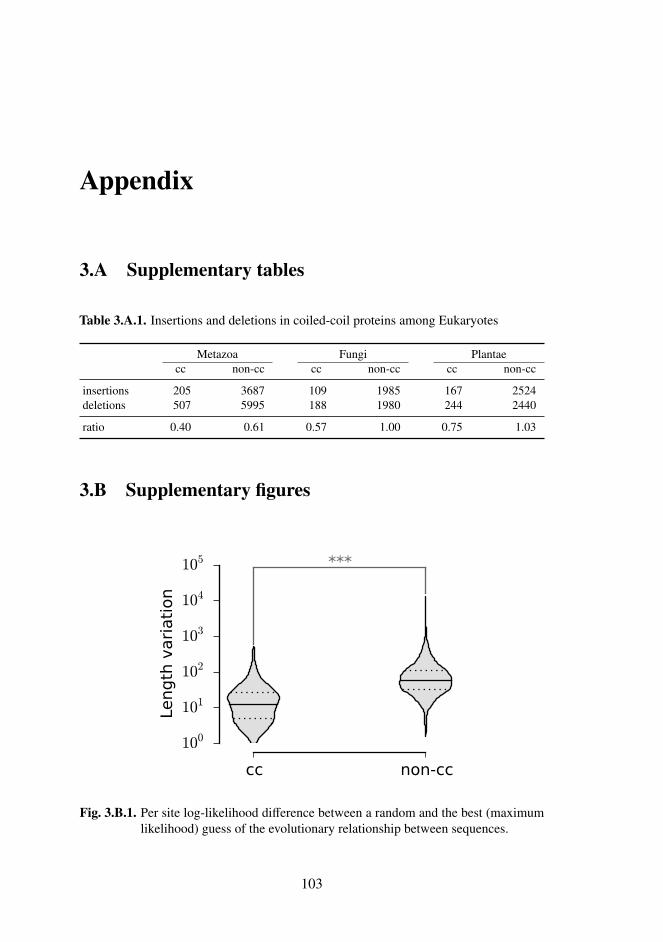
Appendix
3.A Supplementary tables
Table 3.A.1. Insertions and deletions in coiled-coil proteins among Eukaryotes
Metazoa Fungi Plantaecc non-cc cc non-cc cc non-cc
insertions 205 3687 109 1985 167 2524deletions 507 5995 188 1980 244 2440
ratio 0.40 0.61 0.57 1.00 0.75 1.03
3.B Supplementary figures
Fig. 3.B.1. Per site log-likelihood difference between a random and the best (maximumlikelihood) guess of the evolutionary relationship between sequences.
103

104 Chapter 3. Coiled-coil length: Size does matter
Chapter 4
Rabifier2: an improved bioinformatic
classifier of Rab GTPases
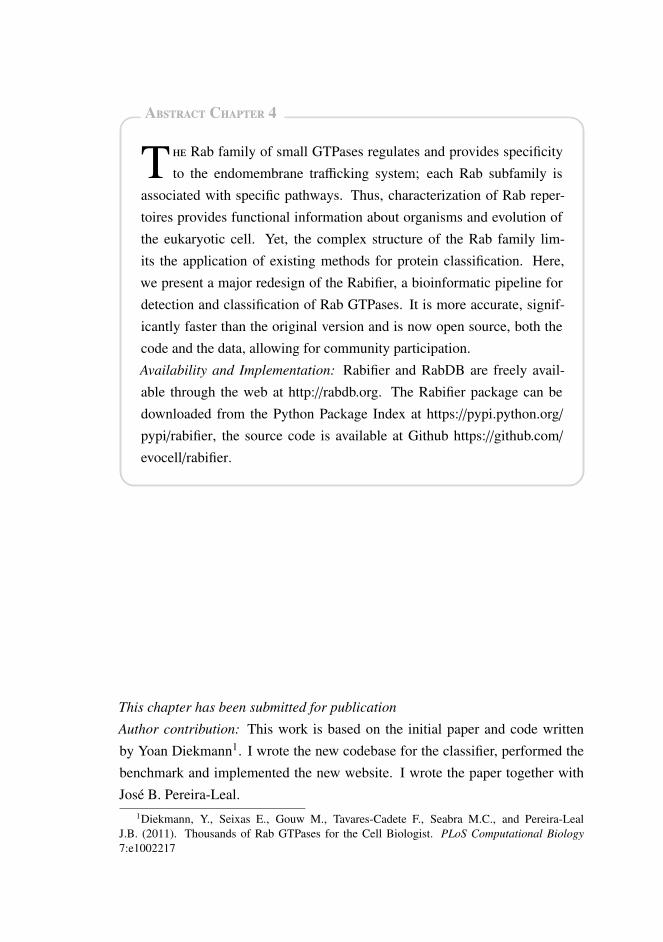
Abstract Chapter 4
T he Rab family of small GTPases regulates and provides specificity
to the endomembrane trafficking system; each Rab subfamily is
associated with specific pathways. Thus, characterization of Rab reper-
toires provides functional information about organisms and evolution of
the eukaryotic cell. Yet, the complex structure of the Rab family lim-
its the application of existing methods for protein classification. Here,
we present a major redesign of the Rabifier, a bioinformatic pipeline for
detection and classification of Rab GTPases. It is more accurate, signif-
icantly faster than the original version and is now open source, both the
code and the data, allowing for community participation.
Availability and Implementation: Rabifier and RabDB are freely avail-
able through the web at http://rabdb.org. The Rabifier package can be
downloaded from the Python Package Index at https://pypi.python.org/
pypi/rabifier, the source code is available at Github https://github.com/
evocell/rabifier.
This chapter has been submitted for publication
Author contribution: This work is based on the initial paper and code written
by Yoan Diekmann1. I wrote the new codebase for the classifier, performed the
benchmark and implemented the new website. I wrote the paper together with
José B. Pereira-Leal.1Diekmann, Y., Seixas E., Gouw M., Tavares-Cadete F., Seabra M.C., and Pereira-Leal
J.B. (2011). Thousands of Rab GTPases for the Cell Biologist. PLoS Computational Biology
7:e1002217

4.1. Introduction 107
4.1 Introduction
T he Rab family, the largest member of the Ras superfamily of small gua-
nine nucleotide-binding proteins, is a key regulator of vesicle trafficking
in eukaryotic cells. This highly paralogous family can be further divided into
subfamilies associated with specific trafficking pathways. Rab function tends to
be conserved across species, for example, Rab1 in mouse can functionally re-
place its orthologue in yeast (Haubruck et al. 1989). Hence, annotating Rabs
provides information about presence and evolution of particular cellular func-
tions and pathways in Eukaryotes. However, classification into subfamilies is
complicated as paralogues are very similar to each other, so it has traditionally
been done manually using bespoke approaches (e.g. Pereira-Leal 2008; Ackers
et al. 2005; Elias et al. 2012). Previously we developed a bioinformatic method
to automatically classify Rabs that uses multiple decision steps and a manually
curated reference set of Rab subfamilies (Diekmann et al. 2011). We also created
a web-accessible database (RabDB) where we display Rab annotation for all Su-
perfamily 1.75 (Gough et al. 2001) genomes available at the time, alongside a
web tool that allows users to annotate submitted sequences.
Rabifier and RabDB have provided means to the community to explore the
Rab universe. Yet, recent developments in bioinformatic methods prompted us
to improve the classifier, providing both better and faster annotations (the latter
is especially important given the ever increasing amount of genomic data). The
new version of the pipeline adds new features and improves on both accuracy and
speed of sequence classification. Rabifier has been released as an open-source
software to facilitate the further community-driven development of the classifier,
easily allowing for example its extension to other small GTPases.
4.2 Rabifier2& RabDB2
4.2.1 Overview
The Rabifier pipeline (fig. 4.A.1) has two main parts: an input protein sequence
is classified whether or not it belongs to the Rab family (phase 1), and if it is
a Rab, which subfamily it most likely belongs to (phase 2). Rab family assign-

108 Chapter 4. Rabifier2
ment is based on satisfying three conditions: (1) presence of the G domain, (2)
the top hit against the reference database is a Rab, (3) at least one RabF motif
(Pereira-Leal and Seabra 2000) is present. In the second phase, Rabifier mea-
sures similarities between the query protein and the reference Rab subfamily
datasets to assign a confidence score to each subfamily prediction. Alternatively,
if the sequence is only marginally similar to any of the subfamilies, it is classi-
fied as RabX (unknown/new Rab). Both phases rely on manually curated sets of
protein sequences that include Rabs, representatives of each Rab subfamily and
other small GTPases of the Ras superfamily.
Rabifier updates include changes to both the reference databases and the
pipeline. Among numerous modifications to the original pipeline (see http://
rabdb.org/about), two are the most noticeable: (1) HMMER3 replaces BLAST
in the majority of similarity searches, (2) subfamily classification system is now
based on sequence score comparison against a model of each subfamily, which
is subsequently used as input for the naive Bayes classifier.
4.2.2 Improvements – performance
We measured classification performance of the new Rabifier pipeline on a refer-
ence set of more than 800 manually curated, eukaryotic Rabs (Elias et al. 2012)
and compared it with the original Rabifier; we used the same reference databases
for both versions, so the result reflects only the differences between implemen-
tations. The two phases are considered separately. The high performance of the
original classifier in phase 1 left little space for improvement, we observed only
a minor gain in sensitivity (0.5%) (fig. 4.A.2). Yet, in phase 2 the difference is
substantial: Rabifier2 is able to correctly assign more sequences into subfami-
lies (fewer RabX annotations), which increases sensitivity by 7.8%, precision by
0.3% and the overall performance (F1) by 4.7% (fig. 4.1A).
The Rabifier2 codebase has been redesigned and rewritten, the third party
software used in the pipeline has been updated to the most recent versions. This
resulted in a major speed improvement (up to 10 fold, fig. 4.1B). Rabifier2 makes
better use of parallel processing: the total computation time increases very slowly
with the number of simultaneously classified sequences, compared to the old
implementation. This major speedup allows for fast annotation of hundreds of
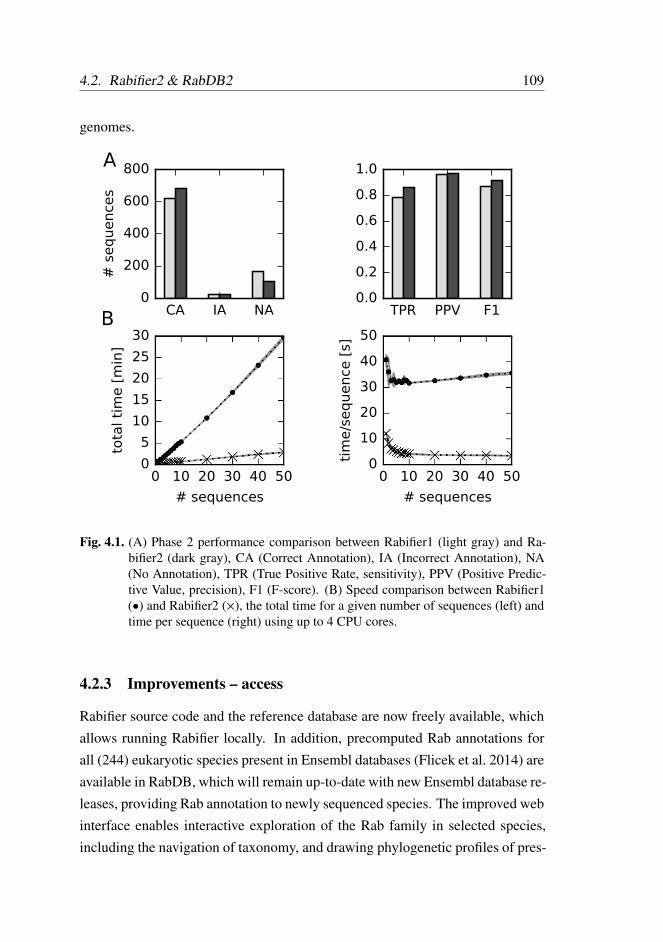
4.2. Rabifier2 & RabDB2 109
genomes.
B
A
0 10 20 30 40 50
# sequences
0
5
10
15
20
25
30
tota
l ti
me [
min
]
0 10 20 30 40 50
# sequences
0
10
20
30
40
50ti
me/s
equ
ence [
s]
CA IA NA0
200
400
600
800
# s
equen
ces
TPR PPV F10.0
0.2
0.4
0.6
0.8
1.0
Fig. 4.1. (A) Phase 2 performance comparison between Rabifier1 (light gray) and Ra-bifier2 (dark gray), CA (Correct Annotation), IA (Incorrect Annotation), NA(No Annotation), TPR (True Positive Rate, sensitivity), PPV (Positive Predic-tive Value, precision), F1 (F-score). (B) Speed comparison between Rabifier1(•) and Rabifier2 (×), the total time for a given number of sequences (left) andtime per sequence (right) using up to 4 CPU cores.
4.2.3 Improvements – access
Rabifier source code and the reference database are now freely available, which
allows running Rabifier locally. In addition, precomputed Rab annotations for
all (244) eukaryotic species present in Ensembl databases (Flicek et al. 2014) are
available in RabDB, which will remain up-to-date with new Ensembl database re-
leases, providing Rab annotation to newly sequenced species. The improved web
interface enables interactive exploration of the Rab family in selected species,
including the navigation of taxonomy, and drawing phylogenetic profiles of pres-
110 Chapter 4. Rabifier2
ence/absence of Rab subfamilies in chosen taxa. Each protein contains a detailed
annotation and is linked to the corresponding entry in the Ensembl database. The
website also allows to submit protein sequences for classification; due to the per-
formance increase, user can now upload hundreds of sequences at a time, com-
pared to 5 sequences in the original version. It is also now possible to change
several parameters used by the classifier and view a detailed output for each an-
notation.
4.3 Conclusions
Rabifier2 provides major improvements in Rab annotation, both in terms of
speed and accuracy, over the initial version; it can now be used in genome anno-
tation pipelines. We used it to annotate Rab diversity across Eukaryotes, which
can be explored through the web. We have also released the source code of Ra-
bifier to facilitate further development of the pipeline; this framework can be
extended to include other small GTPases and, perhaps, other difficult families of
the P-loop NTPase fold (the most widespread protein fold in cellular organisms,
Koonin et al. 2000).
Acknowledgements
The authors thank all members of the Computational Genomics Laboratory for
helpful discussions. In particular, we wish to thank Marc Gouw for help with
the implementation of the Rabifier and RabDB interfaces. We would also like to
thank the Bioinformatics Unit of the Instituto Gulbenkian de Ciência for hosting
RabDB.
Funding
This work has been supported by the Fundação para a Ciência e a Tecnologia,
under the grant PTDC/EBB-BIO/119006/2010, and PhD fellowship SFRH/BD/
51880/2012 to JS.

References 111
References
Ackers, J. P., Dhir, V., and Field, M. C. (2005). A bioinformatic analysis of the
RAB genes of Trypanosoma brucei. Molecular and Biochemical Parasitol-
ogy 141, 89–97.
Diekmann, Y., Seixas, E., Gouw, M., Tavares-Cadete, F., Seabra, M. C., and
Pereira-Leal, J. B. (2011). Thousands of Rab GTPases for the Cell Biologist.
PLoS Computational Biology 7, e1002217.
Elias, M., Brighouse, A., Gabernet-Castello, C., Field, M. C., and Dacks, J. B.
(2012). Sculpting the endomembrane system in deep time: high resolution
phylogenetics of Rab GTPases. Journal of Cell Science 125, 2500–2508.
Flicek, P., Amode, M. R., Barrell, D., Beal, K., Billis, K., et al. (2014). Ensembl
2014. Nucleic Acids Research 42, 749–755.
Gough, J., Karplus, K., Hughey, R., and Chothia, C. (2001). Assignment of ho-
mology to genome sequences using a library of hidden Markov models that
represent all proteins of known structure. Journal of Molecular Biology 313,
903–919.
Haubruck, H., Prange, R., Vorgias, C., and Gallwitz, D. (1989). The ras-related
mouse ypt1 protein can functionally replace the YPT1 gene product in yeast.
The EMBO Journal 8, 1427–1432.
Koonin, E. V., Wolf, Y. I., and Aravind, L. (2000). Protein fold recognition us-
ing sequence profiles and its application in structural genomics. Advances in
Protein Chemistry 54, 245–75.
Pereira-Leal, J. B. and Seabra, M. C. (2000). The mammalian Rab family of
small GTPases: definition of family and subfamily sequence motifs suggests
a mechanism for functional specificity in the Ras superfamily. Journal of
Molecular Biology 301, 1077–1087.
Pereira-Leal, J. B. (2008). The Ypt/Rab Family and the Evolution of Trafficking
in Fungi. Traffic 9, 27–38.

112 Chapter 4. Rabifier2

Appendix
4.A Supplementary figures
seq. id.> threshold
YES
NO
NO
NO
NO
Phase1
Phase2
sequence
G domain
best hit Rab
RabF motif
compute
subfamily score
Rab | score
RabX
| s
core
Not
a R
ab
YES
YES
Fig. 4.A.1. Rabifier pipeline flowchart.
113
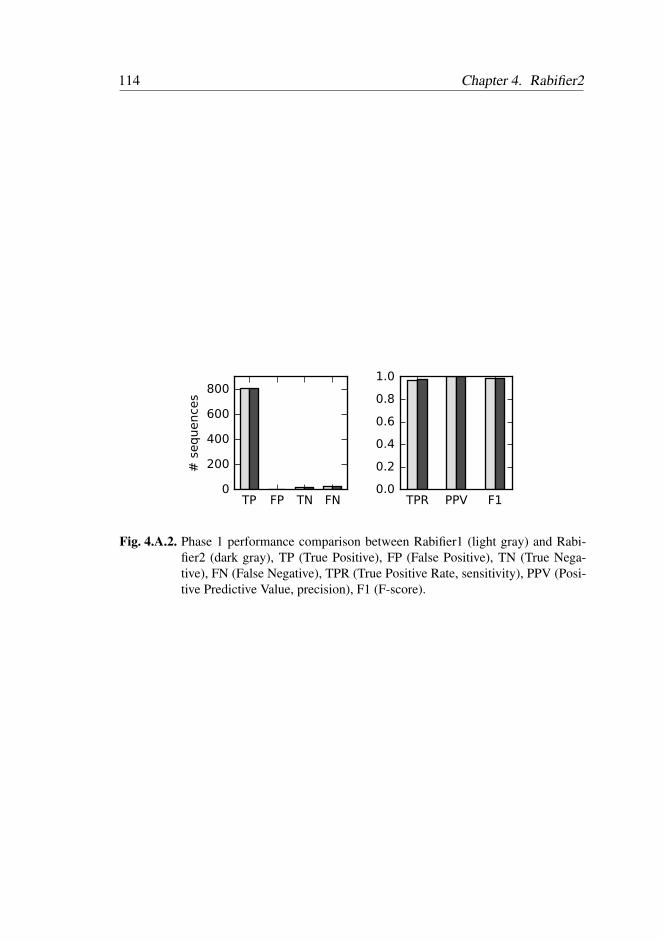
114 Chapter 4. Rabifier2
TP FP TN FN0
200
400
600
800
# s
equen
ces
TPR PPV F10.0
0.2
0.4
0.6
0.8
1.0
Fig. 4.A.2. Phase 1 performance comparison between Rabifier1 (light gray) and Rabi-fier2 (dark gray), TP (True Positive), FP (False Positive), TN (True Nega-tive), FN (False Negative), TPR (True Positive Rate, sensitivity), PPV (Posi-tive Predictive Value, precision), F1 (F-score).

Chapter 5
Are there Rab GTPases in Archaea?
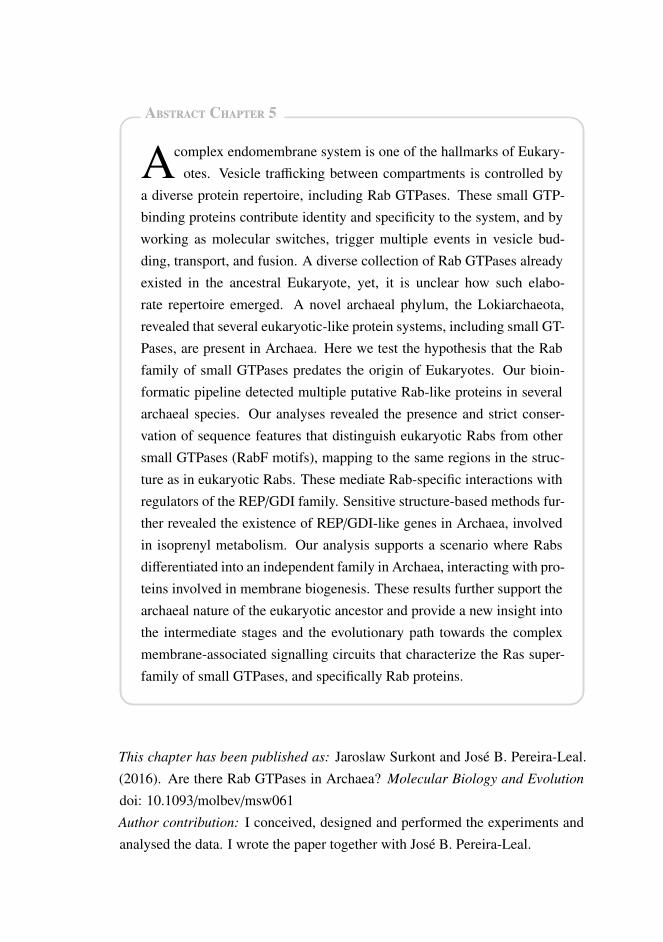
Abstract Chapter 5
Acomplex endomembrane system is one of the hallmarks of Eukary-
otes. Vesicle trafficking between compartments is controlled by
a diverse protein repertoire, including Rab GTPases. These small GTP-
binding proteins contribute identity and specificity to the system, and by
working as molecular switches, trigger multiple events in vesicle bud-
ding, transport, and fusion. A diverse collection of Rab GTPases already
existed in the ancestral Eukaryote, yet, it is unclear how such elabo-
rate repertoire emerged. A novel archaeal phylum, the Lokiarchaeota,
revealed that several eukaryotic-like protein systems, including small GT-
Pases, are present in Archaea. Here we test the hypothesis that the Rab
family of small GTPases predates the origin of Eukaryotes. Our bioin-
formatic pipeline detected multiple putative Rab-like proteins in several
archaeal species. Our analyses revealed the presence and strict conser-
vation of sequence features that distinguish eukaryotic Rabs from other
small GTPases (RabF motifs), mapping to the same regions in the struc-
ture as in eukaryotic Rabs. These mediate Rab-specific interactions with
regulators of the REP/GDI family. Sensitive structure-based methods fur-
ther revealed the existence of REP/GDI-like genes in Archaea, involved
in isoprenyl metabolism. Our analysis supports a scenario where Rabs
differentiated into an independent family in Archaea, interacting with pro-
teins involved in membrane biogenesis. These results further support the
archaeal nature of the eukaryotic ancestor and provide a new insight into
the intermediate stages and the evolutionary path towards the complex
membrane-associated signalling circuits that characterize the Ras super-
family of small GTPases, and specifically Rab proteins.
This chapter has been published as: Jaroslaw Surkont and José B. Pereira-Leal.
(2016). Are there Rab GTPases in Archaea? Molecular Biology and Evolution
doi: 10.1093/molbev/msw061
Author contribution: I conceived, designed and performed the experiments and
analysed the data. I wrote the paper together with José B. Pereira-Leal.
5.1. Introduction 117
5.1 Introduction
Amajor question in evolutionary biology is the origin of the Eukaryotic cell
plan, which is characterized by a multitude of intracellular organelles,
including the energy producing endosymbiotic organelles, complex endomem-
brane trafficking system, and a nucleus containing a large genome that encodes
thousands of genes. The protein repertoires associated with these organelles
have been found in most Eukaryotes, suggesting that they were already present
in the Last Eukaryotic Common Ancestor (LECA) (e.g., Field and Dacks 2009;
Schlacht et al. 2014). Like in other areas of the evolutionary biology, the search
for intermediate, transitional forms has attracted the attention of many, and eu-
karyotic-like cellular features or gene repertoires have been identified in different
prokaryotes, for example, having been termed as the ‘dispersed eukaryome’ in
Archaea (Koonin and Yutin 2014).
Inferring ancient events such as the origin of Eukaryotes or the origin of
their specific molecular traits is a very challenging task given the timescale, data
scarcity, and insufficient methods. Despite this, mounting evidence suggests that
the ancestral host cell that accommodated the endosymbiotic bacteria, which
gave rise to mitochondria, was from the archaeal lineage (Lake et al. (1984) and
Cox et al. (2008), reviewed in López-García and Moreira (2015)). This host cell
may have in fact evolved from within Archaea (the TACK superphylum), rather
than result from a much earlier branching as a sister group to all Archaea (Guy
and Ettema 2011; Kelly, Wickstead, et al. 2011; Williams, Foster, Nye, et al.
2012; Williams, Foster, Cox, et al. 2013; Williams and Embley 2014; Raymann
et al. 2015). This scenario suggests that the search for transitional states should
be carried out within the archaeal domain, and specifically the TACK superphy-
lum.
A recent metagenomic survey of a deep ocean sediment sample from the Arc-
tic Mid-Ocean Ridge revealed the existence of a new archaeal phylum within the
TACK superphylum, the Lokiarchaeota (Spang et al. 2015). The authors reported
that several building blocks characteristic of Eukaryotes are present in this taxon,
suggesting that Lokiarchaeota and Eukaryotes share a common ancestor and that
Lokiarchaeota is a modern descendant of that ancestor. Small GTPase gene fam-

118 Chapter 5. Are there Rab GTPases in Archaea?
ilies are highly expanded in Lokiarchaeota compared with other Archaea, includ-
ing many small GTPases from the RAS superfamily; they form several distinct
clusters, yet their relationship to the eukaryotic GTPases remains unclear.
The eukaryotic RAS superfamily contains five major families Arf, Ras, Rho,
Ran, and Rab that are involved in the intracellular signaling and share the com-
mon G domain core (GTPase activity), responsible for the switching mechanism
between the GTP-bound active and GDP-bound inactive state. The Arf family
is involved in regulation of vesicular transport, Ras in response to diverse extra-
cellular stimuli, Rho in actin dynamics, and Ran in nucleocytoplasmic transport
(reviewed in Wennerberg et al. 2005). Here, we focused on Rab GTPases, critical
regulators of vesicular trafficking systems (Fukuda 2008; Stenmark 2009; Kelly,
Horgan, et al. 2012; Pfeffer 2013), included in the list of eukaryotic signature pro-
teins, that is, ‘proteins that are found in eukaryotic cells but have no significant
homology to proteins in Archaea and Bacteria’ (Hartman and Fedorov 2002).
This family has experienced extensive universal and taxon-specific duplications
associated with the emergence of major organelles and organelle specializations
of the endomembrane system; each Rab subfamily provides specificity to a par-
ticular component of the trafficking system and this function is generally con-
served throughout evolution (Dacks and Field 2007; Dacks, Peden, et al. 2009;
Brighouse et al. 2010; Diekmann et al. 2011). They form the largest RAS family,
with more than 60 Rab homologues in human (Pereira-Leal and Seabra 2001),
and several studies point to the existence of a rich Rab repertoire at the LECA
(Diekmann et al. 2011; Elias et al. 2012; Klöpper et al. 2012); however, they
have been so far restricted to the eukaryotic domain. Here, we test the hypothe-
sis that Rab GTPases predate Eukaryogenesis, by investigating the small GTPase
repertoire in Archaea, and in particular the expanded small GTPase family in the
recently described Lokiarchaea.
5.2. Results 119
5.2 Results
5.2.1 Multiple Rab-like sequences in Archaea
In the original metagenomic study by Spang et al. (2015) the assembly of a com-
plete archaeal genome defined a novel archaeal phylum, the Lokiarchaeota. In
this Lokiarchaeum genome, more than 90 members of the RAS superfamily were
predicted, yet it is unclear whether these proteins belong to any specific, previ-
ously described RAS family or constitute a novel group. Here, we systemati-
cally searched all complete archaeal genomes, including the Lokiarchaeum, for
members of the RAS superfamily of small GTPases and specifically annotated
Rab-like proteins. We used the Rabifier (Diekmann et al. 2011), a bioinformatic
pipeline that runs a series of consecutive classification steps as follows: 1) de-
termining if a protein contains the small GTPase domain, 2) whether it belongs
to the Rab family or another member of the RAS superfamily, and 3) what is
the most likely Rab subfamily assignment of the protein. We detected a to-
tal of 3152 proteins containing the small GTPase domain, of which 133 within
the Lokiarachaeum genome (the remaining an average of 13.6±3.4 proteins per
genome). Of this total, 42 were predicted as Rab-like GTPases without any spe-
cific subfamily annotation, that is, none of the Rab-like proteins is sufficiently
similar to any of the established eukaryotic subfamilies. Among the 42 Rab-like
proteins 37 belong to Lokiarchaeum, the remaining five (one copy per species)
were identified in Thermofilum pendens, Thermofilum sp., Caldiarchaeum subter-
raneum, Thermoplasmatales archaeon, and Aciduliprofundum sp. These species
are distributed across Archaea, they belong to one of two major superphyla, Eur-
yarchaeota and TACK. This raises a question about the origin of these Rab-like
proteins, as their phylogenetic profile (fig. 5.1) does not reveal any obvious pat-
tern of vertical inheritance.
5.2.2 Inconclusive phylogenetic positioning of Archaeal Rab-like se-
quences
Our bioinformatic analysis confirms the presence of many small GTPases in Ar-
chaea and identifies multiple Rab-like GTPases in diverse archaeal species, yet
without any subfamily assignment. To determine the position of archaeal Rab-
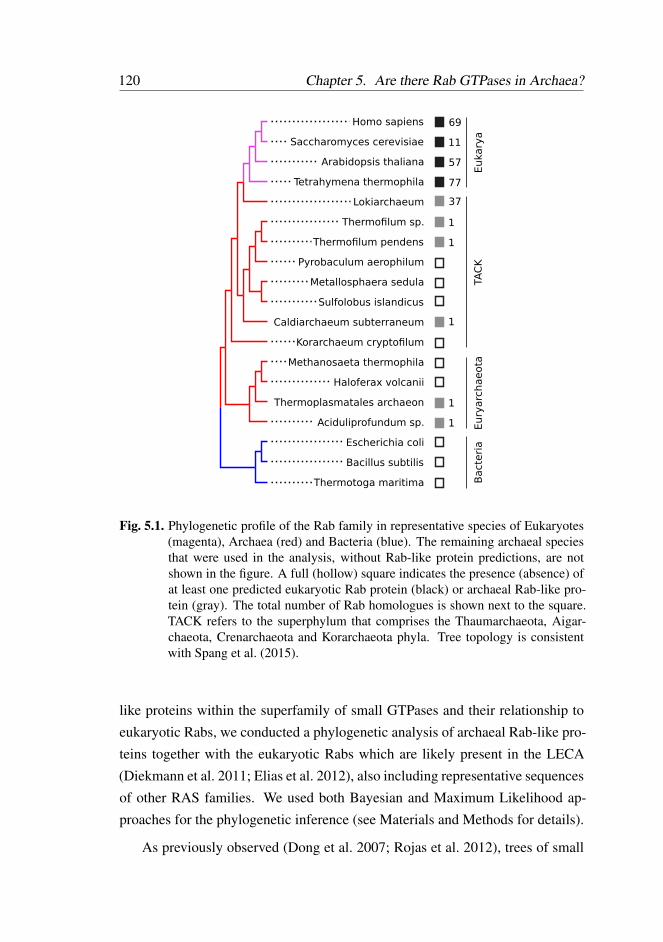
120 Chapter 5. Are there Rab GTPases in Archaea?
Thermoplasmatales archaeon
Methanosaeta thermophila
Lokiarchaeum
Saccharomyces cerevisiae
Escherichia coli
Thermofilum sp.
Caldiarchaeum subterraneum
Homo sapiens
Aciduliprofundum sp.
Tetrahymena thermophila
Bacillus subtilis
Korarchaeum cryptofilum
Metallosphaera sedula
Thermotoga maritima
Thermofilum pendens
Pyrobaculum aerophilum
Haloferax volcanii
Arabidopsis thaliana
Sulfolobus islandicus
Eukary
aTA
CK
Eury
arc
haeota
Bacte
ria
11
69
57
77
37
1
1
1
1
1
Fig. 5.1. Phylogenetic profile of the Rab family in representative species of Eukaryotes(magenta), Archaea (red) and Bacteria (blue). The remaining archaeal speciesthat were used in the analysis, without Rab-like protein predictions, are notshown in the figure. A full (hollow) square indicates the presence (absence) ofat least one predicted eukaryotic Rab protein (black) or archaeal Rab-like pro-tein (gray). The total number of Rab homologues is shown next to the square.TACK refers to the superphylum that comprises the Thaumarchaeota, Aigar-chaeota, Crenarchaeota and Korarchaeota phyla. Tree topology is consistentwith Spang et al. (2015).
like proteins within the superfamily of small GTPases and their relationship to
eukaryotic Rabs, we conducted a phylogenetic analysis of archaeal Rab-like pro-
teins together with the eukaryotic Rabs which are likely present in the LECA
(Diekmann et al. 2011; Elias et al. 2012), also including representative sequences
of other RAS families. We used both Bayesian and Maximum Likelihood ap-
proaches for the phylogenetic inference (see Materials and Methods for details).
As previously observed (Dong et al. 2007; Rojas et al. 2012), trees of small

5.2. Results 121
GTPases have very weak statistical support for basal branches (Rho vs. Rab
vs. Ras, etc.), and Rabs may appear in multiple independent basal branches
(fig. 5.2,fig: 5.B.1). Archaeal Rab-like sequences are monophyletic with the eu-
karyotic proteins, indicating that they are more similar to sequences from Eukary-
otes than to other small GTPases from Archaea (fig. 5.B.2). They are however
not monophyletic with any one specific small GTPase family, being part of a
basal polytomy (fig. 5.2).
RabRab-like Ran Rho Ras Arf
1.00
a b
Archaea Eukarya
Fig. 5.2. Phylogeny of small GTPases from Eukarya and Archaea using (a) Bayesianand (b) maximum-likelihood inference. Representative eukaryotic membersof all RAS families (Rab, Ran, Rho, Ras and Arf) and putative archaeal Rab-like are included. Black (gray) circle indicates a Bayesian posterior probabilityvalue above 0.9 (0.6) and a bootstrap support value above 90 (60) for a branchsplit. Branch lengths are proportional to the expected number of substitutionsper site, as indicated by the scale bar.
To gain a more detailed view on the Rab-like family structure, we constructed
a phylogenetic tree using only archaeal Rab-like sequences (fig. 5.B.3). Al-
though the deep branching pattern could not be reliably resolved, we observed
that most of the sequences cluster within several highly supported groups. Short
terminal branches suggest recent duplication of several Lokiarchaean proteins.
Proteins from Thermoplasmatales, Aciduliprofundum, and Caldiarchaeum form
long branches indicating very divergent sequences, which do not cluster together
122 Chapter 5. Are there Rab GTPases in Archaea?
with Lokiarchaeum. In contrast, proteins from both Thermofilum species form a
distinct cluster with two other Lokiarchaean sequences.
Overall, this analysis suggests that phylogenetic methods alone are insuffi-
cient to determine the relationship between archaeal Rab-like GTPases and the
eukaryotic members of the RAS superfamily. This, however, raises the question
of why these sequences were classified as Rab-like.
5.2.3 Rab-like proteins contain typical eukaryotic Rab motifs
We next analyzed sequence properties of archaeal Rab-like GTPases at the family
level to further assess their similarity to other members of the RAS superfamily.
We constructed a sequence model for each family (Rab, archaeal Rab-like, Ran,
Rho, Ras, Arf). We first built multiple sequence alignments using representative
sequences for each family and a seed alignment of the small GTPase domain
(Pfam:PF00071) to guide the alignment process and improve an overall quality
of the alignment, the seed sequences were then removed from the final alignment.
The alignments were subsequently used to construct profile hidden Markov mod-
els (pHMMs) and generate plurality-rule consensus sequences that describe each
family.
We first calculated the overall, pairwise similarity between the families (ta-
ble 5.A.1) and observed a remarkable similarity of 78% (60% identity, local
alignment) between eukaryotic Rab and archaeal Rab-like GTPases (71% and
55%, respectively, for global alignment, table 5.A.2), much higher than between
the archaeal Rab-like family and any other member of the RAS superfamily. We
subsequently focused on a more specific comparison between Rab-like and Rab
proteins; we compared amino acid variation along the sequence across Rab par-
alogues in Lokiarchaeum and representative species from different major eukary-
otic groups (Homo sapiens, Trypanosoma brucei, and Guillardia theta). We
observed similar patterns of variation for all analyzed species (fig. 5.B.4): re-
gions of both low and high sequence conservation belong to the corresponding
positions in the Rab sequences from different species, suggesting that archaeal
Rab-like sequences are evolutionarily constrained in the same regions as the eu-
karyotic Rabs.
We next tested the hypothesis that sequence conservation between archaeal
5.2. Results 123
and eukaryotic sequences is associated with the Rab family (RabF) motifs – se-
quence motifs unique to the Rab family that are important for the interaction with
Rab effectors (Pereira-Leal and Seabra 2000). The results of this analysis are
summarized in figure 5.3. All positions that correspond to the RabF1 and RabF2
motifs in eukaryotic Rabs are conserved in the archaeal Rab-like sequence. For
comparison, in other families at most two amino acids are conserved at the corre-
sponding positions. In the remaining three motifs most of the residues are iden-
tically conserved between Rab and Rab-like sequences, some are similar, for
example, positively charged arginine and lysine in RabF4, aliphatic isoleucine
and leucine in RabF5, and aromatic tyrosine and phenylalanine in RabF5 (tyro-
sine is also the second most common amino acid at this position in the archaeal
sequences). From the sequence perspective, archaeal Rab-like proteins have all
the hallmarks of Rabs, including the motifs involved in binding Rab regulators
and effectors.
The major difference between eukaryotic Rab and archaeal Rab-like sequences
is the absence of C-terminal cysteine residues, the prenylation sites of the eukary-
otic Rabs, in all of the analyzed archaeal sequences. Rab-like sequences tend to
have a shorter C-terminal sequence, missing most of what is termed the (flexible)
hypervariable region in eukaryotic Rabs, known to be involved in associations
with the membrane.
5.2.4 Rab-like proteins are structurally similar to eukaryotic Rabs
Given a high level of the primary sequence similarity between the archaeal Rab-
like proteins and their eukaryotic counterparts, we modeled a putative 3D struc-
ture of a Rab-like GTPase and compared the location of Rab-specific features
at the structural level. We chose a Lokiarchaeum sequence that contains all five
RabF motifs (GenBank:KKK40223), as predicted by the Rabifier. To ensure a
high quality of the model, we selected four templates from different Rab subfam-
ilies that both have a high level of sequence identity to the archaeal homologue
and a good crystallographic resolution of the 3D structure: Rab8 (H. sapiens,
PDB:4LHW), Rab26 (H. sapiens, PDB:2G6B), Rab30 (H. sapiens, PDB:2EW1),
and Ypt1 (Saccharomyces cerevisiae, PDB:1YZN). All template structures were
in the active state, that is, bound to a GTP molecule. We used Modeller (Šali and
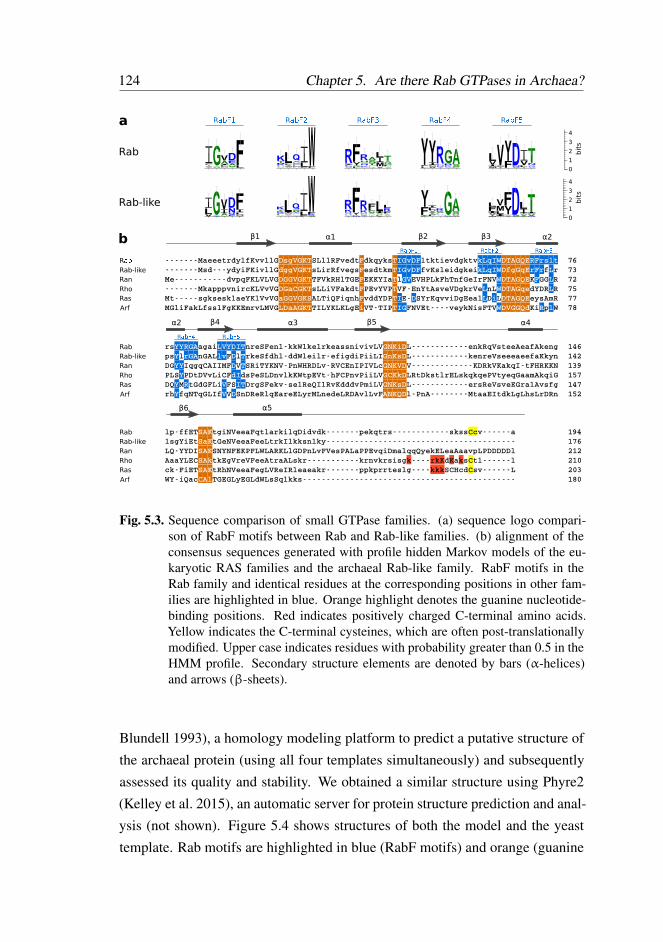
124 Chapter 5. Are there Rab GTPases in Archaea?
1
0
2
3
4
1
0
2
3
4
bit
sbit
s
Rab
Rab-like
Ra��� Ra��� Ra��� Ra�� Ra��a
α1β1 β2 β3 α2
α2 β4 β5
β6
α3 α4
α5
R�� � R�� � R�� �
R�� � R�� �
R��Rab-like
Ran
Rho
Ras
Arf
Rab
Rab-like
Ran
Rho
Ras
Arf
Rab
Rab-like
Ran
Rho
Ras
Arf
76
73
72
75
77
78
-------MaeeetrdylfKvvllGDsgVGKTSLllRFvedtFdkqyksTIGvDFltktievdgktvkLqIWDTAGQERFrsltDsgVGKT F T DTAGQEIGvDF kLqIW RFrslt
-------Msd---ydyiFKivllGdggVGKTsLirRfvegsFesdtkmTIGvDFfvKsleidgkeikLqIWDfgGqErFrfLrdggVGKT F T DfgGqEIGvDF kLqIW rFr L
Me-----------dvpqFKLVLVGDGGVGKTTFVkRHlTGEFEKKYIaTlGVEVHPLkFhTnfGeIrFNVWDTAGQEKFGGLRDGGVGKT F T DTAGQE LFGV W
-------MkapppvnircKLVvVGDGaCGKTsLLiVFakdtFPEvYVPTVF-EnYtAsveVDgkrVeLnLWDTAGqedYDRLRDGaCGKT F T DTAGqe LL W
Mt-----sgksesklaeYKlVvVGaGGVGKSALTiQFiqnhFvddYDPTIE-DSYrKqvviDgEealLDiLDTAGQEeysAmRaGGVGKS F T DTAGQEI D L i
MGliFakLfsslFgKKEmrvLMVGLDaAGKTTILYKLKLgEiVT-TIPTIGFNVEt----veykNisFTVWDVGGQdKiRplWLDaAGKT i T DVGGQd lRIG W
146
142
139
157
147
152
rsYYRGAagaiLVYDITnreSFenl-kkWlkelrkeassnivivLVGNKiDL------------enkRqVsteeAeafAkengGNKiDYYRGA LVYDIT
psYlrGAnGALlvFDlTrkeSfdhl-ddWleilr-efigdiPiiLIGnKsDL------------kenreVseeeaeefaKkynGnKsDY rGA lv D T
DGYYIqgqCAIIMFDVTSRiTYKNV-PnWHRDLv-RVCEnIPIVLcGNKVDV-------------KDRkVKakqI-tFHRKKNGNKVDYY D T
PLSYPDtDVvLiCFdIdsPeSLDnvlkKWtpEVt-hFCPnvPiiLVGCKkDLRtDkstlrELskqkqePVtyeqGaamAkqiGGCKkDY Id
DQYMRtGdGFLiVFSITDrgSFekv-selReQIlRvKdddvPmiLVGNKsDL------------ersReVsveEGralAvsfgGNKsDY R V IT
rhYfqNTqGLIfVVDSnDReRlqEareELyrMLnedeLRDAvlLvFANKQDl-PnA--------MtaaEItdkLgLhsLrDRnANKQDY V D
194
176
212
210
203
180
lp-ffETSAKtgiNVeeaFqtlarkilqDidvdk-------pekqtrs------------skssCcv------aSAK Cc
lsgYiEtSaKtGeNVeeaFeeLtrkIlkksnlky----------------------------------------SaK
LQ-YYDISAKSNYNFEKPFLWLARKLlGDPnLvFVesPALaPPEvqiDmalqqQyekELeaAaavpLPDDDDDlSAK
AaaYLECSAktkEgVreVFeeAtraALskr-----------krnvkrsisgk----rkKdKaksCtl------lSAk C
ck-FiETSAKtRhNVeeaFegLVReIRleaeakr-------ppkprrteslg----kkkSCHcdCsv------LSAK C
WY-iQacCAlTGEGLyEGLdWLsSqlkks---------------------------------------------CAl
b
Fig. 5.3. Sequence comparison of small GTPase families. (a) sequence logo compari-son of RabF motifs between Rab and Rab-like families. (b) alignment of theconsensus sequences generated with profile hidden Markov models of the eu-karyotic RAS families and the archaeal Rab-like family. RabF motifs in theRab family and identical residues at the corresponding positions in other fam-ilies are highlighted in blue. Orange highlight denotes the guanine nucleotide-binding positions. Red indicates positively charged C-terminal amino acids.Yellow indicates the C-terminal cysteines, which are often post-translationallymodified. Upper case indicates residues with probability greater than 0.5 in theHMM profile. Secondary structure elements are denoted by bars (α-helices)and arrows (β-sheets).
Blundell 1993), a homology modeling platform to predict a putative structure of
the archaeal protein (using all four templates simultaneously) and subsequently
assessed its quality and stability. We obtained a similar structure using Phyre2
(Kelley et al. 2015), an automatic server for protein structure prediction and anal-
ysis (not shown). Figure 5.4 shows structures of both the model and the yeast
template. Rab motifs are highlighted in blue (RabF motifs) and orange (guanine
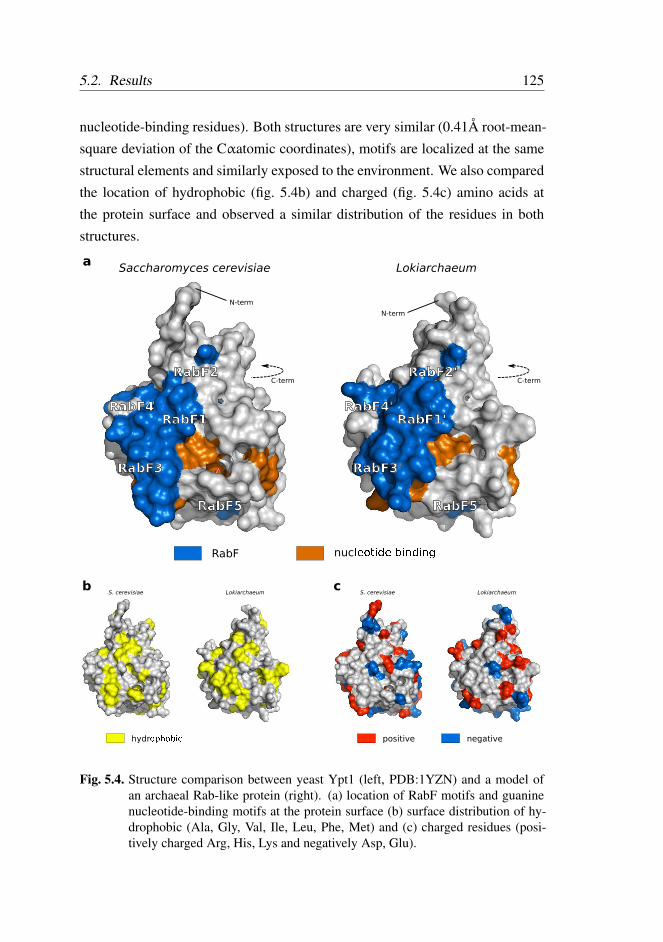
5.2. Results 125
nucleotide-binding residues). Both structures are very similar (0.41Å root-mean-
square deviation of the Cαatomic coordinates), motifs are localized at the same
structural elements and similarly exposed to the environment. We also compared
the location of hydrophobic (fig. 5.4b) and charged (fig. 5.4c) amino acids at
the protein surface and observed a similar distribution of the residues in both
structures.
RabF1
RabF2
RabF3
RabF4
RabF5
N-term
C-term
a
b c
RabF nucl������ �������
hydro��o� ! positive negative
LokiarchaeumSaccharomyces cerevisiae
S. cerevisiae Lokiarchaeum S. cerevisiae Lokiarchaeum
C-term
N-term
RabF1'
RabF2'
RabF3'
RabF4'
RabF5'
Fig. 5.4. Structure comparison between yeast Ypt1 (left, PDB:1YZN) and a model ofan archaeal Rab-like protein (right). (a) location of RabF motifs and guaninenucleotide-binding motifs at the protein surface (b) surface distribution of hy-drophobic (Ala, Gly, Val, Ile, Leu, Phe, Met) and (c) charged residues (posi-tively charged Arg, His, Lys and negatively Asp, Glu).
126 Chapter 5. Are there Rab GTPases in Archaea?
We assessed the putative GTPase activity and the nucleotide-dependent con-
formational change of the archaeal Rab-like protein by analyzing its thermody-
namic stability at both the GDP and GTP-bound state and predicting interactions
between the protein and the phosphate groups of the nucleotide. In addition to
the model of the GTP-bound state, we modeled the structure of the GDP-bound
form, again using several templates belonging to different Rab subfamilies: Rab1
(Cryptosporidium parvum, PDB:2RHD), Rab2 (H. sapiens, PDB:2A5J), Rab8
(H. sapiens, PDB:4LHV), and Rab43 (H. sapiens, PDB:2HUP). The analysis
of the structural predictions shows that the archaeal Rab-like protein is thermo-
dynamically stable in both conformations (both predicted structures are shown
in fig. 5.B.5). The interaction between the phosphate groups and the protein is
stabilized by several residues present in the protein active site. The presence
of Gln68 and its relative position to the GTP molecule enables the interaction
between a water molecule and the phosphate, necessary for the GTP hydrolysis
(Dumas et al. 1999). The analysis of structural models of the archaeal Rab-like
GTPase indicates that it can exist in two stable conformations and it is able to
cycle between an ‘on’ and ‘off’ state like other small GTPases and, in particular,
eukaryotic Rabs.
5.2.5 A Rab Escort Protein/GDP Dissociation Inhibitor ancestor in
Archaea
Our analysis so far suggests that Rab-like sequences predate Eukaryogenesis.
Surprisingly, we found motifs in archaeal Rab-like sequences that are known to
mediate interactions between eukaryotic Rabs and their regulators and effectors.
Eukaryotic Rabs are prenylated on the C-terminus, a post-translational modifi-
cation catalyzed by the enzyme Rab geranylgeranyltransferase, which requires
a chaperone termed REP (Rab Escort Protein) (Pereira-Leal, Hume, et al. 2001;
Leung et al. 2006); a paralogue of REP, termed GDI (GDP dissociation Inhibitor)
recycles Rabs in and out of membranes (Wu et al. 1996, fig. 5.5a). Binding of
Rabs to REP and GDI is mediated by residues in the RabF motifs (Rak, Py-
lypenko, Durek, et al. 2003; Rak, Pylypenko, Niculae, et al. 2004; Goody et al.
2005). The same regions are involved in binding other general Rab regulators –
Rab activity is regulated by guanine-nucleotide-exchange factors (GEF) that turn
5.2. Results 127
Rabs ‘on’ by promoting the GDP to GTP exchange, and by GTPase-activating
proteins (GAP) that increase GTP hydrolysis rate and turn Rabs ‘off’. Both sets
of proteins interact with Rabs with residues included in the RabF motifs (those
within the switch regions). The identification of RabF motifs in Archaea raises
the hypothesis that such proteins and interactions could also predate Eukaryoge-
nesis.
We used two approaches to test if homologues of these eukaryotic proteins
can be detected in Archaea, indicating that some of the complex Rab regula-
tory cycles could predate Eukaryogenesis. First, we used sequences of several
human regulators (GEFs, GAPs, FNT, PGGT1B, REP, RABGGT), performed
BLAST (Altschul et al. 1990) similarity searches against archaeal genomes and
found only hits with insignificant sequence similarity (not shown). As BLAST is
known to lack sensitivity to detect remote homologies, we then used a more sen-
sitive approach based on pHMM. We retrieved pHMMs (Pfam) of the domains
that are found in Rab-binding proteins (Mss4, Sec2, VPS9, DENN, RabGAP-
TBC, GDI/REP, Prenyltransferase, PPTA), which we then used as queries for a
similarity search using the HMMER package. In most cases, we found only scat-
tered hits on the tree with marginal sequence similarity (fig. 5.5b), suggesting
that either canonical Rab regulatory proteins are absent from Archaea or their
sequences diverged from the eukaryotic counterparts beyond the detection level
of standard automated methods. In one case, however, that of REP/GDI, even
though the statistics of the hits were poor, we observed repeated positive hits,
which we then investigated further.
We manually inspected putative GDI/REP domains in Archaea. The primary
sequence of GDI and REP domain containing proteins is generally weakly con-
served in Eukaryotes, both within each family and between GDI-REP paralogues
(e.g., 30% human and fruit fly REP, 21% human GDI1 and REP1, local align-
ment identity). Hence, given the evolutionary distance between Eukaryotes and
Archaea we expect that any putative archaeal homologs would be within the
‘twilight zone’ of sequence similarity, which precludes any automatic sequence-
based analysis. We used a fold recognition method (Jones 1999) with the best
scoring (HMMER) archeal GDI/REP protein to detect candidate proteins with
determined 3D structures. The best predictions belong to eukaryotic GDIs and ar-
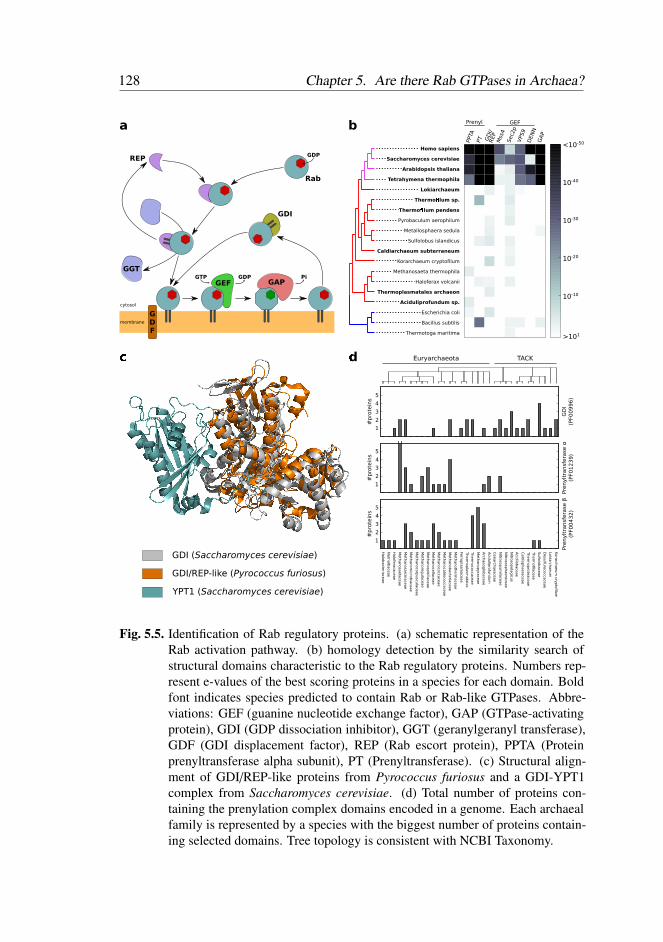
128 Chapter 5. Are there Rab GTPases in Archaea?
a b
GAPGEF
GGT
Rab
REP
GDI
GDF
GDP
GTP
cytosol
membrane
GDP Pi
>101
Thermoplasmatales archaeon
Methanosaeta thermophila
Lokiarchaeum
Saccharomyces cerevisiae
Escherichia coli
Thermo"lum sp.
Caldiarchaeum subterraneum
Homo sapiens
Aciduliprofundum sp.
Tetrahymena thermophila
Bacillus subtilis
Korarchaeum cryptofilum
Metallosphaera sedula
Thermotoga maritima
Thermo"lum pendens
Pyrobaculum aerophilum
Haloferax volcanii
Arabidopsis thaliana
Sulfolobus islandicus
<10-50
GDI/REP-like (Pyrococcus furiosus)
YPT1 (Saccharomyces cerevisiae)
GDI (Saccharomyces cerevisiae)
c
Prenyl GEF
PPTA
Mss
4Sec2p
VPS9
DEN
NG
AP
GD
I/R
EP
PT
10-10
10-20
10-30
10-40
Kora
rchaeum
cry
pto
filu
m
Lokia
rchaeu
m
Desulfu
rococcaceae
Sulfo
lobaceae
Therm
ofila
ceae
Therm
opro
teaceae
Cald
isphaera
ceae
Acid
ilobaceae
Nitro
sopela
gic
us
Nitro
sosphaera
ceae
Nitro
sopum
ilaceae
Cenarc
haeaceae
Arc
haeoglo
baceae
Meth
an
opyra
ceae
Therm
ococcaceae
Therm
opla
sm
ata
les
Ferro
pla
sm
aceae
Acid
ulip
rofu
ndum
Meth
an
oth
erm
aceae
Meth
an
obacte
riaceae
Meth
an
ocald
ococcaceae
Meth
an
ococcaceae
Meth
an
ocella
ceae
Meth
an
ospirilla
ceae
Meth
an
ore
gula
ceae
Meth
an
ocorp
uscula
ceae
Meth
an
om
icro
bia
ceae
Meth
an
osarc
inaceae
Meth
an
osaeta
ceae
Halo
fera
caceae
Natria
lbaceae
Halo
bacte
riaceae
Euryarchaeota TACK
GD
I
(PF00
996)
1
2
3
4
5
#pro
tein
s
Pre
nylt
ransfe
rase α
(PF01
239)
1
2
3
4
5
#pro
tein
s
Pre
nylt
ransfe
rase β
(PF00
432)
1
2
3
4
5
#pro
tein
s
d
Fig. 5.5. Identification of Rab regulatory proteins. (a) schematic representation of theRab activation pathway. (b) homology detection by the similarity search ofstructural domains characteristic to the Rab regulatory proteins. Numbers rep-resent e-values of the best scoring proteins in a species for each domain. Boldfont indicates species predicted to contain Rab or Rab-like GTPases. Abbre-viations: GEF (guanine nucleotide exchange factor), GAP (GTPase-activatingprotein), GDI (GDP dissociation inhibitor), GGT (geranylgeranyl transferase),GDF (GDI displacement factor), REP (Rab escort protein), PPTA (Proteinprenyltransferase alpha subunit), PT (Prenyltransferase). (c) Structural align-ment of GDI/REP-like proteins from Pyrococcus furiosus and a GDI-YPT1complex from Saccharomyces cerevisiae. (d) Total number of proteins con-taining the prenylation complex domains encoded in a genome. Each archaealfamily is represented by a species with the biggest number of proteins contain-ing selected domains. Tree topology is consistent with NCBI Taxonomy.
5.3. Discussion 129
chaeal proteins without experimentally determined function (top three hits corre-
spond to proteins from Bos taurus PDB:1D5T, Pyrococcus furiosus PDB:3NRN,
and S. cerevisiae PDB:2BCG). These structures are also very similar to FAD-
containing monooxygenases and oxidases (Schalk et al. 1996), including ar-
chaeal geranylgeranyl reductases. While the sequence identity between putative
archaeal GDI/REP and eukaryotic GDI is very low, at the structural level both
domains (3NRN and 1UKV, a yeast GDI in complex with YPT1) are similar, in-
cluding the Rab-binding platform (fig. 5.5c); our structural comparison revealed
several residues that may form interactions with Rab switch regions (not shown).
Our results strongly support the existence of a REP/GDI-like molecule in the
TACK group, whose function implies an isoprenyl-binding ability.
We further used the same strategy to investigate whether the isoprenylation
machinery, specifically the two subunits (αand β) of the eukaryotic isoprenyl
transferases, is present in Archaea. Both approaches were inconclusive to de-
termine the existence of the αsubunit, as the tetratricopeptide repeat that char-
acterizes this domain is widespread and functionally promiscuous, precluding
any conclusion about function. However, we detected archaeal proteins whose
predicted fold matches several isoprenoid metabolism enzymes including the ger-
anylgeranyl transferase subunit β. We found multiple instances of genes contain-
ing these domains, observing some species where they co-occur (fig. 5.5d).
5.3 Discussion
In this work, we investigated the hypothesis that the separation of the eukaryotic
signature Rab sequences pre-dates the emergence of Eukaryotes. This hypothe-
sis follows from the recent discovery of a new archaeal group, the Lokiarchaeota,
that was claimed to be a sister group of Eukaryotes. Our Rabifier pipeline iden-
tified 42 candidate Rab-like sequences that have multiple features related to eu-
karyotic Rabs, they exist in several Archaea of both the TACK group and Eu-
ryarchaeota but are particularly abundant in Lokiarchaeum. Although phyloge-
netic methods alone were insufficient to determine the position of Rab-like pro-
teins within the RAS superfamily, our results indicate that these GTPases may
be Rab precursors. Surprisingly, we also found evidence for a GDI/REP-like
protein existing in Archaea, raising the possibility that this interaction pre-dates
130 Chapter 5. Are there Rab GTPases in Archaea?
Eukaryogenesis.
Small GTPases are well known to exist in prokaryotes, where they mediate
diverse functions, for example, MglA regulates cell polarity and motility by accu-
mulating at a cell pole in its active GTP-bound state (Zhang et al. 2010). The clos-
est group to eukaryotic Rab/Rho/Ras/Ran are the Rup proteins (Ras superfamily
GTPase of unknown function in prokaryotes) (Wuichet and Sogaard-Andersen
2015). Phylogenetic analysis is not able to resolve the relationship between eu-
karyotic small GTPases and prokaryotic ones, so no claim can be made whether
these sequences are Rup-like or a new independent branch (fig 5.B.6).
We concentrated on characterizing sequence and structural features that could
shed light on the relationship between these sequences and eukaryotic Rabs. At
the family level, they are more similar to the Rab family than to other eukaryotic
small GTPases (Arf/Ras/Rho/Ran). We found extensive RabF motifs conserva-
tion, motifs that in Eukaryotes are diagnostic of this family, and that mediate
important protein interactions characteristic of Rabs. On the structural models
of archaeal Rab-like proteins, these motifs map to the same positions as their
eukaryotic counterparts, suggesting that they could mediate similar interactions,
which lends further support to their Rab-like classification. Our results thus point
to Archaea having Rab-like sequences, which although not being full-fledged
Rabs, as we will discuss below, are already differentiated intermediates to this
small GTPase family.
The presence of Rab motifs that are known to mediate interactions with other
Eukaryote-specific Rab regulators was puzzling and led us to test the hypothesis
that one or more of these interactions could have pre-dated eukaryogenesis. Us-
ing sensitive methods we found convincing REP/GDI-like proteins in multiple
Archaea that are involved in the biosynthesis of membrane lipids (geranylger-
anyl reductase, EC 1.3.1.101). An archaeal form of this enzyme had its crystal
structure solved and aligns well with the crystal structure of GDI:Rab complex.
It is thus very probable that the conservation of the RabF motifs in archaeal
Rab-like sequences points to an established interaction with this enzyme. The
functional meaning of this interaction is unclear, but the fact that this enzyme is
involved in the synthesis of the isoprenoids that are used in the lipid modification
of eukaryotic small GTPases is highly suggestive. Inspection of the structure of
5.3. Discussion 131
the archaeal enzyme suggests that although it has a binding pocket able to shield
the lipid groups from the cytosol as REP and GDI do, it is in a different orien-
tation, suggesting that it cannot chaperone lipid-modified eukaryotic Rabs that
have longer C-termini than the archaeal Rab-like sequences.
In Eukaryotes REP/GDI are chaperones of the lipid-modified Rabs, that de-
liver them to the membranes, where REP is doing so in the context of the lipid
modification reaction, as an accessory protein to the RabGGTase complex, and
where GDI recycles Rabs in and out of membranes. The presence of a REP/GDI
homologue in Archaea raises the hypothesis that membrane association of small
GTPases via prenylation may have preceded the emergence of Eukaryotes. There
is, at least, one report claiming isoprenylation of proteins in Archaea (Konrad
and Eichler 2002). However, the absence of an extended C-terminal region be-
yond the GTPase globular domain together with the absence of the prenylateable
C-terminal cysteine residues points against this. Furthermore, we found no ev-
idence of a polybasic region that is known to mediate membrane association
(Williams 2003), nor of any other membrane association signal. Our results thus
suggest that these Rab-like sequences are unlikely to associate with membranes
via lipidation. It is, however, interesting to note that archaeal homologues of
both the alpha and beta subunits of eukaryotic prenyltransferases are common,
although there is no evidence that they are able to form a heterodimer with the
prenyltransferase activity. The beta subunit homologues are involved in the iso-
prenoid metabolism and their structure is predicted to be similar to eukaryotic
prenyltransferases, which further supports the notion that some components of
the prenylation complex are present in Archaea.
Small GTPases are molecular switches that can cycle between two membrane-
associated states, as well as cycle in an out of membrane. Our results suggest that
these Archaea represent a snapshot of the evolution of this circuit, that resolves
part of the evolutionary path into membrane-associated protein trafficking regula-
tors. The Rab protein family is already individualized, even though we lack any
known internal membranes in the TACK Archaea. These proteins are apparently
active GTPases able to cycle between two structural states, but it is unclear if
they do it in the cytosol or if an ‘in’ and ‘out’ of membrane switch was already
established. In this scenario, an interaction with the protein that will become the

132 Chapter 5. Are there Rab GTPases in Archaea?
chaperone that catalyses this second part of the Rab cycle is already established,
but in the absence of lipid modification. It is plausible that localization to mem-
branes may exist via protein-protein interactions. Finally, the building blocks for
a protein prenylation machinery are also found in multiple Archaea, suggesting
that even the emergence of this component of the Rab cycle may also pre-date
eukaryogenesis.
Our conclusions are possible because we were able to go beyond phylo-
genetic methods, which are clearly insufficiently sensitive to resolve events at
this order of temporal divergence, using instead our motif/domain-based tool
to identify Rabs, the Rabifier. It is important now to look into other small
GTPase families, as our preliminary data suggest that other members of the
Ras/Rho/Ran/Rab clade may have already been individualized in Archaea. It
is also important to investigate whether the interaction we predict here between
Rab-like and REP/GDI-like sequences does in fact exist, and what is the sub-
cellular localization of these small GTPases. Lokiarchaeota, are unlikely target
organisms for these experiments, as they exist in a difficult to reach environment.
However, organisms that are routinely cultured in the laboratory have these se-
quences (see fig. 5.5), which makes these experiments tractable. Furthermore,
we found that other environmental (marine) samples (Kawai et al. 2014) also
possess Lokiarchaeota-like small GTPases and specifically abundant Rab-like
sequences (117 proteins in the analyzed sample), which makes the possibility of
isolation and culture of these organisms more plausible. Our study gives further
support to the notion that Eukarya emerged from within Archaea, and may be
construed to support the notion that it was from within organisms close to the
recently identified Lokiarchaeum. We are convinced that in the near future we
will be able to resolve the origin of the in-out of membrane cycle of small GT-
Pases, and their association with specific eukaryotic processes. It is possible that
this cycle emerged in Archaea, even before the specific system they regulate in
Eukaryotes has emerged, and that have later been co-opted.

5.4. Materials and Methods 133
5.4 Materials and Methods
5.4.1 Sequences
All complete archaeal proteomes (231) were downloaded from the UniProt data-
base (UniProt Consortium 2015), all Lokiarchaeum proteins (5384) were down-
loaded from GenBank (Benson et al. 2014). The complete list of species is
shown in the supplementary materials online (Molecular Biology and Evolution,
Supplementary Data). Eukaryotic and bacterial genomes were downloaded from
Ensembl (Cunningham et al. 2015).
5.4.2 Protein sequence alignments
Multiple sequence alignments were built with MAFFT 7.221 (Katoh and Stan-
dley 2013) using a high accuracy mode (--maxiterate 1000 --localpair). Tri-
mAl v1.2 (Capella-Gutierrez et al. 2009) was used to remove gap-rich regions
from alignments. Pairwise sequence alignments were constructed with water
(the Smith-Waterman local alignment algorithm) and needle (the Needleman-
Wunsch global alignment algorithm) from the EMBOSS package (Rice et al.
2000). Jalview 2.8.2 (Waterhouse et al. 2009) was used for alignment visualiza-
tion.
5.4.3 Phylogeny reconstruction
Phylogeny reconstruction using the Bayesian inference was conducted with Mr-
Bayes 3.2.5 (Ronquist et al. 2012) using the mixed amino acid model with gamma-
distributed rate variation across sites. Two parallel runs with four chains each
(Metropolis coupling) were run until the topologies converged (standard devia-
tion of split frequencies is below 0.05), first 25% generations were discarded as
the burn-in. RAxML 8.1.22 (Stamatakis 2014) was used for tree reconstruction
using the maximum likelihood method, a discrete approximation to the gamma
distribution with four categories was used to model across-site rate heterogene-
ity, the best-fitting substitution model (LG, Le and Gascuel 2008) was selected
using ProtTest 3.4 (Darriba et al. 2011). ETE2 (Huerta-Cepas et al. 2010) and
Dendroscope3 (Huson and Scornavacca 2012) were used for tree visualization.
134 Chapter 5. Are there Rab GTPases in Archaea?
5.4.4 Sequence analysis
pHMMs of protein families were build from sequence alignments using hmm-
build from the HMMER 3.1b2 software package (http://hmmer.org), plurality-
rule consensus sequences were generated with hmmemit. Sequence logos were
generated with WebLogo 3.4 (Crooks et al. 2004) from multiple sequence align-
ments.
Amino acid variation was calculated for each position in an alignment of par-
alogous proteins as the entropy of that position, H(X) = −∑ni=1 p(xi) log2 p(xi),
where p(xi) is the fraction of the residue xi at the X column in the alignment.
5.4.5 Protein structure prediction
MODELLER v9.15 (Šali and Blundell 1993), a program which implements a
homology-based method for structure modeling, was used to predict protein
structures given templates with known structure that share a high level of se-
quence identity to the modeled protein. Model quality and stability were evalu-
ated with the DOPE potential (Shen and Sali 2006), ProSA (Sippl 1993; Wieder-
stein and Sippl 2007), and Verify3D (Lüthy et al. 1992). PyMOL (The PyMOL
Molecular Graphics System, Version 1.7.4 Schrödinger, LLC.) was used for
structure visualization.
Acknowledgments
The authors thank all members of the Computational Genomics Laboratory for
helpful discussions. Krzysztof Kus for reading the manuscript. This work was
supported by Fundação para a Ciência e a Tecnologia [SFRH/BD/51880/2012 to
J.S.].
References 135
References
Altschul, S. F., Gish, W., Miller, W., Myers, E. W., and Lipman, D. J. (1990).
Basic local alignment search tool. Journal of Molecular Biology 215, 403–
410.
Benson, D. a., Clark, K., Karsch-Mizrachi, I., Lipman, D. J., Ostell, J., and Say-
ers, E. W. (2014). GenBank. Nucleic Acids Research 42, D32–D37.
Brighouse, A., Dacks, J. B., and Field, M. C. (2010). Rab protein evolution and
the history of the eukaryotic endomembrane system. Cellular and Molecular
Life Sciences 67, 3449–3465.
Capella-Gutierrez, S., Silla-Martinez, J. M., and Gabaldon, T. (2009). trimAl: a
tool for automated alignment trimming in large-scale phylogenetic analyses.
Bioinformatics 25, 1972–1973.
Cox, C. J., Foster, P. G., Hirt, R. P., Harris, S. R., and Embley, T. M. (2008). The
archaebacterial origin of eukaryotes. Proceedings of the National Academy
of Sciences 105, 20356–20361.
Crooks, G. E., Hon, G., Chandonia, J.-M., and Brenner, S. E. (2004). WebLogo:
a sequence logo generator. Genome Research 14, 1188–1190.
Cunningham, F., Amode, M. R., Barrell, D., Beal, K., Billis, K., et al. (2015).
Ensembl 2015. Nucleic Acids Research 43, D662–D669.
Dacks, J. B. and Field, M. C. (2007). Evolution of the eukaryotic membrane-
trafficking system: origin, tempo and mode. Journal of Cell Science 120,
2977–2985.
Dacks, J. B., Peden, A. a., and Field, M. C. (2009). Evolution of specificity in the
eukaryotic endomembrane system. The International Journal of Biochem-
istry & Cell Biology 41, 330–340.
Darriba, D., Taboada, G. L., Doallo, R., and Posada, D. (2011). ProtTest 3: fast
selection of best-fit models of protein evolution. Bioinformatics 27, 1164–
1165.
Diekmann, Y., Seixas, E., Gouw, M., Tavares-Cadete, F., Seabra, M. C., and
Pereira-Leal, J. B. (2011). Thousands of Rab GTPases for the Cell Biologist.
PLoS Computational Biology 7, e1002217.
136 Chapter 5. Are there Rab GTPases in Archaea?
Dong, J. H., Wen, J. F., and Tian, H. F. (2007). Homologs of eukaryotic Ras su-
perfamily proteins in prokaryotes and their novel phylogenetic correlation
with their eukaryotic analogs. Gene 396, 116–124.
Dumas, J. J., Zhu, Z., Connolly, J. L., and Lambright, D. G. (1999). Structural
basis of activation and GTP hydrolysis in Rab proteins. Structure 7, 413–
423.
Elias, M., Brighouse, A., Gabernet-Castello, C., Field, M. C., and Dacks, J. B.
(2012). Sculpting the endomembrane system in deep time: high resolution
phylogenetics of Rab GTPases. Journal of Cell Science 125, 2500–2508.
Field, M. C. and Dacks, J. B. (2009). First and last ancestors: reconstructing evo-
lution of the endomembrane system with ESCRTs, vesicle coat proteins, and
nuclear pore complexes. Current Opinion in Cell Biology 21, 4–13.
Fukuda, M. (2008). Membrane traffic in the secretory pathway. Cellular and
Molecular Life Sciences 65, 2801–2813.
Goody, R. S., Rak, A., and Alexandrov, K. (2005). The structural and mecha-
nistic basis for recycling of Rab proteins between membrane compartments.
Cellular and Molecular Life Sciences 62, 1657–1670.
Guy, L. and Ettema, T. J. G. (2011). The archaeal ’TACK’ superphylum and the
origin of eukaryotes. Trends in Microbiology 19, 580–587.
Hartman, H. and Fedorov, A. (2002). The origin of the eukaryotic cell: A ge-
nomic investigation. Proceedings of the National Academy of Sciences 99,
1420–1425.
Huerta-Cepas, J., Dopazo, J., and Gabaldón, T. (2010). ETE: a python Environ-
ment for Tree Exploration. BMC Bioinformatics 11, 24.
Huson, D. H. and Scornavacca, C. (2012). Dendroscope 3: An Interactive Tool
for Rooted Phylogenetic Trees and Networks. Systematic Biology 61, 1061–
1067.
Jones, D. T. (1999). GenTHREADER: an efficient and reliable protein fold recog-
nition method for genomic sequences. Journal of Molecular Biology 287,
797–815.
Katoh, K. and Standley, D. M. (2013). MAFFT Multiple Sequence Alignment
Software Version 7: Improvements in Performance and Usability. Molecular
Biology and Evolution 30, 772–780.
References 137
Kawai, M., Futagami, T., Toyoda, A., Takaki, Y., Nishi, S., Hori, S., Arai, W.,
Tsubouchi, T., Morono, Y., Uchiyama, I., Ito, T., Fujiyama, A., Inagaki, F.,
and Takami, H. (2014). High frequency of phylogenetically diverse reductive
dehalogenase-homologous genes in deep subseafloor sedimentary metagen-
omes. Frontiers in Microbiology 5, 80.
Kelly, S., Wickstead, B., and Gull, K. (2011). Archaeal phylogenomics provides
evidence in support of a methanogenic origin of the Archaea and a thaumar-
chaeal origin for the eukaryotes. Proceedings of the Royal Society B: Biolog-
ical Sciences 278, 1009–1018.
Kelly, E. E., Horgan, C. P., Goud, B., and McCaffrey, M. W. (2012). The Rab
family of proteins: 25 years on. Biochemical Society Transactions 40, 1337–
1347.
Kelley, L. A., Mezulis, S., Yates, C. M., Wass, M. N., and Sternberg, M. J. E.
(2015). The Phyre2 web portal for protein modeling, prediction and analy-
sis. Nature Protocols 10, 845–858.
Klöpper, T. H., Kienle, N., Fasshauer, D., and Munro, S. (2012). Untangling the
evolution of Rab G proteins: implications of a comprehensive genomic anal-
ysis. BMC Biology 10, 71.
Konrad, Z. and Eichler, J. (2002). Lipid modification of proteins in Archaea: at-
tachment of a mevalonic acid-based lipid moiety to the surface-layer glyco-
protein of Haloferax volcanii follows protein translocation. The Biochemical
Journal 366, 959–64.
Koonin, E. V. and Yutin, N. (2014). The Dispersed Archaeal Eukaryome and the
Complex Archaeal Ancestor of Eukaryotes. Cold Spring Harbor Perspec-
tives in Biology 6, a016188–a016188.
Lake, J. a., Henderson, E., Oakes, M., and Clark, M. W. (1984). Eocytes: a new ri-
bosome structure indicates a kingdom with a close relationship to eukaryotes.
Proceedings of the National Academy of Sciences 81, 3786–3790.
Le, S. Q. and Gascuel, O. (2008). An Improved General Amino Acid Replace-
ment Matrix. Molecular Biology and Evolution 25, 1307–1320.
Leung, K. F., Baron, R., and Seabra, M. C. (2006). Thematic review series: lipid
posttranslational modifications. geranylgeranylation of Rab GTPases. Jour-
nal of Lipid Research 47, 467–75.

138 Chapter 5. Are there Rab GTPases in Archaea?
López-García, P. and Moreira, D. (2015). Open Questions on the Origin of Eu-
karyotes. Trends in Ecology & Evolution 30, 697–708.
Lüthy, R., Bowie, J. U., and Eisenberg, D. (1992). Assessment of protein models
with three-dimensional profiles. Nature 356, 83–85.
Pereira-Leal, J. B. and Seabra, M. C. (2000). The mammalian Rab family of
small GTPases: definition of family and subfamily sequence motifs suggests
a mechanism for functional specificity in the Ras superfamily. Journal of
Molecular Biology 301, 1077–1087.
Pereira-Leal, J. B., Hume, A. N., and Seabra, M. C. (2001). Prenylation of Rab
GTPases: Molecular mechanisms and involvement in genetic disease. FEBS
Letters 498, 197–200.
Pereira-Leal, J. B. and Seabra, M. C. (2001). Evolution of the Rab family of small
GTP-binding proteins. Journal of Molecular Biology 313, 889–901.
Pfeffer, S. R. (2013). Rab GTPase regulation of membrane identity. Current Opin-
ion in Cell Biology 25, 414–419.
Rak, A., Pylypenko, O., Durek, T., Watzke, A., Kushnir, S., Brunsveld, L., Wald-
mann, H., Goody, R. S., and Alexandrov, K. (2003). Structure of Rab GDP-
dissociation inhibitor in complex with prenylated YPT1 GTPase. Science
302, 646–650.
Rak, A., Pylypenko, O., Niculae, A., Pyatkov, K., Goody, R. S., and Alexandrov,
K. (2004). Structure of the Rab7:REP-1 complex: insights into the mecha-
nism of Rab prenylation and choroideremia disease. Cell 117, 749–60.
Raymann, K., Brochier-Armanet, C., and Gribaldo, S. (2015). The two-domain
tree of life is linked to a new root for the Archaea. Proceedings of the Na-
tional Academy of Sciences 112, 6670–6675.
Rice, P., Longden, I., and Bleasby, A. (2000). EMBOSS: The European Molecu-
lar Biology Open Software Suite. Trends in Genetics 16, 276–277.
Rojas, A. M., Fuentes, G., Rausell, A., and Valencia, A. (2012). The Ras protein
superfamily: Evolutionary tree and role of conserved amino acids. Journal
of Cell Biology 196, 189–201.
Ronquist, F., Teslenko, M., Van Der Mark, P., Ayres, D. L., Darling, A., Höhna,
S., Larget, B., Liu, L., Suchard, M. a., and Huelsenbeck, J. P. (2012). Mr-
References 139
bayes 3.2: Efficient bayesian phylogenetic inference and model choice across
a large model space. Systematic Biology 61, 539–542.
Šali, A. and Blundell, T. L. (1993). Comparative Protein Modelling by Satisfac-
tion of Spatial Restraints. Journal of Molecular Biology 234, 779–815.
Schlacht, A., Herman, E. K., Klute, M. J., Field, M. C., and Dacks, J. B. (2014).
Missing Pieces of an Ancient Puzzle: Evolution of the Eukaryotic Membrane-
Trafficking System. Cold Spring Harbor Perspectives in Biology 6, a016048–
a016048.
Schalk, I., Zeng, K., Wu, S. K., Stura, E. a., Matteson, J., Huang, M., Tandon, A.,
Wilson, I. a., and Balch, W. E. (1996). Structure and mutational analysis of
Rab GDP-dissociation inhibitor. Nature 381, 42–8.
Shen, M.-Y. and Sali, A. (2006). Statistical potential for assessment and predic-
tion of protein structures. Protein Science 15, 2507–2524.
Sippl, M. J. (1993). Recognition of errors in three-dimensional structures of pro-
teins. Proteins: Structure, Function and Genetics 17, 355–362.
Spang, A., Saw, J. H., Jørgensen, S. L., Zaremba-Niedzwiedzka, K., Martijn, J.,
Lind, A. E., Eijk, R. van, Schleper, C., Guy, L., and Ettema, T. J. G. (2015).
Complex archaea that bridge the gap between prokaryotes and eukaryotes.
Nature 521, 173–179.
Stamatakis, A. (2014). RAxML version 8: A tool for phylogenetic analysis and
post-analysis of large phylogenies. Bioinformatics 30, 1312–1313.
Stenmark, H. (2009). Rab GTPases as coordinators of vesicle traffic. Nature Re-
views Molecular Cell Biology 10, 513–525.
UniProt Consortium (2015). UniProt: a hub for protein information. Nucleic
Acids Research 43, D204–D212.
Waterhouse, A. M., Procter, J. B., Martin, D. M. a., Clamp, M., and Barton, G. J.
(2009). Jalview Version 2-A multiple sequence alignment editor and analysis
workbench. Bioinformatics 25, 1189–1191.
Wennerberg, K., Rossman, K. L., and Der, C. J. (2005). The Ras superfamily at
a glance. Journal of Cell Science 118, 843–846.
Wiederstein, M. and Sippl, M. J. (2007). ProSA-web: Interactive web service for
the recognition of errors in three-dimensional structures of proteins. Nucleic
Acids Research 35, 407–410.

140 Chapter 5. Are there Rab GTPases in Archaea?
Williams, T. A., Foster, P. G., Nye, T. M. W., Cox, C. J., and Embley, T. M. (2012).
A congruent phylogenomic signal places eukaryotes within the Archaea. Pro-
ceedings of the Royal Society B: Biological Sciences 279, 4870–4879.
Williams, T. A., Foster, P. G., Cox, C. J., and Embley, T. M. (2013). An archaeal
origin of eukaryotes supports only two primary domains of life. Nature 504,
231–6.
Williams, T. A. and Embley, T. M. (2014). Archaeal "Dark Matter" and the Ori-
gin of Eukaryotes. Genome Biology and Evolution 6, 474–481.
Williams, C. L. (2003). The polybasic region of Ras and Rho family small GT-
Pases: a regulator of protein interactions and membrane association and a site
of nuclear localization signal sequences. Cellular Signalling 15, 1071–1080.
Wu, S. K., Zeng, K., Wilson, I. A., and Balch, W. E. (1996). Structural insights
into the function of the Rab GDI superfamily. Trends in Biochemical Sci-
ences 21, 472–6.
Wuichet, K. and Sogaard-Andersen, L. (2015). Evolution and Diversity of the
Ras Superfamily of Small GTPases in Prokaryotes. Genome Biology and
Evolution 7, 57–70.
Zhang, Y., Franco, M., Ducret, A., and Mignot, T. (2010). A Bacterial Ras-Like
Small GTP-Binding Protein and Its Cognate GAP Establish a Dynamic Spa-
tial Polarity Axis to Control Directed Motility. PLoS Biology 8. Ed. by M. T.
Laub, e1000430.

Appendix
5.A Supplementary tables
Table 5.A.1. Family consensus sequence identity (lower triangle, gray background)and similarity (upper triangle) calculated using the Smith-Waterman localalignment algorithm.
Rab Rab-like Ran Rho Ras Arf
Rab 0.78 0.57 0.58 0.62 0.48Rab-like 0.60 0.59 0.56 0.67 0.56Ran 0.34 0.34 0.46 0.54 0.42Rho 0.39 0.38 0.28 0.54 0.43Ras 0.41 0.42 0.31 0.37 0.46Arf 0.29 0.33 0.29 0.23 0.29
Table 5.A.2. Family consensus sequence identity (lower triangle, gray background) andsimilarity (upper triangle) calculated using the Needleman-Wunsch globalalignment algorithm.
Rab Rab-like Ran Rho Ras Arf
Rab 0.71 0.53 0.56 0.60 0.41Rab-like 0.55 0.47 0.52 0.57 0.51Ran 0.32 0.26 0.41 0.47 0.30Rho 0.37 0.35 0.25 0.51 0.38Ras 0.40 0.36 0.27 0.35 0.39Arf 0.25 0.30 0.20 0.20 0.24
5.B Supplementary figures
141
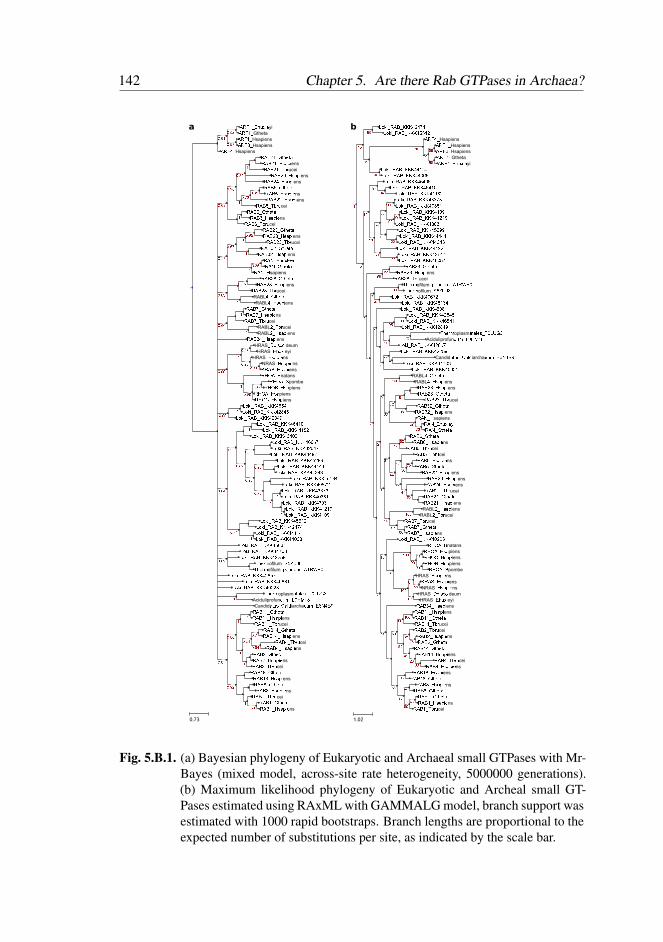
142 Chapter 5. Are there Rab GTPases in Archaea?
1
10#$1
0#%& A'()*E+,-./yi
A'()*Gtheta
0#2$ A'()*Hsapiens
A'(3*Hsapiens
A'(4*Hsapiens
1
0#52
0#2$
0#$%1 1 'AR6)*78+/89
'AR6)*:;9<=ens
'AR6)*>?@ucei
'AR6B*:;9<=ens
'AR64*:;9<=ens
10#C& 0#2% 'ARD*78+/89
'ARD*:;9<=/ns
'AR66*:;9<=ens
'ARD*>?@,cei
1 1 'ARF*78+/89'ARF*:;9<=/ns
'ARF*>?@,cei
0#CG0#5C
1 0#2% 'AR63*78+/89'AR63*:;9<=ens
'AR63*>?@ucei
1 'AR36*78+/89'AR36*:;9<=ens
1 0#$% 'AH*E+,-./h='AH*78+/89
'AH*:sapiens
0#5G1 0#2% 'AR6I*78+/89
'AR6I*:;9<=ens
'AR6I*>?@ucei
1 RABL4*78+/89RABL4*:;9<=ens
0#551 1 'ARJ*78+/89
'ARJ*:;9<=/ns
'ARJ*>?@,cei
1 RABL6*>?@ucei
RABL6*:;9<=ens
'AR34*:;9<=ens
0#22
10#2C HRAS*_K=;LM=deum
HRAS*E+,-.eyi
0#2$HRAS*:;9<=/ns
0#$% NRAS*:;9<=/ns
N'AO*:;9<=ens
1':PA*Rnatans
0#220#22 ':PA*Opombe
':PR*:;9piens
':PA*:;9piens
':PQ*:;9<iens
0#22 1 SMT=*'AR*NNN4FD4)SMT=*'AR*NNN46I4D
SMT=*'AR*NNN46I4U
0#5V
0#%%
1 1 SMT=*'AR*NNN4F4)BSMT=*'AR*NNN4))I6
SMT=*'AR*NNN4F4BF
0#$&
0#$G 1 SMT=*'AR*NNN4FBDJSMT=*'AR*NNN46F4JSMT=*'AR*NNN444U6
0#2%0#2$
SMT=*'AR*NNN4D6UU1 SMT=*'AR*NNN44444
SMT=*'AR*NNN44343
0#CG1 SMT=*'AR*NNN4D)34
SMT=*'AR*NNN4BFJ6
0#221 SMT=*'AR*NNN433J3
SMT=*'AR*NNN4BID)1
SMT=*'AR*NNN43B3)1 SMT=*'AR*NNN4)6)U
SMT=*'AR*NNN4)BU)
0#CV1 SMT=*'AR*NNN4DD)6
SMT=*'AR*NNN464J41 SMT=*'AR*NNN44))4
SMT=*'AR*NNN44BFISMT=*'AR*NNN4DBI)
0#5&SMT=*'AR*NNN44JB3SMT=*'AR*NNN466DU
1 >+/@Wofilum*ODXYZI>+/@Wofilum*</[K/[;*A)'\RB
SMT=*'AR*NNN46IDJSMT=*'AR*NNN4BI3)
SMT=*'AR*NNN4B6631 >+/@Woplasm989./;*>BSY73
AciduliprofunK,W*SB:])ICandid98,;*Q9.Kiarcha/,W*EFH4RU
0#$C
0#$5
1 1 'AR))*78+/89'AR))*:;9<=ens
'AR))*>?@ucei
10#$V
0#C 'AR)4*78+/89'AR)4*:;9<=ens
0#2V 'AR4*>?@,cei
'AR4*:;9<=/ns
1 1 'AR6*78+/89'AR6*:;9<=/ns
'AR6*>?@,cei
0#2&1 'AR)I*78+/89
'AR)I*:;9<=ens
11 'ARI*78+/89
'ARI*:;9<=/ns
1'AR)*>?@,cei
0#52 'AR)*78+/89'AR)*:;9<=/ns
0.73
^
`b
cd efgijkmnjpppqrqsqefgijkmnjpppqttur
v^^ww
mkxqjHsapiens
ywcd mkxujHsapiens
mkxzjHsapiens
bd mkxujGtheta
mkxuj{|}~��yi
^ww efgijkmnjpppqquuqefgijkmnjpppqq���
`b
^`
cyefgijkmnjpppq�q��
c` efgijkmnjpppq�qu�efgijkmnjpppquu�r
�^
b`dd
^ww efgijkmnjpppqzzszefgijkmnjpppq��tu
cc cc efgijkmnjpppqu��uefgijkmnjpppquru�
efgijkmnjpppqz�zu��
efgijkmnjpppqtr��^ww efgijkmnjpppqqqqq
efgijkmnjpppqqzqzbw
efgijkmnjpppqqq�rcc efgijkmnjpppqr�qs
efgijkmnjpppq��ts
`
cc dv kmnr�j��|���kmnr�j����iens
kmnr�j���ucei
^
d^ww �|���ofilumj�������jmuk�n�
�|���ofilumj�t����`d efgijkmnjpppq��sr
efgijkmnjpppqtuzq
^
^
efgijkmnjpppqt��u
^
dcb cc efgijkmnjpppqr�qt
efgijkmnjpppq�tquefgijkmnjpppqr�q�
^� yv �|���oplasm������j��e��zAciduliprofun�}�je���u�
efgijkmnjpppqr�ts
v^^
efgijkmnjpppqrrt�y Candid��}�j����iarcha�}�j{��qn�
efgijkmnjpppqqs�zefgijkmnjpppq��zu
^
�
�
^ww RABLqj��|���RABLqj����iens
�vv�
cy y� kmnrzj����iens
kmnrzj��|���kmnrzj���ucei
cy kmnzrj��|���kmnzrj����iens
^wwkm�j�sapiens
yv km�j{|}~���ikm�j��|���
v
vy
cd cw kmn�j��|���kmn�j����i�ns
kmn�j���}cei
``y�
kmntj���}cei
bw y� kmntj����i�ns
kmntj��|���kmnrrj����iens
`wkmnr�j����iens
`ykmnrqj����iens
�vkmnruj���ucei
cv kmnruj��|���kmnruj����iens
�w^ww RABLrj����iens
RABLrj���ucei
cbkmnsj���}cei
^ww kmnsj��|���kmnsj����i�ns
^
^w
efgijkmnjpppq�rrz
yd
^wwk��mjnnatans
cw`y k��mj���piens
k���j����iens
db k��nj���piens
k��mj�pombe
^ww�y
HRASj����i�ns
bd pkm�j����iens
NRASj����i�ns
dy HRASj��i��fideum
HRASj{|}~�eyi
��
kmnzqj����iens
vv
bwyb ^ww kmnuuj����iens
kmnuuj��|���kmnuuj���ucei
dbcd
kmnrj���}cei
yd kmnrj����i�ns
kmnrj��|���
`^kmnuqj��|���
��kmnuqj����iens
bd kmnqj���}cei
kmnqj����i�ns
b�c� kmnu�j����iens
kmnu�j��|���
cbdb kmn�j����i�ns
kmn�j��|���
dc `� kmnuj��|���kmnuj����i�ns
kmnuj���}cei
1.02
a b
Fig. 5.B.1. (a) Bayesian phylogeny of Eukaryotic and Archaeal small GTPases with Mr-Bayes (mixed model, across-site rate heterogeneity, 5000000 generations).(b) Maximum likelihood phylogeny of Eukaryotic and Archeal small GT-Pases estimated using RAxML with GAMMALG model, branch support wasestimated with 1000 rapid bootstraps. Branch lengths are proportional to theexpected number of substitutions per site, as indicated by the scale bar.
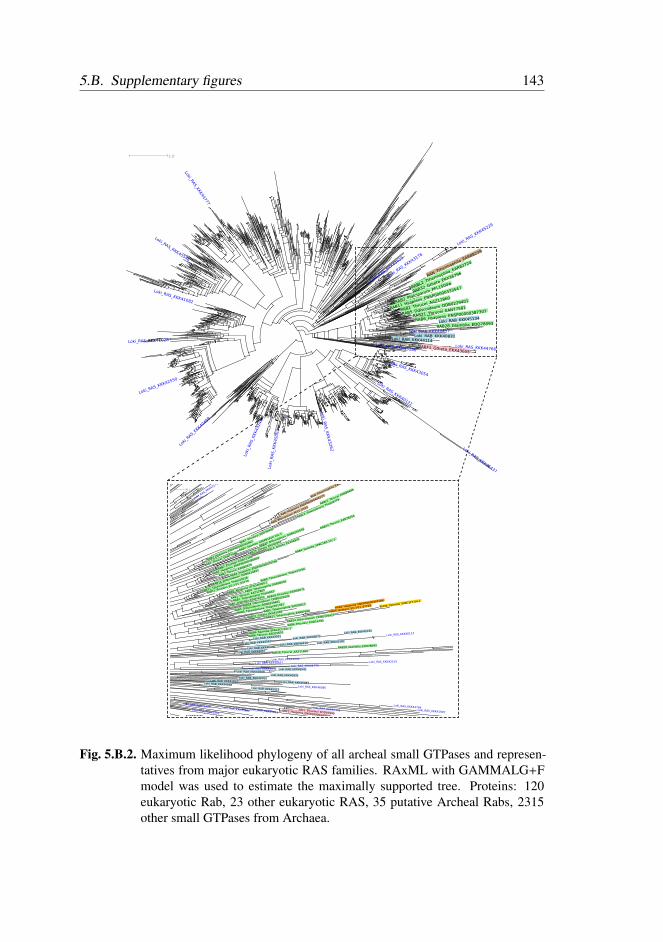
5.B. Supplementary figures 143
Loki_RAS_KKK43176
RAN_Tth
ermophila
_EAR8
8239
RAN_Hsapien
s_ENS
P00000446215
RAN_P
falcipa
rum_PF
11_01
83
RABL2
_Tbruc
ei_EA
N80449
RABL2
_Tpseu
donana
_Thaps
8779
RAB7
_Ehuxl
eyi_EO
D3949
5
RAB7_
Hsapie
ns_EN
SP0000
026506
2
RAB7_S
pombe_
SPAPB1
A10.10
c.1
RAB7_T
brucei
_EAN7
7046
RAB32_
Ddisco
ideum
_DDB02
01639
RAB23_
Gtheta
_EKX45
943
RAB23_
Tbruce
i_EAN78
254
RABL4_
Gtheta
_EKX44
929
RAB2_E
huxleyi
_EOD11
306
RAB2_H
sapiens
_ENSP0
000038
0869
RAB2_T
brucei_
EAN804
70
RAB4_S
pombe_
SPAC1B
3.11c.1
RAB4_H
sapiens
_ENSP0
000047
0246
RAB14_
Ddiscoid
eum_DD
B02148
21
RAB11_
Tpseudo
nana_Th
aps2352
8
RAB11_B
natans_J
GI_V11_5
3770 RAB
8_Tpseud
onana_Th
aps3319
9
RAB8_At
haliana_A
T3G4606
0.1
RAB8_Tth
ermophila_EA
R96030
RAB1_Tbr
ucei_AAZ1
2860
RAB1_Tps
eudonana
_Thaps84
3
RAB1_Glam
blia_EDO76
752 RAB18_Eh
uxleyi_EOD
09575
RAB18_Dd
iscoideum_DDB
0229409
RAB5_Ddis
coideum_DDB
0229401
RAB5_Tpseu
donana_Tha
ps261381
RAB5_Ttherm
ophila_EAS0
5613
RAB21_Gthet
a_EKX51086
RAB21_Ttherm
ophila_EAR87
690HRAS_H
sapiens_ENSP
00000407586
HRAS_Bnatans_
JGI_V11_47763 RHOA_S
pombe_SPAC1F7.04
.1
RAB24_Ddiscoid
eum_DDB0229417
RAB6_Ehuxleyi_E
OD16790
RAB6_Spombe_SPAC4
C5.02c.1
RAB6_Tbrucei_AAQ
15670
Loki_RAB_KKK43031
Loki_RAB_KKK45134
Loki_RAB_KKK40672
Loki_RAB_KKK44343
Loki_RAS_KKK46113
Loki_RAB_KKK46410 Loki_RAB_KKK4
1182
Loki_RAB_KKK46406
Loki_RAB_KKK46057
RAB28_Glamblia_EDO78093
RAB28_Tbrucei_AAZ11866
Loki_RAS_KKK42609
Loki_RAS_KKK40457 Loki_RAS_KKK42155
Loki_RAS_KKK44775Loki_RAS_KKK44032 Loki_RAB_KKK46541
Loki_RAB_KKK42849Loki_RAB_KKK40831
Loki_RAB_KKK44703
Loki_RAB_KKK45081Loki_RAB_KKK42857
Loki_RAS_KKK46086
Loki_RAB_KKK44068Loki_RAB_KKK45512
Loki_RAS_KKK44766Loki_RAS_KKK41997
Loki_RAS_KKK444
Loki_RAS_KKK40445ARF1_Ehuxleyi_EOD07999ARF1_Hsapiens_ENSP00000440005
Loki_RAS_KKK45873
Loki_RAS_KKK45962
Loki_RAS_KKK45400Loki_RAS_KKK45961
0.1
Loki_RA
S_KKK4
2550
Loki_RAS_KKK41028
Loki_RAS_KKK41082
Loki_RAS_KKK45546
Loki_R
AS_KKK44777
Loki_RAS_KKK43625
Loki_RAS_KKK43176
Loki_RAS_KKK45229
RAN_Tth
ermophila
_EAR8
8239
RABL2
_Tther
mophi
la_EA
R8272
4
RAB32_
Gtheta
_EKX36
796
RAB2_P
falcipar
um_PF
L1500w
RAB11_H
sapiens_
ENSP00
000333
547
RAB1_Tbr
ucei_AAZ1
2860
RAB5_Ddis
coideum_DDB
0229401
RAB21_Tbruc
ei_EAN77581
RAB6_Hsapiens_E
NSP00000387307
Loki_RAB_KKK45134
RAB28_Glamblia_EDO78093
Loki_RAS_KKK40457Loki_RAB_KKK40831
Loki_RAB_KKK44114
Loki_RAS_KKK44766ARF1_Gtheta_EKX43655
Loki_RAS_KKK45286
Loki_RAS_KKK43054
Loki_RAS_KKK40122
Loki_RAS_KKK46437
Loki_R
AS_KKK43262
Loki_RAS_KKK45003
Loki_RAS_KKK43248
Loki_RAS_KKK40499
1.0
Fig. 5.B.2. Maximum likelihood phylogeny of all archeal small GTPases and represen-tatives from major eukaryotic RAS families. RAxML with GAMMALG+Fmodel was used to estimate the maximally supported tree. Proteins: 120eukaryotic Rab, 23 other eukaryotic RAS, 35 putative Archeal Rabs, 2315other small GTPases from Archaea.
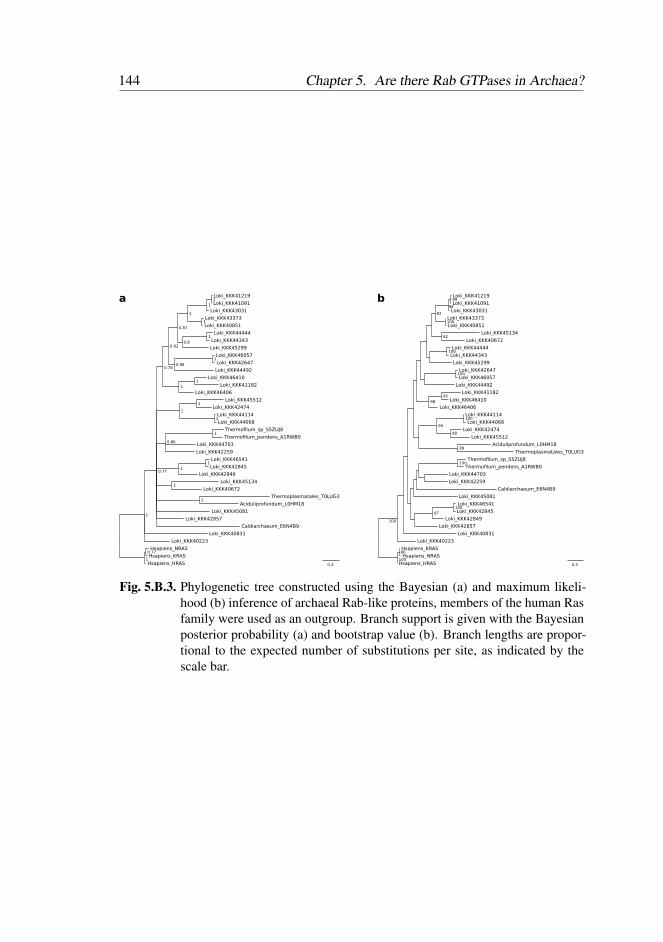
144 Chapter 5. Are there Rab GTPases in Archaea?
0.3
Loki_KKK41219
Loki_KKK45299
Loki_KKK44114
Loki_KKK44343
Loki_KKK42474
Thermofilum_sp_S5ZUJ8
Hsapiens_HRAS
Loki_KKK44444
Loki_KKK46406
Loki_KKK44068
Thermoplasmatales_T0LUG3
Aciduliprofundum_L0HM18
Loki_KKK40672
Hsapiens_KRAS
Caldiarchaeum_E6N4B9
Loki_KKK45134
Loki_KKK42647
Loki_KKK46057
Loki_KKK42259
Loki_KKK44703
Loki_KKK42845
Loki_KKK41091
Loki_KKK40851
Loki_KKK42849
Loki_KKK43031
Loki_KKK40223
Loki_KKK45081
Loki_KKK46541
Loki_KKK45512
Loki_KKK41182
Loki_KKK40831
Hsapiens_NRAS
Loki_KKK44492
Loki_KKK42857
Thermofilum_pendens_A1RWB0
Loki_KKK43373
Loki_KKK46410
1
1
1
0.77
1
1
0.77
1
1
1
0.86
1
1
1
1
0.78
1
1
1
1
1
0.87
1
0.820.8
0.86
0.5
Loki_KKK42857
Loki_KKK43031
Loki_KKK45081
Hsapiens_NRAS
Loki_KKK46406
Thermoplasmatales_T0LUG3
Loki_KKK43373
Loki_KKK41219
Loki_KKK44444
Loki_KKK42647
Loki_KKK46410
Loki_KKK44492
Loki_KKK42474
Loki_KKK44703
Loki_KKK40831
Loki_KKK44068
Loki_KKK41182
Thermofilum_pendens_A1RWB0
Loki_KKK42849
Loki_KKK44114
Loki_KKK42259
Loki_KKK42845
Loki_KKK46057
Loki_KKK46541
Caldiarchaeum_E6N4B9
Loki_KKK40672
Loki_KKK40851
Loki_KKK40223
Loki_KKK45134
Loki_KKK44343
Loki_KKK45299
Aciduliprofundum_L0HM18
Loki_KKK41091
Hsapiens_HRAS
Loki_KKK45512
Hsapiens_KRAS
Thermofilum_sp_S5ZUJ8
99
100
98
100
82
100
95
98
89
62
100
100
99
97
100
100
98
100
86
a b
Fig. 5.B.3. Phylogenetic tree constructed using the Bayesian (a) and maximum likeli-hood (b) inference of archaeal Rab-like proteins, members of the human Rasfamily were used as an outgroup. Branch support is given with the Bayesianposterior probability (a) and bootstrap value (b). Branch lengths are propor-tional to the expected number of substitutions per site, as indicated by thescale bar.

5.B. Supplementary figures 145
Fig. 5.B.4. Sequence variation (H, entropy) across Rab paralogues in four species. Se-quence were aligned for each species, amino acid variation was estimatedfor each column in the alignment and consensus sequence was calculated(X denotes positions where the frequency of the most common amino acidis lower than 0.2). Plot shows the alignment of consensus sequences andsequence variation at each site.
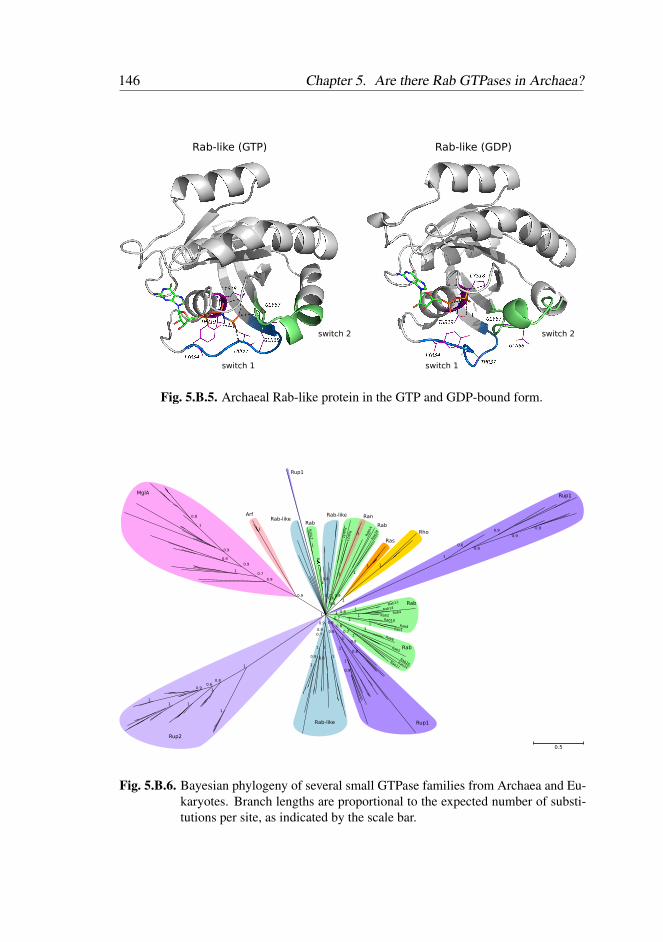
146 Chapter 5. Are there Rab GTPases in Archaea?
switch 1 switch 1
switch 2switch 2
Rab-like (GTP) Rab-like (GDP)
Fig. 5.B.5. Archaeal Rab-like protein in the GTP and GDP-bound form.
1
0.9
0.8
1
0.9
0.9
0.7
0.9
1
1
10.8
0.7
1
0.6
1
0.9
0.6
1 1
1
0.6
0.90.9
0.9
0.8
1
1
10.8
11
1
1
10.7
0.8
0.7
0.8
0.91
0.9
1
1
0.8
0.6
1
1
0.8
1
0.9
1
0.7
0.9
0.9
1
1
111
0.90.6
0.8
1
1
0.9
Rup2
MglA
Arf
Rup1
Rab-like Rup1
Rab
Rab
RabL2
Rab-like
Rup1
R� ¡
Rab-like
Rab
0.5
Ras
Rho
Rab
Rab32
Rab23
Ran
1
RabL4
Rab28
Rab11
Rab14
Rab4Rab2
Rab18
Rab8Rab1
Rab6
Rab5
Rab20Rab24
Rab21
Fig. 5.B.6. Bayesian phylogeny of several small GTPase families from Archaea and Eu-karyotes. Branch lengths are proportional to the expected number of substi-tutions per site, as indicated by the scale bar.
Chapter 6
Discussion

6.1. A brief summary 149
6.1 A brief summary
I n this thesis, I have focused on analysing the influence of protein properties
on evolutionary inference. Many methods have been developed over the years
to infer phylogenies and to map relationships between homologous proteins. Yet,
they often ignore specific properties that constrain protein evolution and, as a con-
sequence, yield suboptimal results. Here, I have considered two protein classes.
1) The coiled-coils, rod-shaped protein domains formed by a simple repetitive
peptide motif that has arisen multiple times in evolution. 2) Rab GTPases, a large
family of closely related proteins with a complex evolutionary history character-
ized by multiple duplications and losses. I have developed tools, which address
specific properties defining these proteins, to improve evolutionary inference.
Proteins consisting of repetitive sequences, due to their low-complexity, are
considered difficult for evolutionary studies. Yet, they are ubiquitous cellular
components, essential to many processes. Functional information is available for
only a handful of model organisms; accurate methods for homology mapping
are necessary to annotate the remaining species. Thus, we set out to improve
the evolutionary analysis for coiled-coils, prevalent repetitive domains with di-
verse functions. First, we estimated the phylogenetically predictive power of
coiled-coil regions by quantifying the amount of information in the sequence.
Surprisingly, despite the repetitive nature, coiled-coils contain a similar level of
information to the globular domains, which are commonly used for evolution-
ary studies. This analysis demonstrates that a premise derived from the general
properties (i.e. repetitive sequences have low-complexity and, as a result, low-
informativeness) can be misleading; the premise should be tested. Given the
specific constraints imposed on the coiled-coil sequence, we have developed a
new substitution model, substantially different from the general models, that in-
corporates these properties. We demonstrated that the new model provides a bet-
ter parameter estimate for evolutionary inference of coiled-coil proteins. It can
be incorporated into the existing tools for homology detection and phylogeny
reconstruction. Although we have not yet used the CC model to address spe-
cific biological questions, it has been used by others (Jose Pereira-Leal personal
communication with Joel Dacks). The repetitive nature of the coiled-coil do-

150 Chapter 6. Discussion
main suggests that the model can be further improved. For instance, defining the
heptad motif positions with a hidden Markov model whose hidden states, cor-
responding to hydrophobic and polar positions would allow assigning different
substitution models to each hidden state. Such framework could also be used to
improve the sequence alignment process.
Proteins evolve by modifying the primary sequence composition and by chang-
ing their length by inserting new residues or deleting existing positions. Hence,
to obtain a more comprehensive view of coiled-coil evolution we analysed their
size variation. We hypothesized, given their structural role as spacers and scaf-
folds, that the size of the coiled-coil domain is conserved in evolution. Indeed,
we observed that the length of coiled-coil regions in more conserved than that of
globular domains and even the α-helical secondary structures of non-coiled-coil
regions. This observation is consistent throughout all three domains of life. It rep-
resents the conservation of the physical size of the coiled-coil domain. Despite
being generally conserved in length, both the most conserved and the most vari-
able proteins are enriched in specific cellular components and processes. Such
properties suggest that the length of the coiled-coil domain can be used as a pre-
dictor in various analyses, for example, in mapping evolutionary relationships or
for functional predictions. So far, we tested if the coiled-coil length co-evolution
can be used to detect protein-protein interactions, the results, however, were in-
conclusive (not shown).
In the second part, we have considered a case of a large family of closely
related proteins, Rab small GTPases, whose specific sequence properties impede
application of traditional protein annotation and classification methods. Such
complicated cases often require manual annotation by a human expert, which
is impractical in large-scale analyses. We described Rabifier2, a tool that of-
fers accurate automatic Rab annotations, which is achieved by combining com-
putational methods with manually curated datasets in an automated multi-step
pipeline. The new version of the pipeline provides more accurate annotations,
better accessibility, and a major speed increase over the initial version. Despite
these improvements, there still exist areas for further development. Rabifier clas-
sification capability is limited, by design, to existing Rab subfamilies that have
been manually curated; proteins that are not sufficiently similar to the existing
6.2. Outlook 151
subfamilies are collectively classified as RabX. However, the pipeline could au-
tomatically cluster such predictions into new subfamilies (and suggest their posi-
tion in the Rab family tree), for further manual verification.
Although Rabifier defines clear rules for Rab classification, it neither pro-
vides a direct description of the evolutionary history of the family nor points
to its origin within small GTPases. Yet, it can provide initial insight into these
problems and generate hypotheses that can be further tested. We investigated the
origin of Rab GTPases in Eukaryotes, based on the initial prediction, by Rabifier,
of the existence of putative Rab-like proteins in Archaea. Low-informativeness
of Rab sequences precludes any single method from revealing the early evolu-
tion of the family. However, a comprehensive manual examination involving
several methods analysing different Rab properties (i.e. sequence, structure, and
interactions), revealed that, indeed, proteins with Rab-like properties evolved in
Archaea. These results were possible because we were able to narrow the scope
of the analysis using Rabifier.
The results presented in this thesis show that often to obtain a more accurate
estimation of protein evolutionary histories it is necessary to include specific
models or tools that capture specific properties, characteristic of these proteins.
6.2 Outlook
The work presented in this thesis can be continued in several ways. Yet, there are
two main directions: multiple technical and methodological aspects of the pre-
sented tools can be further improved (some possible improvements have already
been mentioned throughout the thesis), and these tools can be used to analyse
protein and cell evolution.
The CC model improves homology inference for coiled-coil proteins by pro-
viding more accurate amino acid substation rate estimates. However, given the
periodicity of the coiled-coil sequences, it should be possible to further improve
the model by assigning a different set of substitution rates to different positions
of the pattern. The simplest implementation could define two models, one de-
scribing the rates at the hydrophobic positions (ad), the other at the hydrophilic
(bcefg) positions. Such models could be then assigned to the corresponding po-
sitions in two ways: based on the coiled-coil pattern register from a coiled-coil
152 Chapter 6. Discussion
predicting tool or by maximizing the likelihood of the alignment for a given tree.
Yet, both approaches are contingent on the quality of the sequence alignment; a
misaligned coiled-coil pattern may result in hydrophobic and polar positions co-
occurring at the same alignment columns. Hence, another possible improvement
to the overall quality of the evolutionary inference of coiled-coil proteins could
involve an improved sequence alignment method that incorporates information
about the coiled-coil register (i.e. each residue has a corresponding a-g heptad
position assignment). These modifications to the classical pipeline should im-
prove the accuracy of phylogenetic inference. A different approach that could
bring further improvements to homology detection can involve heuristic meth-
ods, for example, using the length of the coiled-coil domain (which is generally
conserved in homologous proteins) and oligomerization state to increase predic-
tion confidence. For instance, given a low level of similarity between query
and target sequences, a method can compare the difference in length of the pre-
dicted coiled-coil domain (length variation depends on protein function, hence,
GO terms should be included) and its oligomerization state. This approach re-
sembles the manual curation process, where an expert compares many features
to improve the annotation. It should improve search specificity by discarding un-
likely hits, without sacrificing sensitivity (the trade-off between specificity and
sensitivity can be optimized in an appropriate benchmark).
Rabifier is a bioinformatic pipeline, it classifies Rab GTPases based on se-
quence similarities to the reference family and subfamilies profiles. Such ap-
proach is computationally very efficient, scaling well with the number of se-
quences and reference subfamilies. Yet, it ignores information about the phy-
logenetic relationships within the family; such information should improve pro-
tein classification by inserting the sequence in its appropriate phylogenetic con-
text. Classical phylogenetic methods are computationally too demanding to be
included in high throughput pipelines: each time a new sequence is classified a
tree, largely composed of reference sequences, must be re-computed. This cost
can be, however, decreased by using precomputed data, that is by extending the
existing reference tree/alignment with new sequences (the reference can also be
manually verified and corrected to improve the subsequent automatic classifica-
tion). Such solution has been implemented in PAGAN (Löytynoja et al. 2012),
6.2. Outlook 153
the algorithm aligns a new sequence to the existing multiple sequence alignment
in the phylogenetic context. PAGAN could be used in the final step of the Rab-
ifier pipeline, especially with low-scoring annotations. The addition of the phy-
logenetic component to the pipeline can also be used to automatically classify
unknown/new Rab GTPases (RabX) into new putative subfamilies. Rabs that do
not cluster together with existing subfamilies may form new distinct clades in
the Rab family tree. Such putative groups can be then manually inspected and
added to the set of Rabifier’s subfamily models.
Rabifier has been specifically designed to identify and classify Rab GTPases,
yet, a very similar framework can be used to classify other protein families with
similar properties (i.e. large families of closely related proteins). The most ob-
vious candidates are other small GTPases or even other families of the P-loop
NTPase fold1. This new tool could automatically classify proteins into respec-
tive families and subfamilies allowing for an easy, automated annotation of small
GTPases and prediction of the corresponding intracellular signalling pathways
in newly sequenced organisms. Such endeavour would mostly require compiling
additional reference datasets defining new families and subfamilies. Additional
annotation specificity can be obtained by defining conserved sequence regions at
the family level, similar to the RabF motifs.
Improved methods for molecular evolution allow inferring more accurate
evolutionary histories of protein families. This, however, has wider implications.
An accurate description of protein evolution is also informative about cellular
evolution: proteins are building blocks of cellular components, they are involved
in virtually all cellular processes, where they perform diverse molecular func-
tions. The analysis of cell biology in the evolutionary context has been termed
as Evolutionary Cell Biology (Brodsky et al. 2012; Lynch et al. 2014). Diversity
at all biological levels can ultimately be traced back to the change at the cellu-
lar level, which places cells at the focus of biological research. Multiple ques-
tions concerning cell biology can be asked in the evolutionary context to explain
the observed diversity of intracellular components. When did cellular innova-
tions arise? Did they evolve de novo or by co-option of existing components?
What are the processes that drive these innovations: natural selection, random
1An initial analysis of classification performance using simple methods (e.g., BLAST) is re-quired to assess the necessity of developing a more complex tool.
154 Chapter 6. Discussion
genetic drift? What constrains variation of cellular components? An integrative
approach involving different types of data (genomic, functional, morphological)
is required to answer these questions. Yet, most information is available for only
a few model organisms that do not represent complete biological diversity. They
are biased towards animals, fungi, plants and microbes of medical and industrial
interest. A feasible initial approach of capturing the existing diversity requires
sequencing genomes of new species to populate underrepresented taxa and pos-
sibly establish new ones. It can bring unexpected breakthroughs that introduce
new highly informative species like the Lokiarchaea (Spang et al. 2015). Large-
scale projects have been devised to sequence a yet unseen microbial diversity.
For instance, Rinke et al. (2013) sequenced more than 200 archaeal and bacterial
species from diverse environments that belong to the largely uncharted branches
of the tree of life (often referred to as the ‘microbial dark matter’). Unfortunately,
many species are uncultivable in the laboratory conditions, which precludes from
obtaining functional data. It also poses a challenge to the sequencing technolo-
gies (metagenomics and single-cell genomics), genome assembly and annota-
tion. Obtaining a comprehensive description of cellular evolution is contingent
on many factors including collecting genomic data from diverse organisms and
developing improved methods for analysing the data, for example, more accurate
methods for sequence annotation and homology detection.
In this thesis, we presented refined tools for protein homology mapping that
can be used in the context of the evolutionary cell biology. We studied the origin
of the eukaryotic endomembrane trafficking system. We detected putative Rab-
like GTPases in Archaea using Rabifier and other sensitive methods. Similarly,
Klinger et al. (2016) searched for the components of the endomembrane system
in Archaea. They identified two eukaryotic signature proteins (Gtr/Rag GTPases
and the RLC7 dynein component) and estimated a split of Arf-like and Ras-like
superfamilies in Archaea. Yet, they could not detect other components of the
trafficking system including golgin and SNARE (proteins composed of coiled-
coil domains). This indicates that more genomes, of sister species to Lokiarchaea
and Eukarya, are required for a more sensitive analysis. The origin of other
eukaryotic components is also elusive, for example, the Golgi apparatus and the
microtubule-organizing center. Coiled-coil proteins are crucial components of

6.2. Outlook 155
these organelles, hence, our description of coiled-coil properties, including the
model, may prove useful in this context.

156 Chapter 6. Discussion
References
Brodsky, F. M., Thattai, M., and Mayor, S. (2012). Evolutionary cell biology:
Lessons from diversity. Nature 14, 651.
Klinger, C. M., Spang, A., Dacks, J. B., and Ettema, T. J. (2016). Tracing the Ar-
chaeal Origins of Eukaryotic Membrane-Trafficking System Building Blocks.
Molecular Biology and Evolution, msw034.
Löytynoja, A., Vilella, A. J., and Goldman, N. (2012). Accurate extension of mul-
tiple sequence alignments using a phylogeny-aware graph algorithm. Bioin-
formatics 28, 1684–1691.
Lynch, M., Field, M. C., Goodson, H. V., Malik, H. S., Pereira-Leal, J. B., Roos,
D. S., Turkewitz, A. P., and Sazer, S. (2014). Evolutionary cell biology: Two
origins, one objective. Proceedings of the National Academy of Sciences 111,
16990–16994.
Rinke, C., Schwientek, P., Sczyrba, A., Ivanova, N. N., Anderson, I. J., et al.
(2013). Insights into the phylogeny and coding potential of microbial dark
matter. Nature 499, 431–437.
Spang, A., Saw, J. H., Jørgensen, S. L., Zaremba-Niedzwiedzka, K., Martijn, J.,
Lind, A. E., Eijk, R. van, Schleper, C., Guy, L., and Ettema, T. J. G. (2015).
Complex archaea that bridge the gap between prokaryotes and eukaryotes.
Nature 521, 173–179.


![JONAS WEISSMANN GAIARSA HISTÓRIA EVOLUTIVA DE … · Gaiarsa JW. Evolutionary history of lignocellulosic carbo-hydrolases of the Xanthomonadaceae family. [Ph. D. thesis (Biotechnology)].](https://static.fdocumentos.com/doc/165x107/5c4a0a4093f3c34c5507c45a/jonas-weissmann-gaiarsa-historia-evolutiva-de-gaiarsa-jw-evolutionary-history.jpg)