universidade federal do paraná thayanne lima barros estresse ...
36
UNIVERSIDADE FEDERAL DO PARANÁ THAYANNE LIMA BARROS ESTRESSE OXIDATIVO NO POLIQUETA LAEONEREIS CULVERI APÓS CONTAMINAÇÃO E DESCONTAMINAÇÃO ABRUPTAS POR ESGOTO EM UM ESTUÁRIO SUBTROPICAL OXIDATIVE STRESS IN THE POLYCHAETE LAEONEREIS CULVERI AFTER ABRUPT CONTAMINATION AND DECONTAMINATION BY SEWAGE IN A SUBTROPICAL ESTUARY CURITIBA 2016
-
Upload
trankhuong -
Category
Documents
-
view
214 -
download
0
Transcript of universidade federal do paraná thayanne lima barros estresse ...

UNIVERSIDADE FEDERAL DO PARANÁ
THAYANNE LIMA BARROS
ESTRESSE OXIDATIVO NO POLIQUETA LAEONEREIS CULVERI APÓS
CONTAMINAÇÃO E DESCONTAMINAÇÃO ABRUPTAS POR ESGOTO EM
UM ESTUÁRIO SUBTROPICAL
OXIDATIVE STRESS IN THE POLYCHAETE LAEONEREIS CULVERI AFTER
ABRUPT CONTAMINATION AND DECONTAMINATION BY SEWAGE IN A
SUBTROPICAL ESTUARY
CURITIBA
2016
2
UNIVERSIDADE FEDERAL DO PARANÁ
THAYANNE LIMA BARROS
ESTRESSE OXIDATIVO NO POLIQUETA LAEONEREIS CULVERI APÓS
CONTAMINAÇÃO E DESCONTAMINAÇÃO ABRUPTAS POR ESGOTO EM
UM ESTUÁRIO SUBTROPICAL
OXIDATIVE STRESS IN THE POLYCHAETE LAEONEREIS CULVERI AFTER
ABRUPT CONTAMINATION AND DECONTAMINATION BY SEWAGE IN A
SUBTROPICAL ESTUARY
CURITIBA
2016

1
UNIVERSIDADE FEDERAL DO PARANÁ
THAYANNE LIMA BARROS
ESTRESSE OXIDATIVO NO POLIQUETA LAEONEREIS CULVERI APÓS
CONTAMINAÇÃO E DESCONTAMINAÇÃO ABRUPTAS POR ESGOTO EM
UM ESTUÁRIO SUBTROPICAL
OXIDATIVE STRESS IN THE POLYCHAETE LAEONEREIS CULVERI AFTER
ABRUPT CONTAMINATION AND DECONTAMINATION BY SEWAGE IN A
SUBTROPICAL ESTUARY
Dissertação apresentada ao Curso de
Pós-Graduação em Zoologia, Setor de
Ciências Biológicas da Universidade
Federal do Paraná.
Orientador: Dr. Paulo da Cunha Lana
CURITIBA
2016

2

3
AGRADECIMENTOS
Ao Paulo, pela dedicação, acessibilidade e principalmente pelo entusiasmo
durante esses dois anos.
Aos professores José Monserrat, Helena de Assis e Afonso Bainy, pela
disponibilidade e interesse em compor a banca avaliadora dessa dissertação.
Ao Centro de Estudos do Mar e à Universidade Federal do Paraná (UFPR),
pelo apoio logístico e infraestrutura para realização das atividades.
Ao Programa de Pós-Graduação em Zoologia da Universidade Federal do
Paraná, ao Conselho Nacional de Desenvolvimento Científico e Tecnológico
(CNPq) e à Coordenação de Aperfeiçoamento de Pessoal de Nível Superior
(CAPES), pela concessão da bolsa de mestrado.
Ao professor Dr. Adalto Bianchini e à Dra. Roberta Klein do Instituto de
Ciências Biológicas FURG, pela recepção e atenção durante minha estadia na
FURG e pelo aprendizado das técnicas e procedimentos para determinação
dos biomarcadores utilizados neste trabalho.
À Mariana Holanda e ao Lucas Maltez, pela calorosa acolhida durante o
período das análises em Rio Grande.
Ao professor Dr. César Martins do Laboratório de Geoquímica Orgânica e
Poluição Marinha do CEM/UFPR pelas análises geoquímicas, à Ana Lucia
Lindroth Dauner pela extração das amostras e Ana Caroline Cabral pela
análise cromatográfica.
Ao professor Dr. Marcelo Lamour e à Msc. Pâmela Cattani do Laboratório de
Estudos Morfodinâmicos e Sedimentológicos do CEM/UFPR, pelas análises
granulométricas.
À professora Dra. Helena Cristina da Silva de Assis e à Dra. Izonete Guiloski
do Departamento de Farmacologia da UFPR, pelo armazenamento das
amostras.
Aos motoristas, vigilantes noturnos, marinheiros, telefonista, técnicos e demais
funcionários do Centro de Estudos do Mar por toda ajuda e parceria durante o
desenvolvimento do projeto. Um agradecimento especial ao Agnaldo,
Alexandre, Fumaça, Edinaldo, Pedro, Abraão, Felipe, Josias, Moisés, Ronei e
Sérgio.
Aos professores do Programa de Pós-Graduação em Zoologia e em Sistemas
Costeiros e Oceânicos da UFPR, pelos ensinamentos e contribuições
acadêmicas.

4
Aos integrantes do Laboratório de Bentos pelo companheirismo, “pitacos” e
ajuda durante os experimentos.
Aos voluntários que ajudaram nas inúmeras idas à campo, triagens, testes,
montagem de equipamento, instalação dos experimentos e organização das
coletas: Maria Emília Diez, Luiz Silva, Amanda Alvarez, Olalla Alonso, Adriana
Sardi, Cristiane de Matos, Rodolfo Rocha, Júlia Porto, Ariane Rodrigues, Flávia
de Souza, Christina Lazzarotto, Gustavo de Oliveira, Daniele da Conceição,
Madson de Melo, Ilara, Bruna Marcela, Nálita Scamparle, Bárbara Gimenez,
Mathilde Lemoine, Estela Pires, Orlando Ricetti, Inara Regina, Aline Cason,
Matheus Japur, Jessé Scapini, Bruno Escobar, Fernanda Souza, Eliandro
Gilbert, Bianca Possamai, Hectory Siuch, Kalina Brauko, Leonardo Sandrini,
Angel Gonzalez, Hugo, Ândrea Lemes, Rodrigo Pelanda, Taynara Pinheiro,
Renan Macedo, Julia Castro e Marina Sutili.
À minha família e amigos pelo constante apoio e incentivo. Apesar da distância,
sempre se fazem presentes nos momentos mais importantes.

5
ABSTRACT
This study experimentally evaluated in situ responses of the polychaete
Laeonereis culveri to acute or chronic contamination/decontamination by
sewage in a subtropical estuary. We assessed levels of the total antioxidant
capacity (ACAP) and lipoperoxidation (LPO) through an experiment involving
reciprocal transplants between contaminated and uncontaminated intertidal
areas in acute/short term (24 to 96 hours) and chronic/medium term (7 to 14
days) time scales. In the acute assay, LPO levels significantly increased in
animals transplanted from an uncontaminated to a contaminated area.
However, there was no significant decrease in ACAP levels between
transplanted worms and those from origin areas. There was no significant
decrease of LPO levels in animals transplanted from contaminated to
uncontaminated areas, but ACAP levels surprisingly decreased over time. None
of the biochemical variables were affected in the chronic assay. Variations in
biochemical responses were more related to background variability over time
and heterogeneity among areas than to the experimental manipulation itself.
Our results strongly suggest that biochemical responses in L. culveri occur on
the time scale of hours to days after abrupt contamination or decontamination.
Keywords: sewage; oxidative stress; lipoperoxidation; manipulation; recovery

6
RESUMO
Avaliamos experimentalmente respostas in situ do poliqueta Laeonereis
culveri à contaminação/descontaminação aguda e crônica por esgoto em um
estuário subtropical. Analisamos os níveis de capacidade antioxidante contra
radicais peroxil (ACAP) e de lipoperoxidação (LPO) com um experimento
envolvendo transplantes recíprocos entre áreas contaminadas e não
contaminadas em agudo/curto (24 à 96 horas) e crônico/médio (7 à 14 dias)
prazo. No experimento agudo, os níveis de LPO aumentaram
significativamente nos animais transplantados da área não contaminada para a
área contaminada. Contudo, não houve uma diminuição significativa nos níveis
de ACAP entre os animais transplantados e os da área de origem. Não houve
decréscimo significativo nos níveis de LPO nos animais transplantados da área
contaminada para a área não contaminada, mas os níveis de ACAP diminuíram
ao longo do tempo. Variações nas respostas bioquímicas no experimento
crônico estavam mais relacionadas à variabilidade de fundo ao longo do tempo
e à heterogeneidade entre áreas do que à manipulação experimental. Nossos
resultados indicam que as respostas bioquímicas em L. culveri ocorrem na
escala de horas a dias após contaminação ou descontaminação abruptas.
Palavras-chave: esgoto; estresse oxidativo; peroxidação lipídica; manipulação; recuperação

7
TABLE OF CONTENTS
1. INTRODUCTION ................................................................................................................ 8
2.1. Study area ................................................................................................................. 10
2.2. Experimental design and field procedures ........................................................... 11
2.3. Sampling processing and laboratory procedures ................................................ 13
2.3.1. Tissue homogenization .................................................................................... 13
2.3.2. Antioxidant competence against peroxyl radicals determination .............. 13
2.3.3. LPO determination ............................................................................................ 14
2.3.4. Coprostanol ....................................................................................................... 14
2.3.5. Grain size and organic matter content .......................................................... 14
2.4. Data analysis ............................................................................................................. 15
3. RESULTS .......................................................................................................................... 15
3.1. Water and sediment variables ................................................................................ 15
3.2. Acute Experiment ..................................................................................................... 16
3.2.1. Transplant to the contaminated area (UC to C) ............................................... 18
3.2.2. Transplant to the uncontaminated area (C to UC) .......................................... 18
3.3. Chronic experiment .................................................................................................. 18
3.3.1. Transplant to the contaminated area (UC to C) ............................................... 18
3.3.2. Transplant to the uncontaminated area (C to UC) .......................................... 20
4. DISCUSSION .................................................................................................................... 20
5. CONCLUSIONS................................................................................................................ 23
6. REFERENCES ................................................................................................................. 23
SUPPLEMENTARY MATERIAL ............................................................................................ 30

8
1. INTRODUCTION
Coastal zones are vulnerable to pollution from multiple sources, including
domestic and industrial discharges, agricultural runoff, and ship traffic (Islam
and Tanaka, 2004). Sewage discharges, made up by a complex mixture of
organic and inorganic components (Craig, 2012), are chronic sources of
pollution in developing countries, such as Brazil, with precarious sanitation
conditions, and inadequate facilities for the collection, treatment and disposal of
domestic wastewater (Martins et al., 2008). There is a need to assess the
sensitivity of coastal systems to sewage contamination and their recovery
potential from the impact of anthropogenic stresses, as a basis for adequate
management. Despite recovery time scales are expected to be dependent on
the particular community affected and the magnitude of the impacts (Duarte et
al., 2015), estuaries, which have naturally large populations of stress-tolerant
strategists, may recover relatively fast (Elliott and Whitfield, 2011). Ongoing
monitoring of human activities in coastal areas, particularly in developing
countries with basic sanitation problems, is necessary to ensure safer
operations and prevent or reduce damage to marine systems (Bevilacqua et al.,
2006)
Sewage pollution may affect the activity of multiple enzymes and
stimulate reactive oxygen species (ROS) production causing significant
oxidative damage (Livingstone, 2003; Bebianno et al., 2005; Bianchi et al.,
2014), given the capacity to generate reactive oxygen species (ROS), altering
the balance of pro-oxidants and antioxidants at the molecular and cellular level
(Baussant et al., 2009; Manduzio et al., 2005). Oxidative stress biomarkers are
widely used in environmental impact studies since they are considered a key
component of the response of organisms exposed to changing environmental
conditions and can be used to evaluate exposure to and effect of different
contaminants (Cajaraville et al., 2000; Douhri and Sayah, 2009; Gomes et al.,
2013; Lesser, 2006; Lushchak, 2011; Maranho et al., 2015; Martinez-Gomez et
al., 2010; Monserrat et al., 2007; Thain et al., 2008). For instance, exposure to
domestic sewage effluents causes an increase in lipid damage in marine worms
(Vlahogianni et al., 2007). Additionally, low capacity to face oxidative stress is
known for the polychaetes Laeonereis acuta and Perinereis gualpensis from
contaminated coastal areas (Díaz-Jaramillo et al., 2010; Geracitano et al.,
2004).
Classical oxidative stress studies usually measure a limited number of
antioxidants individually, such as SOD, catalase, GPX, and free radical
scavengers (Livingstone, 2003). However, determination of total antioxidant
capacity is essential to evaluate pollution effects and understand how oxidants
interact with the reactive oxygen species generated during oxidative stress
(Amado et al., 2009; Regoli et al., 2002). The analysis of total antioxidant

9
capacity may thus provide an overall assessment of the biological responses
against a particular type of ROS, such as peroxyl radicals (Bocchetti and
Regoli, 2006).
Lipid peroxidation (LPO) is the oxidation of cell membranes by ROS
which leads to the formation of secondary products (Reid and MacFarlane,
2003). The measurement of lipid peroxidation products represents an effect
biomarker besides being considered an index of peroxidation of membrane
phospholipids (Gorbi et al., 2005). Lipid peroxidation leads to loss of
permeability and integrity of cell membranes. Malondialdehyde (MDA) is an
end-product and has been widely used as an indicator of lipid injury caused by
ROS (Almeida et al., 2005).
Benthic organisms are considered reliable indicators of marine pollution
(Burton, 2013; Neto et al., 2010) and evaluation of their responses to
disturbance is essential for impact assessments (Dauvin et al., 2010).
Nevertheless, the use of oxidative stress responses for field monitoring in
estuarine benthic organisms is still scarce in the southern hemisphere (Díaz-
Jaramillo et al., 2013). Among macrofauna, polychaetes are often used in
environmental studies due to their high species and trophic diversity, sedentary
life-style, which ensures chronic exposure to any toxic materials in the
environment, resistance to different contamination levels, and abundance in
benthic communities (Dean, 2008).
Polychaetes belonging to the nereidid genus Laeonereis are among the
numerically dominant organisms in Paranaguá Bay, one of the largest and best
preserved subtropical estuaries in the South Atlantic (Souza et al., 2013).
Laeonereis most probably comprises a complex of cryptic species which occur
or co-occur from Florida to Argentina. Species of Laeonereis are considered
key species in SW Atlantic estuarine coastal environments for fish, shore birds
and carnivore invertebrates. The names Laeonereis culveri (which we favour till
a much needed phylogenetic review based on molecular data) and L. acuta are
largely interchanged both in the taxonomical and ecological literature in the
southwestern Atlantic. Laeonereis, usually under the name Laeonereis acuta, is
well known in terms of its antioxidant responses and oxidative damage induced
by pollutants, both under experimental and field conditions, in the Patos Lagoon
estuary, S Brazil (Geracitano et al. 2002, 2004a,b; Monserrat et al., 2007).
In this study we evaluated oxidative stress and antioxidant responses in
populations of Laeonereis culveri from a sewage-contaminated subtropical
estuary after abrupt recovery or disturbance, by carrying out reciprocal
sediment transplants between contaminated and uncontaminated areas at
acute and chronic time scales. We carried out two in situ assays to assess the
extent and velocity of biochemical responses of L. culveri to abrupt

10
decontamination or contamination to sewage, by evaluating lipid peroxidation,
and total antioxidant capacity. We hypothesized that if organisms from
contaminated areas show higher MDA levels and a lower capacity to face
oxidative stress than those from uncontaminated areas, then their transplant to
uncontaminated areas will induce the reduction of MDA levels and the increase
of antioxidant competence against peroxyl radicals (ACAP) levels. Conversely,
animals transplanted from uncontaminated to contaminated areas will display
increased MDA levels and decreased ACAP levels both in short term/acute (24,
48 and 96 hours) and medium term/chronic (7 to 14 days) time scales.
Responses of Laeonereis culveri to sewage disturbance and subsequent
ecological recovery may provide a better tool to assess the putative effect of
these complex mixture of contaminants and to develop management policies.
2. MATERIALS AND METHODS
2.1. Study area
The Paranaguá Bay (25º30’ S, 48º25’ W), located in the coastal plain of
Paraná State, in Southern Brazil, is a semi-closed estuarine system, bordered
by extensive tidal plains and colonized by mangroves and marshes (Fig.1). The
bay has an average depth of 5.4 m, with a surface area of about 250 km² (Lana
et al., 2001). Estuarine hydrodynamics is mainly regulated by tidal currents, and
markedly seasonal fresh-water input (Marone et al., 2005). Macrobenthic
communities of local mangroves are numerically dominated by crabs and
polychaetes (Faraco and Lana, 2003).
Some sectors of the Paranaguá Bay are impacted by urban, industrial,
agricultural and harbour activities (Ribeiro et al., 2013). The lack of a sanitation
system is still a basic health problem. Levels of inorganic nutrients from
Paranagua city sewage exceed threshold limits determined by the Brazilian
environmental legislation (Mizerkowski et al., 2012). Most of the sewage from
Paranaguá city is discharged into Itiberê and Emboguaçú rivers (Kolm et al.,
2002), creating dispersion plumes and sedimentary environments with high
levels of organic matter, faecal coliforms and faecal steroid concentrations in
the vicinity of Paranaguá city (Abreu-Mota et al., 2014; Martins et al., 2010).
We selected two experimental areas in tidal plains at the mouth of Chumbo
river and at Cotinga Island, which are about 3 km apart from each other, and
display different levels of human pressure (Fig. 1). Both were previously
prospected for dense populational patches of Laeonereis. We selected the tidal
plain at the mouth of Chumbo river as an area contaminated by sewage.
Sewage is discharged directly into the estuary about 300 m from the
experimental area, without even primary treatment. Sewage discharge creates

11
a sharp and compressed contamination gradient which is limited to areas near
the city of Paranaguá (Barboza et al., 2015; Brauko et al., 2015). In contrast,
the tidal plain of Cotinga Island is uncontaminated by sewage, as indicated by
the concentrations of faecal sterols (see section of results).
Figure 1. Study areas in the tidal plains near the Chumbo River (Contaminated – C) and
Cotinga Island (Uncontaminated – UC). Modified from Gern and Lana (2013).
2.2. Experimental design and field procedures
We carried out two in situ experiments to evaluate the response of
oxidative stress biomarkers of Laeonereis culveri after acute/short term (April
2015) and chronic/medium term (May 2015) exposure to sewage. Both field
experiments were licensed by SISBIO (license no. 36255, of the Brazilian
Ministry of Environment). In each field assay, we transplanted worms between
the contaminated and the uncontaminated area to simulate either abrupt
contamination or decontamination by sewage (transplant treatment). To assess
the effects of experimental artifacts (i.e, to discriminate between the effect of the
new environmental conditions and the effect of experimental handling), as
suggested by Crowe and Underwood (1999), worms were also translocated
within each of the origin areas (translocation treatment). Control treatments to
assess background variation included worms from each area, without any
manipulation.

12
Two blocks were established 40 m apart from each other, in each area.
Each block included three experimental sites, 4 m apart from each other,
corresponding to the treatments (transplantation, translocation, and control)
(Fig. 2). Test organisms were transported in sediment blocks within an essay
chamber (Fig. 2), modified from Burton et al. (2005) and originally designed for
in situ assays with Hediste diversicolor, to reduce transportation stress. Each
chamber consisted of 10 cm inner diameter plastic pots with openings in the top
and two rectangular windows. To prevent the escape of the test organism and
allow the proper exchange of interstitial and overlying waters, the openings
were covered with a 40 µm nylon mesh.
We have taken three replicates for each treatment for each site over
three successive sampling times (24, 48, and 96 hours) for the acute
experiment and two successive sampling times (7 and 14 days) in the chronic
experiment. All samples were performed simultaneously in both tidal flats at
same time. Surface sediment samples were collected in each experimental site
to assess grain size, organic matter content and contamination levels using
coprostanol as a geochemical marker.
Figure 2. The schematic arrangement of the sampling sites in the contaminated (C) and
uncontaminated area (UC) and the essay chambers. B1 = block 1, B2 = block 2, Cuc = control

13
for the uncontaminated area, Cc = control for the contaminated area, TL = translocate, TP =
transplant.
2.3. Sampling processing and laboratory procedures
Samples were screened through a 0.5 mm mesh. A pool of 6 to 9
polychaetes weighing between 35 and 55 mg were collected from each
replicate, cleaned and kept frozen at −80 °C until biochemical analysis. Only
complete, undamaged individuals were selected.
2.3.1. Tissue homogenization
For the biochemical measurements, organisms were homogenized (1:3
w:v) in buffer solution containing 0.5 M sucrose, 20 mMTris-base, 1 mM EDTA,
1 mMdithiothreitol (DTT) and 0.15 M KCL with pH adjusted to 7.6 and adding
protease inhibitor (0.1 mMphenylmethylsulfonyl fluoride, PMSF) (Geracitano et
al., 2004). Homogenates were centrifuged at 10.000g for 20 min at -4ºC.
Supernatants were collected, stored at -80 ºC and employed later to determine
total protein content, antioxidant capacity against peroxyl radical, and LPO
levels.
Protein concentration was determined using a commercial reagent kit
('ProteínasTotais', Doles Reagentes, Lagoa Santa, MG, Brazil), which is based
on the Biuret method. Absorbance readings (550 nm) were performed in
triplicate using a microplate reader (ELx808IU, BioTek Instruments, Winooski,
VT, USA).
2.3.2. Antioxidant competence against peroxyl radicals determination
Antioxidant competence against peroxyl radicals (ACAP) was measured
according to Amado et al. (2009). Briefly, homogenate supernatant obtained for
ACAP measurements had its protein content adjusted to 1.5 mg/ml. In a white
96-well microplate, we pipetted 10 µL of the supernatant, 127.5 µL of reaction
buffer (30 mM HEPES, 200 mMKCl, and 1 mM MgCl2,) with pH adjusted to 7.2,
and prepared a half of the wells with 7.5 µL ultrapure water and the other half
(with the same samples) 7.5 µL of 4 mM ABAP (2,2′-azobis 2
methylpropionamidinedihydrochloride, a ROS producer). Then, we put the
microplate into a fluorescence microplate reader (Victor 2, Perkin Elmer) and
added 10 µL of H2DCF-DA (2′,7′ dichlorofluorescein diacetate), a fluorescent
probe. The readings were taken every 5 min during 30 min at 37ºC. At this
temperature, thermal decomposition of ABAP produces ROS and the non-
fluorescent compound H2DCF is oxidized by ROS to the fluorescent compound
DCF, allowing to detect competence in neutralizing peroxyl radicals. Therefore,
we can measure the antioxidant capacity with the relative difference between
ROS area with and without ABAP and the data were expressed as 1/relative
area, where a smaller area means a lower antioxidant capacity.

14
2.3.3. LPO determination
Lipid peroxidation was measured by thiobarbituric acid reactive
substances (TBARS) determination as described by Oakes & Van Der Kraak
(2003). Samples homogenates obtained for LPO determination had its protein
content adjusted to 3 mg/ml. We added 20 µL of tissue homogenate in test
tubes with the reaction mixture containing 67 mM BHT, 20 % acetic acid, 0,8%
thiobarbituric acid (TBA), ultrapure water and 8,1% sodium dodecyl sulfate
(SDS). Then, tubes were heated in a water bath at 95 °C for 30min. After
cooling, ultrapure water and n-butanol were added with thorough vortexing.
After centrifugation at 825 xg for 10 minutes at 15 °C, 150 µL of the supernatant
were put in a 96-well clear polystyrene plate and its fluorescence measured on
a fluorescence microplate reader (excitation: 515 nm; emission: 553 nm; Victor
2, Perkin Elmer). Under these conditions of high temperature and acidity,
malondialdehyde (MDA), an end product of lipid peroxidation, reacts with
thiobarbituric acid (TBA), allowing its measurement. Concentration of TBARS
was calculated employing a standard curve built with tetramethoxypropane
(TMP) and the results were expressed as nmol MDA/ mg of protein.
2.3.4. Coprostanol
The anthropogenic input of sedimentary organic matter, represented by
sewage contribution, was evaluated by fecal sterol concentrations, such as
coprostanol and epicoprostanol. Coprostanol is produced in the digestive tracts
of humans by microbial reduction of cholesterol (Venkatesan and Mirsadeghi,
1992) and epicoprostanol is formed during wastewater treatment and sewage
sludge digestion (Mudge and Lintern, 1999). These sterols are widely used as
tracers for human waste along coastal areas (Readman et al., 2005). The top 2
cm of surface sediment was collected with a spoon and placed in pre-cleaned
aluminum foil and stored at –20 ºC until determination. The identification and
quantification of sterols occurred by 2 µL of the resulting final extract injection
into a gas chromatograph (Agilent 7890A GC) coupled with a flame ionization
detector (GC-FID).
2.3.5. Grain size and organic matter content
Particle size analysis was conducted using the laser diffraction method
measured by the MICROTRAC Bluewave laser diffraction particle size analyzer.
Sediment parameters were estimated according to Folk and Ward, (1957)
method. The CO3 content and organic matter was calculated as the difference
between the initial and final weights of each sample after chemical attack, using
a solution of hydrochloric acid and hydrogen peroxide (Gross, 1971).

15
2.4. Data analysis
The statistical design demands that experiments involving animal
transplantation from uncontaminated to contaminated areas and from
contaminated to uncontaminated areas be analyzed separately.
Biomarker responses were individually tested using an analysis of
variance (ANOVA). The linear model employed to test the hypothesis consisted
of three factors: Treatments (fixed, four levels: transplantation, translocation,
contaminated control, and uncontaminated control), Time (acute experiment:
fixed, three levels: 24, 48, and 96 hours/ fixed; chronic experiment: two levels: 7
and 14 days), and Blocks (random, two levels: block 1 and block 2).
The homogeneity of variances was assessed by the Cochran’s C test. In
the absence of homogeneity, data were log-transformed prior to analysis of
variance (Underwood, 1997). For significant terms (P < 0.05), a posteriori test
was performed using Student–Newman–Keuls (SNK) test.
All statistical analyses and graphs were done into the R environment (R
Core Team, 2016) combined with GAD (Sandrini-Neto, L. & Camargo, 2014)
and sciplot (Morales, 2015) packages.
3. RESULTS
3.1. Water and sediment variables
Water regime varied from mesohaline to polyhaline (Tables 1 and 2).
Average temperatures were lower during the chronic than than during the acute
experiment. Sediment texture was similar between experimental areas, with
average grain diameter corresponding to fine sand. Organic matter content was
similar at all experimental blocks, varying from 1,69 to 2,2% (Table 3).
Table 1. Values of environmental parameters in experimental areas during the acute
experiment.
24h 48h 96h
Uncontaminated area
Salinity (%) 30 25 20
pH 8 7.9 7.9
Temperature (°C) 26.2 30.4 28.6
Dissolved oxygen (mg/L) 9.2 11.4 9.5
Contaminated area
Salinity (%) 20 15 15
pH 7.7 7.9 7.5
Temperature (°C) 25.2 27 27.7
Dissolved oxygen (mg/L) 6.8 5 6.3
Table 2. Values of environmental parameters in experimental areas during the chronic
experiment. T0 = field deployment.

16
T0 7 days 14 days
Uncontaminated area
Salinity (%) 25
Nd
20
pH 7.8 8.1
Temperature (°C) 22.8 22.9
Dissolved oxygen (mg/L) 5.0 6.9
Contaminated area
Salinity (%) 20 25 25
pH 7.7 7.4 7.7
Temperature (°C) 23 23.3 22.1
Dissolved oxygen (mg/L) 4.0 4.8 4.9
Nd= Not determined
Total sterol concentrations varied between 1.63 and 9.66 µg g-1, with
large variations between the sites of the contaminated area. Coprostanol
concentrations varied between 0.01 and 0.44 µg g–1. The highest concentration
of coprostanol (0.44 µg.g-1) was found at B1 of the contaminated area, which
was about 300 m from the sewage outfall. At the uncontaminated area, the
concentration of coprostanol was comparatively low and and epicoprostanol
was not detected (Table 3).
Table 3. Sediment parameters, sterols concentrations (in µg.g-1) and sterol diagnostic indices
in surface sediments from experimental blocks. nd = not detected.
Contaminated
area Uncontaminated
area
B1 B2 B1 B2
Particle size (µm) 172.70 205.90 225.6 213.4 250 - 125: fine sand
CO3 content 1.73 3.33 1.61 1.92 Organic matter (%) 1.69 1.32 1.84 2.20
Sterols
Coprostanol 0.44 0.09 0.03 0.01
Epicoprostanol 0.09 0.01 Nd Nd
Fecal sterol (cop+epic) 0.53 0.10 0.03 0.01
Total sterol 9.66 1.63 5.42 1.80
Sterol diagnostic indices Threshold levels
% of faecal sterols/total sterols
5.49 6.13 0.55 0.56 >50%: high sewage contamination
epicoprostanol/coprostanol
0.20 0.11 Nd Nd <0.20: untreated sewage input
3.2. Acute Experiment
ACAP levels varied significantly for the interaction among treatments,
times and blocks (interaction Tr x T x B) on both manipulations (UC to C and C
to UC), as demonstrated by the ANOVA test (supplementary material). A
posteriori analysis revealed that significant differences were only observed in
block 1. SNK tests revealed that the means of ACAP levels were higher in

17
control from contaminated than in control from uncontaminated areas.
Variations in MDA levels were significant between Treatment and Time (UC to
C) and between Treatment and Block (C to UC; Fig. 3). Nonetheless, in both
analyses, sampling times constituted a very large source of variation (note the
sizes of mean squares and F values for this term in supplementary material
Table 4).
Fig. 3 Acute experiment. Mean values of lipid peroxidation (MDA) and antioxidant competence
against peroxyl radicals (ACAP) in the polychaeta Laeonereis culveri in response to reciprocal
transplantation between a contaminated and uncontaminated estuaries. UC = uncontaminated
area, C= contaminated area, Cuc = control for the uncontaminated area, Cc = control for the
contaminated area, TLc = translocate in the contaminated area TPc = transplant to the
contaminated area, TLuc = translocate from the uncontaminated, TPuc = transplant to the
uncontaminated area, B1 = block 1, B2 = block 2. For Student–Newman–Keuls (SNK) tests, the
mean values are listed in ascending order. ‘‘>’’ indicates p < 0.05 and ‘‘=’’ indicates p > 0.05. "*"
denotes significant difference by SNK procedure. Lower values of ACAP data indicate lower
antioxidant capacity.

18
3.2.1. Transplant to the contaminated area (UC to C)
Variations in MDA levels were significantly affected by the interaction
between treatment and time (interaction Tr x T; F = 4.88; P < 0.05). The SNK
test and comparisons between the treatments revealed that MDA levels of
control from uncontaminated area were significantly lower than in the others
treatments at T3 (96 hours) (Cuc<TLc=Cc=TPc; Fig. 3).
Significant differences in ACAP levels resulted from the combined effect of
the treatments, time and sites (interaction Tr x T x B; F = 3.1576; P < 0.05).
ACAP levels on translocate treatment were significant higher than in the other
treatments (Cuc=Cc=Tpc<TLc) on time 2, block 1. At the same site on time 3
the ACAP levels were significantly higher in control from the contaminated area
(Cuc=TPc=TLc<Cc; Fig. 3).
3.2.2. Transplant to the uncontaminated area (C to UC)
The experimental manipulation did not cause detectable short-term changes
in the levels of MDA. Variations in MDA levels were significantly affected by the
combined effects of time and blocks (interaction T x B; F = 6.3974; P < 0.01 ).
On block 1, SNK a posteriori comparisons showed that MDA levels were
significantly lower at time 1 with not significant differences between T2 and T3
(T1<T3=T2) whereas on block 2, time 1 has once again the lower mean value
but time 2 shows higher MDA levels than T3 (T1<T3<T2; Fig. 3).
Variations in the mean values of ACAP radical levels resulted from the
combined effect of the treatments, time and sites (interaction Tr x T x B; F =
5.08; P < 0.001). ACAP levels of control from contaminated area were
significantly higher than the other treatments on times 2 and 3 in block 1
(Cuc=TLuc=Tpuc<Cc; TPuc=Cuc=TLuc<Cc; Fig. 3).
3.3. Chronic experiment
The mean values of total antioxidant capacity against peroxyl radical levels
were significantly affected by the combined effects of treatment, time and sites
(interaction Tr x T x B). Variations in MDA levels resulted from the combined
effect of the treatment and the blocks (interaction Tr x B), on both manipulations
(UC to C and C to UC) and sampling times constituted a very large source of
variation (note the sizes of mean squares and F values for this term in
supplementary material Table 5).
3.3.1. Transplant to the contaminated area (UC to C)
MDA levels varied significantly among treatments according to blocks and
time (Tr x B and Tr x T;F = 5.6325 and 12.973; P < 0.01 and P < 0.05,
respectively). SNK a posteriori comparisons showed that the MDA levels of
control from uncontaminated area was significantly higher on block 2
19
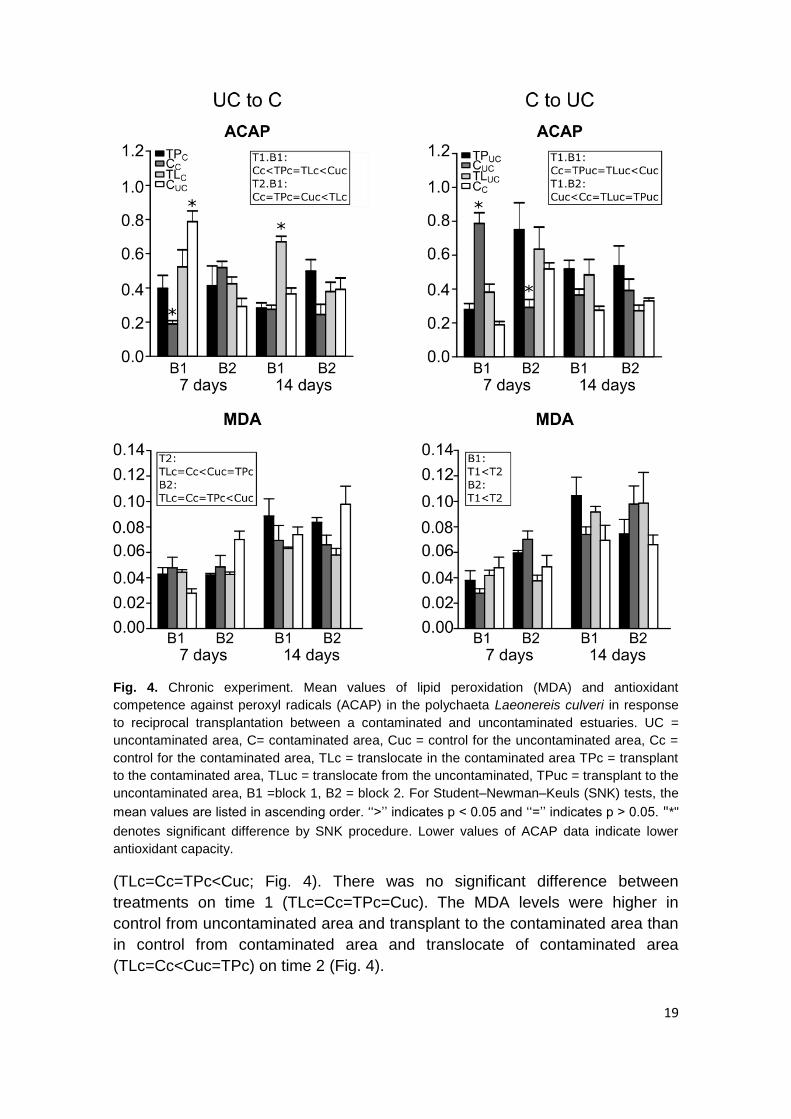
Fig. 4. Chronic experiment. Mean values of lipid peroxidation (MDA) and antioxidant
competence against peroxyl radicals (ACAP) in the polychaeta Laeonereis culveri in response
to reciprocal transplantation between a contaminated and uncontaminated estuaries. UC =
uncontaminated area, C= contaminated area, Cuc = control for the uncontaminated area, Cc =
control for the contaminated area, TLc = translocate in the contaminated area TPc = transplant
to the contaminated area, TLuc = translocate from the uncontaminated, TPuc = transplant to the
uncontaminated area, B1 =block 1, B2 = block 2. For Student–Newman–Keuls (SNK) tests, the
mean values are listed in ascending order. ‘‘>’’ indicates p < 0.05 and ‘‘=’’ indicates p > 0.05. "*"
denotes significant difference by SNK procedure. Lower values of ACAP data indicate lower
antioxidant capacity.
(TLc=Cc=TPc<Cuc; Fig. 4). There was no significant difference between
treatments on time 1 (TLc=Cc=TPc=Cuc). The MDA levels were higher in
control from uncontaminated area and transplant to the contaminated area than
in control from contaminated area and translocate of contaminated area
(TLc=Cc<Cuc=TPc) on time 2 (Fig. 4).

20
Variations on ACAP levels resulted from the combined effect of the
treatment, time and sites (interaction Tr x T x B; F = 10.8774; P < 0.001). The
SNK test and comparisons revealed that such variations occurred only in block
1. The mean values of ACAP were significantly lower in control from
contaminated area than in transplant to the contaminated area, and the mean
values of ACAP were significantly higher in control from uncontaminated area
than in translocated of contaminated area and transplant to the contaminated
area (Cc<TPc=TLc<Cuc; Fig. 4).
3.3.2. Transplant to the uncontaminated area (C to UC)
Variations in MDA levels resulted from the combined effects from the
treatment with the block and the time with the block (Tr x B and T x B, F =
4.3593 and 5.8405; P < 0.05, respectively). The SNK test and comparisons
showed that the mean values of MDA levels were significantly higher on time 2
than in time 1 on both blocks (T1<T2;Fig. 4).
Variations on ACAP were significantly affected by the combined effects of
treatment, time and sites (interaction Tr x T x B; F = 10.1675; P < 0.001). There
was no significant difference between the mean values of ACAP levels of
treatments on time 2 on both blocks. On time 1, the mean value of ACAP was
significantly higher in control from uncontaminated area than in the other
treatments on block 1 (Cc=TPuc=TLuc<Cuc) and significantly lower on block 2
(Cuc<Cc =TLuc=TPuc; Fig. 4).
4. DISCUSSION
We refuted the hypothesis that reciprocal experimental transplantation
induces acute or medium-term variation in oxidative stress responses of the
worm Laeonereis culveri. With the exception of a short-term response of MDA
levels after the abrupt exposure to sediment contaminated by domestic sewage
effluents, none of the biochemical responses were significantly affected by
reciprocal sediment transplants between contaminated and uncontaminated
areas
Differences in faecal and total sterol concentrations between blocks
indicate that the experimental blocks were not homogeneous, contrary to what
was expected. The local distribution of faecal sterols typically follows a gradient
pattern caused by the proximity to the sewage outfall (Barboza et al., 2015;
Martins et al., 2014). Barboza et al., (2015) showed a clear contamination
gradient at the kilometer scale at the study area. However, it is also known that
faecal sterol concentrations can dramatically decrease at small spatial scales
(Martins et al., 2002) or not necessarily be higher close to sewage outfalls, due
to dispersion processes (Mudge and Duce, 2005). In this context, our results
show that the 40 m distance between blocks at the contaminated area was

21
enough to considerably decrease sterol levels, probably as a consequence of
quick dispersion and dilution of the sewage-discharge plume. Discrepancy in
sterol distributions and concentrations can also be explained by small-scale
differences in sediment texture (Biache and Philp, 2013) . However, sediment
texture was similar between our experimental blocks. Thus, our results shows
significant variation in contamination conditions even at small spatial scales,
furthermore stressing the relevance of robust spatial replication for
ecotoxicological monitoring programs.
In the acute assay, as expected, the abrupt exposure to sediment
contaminated by domestic sewage effluents induced a short-term increase in
MDA levels. However, there was no significant decrease in ACAP levels
between transplanted worms and those from origin habitats. There was no
significant short-term decrease of MDA levels or increase of ACAP levels in the
transplant from a contaminated to an uncontaminated area. However, ACAP
levels of transplanted organisms decreased over time.
During the acute experiment, ACAP levels showed to significantly vary
only in block 1 for both transplants scenarios. Such a marked heterogeneity in
local contamination conditions may partially explain the unexpected response
patterns in the contaminated area, with significant short-term responses only
detected in block 1 for both transplant scenarios. Based on that, all the following
discussion on variations in ACAP refer only to the block 1.
Higher MDA levels in the control from contaminated area, transplanted
and translocated treatments (Cuc<TLc=Cc=TPc) on time 3 in transplants to the
contaminated area (UC to C) indicates that the antioxidant defense was not
sufficient to prevent oxidative damage at the lipid level. Four days of exposure
to sewage were enough to induce lipid peroxidation in transplanted organisms.
The lower mean values of antioxidant capacity in the transplanted, translocated
and control group from uncontaminated area (Cuc=TPc=TLc<Cc) on time 3,
indicate a potential higher susceptibility to oxidative damage by specific
oxyradicals. The pro-oxidant effect of sewage pollution promoting lipid
peroxidation has been previously reported for several other aquatic species
(Bianchi et al., 2014; López-López et al., 2006; Maranho et al., 2015; Soorya et
al., 2013; Vlahogianni et al., 2007).
Transplant to the uncontaminated area (C to UC) did not induce any
oxidative damage at the lipid level, as expected, since the organisms were
transplanted to an area with less anthropogenic pressure (Lukyanova, 2006;
Rocchetta et al., 2014). There were no significant difference between ACAP
levels of transplanted organisms and control of uncontaminated area after 48
hours. This indicates that organisms adapted to new environmental conditions
after an abrupt decontamination (less than 48-hours). Quick recovery responses

22
after abrupt sewage decontamination were also reported by Ferreira et al.,
(2005) and Liu et al. (2011) in fish and nematode community, respectively.
The ANOVA and SNK tests In the chronic assay indicated that variations
in biochemical responses were more related to background variability over time
and heterogeneity among areas than to the experimental manipulation itself. In
a previous experiment conducted with Perinereis gualpensis, at a same time
scale, the total antioxidant capacity and lipid peroxidation levels did not
consistently reflect differences between sites under different anthropogenic
pressure (Díaz-Jaramillo et al., 2013). The lack of differences between
treatments confirms that medium-term responses was attributed rather to the
high environmental variability than to experimental manipulation. This strongly
suggests that organism recovery after an abrupt contamination and
decontamination is a short-term process, which occurs on the scale of hours or
less than 4 days. However, Geracitano et al. (2004) showed different patterns
for biomarkers response in Laeonereis acuta after copper exposure, with
significant responses at medium but not short-time scales.
Variations on ACAP levels in 48 hours were probably a methodological
artefact, (note the high level in supplementary material and the standard error in
Figure 3).
Significant differences in ACAP levels between translocated and control
treatments, detected during the chronic experiment, were more related to
heterogeneity among experimental blocks than to methodological artefacts,
since there was a difference in faecal and total sterol concentrations between
blocks.
ACAP levels were higher in organisms from contaminated than in those
from uncontaminated areas in the acute experiment. An inverse pattern was
detected in the chronic experiment, where ACAP levels were lower in
organisms from contaminated than in those from uncontaminated areas (except
in block 2 time 1). This is unexpected, since the capacity to face oxidative stress
have previously proved to be lower in organisms from contaminated coastal
areas (Machado et al., 2014; Díaz-Jaramillo et al., 2010; Ferreira-Cravo et al.,
2007; Geracitano et al., 2004). Different response patterns for ACAP were also
recorded by Díaz-Jaramillo et al. (2011) and Díaz-Jaramillo et al. (2013).
Probably, ACAP response to xenobiotics does not follow a specific pattern,
especially when results of field and laboratory are compared. Therefore, such
comparisons should be made cautiously because organisms are subject to
variables and scales of variability that are quite different under each condition.
There is clearly a demand for more complex ecological assessments and
a further advance for ecotoxicology will dependent upon better integration of lab
toxicology with field experiments. For this, field, laboratory studies and long-

23
term monitoring combined with an advanced understanding of larger and more
complex variation along time and spatial scales are necessary to ensure that
the ecological complexity will be taken into account for better management
strategies and environmental monitoring programs.
5. CONCLUSIONS
There were no medium-term significant responses after the transplants
between contaminated and uncontaminated areas, as shown by the response
of oxidative stress and antioxidants biomarkers. With the exception of a short-
term response of MDA levels after the abrupt exposure to sediment
contaminated by domestic sewage effluents, none of the biochemical responses
were significantly altered by the impact. This result was attributed to the high
environmental variability between the experimental sites. Nevertheless, our
results strongly suggests that recovery in L. culveri after an abrupt
contamination and decontamination occurs on a very short term scale,
indicating the resilience or ability of fast recovery in estuarine species.
We also stress the importance of robust spatial replication for
ecotoxicological monitoring programs (as blocks were always interacting with
the other factors and showing significant differences), mainly when information
is scant about the local fauna and about the background variability of
biomarkers.
6. REFERENCES
Abreu-Mota, M.A., de Moura Barboza, C.A., Bícego, M.C., Martins, C.C., 2014. Sedimentary biomarkers along a contamination gradient in a human-impacted sub-estuary in Southern Brazil: A multi-parameter approach based on spatial and seasonal variability. Chemosphere 103, 156–163.
Almeida, E.A., Bainy, A.C.D., Dafre, A.L., Gomes, O.F., Medeiros, M.H.G., Di Mascio, P., 2005. Oxidative stress in digestive gland and gill of the brown mussel (Perna perna) exposed to air and resubmersed. J. Exp. Mar. Bio. Ecol. 318, 21–30.
Amado, L.L., Garcia, M.L., Ramos, P.B., Freitas, R.F., Zafalon, B., Ferreira, J.L.R., Yunes, J.S., Monserrat, J.M., 2009. A method to measure total antioxidant capacity against peroxyl radicals in aquatic organisms: Application to evaluate microcystins toxicity. Sci. Total Environ. 407, 2115–2123.
Barboza, C.A. de M., Martins, C.C., Lana, P. da C., 2015. Dissecting the distribution of brittle stars along a sewage pollution gradient indicated by organic markers. Mar. Pollut. Bull. 100, 438–444.
Baussant, T., Bechmann, R.K., Taban, I.C., Larsen, B.K., Tandberg, a H., Bjørnstad, a, Torgrimsen, S., Naevdal, a, Øysaed, K.B., Jonsson, G., Sanni, S., 2009. Enzymatic and cellular responses in relation to body burden of PAHs in bivalve molluscs: a case study with chronic levels of

24
North Sea and Barents Sea dispersed oil. Mar. Pollut. Bull. 58, 1796–807.
Bebianno, M.J., Company, R., Serafim, A., Camus, L., Cosson, R.P., Fiala-Médoni, A., 2005. Antioxidant systems and lipid peroxidation in Bathymodiolus azoricus from Mid-Atlantic Ridge hydrothermal vent fields. Aquat. Toxicol. 75, 354–73.
Bevilacqua, S., Terlizzi, A., Fraschetti, S., Russo, G.F., Boero, F., 2006. Mitigating human disturbance: Can protection influence trajectories of recovery in benthic assemblages? J. Anim. Ecol. 75, 908–920.
Biache, C., Philp, R.P., 2013. The use of sterol distributions combined with compound specific isotope analyses as a tool to identify the origin of fecal contamination in rivers. Water Res. 47, 1201–1208.
Bianchi, V.A., Rocchetta, I., Luquet, C.M., 2014. Biomarker responses to sewage pollution in freshwater mussels ( Diplodon chilensis ) transplanted to a Patagonian river. J. Environ. Sci. Heal. Part A 49, 1276–1285.
Bocchetti, R., Regoli, F., 2006. Seasonal variability of oxidative biomarkers, lysosomal parameters, metallothioneins and peroxisomal enzymes in the Mediterranean mussel Mytilus galloprovincialis from Adriatic Sea. Chemosphere 65, 913–921.
Brauko, K.M., Souza, F.M., Muniz, P., Camargo, M.G., Lana, P.C., 2015. Spatial variability of three benthic indices for marine quality assessment in a subtropical estuary of Southern Brazil. Mar. Pollut. Bull. 91, 454–460.
Burton, G.A., 2013. Assessing sediment toxicity: past, present, and future. Environ. Toxicol. Chem. 32, 1438–40.
Burton, G.A., Greenberg, M.S., Rowland, C.D., Irvine, C. a., Lavoie, D.R., Brooker, J. a., Moore, L., Raymer, D.F.N., McWilliam, R. a., 2005. In situ exposures using caged organisms: A multi-compartment approach to detect aquatic toxicity and bioaccumulation. Environ. Pollut. 134, 133–144.
Cajaraville, M.P., Bebianno, M.J., Blasco, J., Porte, C., Sarasquete, C., Viarengo, A., 2000. The use of biomarkers to assess the impact of pollution in coastal environments of the Iberian Peninsula: a practical approach. Sci. Total Environ. 247, 295–311.
Craig, R.K., 2012. The Oceans 224–238. doi:10.3390/d4020224
Crowe, T.P., Underwood, A.J., 1999. Differences in dispersal of an intertidal gastropod in two habitats: the need for and design of repeated experimental transplantation. J. Exp. Mar. Bio. Ecol. 237, 31–60.
Dauvin, J.-C., Bellan, G., Bellan-Santini, D., 2010. Benthic indicators: From subjectivity to objectivity - Where is the line? Mar. Pollut. Bull. 60, 947–53.
Dean, H., 2008. The use of polychaetes (Annelida) as indicator species of marine pollution: a review. Rev Biol Trop 56, 11–38.
Díaz-Jaramillo, M., da Rocha, A.M., Chiang, G., Buchwalter, D., Monserrat, J.M., Barra, R., 2013. Biochemical and behavioral responses in the estuarine polychaete Perinereis gualpensis (Nereididae) after in situ exposure to polluted sediments. Ecotoxicol. Environ. Saf. 89, 182–188.
Díaz-Jaramillo, M., Ferreira, J.L., Amado, L.L., Ventura-Lima, J., Martins, a,

25
Retamal, M.R., Urrutia, R., Bertrán, C., Barra, R., Monserrat, J.M., 2010. Biomonitoring of antioxidant and oxidative stress responses in Perinereis gualpensis (Polychaeta: Nereididae) in Chilean estuarine regions under different anthropogenic pressure. Ecotoxicol. Environ. Saf. 73, 515–23.
Díaz-Jaramillo, M., Martins da Rocha, A., Gomes, V., Bianchini, A., Monserrat, J.M., Sáez, K., Barra, R., 2011. Multibiomarker approach at different organization levels in the estuarine Perinereis gualpensis (Polychaeta; Nereididae) under chronic and acute pollution conditions. Sci. Total Environ. 410-411, 126–35.
Díaz-Jaramillo, M., Socowsky, R., Pardo, L.M., Monserrat, J.M., Barra, R., 2013. Biochemical responses and physiological status in the crab Hemigrapsus crenulatus (Crustacea, Varunidae) from high anthropogenically-impacted estuary (Lenga, south-central Chile). Mar. Environ. Res. 83, 73–81.
Douhri, H., Sayah, F., 2009. The use of enzymatic biomarkers in two marine invertebrates Nereis diversicolor and Patella vulgata for the biomonitoring of Tangier’s bay (Morocco). Ecotoxicol. Environ. Saf. 72, 394–9.
Duarte, C.M., Borja, A., Carstensen, J., Elliott, M., Krause-Jensen, D., Marbà, N., 2015. Paradigms in the recovery of estuarine and coastal ecosystems. Estuaries and Coasts 38, 1202–1212.
Elliott, M., Whitfield, A.K., 2011. Challenging paradigms in estuarine ecology and management. Estuar. Coast. Shelf Sci. 94, 306–314.
Faraco, L.F.D., Lana, P. da C., 2003. Response of polychaetes to oil spills in natural and defaunated subtropical mangrove sediments from Paranaguá bay ( SE Brazil ) Hydrobiologia . 321–328.
Ferreira, M., Moradas-Ferreira, P., Reis-Henriques, M.A., 2005. Oxidative stress biomarkers in two resident species, mullet (Mugil cephalus) and flounder (Platichthys flesus), from a polluted site in River Douro Estuary, Portugal. Aquat. Toxicol. 71, 39–48.
Ferreira-Cravo, M., Piedras, F.R., Moraes, T.B., Ferreira, J.L.R., de Freitas, D.P.S., Machado, M.D., Geracitano, L. a, Monserrat, J.M., 2007. Antioxidant responses and reactive oxygen species generation in different body regions of the estuarine polychaeta Laeonereis acuta (Nereididae). Chemosphere 66, 1367–74.
Folk, R., Ward, W., 1957. Brazos River Bar: A Study in the Significance of Grain Size Parameters. J. Sediment. Petrol. Vol. 27, 3–26.
Geracitano, L. a, Bocchetti, R., Monserrat, J.M., Regoli, F., Bianchini, a, 2004. Oxidative stress responses in two populations of Laeonereis acuta (Polychaeta, Nereididae) after acute and chronic exposure to copper. Mar. Environ. Res. 58, 1–17.
Gern, F.R., Lana, P.D.C., 2013. Reciprocal experimental transplantations to assess effects of organic enrichment on the recolonization of benthic macrofauna in a subtropical estuary. Mar. Pollut. Bull. 67, 107–120.
Gomes, T., Gonzalez-Rey, M., Rodríguez-Romero, A., Trombini, C., Riba, I., Blasco, J., Bebianno, M.J., 2013. Biomarkers in Nereis diversicolor

26
(Polychaeta: Nereididae) as management tools for environmental assessment on the southwest Iberian coast. Sci. Mar. 77, 69–78.
Gorbi, S., Baldini, C., Regoli, F., 2005. Seasonal variability of metallothioneins, cytochrome P450, bile metabolites and oxyradical metabolism in the European eel Anguilla anguilla L. (Anguillidae) and striped mullet Mugil cephalus L. (Mugilidae). Arch. Environ. Contam. Toxicol. 49, 62–70.
Gross, M.G., 1971. Procedures in Sedimentary Petrology From inside the book. Wiley Interscience, New York.
Islam, M.S., Tanaka, M., 2004. Impacts of pollution on coastal and marine ecosystems including coastal and marine fisheries and approach for management: A review and synthesis. Mar. Pollut. Bull. 48, 624–649.
Kolm, H.E., Schoenenberger, M.F., Da Rocha Piemonte, M., Souza, P.S.D. a, Schnell E Scühli, G., Mucciatto, M.B., Mazzuco, R., 2002. Spatial variation of bacteria in surface waters of Paranaguá and Antonina Bays, Paraná, Brazil. Brazilian Arch. Biol. Technol. 45, 27–34.
Lana, P.C., Marone, E., Lopes, R.M., Machado, E.C., 2001. Lana, P. C., Marone, E., Lopes, R.M., Machado, E.C. 2000. The subtropical estuarine complex of Paranaguá Bay, Brazil. In Ecological Studies, Coastal Marine Ecosystems of Latin America. Springe.pdf.
Lesser, M.P., 2006. Oxidative stress in marine environments: biochemistry and physiological ecology. Annu. Rev. Physiol. 68, 253–78.
Liu, X., Cheung, S.G., Shin, P.K.S., 2011. Response of meiofaunal and nematode communities to sewage pollution abatement: a field transplantation experiment. Chinese J. Oceanol. Limnol. 29, 1174–1185.
Livingstone, D., 2003. Oxidative stress in aquatic organisms in relation to pollution and aquaculture. Rev. Med. Vet. (Toulouse). 427–430.
López-López, E., Sedeño-Díaz, J.E., Perozzi, F., 2006. Lipid peroxidation and Acetylcholinesterase activity as biomarkers in the BlackSailfui Goodeid, Girardinichthys viviparous (Bustamante) exposed to water from Lake Xochimilco (Mexico). Aquat. Ecosyst. Heal. Manag. 9(3)379-385, 9(3), 1379–385.
Luk’yanova, O.N., 2006. Molecular biomarkers of energy metabolism in mussels under anthropogenic pollution of Peter the Great Bay, the Sea of Japan. Russ. J. Ecol. 37, 205–209.
Lushchak, V.I., 2011. Environmentally induced oxidative stress in aquatic animals. Aquat. Toxicol. 101, 13–30.
Machado, A.A. S., Wood, C.M., Bianchini, A., Gillis, P.L., 2014. Responses of biomarkers in wild freshwater mussels chronically exposed to complex contaminant mixtures. Ecotoxicology. 23(7):1345-1358.
Manduzio, H., Rocher, B., Durand, F., Galap, C., Leboulenger, F., 2005. The point about oxidative stress in molluscs. Invertebr. Surviv. J. 2, 91–104.
Maranho, DelValls, T. a., Martín-Díaz, M.L., 2015. Assessing potential risks of wastewater discharges to benthic biota: An integrated approach to biomarker responses in clams (Ruditapes philippinarum) exposed under
27
controlled conditions. Mar. Pollut. Bull. 92, 11–24.
Marone, E., Machado, E.C., Lopes, R.M., Teixeira, E., 2005. Land-ocean fluxes in the paranaguá bay estuarine system, southern brazil. BRAZILIAN J. Oceanogr. 53, 169–181.
Martin, J.P., Bastida, R., 2006. Population structure, growth and production of Laeonereis culveri (Nereididae: Polychaeta) in tidal flats of Río de la Plata estuary, Argentina. J Mar Biol Assoc UK. 86(02):235.
Martinez-Gomez, C., Vethaak, a D., Hylland, K., Burgeot, T., Kohler, a, Lyons, B.P., Thain, J., Gubbins, M.J., Davies, I.M., 2010. A guide to toxicity assessment and monitoring effects at lower levels of biological organization following marine oil spills in European waters. J Mar Sci. 67, 1105-1118.
Martins, C.C., Braun, J. a F., Seyffert, B.H., Machado, E.C., Fillmann, G., 2010. Anthropogenic organic matter inputs indicated by sedimentary fecal steroids in a large South American tropical estuary (Paranaguá estuarine system, Brazil). Mar. Pollut. Bull. 60, 2137–2143.
Martins, C.C., Cabral, A.C., Barbosa-Cintra, S.C.T., Dauner, A.L.L., Souza, F.M., 2014. An integrated evaluation of molecular marker indices and linear alkylbenzenes (LABs) to measure sewage input in a subtropical estuary (Babitonga Bay, Brazil). Environ. Pollut.
Martins, C.C., Ferreira, J.A., Taniguchi, S., Mahiques, M.M., Bícego, M.C., Montone, R.C., 2008. Spatial distribution of sedimentary linear alkylbenzenes and faecal steroids of Santos Bay and adjoining continental shelf , SW Atlantic , Brazil : Origin and fate of sewage contamination in the shallow coastal environment 56, 1359–1363.
Martins, C.C., Venkatesan, M.I., Montone, R.C., 2002. Sterols and linear alkylbenzenes in marine sediments from \nAdmiralty Bay, King George Island, South Shetland Islands. Antarct. Sci. 14, 244–252. doi:10.1017/S0954102002000093
Mizerkowski, B.D., Hesse, K.-J., Ladwig, N., da Costa Machado, E., Rosa, R., Araujo, T., Koch, D., 2012. Sources, loads and dispersion of dissolved inorganic nutrients in Paranaguá Bay. Ocean Dyn. 62, 1409–1424. doi:10.1007/s10236-012-0569-x
Monserrat, J.M., Martínez, P.E., Geracitano, L. a, Amado, L.L., Martins, C.M.G., Pinho, G.L.L., Chaves, I.S., Ferreira-Cravo, M., Ventura-Lima, J., Bianchini, A., 2007. Pollution biomarkers in estuarine animals: critical review and new perspectives. Comp. Biochem. Physiol. C. Toxicol. Pharmacol. 146, 221–34. doi:10.1016/j.cbpc.2006.08.012
Morales, M., 2015. Sciplot: scientic graphing functions for factorial designs. R package version 1.0-6.
Mudge, S.M., Duce, C.E., 2005. Identifying the source, transport path and sinks of sewage derived organic matter. Environ. Pollut. 136, 209–220.
Mudge, S.M., Lintern, D.G., 1999. Comparison of Sterol Biomarkers for Sewage with other Measures in Victoria Harbour, B.C., Canada. Estuar. Coast. Shelf Sci. 48, 27–38.

28
Neto, J.M., Teixeira, H., Patrício, J., Baeta, A., Veríssimo, H., Pinto, R., Marques, J.C., 2010. The Response of Estuarine Macrobenthic Communities to Natural- and Human-Induced Changes: Dynamics and Ecological Quality. Estuaries and Coasts 33, 1327–1339.
Oakes, K.D., Van Der Kraak, G.J., 2003. Utility of the TBARS assay in detecting oxidative stress in white sucker (Catostomus commersoni) populations exposed to pulp mill effluent. Aquat. Toxicol. 63, 447–463.
R Core Team, 2016. R: A Language and Environment for Statistical Computing. R Foundation for Statistical Comput- ing, Vienna, Austria.
Readman, J.W., Fillmann, G., Tolosa, I., Bartocci, J., Mee, L.D., 2005. The use of steroid markers to assess sewage contamination of the Black Sea. Mar. Pollut. Bull. 50, 310–8.
Regoli, F., Gorbi, S., Frenzilli, G., Nigro, M., Corsi, I., Focardi, S., Winston, G.W., 2002. Oxidative stress in ecotoxicology: From the analysis of individual antioxidants to a more integrated approach. Mar. Environ. Res. 54, 419–423.
Reid, D.J., MacFarlane, G.R., 2003. Potential biomarkers of crude oil exposure in the gastropod mollusc, Austrocochlea porcata: laboratory and manipulative field studies. Environ. Pollut. 126, 147–155.
Ribeiro, C.A.D.O., Katsumiti, A., França, P., Maschio, J., Zandoná, E., Cestari, M.M., Vicari, T., Roche, H., de Assis, H.C.S., Filipak Neto, F., 2013. Biomarkers responses in fish (Atherinella brasiliensis) of paranaguá bay, southern Brazil, for assessment of pollutant effects. Brazilian J. Oceanogr. 61, 1–11.
Rocchetta, I., Pasquevich, M.Y., Heras, H., Ríos de Molina, M. del C., Luquet, C.M., 2014. Effects of sewage discharges on lipid and fatty acid composition of the Patagonian bivalve Diplodon chilensis. Mar. Pollut. Bull. 79, 211–219.
Sandrini-Neto, L. & Camargo, M.G., 2014. GAD: an R package for ANOVA designs from general principles. Available on CRAN.
Soorya, S.R., C, A.D., R.N., B., B.V., A., Jayalekshmi, G., Sunny, F., 2013. Quantitative changes in antioxidant enzyme activities , glutathione content and malondialdehyde in a freshwater fish , Anabas testudineus ( bloch ), exposed to sewage. J. Aquat. Biol. Fish. 1(1 & 2), 68–76.
Souza, F.M., Brauko, K.M., Lana, P.C., Muniz, P., Camargo, M.G., 2013. The effect of urban sewage on benthic macrofauna: A multiple spatial scale approach. Mar Pollut Bull. 67(1-2):234-240.
Thain, J.E., Vethaak, A.D., Hylland, K., 2008. Contaminants in marine ecosystems: Developing an integrated indicator framework using biological-effect techniques. ICES J. Mar. Sci. 65, 1508–1514.
Underwood, A.J., 1997. Experiments in Ecology Their Logical Design and Interpretation Using Analysis of Variance. New York: Cambridge University Press.
Venkatesan, M.I., Mirsadeghi, F.H., 1992. Coprostanol as sewage tracer in

29
McMurdo Sound, Antarctica. Mar. Pollut. Bull. 25, 328–333.
Vlahogianni, T., Dassenakis, M., Scoullos, M.J., Valavanidis, A., 2007. Integrated use of biomarkers (superoxide dismutase, catalase and lipid peroxidation) in mussels Mytilus galloprovincialis for assessing heavy metals’ pollution in coastal areas from the Saronikos Gulf of Greece. Mar. Pollut. Bull. 54, 1361–1371.
30
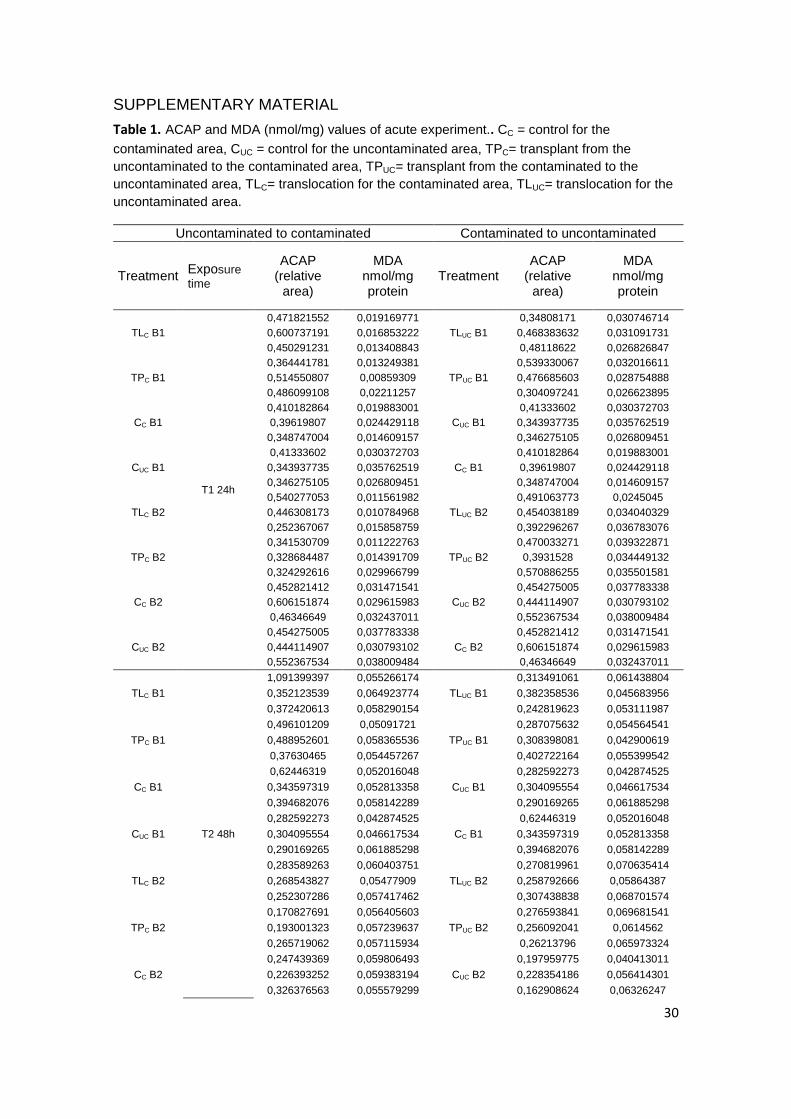
SUPPLEMENTARY MATERIAL
Table 1. ACAP and MDA (nmol/mg) values of acute experiment.. CC = control for the
contaminated area, CUC = control for the uncontaminated area, TPC= transplant from the
uncontaminated to the contaminated area, TPUC= transplant from the contaminated to the
uncontaminated area, TLC= translocation for the contaminated area, TLUC= translocation for the
uncontaminated area.
Uncontaminated to contaminated Contaminated to uncontaminated
Treatment Exposure
time
ACAP (relative
area)
MDA nmol/mg protein
Treatment ACAP
(relative area)
MDA nmol/mg protein
TLC B1
T1 24h
0,471821552 0,019169771
TLUC B1
0,34808171 0,030746714
0,600737191 0,016853222 0,468383632 0,031091731
0,450291231 0,013408843 0,48118622 0,026826847
TPC B1
0,364441781 0,013249381
TPUC B1
0,539330067 0,032016611
0,514550807 0,00859309 0,476685603 0,028754888
0,486099108 0,02211257 0,304097241 0,026623895
CC B1
0,410182864 0,019883001
CUC B1
0,41333602 0,030372703
0,39619807 0,024429118 0,343937735 0,035762519
0,348747004 0,014609157 0,346275105 0,026809451
CUC B1
0,41333602 0,030372703
CC B1
0,410182864 0,019883001
0,343937735 0,035762519 0,39619807 0,024429118
0,346275105 0,026809451 0,348747004 0,014609157
TLC B2
0,540277053 0,011561982
TLUC B2
0,491063773 0,0245045
0,446308173 0,010784968 0,454038189 0,034040329
0,252367067 0,015858759 0,392296267 0,036783076
TPC B2
0,341530709 0,011222763
TPUC B2
0,470033271 0,039322871
0,328684487 0,014391709 0,3931528 0,034449132
0,324292616 0,029966799 0,570886255 0,035501581
CC B2
0,452821412 0,031471541
CUC B2
0,454275005 0,037783338
0,606151874 0,029615983 0,444114907 0,030793102
0,46346649 0,032437011 0,552367534 0,038009484
CUC B2
0,454275005 0,037783338
CC B2
0,452821412 0,031471541
0,444114907 0,030793102 0,606151874 0,029615983
0,552367534 0,038009484 0,46346649 0,032437011
TLC B1
T2 48h
1,091399397 0,055266174
TLUC B1
0,313491061 0,061438804
0,352123539 0,064923774 0,382358536 0,045683956
0,372420613 0,058290154 0,242819623 0,053111987
TPC B1
0,496101209 0,05091721
TPUC B1
0,287075632 0,054564541
0,488952601 0,058365536 0,308398081 0,042900619
0,37630465 0,054457267 0,402722164 0,055399542
CC B1
0,62446319 0,052016048
CUC B1
0,282592273 0,042874525
0,343597319 0,052813358 0,304095554 0,046617534
0,394682076 0,058142289 0,290169265 0,061885298
CUC B1
0,282592273 0,042874525
CC B1
0,62446319 0,052016048
0,304095554 0,046617534 0,343597319 0,052813358
0,290169265 0,061885298 0,394682076 0,058142289
TLC B2
0,283589263 0,060403751
TLUC B2
0,270819961 0,070635414
0,268543827 0,05477909 0,258792666 0,05864387
0,252307286 0,057417462 0,307438838 0,068701574
TPC B2
0,170827691 0,056405603
TPUC B2
0,276593841 0,069681541
0,193001323 0,057239637 0,256092041 0,0614562
0,265719062 0,057115934 0,26213796 0,065973324
CC B2
0,247439369 0,059806493
CUC B2
0,197959775 0,040413011
0,226393252 0,059383194 0,228354186 0,056414301
0,326376563 0,055579299 0,162908624 0,06326247
31
CUC B2
0,197959775 0,040413011
CC B2
0,247439369 0,059806493
0,228354186 0,056414301 0,226393252 0,059383194
0,162908624 0,06326247 0,326376563 0,055579299
TLC B1
T3 96h
0,354250309 0,062157833
TLUC B1
0,3419795 0,064265631
0,41660613 0,050343147 0,373432969 0,058669963
0,461711679 0,070351281 0,275827833 0,027882196
TPC B1
0,206863167 0,064071377
TPUC B1
0,309943318 0,038737211
0,37717497 0,07220394 0,223048176 0,044683694
0,536300973 0,063827835 0,31054963 0,029555097
CC B1
1,156133173 0,067188135
CUC B1
0,241773633 0,04210041
0,629564038 0,072827292 0,398220728 0,052656796
0,714634223 0,08009876 0,250691747 0,03445493
CUC B1
0,241773633 0,04210041
CC B1
1,156133173 0,067188135
0,398220728 0,052656796 0,629564038 0,072827292
0,250691747 0,03445493 0,714634223 0,08009876
TLC B2
0,74206198 0,067191034
TLUC B2
0,243563881 0,039302576
0,370436007 0,064109068 0,189894157 0,026774659
0,310097924 0,051117262 0,300925971 0,031746975
TPC B2
0,456822134 0,072673628
TPUC B2
0,403275997 0,027809713
0,442244888 0,06510933 0,488361544 0,034727465
0,32338532 0,058814929 0,44374833 0,053633863
CC B2
0,433866504 0,06288266
CUC B2
0,373305934 0,056405603
0,303295227 0,063189987 0,345193503 0,041909055
0,330918095 0,037133892 0,732281973 0,043210845
CUC B2
0,373305934 0,056405603
CC B2
0,433866504 0,06288266
0,345193503 0,041909055 0,303295227 0,063189987
0,732281973 0,043210845 0,330918095 0,037133892
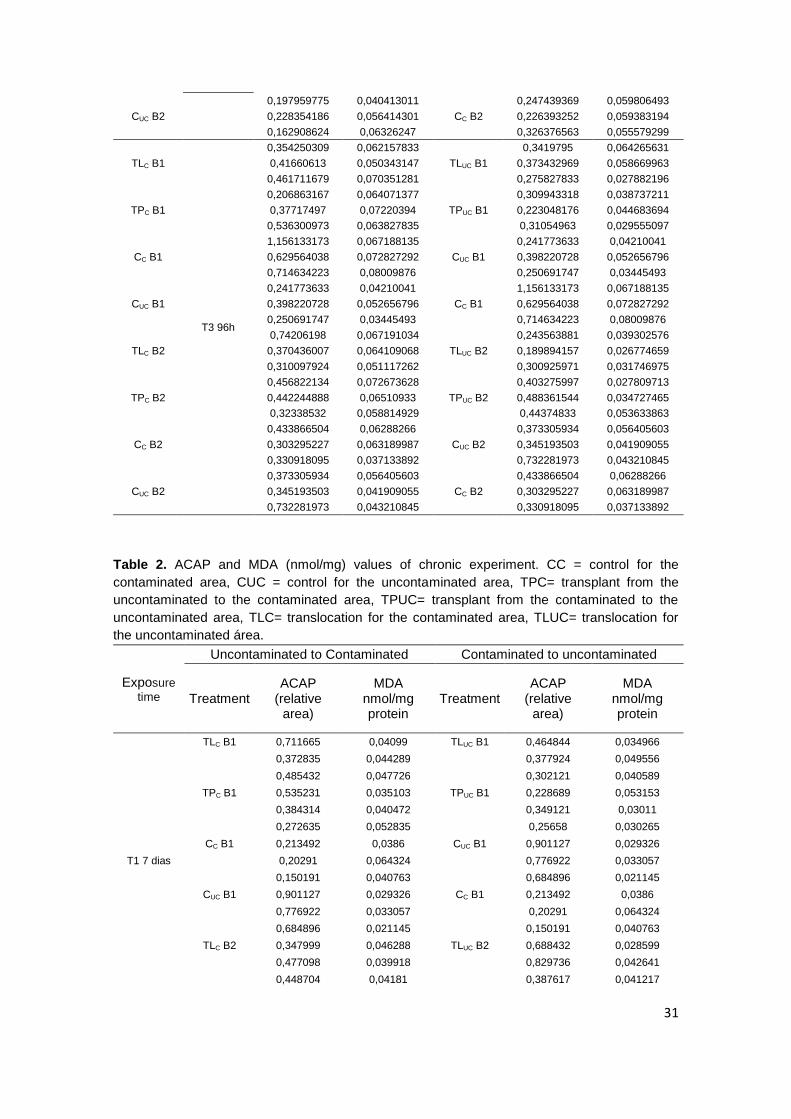
Table 2. ACAP and MDA (nmol/mg) values of chronic experiment. CC = control for the
contaminated area, CUC = control for the uncontaminated area, TPC= transplant from the
uncontaminated to the contaminated area, TPUC= transplant from the contaminated to the
uncontaminated area, TLC= translocation for the contaminated area, TLUC= translocation for
the uncontaminated área.
Exposure
time
Uncontaminated to Contaminated Contaminated to uncontaminated
Treatment ACAP
(relative area)
MDA nmol/mg protein
Treatment ACAP
(relative area)
MDA nmol/mg protein
T1 7 dias
TLC B1 0,711665 0,04099 TLUC B1 0,464844 0,034966
0,372835 0,044289
0,377924 0,049556
0,485432 0,047726
0,302121 0,040589
TPC B1 0,535231 0,035103 TPUC B1 0,228689 0,053153
0,384314 0,040472
0,349121 0,03011
0,272635 0,052835
0,25658 0,030265
CC B1 0,213492 0,0386 CUC B1 0,901127 0,029326
0,20291 0,064324
0,776922 0,033057
0,150191 0,040763
0,684896 0,021145
CUC B1 0,901127 0,029326 CC B1 0,213492 0,0386
0,776922 0,033057
0,20291 0,064324
0,684896 0,021145
0,150191 0,040763
TLC B2 0,347999 0,046288 TLUC B2 0,688432 0,028599
0,477098 0,039918
0,829736 0,042641
0,448704 0,04181
0,387617 0,041217

32
TPC B2 0,342197 0,03957 TPUC B2 0,556107 0,063517
0,253194 0,04344
0,627461 0,056781
0,639318 0,043504
1,065994 0,057768
CC B2 0,590208 0,062502 CUC B2 2,052966 0,057651
0,498469 0,051355
0,528317 0,079784
0,466547 0,03163
0,275713 0,07308
CUC B2 2,052966 0,057651 CC B2 0,590208 0,062502
0,528317 0,079784
0,498469 0,051355
0,275713 0,07308
0,466547 0,03163
T2 14 dias
TLC B1 0,61003 0,060879 TLUC B1 0,387909 0,09353
0,681789 0,063365
0,397642 0,083222
0,718408 0,064743
0,66573 0,097955
TPC B1 0,252265 0,092813 TPUC B1 0,491727 0,126597
0,25338 0,109595
0,616704 0,109574
0,342104 0,06323
0,445622 0,077278
CC B1 0,26748 0,091045 CUC B1 1,895408 0,061643
0,319505 0,066926
0,339472 0,080438
0,237035 0,050002
0,243595 0,0795
CUC B1 1,895408 0,061643 CC B1 0,26748 0,091045
0,339472 0,080438
0,319505 0,066926
0,243595 0,0795
0,237035 0,050002
TLC B2 0,466821 0,063173 TLUC B2 0,290841 0,071401
0,277348 0,062903
0,316921 0,077828
0,390607 0,047765
0,208146 0,146642
TPC B2 0,525852 0,090817 TPUC B2 0,280574 0,081983
0,59869 0,081201
0,206827 0,089191
0,369857 0,078815
0,307914 0,052144
CC B2 0,331891 0,057921 CUC B2 0,104591 0,102805
0,269849 0,058798
0,164734 0,071074
0,131747 0,081127
0,147973 0,11963
CUC B2 0,104591 0,102805 CC B2 0,331891 0,057921
0,164734 0,071074
0,269849 0,058798
0,147973 0,11963
0,131747 0,081127
Table 3. Total sterol concentrations (in µg.g-1) and sterol diagnostic indices in surface
sediments from experimental blocks. nd = not detected.
Contaminated
area Uncontaminated
area
B1 B2 B1 B2
Sterols
Coprostanol 0,44 0,09 0,03 0,01
Epicoprostanol 0,09 0,01 nd nd
Colesterol 2,55 0,64 2,43 0,72
Cholestanol 0,69 0,09 0,59 0,09
Campesterol 1,51 0,10 1,06 0,11
Stigmasterol 0,87 0,34 0,28 0,50
Sitosterol 2,65 0,26 0,81 0,27
Sitostanol 0,48 0,05 0,14 0,06
Dinosterol 0,38 0,05 0,08 0,04
Fecal sterol (cop+epic) 0,53 0,10 0,03 0,01
Total sterol 9,66 1,63 5,42 1,80
Sterol diagnostic indices I Threshold levels
coprostanol/(coprostanol + 0,39 0,50 0,05 0,10 <0.30: pristine

33
cholestanol) environments
coprostanol/(coprostanol + cholesterol)
0,15 0,12 0,01 0,01 >0.50: sewage contamination
coprostanol/(coprostanol + dinosterol)
0,54 0,64 0,27 0,20 >0.50: sewage contamination
% of faecal sterols/total sterols 5,49 6,13 0,55 0,56 >50%: high sewage contamination
epicoprostanol/coprostanol 0,20 0,11 nc nc <0.20: untreated sewage input
Table 4. Acute experiment. Analysis of variance of lipid peroxidation levels and antioxidant
capacity against peroxyl on transplantations to the contaminated (UC to C) and
uncontaminated areas (C to UC). Significant terms of interest (α = 0.05) used in a posteriori
comparisons are highlighted in bold. For Student–Newman–Keuls (SNK) tests the mean values
are listed in ascending order. ‘‘>’’ indicates p < 0.05 and ‘‘=’’ indicates p > 0.05. UC =
uncontaminated area, C= contaminated area, Cuc = control for the uncontaminated area, Cc =
control for the contaminated area, TLc = translocate in the contaminated area TPc = transplant
to the contaminated area, TLuc = translocate from the uncontaminated, TPuc = transplant to the
uncontaminated area.
UC to C C to UC
ACAP
Source of variation df MS F Pr(>F) MS F Pr(>F)
Treatment (Tr) 3 0.45475 35.333 0.16374
0.046893 1.8689 0.3101767
Time (T) 2 0.43329 0.5336 0.65208
0.122191 2.6329 0.2752616
Block (B) 1 131.365 24.6437 9.105e-06
0.012558 2.7228 0.1054568
Tr x T 6 0.12966 0.7703 0.62026
0.015662 0.6673 0.6821548
Tr x B 3 0.12870 2.4144 0.07803
0.025091 5.4402 0.0026576
T x B 2 0.81207 15.2342 7.535e-06
0.046409 10.0622 0.0002241
Tr x T x B 6 0.16832 3.1576 0.01084
0.023471 5.0888 0.0004114
Residuals 48 0.05331
0.004612 SNK test
T1.B1 Cuc=Cc=TPc=TLc
T1.B1 Cuc=Cc=TLuc=Tpuc
T1.B2 TPc=TLc=Cuc=Cc
T1.B2 TLuc=Tpuc=Cuc=Cc
T2.B1 Cuc=Cc=TPc<TLc
T2.B1 Cuc=TLuc=Tpuc<Cc
T2.B2 Cuc=TPc=Cc=TLc
T2.B2 Cuc=TPuc=Cc=TLuc
T3.B1 Cuc=TPc=TLc<Cc
T3.B1 TPuc=Cuc=TLuc<Cc
T3.B2 Cuc=Cc=TPc=TLc T3.B2 TLuc=Cuc=Cc=TPc
MDA
Source of variation df MS F Pr(>F) MS F Pr(>F)
Treatment (Tr) 3 0.0000866 2.7006 0.21810
0.01830 0.5989 0.658010
Time (T) 1 0.0097817 93.2917 0.01061
242.329 10.1085 0.090021
Block (B) 1 0.0000066 0.1330 0.71698
0.10057 2.6838 0.107914
Tr x T 3 0.0004713 4.8875 0.03737
0.22133 3.6592 0.069772
Tr x B 3 0.0000321 0.6480 0.58808
0.03056 0.8156 0.491611
T x B 1 0.0001049 2.1197 0.13117
0.23973 6.3974 0.003444
Tr x T x B 3 0.0000964 1.9495 0.09182
0.06049 1.6141 0.163751
Residuals 32 0.0000495 SNK test
T1 TLc=TPc=Cc=Cuc
B1 T1<T3=T2

34
T2 Cuc=TPc=Cc=TLc
B2 T1<T3<T2
T3 Cuc<TLc=Cc=TPc
Table 5. Chronic experiment. Analysis of variance of lipid peroxidation levels and antioxidant
capacity against peroxyl on transplant to the contaminated area (UC to C) and uncontaminated
area (C to UC). Significant terms of interest (α = 0.05) used in a posteriori comparisons are
highlighted in bold. For Student–Newman–Keuls (SNK) tests, the mean values are listed in
ascending order. ‘‘>’’ indicates p < 0.05 and ‘‘=’’ indicates p > 0.05. UC = uncontaminated area,
C= contaminated area, Cuc = control for the uncontaminated area, Cc = control for the
contaminated area, TLc = translocate in the contaminated area TPc = transplant to the
contaminated area, TLuc = translocate from the uncontaminated, TPuc = transplant to the
uncontaminated area.
UC to C C to UC
ACAP
Source df MS F Pr(>F) MS F Pr(>F)
Treatment (Tr) 3 0.084206 0.6903 0.6160
0.077663 0.5534 0.680454
Time (T) 1 0.036069 6.5565 0.2370
0.081397 0.9696 0.504911
Block (B) 1 0.020537 1.8884 0.1789
0.037703 2.3313 0.136617
Tr x T 3 0.025572 0.2162 0.8798
0.018755 0.1141 0.946125
Tr x B 3 0.121992 11.2177 3.446e-05
0.140327 8.6771 0.000234
T x B 1 0.005501 0.5059 0.4821
0.083948 5.1909 0.029523
Tr x T x B 3 0.118291 10.8774 4.399e-05
0.164431 10.1675 7.406e-05
Residuals 32 0.010875 SNK test
T1.B1 Cc<TPc=TLc<Cuc
T1.B1 Cc=TPuc=TLuc<Cuc
T1.B2 Cuc=TPc=TLc=Cc
T1.B2 Cuc<Cc=TLuc=Tpuc
T2.B1 Cc=TPc=Cuc<TLc
T2.B1 Cc=Cuc=TLuc=Tpuc
T2.B2 Cc=TLc=Cuc=TPc T2.B2 TLuc=Cc=Cuc=Tpuc
MDA
Source df MS F Pr(>F) MS F Pr(>F)
Treatment (Tr) 3 0.0005656 0.5917 0.661472
0.0350 0.1280 0.93737
Time (T) 1 0.0102389 60.6052 0.081330
46.164 12.6097 0.17475
Block (B) 1 0.0004925 2.9022 0.098154
0.2783 4.4392 0.04305
Tr x T 3 0.0005104 12.9730 0.031795
0.1320 0.7924 0.57356
Tr x B 3 0.0009559 5.6325 0.003236
0.2732 4.3593 0.01105
T x B 1 0.0001689 0.9955 0.325886
0.3661 5.8405 0.02154
Tr x T x B 3 0.0000393 0.2318 0.873536
0.1665 2.6570 0.06506
Residuals 32 0.0000552 SNK test
T1 TPc=TLc=Cc=Cuc
B1 Cuc=Cc=TPuc=Tluc
T2 TLc=Cc<Cuc=TPc
B2 Cc=TLuc=TPuc=Cuc
B1 Cuc=TLc=Cc=TPc
B1 T1<T2
B2 TLc=Cc=TPc<Cuc B2 T1<T2