University of São Paulo “Luiz de Queiroz” College of ... · University of São Paulo “Luiz...
91
University of São Paulo “Luiz de Queiroz” College of Agriculture Hydrological modeling of soil-water availability in the Caatinga biome Everton Alves Rodrigues Pinheiro Thesis presented to obtain the degree of Doctor of Science. Area: Agricultural Systems Engineering Piracicaba 2016
Transcript of University of São Paulo “Luiz de Queiroz” College of ... · University of São Paulo “Luiz...

University of São Paulo
“Luiz de Queiroz” College of Agriculture
Hydrological modeling of soil-water availability in the Caatinga biome
Everton Alves Rodrigues Pinheiro
Thesis presented to obtain the degree of Doctor of
Science. Area: Agricultural Systems Engineering
Piracicaba
2016
Everton Alves Rodrigues Pinheiro
Agronomist
Hydrological modeling of soil-water availability in the Caatinga biome
Advisor:
Prof. Dr. QUIRIJN DE JONG VAN LIER
Thesis presented to obtain the degree of Doctor of
Science. Area: Agricultural Systems Engineering
Piracicaba
2016

Dados Internacionais de Catalogação na Publicação
DIVISÃO DE BIBLIOTECA - DIBD/ESALQ/USP
Pinheiro, Everton Alves Rodrigues Hydrological modeling of soil-water availability in the Caatinga biome / Everton Alves
Rodrigues Pinheiro. - - Piracicaba, 2016. 90 p. : il.
Tese (Doutorado) - - Escola Superior de Agricultura “Luiz de Queiroz”.
1. Semiárido 2. Evapotranspiração 3. Mudanças climáticas 4. SWAP 5. Balanço hídrico I. Título
CDD 631.432 P654h
“Permitida a cópia total ou parcial deste documento, desde que citada a fonte – O autor”

3
To my beloved parents: Elisberto
and Maria, for all love and comprehension
devoted to me and for their kind
understanding towards my career
decisions.
To my sisters, Fabiana and Tatiane,
for the mutual love.
To Cleidiane, for making herself
always present into my life, for all
comprehension and patience.
DEDICATED TO THEM

4

5
ACKNOWLEDGMENTS
To God, Christ Jesus and Virgin Mary, for life, health and for the opportunity to
overcome the life challenges that strengthen my spiritual being, humane and professional.
To Professor Quirijn de Jong van Lier for all knowledge transmitted, patience,
openness and professionalism dedicated to this research.
To the “Luiz de Queiroz” College of Agriculture (ESALQ/USP), for providing the
necessary resources to finish this thesis.
To FAPESP (São Paulo Research Foundation) for funding this PhD thesis and for
providing national scholarship (grant # 2013/08967-8) and for sponsoring my research
internship abroad (grant # 2014/06084-4).
To the Department of Biosystems Engineering through its professors, in special,
Sergio Oliveira Moraes, Paulo Leonel Libardi, Fábio Ricardo Marin, Sérgio Nascimento
Duarte e Jarbas Honório de Miranda.
To the people of the Department of Biosystems Engineering, especially the
secretaries Angela Derigi Silva e Davilmar Aparecida Colevatti.
To the Center for Nuclear Energy in Agriculture, for the reception during the entire
period of my PhD.
To my Professors and supervisors during my undergraduate course and master course
from Federal University of Ceará, especially, Carlos Alexandre Gomes Costa, Cândida
Hermínia, Ervino Bleicher e José Carlos de Araújo.
To the group of measurement and modeling of hydrological and sedimentological
processes of the semiarid region of Brazil (HIDROSED) for making its dataset available to
my research.
To the technicians from FISOL/CENA lab: Robson Arthur e Eduardo Pillot.
To my friends from ESALQ and CENA for the unforgettable talks and scientific
discussions: Ali Mehmandoost, Ana Luiza, Ana Paula, André Herman, Angelica Durigon,
Ismael Meurer, Leonardo, Lívia Previatello, Marcos Santos, Osvaldo Nogueira, Thaís
Rodrigues, Thalita Campos, Verena Benício, Victor Merigueti e Yeleine Almoza.
To my housemates: Alan Bernard, Bruno Lena, Luciano Silveira, Luiz Sobenko,
Otávio Neto, Thiago Wendling e Fabrício.

6
From The Netherlands I would like to thank:
To Professor Klaas Metselaar for his kindness and remarkable scientific
contributions devoted to my PhD thesis.
To the Wageningen University, especially SLM group, for accepting me as a guest
researcher and as part of their scientific team.
To my friends over there who taught me how to cope with a very international group,
providing me confidence to share my thoughts and experiences: Ammar Adham, Bélyse
Mupfasoni, Berhane Grum, Célia Bento, Demie Moore, Fan Liangxin, Irene Koko, Isaurinda
Baptista, Karrar Al-Timiny, Kaveh Hosseini, Lingtong Gai, Mahrooz, Marcien Ndagijimana,
Marina Kim, Nadia Jones, Peter Voortman, Raoul Kpegli, Ricardo Silva, Ruben van der
Meulen, Saeede Nazari, Sija Stofberg, Vera Silva and Xiaomei Yang.

7
CONTENTS
RESUMO ................................................................................................................................... 9
ABSTRACT ............................................................................................................................. 11
1 INTRODUCTION ................................................................................................................. 13
2 IMPORTANCE OF SOIL-WATER TO THE CAATINGA BIOME, BRAZIL .................. 15
Abstract ..................................................................................................................................... 15
2.1 Introduction ........................................................................................................................ 15
2.2 Material and Methods ......................................................................................................... 17
2.2.1 Study area ........................................................................................................................ 17
2.2.2 Modeling .......................................................................................................................... 18
2.2.2.1 Soil hydraulic parameterization .................................................................................... 19
2.2.2.2 Vegetation Parameterization......................................................................................... 20
2.2.3 Evapotranspiration parameterization ............................................................................... 22
2.2.4 Simulation, validation and statistical procedures ............................................................ 22
2.3. Results and Discussion ...................................................................................................... 23
2.3.1 Spatial and temporal rainfall distribution ........................................................................ 23
2.3.2 Spatial and temporal dynamics of the leaf area index ..................................................... 24
2.3.3 Simulations and validation results ................................................................................... 25
2.3.4 Climate change ................................................................................................................ 33
2.4 Conclusions ........................................................................................................................ 36
References ................................................................................................................................ 37
3 CAATINGA HYDROLOGY UNDER A CLIMATE CHANGE SCENARIO .................... 43
Abstract ..................................................................................................................................... 43
3.1 Introduction ........................................................................................................................ 43
3.2 Material and Methods ......................................................................................................... 45
3.2.1 Study area ........................................................................................................................ 45
3.2.2 Climatic data generator – ClimGen ................................................................................. 46
3.2.3 Climate change scenario .................................................................................................. 47
3.2.4 Modeling .......................................................................................................................... 48
3.3 Results and Discussion ....................................................................................................... 49
3.3.1 ClimGen outputs .............................................................................................................. 49
3.3.2 SWAP simulations ........................................................................................................... 50
3.4 Conclusions ........................................................................................................................ 59

8
References ................................................................................................................................ 59
4 A MATRIC FLUX POTENTIAL APPROACH TO ASSESS WATER AVAILABILITY
APPLIED TO SOME BRAZILIAN SOILS ........................................................................ 65
Abstract .................................................................................................................................... 65
4.1 Introduction ........................................................................................................................ 65
4.2 Material and Methods ........................................................................................................ 66
4.2.1 Development of an expression to calculate limiting hydraulic conditions ..................... 66
4.2.2 Evaluation of water availability in some Brazilian soils................................................. 69
4.2.3 Evaporation experiments................................................................................................. 71
4.2.4 Inverse solution ............................................................................................................... 72
4.2.5 Simulation scenarios to estimate Mlim ............................................................................. 73
4.3 Results and Discussion....................................................................................................... 74
4.3.1 Soil hydraulic parameter estimation ............................................................................... 74
4.3.2 Limiting pressure head .................................................................................................... 76
4.3.3 Limiting soil pressure head for semiarid zone soils based on in situ measurements of
root length density ........................................................................................................... 78
4.4 Conclusions ........................................................................................................................ 80
References ................................................................................................................................ 81
APPENDIX .............................................................................................................................. 87

9
RESUMO
Modelagem hidrológica da disponibilidade da água do solo no bioma Caatinga
O Nordeste do Brasil é hidrologicamente caracterizado por secas recorrentes, tornando
os recursos hídricos naturais altamente vulneráveis. Nesta região está o bioma Caatinga,
ocupando uma área de aproximadamente 800.000 km2. Cenários de déficit hídrico são
projetados para grandes regiões do globo, incluindo o Nordeste brasileiro. Devido às
interações entre clima e vegetação, várias pesquisas têm abordado os efeitos das mudanças
climáticas sobre os ecossistemas naturais e agrícolas. Neste contexto, as propriedades
hidráulicas do solo são essenciais para avaliar o movimento de água, e assim a capacidade de
fornecimento de água às plantas. Com base nesta contextualização, os objetivos desta tese
são: simular os componentes do balanço hídrico do bioma Caatinga para cenários climáticos
atuais e futuros; e avaliar a capacidade de alguns solos em fornecer água às plantas a partir de
uma abordagem de potencial de fluxo matricial. Para os cenários climáticos atuais e futuros,
simulações hidrológicas foram realizadas com o modelo SWAP, parametrizado para uma
microbacia de 12 km², inserida em área de Caatinga preservada. A validação das simulações
foi processada a partir de medidas diárias do conteúdo de água do solo na profundidade de
0,2 m no período de 2004 a 2012. A capacidade do solo em fornecer água às plantas foi
avaliada através da atualização de uma função de potencial de fluxo matricial, que acopla as
propriedades hidráulicas do solo, densidade de comprimento radicular e transpiração das
plantas, aplicada a um grupo de solos da zona climática semiárida e sub-úmida. Como
resultados principais destacam-se: nas condições climáticas atuais, o bioma Caatinga retorna
75% da precipitação anual para a atmosfera como evapotranspiração, particionada entre seus
componentes (transpiração, evaporação e intercepção) em 41%, 40% e 19%, respectivamente.
Evapotranspiração e temperatura do ar foram sensíveis à umidade do solo durante os períodos
de junho-setembro e dezembro-janeiro. Em relação ao cenário climático futuro, a taxa de
transpiração foi acrescida em 36%. A evaporação do solo e a interceptação foram reduzidas
em 16% e 34%, respectivamente. A quantidade de precipitação devolvida para a atmosfera foi
em média 98%. Para ambos os cenários climáticos, é sugerido que os fluxos de água no
sistema solo-planta-atmosfera são controlados pela camada superior do solo (0-0,2 m),
fornecendo, em média, 80% do total transpirado, indicando que, caso os cenários de
disponibilidade hídrica reduzida se confirmem, o bioma Caatinga pode se tornar
completamente dependente dos pulsos de água no solo. A partir do potencial de fluxo
matricial limitante revelou-se que os solos da região semiárida são capazes de manter o fluxo
de água às plantas em taxas potenciais em condições de solo seco (potencial matricial
limitante variando de -36 a -148 m), enquanto que, os solos da região mais úmida indicaram
severa restrição hidráulica, com potencial matricial limitante maior do que -1,5 m. Ainda para
os solos analisados, a atribuição de potencial na superfície da raiz inferior a -150 m não
ocasionou aumento de disponibilidade hídrica, indicando que valores menores que -150 m não
implicam em uma estratégia viável para suportar baixa disponibilidade hídrica.
Palavras-chave: Semiárido; Evapotranspiração; Mudanças climáticas; SWAP; Balanço hídrico

10
11
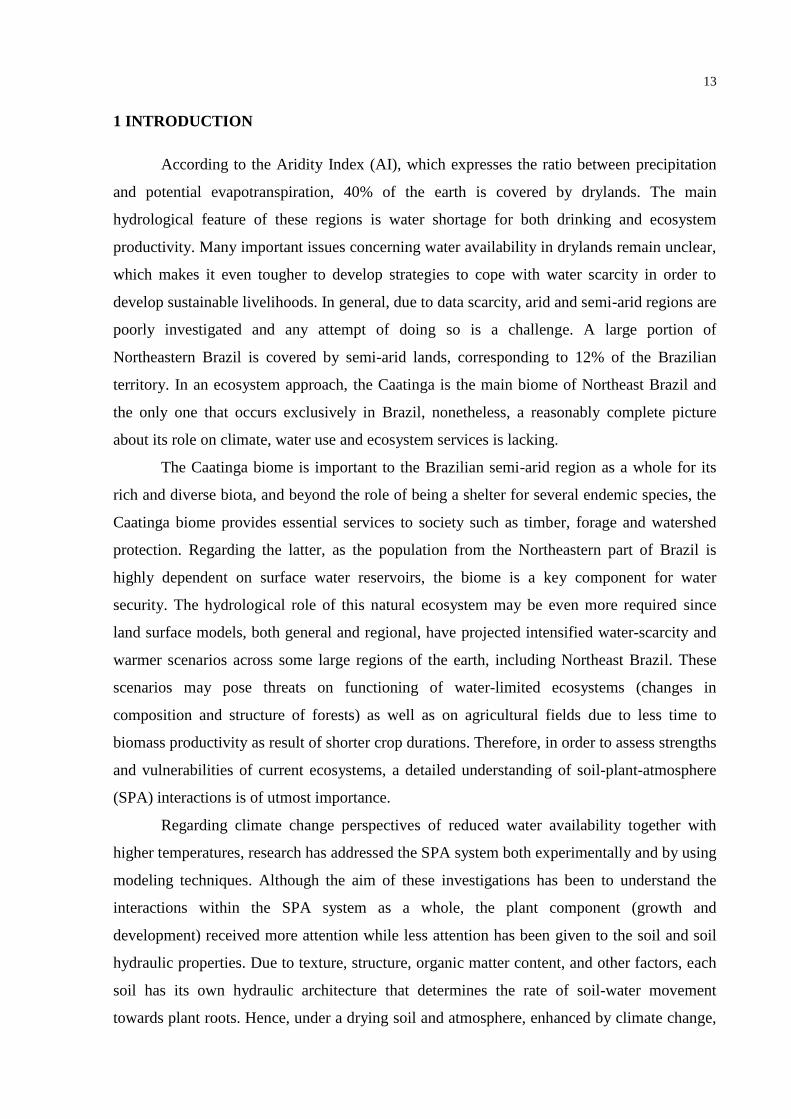
ABSTRACT
Hydrological modeling of soil-water availability in the Caatinga biome
Northeastern Brazil is hydrologically characterized by recurrent droughts leading to a
highly vulnerable natural water resource system. The region contains the Caatinga biome, a
sparsely studied ecosystem, covering an area of approximately 800,000 km2. Reduced water-
availability is projected to take place in large regions of the globe, including Northeastern
Brazil. Given the strong interactions between climate and vegetation, research has addressed
climate change effects on natural and agricultural ecosystems. In this context, soil hydraulic
properties are essential to assess soil water flow, and thus the ability of soil to supply water to
plants at potential rates under different ranges of pressure head. Based on that, the aims of this
thesis are: to increase insight in water balance components for the Caatinga biome, under
current and future climate scenarios; and to assess the ability of soils in supplying water to
plants by the further development of an existing matric flux potential approach, followed by
its application to a group of soils from two Brazilian climatic zones (semi-arid and sub-
humid). Both for current and future climate scenarios, hydrological simulations were
performed with SWAP model parameterized for a preserved Caatinga basin of 12 km². The
validation of the simulations was performed using a dataset of daily soil-water content
measurements taken at 0.2 m depth in the period from 2004 to 2012. The soil water supplying
capacity was evaluated through a multilayer matric flux potential approach, coupling the soil
hydraulic properties, root length density and plant transpiration. Regarding the current climate
conditions, the Caatinga biome returns 75% of the annual precipitation to the atmosphere,
whereas the partitioning of total evapotranspiration into its components (transpiration,
evaporation and interception) on annual basis accounts for 41%, 40% and 19%, respectively.
Evapotranspiration and air temperature are most sensitive to soil moisture during the periods
June-September and December-January. Concerning the future climate, transpiration was
enhanced by 36%, soil evaporation and interception losses reduced by 16% and 34%,
respectively. The amount of precipitation returned to the atmosphere was on average 98%.
For both climate scenarios, the soil-plant-atmosphere fluxes seem to be controlled by the
surface soil layer (0-0.2 m) which provides, on average, 80% of the total transpiration,
suggesting that the Caatinga biome may become completely soil-water pulse dominated under
scenarios of reduced water availability. The matric flux potential analysis revealed that soils
from the semiarid zone were able to deliver water to plants at potential rates under a wider
range of bulk soil pressure head (-36 to -148 m), whereas the soils from the wetter zone
showed more hydraulic restriction with limiting soil water potential above -1.5 m. For the
analyzed soils, only a negligible increase in available water results from decreasing the root
water potential below -150 m, therefore, in order to adapt to water-limited conditions, plant
species may invest in other adaptive strategies, rather than spending energy in structures that
allow a reduction of the lower suction limit in their tissues.
Keywords: Semi-arid; Evapotranspiration; Climate change; SWAP; Water balance

12
13
1 INTRODUCTION
According to the Aridity Index (AI), which expresses the ratio between precipitation
and potential evapotranspiration, 40% of the earth is covered by drylands. The main
hydrological feature of these regions is water shortage for both drinking and ecosystem
productivity. Many important issues concerning water availability in drylands remain unclear,
which makes it even tougher to develop strategies to cope with water scarcity in order to
develop sustainable livelihoods. In general, due to data scarcity, arid and semi-arid regions are
poorly investigated and any attempt of doing so is a challenge. A large portion of
Northeastern Brazil is covered by semi-arid lands, corresponding to 12% of the Brazilian
territory. In an ecosystem approach, the Caatinga is the main biome of Northeast Brazil and
the only one that occurs exclusively in Brazil, nonetheless, a reasonably complete picture
about its role on climate, water use and ecosystem services is lacking.
The Caatinga biome is important to the Brazilian semi-arid region as a whole for its
rich and diverse biota, and beyond the role of being a shelter for several endemic species, the
Caatinga biome provides essential services to society such as timber, forage and watershed
protection. Regarding the latter, as the population from the Northeastern part of Brazil is
highly dependent on surface water reservoirs, the biome is a key component for water
security. The hydrological role of this natural ecosystem may be even more required since
land surface models, both general and regional, have projected intensified water-scarcity and
warmer scenarios across some large regions of the earth, including Northeast Brazil. These
scenarios may pose threats on functioning of water-limited ecosystems (changes in
composition and structure of forests) as well as on agricultural fields due to less time to
biomass productivity as result of shorter crop durations. Therefore, in order to assess strengths
and vulnerabilities of current ecosystems, a detailed understanding of soil-plant-atmosphere
(SPA) interactions is of utmost importance.
Regarding climate change perspectives of reduced water availability together with
higher temperatures, research has addressed the SPA system both experimentally and by using
modeling techniques. Although the aim of these investigations has been to understand the
interactions within the SPA system as a whole, the plant component (growth and
development) received more attention while less attention has been given to the soil and soil
hydraulic properties. Due to texture, structure, organic matter content, and other factors, each
soil has its own hydraulic architecture that determines the rate of soil-water movement
towards plant roots. Hence, under a drying soil and atmosphere, enhanced by climate change,

14
the different soil abilities of supplying water to plants will play a very important part in the
establishment and development of ecosystems and in the regional pattern of hydrological
connectivity of land and atmosphere.
In order to acquire more insights in aspects that determine water availability in a
water-limited ecosystem, this thesis reports on the hydrological modeling of the spatial and
temporal partitioning of the water balance components for a small preserved Caatinga Basin
under current and future climate conditions (chapter 2 e 3); and aiming to evaluate the soil
ability of supplying water to plants, it also presents the further development of a matric flux
potential approach and its application to a group of soils from two Brazilian climatic zones
(semi-arid and sub-humid), hydraulically parameterized for the dry range (chapter 4).
15
2 IMPORTANCE OF SOIL-WATER TO THE CAATINGA BIOME, BRAZIL1
Abstract
Northeastern Brazil is hydrologically characterized by recurrent droughts leading to a
highly vulnerable natural water resource system. The region contains the Caatinga biome,
covering an area of approximately 800,000 km2. To increase insight in water balance
components for this sparsely studied ecosystem, hydrology simulations were performed with
the SWAP (Soil Water Atmosphere Plant) model for a Caatinga basin of 12 km². SWAP was
developed to simulate hydrology under short cycle crops and its parameterization and
validation to a diverse ecosystem is a novelty. The validation of the simulations was
performed using a dataset of daily soil water content measurements taken at 0.2 m depth in
three sites in the basin in the period from 2004 to 2012. Average Nash-Sutcliffe efficiency
coefficient for these simulations was 0.57 and Root Mean Square Error of Prediction was
4.3%. The results of the simulations suggest that water components do not diverge
statistically among different sites of the biome. The Caatinga biome returns 75% (±17%) of
the annual precipitation to the atmosphere, whereas the partitioning of total evapotranspiration
into its components (transpiration, evaporation and interception) on annual basis accounts for
41% (±7%), 40% (±6%) and 19% (±3%), respectively. Regarding water availability, the
surface soil layer (0.0-0.2 m) is the most important layer in the rooted profile, supplying up to
90% of atmospheric water demand. According to our analysis performed on daily basis,
evapotranspiration and air temperature are most sensitive to soil moisture during the periods
June-September and December-January.
Keywords: Semi-arid; Evaporation; Evapotranspiration; Hot spots; Hydrology; SWAP; Water
balance
2.1 Introduction
A significant part (12%) of the Brazilian territory consists of a semi-arid region, in
which the Caatinga biome is dominant. The Caatinga, a complex tropical ecosystem
characterized by a wide variety of both herbaceous and arborescent vegetation (PINHEIRO;
COSTA; DE ARAÚJO, 2013) is entirely located within Northeastern Brazil, covering an area
of approximately 800,000 km2. Despite its status of Global Wilderness (MITTERMEIER et
al., 2002), the amount of scientific research it has attracted is limited (SANTOS, 2011). The
seeking for a better hydrological understanding for such an important ecosystem where
significant rainfall reduction and increase in air temperature are predicted to take place in the
coming years as results of climate change is a need and a challenge.
On a global scale, the tropics are the main source of atmosphere sensible and latent
heat (WANG, 2004). Latent heat flux is the most important component of the continental
water cycle, capable of returning as much as 60% of all precipitation back to the atmosphere
1 Chapter published in Ecohydrology (2016). DOI: 10.1002/eco.1728

16
(SCHLESINGER; JASECHKO, 2014), more than half of the solar energy absorbed by land
surfaces (TRENBERTH; FASULLO; KIEHL, 2009). However, specific semi-arid regions
characterized by a strongly negative atmospheric water balance, like the Caatinga (average
precipitation below 900 mm y-1 and potential evapotranspiration above 2200 mm y-1), might
indicate a hot spot, a location at which soil water content has a substantial impact on
precipitation and air temperature (KOSTER et al., 2004, 2006; SENEVIRATNE et al., 2006).
Beyond this, the Caatinga biome has been projected by global and regional climate models to
face large rainfall reductions and air temperature increase (MARENGO et al., 2012;
PESQUERO et al., 2010; SENEVIRATNE et al., 2012).
Modeling results using data from the GLACE, the Global Land-Atmosphere Coupling
Experiment (KOSTER et al., 2006) and from IPCC AR4 simulations (SENEVIRATNE et al.,
2006) show the Caatinga region in Northeastern Brazil to be such a hot spot for coupling
between soil water content and air temperature. These hot spots can significantly impact the
near-surface climate, causing very high temperatures and heat waves (FISCHE et al., 2007)
because more energy is available for sensible heating when soil water content restricts the
total energy converted in latent heat.
Despite the weak support for coupling between soil water content and precipitation
based on the GLACE modeling dataset for Northeastern Brazil, this does not rule out the
presence of coupling at local scales. The GLACE simulations (KOSTER et al., 2006) focused
on the impact of soil water content on subseasonal climate variability for a single year. As
highlighted by Seneviratne et al. (2010), climate models contain a high level of uncertainty.
To obtain a more complete picture, more investigations using other modeling tools and
observational data are needed. A more comprehensive dataset is required to investigate the
impact of soil water content on evapotranspiration and indirectly on precipitation. A finer-
scale spatial and temporal analysis of the soil water content and meteorological components
would allow investigations of the necessary details and also provide a better performance of
simulations in current climate models and as well as land-atmosphere interactions. Such an
analysis is of utmost importance for semi-arid regions in general, given the scarcity of
hydrological data characterized by high spatial variability (COSTA et al., 2012, 2013).
Northeastern Brazil faces recurrent drought episodes which lead to highly vulnerable
natural water resource systems and environmental degradation (BARBOSA et al., 2006; DE
ARAÚJO; GÜNTNER; BRONSTERT, 2006). Identification of specific soil water content-
climate interactions could bring significant improvements in seasonal forecasting and drought
monitoring. To address some of the current scientific demands in the field of soil water

17
content-climate interactions, Seneviratne et al. (2010) performed a broad review and
identified a necessity to improve understanding of the main components driven by climate
conditions such as soil water, transpiration and evaporation for heterogeneous terrain and
regions, including South America. In line with their recommendation and to acquire more
insights on water availability upon water-limited ecosystem, the research reports here the
spatial and temporal partitioning of the hydrological balance components for a small
preserved Caatinga Basin through a hydrological modeling approach using soil physical
properties, morphological characteristics of the vegetation and meteorological data.
2.2 Material and Methods
2.2.1 Study area
The study was conducted in the Aiuaba Experimental Basin (AEB), a 12 km2
integrally-preserved Caatinga watershed (6º42’S; 40º17’W). The AEB is completely located
inside the ecological station of Aiuaba, state of Ceará, Brazil, ruled by the Brazilian Federal
Environmental Institute. The climate is BSh (semi-arid with low latitude and altitude)
according to the Köppen classification, with an average annual class-A pan evaporation of
2500 mm. Average annual rainfall is 549 mm, concentrated between January and May (rainy
season). The monthly average temperatures range from 24ºC to 28ºC. The watershed is
covered by a dense native vegetation characterized by tree heights typically ranging from 5 to
12 m. The basin has an average slope of 19% and its geology is characterized by the transition
from a crystalline complex to a sedimentary formation. The hydrological variables, such as
soil water content, rainfall, class A Pan evaporation and brook discharges have been
monitored since 2003 by the HIDROSED group (www.hidrosed.ufc.br) with the purpose of
studying hydrological and sedimentological processes. More detailed information can be
found in de Araújo and Piedra (2009), Medeiros et al. (2009), Medeiros and de Araújo (2014)
and Pinheiro et al. (2013).
Based on previous studies (COSTA et al., 2013; GÜNTNER; BRONSTERT, 2004;
PINHEIRO et al., 2013), the Aiuaba Experimental Basin (AEB) was subdivided into three
systems, denominated soil and vegetation associations or SVA (Figure 2.1). The first
association (SVA1), covered with an Acrisol, occupies 20% of the AEB area, and the average
rooting depth of the vegetation is 0.8 m. In the second system (SVA2, 34% of the
experimental area) the soils are classified as Luvisols and the average rooting depth is 0.6 m.
SVA3 has a shallow soil (Regosol) with average rooting depth of 0.4 m, occupying 46% of the
18
AEB. In each SVA, a location is equipped with a Time Domain Reflectometry sensor (TDR,
model CS616), installed at the depth of 0.2 m, together with an automatic rainfall gauge.
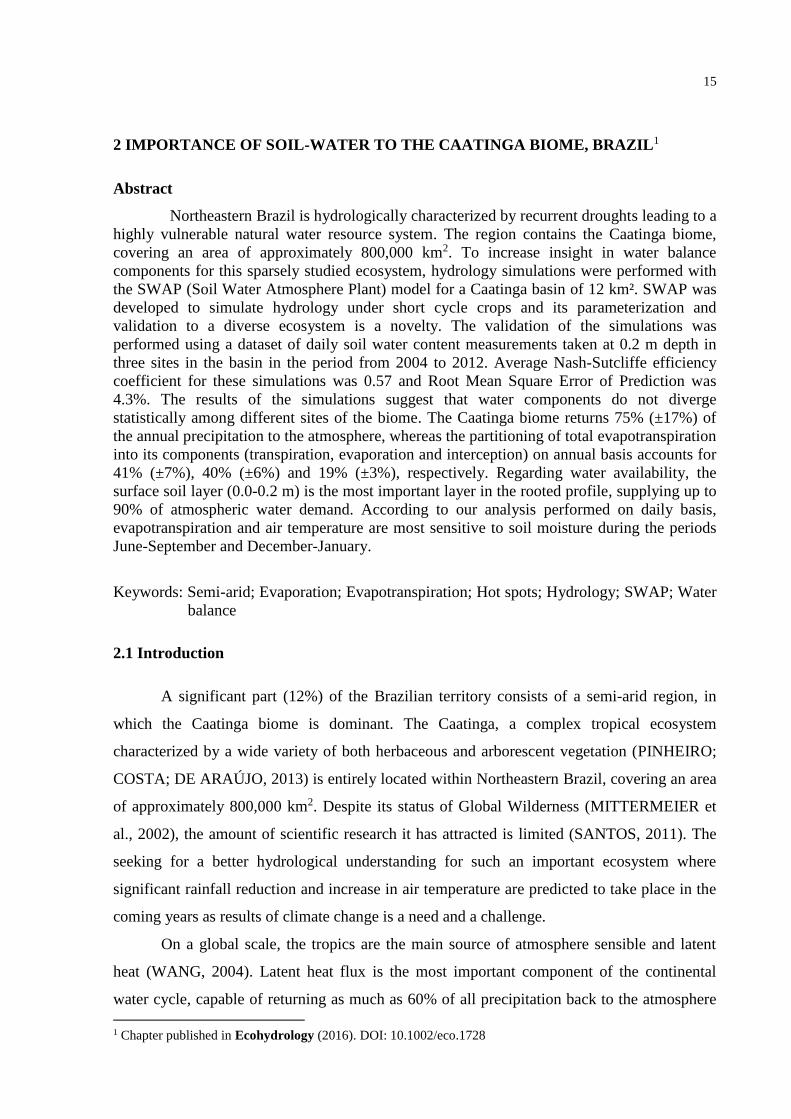
Figure 2.1 – Geographical location of the Aiuaba Experimental Basin (AEB) and its subdivision into three Soil
and Vegetation Association (SVA1, SVA2 and SVA3). Dots indicate the location of TDR
measurements
2.2.2 Modeling
Hydrological modeling was performed with the SWAP model (KROES et al., 2008), a
one-dimensional agro-hydrological model. The model simulates water flow, solute transport
and plant growth in a soil–water–atmosphere–plant environment. To calculate the water
balance terms, the model employs the Richards equation with a root water extraction sink
term:
hSz
hhK
zt
1
(2.1)
in this equation, t denotes time (d), z is the vertical coordinate taken as positive upwards (cm),
K(h) is the hydraulic conductivity (cm d-1) and S(h) represents the water uptake by plant roots
(d-1). Eq. (2.1) is solved numerically describing the θ-h-K relation by the Mualem–van
Genuchten equations (MUALEM, 1976; VAN GENUCHTEN, 1980). To estimate the sink
term S(h), the reduction function proposed by de Jong van Lier et al. (2008; 2013) was used
19
to simulate root water uptake distribution over depth. This reduction function includes a
compensation mechanism such that uptake restrictions in drier layers may be offset by
increased uptake from a wetter layer.
The SWAP model was parameterized for the three SVAs with soil hydraulic
properties and vegetation parameters. Rainfall was monitored in each SVA, whereas for other
meteorological data the regional average was used.
2.2.2.1 Soil hydraulic parameterization
Soil samples were collected in each SVA. A soil profile from each SVA was sampled
per 0.2 m thick layer. Following the description of root depth (PINHEIRO; COSTA; de
ARAÚJO, 2013), four layers were sampled in SVA1 and two layers in SVA2 and SVA3.
Although a third layer should have been sampled in SVA2, the presence of a very stony layer
at the sample spot from about 0.4 m downwards made undisturbed sampling not possible.
However, earlier studies (COSTA et al., 2013; PINHEIRO; COSTA; de ARAÚJO, 2013)
testify the presence of a third rooted layer (0.4-0.6 m) in other spots of the SVA2. Therefore,
we considered the third layer in our simulations using the hydraulic properties of the second
layer. The saturated hydraulic conductivity was measured in seven samples for each layer and
water retention was measured for nine different tensions (0.1, 0.2, 0.4, 0.6, 1.0, 3.3, 10, 30
and 150 m) with five replicates per tension for each layer (Table 2.1).

20
Table 2.1 - Soil physical parameters for the Soil Vegetation Associations: θr, θs, α, n and Ks according to the van
Genuchten equation system. (95% confidence levels between brackets).
Depth θr θs α n Ks
m --------m3 m-3--------- cm-1 - m d-1
SVA1
0.0-0.2 0.000 0.418 (0.401-0.435)
0.068 (0.039-0.0980)
1.210 (1.18-1.23)
2.22 (0.65-3.62)
0.2-0.4 0.000 0.440 (0.430-0.450)
0.225 (0.169-0.280)
1.186 (1.17-1.20)
2.50 (0.50-4.10)
0.4-0.6 0.000 0.433 (0.415-0.450)
0.249 (0.130-0.369)
1.162 (1.15-1.18)
0.36 (0.01-0.68)
0.6-0.8 0.000 0.415 (0.403-0.426)
0.139 (0.094-0.186)
1.170 (1.16-1.18)
0.16 (0.06-0.26)
SVA2
0.0-0.2 0.000 0.456 (0.434-0.477)
0.246 (0.107-0.385)
1.159 (1.14-1.18)
3.59 (0.96-6.01)
0.2-0.4 0.000 0.413 (0.387-0.439)
0.128 (0.024-0.233)
1.155 (1.13-1.18)
5.81 (1.57-9.60)
SVA3
0.0-0.2 0.000 0.434 (0.420-0.447)
0.219 (0.165-0.273)
1.299 (1.28-1.32)
3.89 (2.42-5.47)
0.2-0.4 0.000 0.3933 (0.381-0.406)
0.294 (0.205-0.384)
1.228 (1.21-1.25)
7.62 (1.70-13.68)
2.2.2.2 Vegetation Parameterization
The Caatinga biome is a complex multispecies system with more than 900 known
vascular plant species. However, only 60% of the biome area has been surveyed, 20%
intensively, making the number of species potentially larger (LEAL et al., 2005). For the
AEB, cataloguing only plants with a stem diameter at soil surface level greater than 3 cm
resulted in a density of 7700 units/ha (MEDEIROS; DE ARAÚJO; BRONSTERT, 2009). As
very few botanical descriptions of the Caatinga biome are available, it does not seem
reasonable to consider all species individually for hydrological simulation, and an alternative
method was employed to analyze the hydrological processes in the vadose zone. We used a
lumped leaf area index approach, i.e. the total leaf area of all species over a unit soil area is
assumed to represent the vegetation in terms of interaction with the atmosphere. An
exponential extinction coefficient for the aggregated canopy was assumed. This simplification
allowed investigation of the soil water balance for the Caatinga biome at soil profile scale.
Temporal and spatial dynamics of the Leaf Area Index
To estimate the temporal and spatial dynamics of the leaf area index, the SEBAL
(Surface energy balance algorithm for land) was used (ALLEN; TREZZA; TASUMI, 2002).
SEBAL consists of an algorithm validated for different ecosystems around the world. For our
purpose, leaf area index (LAI) and albedo were estimated from Landsat 5 satellite images

21
(eleven in total) downloaded from the website of the Brazilian National Space Research
Institute (INPE) (www.inpe.br), covering different periods over time between 2004 and 2012.
The period was chosen to match the availability of the dataset of the Aiuaba Experimental
Basin (AEB).
Leaf area index estimated by the SEBAL algorithm from eight images was correlated
to the mean soil water pressure head at the depth of 0.2 m in the 15-day period before the
satellite image for each SVA. Three other images were used to validate the regression models
using the Nash-Sutcliffe efficiency index. The soil water content database of the AEB
together with soil hydraulic properties allowed us to obtain temporal and spatial dynamics of
LAI from 2004 to 2012 for SVA1 and SVA2 and from 2004 to 2010 for SVA3 (PINHEIRO;
DE JONG VAN LIER; METSELAAR, 2015).
Root Length Density (RLD)
Soil samples were collected for each SVA, three replicates per layer following the
same protocol described for the undisturbed soil samples, using a sample ring with a diameter
of 0.1 m (volume 9.43∙10-4 m3). The roots collected in the soil samples were separated from
the soil material, digitally scanned and subsequently analyzed for root length and diameter.
Crop Factor for forests
Transpiration crop factors for arable crops are available from literature, but values for
more complex systems like forests are scarce. We therefore developed eq. (2.2) (eq. A1.13
from appendix A) from crop growth modeling (VAN DER WERF et al., 2007), describing the
crop factor as a function of the extinction coefficient (k), the leaf area index (LAI), surface soil
albedo ( s ) and vegetation albedo ( v ).
23.01
)(1
kLAI
vsvc
eK
(2.2)
Values of albedo were estimated from satellite images for both rainy and dry seasons.
Interception losses
To assess the interception losses, the Gash approach (GASH, 1979) was applied, as
implemented in SWAP. Required parameters were based on Medeiros, de Araújo and
Bronstert (2009), who carried out an experiment (from 2004 to 2006) to evaluate the

22
interception losses in the Caatinga biome, by monitoring precipitation, throughfall and stem
flow in a 100 m² plot inside the AEB.
2.2.3 Evapotranspiration parameterization
Daily ETo was estimated from Class A Pan data measured in the AEB. About 40% of
data were missing, and these were substituted by ETo estimated using the Hargreaves method
as described in Allen et al. (1998). The Hargreaves method was chosen due to its low data
requirements (mean, maximum and minimum temperature). The meteorological data used in
the Hargreaves method were provided by the Ceará State Foundation of Meteorology and
Water Resources (FUNCEME, www.funceme.br).
2.2.4 Simulation, validation and statistical procedures
The SWAP model was run for nine years for SVA1 and SVA2 (2004-2012) and for
seven years for SVA3 (2004-2010). After parameterization, the model was run and validated
for each SVA. The validation procedures were applied for each SVA, comparing the soil
water content measured by the TDR, installed in each SVA at the depth of 0.2 m (totaling
5912 daily measurements), to soil water content simulated by the SWAP model for the same
depth. To perform the validation procedure, two statistical parameters were used; Nash and
Sutcliffe (1970) efficiency (NSE – eq. 2.3), and the Root Mean Square Error of Prediction
(RMSEP – eq. 2.4):
1
2
12
^
)(
)(
1i
j
ii
i
j
ii
NSE
(2.3)
n
i
ii
nRMSEP
1
2^
)( (2.4)
where i and i
^
are observed and estimated values of soil water content, respectively; i
is
mean of the observed soil water content and n is number of observations. NSE ranges from
−∞ to 1. If the model prediction capability is lower than simply using the mean measured
value as a predictor, then NSE < 0. If the model predicts with a higher accuracy than using the
mean observed value, NSE > 0. The closer NSE is to unity, the higher the model efficiency.
23
In turn, the RMSEP describes the difference between the model simulations and observations
in the units of the variable. The closer it is to zero, the higher the model efficiency
(LEGATES; MCCABE, 1999).
Another procedure followed in order to analyze the quality of the simulated data was
undertaken by drawing the cumulative probability distribution for observed and predicted soil
water content. The mathematical description used is known as Chegodayev’s method, eq.
(2.5). The procedure is described by Chow, Maidment and Mays (1988):
4.0
3.0)(
n
mP m (2.5)
where m is a rank of a value in a list ordered by descending magnitude and n is the total
number of values.
Statistical analysis was performed using the SPSS 22.0. Water balance components
data (precipitation, interception losses, transpiration, evaporation and deep drainage) showed
normality and homogeneity of variances according to Kolmogorov-Smirnov (KS) test and
Levene’s test (p>0.05), respectively. Data were analyzed by one-way ANOVA to explore
significant differences among the three SVAs for the sets of variables of the water balance
components using the Tukey test with a probability value of 0.05.
2.3. Results and Discussion
2.3.1 Spatial and temporal rainfall distribution
Mean annual rainfall for the analyzed period for the three SVAs (2004-2012) was 640,
572 and 694 mm, respectively, and slightly above the long-term average (549 mm). However,
despite the size of the watershed, 12 km², for some years a significant difference in rainfall
amount among the SVAs could be observed. For instance, in 2007 the measured rainfall in
SVA1 was 740 mm, whereas in SVA2 it was 34% lower (490 mm) and in SVA3 it was 80%
higher (1330 mm, Figure 2.2).
Besides this spatial variability, Medeiros and de Araújo (2014) also describe a high
temporal variability in the rainfall pattern for the same region, where in some years the
rainfall is over twice the average.

24
Figure 2.2 – Spatial and temporal variability of the total annual rainfall depth for the studied period (2004-2012
for SVA1 and SVA2 and 2004-2010 for SVA3)
2.3.2 Spatial and temporal dynamics of the leaf area index
Correlations between LAI obtained from SEBAL and mean soil pressure head in the
15-day period before the satellite imaging yielded a range of coefficient of determination from
0.89 to 0.92 and NSE values from 0.76 to 0.94 (Figure 2.3).
Figure 2.3 – Correlations between LAI obtained from SEBAL and the mean soil water pressure head in the 15-
day period previous to satellite imaging. NSE (Nash-Sutcliffe efficiency)
For SVA1, SVA2 and SVA3, the average values of LAI estimated from the above
correlations during the rainy season were 0.97, 1.12 and 1.07, respectively. During the dry
season when most of species shed leaves as survival behavior, mean LAI values were 0.15 for

25
SVA1 and 0.11 for SVA2 and SVA3. The vegetation showed abrupt LAI changes which were
highly correlated to mean soil water pressure head at 0.2 m depth in the 15-day period before
satellite imaging. Maximum LAI was relatively stable over the years and occurred between
March and April. The spatial behavior of LAI appeared to be independent of soil type and
root depth, similar for the three SVAs. These LAI values are low when compared to many
other forests, however, in a global synthesis of LAI observations representative of a wide
range of geographical locations worldwide (ASNER; SCURLOCK; HICKE, 2003), deserts
and shrublands registered the lowest values, 1.3 (± 0.9) and 2.1 (± 1.6), respectively.
Although no measurement was recorded for the Caatinga biome in the aforementioned study,
it indicates that biomes from arid and semi-arid lands with fragmented canopy, like Caatinga,
tend to show a lower LAI, indicating that our correlations yielded representative results for
canopy scale.
2.3.3 Simulations and validation results
Regarding the validation results, NSE values were well above zero, indicating good
model performance. Values of RMSEP were around 0.04 m3 m-3, similar to those obtained by
de Jong van Lier et al. (2008) and achieved by the same physically based macroscopic uptake
model incorporated in the SWAP (Table 2.2).
Table 2.2 – Values of the Nash-Sutcliffe (NSE) coefficient of efficiency and Root Mean Square Error of
Prediction (RMSEP) for the water content at depth 0.2 m in the three SVAs
SVA n NSE RMSEP (m3 m-3)
1 2219 0.65 0.04
2 2064 0.34 0.04
3 1629 0.71 0.05 n - number of data of soil water content available to the validation procedure for each SVA
Cumulative probability curves of soil water content (Figure 2.4) and respective indices
of agreement (dr) as proposed by Willmott et al. (2012), show the similarity between
observed and simulated series.
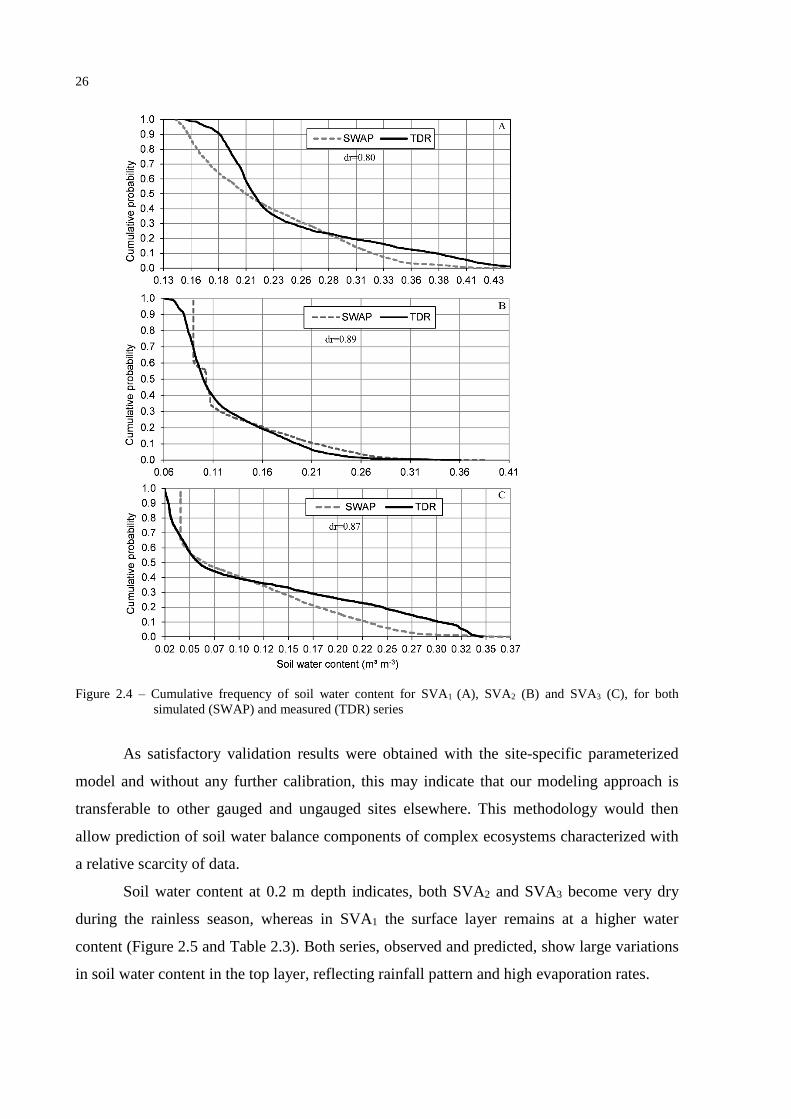
26
Figure 2.4 – Cumulative frequency of soil water content for SVA1 (A), SVA2 (B) and SVA3 (C), for both
simulated (SWAP) and measured (TDR) series
As satisfactory validation results were obtained with the site-specific parameterized
model and without any further calibration, this may indicate that our modeling approach is
transferable to other gauged and ungauged sites elsewhere. This methodology would then
allow prediction of soil water balance components of complex ecosystems characterized with
a relative scarcity of data.
Soil water content at 0.2 m depth indicates, both SVA2 and SVA3 become very dry
during the rainless season, whereas in SVA1 the surface layer remains at a higher water
content (Figure 2.5 and Table 2.3). Both series, observed and predicted, show large variations
in soil water content in the top layer, reflecting rainfall pattern and high evaporation rates.

27
Figure 2.5 – Measured and simulated soil water content on a daily basis for 0.2 m depth together with rainfall for
SVA1 (A), SVA2 (B) and SVA3 (C)
Table 2.3 – Average pressure head (h) and soil water content (θ) in wet and dry seasons for each SVA (averages
taken over the entire simulated period)
SVA Wet season Dry season
h (m) θ (cm3 cm-3) h (m) θ (cm3 cm-3)
1 -0.8 0.285 -5.6 0.194
2 -10.0 0.196 <-150 0.125
3 -0.9 0.177 <-150 0.035
Water components (yearly precipitation, interception losses, actual transpiration,
actual evaporation and deep drainage) do not differ statistically among the SVAs (Table 2.4),

28
regardless of difference in soil and vegetation parameterization. Despite limited experimental
evidence, this may indicate a homogeneous spatial pattern of water use in the Caatinga biome,
or, alternatively, more insight is needed to understand the dependency between hydrological
components and soil-vegetation patterns in this ecosystem.
Table 2.4 – Yearly precipitation (P), interception losses (IL), actual transpiration (T), actual evaporation (E) and
deep drainage (Dd) for the three SVAs for the period 2004-2012
SVA WBC1
Year σ X
Statistical
cluster 2004 2005 2006 2007 2008 2009 2010 2011 2012
--------------------mm-----------------
SVA1
P 996 516 631 742 737 743 485 632 274 203 640 a
IL 118 62 80 86 98 102 60 84 44 23 81 b
T 178 104 115 147 160 161 152 198 153 29 152 c
E 210 129 214 173 206 263 158 191 99 49 182 d
Dd 457 160 229 368 296 200 125 158 16 133 223 e
SVA2
P 837 407 519 495 530 742 630 640 347 156 572 a
IL 100 50 73 68 72 103 83 83 52 18 76 b
T 178 158 210 182 129 189 214 270 147 42 183 c
Eact 224 122 201 168 161 297 249 217 146 45 198 d
Dd 373 42 24 113 171 151 41 125 2 114 116 e
SVA3
P 1033 684 551 1330 565 552 136 - - 386 694 a
IL 126 89 78 145 85 89 24 - - 39 91 b
T 194 220 246 271 220 275 65 - - 71 213 c
E 194 156 150 165 150 173 46 - - 48 148 d
Dd 490 230 66 792 120 16 00 - - 294 245 e 1WBC - Water Balance Components; σ – standard deviation; X - average; ‘a, b, c, d, e’ represent, each, a
homogeneous cluster (Tukey at 0.05 significance)
Daily frequency of rainfall data is sufficient for most SWAP applications (KROES et
al., 2008) and was used in our simulations. No runoff was predicted in the simulations,
confirming experimental results of de Figueiredo et al. (2016) who evaluated runoff initiation
in the AEB based on field measurements and found annual runoff coefficients smaller than
0.5% and no event with I60 (maximum 60-min rainfall intensity) below 12 mm h-1 to generate
runoff. According to these authors, a possible explanation may be that initial abstractions
change seasonably as a function of the dynamic behavior (expansion and contraction) of the
root system in the Caatinga biome, enhancing macro-pore flow. The same authors seldom
observed base flow at the catchment scale, because the water table was located several meters
below the river bed in the downstream area. Measurable base flow were only observed during
a long-lasting event (several days) in 2004. For the decade 2005-2014, the Aiuaba
Experimental Basin had only five days with runoff per year, and river discharges lasted less
than six hours after rainfall.
The amount of precipitation returned to the atmosphere (through T, E and IL) by
SVA1, SVA2 and SVA3 was, on average, 69% (±16%); 82% (±11%) and 75% (±20%),

29
respectively. Considering the overall average for all SVAs, the Caatinga biome returns 75%
(±17%) of annual precipitation back to the atmosphere. Moreover, for years with less
precipitation, the percentage of rainfall returned to the atmosphere is close to 100%. For
example, in the dry year of 2012 ET simulated for SVA1 was slightly higher than precipitation
(7%); this difference can be attributed to evapotranspiration of stored soil water. SVA1 has a
deeper root zone and soil water content in the rainless season is around 20% (Figure 2.5A and
Table 2.3), which is possibly used in dry years. A similar observation was made by Raz-
Yaseef et al. (2010) for a semiarid pine forest, in which both current forest density and canopy
cover provided an optimal balance between ET components, storing some soil water content
for forest transpiration in drier years as a survival strategy.
Ratios of actual transpiration, actual evaporation and interception losses to actual
evapotranspiration (T/ET, E/ET, IL/ET) on an annual basis for the Caatinga biome are 41%
(±7%), 40% (±6%) and 19% (±3%), respectively (Table 2.5 and Figure 2.6).
Table 2.5 – Transpiration, evaporation and interception losses as a fraction of total water use over the analyzed
period for each SVA
SVA T/ET E/ET IL/ET
1 0.37 0.43 0.19
2 0.41 0.43 0.17
3 0.47 0.33 0.20
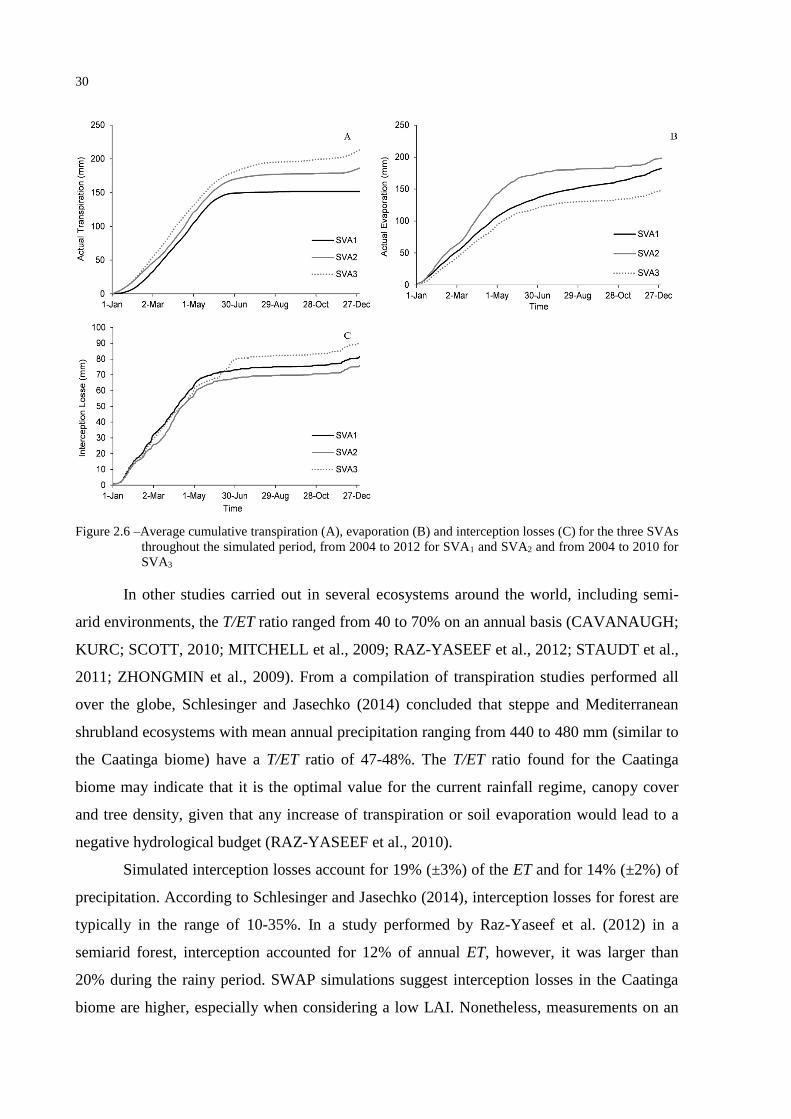
30
Figure 2.6 –Average cumulative transpiration (A), evaporation (B) and interception losses (C) for the three SVAs
throughout the simulated period, from 2004 to 2012 for SVA1 and SVA2 and from 2004 to 2010 for
SVA3
In other studies carried out in several ecosystems around the world, including semi-
arid environments, the T/ET ratio ranged from 40 to 70% on an annual basis (CAVANAUGH;
KURC; SCOTT, 2010; MITCHELL et al., 2009; RAZ-YASEEF et al., 2012; STAUDT et al.,
2011; ZHONGMIN et al., 2009). From a compilation of transpiration studies performed all
over the globe, Schlesinger and Jasechko (2014) concluded that steppe and Mediterranean
shrubland ecosystems with mean annual precipitation ranging from 440 to 480 mm (similar to
the Caatinga biome) have a T/ET ratio of 47-48%. The T/ET ratio found for the Caatinga
biome may indicate that it is the optimal value for the current rainfall regime, canopy cover
and tree density, given that any increase of transpiration or soil evaporation would lead to a
negative hydrological budget (RAZ-YASEEF et al., 2010).
Simulated interception losses account for 19% (±3%) of the ET and for 14% (±2%) of
precipitation. According to Schlesinger and Jasechko (2014), interception losses for forest are
typically in the range of 10-35%. In a study performed by Raz-Yaseef et al. (2012) in a
semiarid forest, interception accounted for 12% of annual ET, however, it was larger than
20% during the rainy period. SWAP simulations suggest interception losses in the Caatinga
biome are higher, especially when considering a low LAI. Nonetheless, measurements on an

31
event-based study carried out by Medeiros, de Araújo and Bronstert (2009) showed that
interception losses in the Caatinga account for 13% of annual precipitation. This elevated
interception value could be attributed to high evaporation turnover rate.
Root water uptake data demonstrated that in near-average years, the growing season
starts shortly after the first rainfall events, by the end of December or beginning of January for
all SVAs. For SVA1, transpiration equaled potential rates in all simulated years, with water
uptake ceasing in the second half of June. Meanwhile, for SVA2 and SVA3, potential
transpiration never occurred during the simulated period, and water uptake ceased in the
second half of July for SVA2 and in the second half of September for SVA3. It is worth noting
that for the investigated period, 2012 was the only dry year, but in SVA1 root water extraction
continued at potential levels until September of that year with the fourth layer (0.60-0.80 m)
contributing with 17% of water uptake (Figure 2.7). This illustrates the effects of drought are
not linear, given the existence of, for example, discrete soil water content thresholds affecting
vegetation and surface fluxes (KOSTER et al., 2004; SENEVIRATNE et al., 2010). This
means that the same precipitation deficit will affect each region in a specific way, even within
small areas like the Aiuaba Experimental Basin.
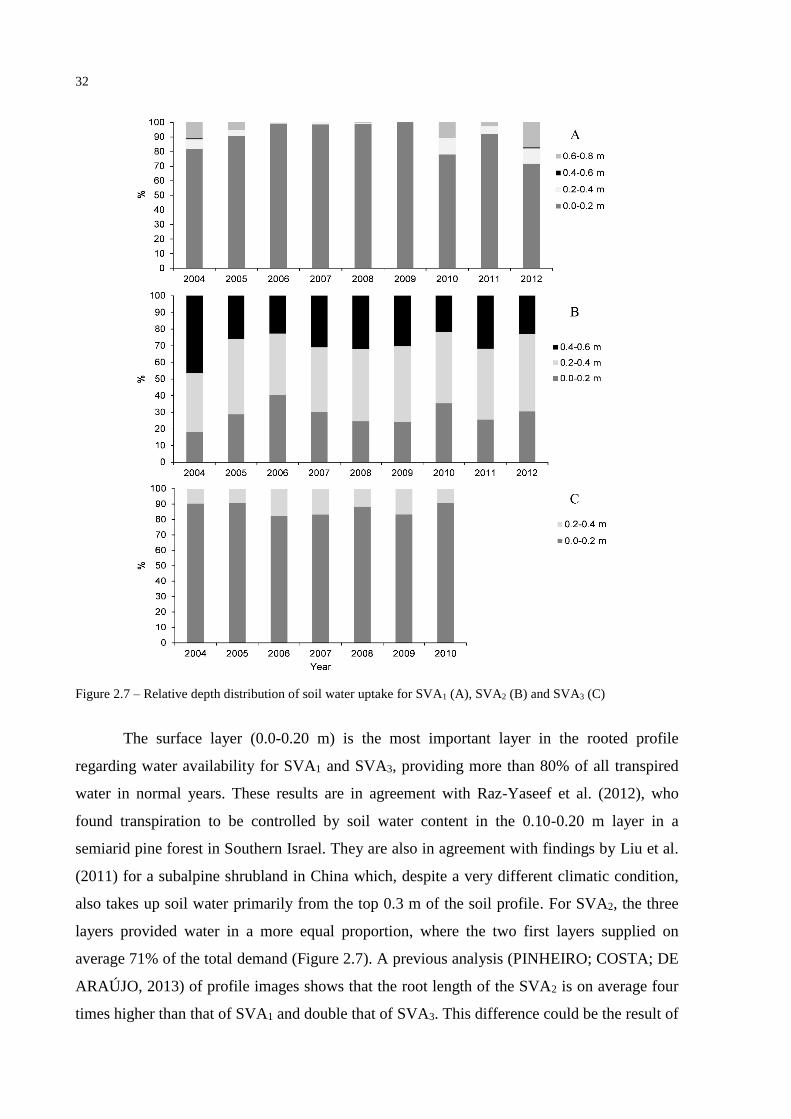
32
Figure 2.7 – Relative depth distribution of soil water uptake for SVA1 (A), SVA2 (B) and SVA3 (C)
The surface layer (0.0-0.20 m) is the most important layer in the rooted profile
regarding water availability for SVA1 and SVA3, providing more than 80% of all transpired
water in normal years. These results are in agreement with Raz-Yaseef et al. (2012), who
found transpiration to be controlled by soil water content in the 0.10-0.20 m layer in a
semiarid pine forest in Southern Israel. They are also in agreement with findings by Liu et al.
(2011) for a subalpine shrubland in China which, despite a very different climatic condition,
also takes up soil water primarily from the top 0.3 m of the soil profile. For SVA2, the three
layers provided water in a more equal proportion, where the two first layers supplied on
average 71% of the total demand (Figure 2.7). A previous analysis (PINHEIRO; COSTA; DE
ARAÚJO, 2013) of profile images shows that the root length of the SVA2 is on average four
times higher than that of SVA1 and double that of SVA3. This difference could be the result of
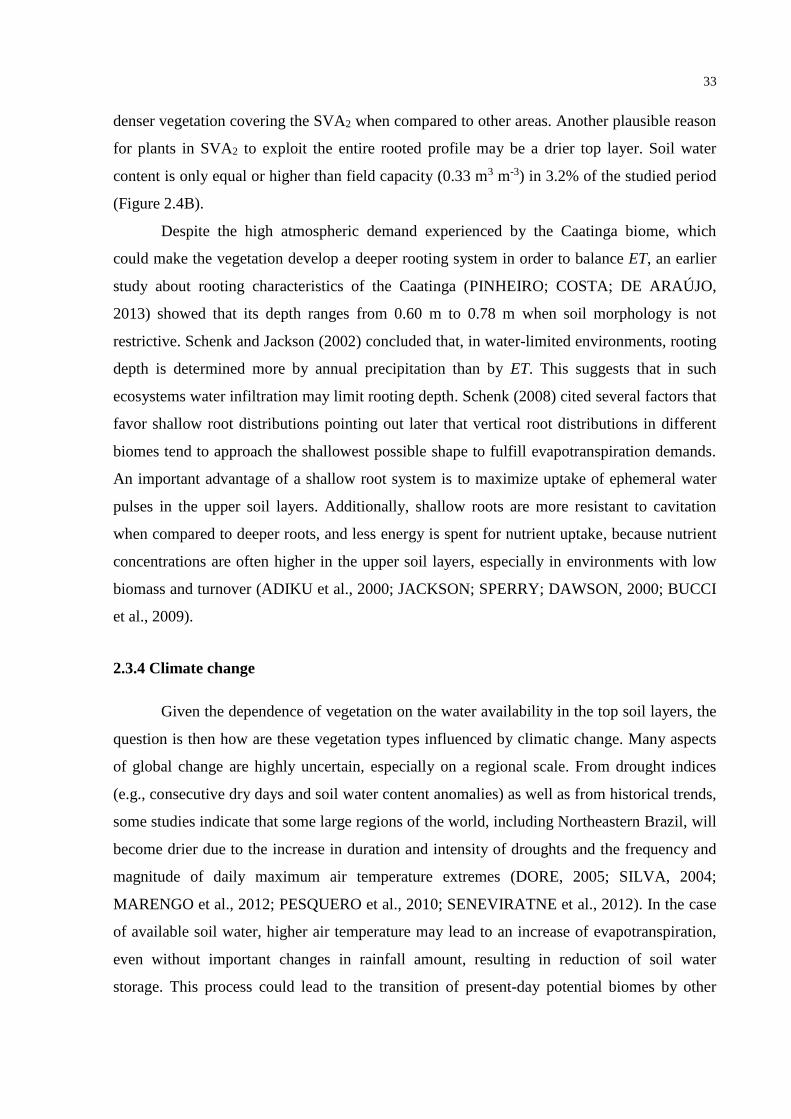
33
denser vegetation covering the SVA2 when compared to other areas. Another plausible reason
for plants in SVA2 to exploit the entire rooted profile may be a drier top layer. Soil water
content is only equal or higher than field capacity (0.33 m3 m-3) in 3.2% of the studied period
(Figure 2.4B).
Despite the high atmospheric demand experienced by the Caatinga biome, which
could make the vegetation develop a deeper rooting system in order to balance ET, an earlier
study about rooting characteristics of the Caatinga (PINHEIRO; COSTA; DE ARAÚJO,
2013) showed that its depth ranges from 0.60 m to 0.78 m when soil morphology is not
restrictive. Schenk and Jackson (2002) concluded that, in water-limited environments, rooting
depth is determined more by annual precipitation than by ET. This suggests that in such
ecosystems water infiltration may limit rooting depth. Schenk (2008) cited several factors that
favor shallow root distributions pointing out later that vertical root distributions in different
biomes tend to approach the shallowest possible shape to fulfill evapotranspiration demands.
An important advantage of a shallow root system is to maximize uptake of ephemeral water
pulses in the upper soil layers. Additionally, shallow roots are more resistant to cavitation
when compared to deeper roots, and less energy is spent for nutrient uptake, because nutrient
concentrations are often higher in the upper soil layers, especially in environments with low
biomass and turnover (ADIKU et al., 2000; JACKSON; SPERRY; DAWSON, 2000; BUCCI
et al., 2009).
2.3.4 Climate change
Given the dependence of vegetation on the water availability in the top soil layers, the
question is then how are these vegetation types influenced by climatic change. Many aspects
of global change are highly uncertain, especially on a regional scale. From drought indices
(e.g., consecutive dry days and soil water content anomalies) as well as from historical trends,
some studies indicate that some large regions of the world, including Northeastern Brazil, will
become drier due to the increase in duration and intensity of droughts and the frequency and
magnitude of daily maximum air temperature extremes (DORE, 2005; SILVA, 2004;
MARENGO et al., 2012; PESQUERO et al., 2010; SENEVIRATNE et al., 2012). In the case
of available soil water, higher air temperature may lead to an increase of evapotranspiration,
even without important changes in rainfall amount, resulting in reduction of soil water
storage. This process could lead to the transition of present-day potential biomes by other

34
vegetation types, which may be more adapted to lower soil water availability (SALAZAR;
NOBRE; OYAMA, 2007).
Investigating the processes that interact with coupling between soil water content and
the main components driven by climate conditions (e.g., evapotranspiration and air
temperature), periods in which these components are more sensitive to soil water content can
be identified. A linear regression between daily soil water content at the depth of 0.2 m and
daily ET for all SVAs identified periods with higher correlation in June-August and
December-January (Figure 2.8A). This makes sense because both periods match the
transitions between wet and dry soil conditions during which ET rates are naturally sensitive
to soil water content.
Figure 2.8 – R2 of regression between daily soil water content and daily evapotranspiration (A) and air
temperature (B) (solid lines refer to average values and dotted lines indicate the upper and lower
limits with 95% of confidence), and average monthly rainfall (C) for the entire basin

35
The sensitivity observed for the months June-August agrees with the results from
analyses based on Atmospheric General Circulation Models (KOSTER et al., 2004, 2006;
SENEVIRATNE et al., 2010) and shows that despite the high temporal and spatial rainfall
variability in the Brazilian semi-arid (MEDEIROS; DE ARAÚJO, 2014), soil water content is
likely to have stronger influence on ET only in the very beginning (Dec-Jan) and at the end of
the wet season. During the December-January period, a higher sensitivity between soil water
content and ET is expected for the Caatinga biome because the rainy season usually starts in
the second half of December. During this transitional period between dry and wet, instabilities
may trigger additional precipitation from oceanic sources (SENEVIRATNE et al., 2010).
Major global hot spots identified by AGCM occur in such transition conditions (KOSTER et
al., 2004, 2006).
A similar argument holds for the relationship between air temperature and soil water
content. Even in dry conditions, soil water content-air temperature sensitivity is likely to
occur when increased temperature leads to a higher vapor pressure deficit and evaporative
demand, and thus to a potential increase in ET, possibly leading to a further decrease in soil
water content. As Seneviratne et al. (2010) pointed out, this feedback loop can go on until the
soil is completely dry and temperature increases cannot be reduced by any further increase in
ET, leading to extreme temperatures and heat waves. During the dry season, soil evaporation
in the Caatinga biome is the main component of the feedback loop, driving soil water content
to very low values, as shown by the fact that the vegetation shed leaves as a survival behavior
to cope with limiting water availability. According to our simulations, soil evaporation
accounted for 40% (±6%) of annual evapotranspiration, similar to the value (39%) reported
by Raz-Yaseef et al. (2012) for a semiarid pine forest. Based on these system characteristics,
analysis of the linear regression between soil water content and air temperature (Figure 2.8B)
shows that the period of higher correlation between these components occurs in August-
September and December-January, transitional periods between dry and wet seasons as
discussed in the foregoing for soil water content-ET sensitivity.
The results from this study suggest that shallow root water uptake developed by the
Caatinga biome likely ensures the vegetation can exploit ephemeral pulses of water in the
upper soil layers, permitting a rapid start of the growing season following even small rain
events. The concept of pulse water availability of short duration for arid and semi-arid regions
has been widely recognized (SALA; LAUENROTH, 1982; REYNOLDS; KEMP;
TENHUNEN, 2000; WILLIAMS et al., 2009; LAUENROTH; SCHLAEPFER;
BRADFORD, 2014). This suggests that under a reduced rainfall climate change of up to 40%

36
(MARENGO et al., 2012), the Caatinga productivity could be maintained providing that
storm intensity is increased. In terms of biomass productivity, temporal distribution of rainfall
may be more important than the amount itself, since intensified storms may increase soil
water storage (WANG et al., 2012). On the other hand, under a climate change scenario
characterized by increasing ET driven by an increase in air temperature, water stress would be
expected to increase and this would lead to a higher tree mortality, as observed by Raz-Yaseef
et al. (2010). Many aspects still require research to analyse the influence of rainfall patterns
on the capacity of the Caatinga biome to cope with climate change.
2.4 Conclusions
The hydrological modeling approach applied to a semi-arid Caatinga basin allows the
following conclusions:
1. The satisfactory validation results of the simulations based on the parameterization with
site-specific data indicates that our modeling approach may be transferable to other gauged or
ungauged sites, opening the possibility to investigate interactions between soil-vegetation and
environmental driving forces in sparsely studied ecosystem.
2. Soil water balance components do not differ statistically among the three soil and
vegetation associations (SVA), suggesting a homogeneous spatial pattern of water use in the
Caatinga biome.
3. Considering the overall average for all SVAs, the Caatinga biome returns 75% (±17%) of
annual precipitation to the atmosphere, whereas partitioning of total evapotranspiration into
its components (actual transpiration, actual evaporation and interception losses) on annual
basis accounts for 41% (±7%), 40% (±6%), 19% (±3%), respectively.
4. Surface layer (0.0-0.2 m) is the most important layer in the rooted profile regarding water
availability.
5. Higher sensitivity of soil water content-ET and soil water content-air temperature is
expected to occur in the periods June-September and December-January. Despite the fact that
our results were insufficient to produce robust conclusions about presence of coupling
between the studied components in the Caatinga biome, they provide some preliminary
indications of the period of the year during which ET and air temperature are more sensitive
to hydrological processes, warranting further local investigation to assess more precisely the
role of the soil water content on ET, air temperature and rainfall pattern.
37
References
ADIKU, S.G.K.; ROSE, C.W.; BRADDOCK, R.D.; OZIER-LAFONTAINE, H. On the
simulation of root water extraction: examination of a minimum energy hypothesis. Soil
Science, Philadelphia, v. 165, n. 3, p. 226-236, 2000.
ALLEN, R.G.; TREZZA, R.; TASUMI, M. Surface energy balance algorithms for land:
advance training and users manual; version 1.0. Idaho, 2002. 98 p.
ALLEN, R.G.; PEREIRA, L.S.; RAES, D.; SMITH, M. Crop evapotranspiration:
guidelines for computing crop water requirements. Rome: FAO, 1998. 333 p. (FAO.
Irrigation and Drainage Paper, 56).
ASNER, G.P.; SCURLOCK, J.M.O.; HICKE, A. Global synthesis of leaf area index
observations: implications for ecological and remote sensing studies. Global Ecology and
Biogeography, Malden, v. 12, n. 3, p. 191–205, 2003.
BARBOSA, H.A.; HUETE, A.R.; BAETHGEN, W.E. A 20-year study of NDVI variability
over the Northeast Region of Brazil. Journal of Arid Environments, London, v. 67, n. 2,
p. 288-307, 2006.
BUCCI, S.J.; SCHOLZ, F.G.; GOLDSTEIN, G.; MEINZER, F.C.; ARCE, M.E. Soil water
availability and rooting depth as determinants of hydraulic architecture of Patagonian woody
species. Oecologia, New York, v. 160, n. 4, p. 631-641, 2009.
CAVANAUGH, M.L.; KURC, S.A.; SCOTT, R.L. 2010. Evapotranspiration partitioning in
semiarid shrubland ecosystems: a two-site evaluation of soil moisture control on transpiration.
Ecohydrology, Hoboken, v. 4, n. 5, p. 671-681, 2010.
CHOW, V.T.; MAIDMENT, D.R.; MAYS, L.W. Applied hydrology. New York: McGraw-
Hill, 1988. 588 p.
COSTA, A.C.; BRONSTERT, A.; DE ARÚJO, J.C. A channel transmission losses model for
different dryland rivers. Hydrology and Earth System Sciences, Gottingen, v. 16, n. 4,
p. 1111–1135, 2012.
COSTA, A.C.; FOERSTER, S.; DE ARAÚJO, J.C.; BRONSTERT, A. Analysis of channel
transmission losses in a dryland river reach in north-eastern Brazil using streamflow series,
groundwater level series and multi-temporal satellite data. Hydrological Processes,
Chichester, v. 27, n. 7, p. 1046-1060, 2013.
COSTA, C.A.G.; LOPES, J.W.B.; PINHEIRO, E.A.R.; DE ARAÚJO, J.C.; GOMES FILHO,
R.R. Spatial behaviour of soil moisture in the root zone of the Caatinga biome. Revista
Ciência Agronômica, Fortaleza, v. 44, n. 4, p. 685-694, 2013.
DE ARAÚJO, J.C.; PIEDRA, J.I.G. Comparative hydrology: analysis of a semiarid and a
humid tropical watershed. Hydrological Processes, Chichester, v. 23, n.8, p. 1169-1178,
2009.

38
DE ARAÚJO, J.C.; GÜNTNER, A.; BRONSTERT, A. Loss of reservoir volume by sediment
deposition and its impact on water availability in semiarid Brazil. Hydrological Sciences
Journal, Wallingford, v. 51, n.1, p.157-170, 2006.
DE FIGUEIREDO, J.V.; DE ARAÚJO, J.C.; MEDEIROS, P.H.A.; COSTA, A.C. Runoff
initiation in a preserved semiarid Caatinga small watershed, Northeastern Brazil.
Hydrological Processes, Chichester, 2016. In press.
DE JONG VAN LIER, Q.; VAN DAM, J.C.; DURIGON, A.; DOS SANTOS, M.A.;
METSELAAR, K. Modeling water potentials and flows in the soil-plant system comparing
hydraulic resistances and transpiration reduction functions. Vadose Zone Journal, Madison,
v. 12, n. 3, p. 1-20, 2013.
DE JONG VAN LIER, Q.; VAN DAM, J.C.; METSELAAR, K.; DE JONG, R.;
DUIJNISVELD, W.H.M. Macroscopic Root Water Uptake Distribution Using a Matric Flux
Potential Approach. Vadose Zone Journal, Madison, v. 7, n. 3, p. 1065-1078, 2008.
DORE, M.H.I. Climate change and changes in global precipitation patterns: what do we
know? Environment International, Kidlington, v. 31, n. 8, p. 1167-1181, 2005.
FISCHER, E.M.; SENEVIRATNE, S.I.; VIDALE, P.L.; LÜTHI, D.; SCHÄR, C. Soil
moisture: atmosphere interactions during the 2003 European summer heat wave. Journal of
Climate, Boston, v. 20, p. 5081–5099, 2007.
GASH, J.H.C. An analytical model of rainfall interception by forests. Quarterly Journal of
the Royal Meteorological Society, Chichester, v. 105, n. 443, p. 43-55, 1979.
MITTERMEIER, R.A.M.; PILGRIM, C.G.; FONSECA, J.; KONSTANT, G.; WILLIAM, R.
Wilderness: earth’s last wild places. Mexico City: CEMEX, 2002. 576 p.
GÜNTNER, A.; KROL, M.; DE ARAÚJO, J.C.; BRONSTERT, A. Simple water balance
modeling of surface reservoir systems in a large data-scarce semiarid region. Hydrological
Sciences Journal, Wallingford, v. 49, n. 5, p. 901-918, 2004.
JACKSON, R.B.; SPERRY, J.S.; DAWSON, T.E. Root water uptake and transport: using
physiological processes in global predictions. Trends in plant science, London, v. 5, n. 11,
p. 482-488, 2000.
KOSTER, R.D.; DIRMEYER, P.A.; GUO, Z.; BONAN, G.; CHAN, E.; COX, P.; GORDON,
C.T.; KANAE, S.; KOWALCZYK, E.; LAWRENCE, D.; LIU, P.; LU, C.; MALYSHEV, S.;
MCAVANEY, B.; MITCHELL, K.; MOCKO, D.; OKI T.; OLESON, K.; PITMAN, A.;
SUD, Y.C.; TAYLOR, C.M.; VERSEGHY, D.; VASIC, R.; XUE, Y.;, YAMADA, T.
Regions of strong coupling between soil moisture and precipitation. Science, Washington,
v. 305, n. 5687, p. 1138–1140, 2004.

39
KOSTER, R.D.; SUD, Y.C.; GUO, Z.; DIRMEYER, P.A.; BONAN, G.; OLESON, W.K.;
CHAN, E.; VERSEGHY, D.; COX, P.; DAVIES, H.; KOWALCZYK, E.; GORDON, C.T.;
KANAE, S.; LAWRENCE, D.; LIU, P.; MOCKO, D.; LU, C.; MITCHELL, K.;
MALYSHEV, S.; MCAVANEY, B.; OKI, T.; YAMADA, T.; PITMAN, A.; TAYLOR,
C.M.; VASIC, R.; XUE, Y. GLACE: the global land– atmosphere coupling experiment. Part
I: overview. Journal of Hydrometeorology, Boston, v. 7, p. 590–610, 2006.
KROES, J.G; VAN DAM, J.C.; GROENENDIJK, P.; HENDRIKS, R.F.A.; JACOBS, C.M.J.
SWAP version 3.2: theory description and user manual. Wageningen: Alterra, 2008. 262p.
(Alterra Report, 1649).
LAUENROTH, W.K.; SCHLAEPFER, D.R.; BRADFORD, J.B. Ecohydrology of dry
regions: storage versus pulse soil water dynamics. Ecosystems, New York, v. 17, n.8,
p. 1469–1479, 2014.
LEAL, I.R.; DA SILVA, J.M.C.; TABARELLI, M.; LACHER JR, T.E. Changing the course
of biodiversity conservation in the Caatinga of Northeastern Brazil. Conservation Biology,
Malden, v. 19, n.3, p. 701-706, 2005.
LEGATES, D.R.; MCCABE, G.J. Evaluating the use of "goodness-of-fit" measures in
hydrologic and hydroclimatic model validation. Water Resources Research, Washington,
v. 35, n.1, p. 233-241, 1999.
LIU, Y.; XU, Z.; DUFFY, R.; CHEN, W.; AN, S.; LIU, S.; LIU, F. Analyzing relationships
among water uptake patterns, rootlet biomass distribution and soil water content profile in a
subalpine shrubland using water isotopes. European Journal of Soil Biology, Paris, v. 47,
n. 6, p. 380-386, 2011.
MARENGO, J.A.; CHOU, S.C.; KAY, G.; ALVES, L.M.; PESQUERO, J.F.; SOARES,
W.R.; SANTOS, D.C.; LYRA, A.A.; SUEIRO, G.; BETTS, R.; CHAGAS, D.J.; GOMES,
J.L.; BUSTAMENTE, J.F.; TAVARES, P. Development of regional future climate change
scenarios in South America using the Eta CPTEC/HadCM3 climate change projections:
climatology and regional analyses for the Amazon, São Francisco and the Paraná River
basins. Climate Dynamics, New York, v. 38, n. 9, p. 1829–1848, 2012.
MEDEIROS, P.H.A.; DE ARAÚJO, J.C.; BRONSTERT, A. Interception measurements and
assessment of Gash model performance for a tropical semi-arid region. Revista Ciência
Agronômica, Fortaleza, v. 40, n. 2, p. 165-174, 2009.
MEDEIROS, P.H.A.; DE ARAÚJO J.C. Temporal variability of rainfall in a semiarid
environment in Brazil and its effect on sediment transport processes. Journal of Soils and
Sediments, Heidelberg, v. 14, n.7, p. 1216-1223, 2014.
MITCHELL, P.J.; VENEKLAAS, E.; LAMBERS, H.; BURGESS, S.S.O. Partitioning of
evapotranspiration in a semi-arid eucalypt woodland in South-Western Australia.
Agricultural and Forest Meteorology, Amsterdam, v. 149, n. 1, p. 25–37, 2009.
MUALEM, Y. A New model for predicting the hydraulic conductivity of unsaturated porous
media. Water Resources Research, Washington, v. 12, n. 3, p. 513-522, 1976.

40
NASH, J.E.; SUTCLIFFE, J.V. River flow forecasting through conceptual models. Part I: A
discussion of principles. Journal of Hydrology, Amsterdam, v. 10, n. 3, p. 282-290, 1970.
PESQUERO, J.F.; CHOU, S.C.; NOBRE, C.A.; MARENGO, J.A. Climate downscaling over
South America for 1961–1970 using the Eta Model. Theoretical and Applied Climatology,
Wien, v. 99, n.1, p. 75–93, 2010.
PINHEIRO, E.A.R.; COSTA, C.A.G.; DE ARAÚJO, J.C. Effective root depth of the
Caatinga biome. Journal of Arid Environments, London, v. 89, p. 1-4, 2013.
PINHEIRO, E.A.R.; DE JONG VAN LIER, Q.; METSELAAR, K. Spatial and temporal
dynamics of the leaf area index of the Caatinga biome. Geophysical Research Abstracts,
Vienna, v. 17, EGU2015-1413, 2015.
RAZ-YASEEF, N.; ROTENBERG, E.; YAKIR ,D. Effects of spatial variations in soil
evaporation caused by tree shading on water flux partitioning in a semi-arid pine forest.
Agricultural and Forest Meteorology, Amsterdam, v. 150, n. 3, p. 454–462, 2010.
RAZ-YASEEF, N.; YAKIR, D.; SCHILLER, G.; COHEN, S. Dynamics of
evapotranspiration partitioning in a semi-arid forest as affected by temporal rainfall patterns.
Agricultural and Forest Meteorology, Amsterdam, v. 157, p. 77-85, 2012.
RAZ-YASEEF, N.; YAKIR, D.; ROTENBERG, E.; SCHILLER, G.; COHEN, S.
Ecohydrology of a semi-arid forest: partitioning among water balance and its components
implications for predicted precipitation changes. Ecohydrology, Hoboken, v. 3, n.2, p.1 43–
154, 2010.
REYNOLDS, J.F.; KEMP, P.R.; TENHUNEN, J.D. Effects of long-term rainfall variability
on evapotranspiration and soil water distribution in the Chihuahuan Desert: a modeling
analysis. Plant Ecology, Dordrecht, v. 150, n. 1, 145–59, 2000.
SALA, O.E.; LAUENROTH, W.K. Small rainfall events: an ecological role in semiarid
regions. Oecologia, New York, v. 53, n. 3, p. 301–304, 1982.
SALAZAR, L.F.; NOBRE, C.A.; OYAMA, M.D. Climate change consequences on the biome
distribution in tropical South America. Geophysical research letters, Washington, v. 34,
n. 9, p. 1-6, 2007.
SANTOS, J.C.; LEAL, I.R.; ALMEIDA-CORTEZ, J.S.; FERNANDES, G.W.; TABARELLI,
M. Caatinga: the scientific negligence experienced by a dry tropical forest. Tropical
Conservation Science, Washington, v. 4, n. 3, p. 276-286, 2011.
SCHENK, H.J. The shallowest possible water extraction profile: a null model for global root
distributions. Vadose Zone Journal, Madison, v. 7, n. 3, p. 1119-1124, 2008.
SCHENK, H.J.; JACKSON, R.B. Rooting depths, lateral root spreads and below-
ground/above-ground allometries of plants in water-limited ecosystems. Journal of Ecology,
Malden, v. 90, n. 3, p. 480-494, 2002.

41
SCHLESINGER, W.H.; JASECKO, S. Transpiration in the global water cycle. Agricultural
and Forest Meteorology, Amsterdam, v. 189/190, p. 115-117, 2014.
SENEVIRATNE, S.I.; LÜTHI, D.; LITSCHI, M.; SCHÄR, C. Land–atmosphere coupling
and climate change in Europe. Nature, London, v. 443, p. 205–209, 2006.
SENEVIRATNE, S.L.; CORTI, T.; DAVIN, E.L.; HIRSCHI, M.; JAEGER, E.B.; LEHNER,
I.; ORLOWSKY, B.; TEULING, A.J. Investigating soil moisture–climate interactions in a
changing climate: a review. Earth-Science Reviews, Amsterdam, v. 99, n. 3/4, p. 125–161,
2010.
SENEVIRATNE, S.I.; NICHOLLS, N.; EASTERLING, D.; , GOODESS, C.M.; KANAE, S.;
KOSSIN, J.; LUO, Y.; MARENGO, J.; MCINNES, K.; RAHIMI, M.; REICHSTEIN, M.;
SORTEBERG, A.; VERA, C.; ZHANG, X. Changes in climate extremes and their impacts on
the natural physical environment. In: FIELD, C.B., BARROS, V.; STOCKER, T.F.; QIN, D.;
DOKKEN, D.J.; EBI, K.L.; MASTRANDREA, M.D.; MACH, K.J.; PLANTTNER, G.-K,
ALLEN, S.K.; TIGNOR, M.; MIDGLEY, P.M. (Ed.). Managing the risks of extreme events
and disasters to advance climate change adaptation: a special report of Working Groups I
and II of the Intergovernmental Panel on Climate Change (IPCC). Cambridge; New York:
Cambridge University Press, 2012. p. 109-230.
SILVA, V.P.R. On climate variability in Northeast of Brazil. Journal of Arid
Environments, London, v. 58, n. 4, 575-596, 2004.
STAUDT, K.; SERAFIMOVICH, A.; SIEBICKE, L.; PYLES, R.D.; FALGE, E. Vertical
structure of evapotranspiration at a forest site (a case study). Agricultural and Forest
Meteorology, Amsterdam, v. 151, n. 6, p. 709–729, 2011.
TRENBERTH, K.E.; FASULLO, J.; KIEHL, J. Earth's global energy budget. Bulletin of the
American Meteorological Society, Boston, v. 90, p. 311–323, 2009.
VAN DER WERF, W.; KEESMAN, K.; BURGESS, P.; GRAVES, A.; PILBEAM, D.;
INCOLL, L.D.; METSELAAR, K.; MAYUS, M.; STAPPERS, R.; VAN KEULEN, H.;
PALMA, J.; DUPRAZ, C. Yield-SAFE: a parameter-sparse, process-based dynamic model
for predicting resource capture, growth, and production in agroforestry systems. Ecological
Engineering, Amsterdam, v. 29, n. 4, p. 419-433, 2007.
VAN GENUCHTEN, MT. A closed-form equation for predicting the hydraulic conductivity
of unsaturated soils. Soil Science Society of America Journal, Madison, v. 44, n. 5, p. 892-
898, 1980.
WANG, L.; D’ODORICO, P.; EVANS, J.P.; ELDRIDGE, D.J.; MCCABE, M.F.; CAYLOR,
K.K.; KING, E.G. Dryland ecohydrology and climate change: critical issues and technical
advances. Hydrolpgical Earth Systematic Science, Gottingen, v. 16, p. 2585–2603, 2012.
WANG, X.; AULER, A.S.; EDWARDS, R.L.; CHENG, H.; CRISTALLI, P.S.; SMART,
P.L.; RICHARDS, D.A.; SHEN, C. Wet periods in northeastern Brazil over the past 210 kyr
linked to distant climate anomalies. Nature, London, v. 432, p. 740-743, 2004.

42
WILLIAMS, C.A.; HANAN, N.; SCHOLES, R.J.; KUTSCH, W. Complexity in water and
carbon dioxide fluxes following rain pulses in an African savanna. Oecologia, New York,
v. 161, n. 3, p. 469–480, 2009.
WILLMOTT, C.J.; ROBESON, S.M.; MATSUURA, K. A refined index of model
performance. International Journal of Climatology, Chichester, v. 32, n. 13, p. 2088–2094,
2012.
ZHONGMIN, H.; GUIRUI, Y.; YANLIAN, Z.; XIAOMIN, S.; YINGNIAN, L.; PEILI, S.;
YANFEN, W.; XIA, S.; ZEMEI, Z.; LI, Z.; SHENGGONG, L. Partitioning of
evapotranspiration and its controls in four grassland ecosystems: application of a two-source
model. Agricultural and Forest Meteorology, Amsterdam, v. 149, n. 9, p. 1410–1420, 2009.

43
3 CAATINGA HYDROLOGY UNDER A CLIMATE CHANGE SCENARIO
Abstract
Given the strong interactions between climate and vegetation, climate change effects
on natural and agricultural ecosystems are a common object of research. Reduced water
availability is predicted to take place in large regions of the globe, including Northeastern
Brazil, a region already vulnerable to droughts. The Caatinga biome, a complex tropical and
water-limited ecosystem, prevails as the main natural forest of this region. The aim of this
study was to examine the soil-water balance for the Caatinga biome in a climate-warming
scenario with reduced rainfall. Climate change projections for the period between 2011 and
2040 were assessed from regional circulation models earlier applied to the Brazilian territory.
A statistical climate data generator was used to compose a synthetic weather dataset in which
rainfall reduction and air temperature increase were linearly incorporated, such that the
maximum changes were reached by the year 2040. The synthetic weather dataset was then
integrated into a hydrological model to assess soil-water balance. Compared to simulations
with current climate for the same Caatinga site, in the scenario with climate change
transpiration was enhanced by 36%, soil evaporation and interception losses reduced by 16%
and 34%, respectively. The amount of precipitation returned to the atmosphere as
evapotranspiration was, on average, 98%. The greatest change in soil water balance
components was observed for deep drainage, accounting only for 2% of the annual rainfall,
followed by top soil water reduction of 38%. Regarding soil water availability, the soil-plant-
atmosphere fluxes seem to be controlled by the top layer (0.0-0.2 m), which provides, on
average, 80% of the total transpiration, suggesting that the Caatinga biome may become
completely soil-water pulse dominated under scenarios of reduced water availability.
Keywords: Semiarid environment; Soil-water; Evapotranspiration; Rainfall reduction
3.1 Introduction
Climate and vegetation interact on temporal and spatial scales and climate is
considered as the main factor determining vegetation distribution (SALAZAR; NOBRE;
OYAMA, 2007). On the other hand, vegetation plays a role in climate as well, mainly on the
regional scale, and replacement of a vegetation type by another will affect evapotranspiration
and other climate factors simultaneously. This process may result directly in land-atmosphere
feedbacks, suggesting that a land-cover change may modify precipitation cycle dynamics, and
thus, play an important role in the water balance of a land surface (JASECHKO et al., 2013;
STERLING; DUCHARNE; POLCHER, 2012).
When predicted climate change scenarios include rainfall reduction and air
temperature increase, soil water content is expected to decrease, thus affecting
evapotranspiration rates. According to Seneviratne et al. (2010), effects of land cover changes
or vegetation dynamics are often associated with modification in the soil moisture regime. If
frequency, duration and severity of droughts increase, as is the case for predicted climatic

44
change scenarios (MARENGO et al., 2012; SENEVIRATNE et al., 2012), this could alter
composition, structure and biogeography of forests in many global regions (ALLEN et al.,
2010).
Drylands cover about 40% of the land surface of the earth. They are characterized by a
low precipitation and a high incidence of drought. Vegetation and atmosphere feedbacks are
especially critical in drylands, mainly due to the tight coupling that exists between water,
energy and biogeochemical budgets (WANG et al., 2012). Therefore, to improve our
understanding of forest-climate interactions in arid and semi-arid zones, an ecosystem
approach might be necessary to assess forest water-use and hydrological limitations in a
warmer and drier climate (KLEIN et al., 2014).
The northeastern part of Brazil contains a large semiarid region, the Caatinga,
representing 12% of the total Brazilian territory. The Caatinga biome prevails as the main
natural forest of this region, a complex tropical and water-limited ecosystem with a wide
variety of both herbaceous and arborescent vegetation, characterized by its ability to cope
with low soil water content ranges (PINHEIRO et al., 2016; PINHEIRO; COSTA; DE
ARAÚJO, 2013). Recently predicted climate changes, assessed by indices from global and
regional climate models like consecutive dry days and soil moisture anomalies, have projected
an increase in air temperature and in duration and intensity of drought in some large regions
of the world. For the semiarid region of Northeastern Brazil, rainfall reductions of up to 40%
and air temperature increase up to 4.0 ºC are predicted by the year 2100 (MARENGO et al.,
2012; SENEVIRATNE et al., 2012).
The Caatinga biome is important to the Brazilian semi-arid region as a whole for its
rich and diverse biota (LEAL et al., 2005). Beyond the role of being a shelter for several
endemic species, the Caatinga biome provides essential services to society such as timber,
forage and watershed protection. Regarding the latter, as the population from the northeastern
part of Brazil is highly dependent on surface water reservoirs, the biome is a key component
for water security. A severe water depletion of the biome is likely when the natural protection
of the watersheds by vegetation would be damaged (PETER et al., 2014). Some specific
issues remain uncertain regarding climate change and its effects on the Caatinga biome water
cycle, such as the fact that the desertification processes may be enhanced as the vegetation
faces higher atmospheric demand in a drier soil (D’ODORICO et al., 2013). With the
objective to study the effects on the hydrology of the Caatinga biome triggered by a climate
change characterized by an increase in air temperature and a reduction of rainfall, we

45
performed a hydrological simulation study focusing on the soil-water balance components of
a representative Caatinga site under possible future scenarios.
3.2 Material and Methods
3.2.1 Study area
The study was conducted for the Aiuaba Experimental Basin (AEB), a 12 km2
integrally-preserved Caatinga watershed (6º42’S; 40º17’W). The AEB is completely located
inside the ecological station of Aiuaba, state of Ceará, Brazil, which is under jurisdiction of
the Brazilian Federal Environmental Institute (IBAMA). Following the Köppen classification
system, the climate is of the BSh type (semi-arid, low latitude and altitude) with an average
annual class-A pan evaporation of 2500 mm. Average annual rainfall is 549 mm, concentrated
in the rainy season between January and May. The monthly average temperatures range from
24ºC to 28ºC. The watershed is covered by dense native vegetation characterized by tree
heights typically between 5 and 12 m. More detailed information can be found in de
Figuereido et al. (2016), Medeiros and de Araújo (2014) and Pinheiro et al. (2016).
Based on previous studies (COSTA et al., 2013; GÜNTNER; BRONSTERT, 2004;
PINHEIRO et al., 2016), the Aiuaba Experimental Basin (AEB) was subdivided in three
parts, each of them characterized by a specific “soil and vegetation association” or SVA
(Figure 3.1). The first association (SVA1), developed in a Lixisol and occupies 20% of the
AEB area. The rooting depth of the vegetation is around 0.8 m. In the second system (SVA2,
34% of the experimental area) the soils are classified as Luvisol and the average rooting depth
is 0.6 m. SVA3 contains a shallow soil (Leptosol) with average rooting depth of 0.4 m,
occupying 46% of the AEB (Figure 3.1).

46
Figure 3.1 – Geographical location of the Aiuaba Experimental Basin (AEB) and subdivision into three Soil and
Vegetation Associations – SVA1, 2 and 3, showing the position of rivers and soil water content
observation locations (TDR)
3.2.2 Climatic data generator – ClimGen
Statistical weather generator software uses existing weather records (baseline data) to
produce long series of synthetic daily climatic data. The statistical properties of the generated
series are expected to be similar to those of the baseline data. We used the Climatic data
generator (ClimGen) developed by Stöckle, Campbell and Nelson (1999). ClimGen does not
use any fixed coefficients optimized from specific weather database, therefore it can be
applied to any location as long as enough information exists to parameterize its code, i.e., 25
years of daily rainfall, 10 years of temperature data, two years of solar radiation data, wind
speed and relative humidity, without missing values. For our simulations, weather data was
reproduced stochastically for the period from 2016 to 2040 for the Aiuaba Experimental
Basin, with baseline data from the period 1990-2015. The synthetically generated daily
weather data consist of rainfall, daily maximum and minimum temperature, solar radiation, air
humidity, and wind speed.
The meteorological baseline data used in the parameterization of ClimGen software
were provided by the Ceará State Foundation of Meteorology and Water Resources
(FUNCEME, www.funceme.br), comprising daily records from the AEB dataset as well as
from a neighboring weather station. According to earlier soil-water balance simulations
(PINHEIRO et al., 2016), the hydrological components do not differ statistically among the

47
three SVA. Nevertheless, SVA1 was chosen for the simulation of climate change scenarios, as
its soil does not contain a shallow stony layer as occurs in SVA2 and SVA3, and it may
therefore provide a more representative picture of the Caatinga hydrology adaptation under
climate change scenarios.
3.2.3 Climate change scenario
Marengo et al. (2012) have assessed the impact of climate change on rainfall and
temperature for different Brazilian regions and periods based on the Eta-CPTEC regional
model driven by four members of an ensemble of the Met Office Hadley Centre Global
Coupled climate model HadCM3. The model ensemble was run according to the SRES A1B
emissions. According to these authors, for mesoscale processes, climate change projections
derived from Regional Climate Models may be considered more representative than
projections derived from Global Climate Models (GCMs), mainly due to the better resolution
which allows improvements in the representation of topography, land use and land-sea
distribution.
Based on that, a climate change projection was selected from the simulations
performed by Marengo et al. (2012) over Brazil. For our purpose, we selected the predicted
changes corresponding to an atmospheric CO2 concentration of 418 ppm by the period 2011-
2040, projected for the São Francisco River Basin. The São Francisco River Basin is
predominantly located in Northeastern Brazil with its middle and lower parts covered mainly
by the Caatinga biome, therefore, representative of the here analyzed site. Under this scenario
and during this period, rainfall is predicted to be reduce by 15% and air temperature is
predicted to increase by 1.5 ºC.
Rainfall reduction and temperature increase were linearly incorporated into a
stochastic weather generator model such that the maximum changes were reached by the year
2040. As the simulation of the synthetic climatic data started in the year 2016, the projected
changes of rainfall and air temperature for the first five years (2011-2015) were considered in
the period 2016-2040. As the stochastic weather generator relies on random numbers, one
hundred stochastic realizations were performed in order to obtain scenarios with more
representativeness. The 100 generated weather datasets were integrated into the hydrological
model SWAP, resulting in 100 water balance simulations for the period.

48
3.2.4 Modeling
Hydrological modeling was performed with the 1-D SWAP model (KROES et al.,
2008). The model simulates water flow and plant growth in a soil-plant-atmosphere
environment. To calculate the water balance terms, the model employs the Richards equation
with a root water extraction sink term:
hSz
hhK
zt
1
(3.1)
In this equation, t is time (d), z is the vertical coordinate (cm, positive upwards), K(h)
is the hydraulic conductivity (cm d-1) and S(h) represents the water uptake by plant roots (d-1).
Equation (3.1) is solved numerically describing the θ-h-K relation by the Mualem–van
Genuchten equations (MUALEM, 1976; VAN GENUCHTEN, 1980). To estimate the sink
term S(h), the reduction function proposed by de Jong van Lier et al. (2008; 2013) was used.
This reduction function includes an implicit compensation mechanism such that uptake
restrictions in drier layers is compensated by increased uptake from wetter parts of the rooted
soil profile.
Simulations with SWAP were based on a parameterization of vegetation (leaf area
index, crop factor, root length density and interception losses) and soil hydraulic properties
performed by Pinheiro et al. (2016) for the Aiuaba Experimental Basin. Regarding the crop
factor (Kc), Pinheiro et al. (2016) developed equation (3.2) based on the modeling of plant
growth:
23.01
)(1
kLAI
vsvc
eK
(3.2)
where αv is the vegetation albedo; αs is the surface soil albedo; k is the light extinction
coefficient and LAI is the leaf area index. Values of αv, αs were assumed constant over time
and estimated using satellite images. The light extinction coefficient (k) was assumed constant
as well and fixed to the value of 0.75 (GOURDIAAN; VAN LAAR, 1994).
For a seasonal forest like Caatinga, LAI values are not constant over time. Pinheiro et
al. (2016) found a strong correlation between LAI estimated from satellite images and the
mean soil water pressure head in the 15-day period before the satellite imaging. However, for
future scenarios no soil water content dataset is available and forecasting the Caatinga leaf
area index would be cumbersome.
49
We opted to establish a correlation between LAI measurements obtained from satellite
images and the rainfall in a period of p days before the satellite imaging. Daily rainfall (R)
was weighed by a factor defined according to a sine function, making rainfall amounts in
the middle of the period (at d = p/2) of highest weight and at the beginning and end (at d = 0
and d = p) of zero weight:
p
d
p
d
pd
p
pd
pR
1
1
4
2sin1
4
2sin1
(3.3)
The highest correlation between LAI and η was found for p = 31 days, and resulted in the
equation (3.4) with coefficient of determination of 0.95:
4252.04188.0 LAI (3.4)
The LAI estimated by equation (3.4) has the same order of magnitude as the estimates carried
out by Pinheiro et al. (2016) using soil pressure head.
SWAP simulated the following water balance components: actual transpiration (T),
actual soil evaporation (E), interception losses (IL) and deep drainage (D). T+E+IL will be
referred to as ET.
3.3 Results and Discussion
3.3.1 ClimGen outputs
The 100 stochastic daily rainfall series simulated by ClimGen for each year for the
period 2016-2040 resulted in total annual rainfall ranging from 133-1142 mm with an annual
average of 473 mm and an average standard deviation of 129 mm (Figure 3.2). This figure
shows the simulated trend of rainfall reduction as well. For the baseline climate period (1990-
2015), annual rainfall ranged from 221-1266 mm with an average of 518 mm.
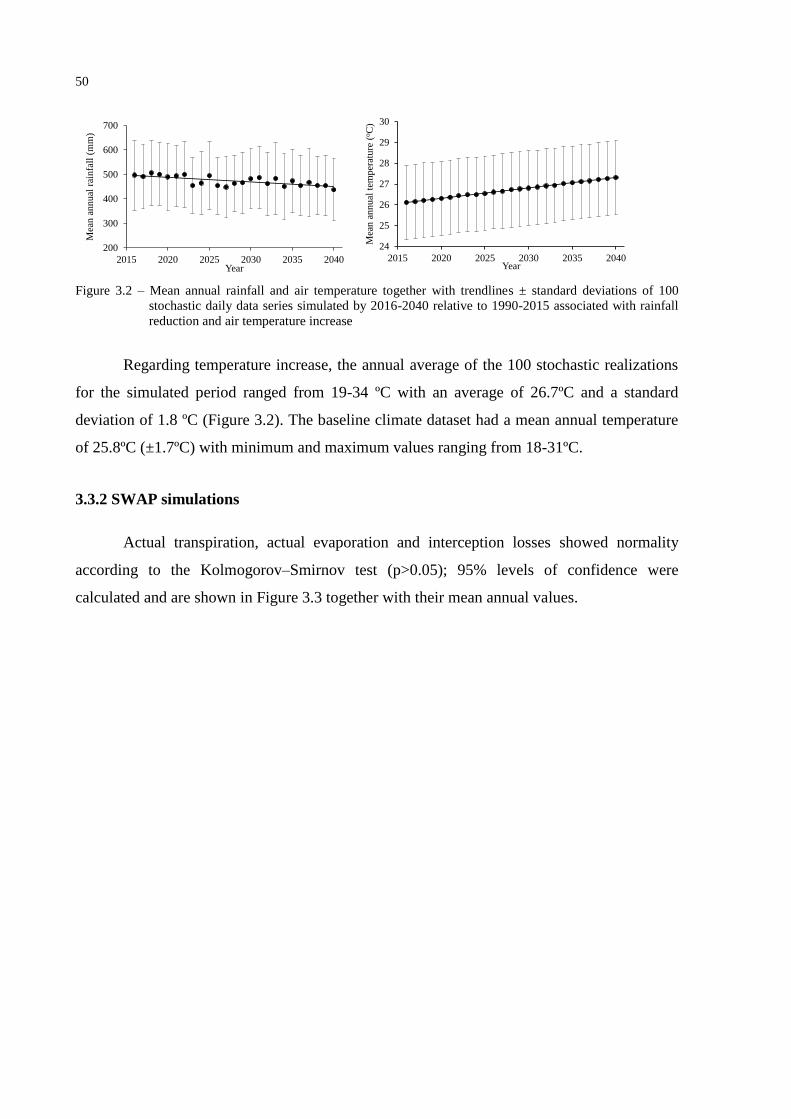
50
Figure 3.2 – Mean annual rainfall and air temperature together with trendlines ± standard deviations of 100
stochastic daily data series simulated by 2016-2040 relative to 1990-2015 associated with rainfall
reduction and air temperature increase
Regarding temperature increase, the annual average of the 100 stochastic realizations
for the simulated period ranged from 19-34 ºC with an average of 26.7ºC and a standard
deviation of 1.8 ºC (Figure 3.2). The baseline climate dataset had a mean annual temperature
of 25.8ºC (±1.7ºC) with minimum and maximum values ranging from 18-31ºC.
3.3.2 SWAP simulations
Actual transpiration, actual evaporation and interception losses showed normality
according to the Kolmogorov–Smirnov test (p>0.05); 95% levels of confidence were
calculated and are shown in Figure 3.3 together with their mean annual values.
24
25
26
27
28
29
30
2015 2020 2025 2030 2035 2040
Mea
n a
nnual
tem
per
ature
(oC
)
Year
200
300
400
500
600
700
2015 2020 2025 2030 2035 2040
Mea
n a
nnual
rai
nfa
ll (
mm
)
Year

51
Figure 3.3 – Mean annual actual transpiration, actual soil evaporation and interception losses with their 95%
confidence levels and trendlines
200
210
220
230
240
250
260
270
280
290
2015 2020 2025 2030 2035 2040
Mea
n a
nn
ual
tra
nsp
irat
ion
(m
m)
45
47
49
51
53
55
57
59
61
63
2015 2020 2025 2030 2035 2040
Mea
n a
nn
ual
in
terc
epti
on
(m
m)
Year
130
135
140
145
150
155
160
165
170
175
2015 2020 2025 2030 2035 2040
Mea
n a
nn
ual
so
il e
vap
ora
tio
n (
mm
)

52
Based on the 95% levels of confidence, T, E and IL for the year 2040 are predicted to
be between the interval of 212-241 mm, 139-149 mm and 48-53 mm, respectively. Therefore,
in order to obtain a positive year-based water budget, annual rainfall should be higher than
443 mm. A lower amount of rainfall would make the vegetation either to increase stomatal
resistance, to reduce transpiration or to further deplete soil-water stocks from previous years,
enhancing soil drought and possibly leading to mortality of certain species as suggested by
Choat et al. (2012) and Raz-Yaseef et al. (2010). Comparing the future predictions to the
simulations carried out by Pinheiro et al. (2016) with measured weather data for the Caatinga
biome, on average actual transpiration increased by 36%, actual soil evaporation and
interception losses decreased by 16% and 34%, respectively. As pointed out by Jasechko et al.
(2013), biological fluxes (transpiration) play a bigger role in water fluxes than physical fluxes
(evaporation). This is expected because plant roots are able to take up stored soil-water and
moving deeper sources of water to the atmosphere, whereas evaporation is only effective for
water at or near the soil surface.
According to Ohmura and Wild (2002), the trend of evaporation rates under a
warming climate scenario is unclear. Class A Pan measurements (PETERSON; GOLUBEV;
GROISMAN, 1995) and simulations by global circulation models (WILD; OHMURA;
CUBASCH, 1997) have revealed a reducing tendency, which would be related to an increase
in the terrestrial water flux correlating to an increasing air humidity, or due to changes in
radiation intensity or in strength of air circulations.
The amount of precipitation that returns to the atmosphere as actual
evapotranspiration, ET, (through T, E and IL) for the whole simulated period at the studied
site was, on average, 98% (± 8.3%), which is 23% higher than the values simulated by
Pinheiro et al. (2016) in the period 2004-2012 for the same site. Lauenroth et al. (2014)
investigated the water balance of dry regions and found that 96 to 98% of total precipitation
returned to atmosphere as ET for shallow-rooted sites, which are dependent on water-pulse
dynamics. For the Caatinga biome, an ET greater than the annual rainfall corresponded to
years with a rainfall amount below the long-term average preceded by years with rainfall
above the long-term average. This can be explained by the depletion of soil-water stored from
the year before. For the analyzed period, the average fraction ± standard deviation of total
water use by T was 54% (±4%), E 34% (±4%) and IL 12% (±1%).
The observed behavior of the actual transpiration over the simulated period can be
explained by the simulated changes in air temperature and rainfall. However, due to the
diversity of plant species in the Caatinga biome, different plant responses to drought stress are
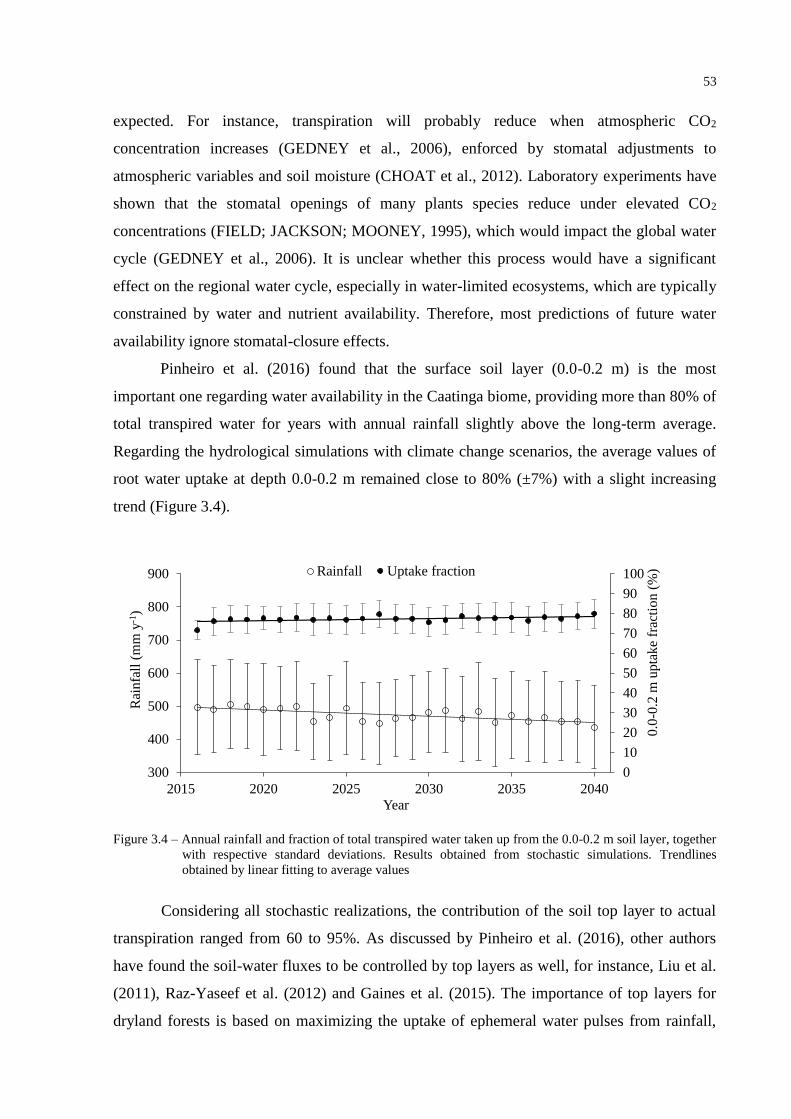
53
expected. For instance, transpiration will probably reduce when atmospheric CO2
concentration increases (GEDNEY et al., 2006), enforced by stomatal adjustments to
atmospheric variables and soil moisture (CHOAT et al., 2012). Laboratory experiments have
shown that the stomatal openings of many plants species reduce under elevated CO2
concentrations (FIELD; JACKSON; MOONEY, 1995), which would impact the global water
cycle (GEDNEY et al., 2006). It is unclear whether this process would have a significant
effect on the regional water cycle, especially in water-limited ecosystems, which are typically
constrained by water and nutrient availability. Therefore, most predictions of future water
availability ignore stomatal-closure effects.
Pinheiro et al. (2016) found that the surface soil layer (0.0-0.2 m) is the most
important one regarding water availability in the Caatinga biome, providing more than 80% of
total transpired water for years with annual rainfall slightly above the long-term average.
Regarding the hydrological simulations with climate change scenarios, the average values of
root water uptake at depth 0.0-0.2 m remained close to 80% (±7%) with a slight increasing
trend (Figure 3.4).
Figure 3.4 – Annual rainfall and fraction of total transpired water taken up from the 0.0-0.2 m soil layer, together
with respective standard deviations. Results obtained from stochastic simulations. Trendlines
obtained by linear fitting to average values
Considering all stochastic realizations, the contribution of the soil top layer to actual
transpiration ranged from 60 to 95%. As discussed by Pinheiro et al. (2016), other authors
have found the soil-water fluxes to be controlled by top layers as well, for instance, Liu et al.
(2011), Raz-Yaseef et al. (2012) and Gaines et al. (2015). The importance of top layers for
dryland forests is based on maximizing the uptake of ephemeral water pulses from rainfall,
0
10
20
30
40
50
60
70
80
90
100
2015 2020 2025 2030 2035 2040
300
400
500
600
700
800
900
Rai
nfa
ll (
mm
y-1
)
Year
0.0
-0.2
m u
pta
ke
frac
tio
n (
%)Rainfall Uptake fraction

54
together with an optimization of nutrient cycling (ADIKU et al., 2000; JACKSON et al.,
2000; BUCCI et al., 2009). Under drier conditions, however, an increase in water extraction
from deeper layers may be expected rather than maintenance of the predominance of shallow
root water uptake. However, apparently the Caatinga water balance not only depends on
rainfall amount, but also on temporal rainfall distribution. The Caatinga vegetation has a
shallow and laterally spread root system (PINHEIRO; COSTA; DE ARAÚJO, 2013)
enhancing the importance of the top layer and indicating that the water regime of this
ecosystem is water pulse rather than storage dominated. According to Lauenroth et al. (2014),
ecosystems dominated by soil-water storage are likely to be more harmed by water shortage
enhanced by increased temperature, higher evapotranspiration demand, and decreased rainfall,
than ecosystems with soil water dynamics that depend on pulsed soil-water patterns.
The temporal pattern of the monthly soil water content for the surface layer (0.0-0.2
m) shows a high correlation to the monthly rainfall pattern, with a large temporal variability
on the yearly scale grouped into periods (Figure 3.5). The highest monthly soil water contents
were observed between February and April (rainy season) and the lowest values between July
and December (dry season). The average value for the whole simulated period
was 0.15 m3 m-3 (±0.039), while the average measured soil water content during the analyzed
period 2004-2012 at depth 0-0.2 m was 0.24 m3 m-3 (see details in PINHEIRO et al., 2016).
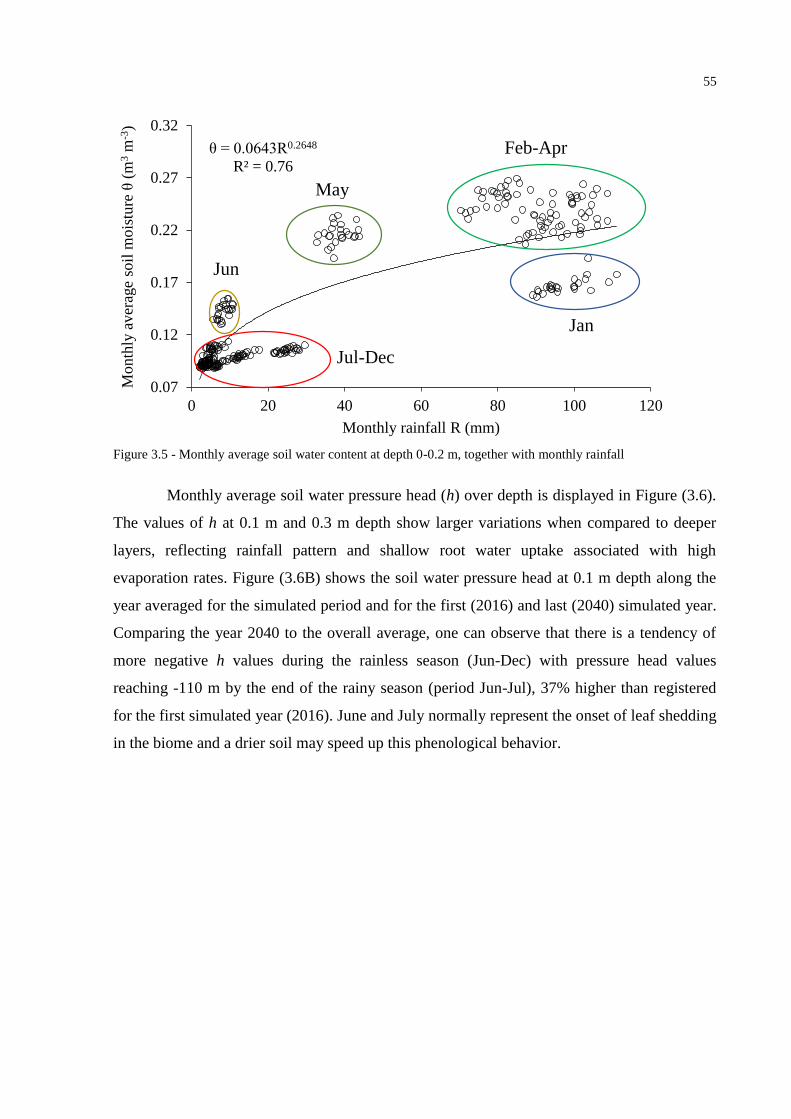
55
Figure 3.5 - Monthly average soil water content at depth 0-0.2 m, together with monthly rainfall
Monthly average soil water pressure head (h) over depth is displayed in Figure (3.6).
The values of h at 0.1 m and 0.3 m depth show larger variations when compared to deeper
layers, reflecting rainfall pattern and shallow root water uptake associated with high
evaporation rates. Figure (3.6B) shows the soil water pressure head at 0.1 m depth along the
year averaged for the simulated period and for the first (2016) and last (2040) simulated year.
Comparing the year 2040 to the overall average, one can observe that there is a tendency of
more negative h values during the rainless season (Jun-Dec) with pressure head values
reaching -110 m by the end of the rainy season (period Jun-Jul), 37% higher than registered
for the first simulated year (2016). June and July normally represent the onset of leaf shedding
in the biome and a drier soil may speed up this phenological behavior.
θ = 0.0643R0.2648
R² = 0.76
0.07
0.12
0.17
0.22
0.27
0.32
0 20 40 60 80 100 120
Mo
nth
ly a
ver
age
soil
mo
istu
re θ
(m3
m-3
)
Monthly rainfall R (mm)
May
Feb-Apr
Jun
Jul-Dec
Jan

56
Figure 3.6 – Average monthly soil water pressure head (h) of 100 realizations at four depths (0.1; 0.3; 0.6 and
0.8 m) together with monthly rainfall (A). Soil water pressure head at 0.1 m depth along the year,
average for the simulated period and first (2016) and last (2040) simulated year (B)
The canopy of the Caatinga biome and soil moisture dynamics allow the development
of understory vegetation. Such understory composed of very shallow-rooted herbaceous
plants quickly dries at the end of rainy season and together with the leaf shedding behavior of
overstory vegetation and coarse woody debris yields a thick layer of potential ground fuel.
The depletion of soil water content in the root zone due to higher evapotranspiration demands
may increase the risk of forest fires (WARING; COOPS, 2016). Krueger et al. (2015) found
that low soil moisture strongly affects wildfires across the Southern Great Plains of United
States. Projections of a warming climate and rainfall reduction would reduce the soil water
content of the Caatinga biome and increase wildfire occurrence.
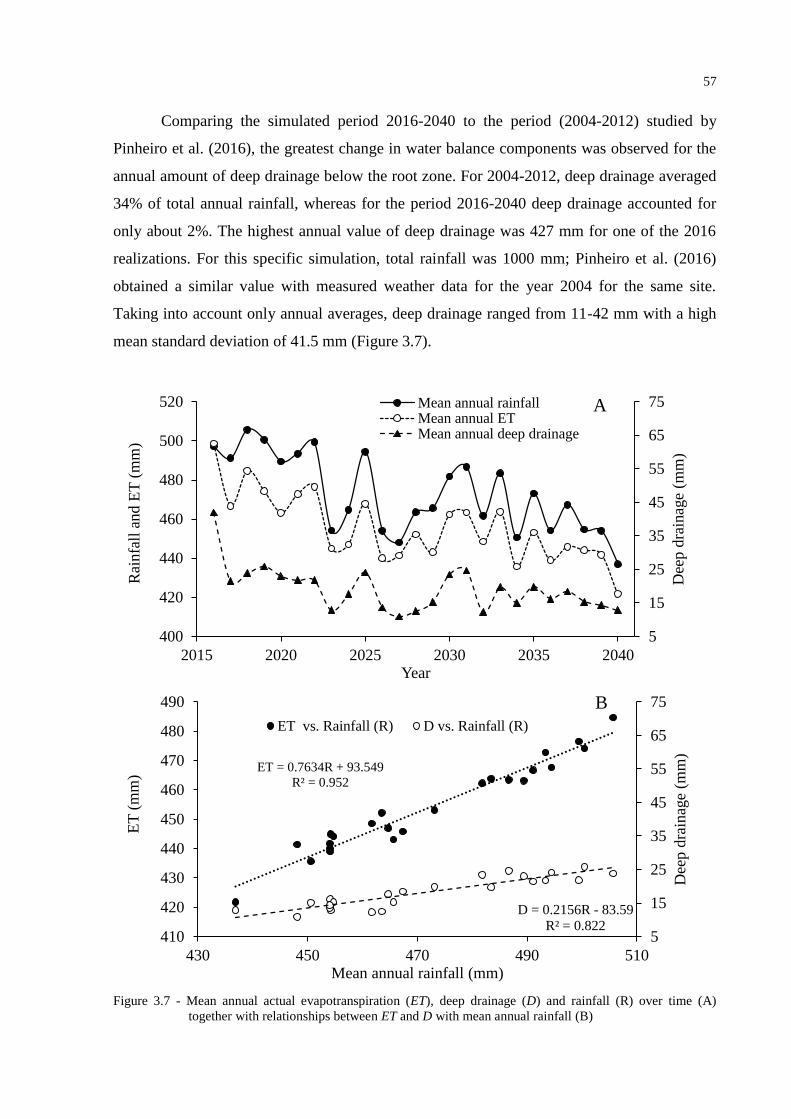
57
Comparing the simulated period 2016-2040 to the period (2004-2012) studied by
Pinheiro et al. (2016), the greatest change in water balance components was observed for the
annual amount of deep drainage below the root zone. For 2004-2012, deep drainage averaged
34% of total annual rainfall, whereas for the period 2016-2040 deep drainage accounted for
only about 2%. The highest annual value of deep drainage was 427 mm for one of the 2016
realizations. For this specific simulation, total rainfall was 1000 mm; Pinheiro et al. (2016)
obtained a similar value with measured weather data for the year 2004 for the same site.
Taking into account only annual averages, deep drainage ranged from 11-42 mm with a high
mean standard deviation of 41.5 mm (Figure 3.7).
Figure 3.7 - Mean annual actual evapotranspiration (ET), deep drainage (D) and rainfall (R) over time (A)
together with relationships between ET and D with mean annual rainfall (B)
5
15
25
35
45
55
65
75
400
420
440
460
480
500
520
2015 2020 2025 2030 2035 2040
Dee
p d
rain
age
(mm
)
Rai
nfa
ll a
nd
ET
(m
m)
Year
Mean annual rainfallMean annual ETMean annual deep drainage
ET = 0.7634R + 93.549
R² = 0.952
D = 0.2156R - 83.59
R² = 0.8225
15
25
35
45
55
65
75
410
420
430
440
450
460
470
480
490
430 450 470 490 510
Dee
p d
rain
age
(mm
)
ET
(m
m)
Mean annual rainfall (mm)
ET vs. Rainfall (R) D vs. Rainfall (R)
A
B

58
A reduction of the amount of deep drainage, as predicted, would represent an increase
in problems related to soil salinity. This would be especially impacting for the Caatinga
biome, a naturally salinization prone ecosystem due to its geological formation (shallow soils
on crystalline basement) together with water scarcity. In a drier soil, the vegetation will
experience higher salt concentration than in a wet soil. With a higher atmospheric water
demand and a 98% fraction of precipitation being used for ET, there will be insufficient
downward water flow to leach salts out of the soil profile. The combination of salt and water
stress could be very damaging to the biome, provoking modifications in vegetation
composition and, perilously, desertification. Although the water table is located several
meters below the river bed (DE FIGUEIREDO et al., 2016) making capillary rise irrelevant,
salts can be introduced in the root zone by rain itself and by weathering of rocks
(D’ODORICO et al., 2013). Even at low rates, the increase of salt concentrations in the
surface layer could impact the ecosystem, which currently depends on shallow soil water. A
shift in plant community composition (e.g., encroachment and decrease in vegetation cover)
and a loss of ecosystem productivity would be a natural consequence.
Our modeling approach pinpointed important features concerning reduction in water
availability for the Caatinga biome, taking into account the water balance at ecosystem scale;
therefore, our results may provide a big picture of the likelihood of threats to the ecosystem
brought about by climate change. Nonetheless, predictions about the response of individual
species in the Caatinga to future climate change rely on details at species level. To improve
predictions of drought related vulnerability of forests, according to Choat et al. (2012), a
better understanding of quantitative physiological mechanisms governing drought stress
together with hydrological modeling is needed. The Caatinga biome shows a remarkable
capacity to cope with low soil-water ranges, with matric potentials dropping below -150 m
during dry seasons that last up to nine months (PINHEIRO et al., 2016). A further decrease in
water availability, however, would trigger the replacement of prevailing species by pre-
adapted individuals already present within the population (KELLY et al., 2003). Biomes with
substantial variability for the traits that regulate the species responses to climate are likely to
show greater tolerance to climate changes. Although genetic response of vegetation to climate
change may play an important role in selection pressure of individuals, when environmental
variation occurs on a timescale shorter than the life of the plant, any response must be in
terms of a plastic phenotype (JUMP; PEÑUELAS, 2005, and references cited therein). These
responses alter plants productivity through both growth (photosynthesis and biomass
59
accumulation) and development (phenological and morphological responses) (CHALLINOR
et al., 2016).
3.4 Conclusions
From the soil-water balance simulations applied to the Caatinga biome, including a
climatic change over the period 2016-2040, we conclude that:
1. Based on 95% levels of confidence, in order to obtain a positive year-based water budget,
annual rainfall should be higher than 443 mm.
2. Compared to simulations with current climate, climate change will lead to an increase of
actual transpiration of 36%, and a decrease of 16% and 34% for soil evaporation and
interception losses, respectively, whereas the amount of precipitation returned to the
atmosphere as evapotranspiration was predicted to reach, on average, 98%.
3. The greatest change in water balance components under the simulated climate change was
predicted for deep drainage, accounting only for 2% of the annual rainfall, followed by top
soil water reduction of 38%.
4. Regarding soil water availability, the soil-plant-atmosphere fluxes seem to be controlled by
the top layer (0.0-0.2 m), which provides, on average, 80% of the total transpiration,
suggesting that the Caatinga biome may become completely soil-water pulse dominated under
scenarios of reduced water availability.
References
ADIKU, S.G.K.; ROSE, C.W.; BRADDOCK, R.D.; OZIER-LAFONTAINE, H. On the
simulation of root water extraction: examination of a minimum energy hypothesis. Soil
Science, Philadelphia, v. 165, n. 3, p. 226-236, 2000.
ALLEN, C.D.; MACALADY, A.K.; CHENCHOUNI, H.; BACHELET, B.; MCDOWELL,
N.; VENNETIER, M.; KITZBERGER, T.; RIGLING, A.; BRESHEARS, D.D.; HOGG, E.H.;
GONZALEZ, P.; FENSHAM, R.; ZHANGM, Z.; CASTRO, J.; DEMIDOVA, N.; LIM, J.H.;
ALLARD, G.; RUNNING, S.W.; SEMERCI, A.; COBB, N. A global overview of drought
and heat-induced tree mortality reveals emerging climate change risks for forests. Forest
ecology and management, Amsterdam, v. 259, n. 4, p. 660-684, 2010.
BUCCI, S.J.; SCHOLZ, F.G.; GOLDSTEIN, G.; MEINZER, F.C.; ARCE, M.E. Soil water
availability and rooting depth as determinants of hydraulic architecture of Patagonian woody
species. Oecologia, New York, v. 160, n. 4, p. 631-641, 2009.
CHALLINOR, A.J.; KOEHLER, A.K.; RAMIREZ-VILLEGAS, J.; WHITFIELD, S.; DAS,
B. Current warming will reduce yields unless maize breeding and seed systems adapt
immediately. Nature Climate Change, London, 2016. In press.
60
CHOAT, B.; JANSEN, S.; BRODRIBB, T.J.; COCHARD, H.; DELZON, S.; BHASKAR, R.;
BUCCI, S.J.; FEILD, T.S.; GLEASON, S.M.; HACKE, U.G.; JACOBSEN, A.L.; LENS, F.;
MAHERALI, H.; MARTÍNEZ-VILALTA, J.; MAYR, S.; MENCUCCINI, M.; MITCHELL,
P.J.; NARDINI, A.; PITTERMANN, J.; PRATT, R.B.; SPERRY, J.S.; WESTOBY, M.;
WRIGHT, I.J.; ZANNE, A.E. Global convergence in the vulnerability of forests to drought.
Nature, London, v. 491, p. 752–755, 2012.
COSTA, C.A.G.; LOPES, J.W.B.; PINHEIRO, E.A.R.; DE ARAÚJO, J.C.; GOMES FILHO,
R.R. Spatial behaviour of soil moisture in the root zone of the Caatinga biome. Revista
Ciência Agronômica, Fortaleza, v. 44, n. 4, p. 685-694, 2013.
D’ODORICO, P.; BHATTACHAN, A.; DAVIS, K.F.; RAVI, S.; RUNYAN, C.W. Global
desertification: drivers and feedbacks. Advances in Water Resources, Kidlington, v. 51,
p. 326-344, 2013.
DE FIGUEIREDO, J.V.; DE ARAÚJO, J.C.; MEDEIROS, P.H.A.; COSTA, A.C. Runoff
initiation in a preserved semiarid Caatinga small watershed, Northeastern Brazil.
Hydrological Processes, Chichester, 2016. In press.
DE JONG VAN LIER, Q.; VAN DAM, J.C.; DURIGON, A.; DOS SANTOS, M.A.;
METSELAAR, K. Modeling water potentials and flows in the soil-plant system comparing
hydraulic resistances and transpiration reduction functions. Vadose Zone Journal, Madison,
v. 12, n. 3, p. 1-20, 2013.
DE JONG VAN LIER, Q.; VAN DAM, J.C.; METSELAAR, K.; DE JONG, R.;
DUIJNISVELD, W.H.M. Macroscopic root water uptake distribution using a matric flux
potential approach. Vadose Zone Journal, Madison, v. 7, n. 3, p. 1065-1078, 2008.
FIELD C.B.; JACKSON, R.B.; MOONEY, H.A Stomatal responses to increased CO2:
implications from the plant to the global-scale. Plant, Cell and Environment, Malden, v. 18,
n. 10, p. 1214-1225, 1995.
GAINES, K.P.; STANLEY, J.W.; MEINZER, F.C.; MCCULLOH, K.A.; WOODRUFF,
D.R.; CHEN, W.; ADAMS, T.S.; LIN, H.; EISSENSTAT, D.M. Reliance on shallow soil
water in a mixed-hardwood forest in central Pennsylvania. Tree Physiology, Oxford, v. 00,
p. 1-15, 2015.
GEDNEY, N.; COX, .PM.; BETTS, R.A.; BOUCHER, O.; HUNTINGFORD, C.; STOTT, A.
Detection of a direct carbon dioxide effect in continental river runoff records. Nature,
London, v. 439, p. 835-838, 2006.
GOURDIAAN, J.; VAN LAAR, H.H. Modelling potential crop growth processes. 2nd ed.
Wageningen: Kluwer Academic, 1994. 238 p.
GÜNTNER, A.; KROL, M.; DE ARAÚJO, J.C.; BRONSTERT, A. Simple water balance
modeling of surface reservoir systems in a large data-scarce semiarid region. Hydrological
Sciences Journal, Wallingford, v. 49, n. 5, p. 901-918, 2004.

61
JACKSON, R.B.; SPERRY, J.S.; DAWSON, T.E. Root water uptake and transport: using
physiological processes in global predictions. Trends in Plant Science, London, v. 5, n. 11,
p. 482-488, 2000.
JASECHKO, S.; SHARP, Z.D.; GIBSON, J.J.; BIRKS, S.J.; YI ,Y.; FAWCETT, P.J.
Terrestrial water fluxes dominated by transpiration. Nature, London, v. 496, p. 347-350,
2013.
JUMP, A.; PEÑUELAS, J. Running to stand still: adaptation and response of plants to rapid
climate change. Ecology Letters, Malden, v. 8, n. 9, p. 1010-1020, 2005.
KELLY, C.K.; CHASE, M.W.; DE BRUIJN, A.; FAY, M.F.; WOODWARD, F.I.
Temperature-based population segregation in birch. Ecology Letters, Malden, v. 6, n. 2, p. 1–
3, 2003.
KLEIN, T.; YAKIR, D.; BUCHMANN, N.; GRÜNZWEIG, J.M. Towards an advanced
assessment of the hydrological vulnerability of forests to climate change-induced drought.
New Phytologist, Malden, v. 201, n. 3, p. 712-716, 2014.
KROES, J.G; VAN DAM, J.C.; GROENENDIJK, P.; HENDRIKS, R.F.A.; JACOBS, C.M.J.
SWAP version 3.2: theory description and user manual. Wageningen: Alterra, 2008. 262 p.
(Alterra Report, 1649).
KRUEGER, E.S, OCHSNER TE, ENGLE DM, CARLSON JD, TWIDWELL D,
FUHLENDORF SD. Soil moisture affects growing-season wildfire size in the Southern great
plains. Soil Science Society of America Journal, Madison, v. 79, p. 1567-1576, 2015.
LAUENROTH, W.K.; SCHLAEPFER, D.R.; BRADFORD, J.B. Ecohydrology of dry
regions: storage versus pulse soil water dynamics. Ecosystems, New York, v. 17, n. 8,
p. 1469–1479, 2014.
LEAL, I.R; DA SILVA, J.M.C.; TABARELLI, M.; LACHER JR, T.E. Changing the course
of biodiversity conservation in the Caatinga of Northeastern Brazil. Conservation Biology,
Malden, v. 19, n. 3, p. 701-706, 2005.
MARENGO, J.A.; CHOU, S.C.; KAY, G.; ALVES, L.M.; PESQUERO, J.F.; SOARES,
W.R.; SANTOS, D.C.; LYRA, A.A.; SUEIRO, G.; BETTS, R.; CHAGAS, D.J.; GOMES,
J.L.; BUSTAMENTE, J.F.; TAVARES, P. Development of regional future climate change
scenarios in South America using the Eta CPTEC/HadCM3 climate change projections:
climatology and regional analyses for the Amazon, São Francisco and the Paraná River
basins. Climate Dynamics, New York, v. 38, n. 9, p. 1829–1848, 2012.
MEDEIROS, P.H.A.; DE ARAÚJO J.C. Temporal variability of rainfall in a semiarid
environment in Brazil and its effect on sediment transport processes. Journal of Soils and
Sediments, Heidelberg, v. 14, n.7, p. 1216-1223, 2014.
MUALEM, Y. A New model for predicting the hydraulic conductivity of unsaturated porous
media. Water Resources Research, Washington, v. 12, n. 3, p. 513-522, 1976.

62
OHMURA, A.; WILD, M. Is the hydrological cycle accelerating? Science, Washington,
v. 298, p. 1345-1346, 2002.
PETER, A.J.; DE ARAÚJO, J.C.; ARAÚJO, N.A.M.; HERMANN, H.J. Flood avalanches in
a semiarid basin with a dense reservoir network. Journal of Hydrology, Amsterdam, v. 512,
p. 408-420, 2014.
PETERSON, T.C.; GOLUBEV, V.S.; GROISMAN, P.Y. Evaporation losing its strength.
Nature, London, v. 377, p. 687-688, 1995.
PINHEIRO, E.A.R.; COSTA, C.A.G.; DE ARAÚJO, J.C. Effective root depth of the
Caatinga biome. Journal of Arid Environments, London, v. 89, p. 1-4, 2013.
PINHEIRO, E.A.R.; METSELAAR, K.; DE JONG VAN LIER, Q.; DE ARAÚJO, J.C.
Importance of soil water to the Caatinga biome, Brazil. Ecohydrology, Hoboken, 2016. In
press.
RAZ-YASEEF, N.; YAKIR, D.; ROTENBERG, E.; SCHILLER, G.; COHEN, S.
Ecohydrology of a semi-arid forest: partitioning among water balance and its components
implications for predicted precipitation changes. Ecohydrology, Hoboken, v. 3, n.2, p. 143–
154, 2010.
RAZ-YASEEF, N.; YAKIR, D.; SCHILLER, G.; COHEN, S. Dynamics of
evapotranspiration partitioning in a semi-arid forest as affected by temporal rainfall patterns.
Agricultural and Forest Meteorology, Amsterdam, v. 157, p. 77-85, 2012.
SALAZAR, L.F.; NOBRE, C.A.; OYAMA, M.D. Climate change consequences on the biome
distribution in tropical South America. Geophysical Research Letters, Washington, v. 34,
n. 9, p. 1-6, 2007.
SENEVIRATNE, S.I.; NICHOLLS, N.; EASTERLING, D.; , GOODESS, C.M.; KANAE, S.;
KOSSIN, J.; LUO, Y.; MARENGO, J.; MCINNES, K.; RAHIMI, M.; REICHSTEIN, M.;
SORTEBERG, A.; VERA, C.; ZHANG, X. Changes in climate extremes and their impacts on
the natural physical environment. In: FIELD, C.B., BARROS, V.; STOCKER, T.F.; QIN, D.;
DOKKEN, D.J.; EBI, K.L.; MASTRANDREA, M.D.; MACH, K.J.; PLANTTNER, G.-K,
ALLEN, S.K.; TIGNOR, M.; MIDGLEY, P.M. (Ed.). Managing the risks of extreme events
and disasters to advance climate change adaptation: a special report of Working Groups I
and II of the Intergovernmental Panel on Climate Change (IPCC). Cambridge; New York:
Cambridge University Press, 2012. p. 109-230.
SENEVIRATNE, S.L.; CORTI, T.; DAVIN, E.L.; HIRSCHI, M.; JAEGER, E.B.; LEHNER,
I.; ORLOWSKY, B.; TEULING, A.J. Investigating soil moisture–climate interactions in a
changing climate: a review. Earth-Science Reviews, Amsterdam, v. 99, n. 3/4, p. 125–161,
2010.
STERLING, S.M.; DUCHARNE, A.; POLCHER, J. The impact of global land-cover change
on the terrestrial water cycle. Nature Climate Change, London, v. 3, p. 385-390, 2013.
STÖCKLE, C.O., G.S. CAMPBELL, R. NELSON. ClimGen manual. Washington: Pullman,
1999. 28 p. (Washington State University, Biological Systems Engineering Department).
63
VAN GENUCHTEN, MT. A closed-form equation for predicting the hydraulic conductivity
of unsaturated soils. Soil Science Society of America Journal, Madison, v. 44, n. 5, p. 892-
898, 1980.
WANG, L.; D’ODORICO, P.; EVANS, J.P.; ELDRIDGE, D.J.; MCCABE, M.F.; CAYLOR,
K.K.; KING, E.G. Dryland ecohydrology and climate change: critical issues and technical
advances. Hydrology and Earth System Sciences, Gottingen, v. 16, p. 2585–2603, 2012.
WARING, R.H.; COOPS, N.C. Predicting large wildfires across western North America by
modeling seasonal variation in soil water balance. Climatic Change, Dordrecht, v. 135, n. 2,
p. 325-339, 2016.
WILD, M.; OHMURA, A.; CUBASCH, U. GCM simulated surface energy fluxes in climate
change experiments. Journal of Climate, Boston, v. 10, p. 30933110, 1997.

64

65
4 A MATRIC FLUX POTENTIAL APPROACH TO ASSESS WATER
AVAILABILITY APPLIED TO SOME BRAZILIAN SOILS
Abstract
Predicting soil water availability to plants is important for agricultural and ecological
models. Models that explicitly take into account root water uptake and transpiration reduction
describe the ability of soil to supply water to plants based on soil hydraulic properties that
depend on soil water content. The objective of this study was to evolve an existing single-
layer root water uptake model based on matric flux potential to allow for multi-layer
scenarios; and to illustrate its functionality using soil hydraulic properties from layered soils
from two agro-ecological zones in Brazil: a semiarid zone and a sub-humid zone. For each
soil layer, the hydraulic properties were determined by inverse modeling of laboratory
evaporation experiment data for the pressure head range between -1.5 and -165 m. The water
supplying capacities were evaluated using the multi-layer root water uptake model. Soils from
the semiarid zone were able to deliver water to plants at potential rates over a wide range of
bulk soil pressure head (-36 to -148 m). On the other hand, the soils from the sub-humid zone
showed more hydraulic limitations. Their limiting soil water condition was wetter than the
range of pressure heads for which parameters were determined. For the analyzed soils, a
negligible increase in available water results from decreasing the root water potential
below -150 m. It is therefore reasonable to expect that, in order to adapt to water-limited
conditions, plant species will invest in other adaptive strategies, rather than spend energy in
structures that allow a reduction of the lower suction limit in their root tissues.
Keywords: Climatic zone; Pressure head; Caatinga biome; Hydraulic conductivity
4.1 Introduction
Hydraulic properties determine the ability of soils to supply water to plants. The
ability of a soil to provide transpirable water to plants under dry conditions is crucial in the
establishment and maintenance of natural vegetation, especially when dealing with drought-
prone ecosystems. In agricultural areas, a less negative limiting pressure head results in higher
rainfed yields, whereas in irrigated agriculture it implies a lower cost to obtain optimized
yields. Assessment of soil-water dynamic availability to plants over depth, especially in dry
regions, is necessary to evaluate strengths and restrictions of ecosystems given the expected
increase in water limitation due to environmental changes projected to occur on some large
regions of the globe (KLEIN et al., 2014b; SENEVIRATNE et al., 2012). According to
Marengo et al. (2012), the whole Brazilian territory is likely to face rainfall reductions and
higher temperatures in the coming years. Hence, it may pose a threat to natural ecosystems
productivity and to rainfed crops grown in soils with limited water supplying capacity.
Soil hydraulic properties together with limiting crop water potentials allow to
characterize crop water stress by predicting the threshold value of water content or pressure

66
head that delimits the constant and falling water uptake rate phase (DE JONG VAN LIER et
al., 2013; RAATS, 2007). Therefore, the assessment of soil water availability combines a
theoretical root water uptake model with soil hydraulic properties (DE JONG VAN LIER et
al., 2013; DURIGON et al., 2011; IDEN et al., 2015; ŠIMUNEK et al., 1998). One such
model was developed by De Jong van Lier et al. (2006), who proposed an equation to
calculate the limiting matric flux potential Mlim (threshold value between constant and falling
rate phase) for a given transpiration rate and root length density in a single-layer soil.
Matric flux potential is a composite quantity combining hydraulic conductivity and
pressure head. The relation between these hydraulic properties can be determined from field
and laboratory experiments using direct methods or inverse modeling techniques. Gardner and
Miklich (1962) developed a laboratory method for the simultaneous measurement of retention
and unsaturated hydraulic conductivity. Their method was modified by Wind (1968) who
proposed an iterative graphical procedure to decrease deviations in readings. Wendroth et al.
(1993) proposed the use of different evaporation rates to overcome problems of small
hydraulic gradients near saturation. The implementation of any of these methods usually relies
on water-filled tensiometers with a limited range of operation. For the determination of
hydraulic conductivity in the dry soil, at pressure heads below -10 m, special measurement
devices like the polymer tensiometer (BAKKER et al., 2007; DURIGON et al., 2011) are
needed.
Soil water hydraulic properties usually vary with depth (DOMEC et al., 2010; KLEIN
et al., 2014b), therefore, the amount of transpirable water is not necessarily distributed
homogenously over the rooting zone. In this context, we aimed to further develop the single-
layer Mlim equation proposed by De Jong van Lier et al. (2006), making it applicable to multi-
layer scenarios. To illustrate the theory, soil hydraulic properties were assessed for soils from
two important ecological zones in Brazil: the northeast Brazilian semiarid zone, an ecosystem
representing 12% of the total national territory, and the southeast Brazilian sub-humid
tropical/subtropical zone covering great parts of Brazil´s southern and southeastern states,
including high intensity agricultural areas.
4.2 Material and Methods
4.2.1 Development of an expression to calculate limiting hydraulic conditions
A convenient soil hydraulic property that is often used in soil water movement studies
is the matric flux potential M (GRANT and GROENEVELT, 2015; PULLAN, 1990; RAATS,
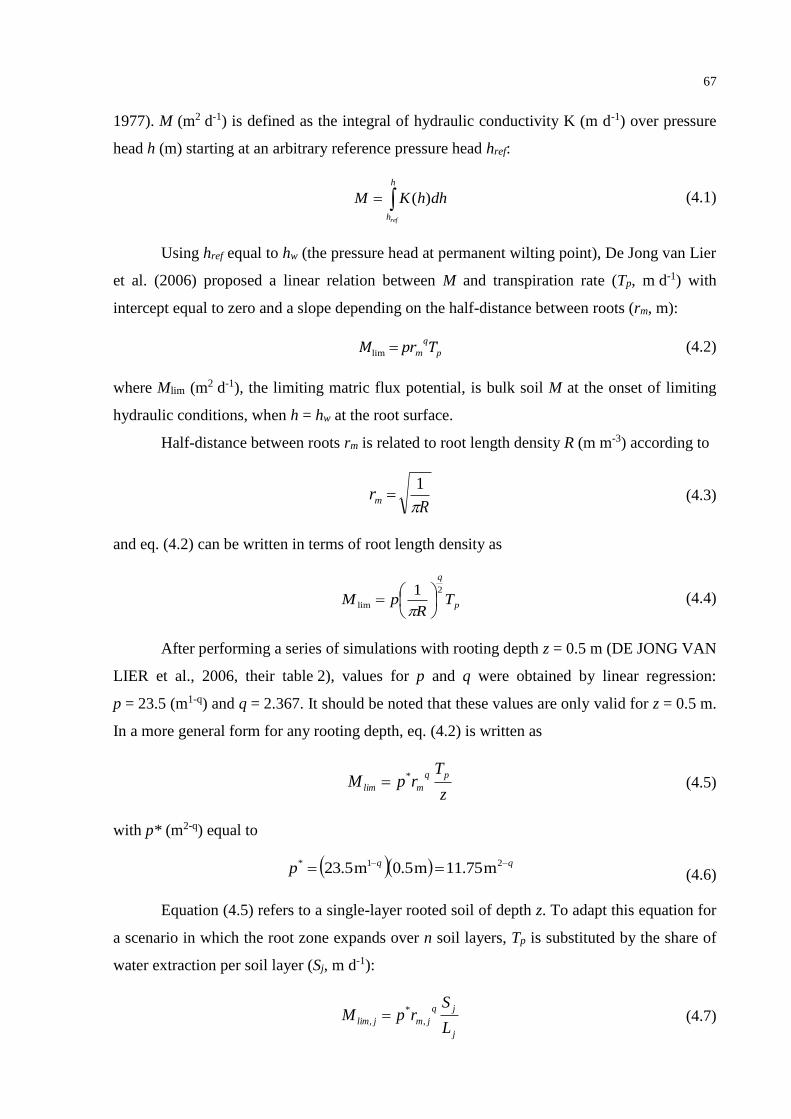
67
1977). M (m2 d-1) is defined as the integral of hydraulic conductivity K (m d-1) over pressure
head h (m) starting at an arbitrary reference pressure head href:
h
href
dhhKM )( (4.1)
Using href equal to hw (the pressure head at permanent wilting point), De Jong van Lier
et al. (2006) proposed a linear relation between M and transpiration rate (Tp, m d-1) with
intercept equal to zero and a slope depending on the half-distance between roots (rm, m):
p
q
m TprM lim (4.2)
where Mlim (m2 d-1), the limiting matric flux potential, is bulk soil M at the onset of limiting
hydraulic conditions, when h = hw at the root surface.
Half-distance between roots rm is related to root length density R (m m-3) according to
R
rm
1 (4.3)
and eq. (4.2) can be written in terms of root length density as
p
q
TR
pM2
lim
1
(4.4)
After performing a series of simulations with rooting depth z = 0.5 m (DE JONG VAN
LIER et al., 2006, their table 2), values for p and q were obtained by linear regression:
p = 23.5 (m1-q) and q = 2.367. It should be noted that these values are only valid for z = 0.5 m.
In a more general form for any rooting depth, eq. (4.2) is written as
z
TrpM
pq
mmli
* (4.5)
with p* (m2-q) equal to
qqp 21* m75.11m5.0m5.23 (4.6)
Equation (4.5) refers to a single-layer rooted soil of depth z. To adapt this equation for
a scenario in which the root zone expands over n soil layers, Tp is substituted by the share of
water extraction per soil layer (Sj, m d-1):
j
jq
jmjmliL
SrpM ,
*
, (4.7)

68
where indices j refer to the soil layer and Lj (m) is the layer thickness. A reasonable way to
estimate Sj, in non-limiting conditions is by weighing potential transpiration according to Lj
and root length density Rj:
n
i
ii
jj
pj
RL
RLTS
1
(4.8)
Substituting eq. (4.8) in eq. (4.7) results in
n
i
ii
q
jq
pjmli
RL
RTpM
1
21
2*
, )1
(
(4.9)
Transforming this finite difference expression into an integral one at depth z, we
obtain:
D
q
q
pmli
Rdz
zRTpzM
0
21
2*)(
)1
()(
(4.10)
For the special case of q = 2 (which is slightly lower than the value of 2.367
determined by De Jong van Lier et al., 2006) and performing a fitting procedure, analogous to
De Jong van Lier et al. (2006), between Mlim and Tp for several half-distance between roots,
p* = 5.3 was found to result in the best fit. Then eq. (4.10) reduces to
D
p
mli
Rdz
TpzM
0
*
)(
(4.11)
If the number of layers is not infinite, eq. (4.11) can be expressed in a finite way as
n
i
ii
p
mli
LR
TpzM
1
*
)(
(4.12)
In non-hysteretic conditions, M is uniquely correlated to and h. M--h relations are
available for several standard soil hydraulic property equation systems (DE JONG VAN

69
LIER et al., 2009; GRANT; GROENEVELT, 2015) and for practical purposes any Mlim can
be converted in lim or hlim.
4.2.2 Evaluation of water availability in some Brazilian soils
In order to illustrate the use of eq. 4.12, soils from two Brazilian climatic zones were
studied. From the semiarid zone located in the northeastern part of Brazil, soils at three sites
(sites 1, 2, and 3) representative of an integrally-preserved Caatinga watershed in Ceará State
were sampled. The sub-humid zone occurs in a vast area covering the south, southeast and
central parts of Brazil. To represent this region, eight sites (sites 4-11) in São Paulo State were
sampled. At each location, soil samples were collected from the surface layer and from one or
more sub-surface layers. Figure 4.1 and Table 4.1 show location and other details of the
sampling locations. The ratio between annual rainfall and potential evapotranspiration shows
the significant climatic difference regarding water availability among the sampling sites
(Table 4.1). Table 4.2 contains information about the particle size distribution for all sampled
soil layers. Soils from both zones show significant variation in particle size distribution over
depth, and soils from the sub-humid zone generally have a much higher clay content than
semiarid zone soils.
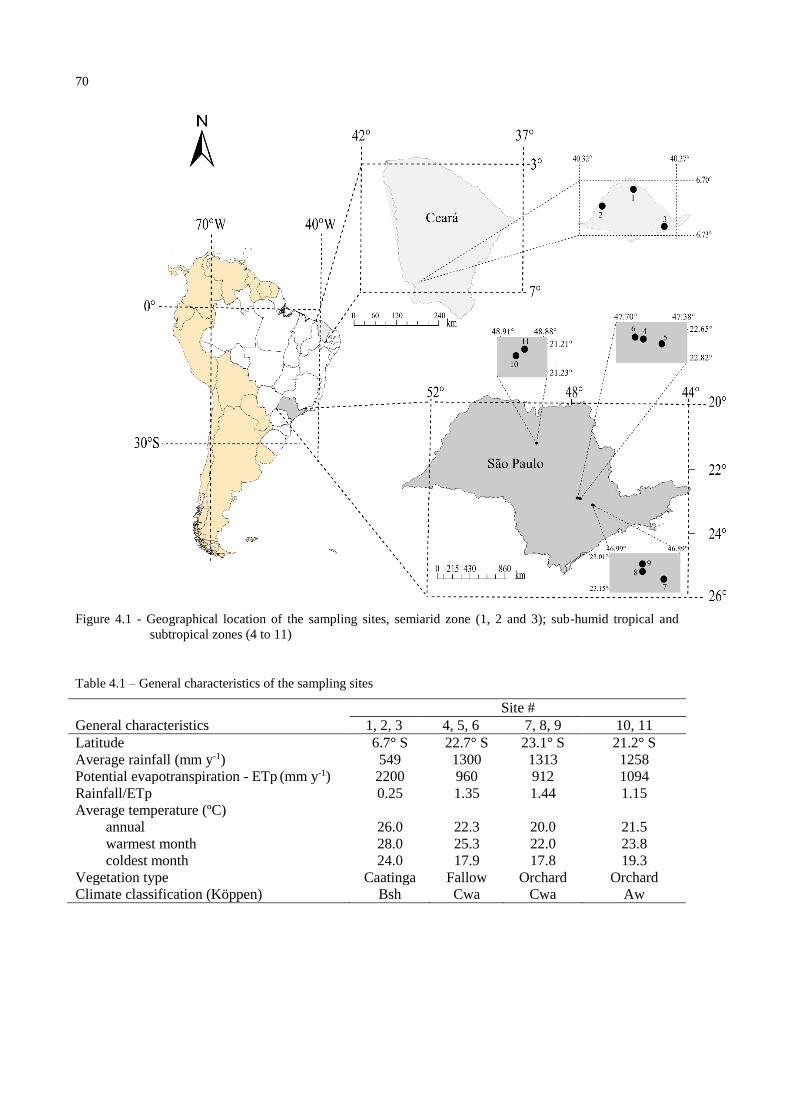
70
Figure 4.1 - Geographical location of the sampling sites, semiarid zone (1, 2 and 3); sub-humid tropical and
subtropical zones (4 to 11)
Table 4.1 – General characteristics of the sampling sites
Site #
General characteristics 1, 2, 3 4, 5, 6 7, 8, 9 10, 11
Latitude 6.7° S 22.7° S 23.1° S 21.2° S
Average rainfall (mm y-1) 549 1300 1313 1258
Potential evapotranspiration - ETp (mm y-1) 2200 960 912 1094
Rainfall/ETp 0.25 1.35 1.44 1.15
Average temperature (ºC)
annual 26.0 22.3 20.0 21.5
warmest month 28.0 25.3 22.0 23.8
coldest month 24.0 17.9 17.8 19.3
Vegetation type Caatinga Fallow Orchard Orchard
Climate classification (Köppen) Bsh Cwa Cwa Aw

71
Table 4.2 – Sampling sites, soil classification (IUSS, 2015), particle size distribution and texture class for
sampled soil layers
Sampling
site #
Great Soil Group
according to IUSS
(2015) Depth
Particle size fraction (kg kg-1)
Soil texture class Sand
0.05-2.0
Silt
0.002-0.05
Clay
<0.002
m ----------mm----------
SE
MIA
RID
1 Lixisol
0.00-0.20 0.38 0.51 0.11 Silt Loam
0.20-0.40 0.40 0.47 0.13 Loam
0.40-0.60 0.42 0.43 0.15 Loam
0.60-0.80 0.45 0.40 0.15 Loam
2 Luvisol 0.00-0.20 0.31 0.55 0.13 Silt Loam
0.20-0.40 0.39 0.48 0.12 Loam
3 Leptosol 0.00-0.20 0.62 0.31 0.07 Sandy Loam
0.20-0.40 0.56 0.34 0.10 Sandy Loam
SU
B-H
UM
ID
4 Ferralsol 0.00-0.20 0.18 0.15 0.67 Clay
0.20-0.40 0.08 0.10 0.82 Clay
5 Nitisol 0.00-0.20 0.35 0.27 0.38 Clay Loam
0.20-0.40 0.26 0.20 0.54 Clay
6 Luvisol 0.00-0.20 0.20 0.18 0.62 Clay
0.20-0.40 0.17 0.23 0.60 Clay
7 Ferralsol 0.00-0.15 0.63 0.04 0.33 Sandy Clay Loam
0.15-0.30 0.56 0.01 0.43 Sandy Clay
8 Acrisol 0.00-0.30 0.67 0.18 0.15 Sandy Loam
0.51-0.68 0.50 0.13 0.37 Sandy Clay
9 Leptosol 0.40-0.60 0.62 0.12 0.26 Sandy Clay Loam
10 Cambisol 0.56-0.72 0.77 0.04 0.19 Sandy Loam
11 Acrisol 0.00-0.15 0.92 0.02 0.06 Fine Sand
0.45-0.75 0.67 0.04 0.29 Sandy Clay Loam
4.2.3 Evaporation experiments
To determine the unsaturated hydraulic properties for each soil layer, laboratory
evaporation experiments were performed. Six rings (0.10 m high and internal diameter
0.145 m) were filled with air-dried and sieved soil material and then slowly saturated with
water by capillarity from bottom to top. After wetting, the bottom side was sealed. Two or
three days later, three polymer tensiometers were horizontally inserted in the sample through
drilled holes with centers at 25, 50 and 75 mm vertical distance from the sample surface. The
used tensiometer type measures in the range from -165 m to -1 m with an accuracy of
approximately 0.2 m (BAKKER et al., 2006; VAN DER PLOEG et al., 2008). Each ring
equipped with three tensiometers was placed on a precision balance (capacity 8.5 kg and
resolution 10-4 kg).

72
Measurements of ring sample weight and pressure heads were automatically logged
every 10 min. The evaporation experiment was finished when the upper tensiometer reached a
pressure head value below -165 m, which took in the order of 3 weeks. At the end of the
measurement, the final water content of the soil sample was determined by oven drying at
105 °C.
4.2.4 Inverse solution
Soil hydraulic parameters were obtained from soil evaporation and pressure head
measurements by an inverse one-dimensional solution using Hydrus-1D (ŠIMUNEK et al.,
2008). The unsaturated soil hydraulic properties were assumed to be defined by K-θ-h
relations described by the Van Genuchten-Mualem model (1980):
1)/1(
1
nn
h (4.13)
2)/1(1)1/(11nnn
sKK (4.14)
with )/()( rsr ; θ, θr and θs are water content, residual water content and
saturated water content (m3 m-3), respectively; h is pressure head (m), K and Ks are hydraulic
conductivity and saturated hydraulic conductivity, respectively (m d-1); and α (m-1), n and λ
are fitting parameters.
The water flow boundary conditions were set in terms of: (i) surface evaporation flux
for each time interval calculated from observed mass difference over a time interval; (ii)
pressure heads measured at the three depths over time and the final soil water content. An
inverse solution was obtained using Hydrus-1D for each replicate (ring); therefore, for each
replicate a set of hydraulic parameters was estimated. To obtain a single set of hydraulic
parameters for each soil layer, for each replicate 10 pressure head values in the range of the
observed readings (from -165 to -1.5 m) were selected and respective water content and
unsaturated hydraulic conductivity were calculated. These data, for all replicates together,
were then processed using RETC software (VAN GENUCHTEN et al., 1991) to generate a
unique hydraulic parameter set for each soil layer.

73
4.2.5 Simulation scenarios to estimate Mlim
In order to assess the water supply capacity of the investigated soil layers for soils
from both climatic regions, we assumed the existence of a vegetation with a vertical root
distribution according to Equation (4.15), as proposed by Schenk and Jackson (2002):
cD
D
D
Rr
50
1
max (4.15)
where: rD (m) is the cumulative amount of roots above profile depth D (m), Rmax (m) is the
total root length in the soil profile, D50 is the depth (m) at which rD =0.5Rmax, and c is a
dimensionless shape-parameter. To calculate the vertical root distribution, we used the
parameterization corresponding to a tropical semi-deciduous and deciduous forest as listed in
table 4 of Schenk and Jackson (2002). In order to match an Rmean of 1000 m m-3 over a soil
profile of 1 m depth, the corresponding Rmax of 4142 m m-³ was assumed for all soils. The
adopted mean root length density of a 1000 m m-3 was based on average values over rooted
zone for different crops types presented by De Willigen and Van Noordwijk (1987).
Limiting hydraulic conditions were evaluated by calculating the value hlim based on
Mlim using optimized Van Genuchten hydraulic functions for evapotranspiration rates in the
range between 0.5 and 6 mm d-1. Two values for the limiting root water potential (hw) were
used: the commonly employed value of -150 m (e.g. DE JONG VAN LIER et al., 2006;
JAVAUX et al., 2008; and many others) and a more negative value hw = -300 m. In this way,
insight was obtained in the sensitivity of results to the value of hw, and whether soil hydraulic
properties allow significant water flow at soil pressure heads more negative than -150 m.
Equation (4.15) was used to evaluate all soils under a similar scenario of water
demand and root uptake. For the Caatinga biome in the semiarid zone, however, (soils 1, 2
and 3), root length density measurements were carried out by Pinheiro et al. (2016).
Therefore, in addition to root length density profiles obtained using eq. (4.15), we also
evaluated a scenario using the experimentally observed root length densities for the semiarid
zone.

74
4.3 Results and Discussion
4.3.1 Soil hydraulic parameter estimation
Estimated hydraulic parameter for all analyzed soil layers are given in Table 4.3. Land
use and vegetation type play an important role in the formation of soil structure; they mainly
affect macroporosity and soil hydraulic properties at and near saturation (GONZALEZ-SOSA
et al., 2012; JARVIS et al., 2013; WANG et al., 2013). In our experiment, samples were
sieved and natural macrostructure was destroyed. Therefore, the effect of land use and
vegetation type on soil hydraulic properties cannot be evaluated by our methodology. On the
other hand, as it was our purpose to evaluate soil water availability determined by soil
hydraulic properties for the dry water content range, these are not expected to be affected by
macrostructural properties (BITTELLI; FLURY, 2009; CRESSWELL et al., 2008; TULI et
al., 2005).

75
Table 4.3 - Optimized Van Genuchten-Mualem parameters (Eq. [4.13] and [4.14]) for soils from the Brazilian
semiarid zone (soils 1-3), and from the Brazilian sub-humid zone (soils 4-11) together with their
coefficient of determination (R²)
Sampling
site #
Great Soil
Group
IUSS
(2015)
Depth α n θr θs Ks λ R²
m m-1 - -----m3 m-3----- m d-1 - -
SE
MIA
RID
1 Lixisol
0.00-0.20 0.195 1.752 0.053 0.242 0.339 0.974 0.85
0.20-0.40 0.171 1.633 0.033 0.200 0.363 1.851 0.93
0.40-0.60 0.081 2.041 0.087 0.196 0.752 2.466 0.96
0.60-0.80 0.042 1.796 0.116 0.194 0.008 1.468 0.60
2 Luvisol 0.00-0.20 0.177 1.436 0.023 0.258 0.147 1.916 0.71
0.20-0.40 0.243 1.828 0.061 0.259 0.187 0.787 0.92
3 Leptosol 0.00-0.20 0.086 1.653 0.034 0.096 0.020 3.029 0.77
0.20-0.40 0.602 1.444 0.031 0.110 3.010 2.691 0.95
SU
B-H
UM
ID
4 Ferralsol 0.00-0.20 1.615 1.223 0.055 0.202 0.0004 17.67 0.64
0.20-0.40 3.575 1.239 0.048 0.324 0.014 2.633 0.60
5 Nitisol 0.00-0.20 4.832 1.348 0.152 0.319 0.123 10.41 0.99
0.20-0.40 1.982 1.268 0.061 0.420 0.0052 -0.645 0.89
6 Luvisol 0.00-0.20 12.506 1.404 0.068 0.377 0.0081 1.414 0.82
0.20-0.40 1.965 1.205 0.094 0.368 0.0018 3.204 0.75
7 Ferralsol 0.00-0.15 3.031 1.249 0.075 0.235 0.0033 6.964 0.60
0.15-0.30 3.276 1.185 0.075 0.353 0.0110 7.930 0.58
8 Acrisol 0.00-0.30 4.949 1.381 0.103 0.300 0.0217 0.612 0.81
0.51-0.68 1.979 1.385 0.031 0.219 0.0105 0.004 0.98
9 Leptosol 0.40-0.60 1.868 1.290 0.078 0.327 0.0028 0.018 0.96
10 Cambisol 0.56-0.72 1.280 1.168 0.109 0.203 0.0002 27.19 0.73
11 Acrisol 0.00-0.15 1.637 1.189 0.029 0.194 0.00001 10.53 0.77
0.45-0.75 8.365 1.565 0.141 0.212 0.03060 3.221 0.96
The measured range of pressure heads during the evaporation experiment was
different among samples. Soils from the semiarid zone were analyzed from -10 m to -165 m,
whereas sub-humid zone soils allowed analysis from -1.5 m to -165 m. The upper limit of
these ranges matches the conditions when the flow in the sample rings was strictly upward,
the difference between both groups of soils is probably related to their distinct pore geometry.
Dealing with sieved material, the >2 mm soil structure is destroyed, but most of the smaller
structure elements, very important in weathered tropical soils, are maintained.
As stressed by Simunek et al. (1998), as long as independent measured information
from the analyzed range is not included in the optimization process, extrapolation beyond the
range of measurement is associated with a high level of uncertainty. Considering this, the
optimized values for saturated conditions (s and Ks) are merely fitting parameters for
equations (4.13) and (4.14) and do not correspond to values measured at saturation.
76
The λ parameter from eq. 4.14 is related to tortuosity and connectivity of the pore
space, but its exact physical meaning is unclear (VOGEL, 2000). A higher λ leads to a faster
reduction of K with decreasing (eq. 4.14). For the analyzed soils, λ ranged from -0.65 to
27.2 (Table 4.3), showing the arbitrariness of the commonly used value (λ = 0.5) obtained in a
fitting procedure performed by Mualem (1976) on a set of 45 soils. Predictions of K are
especially sensitive to λ in the dry range, making its correct determination of utmost
importance in plant water availability studies. The average λ ± standard deviation for the
semiarid zone soils was 1.9 ± 0.8, for the sub-humid zone soils the value was 6.5 ± 7.9.
4.3.2 Limiting pressure head
The limiting pressure head hlim (the bulk soil pressure head at the onset of the falling-
rate phase) calculated from Mlim is lower in the semiarid zone soils (soils 1-3) than in sub-
humid zone soils 4-11 (Table 4.4), suggesting that hydraulic properties of soils from the
semiarid ecosystem allow root water uptake at a potential rate under a wider range of soil
pressure heads. The smaller values of , on average, in the soils from the semiarid zone
(Table 4.3) imply in higher values of K under dry conditions, affecting directly the matric flux
potentials used to evaluate hlim. To illustrate the magnitude of this effect, Table 4.4 shows
values of K at hw = -150 m (K150) and at -300 m (K300) calculated using eq. 4.13 and 4.14.
Whereas K150 for the semiarid zone soils are of the order 10-7 to 10-9 m d-1, in the sub-humid
zone soils this range is between 10-10 and 10-22 m d-1. Semiarid zone soils show a coarser
texture than sub-humid zone soils (Table 4.2). In addition, according to Klein at al. (2014b),
coarse layers are the major water source for plant transpiration during dry periods whereas
soils with higher clay content hold a large amount of non-transpirable water.

77
Table 4.4 – Hydraulic conductivities K150 at hw = -150 m and K300 at hw = -300 m together with hydraulic
conditions (hlim [m] and ϴlim [m3 m-3]) at the onset of the falling rate phase calculated for
Rmax = 4142 m m-3 and Tp = 6 mm d-1 and for limiting root water potentials (hw) of -150 m
and -300 m for all layers of the evaluated soils
Climatic
zones
Sampling
sites
Great Soil
Group
IUSS
(2015)
Depth K150 K300 hlim, 150 hlim 300 ϴlim, 150 ϴlim, 300
m ---m d-1--- ---m--- ---m3 m-3---
SE
MIA
RID
1 Lixisol
0.00-0.20 3.8∙10-8 2.0∙10-9 -78 -81 0.13 0.12
0.20-0.40 3.0∙10-8 1.4∙10-9 -75 -77 0.21 0.20
0.40-0.60 1.2∙10-8 1.2∙10-10 -77 -77 0.15 0.15
0.60-0.80 2.4∙10-7 9.3∙10-9 -118 -135 0.27 0.25
2 Luvisol 0.00-0.20 7.0∙10-8 5.4∙10-9 -84 -90 0.31 0.30
0.20-0.40 7.2∙10-9 3.7∙10-10 -47 -47 0.13 0.13
3 Leptosol 0.00-0.20 4.0∙10-9 1.1∙10-10 -49 -49 0.38 0.38
0.20-0.40 2.9∙10-9 1.7∙10-10 -33 -33 0.26 0.26
SU
B-H
UM
ID
4 Ferralsol 0.00-0.20 7.9∙10-21 9.4∙10-23 >-1.5* >-1.5 >0.83 >0.32
0.20-0.40 1.7∙10-12 2.0∙10-13 >-1.5 >-1.5 >0.71 >0.71
5 Nitisol 0.00-0.20 7.1∙10-21 8.9∙10-23 >-1.5 >-1.5 >0.56 >0.56
0.20-0.40 3.3∙10-10 6.5∙10-11 -2.0 -2.0 0.69 0.69
6 Luvisol 0.00-0.20 5.9∙10-15 5.7∙10-16 >-1.5 >-1.5 >0.36 >0.36
0.20-0.40 1.4∙10-12 1.6∙10-13 >-1.5 >-1.5 >0.81 >0.81
7 Ferralsol 0.00-0.15 7.3∙10-16 3.9∙10-17 >-1.5 >-1.5 >0.72 >0.72
0.15-0.30 1.3∙10-14 8.9∙10-16 >-1.5 >-1.5 >0.77 >0.77
8 Acrisol 0.00-0.30 4.2∙10-12 5.3∙10-13 >-1.5 >-1.5 >0.68 >0.68
0.51-0.68 1.1∙10-10 1.7∙10-11 -2.0 -2.0 0.61 0.61
9 Leptosol 0.40-0.60 6.7∙10-11 1.1∙10-11 >-1.5 >-1.5 >0.77 >0.77
10 Cambisol 0.56-0.72 7.5∙10-22 6.3∙10-24 >-1.5 >-1.5 >0.88 >0.88
11 Acrisol 0.00-0.15 9.2∙10-18 4.5∙10-19 >-1.5 >-1.5 >0.85 >0.85
0.45-0.75 1.8∙10-18 6.0∙10-20 >-1.5 >-1.5 >0.30 >0.30 * Limiting pressure head (hlim) higher than -1.5 m
To what extent plants are able to sustain the water demand of their shoot depends on
the hydraulic properties of the soil-root system. As long as root system conductance is large
enough, root system geometry and root hydraulic properties have a low impact on water
uptake. The ability of the soil to keep water flowing towards the roots is then predominantly
determined by the soil hydraulic properties (DE JONG VAN LIER et al., 2013; LOBET et al.,
2014). As the rhizosphere is highly susceptible to a local drop in hydraulic conductivity
(LOBET et al., 2014), a lower limiting soil pressure head will allow plants to withstand a
wider range of water content with a lower risk of hydraulic failure due to embolism or
cavitation triggered by a soil water potential below a species-specific threshold (CHOAT et
al., 2012; KLEIN et al., 2014a). This would allow plants to withstand adverse scenarios of
soil drought.

78
Comparing the calculated values of hlim for hw= -150 and hw= -300 m, differences were
very small and did not represent a significant increase in soil water availability. These values
show the low sensitivity of available water to the lower limiting pressure head, analogous to
the low sensitivity of the permanent wilting point to the corresponding pressure head (e.g.,
SAVAGE et al., 1996). It is therefore suggested that, in order for a vegetation to adapt to dry
soils without capillary rise from a water table, natural vegetation is more likely to invest in
shallower and denser root systems and in the enforcement of stomatal closure, but not in
structures that allow a reduction of the lower suction limit in root tissues (CASTELLANOS et
al., 1991; KLEIN et al., 2014b). The optimal strategy under capillary rise scenarios is not
answerable by this theory.
4.3.3 Limiting soil pressure head for semiarid zone soils based on in situ measurements
of root length density
Although the bulk RLD measurements carried out in this research for the Caatinga
biome do not exclusively represent active fine roots (roots able to conduct water), the values
measured were higher (Table 4.5) than those used in the previous scenario.
Table 4.5 – Limiting soil pressure head hlim (m) at the onset of the falling rate phase for the Caatinga biome using
measured root length densities associated with a transpiration rate of 6 mm d-1
Sampling
sites
Great Soil
Group
IUSS
(2015)
Depth
(m)
RLD
(m m-3)
hlim,150 hlim,300 ϴlim,150 ϴlim,300
m
m3 m-3
1 Lixisol
0.00-0.20 3.7∙103 -99 -108 0.11 0.10
0.20-0.40 2.8∙103 -95 -101 0.17 0.16
0.40-0.60 2.0∙103 -91 -92 0.12 0.12
0.60-0.80 1.6∙103 -134 -173 0.25 0.20
2 Luvisol 0.00-0.20 4.1∙103 -97 -109 0.29 0.27
0.20-0.40 1.8∙103 -55 -56 0.12 0.12
3 Leptosol 0.00-0.20 2.8∙103 -53 -53 0.36 0.36
0.20-0.40 1.8∙103 -36 -37 0.25 0.25
Analyzing the hlim of the soils from semiarid zone for transpiration rates ranging from
0.5 to 6.0 mm d-1, hlim ranged from -36 to -148 m (Figure 4.2).
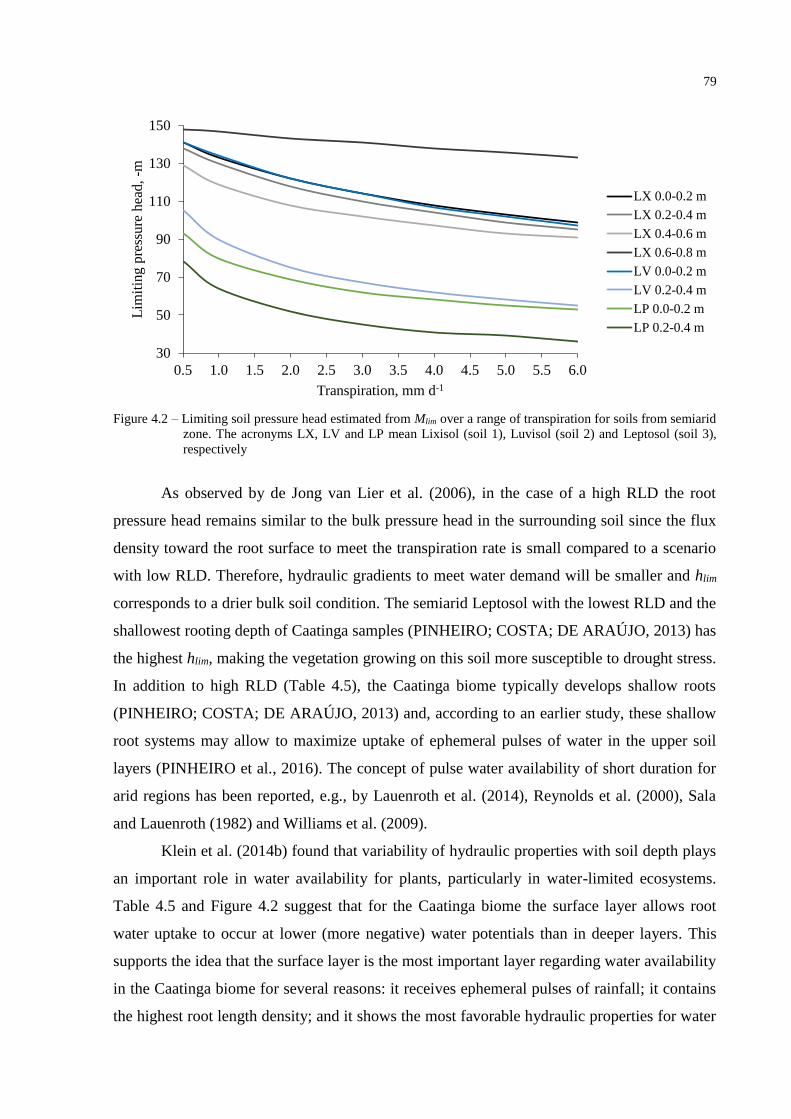
79
Figure 4.2 – Limiting soil pressure head estimated from Mlim over a range of transpiration for soils from semiarid
zone. The acronyms LX, LV and LP mean Lixisol (soil 1), Luvisol (soil 2) and Leptosol (soil 3),
respectively
As observed by de Jong van Lier et al. (2006), in the case of a high RLD the root
pressure head remains similar to the bulk pressure head in the surrounding soil since the flux
density toward the root surface to meet the transpiration rate is small compared to a scenario
with low RLD. Therefore, hydraulic gradients to meet water demand will be smaller and hlim
corresponds to a drier bulk soil condition. The semiarid Leptosol with the lowest RLD and the
shallowest rooting depth of Caatinga samples (PINHEIRO; COSTA; DE ARAÚJO, 2013) has
the highest hlim, making the vegetation growing on this soil more susceptible to drought stress.
In addition to high RLD (Table 4.5), the Caatinga biome typically develops shallow roots
(PINHEIRO; COSTA; DE ARAÚJO, 2013) and, according to an earlier study, these shallow
root systems may allow to maximize uptake of ephemeral pulses of water in the upper soil
layers (PINHEIRO et al., 2016). The concept of pulse water availability of short duration for
arid regions has been reported, e.g., by Lauenroth et al. (2014), Reynolds et al. (2000), Sala
and Lauenroth (1982) and Williams et al. (2009).
Klein et al. (2014b) found that variability of hydraulic properties with soil depth plays
an important role in water availability for plants, particularly in water-limited ecosystems.
Table 4.5 and Figure 4.2 suggest that for the Caatinga biome the surface layer allows root
water uptake to occur at lower (more negative) water potentials than in deeper layers. This
supports the idea that the surface layer is the most important layer regarding water availability
in the Caatinga biome for several reasons: it receives ephemeral pulses of rainfall; it contains
the highest root length density; and it shows the most favorable hydraulic properties for water
30
50
70
90
110
130
150
0.5 1.0 1.5 2.0 2.5 3.0 3.5 4.0 4.5 5.0 5.5 6.0
Lim
itin
g p
ress
ure
hea
d,
-m
Transpiration, mm d-1
LX 0.0-0.2 m
LX 0.2-0.4 m
LX 0.4-0.6 m
LX 0.6-0.8 m
LV 0.0-0.2 m
LV 0.2-0.4 m
LP 0.0-0.2 m
LP 0.2-0.4 m

80
flow to plant roots. These results corroborate an earlier study carried out for the same
Caatinga forest, where the upper layer supplied up to 90% of the total water requirement
(PINHEIRO et al., 2016). Other authors have also found transpiration to be controlled by soil
water content of the surface layer (GAINES et al., 2015; KLEIN et al., 2014b; LIU et al.,
2011; RAZ-YASEEF et al., 2012).
Similar to results discussed before, when considering hw= -300 m instead of -150 m,
only a slight decrease in hlim is observed, corresponding to a minimal increase in transpirable
water for forest survival. According to Klein et al. (2014a), the remarkable changes in
hydraulic properties among soil types that are mostly independent of the forest biome type,
introduce additional variation among forests in terms of their susceptibility to soil drought.
Many plant strategies can be recognized in the Caatinga biome, which allow the vegetation to
cope with low soil-water ranges, e.g. spreading of shallow roots, reduced leaf area and
shedding of leaves (PINHEIRO et al., 2016; PINHEIRO; COSTA; DE ARAÚJO, 2013).
There are indications that the ability of woody plants to survive and recover from periods of
sustained drought is strongly related to their resistance to embolism (CHOAT et al., 2012).
Possibly, some strategy regarding hydraulic failure, i.e. protection of the xylem from
extensive embolism, may then be part of Caatinga species strategy. However, our results
suggest that soil hydraulic properties allowing maintenance of water supply to plants under
low soil pressure heads is also a very important feature in determining establishment and
survival of plants in the Caatinga biome.
4.4 Conclusions
Using measured soil hydraulic properties of Brazilian soils from different climate
zones under unsaturated conditions to determine a limiting matric flux potential of total crop
water availability we conclude that:
1. Given characteristic rooting density patterns, the matric flux potential approach extended to
multi-layer scenarios allows to identify soil hydraulic vulnerability for different ecosystems,
identifying climate zones that are likely to be more harmed by water shortage enhanced by
soil drought.
2. Soils from the Brazilian semiarid zone are able to deliver water to plants under a wide
range of soil-water content, with limiting pressure heads between -36 and -148 m. In contrast,
in the used experimental setup, soils from the sub-humid zone showed stronger hydraulic
restrictions for supplying transpirable water.

81
3. For the analyzed soils, a negligible increase in available water results from decreasing the
root water potential (hw) below -150 m. It is generally suggested that species in semiarid
ecosystems are adapted to allow lower root water potentials, but our results indicate that this
would not be an efficient evolutionary adaptation.
References
BAKKER, G.; VAN DER PLOEG, M.J.; DE ROOIJ, G.H.; HOOGENDAM, C.W.;
GOOREN, H.P.A.; HUISKES C.; KOOPAL, L.K.; KRUIDHOF, H. New polymer
tensiometers: measuring matric pressures down to the wilting point. Vadose Zone Journal,
Madison, v. 6, n. 1, p. 196-202, 2007.
BITTELLI, M.; FLURY, M. Errors in water retention curves determined with pressure plates.
Soil Science Society of America Journal, Madison, v. 73, n. 5, p. 1453-1460, 2009.
CASTELLANOS, J.; MAASS, M.; KUMMEROW, J. Root biomass of a dry tropical forest in
Mexico. Plant and Soil, Dordrecht, v. 131, n. 131, p. 225-228, 1991.
CHOAT, B.; JANSEN, S.; BRODRIBB, T.J.; COCHARD, H.; DELZON, S.; BHASKAR, R.;
BUCCI, S.J.; FEILD, T.S.; GLEASON, S.M.; HACKE, U.G.; JACOBSEN, A.L.; LENS, F.;
MAHERALI, H.; MARTÍNEZ-VILALTA, J.; MAYR, S.; MENCUCCINI, M.; MITCHELL,
P.J.; NARDINI, A.; PITTERMANN, J.; PRATT, R.B.; SPERRY, J.S.; WESTOBY, M.;
WRIGHT, I.J.; ZANNE, A.E. Global convergence in the vulnerability of forests to drought.
Nature, London, v. 491, p. 752–755, 2012.
CRESSWELL, H.P.; GREEN, T.W.; MCKENZIE, N.J. The adequacy of pressure plate
apparatus for determining soil water retention. Soil Science Society of America Journal,
Madison, v. 72, n. 1, p. 41-49, 2008.
DE ARAÚJO J.C.; GÜNTNER, A.; BRONSTERT, A. Loss of reservoir volume by sediment
deposition and its impact on water availability in semiarid Brazil. Hydrological Sciences
Journal, Wallingford, v. 51, n. 1, p. 157-170, 2006.
DE JONG VAN LIER, Q.; DOURADO NETO, D.; METSELAAR, K. Modeling of
transpiration reduction in Van Genuchten–Mualem type soils. Water Resources Research,
Washington, v. 45, n. 2, p. 1-9, 2009.
DE JONG VAN LIER, Q.; METSELAAR, K.; VAN DAM, J.C. Root water extraction and
limiting soil hydraulic conditions estimated by numerical simulation. Vadose Zone Journal,
Madison, v. 5, n. 4, p. 1264–1277, 2006.
DE JONG VAN LIER, Q.; VAN DAM, J.C.; DURIGON, A.; DOS SANTOS, M.A.;
METSELAAR, K. Modeling water potentials and flows in the soil-plant system comparing
hydraulic resistances and transpiration reduction functions. Vadose Zone Journal, Madison,
v. 12, n. 3, p. 1-20, 2013.
DE WILLIGEN, P.; VAN NOORDWIJK, M. Roots, plant production and nutrient use
efficiency. 1987. 282 p. Thesis (PhD) - Wageningen University, 1987.

82
DOMEC, J.C.; KING, J.S.; NOORMETS, A.; TREASURE, E.; GAVAZZI, M.J.; SUN, G.;
MCNULTY, S.G. Hydraulic redistribution of soil water by roots affects whole-stand
evapotranspiration and net ecosystem carbon exchange. New Phytologist, Malden, v. 187,
p. 171–183, 2010.
DURIGON, A.; GOOREN, H.P.A.; DE JONG VAN LIER, Q.; METSELAAR, K. Measuring
hydraulic conductivity to wilting point using polymer tensiometers in an evaporation
experiment. Vadose Zone Journal, London, v. 10, n. 2, p. 741–746, 2011.
GAINES, K.P.; STANLEY, J.W.; MEINZER, F.C.; MCCULLOH, K.A.; WOODRUFF,
D.R.; CHEN, W.; ADAMS, T.S.; LIN, H.; EISSENSTAT, D.M. Reliance on shallow soil
water in a mixed-hardwood forest in central Pennsylvania. Tree Physiology, Oxford, v. 00,
p. 1-15, 2015.
GARDNER, W.R.; MIKLICH, F.J. Unsaturated conductivity and diffusivity measurements
by a constant flux method. Soil Science, Philadelphia, v. 93, n. 4, p. 271–274, 1962.
GONZALEZ-SOSA, E.; BRAUD, I.; DEHOTIN, J.; LASSABATÈRE, L.; ÂNGULO-
JARAMILLO, R.; LAGOUY, M.; BRANGER, F.; JACQUEMINET, C.; KERMADI, S.;
MICHEL, K. Impact of land use on the hydraulic properties of the topsoil in a small French
catchment. Hydrological Processes, Chichester, v. 24, n. 17, p. 2382–2399, 2010.
GRANT, C.D.; GROENEVELT, P.H. Weighting the differential water capacity to account for
declining hydraulic conductivity in a drying coarse-textured soil. Soil Research, Sidney,
v. 53, n. 4, p. 386–391, 2015.
IDEN, S.C.; PETERS, A.; DURNER, W. Improving prediction of hydraulic conductivity by
constraining capillary bundle models to a maximum pore size. Advances in Water
Resources, Oxford, v. 85, p. 86-92, 2015.
IUSS WORKING GROUP WRB. World Reference Base for Soil Resources 2014:
international soil classification system for naming soils and creating legends for soil maps.
Rome: FAO, 2015. 203 p. (FAO. World Soil Resources Reports, 106).
JARVIS, N.; KOESTAL, J.; MESSING, I.; MOEYS, J.; LINDAHL, A. Influence of soil, land
use and climatic factors on the hydraulic conductivity of soil. Hydrology And Earth System
Sciences, Gottingen, v. 17, p. 5185–5195, 2013.
JAVAUX, M.; SCHRÖDER, T.; VANDERBORGHT, J.; VEREECKEN, H. Use of a three-
dimensional detailed modeling approach for predicting root water uptake. Vadose Zone
Journal, London, v. 7, n. 3, p. 1079-1088, 2008.
KLEIN, T.; YAKIR, D.; BUCHMANN, N.; GRÜNZWEIG, J.M. Towards an advanced
assessment of the hydrological vulnerability of forests to climate change-induced drought
New Phytologist, Malden, v. 201, n. 3, p. 712-716, 2014a.
83
KLEIN, T.E.; ROTENBERG, E.; COHEN-HILALEH, E.; RAZ-YASEEF, N.;
TATARINOV, F.; PREISLER, Y.; OGÉE, J.; COHEN, S.; YAKIR, D. Quantifying
transpirable soil water and its relations to tree water use dynamics in a water-limited pine
forest. Ecohydrology, Hoboken, v. 7, n. 2, p. 409–419, 2014b
LAUENROTH, W.K.; SCHLAEPFER, D.R.; BRADFORD, J.B. Ecohydrology of dry
regions: storage versus pulse soil water dynamics. Ecosystems, New York, v. 17, n. 8,
p. 1469–1479, 2014.
LIU, Y.; XU, Z.; DUFFY, R.; CHEN, W.; AN, S.; LIU, S.; LIU, F. Analyzing relationships
among water uptake patterns, rootlet biomass distribution and soil water content profile in a
subalpine shrubland using water isotopes. European Journal of Soil Biology, Paris, v. 47,
p. 380–386, 2011. doi:10.1016/j.ejsobi.2011.07.012.
LOBET, G.; COUVREUR, V.; MEUNIER, F.; JAVAUX, M.; DRAYE, X. Plant water
uptake in drying soils. Plant physiology, Rockville, v. 164, p. 1619-1627, 2014.
MARENGO, J.A.; CHOU, S.C.; KAY, G.; ALVES, L.M.; PESQUERO, J.F.; SOARES,
W.R.; SANTOS, D.C.; LYRA, A.A.; SUEIRO, G.; BETTS, R.; CHAGAS, D.J.; GOMES,
J.L.; BUSTAMENTE, J.F.; TAVARES, P. Development of regional future climate change
scenarios in South America using the Eta CPTEC/HadCM3 climate change projections:
climatology and regional analyses for the Amazon, São Francisco and the Paraná River
basins. Climate Dynamics, New York, v. 38, n. 9, p. 1829–1848, 2012.
MUALEM, Y. A new model for predicting the hydraulic conductivity of unsaturated porous
media. Water Resources Research, Washington, v. 12, n. 3, p. 513-522, 1976.
PINHEIRO, E.A.R.; COSTA, C.A.G.; DE ARAÚJO, J.C. Effective root depth of the
Caatinga biome. Journal of Arid Environments, London, v. 89, p. 1-4, 2013.
PINHEIRO, E.A.R.; METSELAAR, K.; DE JONG VAN LIER, Q.; DE ARAÚJO, J.C.
Importance of soil water to the Caatinga biome, Brazil. Ecohydrology, Hoboken, 2016. In
press.
PULLAN, A.J. The quasilinear approach for unsaturated porous media flow. Water
Resources Research, Washington, v. 26, n. 6, p. 1219–1234, 1990.
RAATS, P.A.C. Laterally confined, steady flows of water from sources and to sinks in
unsaturated soils. Soil Science Society of America Journal, Madison, v. 41, n. 2, p. 294–
304, 1977.
______. Uptake of water from soils by plant roots. Transport in Porous Media, New York,
v. 68, n. 1, p. 5-28, 2007.
RAZ-YASEEF, N.; YAKIR, D.; SCHILLER, G.; COHEN, S. Dynamics of
evapotranspiration partitioning in a semi-arid forest as affected by temporal rainfall patterns.
Agricultural and forest meteorology, Amsterdam, v. 157, p. 77-85, 2012.

84
REYNOLDS, J.F.; KEMP, P.R.; TENHUNEN, J.D. Effects of long-term rainfall variability
on evapotranspiration and soil water distribution in the Chihuahuan Desert: a modeling
analysis. Plant Ecology, Dordrecht, v. 150, n. 1, 145–59, 2000.
SALA, O.E.; LAUENROTH, W.K. Small rainfall events: an ecological role in semiarid
regions. Oecologia, New York, v. 53, n. 3, p. 301–304, 1982.
SAVAGE, M.J.; RITCHIE, J.T.; BLAND, W.L.; DUGAS, W.A. Lower limit of soil water
availability. Agronomy Journal, Madison, v. 88, n. 4, p. 844-651, 1996.
SCHENK, H.J.; JACKSON, R.B. The global biogeography of roots. Ecological
Monographs, Washington, v. 72, n. 3, p. 311-328, 2002.
SENEVIRATNE, S.I.; NICHOLLS, N.; EASTERLING, D.; , GOODESS, C.M.; KANAE, S.;
KOSSIN, J.; LUO, Y.; MARENGO, J.; MCINNES, K.; RAHIMI, M.; REICHSTEIN, M.;
SORTEBERG, A.; VERA, C.; ZHANG, X. Changes in climate extremes and their impacts on
the natural physical environment. In: FIELD, C.B., BARROS, V.; STOCKER, T.F.; QIN, D.;
DOKKEN, D.J.; EBI, K.L.; MASTRANDREA, M.D.; MACH, K.J.; PLANTTNER, G.-K,
ALLEN, S.K.; TIGNOR, M.; MIDGLEY, P.M. (Ed.). Managing the risks of extreme events
and disasters to advance climate change adaptation: a special report of Working Groups I
and II of the Intergovernmental Panel on Climate Change (IPCC). Cambridge; New York:
Cambridge University Press, 2012. p. 109-230.
ŠIMŮNEK, J.; VAN GENUCHTEN, M. TH.; ŠEJNA, M. Development and applications of
the HYDRUS and STANMOD software packages and related codes. Vadose Zone Journal,
Madison, v. 7, n. 2, p. 587-600, 2008.
ŠIMŮNEK, J.; WENDROTH, O.; VAN GENUCHTEN, M. TH. Parameter estimation
analysis of the evaporation method for determining soil hydraulic properties. Soil Science
Society of America Journal, Madison, v. 62, n. 4, p. 894–905, 1998.
TULI, A.; HOPMANS, J.W.; ROSLTON, D.E.; MOLDRUP, P. Comparison of air and water
permeability between disturbed and undisturbed soils. Soil Science Society of America
Journal, Madison, v. 69, n. 5, p. 1361-1371, 2005.
VAN DER PLOEG, M.J.; GOOREN, H.P.A.; BAKKER, G.; DE ROOIJ, G.H.. 2008. Matric
potential measurements by polymer tensiometers in cropped lysimeters under water-stressed
conditions. Vadose Zone Journal, Madison, v. 7, n. 3, p. 1048–1054, 2008.
VAN GENUCHTEN, M.TH. A closed-form equation for predicting the hydraulic
conductivity of unsaturated soils. Soil Science Society of America Journal, Madison, v. 44,
n. 5, 892-898, 1980.
VAN GENUCHTEN, M. TH.; LEIJ, F. J.; YATES, S. R. The RETC code for quantifying
the hydraulic functions of unsaturated soils: version 1.0. Robert S. Riverside: Kerr
Environmental Research Laboratory, 1991. 8 p. (EPA Report, 600/2-91/065).
VOGEL, H.J. A numerical experiment on pore size, pore connectivity, water retention,
permeability, and solute transport using network models. European Journal of Soil Science,
Malden, v. 51, n. 1, p. 99-105, 2000.
85
WANG, Y.; SHAO, M.; LIU, Z.; HORTON, R. Regional-scale variation and distribution
patterns of soil saturated hydraulic conductivities in surface and subsurface layers in the
loessial soils of China. Journal of Hydrology, Amsterdam, v. 487, p. 13–23, 2013.
WENDROTH, O.; EHLERS, W.; HOPMANS, J.W.; KAGE, H.; HALBERTSMA, J.;
WÖSTEN, J.H.M. Reevaluation of the evaporation method for determining hydraulic
functions in unsaturated soils. Soil Science Society of America Journal, Madison, v. 57, n.
6, p. 1436–1443, 1993.
WILLIAMS, C.A.; HANAN, N.; SCHOLES, R.J.; KUTSCH, W. Complexity in water and
carbon dioxide fluxes following rain pulses in an African savanna. Oecologia, New York,
v. 161, n. 3, p. 469–480, 2009
WIND, G.P. Capillary conductivity data estimated by a simple method. In RIJTEMA, P.E.;
WASSINK, H. (Ed.). Water in the unsaturated zone. Gentbrugge: IASAH, 1968. p. 181–
191.

86

87
APPENDIX

88

89
Appendix A
Biomass growth on basis of incoming radiation I is calculated as:
Iftfdt
dBvII
t )1()( (A1.1)
where Bt is woody biomass of the tree; )(tf is the proportion of incoming radiation (I)
intercepted by the vegetation; t is the radiation use efficiency of the vegetation; If is the
resources use efficiency and αv is the albedo of the vegetation.
Biomass growth on basis of water use efficiency is calculated as:
Pwwt ETftf
dt
dB)( (A1.2)
where ETP is the potential evapotranspiration.
Assuming )(tf to be equal for both approaches and equating these biomass growth rates,
yields an estimate for ETP:
P
ww
vII ETf
If
)1( (A1.3)
Dividing eq. A1.3 by the potential evapotranspiration of a reference crop, eq. A1.4:
c
wrcwrc
rcIrcIrc ETf
IfPr
)1(
(A1.4)
results in:
IrcIrc
II
ww
wrcwrc
rc
v
c
P
f
f
f
f
ET
ET
1
1
Pr
(A1.5)
c
c
P KET
ET
Pr
(A1.6)
Assuming
1IrcIrc
II
ww
wrcwrc
f
f
f
f
(A1.7)
results in a ratio of:
rc
vcK
1
1 (A1.8)

90
where:
kLAI
s
kLAI
vv ee )1( (A1.9)
rcrc kLAI
src
kLAI
rcrc ee
)1( (A1.10)
where: αv and αs are the albedo of the vegetation and bare soil of the vegetation, respectively;
αrc and αrcs are the albedo of the reference crop and bare soil, respectively; k is the radiation
extinction coefficient of the canopy; LAI is the leaf area index.
Rearranging eq. A1.9 and A1.10 in A1.8 results in:
rcrc kLAI
src
kLAI
rc
kLAI
s
kLAI
vc
ee
eeK
)1(1
)1(1 (A1.11)
Eq. A1.11 can be written as:
rckLAI
rcsrcrc
kLAI
vsvc
e
eK
)(1
)(1
(A1.12)
For a reference crop the leaf area index is 2.88, and the crop albedo is 0.23. The soil albedo is
not assumed to play a part, so 0.23 will be assumed to be the overall albedo, then:
23.01
)(1
kLAI
vsvc
eK
(A1.13)