


Línguas
Páginas
Legal

D 2016
PEPTIDE SELF-ASSEMBLED MATERIALS
FOR GAS TRANSPORT
JOANA DURÃO Tese de Doutoramento apresentada à faculdade de Engenharia da Universidade do Porto com vista à obtenção do
grau de Doutor na área científica de Engenharia Biomédica
Tese realizada sob a orientação de:
Professor Doutor Luís Miguel Gales Pereira Pinto
Professor Associado no Instituto de Ciências Biomédicas Abel Salazar (ICBAS)
Professora Doutora Cristina Maria Santos Alves de Carvalho Barrias
Investigadora Auxiliar do Instituto Nacional de Engenharia Biomédica (INEB)/ Instituto de Investigação e
Inovação da Universidade do Porto (i3S) e Professora Assistente convidada do ICBAS
Professora Doutora Paula Alexandra de Carvalho Gomes
Professora Associada da Faculdade de Ciências da Universidade do Porto

II
III
Preceitos Legais De acordo com o disposto no nº1 do artigo 34º do Decreto-Lei nº 74/2006, publicado em Diário
da República, 1ª série, nº 60 de 24 de Março de 2006, e republicado pelo Decreto-Lei nº
115/3013, publicado em Diário da República, 1ª série, nº151 de 7 de Agosto de 2013, que
precede à terceira alteração ao Decreto-Lei nº 74/2006, de 24 de Março de 2006, nesta tese
foram publicados os resultados de trabalhos abaixo indicados.
Joana Durão, Luís Gales. Peptide self-assembly for therapeutic applications. Current Organic
Chemistry 19 (2015) 1874-1881
Joana Durão, Luís Gales. Guest diffusion in dipeptide crystals. CrystEngComm 15 (2013) 1532-
1535.
Joana Durão, Luís Gales. Permeation of light gases through hexagonal ice. Materials (2012)
5(9) 1593-1601.

IV
V
AGRADECIMENTOS Esta longa caminhada não procedeu sem que me deparasse com diversos obstáculos, dos mais
técnicos aos mais pessoais, e se aqui apresento o trabalho desta empreitada será unicamente pelo
apoio incessante de todos os que me rodeiam. De uma mão a um braço ou um abraço, a todos
devo os mais sinceros agradecimentos.
Orientar não é uma missão que se deva perseguir de ânimo leve, especialmente quando os
orientandos procuram nos seus mestres a sapiência inatingível de um Yoda. Tive a sorte de ser
orientada pelo Professor Doutor Luís Gales, a quem devo os meus mais genuínos
agradecimentos, pelo apoio e pela disponibilidade que sempre me demonstrou. Apoiou a minha
decisão de seguir por um caminho desviado do seu próprio plano, pelo que lhe agradeço a
flexibilidade e a oportunidade que me concedeu. Além disso, sempre me proporcionou as
ferramentas que me permitiram saborear diversas áreas científicas.
Devo um agradecimento mais do que merecido à Professora Doutora Paula Gomes, da
Faculdade de Ciências da Universidade do Porto, que me guiou através da síntese peptídica e
sempre me ajudou na procura de respostas. Também remeto a minha gratidão para o Doutor
Nuno Vale que me orientou por entre espectros de massa e cromatogramas. Agradeço
igualmente à Sílvia Maia que com enorme simpatia e clareza me apresentou ao laboratório de
química orgânica da faculdade de ciências e às suas práticas.
À minha co-orientadora, Professora Doutora Cristina Barrias, apresento o meu genuíno
agradecimento, por me ceder a oportunidade de explorar um mundo que não o meu de formação
e que por este mesmo desconhecido me conduziu. Também mais do que merecedoras do meu
agradecimento são a Doutora Filipa Soares que, para além de me ceder os fibroblastos de que
precisei para as minhas experiências, sempre se disponibilizou para responder a todas as
questões que me surgiam. À Sara Neves, pela formação e auxílio na utilização do reómetro
assim como na interpretação dos resultados, que infelizmente não apresentaram a qualidade
necessária para figurar nesta tese, devo também os meus agradecimentos.
Expresso também a minha enorme gratidão para com a Professora Doutora Maria Salomé
Gomes, que me instruiu na área de microbiologia e me forneceu todas as ferramentas para que
fosse possível realizar os ensaios de actividade antimicrobiana.
Agradeço igualmente à Professora Doutora Helena Vasconcelos, da Faculdade de Farmácia da
Universidade do Porto, e à sua aluna Filipa Reis, do IPATIMUP, não só por me permitiram
testar o efeito do composto formado como produto desta tese, nas linhas celulares cancerígenas
VI
do pulmão, mas também pela paciência com que me instruíram nas técnicas de culturas
celulares.
Aos meus amigos, Eduarda, Raquel, Manu, Helena, João Pessoa e Andreia, que me
acompanharam lado a lado, com as palavras certas de motivação quando as experiências saíam
infrutíferas e as hipóteses refutadas, e que comigo partilharam a alegria das pequenas conquistas.
Ao Pedro que iluminou os meus dias e os encheu de cores, até mesmo os dias cinzentos de
chuva passaram a ter um sentido especial.
Um especial agradecimento para a Rosa que me ensinou o sentido e o valor de um sorriso nos
dias de maior desmotivação.
Ao Alexandre que me entende e me conhece como poucos e que sempre me empurrou pela
colina a cima, literal e figurativamente; obrigada pela força.
À minha amiga Zsuzsa, com quem partilhei mais do que conversas de almoço e de quem sempre
recebi o maior dos afectos.
Aos meus companheiros de batas brancas, Rui Afonso, Márcia Duarte, Hugo Fraga e Luís
Vasconcelos que de uma forma ou de outra contribuíram para o meu desenvolvimento. À
Mafalda, que com a sua criatividade sempre me arrancou para fora da caixa e ao José Pedro, por
todas as discussões, mesmo as mais disparatadas, e pelas bandas sonoras, que diariamente
animavam o laboratório, um grande agradecimento.
A toda a minha família, que criaram as fundações para que pudesse prosseguir o doutoramento
ao longo de todos estes anos.
VII
TABLE OF CONTENTS
Agradecimentos ............................................................................................................................ V
Table of contents ........................................................................................................................ VII
Abstract ......................................................................................................................................... 1
Resumo .......................................................................................................................................... 3
List of Figures ............................................................................................................................... 5
List of Tables ............................................................................................................................... 10
List of Abbreviations ................................................................................................................... 11
Chapter I: Introduction ................................................................................................................ 13
I.1. Overview of Molecular Self-assembly ............................................................................. 15
I.2. Peptides as building blocks for self-assembly .................................................................. 17
I.3. Aim and Thesis Outline .................................................................................................... 21
Chapter II: Crystalline Materials by Peptide Self-assembly ....................................................... 23
II.1. Overview of Peptide Self-assembly forming Crystalline Materials ................................ 25
II.2. Guest Diffusion in Dipeptide Crystals [41] ..................................................................... 35
II.3. Permeation of Light Gases through hexagonal ice [57] .................................................. 47
Chapter III: Soft materials by peptide self-assembly .................................................................. 59
III.1. Peptide Self-assembly for Therapeutic Applications ..................................................... 61
III.2. Antimicrobial Self-assembled Peptide hydrogel with wound healing properties .......... 71
Chapter IV: General Conclusions and Future Perspectives ...................................................... 103
Appendix A: Fmoc-PXG/NO Characterization ........................................................................ 109
Appendix B: Optimization of Sircol Protocol ........................................................................... 115
Appendix C: SNAP Effect in Fibroblasts Collagen Synthesis .................................................. 117
References ................................................................................................................................. 119

1
ABSTRACT Self-assembling phenomena are ubiquitous in nature and the understanding of the principles
behind them is critical for designing a new generation of materials. The work in this thesis has
evolved from the study of dipeptides self-assembling into crystals to higher complex
oligopeptides that self-assemble into hydrogels.
The first part of this work focused on the dipeptide leucyl-serine, which is known to self-
assemble into a crystalline structure with hydrophobic channels. We exploited its unique crystal
packing to determine transport diffusivities of CO2, CH4, N2, O2, and Ar and study the influence
of several parameters such as crystal length, temperature, pore loading and molecular size of the
guest molecules. We were able to show that the mass transport in LS crystals is fast, in the
upper end of the values reported for zeolites. We argue that the low tortuosity of channels and
the uniformity of chemical character are responsible for the high mass transport measured.
In a second part of this thesis we envisaged the production of an oligopeptide capable of self-
assembling into a hydrogel. The goal was to develop a material with enhanced therapeutic
action for application in a wound dressing. An antimicrobial peptide was selected by virtue of
its chemical properties, which we considered adequate to allow gelification to be triggered by a
pH shift. The peptide was chemically functionalized to incorporate an NO donor moiety, which
putatively releases NO in physiological conditions. NO is a free radical which has been
implicated in several wound healing mechanisms. The resulting functionalized peptide, Fmoc-
PXG/NO, was evaluated for its antimicrobial activity. The compound revealed an initial
increased bacterial killing activity when compared with the unmodified peptide (Fmoc-PXG),
although this effect was reversed with time. We debate on the possible effects of an initial
release of NO from the compound, as an explanation for the early positive bactericidal results
achieved.
In addition, the effect of Fmoc-PXG/NO on collagen production, by fibroblasts, was assessed,
as a simplistic model for wound healing. Fibroblasts exposed to the NO releasing compound
revealed an increased collagen production when compared with control peptide (Fmoc-PXG).
Although the chemical characterization of the developed compound failed to provide concrete
evidence on the production of the NO donor moiety intended, it is undeniable that some
promising effects were achieved. We are confident that the overall results of this thesis will
inspire others to pursue research on the field of peptide self-assembling materials.

2
3
RESUMO A auto-associação, ou self-assembly, é um fenómeno omnipresente na natureza e que poderá
estar na base da criação de uma nova geração de materiais. Para tal, é fundamental adquirir uma
maior compreensão dos princípios que governam este fenómeno.
O trabalho desta tese focou-se no estudo de diversas facetas da auto-associação de péptidos para
desenvolvimento de novos materiais e respectivas aplicações. Como ponto de partida, estudou-
se a auto-associação de dipéptidos hidrofóbicos que dão origem a cristais. Posteriormente, o
estudo evoluiu no sentido de promover a auto-associação de oligopéptidos mais complexos,
originando géis.
Assim, numa primeira fase, estudou-se o dipéptido Leucil-serina (LS), reconhecido pela sua
auto-associação em estruturas cristalinas, dando origem a canais hidrofóbicos. Aproveitando os
tubos de dimensões nanométricas formados pelos cristais de LS, levou-se a cabo um estudo para
a determinação experimental das difusividades de transporte de CO2, CH4, N2, O2, e Ar ao longo
desses canais. Estudou-se igualmente a influência de vários parâmetros tais como o
comprimento do cristal, a temperatura, a carga de poro e a dimensão das moléculas gasosas. Foi
possível demonstrar que o transporte de massa de cristais LS é rápido, equiparado aos valores
da gama superior publicados para transporte em zeólitos. A baixa tortuosidade dos canais e a
uniformidade de carácter químico na sua superfície interior poderão ser alguns dos aspectos
responsáveis pelo elevado transporte de massa obtido.
Numa segunda parte desta tese, produziu-se um hidrogel a partir da auto-associação de um
oligopéptido. O objectivo passava pelo desenvolvimento de um material com acção terapêutica
com vista à aplicação no tratamento de feridas crónicas. Seleccionou-se um péptido
antimicrobiano, não só por minimizar contaminações microbianas na ferida, mas também
devido às suas propriedades químicas, que se considerou serem as adequadas para permitir que
a gelificação decorresse como fruto de uma mudança de pH.
O óxido nítrico (NO) é um radical livre que tem sido implicado em vários mecanismos de
cicatrização de feridas; por isso, funcionalizou-se quimicamente o péptido, por forma a
incorporar um grupo funcional capaz de libertar NO em condições fisiológicas com vista a
optimizar a acção terapêutica do material desenvolvido.
O péptido funcionalizado, Fmoc-PXG/NO, foi avaliado quanto à sua actividade antimicrobiana
através da realização de ensaios de susceptibilidade e geração de curvas tempo-morte (time-kill
curves). No geral, este composto apresentou uma menor actividade contra o microorganismo
estudado, Escherechia Coli, relativamente ao péptido parental. No entanto, nos momentos
iniciais de exposição das células ao composto estudado, verificou-se um maior efeito bactericida,
4
relativamente ao péptido parental, embora este resultado fosse revertido com o tempo. Uma
libertação inicial de NO, conhecido por actuar como agente antimicrobiano, poderá estar na
base dos efeitos observados.
Avaliou-se igualmente o efeito de Fmoc-PXG/NO na produção de colagénio por fibroblastos,
sendo que os fibroblastos expostos ao composto revelaram um aumento da acumulação de
colagénio em comparação com o controlo. Este resultado é indicativo de que a sua aplicação
tópica poderá optimizar o processo de cicatrização.
Embora a caracterização química do composto desenvolvido não tenha resultado em provas
concretas sobre a produção do dador de NO pretendido, é inegável que alguns efeitos
promissores foram alcançados. Estamos confiantes de que os resultados globais desta tese irão
inspirar outros a perseguir estudos no campo de materiais baseados na auto-associação de
péptidos.
5
LIST OF FIGURES
Figure 1. Scheme illustrating top down versus bottom up manufacturing processes. The top-down process consists on the patterning of assemblies whereas the bottom-up approach is based on the interaction of simple building blocks to form a well-ordered assembly by means of molecular recognition and self-assembly. Reproduced from Gazit [3] with the permission of the Royal Society of Chemistry. .......................................................................................... 15
Figure 2. Illustration of design principle underlying the DNA brick structures. The authors compare their design with LEGO® bricks. (A) A single stranded DNA with 32 nucleotides as the building block. (B) Each two-brick architectures assemble via hybridization of two complementary assemblies. Figure adapted from Ke et al. [7] with the permission of The American Association for the Advancement of Science. ..................................................... 16
Figure 3. Amino acids with distinct physical and chemical properties promote the formation of particular types of interactions. A schematic representation of the interactions between different classes of natural amino acids is presented. Reproduced from Mart et al. [14] with the permission of the Royal Society of Chemistry. .............................................................. 18
Figure 4. Representation of three antiparallel β-strands, forming a β-sheet, which are stabilized by hydrogen bonds, on the left of the image, and an α-helix, on the right. The secondary structures depicted were singled out from the enzyme Molinate Hydrolase with the author’s approval.[17] ........................................................................................................................ 19
Figure 5. Self-assembly of peptides may lead to the formations of different structure, such as fibers, tubes, spheres and sheets. Figure from Zelzer et al. [18] with the permission of the Royal Society of Chemistry. ........................................................................................................... 20
Figure 6. Depiction of nanotube assembly from cyclic D,L-peptides. On the left, the peptide planar ring formed by the alternating L and D-amino acid, which self-assembles by stacking each ring on top of each other leading to cylinder-like structure, on the right. Figure from Bong et al.[21] ............................................................................................................................... 25
Figure 7. Representation of the chemical structure of the 10-residue peptide subunit, shown on the left, which self-assembles into a tubular transmembrane channel structure within a lipid bilayer membrane, represented on the right. Adapted with permission from Granja et al.[22] Copyright 1994 American Chemical Society....................................................................... 26
Figure 8. The matrix on the top-left, illustrates the type of crystalline structure obtained by self-assembly of the dipeptides formed by the combination of the two residues listed. Particularly interesting are the tubular structures with inner tubes that are either hydrophilic, in blue circles, or hydrophobic, in orange. Reprinted with permission from Görbitz et al.[24]. Copyright 2007 John Wiley & Sons, Inc. ................................................................ 27
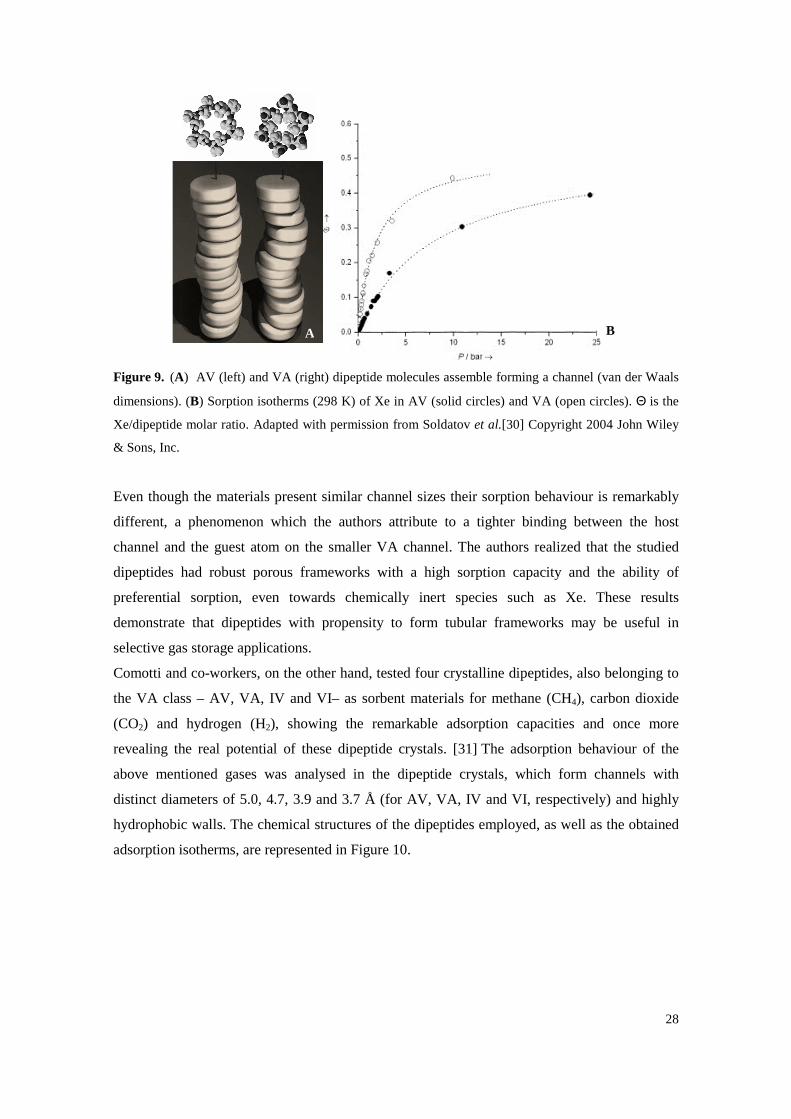
Figure 9. (A) AV (left) and VA (right) dipeptide molecules assemble forming a channel (van der Waals dimensions). (B) Sorption isotherms (298 K) of Xe in AV (solid circles) and VA
(open circles). Θ is the Xe/dipeptide molar ratio. Adapted with permission from Soldatov et al.[30] Copyright 2004 John Wiley & Sons, Inc. ................................................................. 28
6
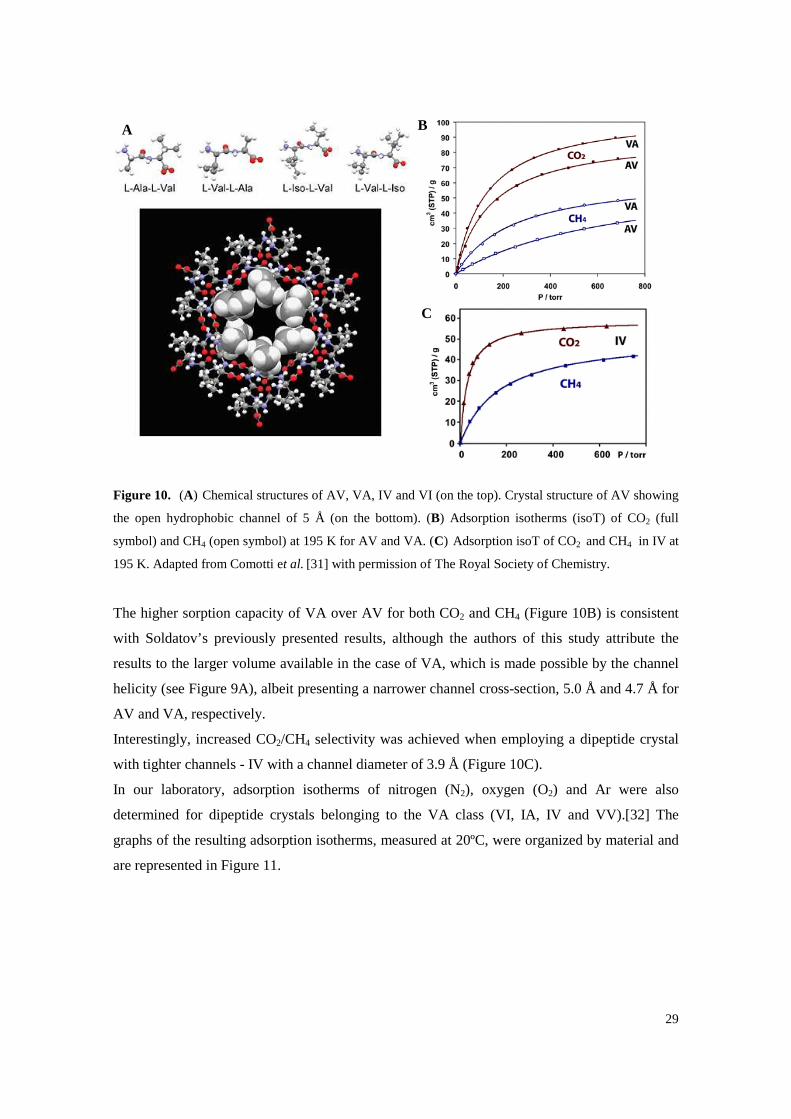
Figure 10. (A) Chemical structures of AV, VA, IV and VI (on the top). Crystal structure of AV showing the open hydrophobic channel of 5 Å (on the bottom). (B) Adsorption isotherms (isoT) of CO2 (full symbol) and CH4 (open symbol) at 195 K for AV and VA. (C) Adsorption isoT of CO2 and CH4 in IV at 195 K. Adapted from Comotti et al. [31] with permission of The Royal Society of Chemistry. .................................................................. 29
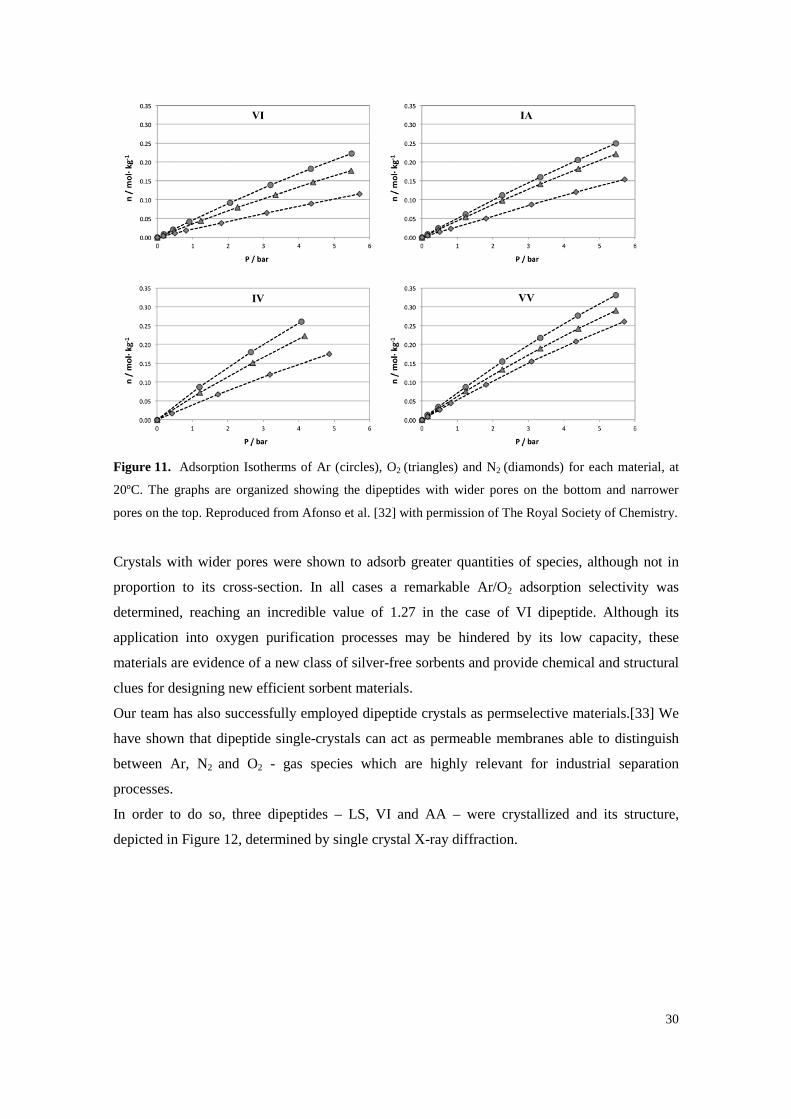
Figure 11. Adsorption Isotherms of Ar (circles), O2 (triangles) and N2 (diamonds) for each material, at 20ºC. The graphs are organized showing the dipeptides with wider pores on the bottom and narrower pores on the top. Reproduced from Afonso et al. [32] with permission of The Royal Society of Chemistry. ................................................................................................ 30
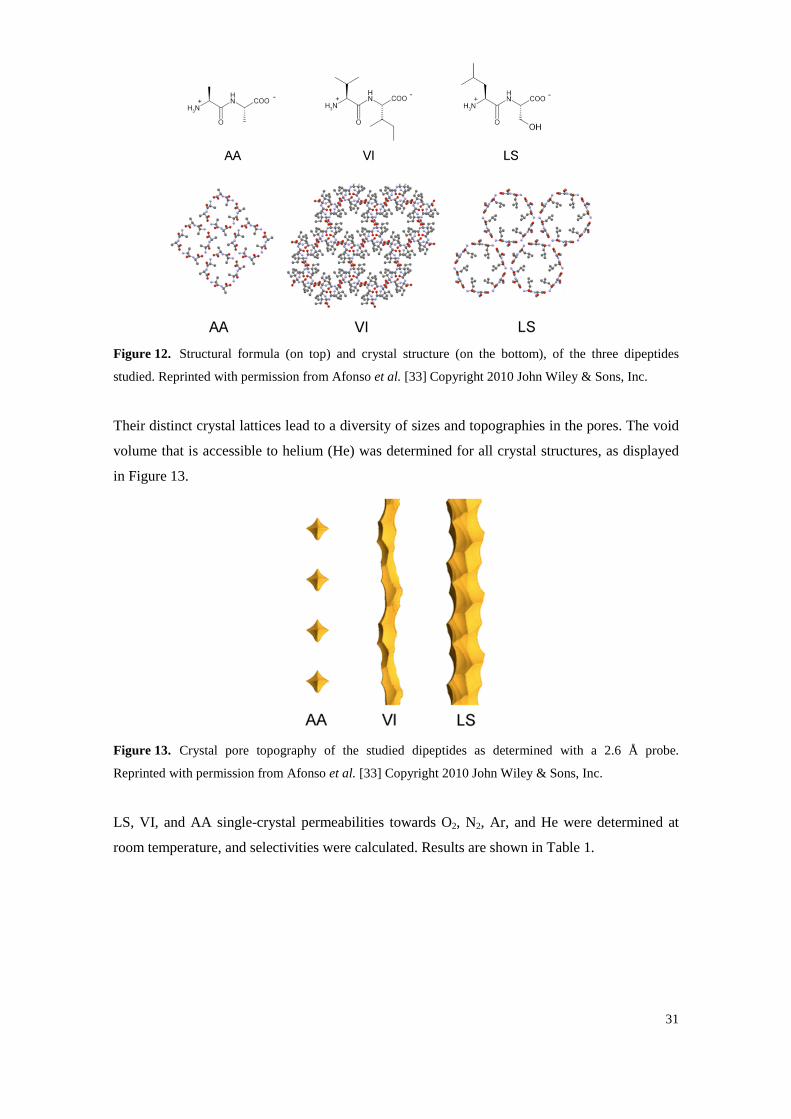
Figure 12. Structural formula (on top) and crystal structure (on the bottom), of the three dipeptides studied. Reprinted with permission from Afonso et al. [33] Copyright 2010 John Wiley & Sons, Inc............................................................................................................................... 31
Figure 13. Crystal pore topography of the studied dipeptides as determined with a 2.6 Å probe. Reprinted with permission from Afonso et al. [33] Copyright 2010 John Wiley & Sons, Inc. ............................................................................................................................................. 31
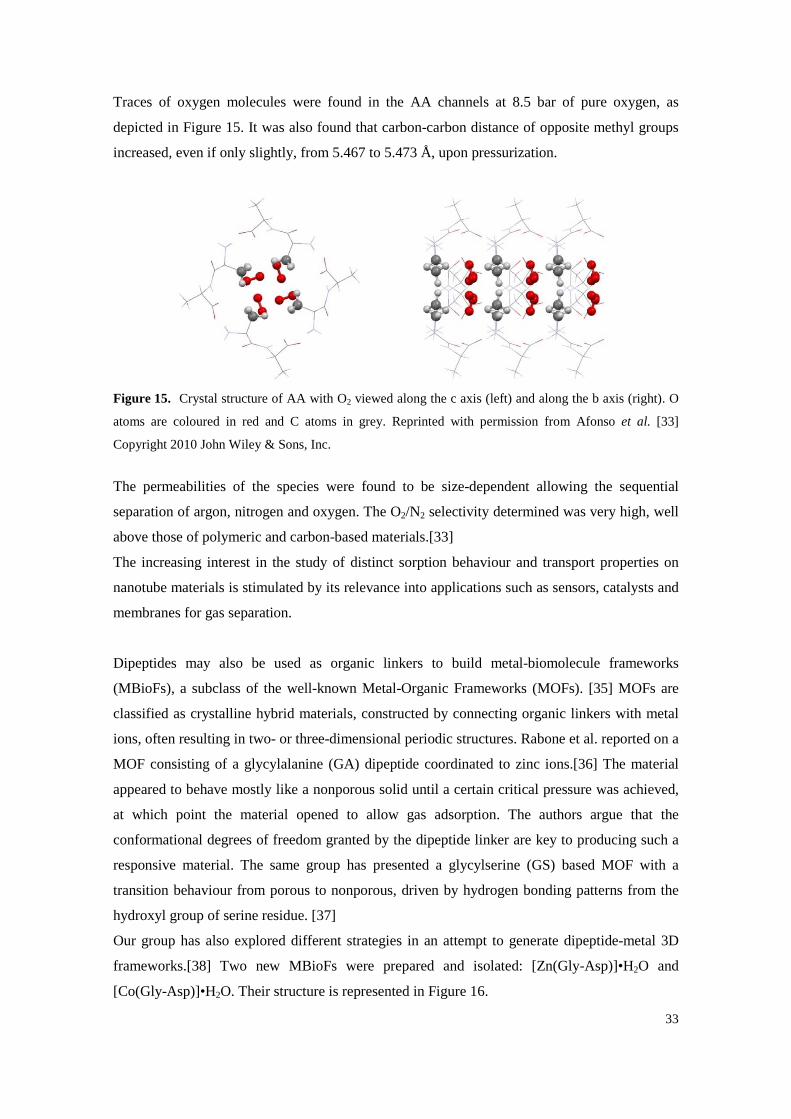
Figure 14. Photograph of the high pressure X-ray data collection apparatus. The crystal is mounted in a capillary and attached to a miniature valve. ......................................................................... 32
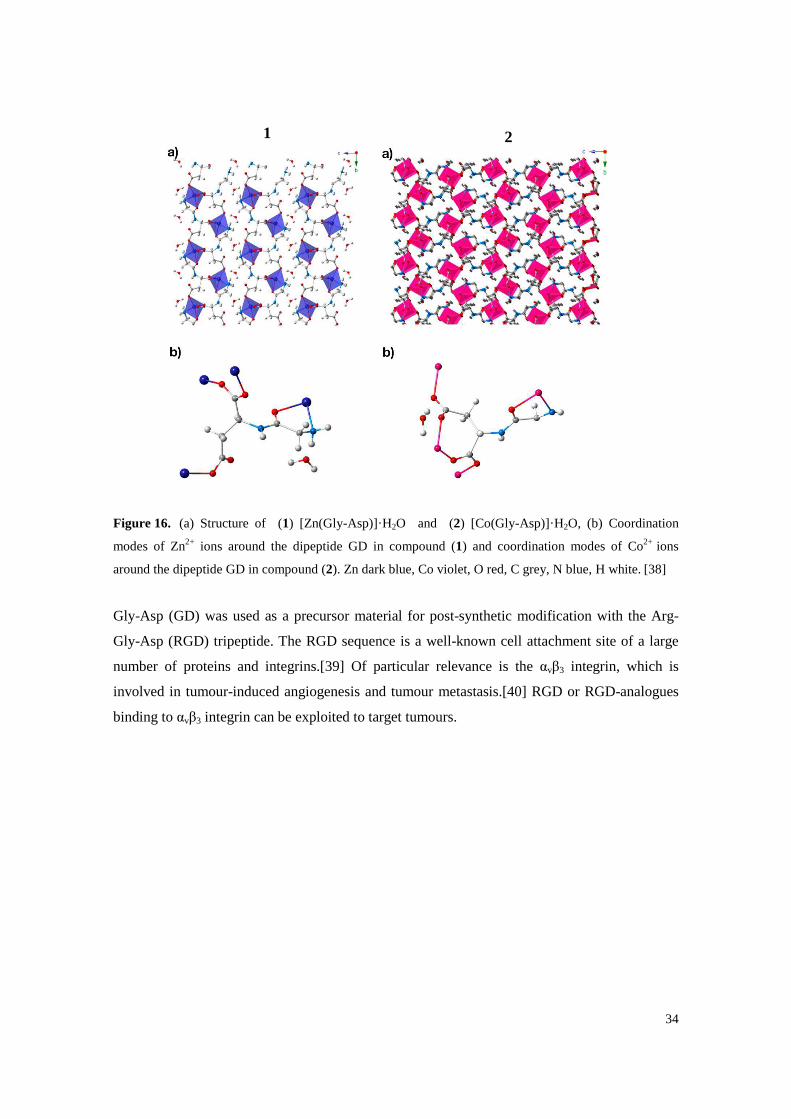
Figure 15. Crystal structure of AA with O2 viewed along the c axis (left) and along the b axis (right). O atoms are coloured in red and C atoms in grey. Reprinted with permission from Afonso et al. [33] Copyright 2010 John Wiley & Sons, Inc. ................................................................ 33
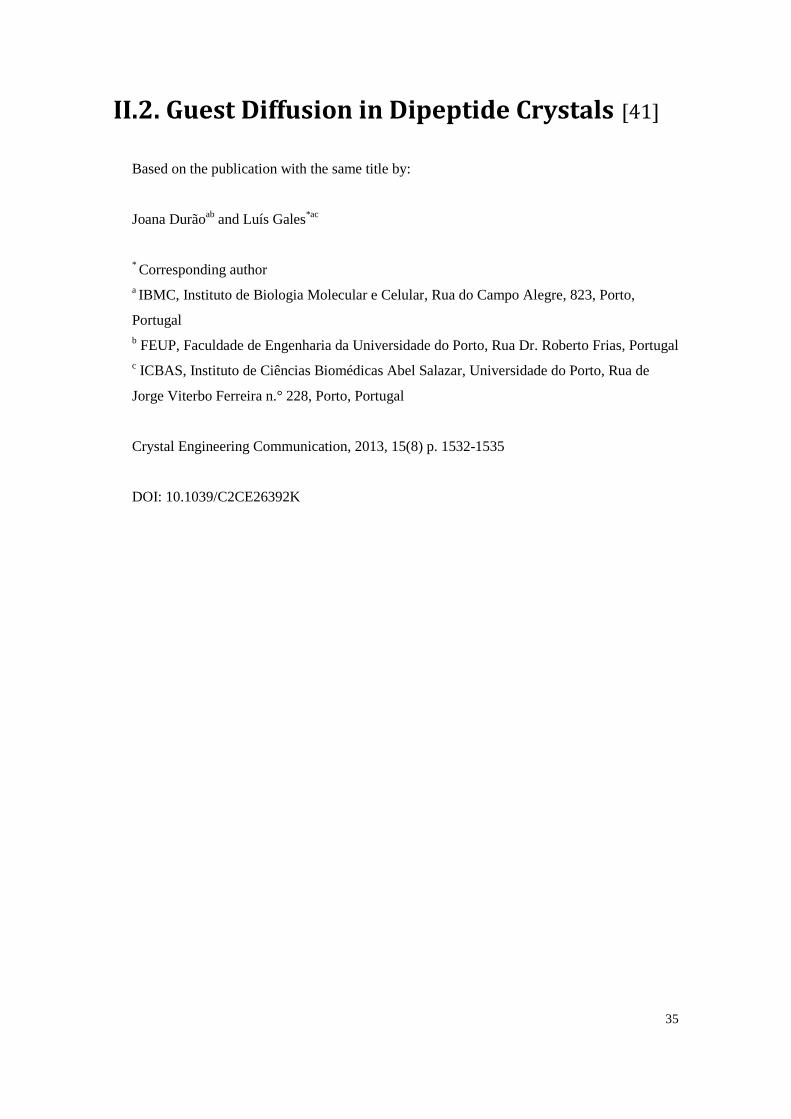
Figure 16. (a) Structure of (1) [Zn(Gly-Asp)]·H2O and (2) [Co(Gly-Asp)]·H2O, (b) Coordination modes of Zn2+ ions around the dipeptide GD in compound (1) and coordination modes of Co2+ ions around the dipeptide GD in compound (2). Zn dark blue, Co violet, O red, C grey, N blue, H white. [38] ........................................................................................................... 34
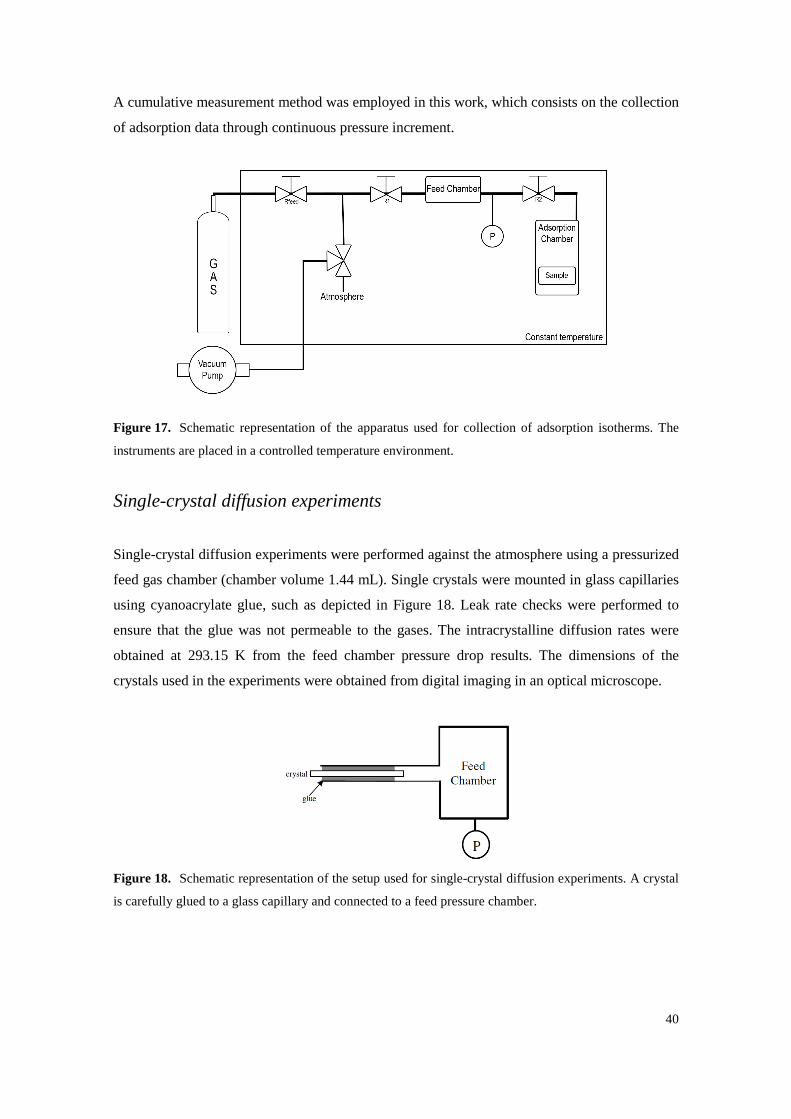
Figure 17. Schematic representation of the apparatus used for collection of adsorption isotherms. The instruments are placed in a controlled temperature environment. ........................................ 40
Figure 18. Schematic representation of the setup used for single-crystal diffusion experiments. A crystal is carefully glued to a glass capillary and connected to a feed pressure chamber. ... 40
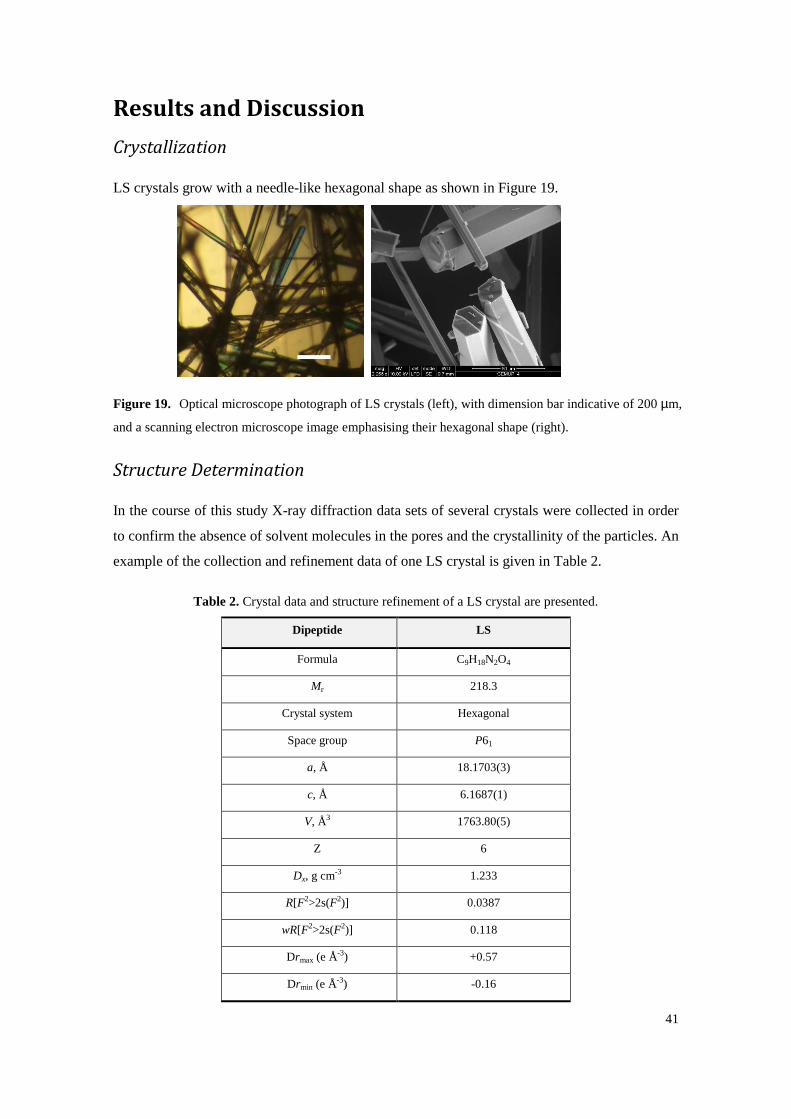
Figure 19. Optical microscope photograph of LS crystals (left), with dimension bar indicative of 200
µm, and a scanning electron microscope image emphasising their hexagonal shape (right). ............................................................................................................................................. 41
Figure 20. Adsorption equilibrium isotherms at 293.15 K expressed as the number of guest molecules per nm of LS nanochannels. ................................................................................................. 42
Figure 21. LS crystals formed on the drop growing in different directions (left). Crystals are collected from the drop and placed on a glass microscope slide allowing their separation and facilitating the process of attaching a single crystal into a glass capillary (right). ............... 42
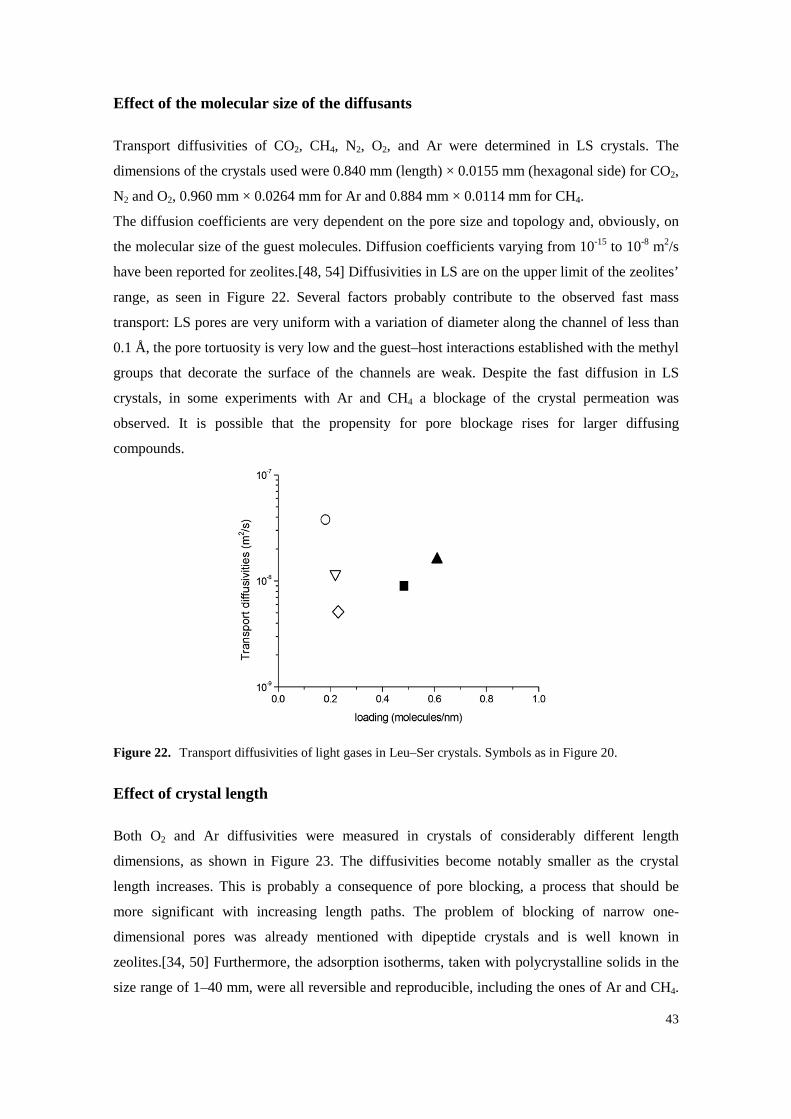
Figure 22. Transport diffusivities of light gases in Leu–Ser crystals. Symbols as in Figure 20. ........... 43
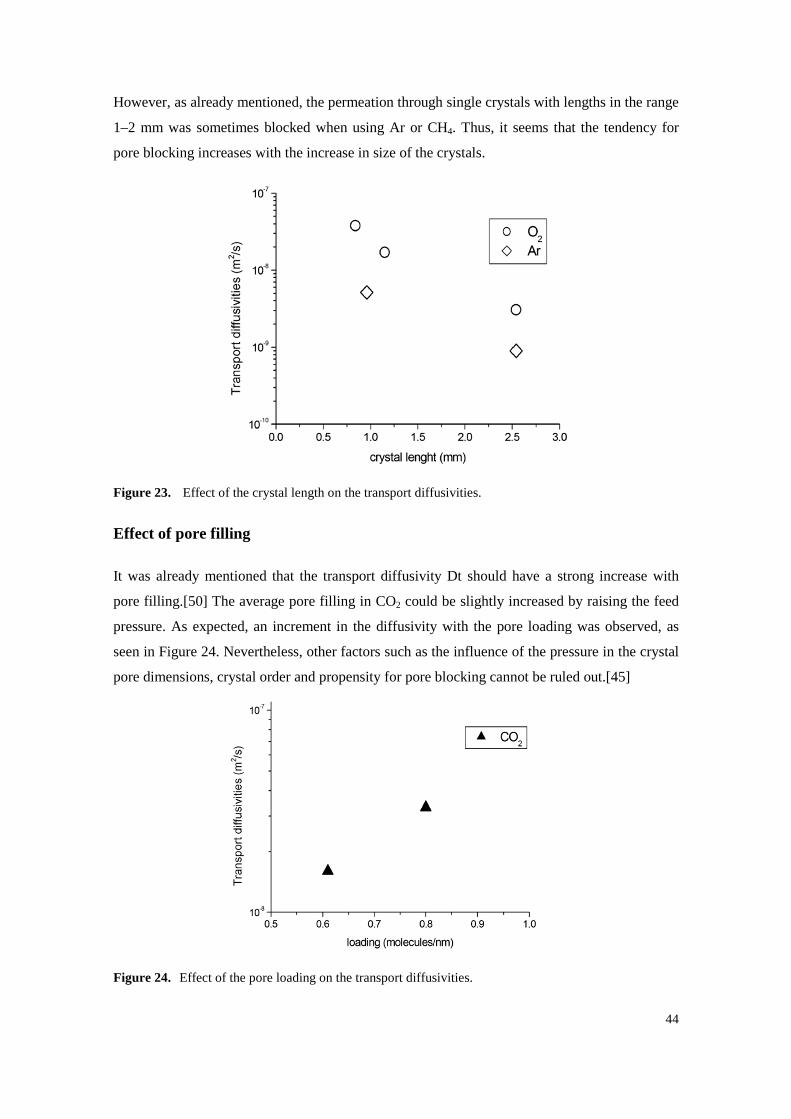
Figure 23. Effect of the crystal length on the transport diffusivities. ..................................................... 44
Figure 24. Effect of the pore loading on the transport diffusivities. ...................................................... 44
7
Figure 25. Effect of temperature on the transport diffusivities. ............................................................. 45
Figure 26. Scheme of the experimental setup used for the single-crystal permeation experiments. ...... 50
Figure 27. Crystal structure of ice Ih at 150 K viewed along the c-axis. Hydrogen atoms are not shown. ............................................................................................................................................. 51
Figure 28. Feed pressure drop normalized by the pressure gradient across the ice crystal. ................... 52
Figure 29. Temperature effect of the ice Ih permeability towards helium. Pressure drop in the feed gas chamber. ............................................................................................................................... 52
Figure 30. Ice Ih selectivity of argon, methane, nitrogen, oxygen and hydrogen, relative to helium. .... 53
Figure 31. Ice Ih hexagonal ring dimensions at (a) 150 K; (b) 195 K; and (c) 240 K. ........................... 54
Figure 32. Thermal ellipsoids of the oxygen atoms of ice Ih crystal structures formed inside 0.1 mm capillaries at 150 K, 195 K and 240 K (from light to dark grey respectively). The three ellipsoids are shown at the same probability level. .............................................................. 55
Figure 33. Schematic representation of a two-stranded coiled coil viewed from the top. Hydrophobic interactions take place within the core residues (a and d) whereas electrostatic interactions occur between proximal residues (e and g). ......................................................................... 63
Figure 34. Scheme representing a peptide amphiphile (PA) and the basic design principles underlying its construction. (A) Chemical structure of the peptide amphiphile with depiction of each structural region. (B) Molecular model of the PA. (C) Self-assembly of PA molecules leads to a cylindrical micelle. Reprinted from Hartgerink with AAAS permission[122] ............. 68
Figure 35. Structural formulae of Fmoc (F), pyrene (P) and naftalene (N) and spiropyran (S). ........... 70
Figure 36. N-Diazeniumdiolate (NONOate) structural formula where the nucleophile is a secondary amine. In the case of primary amines one of the R should be a hydrogen atom. ................. 75
Figure 37. Griess reaction scheme. Sulfanilic acid reacts with nitrite to form a diazonium salt intermediate that then reacts with N-(1-napthyl)ethylenediamine to form an azo dye with a peak absorbance at 548 nm. ................................................................................................. 81
Figure 38. Chromatogram of a purified Fmoc-PXG, resulting in a 99.7% HPLC purity. To perform these analyses, a 15 cm long C18 silica column was used with a linear gradient elution of 0 to 100% of acetonitrile in an aqueous solution with 0.05% TFA. Elution ran for 30 minutes at 1 ml.min-1 flow-rate, and detection was made at a wavelength of 220 nm. ..................... 85
Figure 39. Chromatogram of a purified PXG, resulting in a 96.6% HPLC purity. To perform these analyses, a 15 cm long C18 silica column was used with a linear gradient elution of 0 to 100% of acetonitrile in an aqueous solution with 0.05% TFA. Elution ran for 30 minutes at 1 ml.min-1 flow-rate, and detection was made at a wavelength of 220 nm. ......................... 85
Figure 40. Mass spectrum of Fmoc-PXG obtained by electrospray ionization (positive mode), in a quadrupole ion trap mass spectrometer, confirming the molecular mass expected for Fmoc-PXG, detected as di- (P/2), tri- (P/3) and tetraprotonated (P/4) cationic adducts of the target peptide. ................................................................................................................................. 86
8
Figure 41. Mass spectrum of PXG obtained by electrospray ionization, in a quadrupole ion trap mass spectrometer, confirming the molecular mass expected for PXG detected as di- (P/2), tri- (P/3), tetra- (P/4) and pentaprotonated (P/5) cationic adducts of the target peptide. ........... 86
Figure 42. Self-assembly of Fmoc-PXG leads to a self-standing translucent hydrogel, on the right, whereas PXG, under the same conditions results in no macroscopic signs of self-assembly and gel formation. ................................................................................................................ 87
Figure 43. Amino acid sequence of pexiganan schematically representing its relative hydrophobicites. Hydrophilic residues are highlighted on top (blue) and hydrophobic residues are represented on the bottom (orange) with longer rectangles characterizing the more hydrophobic residues. Dark orange depicts the aromatic group present, phenylalanine. ..... 87
Figure 44. Calibration curve of the ninhydrin assay, obtained with glycine solutions at concentrations
that ranged from 10 to 200 µM. Error bars are the result of three independent experiments. (R square equals 0.997). ....................................................................................................... 88
Figure 45. Calibration curve for nitric quantitation via Griess assay, obtained with sodium nitrite
standard solutions at concentrations that ranged from 1 to 100 µM. Absorbance was measured at wavelength 548 nm. Error bars are the result of three independent experiments. (R square equals 0.997). ....................................................................................................... 89
Figure 46. Cumulative nitrite release profile of a 100 µM Fmoc-PXG/NO solution quantified via
Griess reaction assay. The solution was produced from reaction of a 30 µM Fmoc-PXG solution with NO(g) and resulted in a 60% functionalization. ............................................. 90
Figure 47. Cumulative nitrite release profile of a 125 µM Fmoc-PXG/NO solution quantified via
Griess reaction assay. The solution was produced from reaction of a 400 µM Fmoc-PXG solution with NO(g) and resulted in a 14% functionalization. ............................................. 91
Figure 48. Dose response curves were generated for Fmoc-PXG and Fmoc-PXG/NO from a single experiment. Each point results from the average of triplicate samples. ............................ 93
Figure 49. Time-Kill plots for different concentrations of peptide with filled and dashed lines representing Fmoc-PXG and Fmoc-PXG/NO data respectively. The grey squares represent the control. ........................................................................................................................... 94
Figure 50. Collagen accumulated in the culture medium as a function of NO donor concentration. Collagen is graphed in blue columns and DNA in orange triangles at each concentration. Standard deviations are represented in bars and results from three independent experiments. 97
Figure 51. Fmoc-PXG and Fmoc-PXG/NO (100 µM) samples were processed according to the Sircol protocol and are shown in the first two columns, respectively. For comparison, a third column is shown, representing the result of collagen assessment by Sircol assay, of culture
medium of fibroblasts incubated with a 100 µM Fmoc-PXG solution. ............................... 98
Figure 52. Collagen assessed by Sirius Red reaction. The left column represents the assessment of
Collagen of a sample of 100 µM Fmoc-PXG whereas C10, C50 and C100 are the result of collagen quantification from culture medium samples of fibroblasts incubated with 10, 50
and 100 µM of Fmoc-PXG, respectively. ............................................................................ 99
9
Figure 53. Collagen deposited onto the extracellular matrix versus NO donor concentration. Collagen is represented in light blue columns and DNA in orange triangles. Standard deviations are represented in bars and result from three independent measurements. .............................. 100
Figure 54. UV Spectra of Fmoc-PXG prior its reaction with NO gas, filled line, and after reaction, dashed line. ........................................................................................................................ 109
Figure 55. Mass spectrum of Fmoc-PXG, prior to its reaction with NO gas, obtained by electrospray ionization (positive mode), in a quadrupole ion trap mass spectrometer. It confirms the molecular mass expected for Fmoc-PXG, detected as di- (P/2), tri- (P/3), tetra- (P/4), penta- (P/5) and hexaprotonated (P/6) cationic adducts of the target peptide. .............................. 110
Figure 56. Mass spectrum of Fmoc-PXG following reaction with NO gas, abbreviated as Fmoc-PXG/NO. Mass spectrum was obtained by electrospray ionization (positive mode), in a quadrupole ion trap mass spectrometer. ............................................................................. 110
Figure 57. Mass spectrum of Fmoc-PXG obtained by matrix-assisted laser desorption/ionization (positive mode) in time-of-flight mass spectrometry. ........................................................ 111
Figure 58. Mass spectrum of Fmoc-PXG/NO obtained by matrix-assisted laser desorption/ionization (positive mode) in time-of-flight mass spectrometry. ........................................................ 112
Figure 59. Infrared spectra of Fmoc-PXG prior (in blue) and following (in red) reaction with NO gas. ........................................................................................................................................... 113
Figure 60. Collagen quantified via Sircol assay for increasing fibroblast densities. ............................ 115
Figure 61. Collagen produced by fibroblasts incubated with different concentrations of NO donor SNAP, in culture medium without FBS. ............................................................................ 117
Figure 62. Collagen produced by fibroblasts incubated with different concentrations of NO donor SNAP, in culture medium with 10% FBS. ......................................................................... 118
10
LIST OF TABLES
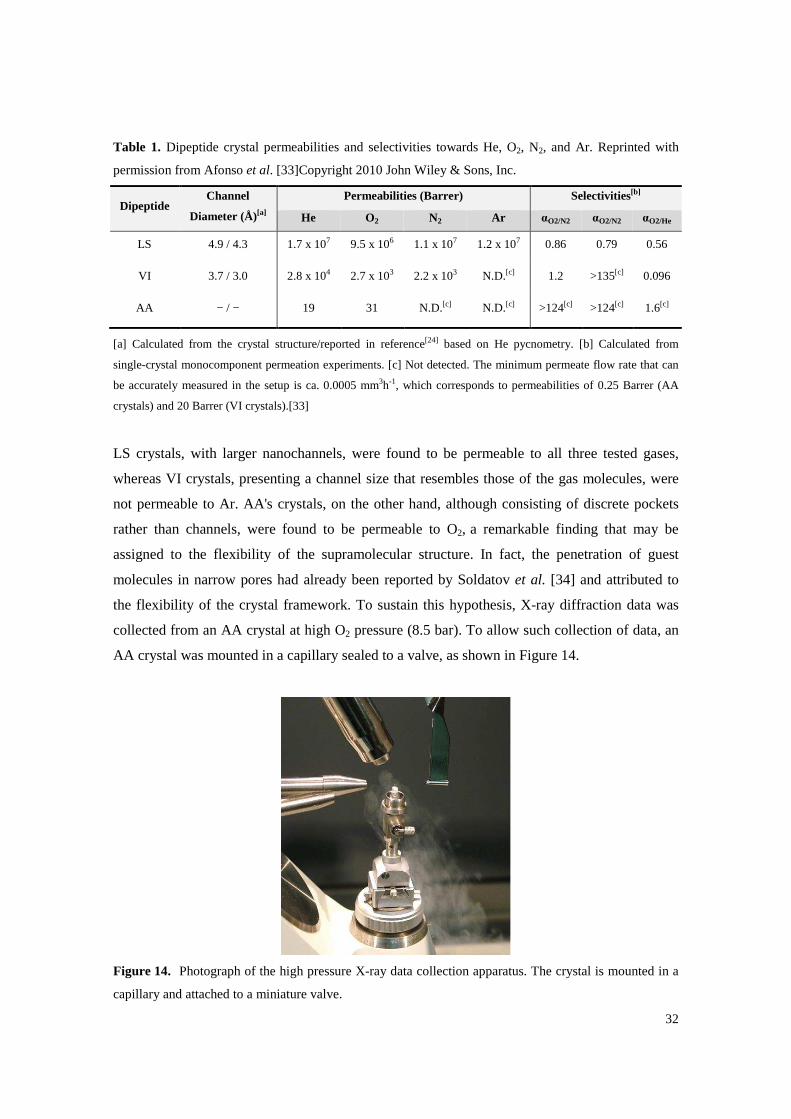
Table 1. Dipeptide crystal permeabilities and selectivities towards He, O2, N2, and Ar. Reprinted with permission from Afonso et al. [33]Copyright 2010 John Wiley & Sons, Inc............................ 32
Table 2. Crystal data and structure refinement of a LS crystal are presented. ........................................... 41
Table 3. Kinetic diameters and excluding temperatures of the gas compounds. ....................................... 53
Table 4. Ninhydrin assay was performed on the solution resulting from the reaction of peptide with NO gas. Absorbance values, as well as the number of primary amine molecules calculated by the calibration curve are shown. ...................................................................................................... 90
Table 5. IC50 and IC90 determined from the dose response curve nonlinear regression for Fmoc-PXG (R square 0.992) and Fmoc-PXG/NO (R square 0.943). ................................................................ 93
Table 6. Log reductions of viable colonies treated with Fmoc-PXG or Fmoc-PXG/NO versus untreated bacteria colonies for peptides concentration 19 µM. ................................................................. 95
Table 7. Log reductions of viable colonies treated with Fmoc-PXG or Fmoc-PXG/NO versus untreated bacteria colonies for peptides concentration 9 µM. ................................................................... 95
Table 8. Infrared absorption peaks for both Fmoc-PXG and Fmoc-PXG/NO. Both samples present the typical Amide I and Amide II bands, highlighted in light and dark blue, respectively. .......... 113
Table 9. Collagen quantified via Sircol assay through different pepsin digestion procedures. Values are the result of triplicate analysis. ................................................................................................ 116
Table 10. Collagen quantified via Sircol assay using different ultracentrifugation columns. Values are the result of triplicate analysis. ...................................................................................................... 116
11
LIST OF ABBREVIATIONS Amino Acids
cDNA, complementary DNA
A or Ala, Alanine
CH4, methane
C or Cys, Cysteine
Cha, cyclohexylalanine
D or Asp, Aspartic acid
Co, Cobalt
E or Glu, Glutamic acid
CO2, carbon dioxide
F or Phe, Phenylalanine
COMPcc, oligomeric matrix protein coiled-coil
G or Gly, Glycine
CSP, coiled coil structure protein
H or His, Histidine
CuKa radiation - copper K alfa radiation
I or Ile, Isoleucine
D, coefficient of diffusion or diffusivity
K or Lys, Lysine
DCM, dichloromethane
L or Leu, Leucine
DFU, diabetic foot ulcer
M or Met, Methionine
DIEA, N-ethyl-N,N-diisopropylethylamine
N or Asn, Asparagine
DMF, N,N-dimethylfomamide
P or Pro, Proline
Ds, self-diffusivity
Q or Gln, Glutamine
Dt, transport (or chemical) diffusivity
R or Arg, Arginine
Dt0, the Maxwell–Stefan diffusivity
S or Ser, Serine
E. Coli, Escherichia coli
T or Thr, Threonine
eNOS, endothelial NOS
V or Val, Valine
ESI-MS, electrospray ionization mass spectrometry
W or Trp, Tryptophan
FDA, food and drug administration
Y or Tyr, Tyrosine
Fmoc, fluorenylmethoxycarbonyl
Fmoc-PXG, Fmoc-Pexiganan
Others FTIR, Fourier transform infrared
ACN, acetonitrile
GSNO, S-nitroso-glutathione
Ar, argon
GTN, nitroglycerin
c, concentration gradient
H2, hydrogen
CCD, charge coupled device
HBTU, 2-(1H-benzotriazol-1-yl)-1,1,3,3-tetramethyluronium hexafluorophosphate
12
He, helium
PEG, Poly(ethylene glycol)
I2, iodine
pKa, logarithm of acid dissociation constant
iNOS, inducible NOS
PVA, Poly(vinyl alcohol)
ISMN, isosorbide mononitrate
PXG, Pexiganan
J, flux density
RHCC, right-handed coiled coil
LMWGs, low-molecular-weight gelators
rmsd, root mean square displacement
MBHA Resin, Rink-amide 4-methyl-benzhydrylamine
RNS, reactive nitrogen species
MBioF, metal-biomolecule framework
RP-HPLC, high pressure liquid chromatography
MOF, metal-organic framework
SAF, self-assembled fibers
MPLC, medium pressure liquid chromatography
SNP, sodium nitroprusside
SPPS, solid phase peptide synthesis
MTBE, methyl tert-butyl ether
TFA, Trifluoroacetic acid
N2, nitrogen
TIS, triisopropylsilane
NO, nitric oxide
UV, ultraviolet
NONOates, N-bound Diazeniumdiolate
VEGF, vascular endothelial growth factor
NOS, nitric oxide synthase
Vfeed, volume of feed chamber
O2, oxygen
Vsample, volume of sample chamber
PAs, Peptide amphiphiles
Xe, xenon
Zn, Zinc

13
CHAPTER I
INTRODUCTION

14
15
I.1. Overview of Molecular Self-assembly
The development of materials on a nanometer scale has had a striking impact on several fields
of science and brings together knowledge from a multitude of areas as diverse as applied
physics, materials science, supramolecular chemistry, mechanical and electrical engineering.
Nowadays, application of nanotechnology goes far beyond the traditional information
technology field and in fact is currently being applied into medicine through the discovery of
biomarkers, molecular diagnostics and drug discovery and delivery. [1, 2]
Advances within the field of nanotechnology include the development of more precise and
predictive fabrication techniques.
A conventional approach to manufacturing is based on the “top down” concept, which seeks to
create smaller devices by using larger ones to direct their assembly, such as the lithography
process. However, to finely control the structure and function of materials at the molecular level,
a new approach needs to be brought into action. Molecular self-assembly, defined as the process
by which supramolecular structures are spontaneously formed through non-covalent interactions,
has emerged as a viable alternative to traditional manufacturing techniques. Such process is part
of the so called “bottom up” mechanism, in opposition to the already mentioned “top down”.
Both are illustrated in Figure 1.
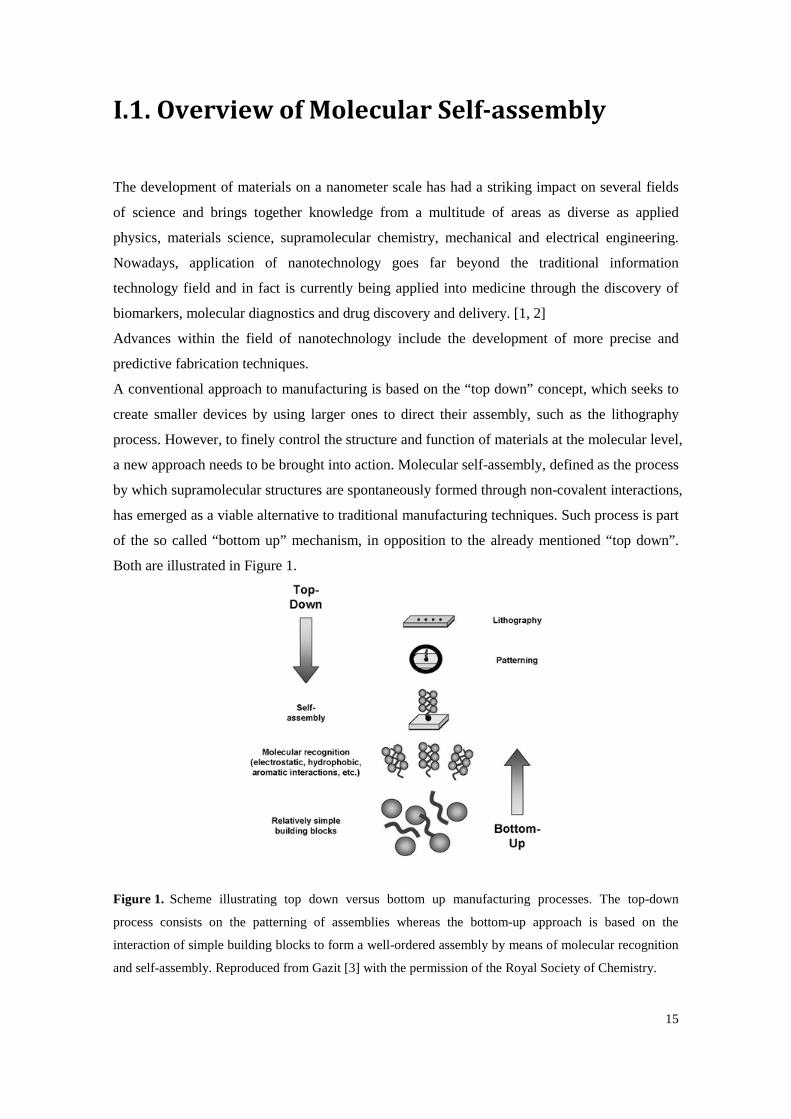
Figure 1. Scheme illustrating top down versus bottom up manufacturing processes. The top-down
process consists on the patterning of assemblies whereas the bottom-up approach is based on the
interaction of simple building blocks to form a well-ordered assembly by means of molecular recognition
and self-assembly. Reproduced from Gazit [3] with the permission of the Royal Society of Chemistry.
16
Many biological structures employ molecular self-assembling mechanisms, such as the
formation of DNA double helix from two complementary deoxyribonucleic acid strands, or the
interactions between four hemoglobin polypeptide chains to form a functional tetrameric
hemoglobin protein, or even through self-assembly of lipid bilayers in cell membranes.[4, 5] In
the case of DNA double helix, its structure is stabilized by hydrogen bonds formed by
complementary nucleotide bases and by the stacking of adjacent bases.[6] Scientists, inspired by
the remarkable specificity and robustness of these assemblies have engineered several
sophisticated structures, through single-stranded DNA self-assembly, just as illustrated in
Figure 2.[7, 8]
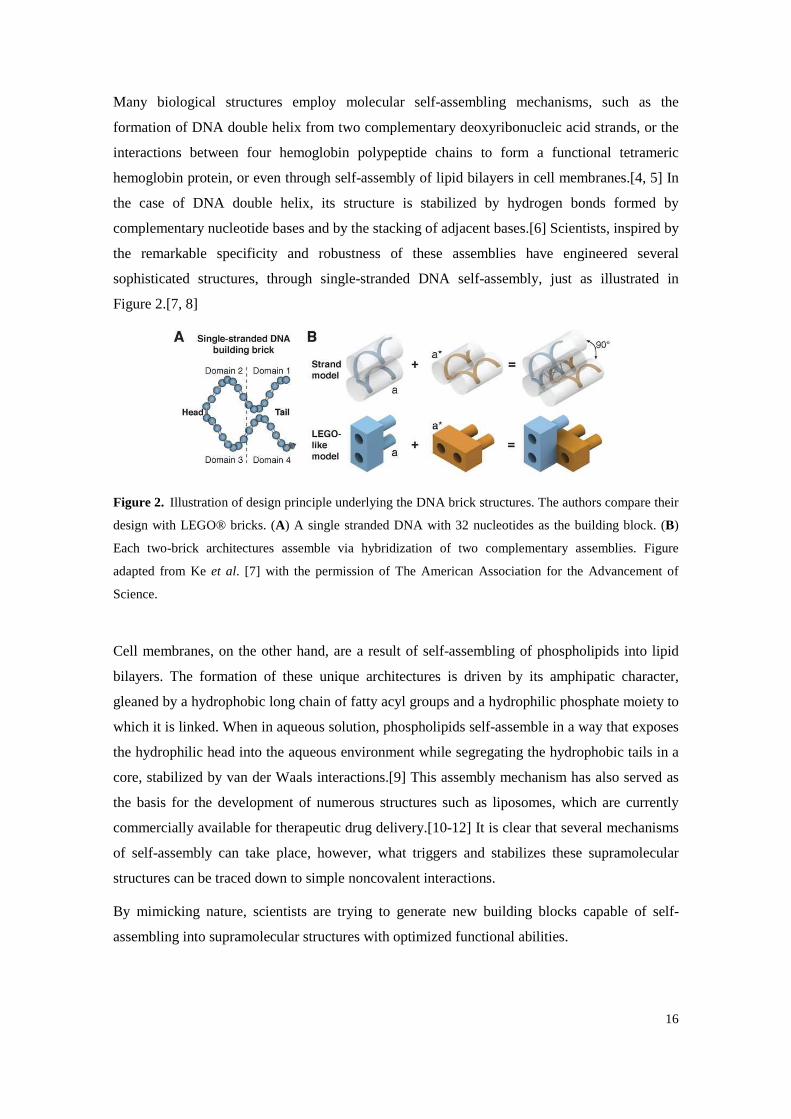
Figure 2. Illustration of design principle underlying the DNA brick structures. The authors compare their
design with LEGO® bricks. (A) A single stranded DNA with 32 nucleotides as the building block. (B)
Each two-brick architectures assemble via hybridization of two complementary assemblies. Figure
adapted from Ke et al. [7] with the permission of The American Association for the Advancement of
Science.
Cell membranes, on the other hand, are a result of self-assembling of phospholipids into lipid
bilayers. The formation of these unique architectures is driven by its amphipatic character,
gleaned by a hydrophobic long chain of fatty acyl groups and a hydrophilic phosphate moiety to
which it is linked. When in aqueous solution, phospholipids self-assemble in a way that exposes
the hydrophilic head into the aqueous environment while segregating the hydrophobic tails in a
core, stabilized by van der Waals interactions.[9] This assembly mechanism has also served as
the basis for the development of numerous structures such as liposomes, which are currently
commercially available for therapeutic drug delivery.[10-12] It is clear that several mechanisms
of self-assembly can take place, however, what triggers and stabilizes these supramolecular
structures can be traced down to simple noncovalent interactions.
By mimicking nature, scientists are trying to generate new building blocks capable of self-
assembling into supramolecular structures with optimized functional abilities.
17
I.2. Peptides as building blocks for self-
assembly
Among the several building blocks available, peptides are burgeoning as promising candidate
monomers for self-assembly. This is likely a consequence of the chemical and physical diversity
of natural and synthetic amino acids, holding side chains with a multiplicity of charges,
hydrophobicity and sizes. Such a diversity of properties is important, allowing a high level of
design versatility. The incorporation of certain amino acids will promote the formation of
specific interactions. For instance, the incorporation of acidic and basic amino acids may
promote electrostatic interactions, whereas the introduction of aromatic amino acids may lead to
π-π interactions. The different types of interactions and the amino acids that promote them are
depicted in Figure 3. Ultimately, a meticulous selection of the amino acids that constitute the
peptide enables a certain level of prediction of noncovalent interactions that will take place.
This is partly the basis of rational design of peptide-based self-assembled materials. In addition
to its versatility, peptides have potential for being explored into medical applications due to the
likelihood of biocompatibility and biodegradability.[13]
18
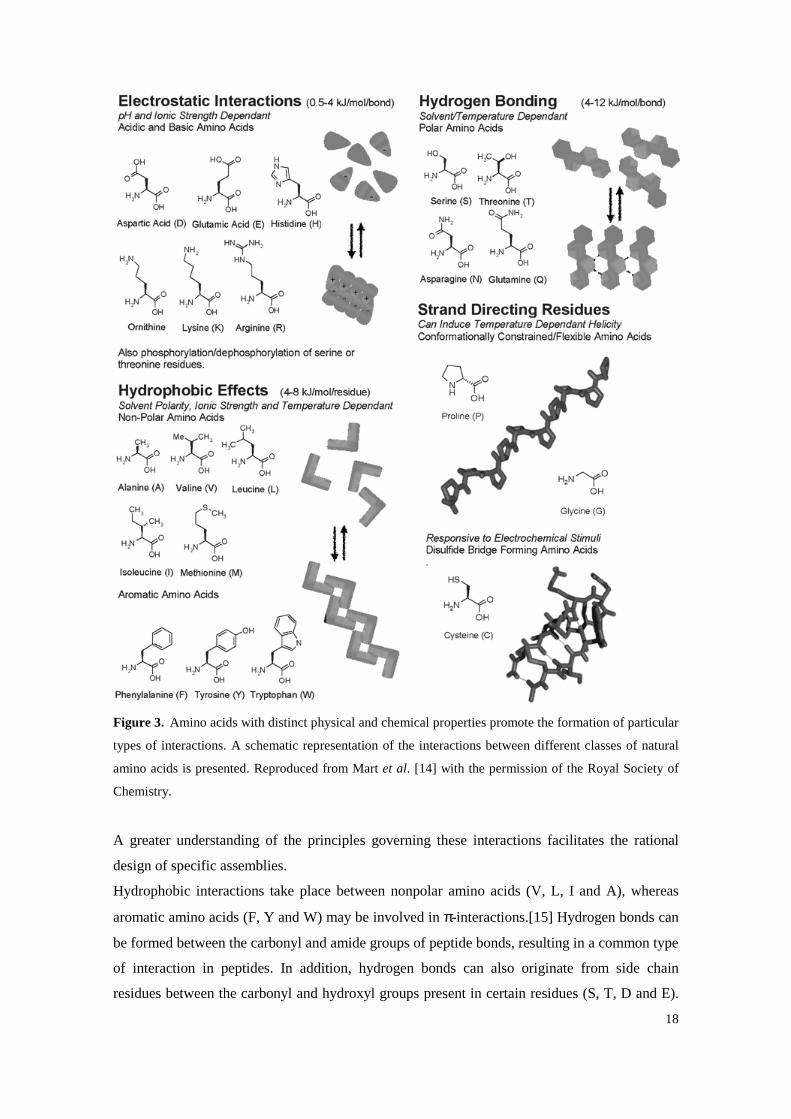
Figure 3. Amino acids with distinct physical and chemical properties promote the formation of particular
types of interactions. A schematic representation of the interactions between different classes of natural
amino acids is presented. Reproduced from Mart et al. [14] with the permission of the Royal Society of
Chemistry.
A greater understanding of the principles governing these interactions facilitates the rational
design of specific assemblies.
Hydrophobic interactions take place between nonpolar amino acids (V, L, I and A), whereas
aromatic amino acids (F, Y and W) may be involved in π-interactions.[15] Hydrogen bonds can
be formed between the carbonyl and amide groups of peptide bonds, resulting in a common type
of interaction in peptides. In addition, hydrogen bonds can also originate from side chain
residues between the carbonyl and hydroxyl groups present in certain residues (S, T, D and E).
19
Ionic interactions, on the other hand, arise between positively and negatively charged amino
acids (R, K, D and E). The diversity of interactions that can occur between peptides, gives us a
glimpse of the myriad of possible combinations of assemblies that can be achieved.
Materials with the ability to change properties in response to local environmental cues are
particularly attractive for biomedical applications, allowing, for instance, controlled release of a
drug incorporated in a matrix in response to an external stimuli, such as pH, temperature or
ionic strength.[14] Peptides are molecules with responsive aptitude and can therefore be
incorporated in biomaterials to induce a macroscopic change to the material when subjected to
specific shifts in environmental conditions. For example, given that protonation and
deprotonation of functional groups is a function of pKa, a pH shift may be sufficient to hamper
pre-existing interactions. Such a pH shift can therefore induce the formation or destruction of
interactions that may lead to physicochemical shifts and can ultimately induce macroscopic
changes to the material. Such dynamic behaviour allows the production of smart materials that
modify their macromolecular structure according to environmental shifts.[14, 16]
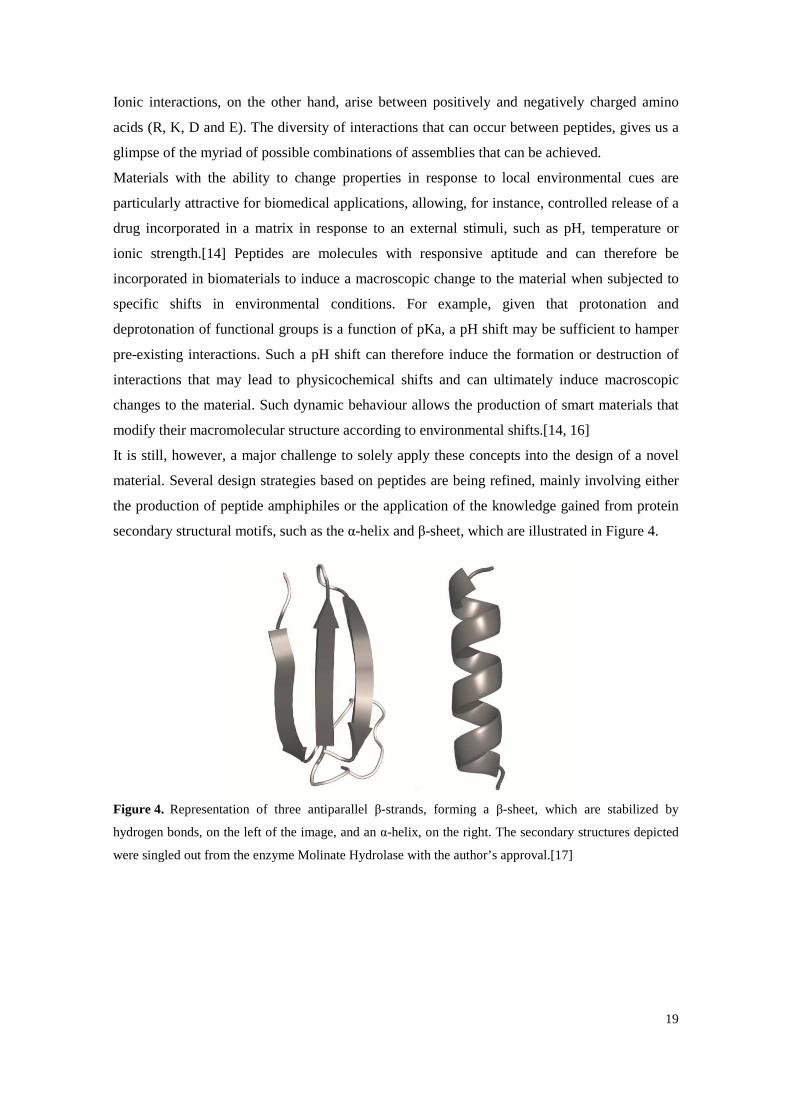
It is still, however, a major challenge to solely apply these concepts into the design of a novel
material. Several design strategies based on peptides are being refined, mainly involving either
the production of peptide amphiphiles or the application of the knowledge gained from protein
secondary structural motifs, such as the α-helix and β-sheet, which are illustrated in Figure 4.
Figure 4. Representation of three antiparallel β-strands, forming a β-sheet, which are stabilized by
hydrogen bonds, on the left of the image, and an α-helix, on the right. The secondary structures depicted
were singled out from the enzyme Molinate Hydrolase with the author’s approval.[17]
20
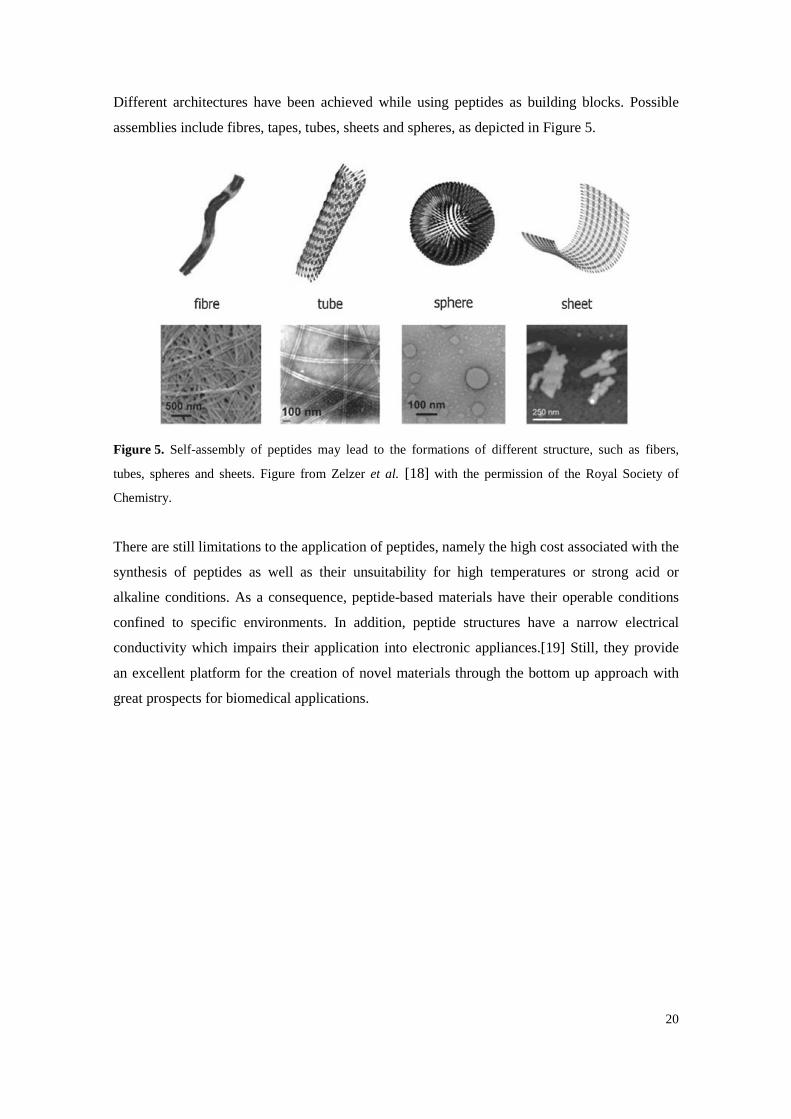
Different architectures have been achieved while using peptides as building blocks. Possible
assemblies include fibres, tapes, tubes, sheets and spheres, as depicted in Figure 5.
Figure 5. Self-assembly of peptides may lead to the formations of different structure, such as fibers,
tubes, spheres and sheets. Figure from Zelzer et al. [18] with the permission of the Royal Society of
Chemistry.
There are still limitations to the application of peptides, namely the high cost associated with the
synthesis of peptides as well as their unsuitability for high temperatures or strong acid or
alkaline conditions. As a consequence, peptide-based materials have their operable conditions
confined to specific environments. In addition, peptide structures have a narrow electrical
conductivity which impairs their application into electronic appliances.[19] Still, they provide
an excellent platform for the creation of novel materials through the bottom up approach with
great prospects for biomedical applications.
21
I.3. Aim and Thesis Outline
The present PhD thesis explores peptide-based self-assembled materials and unravels some of
its potential applications. Peptides may range from short to long and more flexible chains
enabling the construction of structurally diverse arrangements, from solid crystals to soft
disordered materials. Both types of materials were here explored for the loading and delivery of
gas molecules. While microporous peptide crystals, may find application as materials for
physical adsorption/separation of relevant industrial gases (Chapter II), soft peptide materials
can only retain gas molecules that are chemically adsorbed. Here, the loading and delivery of
the gasotransmitter NO, through chemical functionalization of a self-assembled peptide, was
studied, a process of biomedical interest (Chapter III).

22
23
CHAPTER II
CRYSTALLINE MATERIALS BY
PEPTIDE SELF-ASSEMBLY

24
25
II.1. Overview of Peptide Self-assembly
forming Crystalline Materials
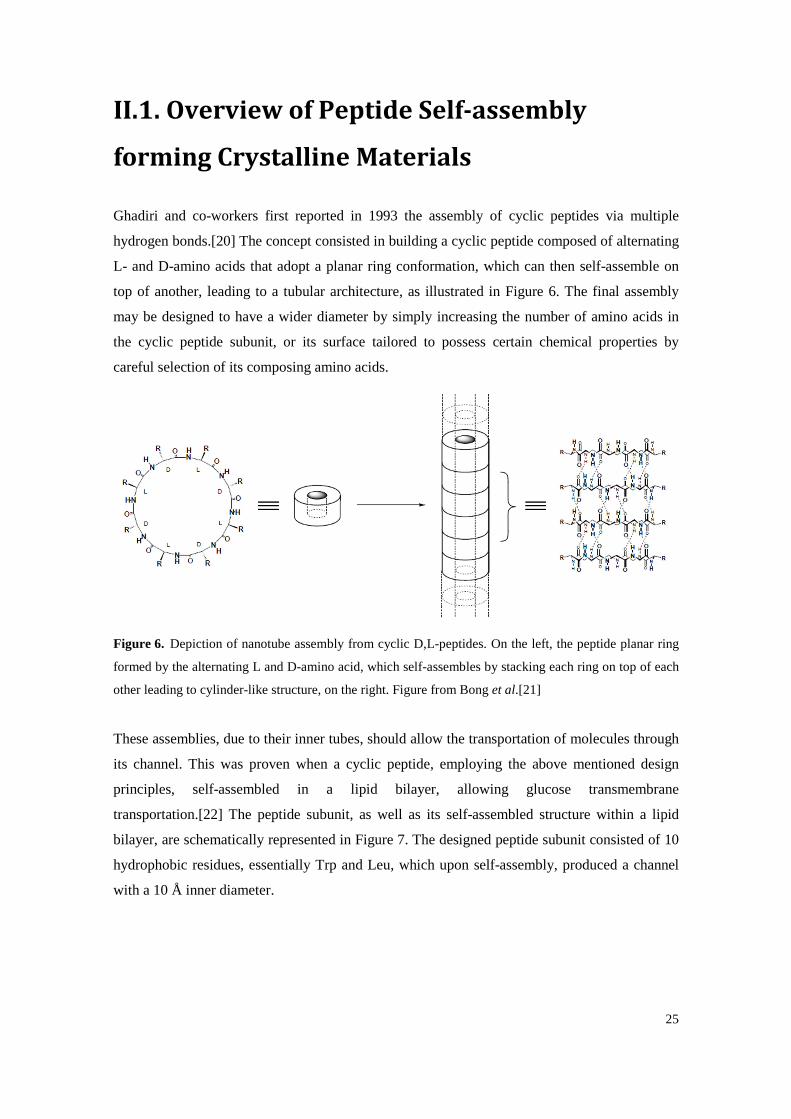
Ghadiri and co-workers first reported in 1993 the assembly of cyclic peptides via multiple
hydrogen bonds.[20] The concept consisted in building a cyclic peptide composed of alternating
L- and D-amino acids that adopt a planar ring conformation, which can then self-assemble on
top of another, leading to a tubular architecture, as illustrated in Figure 6. The final assembly
may be designed to have a wider diameter by simply increasing the number of amino acids in
the cyclic peptide subunit, or its surface tailored to possess certain chemical properties by
careful selection of its composing amino acids.
Figure 6. Depiction of nanotube assembly from cyclic D,L-peptides. On the left, the peptide planar ring
formed by the alternating L and D-amino acid, which self-assembles by stacking each ring on top of each
other leading to cylinder-like structure, on the right. Figure from Bong et al.[21]
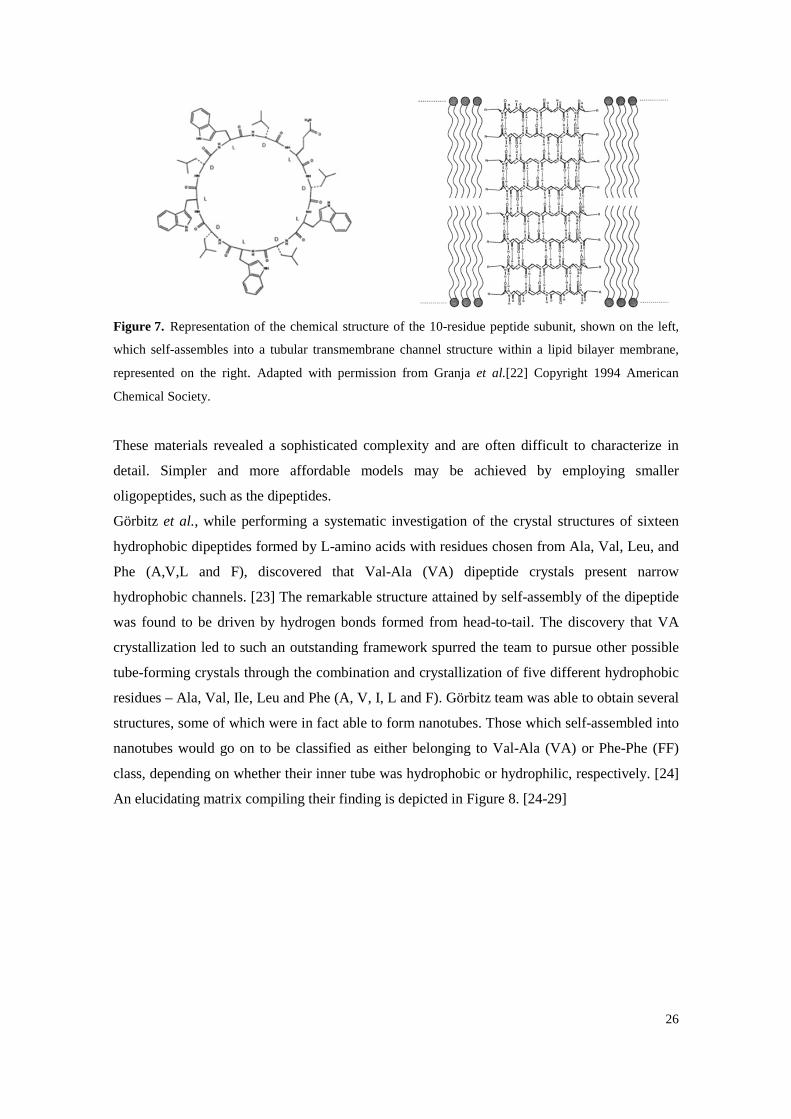
These assemblies, due to their inner tubes, should allow the transportation of molecules through
its channel. This was proven when a cyclic peptide, employing the above mentioned design
principles, self-assembled in a lipid bilayer, allowing glucose transmembrane
transportation.[22] The peptide subunit, as well as its self-assembled structure within a lipid
bilayer, are schematically represented in Figure 7. The designed peptide subunit consisted of 10
hydrophobic residues, essentially Trp and Leu, which upon self-assembly, produced a channel
with a 10 Å inner diameter.
26
Figure 7. Representation of the chemical structure of the 10-residue peptide subunit, shown on the left,
which self-assembles into a tubular transmembrane channel structure within a lipid bilayer membrane,
represented on the right. Adapted with permission from Granja et al.[22] Copyright 1994 American
Chemical Society.
These materials revealed a sophisticated complexity and are often difficult to characterize in
detail. Simpler and more affordable models may be achieved by employing smaller
oligopeptides, such as the dipeptides.
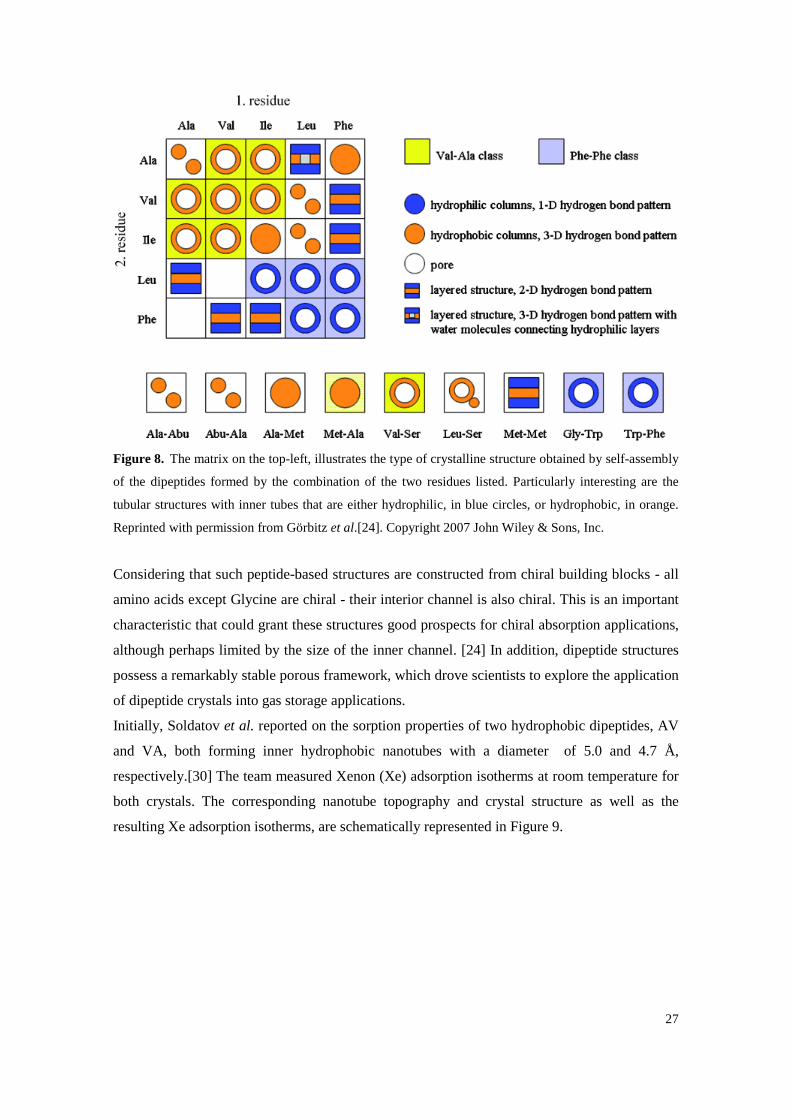
Görbitz et al., while performing a systematic investigation of the crystal structures of sixteen
hydrophobic dipeptides formed by L-amino acids with residues chosen from Ala, Val, Leu, and
Phe (A,V,L and F), discovered that Val-Ala (VA) dipeptide crystals present narrow
hydrophobic channels. [23] The remarkable structure attained by self-assembly of the dipeptide
was found to be driven by hydrogen bonds formed from head-to-tail. The discovery that VA
crystallization led to such an outstanding framework spurred the team to pursue other possible
tube-forming crystals through the combination and crystallization of five different hydrophobic
residues – Ala, Val, Ile, Leu and Phe (A, V, I, L and F). Görbitz team was able to obtain several
structures, some of which were in fact able to form nanotubes. Those which self-assembled into
nanotubes would go on to be classified as either belonging to Val-Ala (VA) or Phe-Phe (FF)
class, depending on whether their inner tube was hydrophobic or hydrophilic, respectively. [24]
An elucidating matrix compiling their finding is depicted in Figure 8. [24-29]
27
Figure 8. The matrix on the top-left, illustrates the type of crystalline structure obtained by self-assembly
of the dipeptides formed by the combination of the two residues listed. Particularly interesting are the
tubular structures with inner tubes that are either hydrophilic, in blue circles, or hydrophobic, in orange.
Reprinted with permission from Görbitz et al.[24]. Copyright 2007 John Wiley & Sons, Inc.
Considering that such peptide-based structures are constructed from chiral building blocks - all
amino acids except Glycine are chiral - their interior channel is also chiral. This is an important
characteristic that could grant these structures good prospects for chiral absorption applications,
although perhaps limited by the size of the inner channel. [24] In addition, dipeptide structures
possess a remarkably stable porous framework, which drove scientists to explore the application
of dipeptide crystals into gas storage applications.
Initially, Soldatov et al. reported on the sorption properties of two hydrophobic dipeptides, AV
and VA, both forming inner hydrophobic nanotubes with a diameter of 5.0 and 4.7 Å,
respectively.[30] The team measured Xenon (Xe) adsorption isotherms at room temperature for
both crystals. The corresponding nanotube topography and crystal structure as well as the
resulting Xe adsorption isotherms, are schematically represented in Figure 9.
28
Figure 9. (A) AV (left) and VA (right) dipeptide molecules assemble forming a channel (van der Waals
dimensions). (B) Sorption isotherms (298 K) of Xe in AV (solid circles) and VA (open circles). Θ is the
Xe/dipeptide molar ratio. Adapted with permission from Soldatov et al.[30] Copyright 2004 John Wiley
& Sons, Inc.
Even though the materials present similar channel sizes their sorption behaviour is remarkably
different, a phenomenon which the authors attribute to a tighter binding between the host
channel and the guest atom on the smaller VA channel. The authors realized that the studied
dipeptides had robust porous frameworks with a high sorption capacity and the ability of
preferential sorption, even towards chemically inert species such as Xe. These results
demonstrate that dipeptides with propensity to form tubular frameworks may be useful in
selective gas storage applications.
Comotti and co-workers, on the other hand, tested four crystalline dipeptides, also belonging to
the VA class – AV, VA, IV and VI– as sorbent materials for methane (CH4), carbon dioxide
(CO2) and hydrogen (H2), showing the remarkable adsorption capacities and once more
revealing the real potential of these dipeptide crystals. [31] The adsorption behaviour of the
above mentioned gases was analysed in the dipeptide crystals, which form channels with
distinct diameters of 5.0, 4.7, 3.9 and 3.7 Å (for AV, VA, IV and VI, respectively) and highly
hydrophobic walls. The chemical structures of the dipeptides employed, as well as the obtained
adsorption isotherms, are represented in Figure 10.
A B
29
Figure 10. (A) Chemical structures of AV, VA, IV and VI (on the top). Crystal structure of AV showing
the open hydrophobic channel of 5 Å (on the bottom). (B) Adsorption isotherms (isoT) of CO2 (full
symbol) and CH4 (open symbol) at 195 K for AV and VA. (C) Adsorption isoT of CO2 and CH4 in IV at
195 K. Adapted from Comotti et al. [31] with permission of The Royal Society of Chemistry.
The higher sorption capacity of VA over AV for both CO2 and CH4 (Figure 10B) is consistent
with Soldatov’s previously presented results, although the authors of this study attribute the
results to the larger volume available in the case of VA, which is made possible by the channel
helicity (see Figure 9A), albeit presenting a narrower channel cross-section, 5.0 Å and 4.7 Å for
AV and VA, respectively.
Interestingly, increased CO2/CH4 selectivity was achieved when employing a dipeptide crystal
with tighter channels - IV with a channel diameter of 3.9 Å (Figure 10C).
In our laboratory, adsorption isotherms of nitrogen (N2), oxygen (O2) and Ar were also
determined for dipeptide crystals belonging to the VA class (VI, IA, IV and VV).[32] The
graphs of the resulting adsorption isotherms, measured at 20ºC, were organized by material and
are represented in Figure 11.
A B
C
30
Figure 11. Adsorption Isotherms of Ar (circles), O2 (triangles) and N2 (diamonds) for each material, at
20ºC. The graphs are organized showing the dipeptides with wider pores on the bottom and narrower
pores on the top. Reproduced from Afonso et al. [32] with permission of The Royal Society of Chemistry.
Crystals with wider pores were shown to adsorb greater quantities of species, although not in
proportion to its cross-section. In all cases a remarkable Ar/O2 adsorption selectivity was
determined, reaching an incredible value of 1.27 in the case of VI dipeptide. Although its
application into oxygen purification processes may be hindered by its low capacity, these
materials are evidence of a new class of silver-free sorbents and provide chemical and structural
clues for designing new efficient sorbent materials.
Our team has also successfully employed dipeptide crystals as permselective materials.[33] We
have shown that dipeptide single-crystals can act as permeable membranes able to distinguish
between Ar, N2 and O2 - gas species which are highly relevant for industrial separation
processes.
In order to do so, three dipeptides – LS, VI and AA – were crystallized and its structure,
depicted in Figure 12, determined by single crystal X-ray diffraction.
31
Figure 12. Structural formula (on top) and crystal structure (on the bottom), of the three dipeptides
studied. Reprinted with permission from Afonso et al. [33] Copyright 2010 John Wiley & Sons, Inc.
Their distinct crystal lattices lead to a diversity of sizes and topographies in the pores. The void
volume that is accessible to helium (He) was determined for all crystal structures, as displayed
in Figure 13.
Figure 13. Crystal pore topography of the studied dipeptides as determined with a 2.6 Å probe.
Reprinted with permission from Afonso et al. [33] Copyright 2010 John Wiley & Sons, Inc.
LS, VI, and AA single-crystal permeabilities towards O2, N2, Ar, and He were determined at
room temperature, and selectivities were calculated. Results are shown in Table 1.
32
Table 1. Dipeptide crystal permeabilities and selectivities towards He, O2, N2, and Ar. Reprinted with
permission from Afonso et al. [33]Copyright 2010 John Wiley & Sons, Inc.
Dipeptide Channel
Diameter (Å)[a]
Permeabilities (Barrer) Selectivities[b]
He O2 N2 Ar αO2/N2 αO2/N2 αO2/He
LS 4.9 / 4.3 1.7 x 10⁷ 9.5 x 10⁶ 1.1 x 10⁷ 1.2 x 10⁷ 0.86 0.79 0.56
VI 3.7 / 3.0 2.8 x 10⁴ 2.7 x 10³ 2.2 x 10³ N.D.[c] 1.2 >135[c] 0.096
AA − / − 19 31 N.D.[c] N.D.[c] >124[c] >124[c] 1.6[c]
[a] Calculated from the crystal structure/reported in reference[24] based on He pycnometry. [b] Calculated from
single-crystal monocomponent permeation experiments. [c] Not detected. The minimum permeate flow rate that can
be accurately measured in the setup is ca. 0.0005 mm3h-1, which corresponds to permeabilities of 0.25 Barrer (AA
crystals) and 20 Barrer (VI crystals).[33]
LS crystals, with larger nanochannels, were found to be permeable to all three tested gases,
whereas VI crystals, presenting a channel size that resembles those of the gas molecules, were
not permeable to Ar. AA's crystals, on the other hand, although consisting of discrete pockets
rather than channels, were found to be permeable to O2, a remarkable finding that may be
assigned to the flexibility of the supramolecular structure. In fact, the penetration of guest
molecules in narrow pores had already been reported by Soldatov et al. [34] and attributed to
the flexibility of the crystal framework. To sustain this hypothesis, X-ray diffraction data was
collected from an AA crystal at high O2 pressure (8.5 bar). To allow such collection of data, an
AA crystal was mounted in a capillary sealed to a valve, as shown in Figure 14.
Figure 14. Photograph of the high pressure X-ray data collection apparatus. The crystal is mounted in a
capillary and attached to a miniature valve.
33
Traces of oxygen molecules were found in the AA channels at 8.5 bar of pure oxygen, as
depicted in Figure 15. It was also found that carbon-carbon distance of opposite methyl groups
increased, even if only slightly, from 5.467 to 5.473 Å, upon pressurization.
Figure 15. Crystal structure of AA with O2 viewed along the c axis (left) and along the b axis (right). O
atoms are coloured in red and C atoms in grey. Reprinted with permission from Afonso et al. [33]
Copyright 2010 John Wiley & Sons, Inc.
The permeabilities of the species were found to be size-dependent allowing the sequential
separation of argon, nitrogen and oxygen. The O2/N2 selectivity determined was very high, well
above those of polymeric and carbon-based materials.[33]
The increasing interest in the study of distinct sorption behaviour and transport properties on
nanotube materials is stimulated by its relevance into applications such as sensors, catalysts and
membranes for gas separation.
Dipeptides may also be used as organic linkers to build metal-biomolecule frameworks
(MBioFs), a subclass of the well-known Metal-Organic Frameworks (MOFs). [35] MOFs are
classified as crystalline hybrid materials, constructed by connecting organic linkers with metal
ions, often resulting in two- or three-dimensional periodic structures. Rabone et al. reported on a
MOF consisting of a glycylalanine (GA) dipeptide coordinated to zinc ions.[36] The material
appeared to behave mostly like a nonporous solid until a certain critical pressure was achieved,
at which point the material opened to allow gas adsorption. The authors argue that the
conformational degrees of freedom granted by the dipeptide linker are key to producing such a
responsive material. The same group has presented a glycylserine (GS) based MOF with a
transition behaviour from porous to nonporous, driven by hydrogen bonding patterns from the
hydroxyl group of serine residue. [37]
Our group has also explored different strategies in an attempt to generate dipeptide-metal 3D
frameworks.[38] Two new MBioFs were prepared and isolated: [Zn(Gly-Asp)]•H2O and
[Co(Gly-Asp)]•H2O. Their structure is represented in Figure 16.
34
Figure 16. (a) Structure of (1) [Zn(Gly-Asp)]·H2O and (2) [Co(Gly-Asp)]·H2O, (b) Coordination
modes of Zn2+ ions around the dipeptide GD in compound (1) and coordination modes of Co2+ ions
around the dipeptide GD in compound (2). Zn dark blue, Co violet, O red, C grey, N blue, H white. [38]
Gly-Asp (GD) was used as a precursor material for post-synthetic modification with the Arg-
Gly-Asp (RGD) tripeptide. The RGD sequence is a well-known cell attachment site of a large
number of proteins and integrins.[39] Of particular relevance is the αvβ3 integrin, which is
involved in tumour-induced angiogenesis and tumour metastasis.[40] RGD or RGD-analogues
binding to αvβ3 integrin can be exploited to target tumours.
1 2
35
II.2. Guest Diffusion in Dipeptide Crystals [41]
Based on the publication with the same title by:
Joana Durãoab and Luís Gales*ac
* Corresponding author a IBMC, Instituto de Biologia Molecular e Celular, Rua do Campo Alegre, 823, Porto,
Portugal b FEUP, Faculdade de Engenharia da Universidade do Porto, Rua Dr. Roberto Frias, Portugal c ICBAS, Instituto de Ciências Biomédicas Abel Salazar, Universidade do Porto, Rua de
Jorge Viterbo Ferreira n.° 228, Porto, Portugal
Crystal Engineering Communication, 2013, 15(8) p. 1532-1535
DOI: 10.1039/C2CE26392K
36
Abstract
The tubes formed by self-assembly of dipeptides provide an incredible platform to
experimentally measure transport properties at the nanoscale.
Herein, we exploit the unique packing of LS crystals to determine transport diffusivities of CO2,
CH4, N2, O2, and Ar and study the influence of several parameters such as crystal length,
temperature, pore loading and molecular size of the guests.
We show that the mass transport in LS crystals is fast, in the upper end of the values reported
for zeolites, and that the pore blocking may yield a significant effect on the overall results.
In addition to the systematic study of the intraparticle diffusion properties of dipeptide crystals
presented next, we conducted a similar study using other (inorganic) 1D porous crystals. Those
results are presented at the end of this chapter.
37
Introduction
Dipeptide crystals: structure and gas sorption behaviour
Organic molecules that form porous crystals tend to collapse upon removal of the co-
crystallized solvent.[42] Interestingly, hydrophobic dipeptides crystallize with hydrogen-bonded
head-to-tail chains in the shape of helices. The resulting structures have permanent chiral
channels with a van der Waals’ diameter up to 10 Å, tunable through residue substitution.[29]
Dipeptide crystals reversely adsorb significant amounts of gas molecules [30] and thus should
be considered porous materials.[43] Indeed, gas sorption applications look very promising for
this class of materials.[44] In 2004, Soldatov et al. argued that dipeptides could be used as
microporous adsorbents and reported that AV and VA have robust porous frameworks with a
high capacity towards chemically inert species such as Xe.[30] Later on, the Sozzani group have
used dipeptides as adsorbents of CO2, CH4 and H2, observing high and fully reversible
adsorption for all gases. The authors obtained high CH4/CO2 selectivity and good H2 uptake
using IV. [31] Recently, we have shown that dipeptide crystals are excellent permselective
materials capable of distinguishing compounds of very close molecular size. [33] It should be
noticed that dipeptides show unprecedented and interesting framework flexibility upon gas
adsorption, as was confirmed using different experimental approaches.[30, 33, 34, 45]
Remarkably, it was already observed that a zinc–glycylalanine framework exhibits a gate-
opening pressure towards CO2. The flexibility of the dipeptide plays a crucial role in the
structural changes upon adsorption.[36]
The Leu–Ser packing is unique among the class;[46] crystals possess hexagonal symmetry with
hydrophobic channels, decorated by the Leu side chains, running along the hexagonal axes.
The Leu–Ser pore diameter calculated from the crystal structure is in the range of 4.90–4.96 Å,
while assessed from He pycnometry is 4.3 Å.[34] Another crystal with hexagonal channels,
formed by only one amino acid, c-amino butyric acid, was already described. However its
microporous behaviour upon removal of the solvent guest was not yet confirmed.[47] In the
case of Leu–Ser, there is a complete loss of cocrystallized solvent (acetonitrile) and re-uptake of
an inorganic molecule (I2) with full retention of the supramolecular host network (peptide). [46]
General mass transport model
Diffusion is the process of random motion of molecules that is quantified by Fick’s first law,
shown in equation (1):
� = −�(�)�
� (1)
38
correlating the flux density, J, with the gradient of concentration, c, of the diffusing species in
the z direction. D is the coefficient of diffusion or diffusivity.
There are several distinct diffusion coefficients associated with different physical concepts of
diffusion in porous materials.[48, 49] The diffusion of individual molecules in the limit of
vanishing concentrations under equilibrium is described by the self-diffusivity, Ds. The
macroscopic diffusion of mass that arises in the presence of a concentration gradient is governed
by the transport (or chemical) diffusivity, Dt. Molecular transport under the so-called “single-
file conditions” is characterized by the fact that any mutual passage between adjacent molecules
is forbidden, [50] which is expected to be true within the narrow channels of LS crystals.
Single-file Xe diffusion was already unequivocally confirmed in the 5.1 Å wide nanotubes of
AV crystals at long time scales. [51, 52] Assuming one-dimensional channels with diameters
close to those of the diffusants and sufficiently long channels, the self-diffusion drops to zero,
leading to mean square displacements increasing only with the square root of time. In these
conditions, as well as in many practical applications, such as pressure-driven membrane
separation, it is the transport diffusion that is of great interest.[48]
The overall effect of surface coverage in the transport diffusion coefficient is given by:
��� =��� ln
� ln� (2)
where Dt0 is the Maxwell–Stefan diffusivity also referred to as “corrected diffusivity”. If the
corrected diffusivity is independent of surface coverage and the adsorption isotherm deviates
from linearity, Dt exhibits a sharp increase with pore filling. Such behaviour was already
experimentally observed.[50]
39
Materials and Methods
Crystallization
LS (Bachem) crystals were grown through phase inversion of an aqueous solution by
acetonitrile diffusion. Phase inversion was performed on crystallization plates (Emerald
BioSystems Combiclover, Jr), by sitting drop crystallization. A 200 µL volume of acetonitrile
was pipetted into each well and 5 µL of peptide aqueous solution was placed on each drop. The
peptide solution concentration was 233 mg.mL-1. Crystals were collected and solvent
evaporation was performed overnight in an oven (Memmert UL 30) at 60 ºC. Precession
photographs of the peptide crystals were taken using an X-ray Diffractometer (Gemini PX
Ultra) equipped with CuKα radiation (l =1.54184 A°), a 4-circle kappa goniometer and a CCD
Detector, to determine the orientation of the c-crystallographic axis (i.e. the orientation of the
nanotubes) within the crystals. Crystals suitable for X-ray diffraction had a needle-like
hexagonal shape.
Structure Determination
Diffraction data were collected at 293 K with a Gemini PX Ultra equipped with CuKα radiation
(λ=1.54184Å), a 4-circle kappa goniometer and a CCD Detector. Data collection and data
processing was carried out using CrysAlisPro software from Oxford diffraction. The structures
were solved by direct methods using SHELXS-97 [53] with atomic positions and displacement
parameters refined with SHELXL-97.[53] The non-hydrogen atoms were refined anisotropically
and the hydrogen atoms were refined freely with isotropic displacement parameters.
Adsorption isotherms
Adsorption isotherms were determined using the volumetric method. The volumetric method is
based on a gas expansion process from a feed chamber (Vfeed) to an adsorption chamber (Vsample),
where the sample is placed. A schematic representation of volumetric apparatus used for this
work is shown in Figure 17.
The inner volumes, Vfeed and Vsample, including the vessels and connecting tubes were calibrated
prior to adsorption. The determined volume of the feed gas chamber was 1.272 mL and of the
sample chamber 0.990 mL.
Samples (from 150 mg to 450 mg) were regenerated overnight under vacuum (<1 mbar) at 60
ºC. The measurements were carried out at (293 ± 0.1) K up to 9 bar.
40
A cumulative measurement method was employed in this work, which consists on the collection
of adsorption data through continuous pressure increment.
Figure 17. Schematic representation of the apparatus used for collection of adsorption isotherms. The
instruments are placed in a controlled temperature environment.
Single-crystal diffusion experiments
Single-crystal diffusion experiments were performed against the atmosphere using a pressurized
feed gas chamber (chamber volume 1.44 mL). Single crystals were mounted in glass capillaries
using cyanoacrylate glue, such as depicted in Figure 18. Leak rate checks were performed to
ensure that the glue was not permeable to the gases. The intracrystalline diffusion rates were
obtained at 293.15 K from the feed chamber pressure drop results. The dimensions of the
crystals used in the experiments were obtained from digital imaging in an optical microscope.
Figure 18. Schematic representation of the setup used for single-crystal diffusion experiments. A crystal
is carefully glued to a glass capillary and connected to a feed pressure chamber.
41
Results and Discussion
Crystallization
LS crystals grow with a needle-like hexagonal shape as shown in Figure 19.
Figure 19. Optical microscope photograph of LS crystals (left), with dimension bar indicative of 200 µm,
and a scanning electron microscope image emphasising their hexagonal shape (right).
Structure Determination
In the course of this study X-ray diffraction data sets of several crystals were collected in order
to confirm the absence of solvent molecules in the pores and the crystallinity of the particles. An
example of the collection and refinement data of one LS crystal is given in Table 2.
Table 2. Crystal data and structure refinement of a LS crystal are presented.
Dipeptide LS
Formula C9H18N2O4
Mr 218.3
Crystal system Hexagonal
Space group P61
a, Å 18.1703(3)
c, Å 6.1687(1)
V, Å3 1763.80(5)
Z 6
Dx, g cm-3 1.233
R[F2>2s(F2)] 0.0387
wR[F2>2s(F2)] 0.118
Drmax (e Å-3) +0.57
Drmin (e Å-3) -0.16

42
Adsorption isotherms
Pure adsorption equilibrium isotherms of CO2, CH4, Ar, O2 and N2 on LS were determined at
293.15 K, represented in Figure 20. In the pressure range, the occupancy of the pores is low,
and thus intermolecular interaction of the guest species should be negligible when compared to
guest–host interaction. The Langmuir equation fits well to all the adsorption isotherms, although
for the weaker sorption species (Ar, N2 and O2) at moderate pressures, Henry’s law applies and
transport diffusivity (Dt) should not depend on pore loading.
Figure 20. Adsorption equilibrium isotherms at 293.15 K expressed as the number of guest molecules
per nm of LS nanochannels.
Single-crystal diffusion experiments
The dimensions of the crystals used in the experiments were obtained from digital imaging in an
optical microscope (Nikon SMZ800). Examples of collected images are presented in Figure 21.
Figure 21. LS crystals formed on the drop growing in different directions (left). Crystals are collected
from the drop and placed on a glass microscope slide allowing their separation and facilitating the process
of attaching a single crystal into a glass capillary (right).
43
Effect of the molecular size of the diffusants
Transport diffusivities of CO2, CH4, N2, O2, and Ar were determined in LS crystals. The
dimensions of the crystals used were 0.840 mm (length) × 0.0155 mm (hexagonal side) for CO2,
N2 and O2, 0.960 mm × 0.0264 mm for Ar and 0.884 mm × 0.0114 mm for CH4.
The diffusion coefficients are very dependent on the pore size and topology and, obviously, on
the molecular size of the guest molecules. Diffusion coefficients varying from 10-15 to 10-8 m2/s
have been reported for zeolites.[48, 54] Diffusivities in LS are on the upper limit of the zeolites’
range, as seen in Figure 22. Several factors probably contribute to the observed fast mass
transport: LS pores are very uniform with a variation of diameter along the channel of less than
0.1 Å, the pore tortuosity is very low and the guest–host interactions established with the methyl
groups that decorate the surface of the channels are weak. Despite the fast diffusion in LS
crystals, in some experiments with Ar and CH4 a blockage of the crystal permeation was
observed. It is possible that the propensity for pore blockage rises for larger diffusing
compounds.
Figure 22. Transport diffusivities of light gases in Leu–Ser crystals. Symbols as in Figure 20.
Effect of crystal length
Both O2 and Ar diffusivities were measured in crystals of considerably different length
dimensions, as shown in Figure 23. The diffusivities become notably smaller as the crystal
length increases. This is probably a consequence of pore blocking, a process that should be
more significant with increasing length paths. The problem of blocking of narrow one-
dimensional pores was already mentioned with dipeptide crystals and is well known in
zeolites.[34, 50] Furthermore, the adsorption isotherms, taken with polycrystalline solids in the
size range of 1–40 mm, were all reversible and reproducible, including the ones of Ar and CH4.
44
However, as already mentioned, the permeation through single crystals with lengths in the range
1–2 mm was sometimes blocked when using Ar or CH4. Thus, it seems that the tendency for
pore blocking increases with the increase in size of the crystals.
Figure 23. Effect of the crystal length on the transport diffusivities.
Effect of pore filling
It was already mentioned that the transport diffusivity Dt should have a strong increase with
pore filling.[50] The average pore filling in CO2 could be slightly increased by raising the feed
pressure. As expected, an increment in the diffusivity with the pore loading was observed, as
seen in Figure 24. Nevertheless, other factors such as the influence of the pressure in the crystal
pore dimensions, crystal order and propensity for pore blocking cannot be ruled out.[45]
Figure 24. Effect of the pore loading on the transport diffusivities.
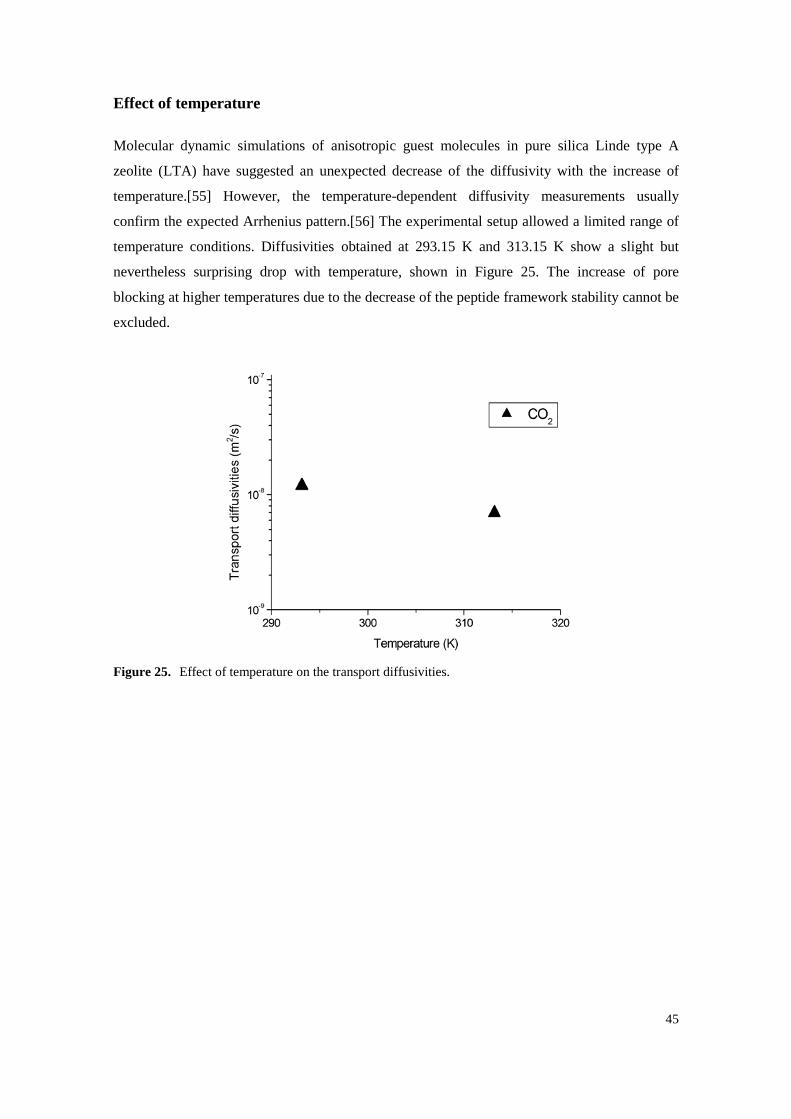
45
Effect of temperature
Molecular dynamic simulations of anisotropic guest molecules in pure silica Linde type A
zeolite (LTA) have suggested an unexpected decrease of the diffusivity with the increase of
temperature.[55] However, the temperature-dependent diffusivity measurements usually
confirm the expected Arrhenius pattern.[56] The experimental setup allowed a limited range of
temperature conditions. Diffusivities obtained at 293.15 K and 313.15 K show a slight but
nevertheless surprising drop with temperature, shown in Figure 25. The increase of pore
blocking at higher temperatures due to the decrease of the peptide framework stability cannot be
excluded.
Figure 25. Effect of temperature on the transport diffusivities.
46
Conclusions
We have shown that the diffusion of small molecules in LS microporous crystals is fast, in the
upper limit of the values reported for zeolites with the same approximate pore dimensions.
Probably, the uniformity of the size dimensions along the pore axis, in contrast to the narrow
windows interconnecting the cage topology of zeolites, favours the fast mass transport.
Moreover, we have observed that pore blocking can be significant under certain experimental
conditions (e.g. bigger diffusion species, higher temperatures, longer diffusion paths). The high
flexibility of the dipeptide crystal frameworks – dipeptides are linked by hydrogen bonds –
together with the fact that the pore and the diffusant have similar dimensions probably
contributes to pore blocking propensity.[41]
47
II.3. Permeation of Light Gases through
hexagonal ice [57]
Based on the publication with the same title by:
Joana Durãoa and Luís Gales*ab
* Corresponding author a IBMC, Instituto de Biologia Molecular e Celular, Rua do Campo Alegre, 823, Porto,
Portugal b ICBAS, Instituto de Ciências Biomédicas Abel Salazar, Universidade do Porto, Rua de
Jorge Viterbo Ferreira n.° 228, Porto, Portugal
Materials 2012, 5, p. 1593-1601
DOI:10.3390/ma5091593
48
Abstract
Gas separation using porous solids have attracted great attention due to their energetic
applications. There is an enormous economic and environmental interest in the development of
improved technologies for relevant processes, such as H2 production, CO2 separation or O2 and
N2 purification from air. New materials are needed for achieving major improvements.
Crystalline materials, displaying unidirectional and single-sized pores, preferentially with low
pore tortuosity and high pore density, are promising candidates for membrane production.
Herein, we study hexagonal ice crystals as an example of this class of materials. By slowly
growing ice crystals inside capillary tubes we were able to measure the permeation of several
gas species through ice crystals and investigate its relation with both the size of the guest
molecules and temperature of the crystal.
Keywords: ice; light gases; diffusion
49
Introduction
Separation or purification of light gases is crucial in many industrial activities. In fact, there is
an enormous economic and environmental interest in the development of better technologies for
relevant processes such as H2 production, CO2 separation or O2 and N2 purification from air.
Membrane separation is growing as a low-cost and energy-efficient alternative to traditional
methods, such as adsorption or cryo-separation. Most membranes in use in industry are
polymeric [58], and despite the ongoing development of better polymeric materials, there is a
trade-off between flow rates and selectivities.[59] Crystalline materials, displaying
unidirectional and single-sized pores are promising candidates for membrane preparation.
Metal-organic frameworks (MOFs) [60, 61] and peptide supramolecular systems [30, 31, 33,
44] are among the most promising crystal structures, due to the variety of pore sizes and high
pore density. Nevertheless, the key challenge in the context of using crystalline materials is to
scale up the fabrication techniques of either dense polycrystalline layers [60] or mixed matrix
membranes, which embed the selective particles inside the polymeric matrix.[61] It is well
known that ordinary water and several organic compounds [62] solidify in a regular geometric
lattice (crystal) containing unidirectional nanochannels. Here, using water ice as a model, we
demonstrate that under controlled phase transition conditions it is possible to induce the
orientation of the crystal lattice inside capillary tubes: a process that may find very interesting
applications. We show that, inside capillary tubes, hexagonal ice crystals form by slowly
growing in the direction of the c-axis and that they can be used as single crystal membranes able
to distinguish between different gas molecules. We observed that the gas molecules cannot
escape through the ice-glass capillary wall interface, which enables an easy scale-up by simply
using perforated solid plates to promote multiple crystal growth. Moreover, we found that the
flow rate of the gas species is severely regulated by ice temperature, expanding the number of
potential species that may be separated.
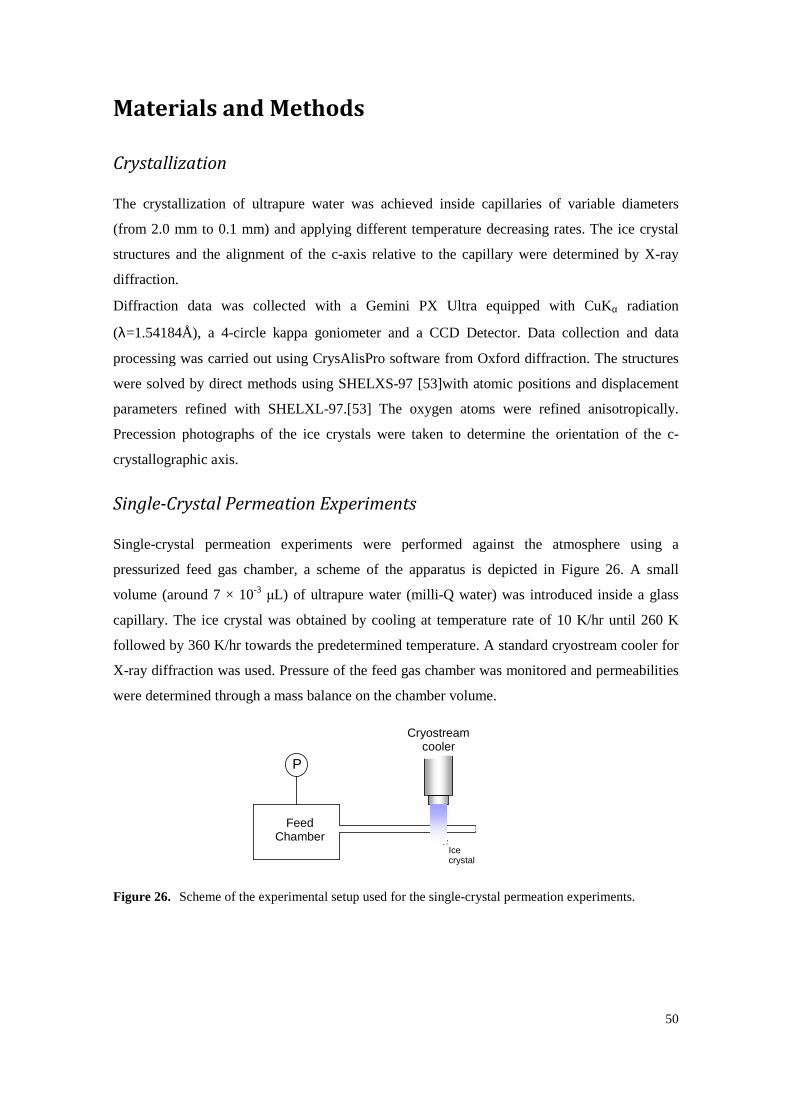
50
Materials and Methods
Crystallization
The crystallization of ultrapure water was achieved inside capillaries of variable diameters
(from 2.0 mm to 0.1 mm) and applying different temperature decreasing rates. The ice crystal
structures and the alignment of the c-axis relative to the capillary were determined by X-ray
diffraction.
Diffraction data was collected with a Gemini PX Ultra equipped with CuKα radiation
(λ=1.54184Å), a 4-circle kappa goniometer and a CCD Detector. Data collection and data
processing was carried out using CrysAlisPro software from Oxford diffraction. The structures
were solved by direct methods using SHELXS-97 [53]with atomic positions and displacement
parameters refined with SHELXL-97.[53] The oxygen atoms were refined anisotropically.
Precession photographs of the ice crystals were taken to determine the orientation of the c-
crystallographic axis.
Single-Crystal Permeation Experiments
Single-crystal permeation experiments were performed against the atmosphere using a
pressurized feed gas chamber, a scheme of the apparatus is depicted in Figure 26. A small
volume (around 7 × 10⁻³ µL) of ultrapure water (milli-Q water) was introduced inside a glass
capillary. The ice crystal was obtained by cooling at temperature rate of 10 K/hr until 260 K
followed by 360 K/hr towards the predetermined temperature. A standard cryostream cooler for
X-ray diffraction was used. Pressure of the feed gas chamber was monitored and permeabilities
were determined through a mass balance on the chamber volume.
Figure 26. Scheme of the experimental setup used for the single-crystal permeation experiments.
Feed Chamber
Ice crystal
P
Cryostream cooler
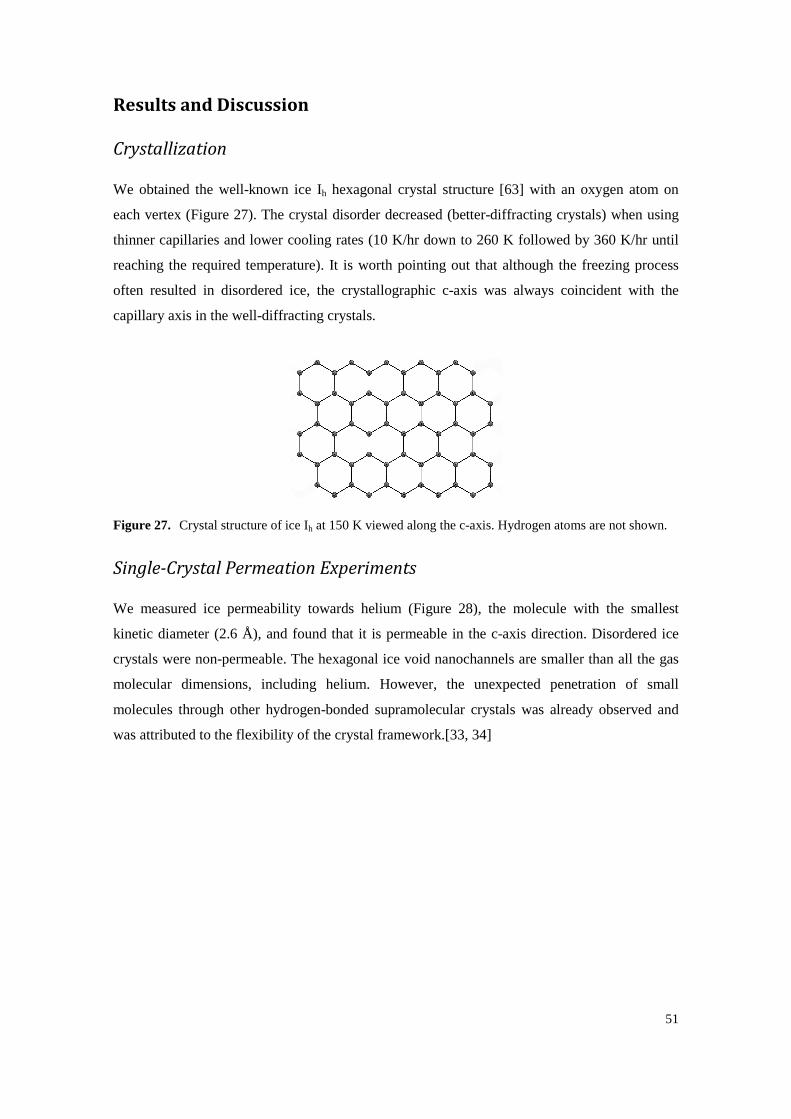
51
Results and Discussion
Crystallization
We obtained the well-known ice Ih hexagonal crystal structure [63] with an oxygen atom on
each vertex (Figure 27). The crystal disorder decreased (better-diffracting crystals) when using
thinner capillaries and lower cooling rates (10 K/hr down to 260 K followed by 360 K/hr until
reaching the required temperature). It is worth pointing out that although the freezing process
often resulted in disordered ice, the crystallographic c-axis was always coincident with the
capillary axis in the well-diffracting crystals.
Figure 27. Crystal structure of ice Ih at 150 K viewed along the c-axis. Hydrogen atoms are not shown.
Single-Crystal Permeation Experiments
We measured ice permeability towards helium (Figure 28), the molecule with the smallest
kinetic diameter (2.6 Å), and found that it is permeable in the c-axis direction. Disordered ice
crystals were non-permeable. The hexagonal ice void nanochannels are smaller than all the gas
molecular dimensions, including helium. However, the unexpected penetration of small
molecules through other hydrogen-bonded supramolecular crystals was already observed and
was attributed to the flexibility of the crystal framework.[33, 34]
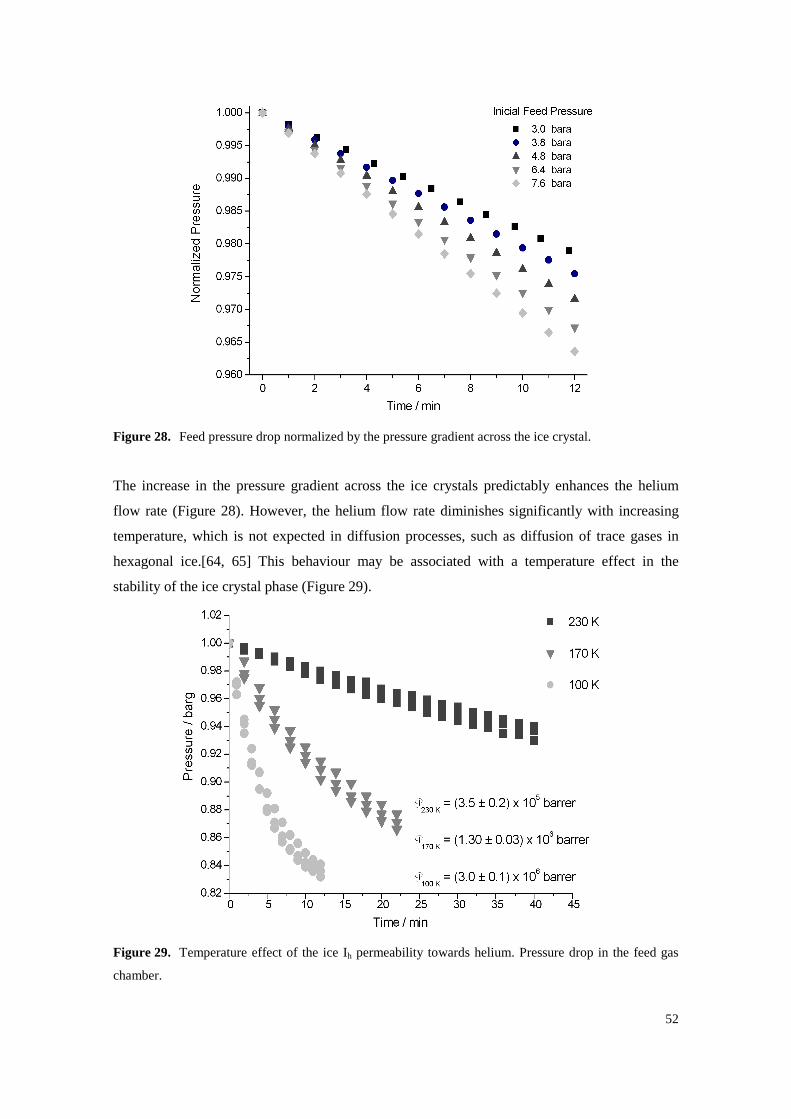
52
Figure 28. Feed pressure drop normalized by the pressure gradient across the ice crystal.
The increase in the pressure gradient across the ice crystals predictably enhances the helium
flow rate (Figure 28). However, the helium flow rate diminishes significantly with increasing
temperature, which is not expected in diffusion processes, such as diffusion of trace gases in
hexagonal ice.[64, 65] This behaviour may be associated with a temperature effect in the
stability of the ice crystal phase (Figure 29).
Figure 29. Temperature effect of the ice Ih permeability towards helium. Pressure drop in the feed gas
chamber.
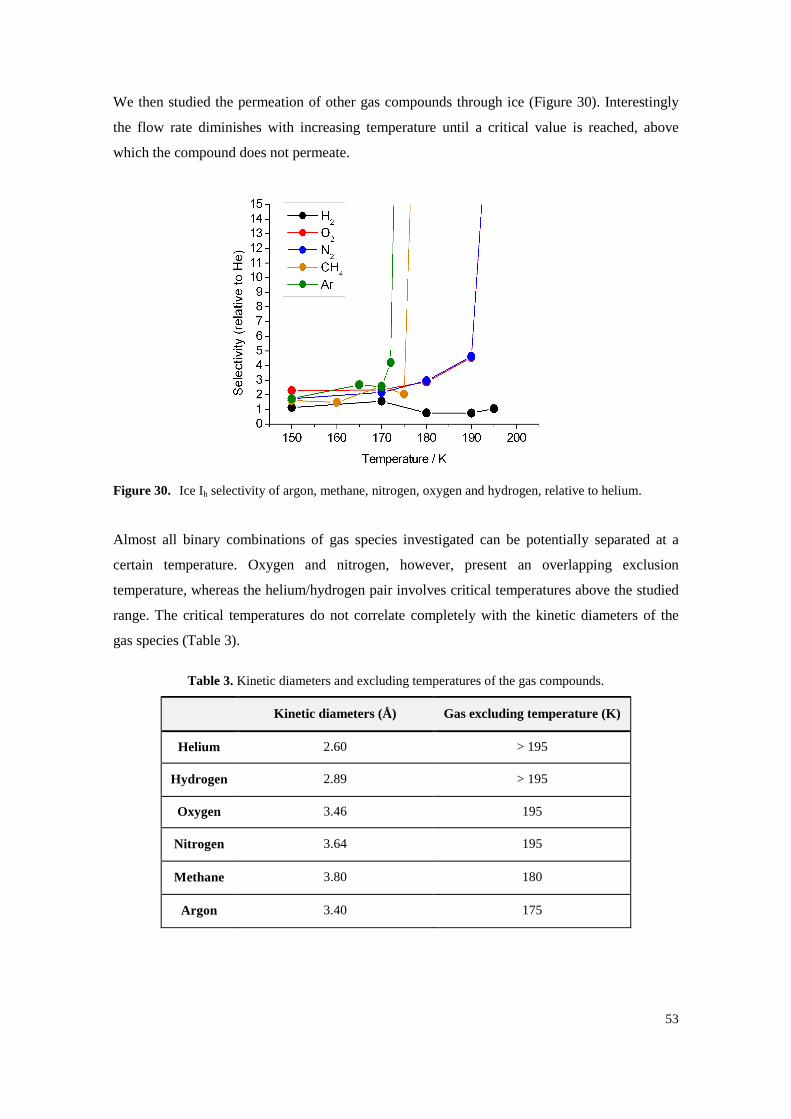
53
We then studied the permeation of other gas compounds through ice (Figure 30). Interestingly
the flow rate diminishes with increasing temperature until a critical value is reached, above
which the compound does not permeate.
Figure 30. Ice Ih selectivity of argon, methane, nitrogen, oxygen and hydrogen, relative to helium.
Almost all binary combinations of gas species investigated can be potentially separated at a
certain temperature. Oxygen and nitrogen, however, present an overlapping exclusion
temperature, whereas the helium/hydrogen pair involves critical temperatures above the studied
range. The critical temperatures do not correlate completely with the kinetic diameters of the
gas species (Table 3).
Table 3. Kinetic diameters and excluding temperatures of the gas compounds.
Kinetic diameters (Å) Gas excluding temperature (K)
Helium 2.60 > 195
Hydrogen 2.89 > 195
Oxygen 3.46 195
Nitrogen 3.64 195
Methane 3.80 180
Argon 3.40 175
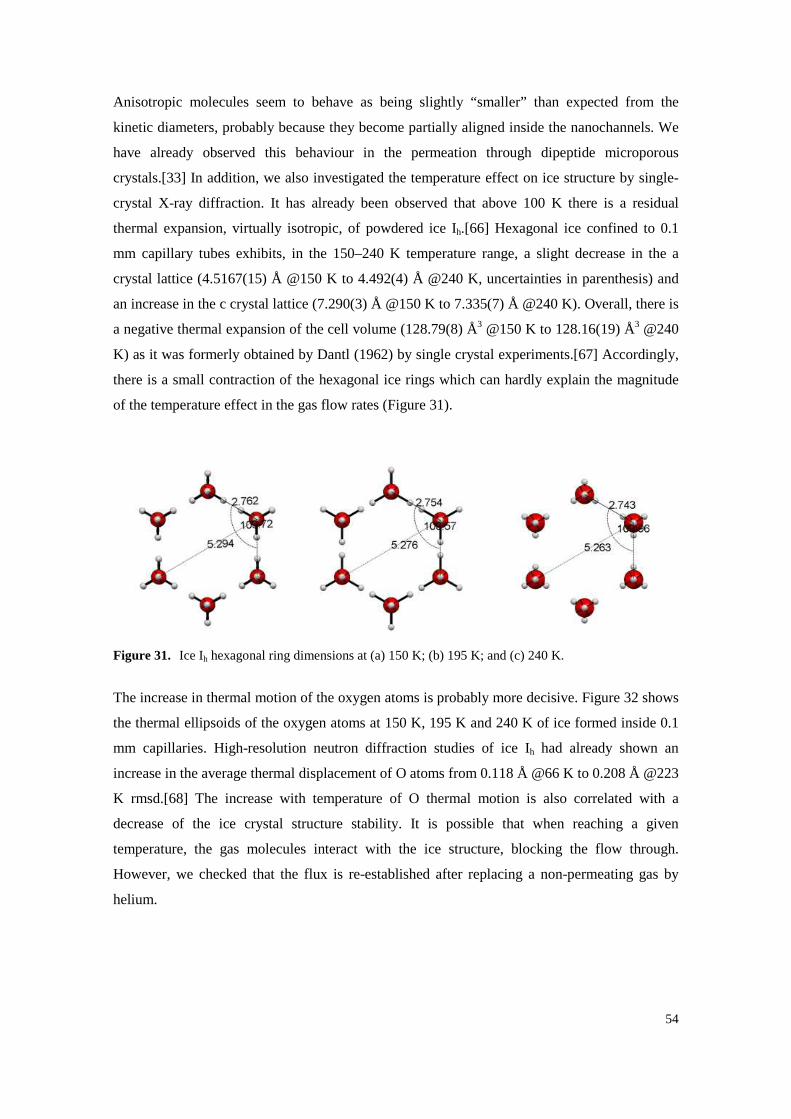
54
Anisotropic molecules seem to behave as being slightly “smaller” than expected from the
kinetic diameters, probably because they become partially aligned inside the nanochannels. We
have already observed this behaviour in the permeation through dipeptide microporous
crystals.[33] In addition, we also investigated the temperature effect on ice structure by single-
crystal X-ray diffraction. It has already been observed that above 100 K there is a residual
thermal expansion, virtually isotropic, of powdered ice Ih.[66] Hexagonal ice confined to 0.1
mm capillary tubes exhibits, in the 150–240 K temperature range, a slight decrease in the a
crystal lattice (4.5167(15) Å @150 K to 4.492(4) Å @240 K, uncertainties in parenthesis) and
an increase in the c crystal lattice (7.290(3) Å @150 K to 7.335(7) Å @240 K). Overall, there is
a negative thermal expansion of the cell volume (128.79(8) Å3 @150 K to 128.16(19) Å3 @240
K) as it was formerly obtained by Dantl (1962) by single crystal experiments.[67] Accordingly,
there is a small contraction of the hexagonal ice rings which can hardly explain the magnitude
of the temperature effect in the gas flow rates (Figure 31).
Figure 31. Ice Ih hexagonal ring dimensions at (a) 150 K; (b) 195 K; and (c) 240 K.
The increase in thermal motion of the oxygen atoms is probably more decisive. Figure 32 shows
the thermal ellipsoids of the oxygen atoms at 150 K, 195 K and 240 K of ice formed inside 0.1
mm capillaries. High-resolution neutron diffraction studies of ice Ih had already shown an
increase in the average thermal displacement of O atoms from 0.118 Å @66 K to 0.208 Å @223
K rmsd.[68] The increase with temperature of O thermal motion is also correlated with a
decrease of the ice crystal structure stability. It is possible that when reaching a given
temperature, the gas molecules interact with the ice structure, blocking the flow through.
However, we checked that the flux is re-established after replacing a non-permeating gas by
helium.
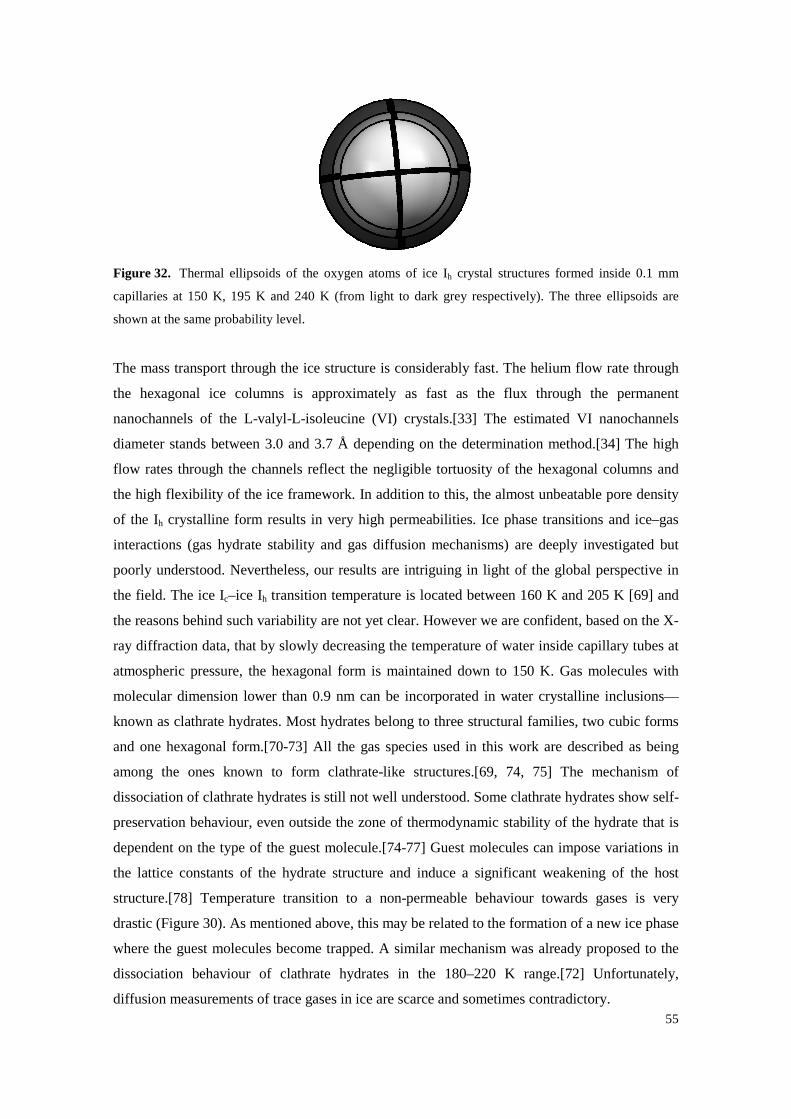
55
Figure 32. Thermal ellipsoids of the oxygen atoms of ice Ih crystal structures formed inside 0.1 mm
capillaries at 150 K, 195 K and 240 K (from light to dark grey respectively). The three ellipsoids are
shown at the same probability level.
The mass transport through the ice structure is considerably fast. The helium flow rate through
the hexagonal ice columns is approximately as fast as the flux through the permanent
nanochannels of the L-valyl-L-isoleucine (VI) crystals.[33] The estimated VI nanochannels
diameter stands between 3.0 and 3.7 Å depending on the determination method.[34] The high
flow rates through the channels reflect the negligible tortuosity of the hexagonal columns and
the high flexibility of the ice framework. In addition to this, the almost unbeatable pore density
of the Ih crystalline form results in very high permeabilities. Ice phase transitions and ice–gas
interactions (gas hydrate stability and gas diffusion mechanisms) are deeply investigated but
poorly understood. Nevertheless, our results are intriguing in light of the global perspective in
the field. The ice Ic–ice Ih transition temperature is located between 160 K and 205 K [69] and
the reasons behind such variability are not yet clear. However we are confident, based on the X-
ray diffraction data, that by slowly decreasing the temperature of water inside capillary tubes at
atmospheric pressure, the hexagonal form is maintained down to 150 K. Gas molecules with
molecular dimension lower than 0.9 nm can be incorporated in water crystalline inclusions—
known as clathrate hydrates. Most hydrates belong to three structural families, two cubic forms
and one hexagonal form.[70-73] All the gas species used in this work are described as being
among the ones known to form clathrate-like structures.[69, 74, 75] The mechanism of
dissociation of clathrate hydrates is still not well understood. Some clathrate hydrates show self-
preservation behaviour, even outside the zone of thermodynamic stability of the hydrate that is
dependent on the type of the guest molecule.[74-77] Guest molecules can impose variations in
the lattice constants of the hydrate structure and induce a significant weakening of the host
structure.[78] Temperature transition to a non-permeable behaviour towards gases is very
drastic (Figure 30). As mentioned above, this may be related to the formation of a new ice phase
where the guest molecules become trapped. A similar mechanism was already proposed to the
dissociation behaviour of clathrate hydrates in the 180–220 K range.[72] Unfortunately,
diffusion measurements of trace gases in ice are scarce and sometimes contradictory.
56
Molecular dynamics simulation studies are more frequent but the understanding of the diffusion
mechanisms remains poorly understood. Ikeda-Fukazawa et al. [79-81] argued that small apolar
guest molecule, such as He, Ne, Ar or H2, diffuse without distorting the ice lattice while large
molecules, such as O2, N2, CO2 and CH4, diffuse by a bond-breaking mechanism. However,
Demurov and colleagues [82] reported molecular dynamic simulations of CO2 through defect-
free hexagonal ice at 200 K and observed no evidence of diffusion. Alavi and Ripmeester [74]
on the other hand showed that H2 can diffuse out of the hydrates through the hexagonal rings, or
even through the smaller pentagonal rings. Mitlin et al. [83] argued that Xe can easily penetrate
the ice hexagonal structure by a mechanism of adsorption and induced crystal disorder. Peters et
al. [84] observed that methane does not fit through the six membered ring without distortion, so
one hydrogen bond in the water ring must break at a transition state. Ballenegger and colleagues
[85] showed that formaldehyde diffuses predominantly through a bond-braking mechanism of
the ice structure. Here we show that H2, O2, N2, CH4 and Ar can diffuse through the hexagonal
ice structure. Diffusion of these compounds was already predicted theoretically by other authors.
[86] However, we cannot ascertain whether defects in the crystal matrix or local disorder
induced by guest species are relevant or not for the diffusion mechanism. We tried to obtain gas
sorption equilibrium data to corroborate our findings but without success. The hexagonal ice
sample size (around 7 × 10⁻³µL) is too small to measure gas sorption uptake. Nevertheless,
adsorption isotherms of light gases, such as H2, N2 and CO2 in hexagonal ice, were already
reported in the literature.[87, 88]
57
Conclusions
Ice was already used as a chromatographic stationary phase to separate enantiomers.[89] Here,
we have shown that hexagonal ice may be used as a molecular sieve to separate light gases with
commercial value. Despite the high selectivities and permeabilities, the practical use of ice for
gas separations is certainly limited by low stability of the ice structure and low operating
temperatures. Nevertheless, our results have a long-term interest as they will motivate the search
for other compounds that solidify at higher temperatures into similar but more stable crystalline
structures. The possibility of easy scale-up into polycrystalline membranes with exceptional
performance certainly looks very promising.

58
59
CHAPTER III
SOFT MATERIALS BY PEPTIDE
SELF-ASSEMBLY

60
61
III.1. Peptide Self-assembly for Therapeutic
Applications
Based on the publication with the same title by:
Joana Durãoa and Luís Gales*ab
* Corresponding author a I3S, Instituto de Investigação e Inovação em Saúde, Universidade do Porto, Portugal and
IBMC, Instituto de Biologia Molecular e Celular, Universidade do Porto, Portugal; b ICBAS, Instituto de Ciências Biomédicas Abel Salazar, Universidade do Porto
Current Organic Chemistry, 2015, 19(19) p. 1874-1881.
DOI: 10.2174/1385272819666150608220036
62
Abstract
Molecular self-assembly is a process ubiquitous in nature that refers to the spontaneous
assembly of molecules in order to generate supramolecular structures through noncovalent
interactions. Such a natural mechanism can be mimicked to modulate the fabrication of novel
materials. The secret underlying the production of successful self-assembled materials lies on
the careful selection of its building blocks. Control over the final architecture may be achieved
by adjusting the size, shape and surface chemistry of these building blocks. Peptides are
promising candidates as monomers for self-assembly, in part, due to the variety of amino acids
which comprise different chemical functionalities. Such chemical diversity allows a myriad of
interactions to take place, such as hydrogen bonding, hydrophobic effects or electrostatic
interactions. In addition to design versatility, an increasing understanding of protein and peptide
folding mechanisms allows the rational design of the monomer and its final assembly. Peptides
have great potential for biomedical applications due to their inherent biocompatibility and
biodegradability. In fact, self-assembled peptide-based biomaterials have been developed for the
production of 3D scaffolds for tissue repair and regeneration and therapeutic drug delivery.
Since peptides are bioactive molecules, its applications may go far beyond the fabrication of
inactive architectures. Inherently functional materials may also be produced. In this review, we
explore the different strategies adopted by scientists in the fabrication of peptide-based self-
assembled biomaterials and provide a comprehensive overview of the mechanisms governing it.
Keywords: Beta-sheet, Biomaterials, Coiled-coil, Peptides, Self-assembly, Supramolecular
Chemistry, Therapeutics
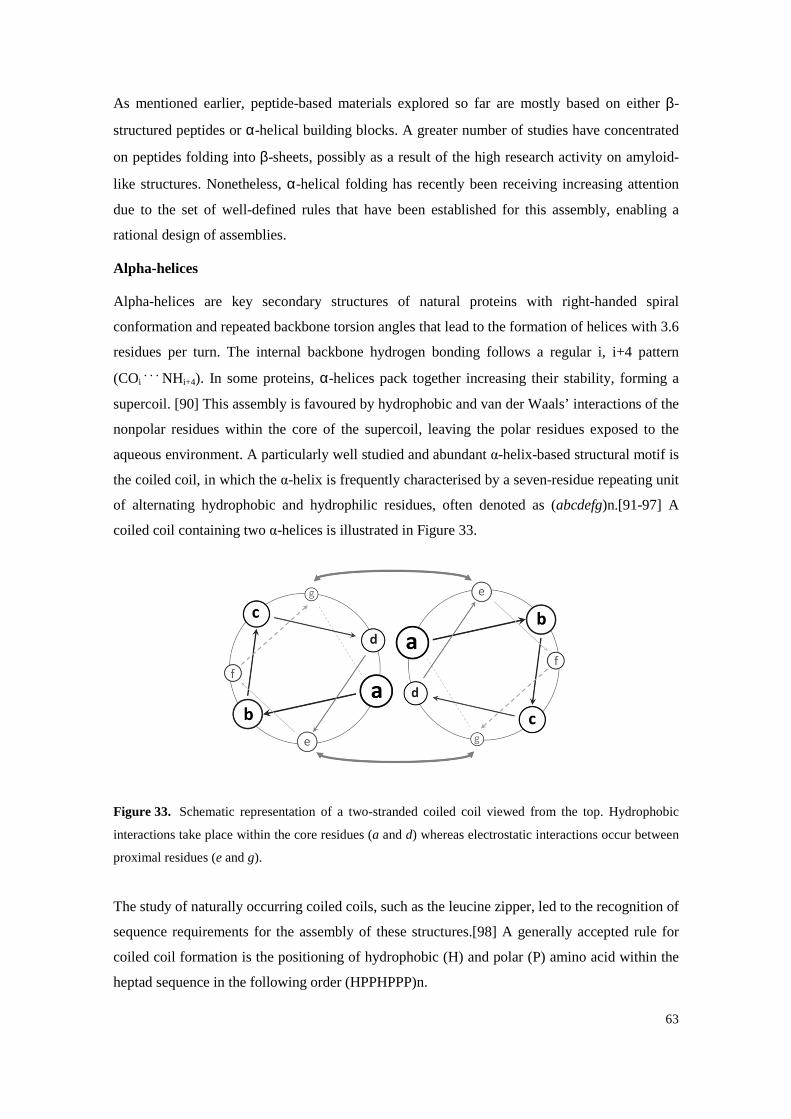
63
As mentioned earlier, peptide-based materials explored so far are mostly based on either β-
structured peptides or α-helical building blocks. A greater number of studies have concentrated
on peptides folding into β-sheets, possibly as a result of the high research activity on amyloid-
like structures. Nonetheless, α-helical folding has recently been receiving increasing attention
due to the set of well-defined rules that have been established for this assembly, enabling a
rational design of assemblies.
Alpha-helices
Alpha-helices are key secondary structures of natural proteins with right-handed spiral
conformation and repeated backbone torsion angles that lead to the formation of helices with 3.6
residues per turn. The internal backbone hydrogen bonding follows a regular i, i+4 pattern
(COi . . . NHi+4). In some proteins, α-helices pack together increasing their stability, forming a
supercoil. [90] This assembly is favoured by hydrophobic and van der Waals’ interactions of the
nonpolar residues within the core of the supercoil, leaving the polar residues exposed to the
aqueous environment. A particularly well studied and abundant α-helix-based structural motif is
the coiled coil, in which the α-helix is frequently characterised by a seven-residue repeating unit
of alternating hydrophobic and hydrophilic residues, often denoted as (abcdefg)n.[91-97] A
coiled coil containing two α-helices is illustrated in Figure 33.
Figure 33. Schematic representation of a two-stranded coiled coil viewed from the top. Hydrophobic
interactions take place within the core residues (a and d) whereas electrostatic interactions occur between
proximal residues (e and g).
The study of naturally occurring coiled coils, such as the leucine zipper, led to the recognition of
sequence requirements for the assembly of these structures.[98] A generally accepted rule for
coiled coil formation is the positioning of hydrophobic (H) and polar (P) amino acid within the
heptad sequence in the following order (HPPHPPP)n.
64
The positions a and d; that form the core of the structure, need to be hydrophobic, in order to
allow interaction between the helices. In addition, it has been reported that the introduction of
charged residues at positions g and e (such as K and E) leads to the assembly of a two-stranded
coiled coil by promoting inter-helical electrostatic interactions.[99] Such ionic bonds can be
used as triggers for promoting self-assembly by simple adjustment of pH. An interesting
example of a rationally designed responsive material was proposed by Zimenkov et al. who
synthesized a peptide containing histidine residues at position d of the heptad sequence,
resulting on the formation of fibers as a response to pH variation.[100]
The selection of amino acids at positions b, c and f of the heptad sequence, the group of amino
acids exposed on the surface of the coiled coils, has also been a target of research and its
influence of final assembly investigated. It has been reported that these positions have an
influence on fibril thickness, with positively charged residues generating long and narrow
(diameters of ∼4 nm) nanofibers, which provides evidence to the importance of these group of
amino acids to inter-fibril interactions.[101] In another publication, researchers designed a
temperature responsive material by changing the amino acids at this same peripheral region,
resulting in self-assembling hydrogels.[91] The authors’ starting point was a peptide sequence
known to self-assemble into fibers (SAFs8). In one case the authors’ have incorporated alanine,
to promote hydrophobic interactions between fibrils, and on the other, glutamine was chosen,
given its propensity to foster hydrogen bonding. In both cases physical hydrogels were obtained,
with the particularity that glutamine-based gels were formed at low temperature in contrast to
the alanine-based gels that were achieved at high temperature. The resulting hydrogels were
able to support both growth and differentiation of rat adrenal pheochromocytoma cells for
sustained periods in culture, which is evidence to the biomedical potential of such peptide-based
materials.
Peptide self-assembling structures have shown great potential for applications in regenerative
medicine, as well as towards the development of new therapeutic delivery systems.[102]
Improving the efficacy of therapeutic drugs can involve the development of drug delivery
systems, designed to administer drugs to a specific target in a controlled fashion. Undesirable
side-effects of systemically administered drugs may occur due to their uptake by healthy cells,
which coupled with short circulation half-lives leads to the high concentrations requirements to
reach the target cells at therapeutic levels. The ideal carrier should therefore be able to
effectively entrap the drug, direct it to pathological cells, tissues or organs and controllably
release its content. Applications of self-assembling peptides as carriers for drug delivery will be
presented hereby.
65
Many therapeutic drugs are hydrophobic, which limits the amount of drug that may be present
in systemic circulation, and therefore restricts its final application. The development of systems
capable of incorporating hydrophobic molecules is thus of great value.
Coiled coils have the potential to carry hydrophobic drugs due to their inner hydrophobic core,
as was shown by Eriksson et al. who studied the potential of loading cisplatin, a hydrophobic
chemotherapeutic drug, into a protein from archaebacterium Staphylothermus marinus forming
a right-handed coiled coil (RHCC).[103] The RHCC had been previously shown to encompass
four hydrophobic cavities, which may be the spots where the incorporation of the hydrophobic
drug takes place. The authors have shown that RHCC containing the drug was able to bind and
enter cells in vitro, suggesting an aptitude for drug delivery.
In a recent work by More et al. a supercharged coiled coil structure protein (CSP) was
engineered and successfully employed for gene therapy, by non-covalently biding the coiled
coil to plasmid DNA and encapsulating it in a liposome, forming complexes which the authors
have named as lipoproteoplexes.[104] The original cartilage oligomeric matrix protein coiled-
coil (COMPcc) was modified at positions b and c of the heptad repeat, by replacing them with
arginine residues that convey the positive charges needed for facilitating ionic bonding with the
negatively charged DNA. Surprisingly this supercharging of the protein did not significantly
affect its structure.
Another inventive study proposed the application of a heterodimer coiled coil to promote the
fabrication of a drug-polymer conjugate.[105] The authors accomplished this by covalently
binding one helix to the carrier polymer and the other complementary helix to the drug,
obtaining in this way the polymer-drug conjugate.
The set of rules that have been established for the assembly of coiled coils enable the rational
design for the production of new building blocks capable of self-assembling.
Beta sheets
The other common secondary structure of proteins is the beta-sheet, formed by assembly of
beta-strands in a parallel or anti-parallel fashion, driven by hydrogen bonds. Much like the
alpha-helix, beta-sheets can be made amphiphilic to facilitate the creation of design guidelines.
In the latter, a HPHPHP pattern has been recognized as beta-sheet prone, where the hydrophobic
and hydrophilic residues stand on opposite sides of the beta-sheet. While studying a zuotin
protein fragment, AEAEAKAKAEAEAKAK , Zhang et al. found that addition of salt led to the
spontaneous generation of assemblies that formed a stable macroscopic membrane.[106] The
alternating cationic, hydrophobic and anionic residues are positioned on opposite sides of the
formed beta-strand.
66
Adopting the same sequence pattern, many other peptides were designed and a great number of
successful assemblies was achieved.[107] One of such assemblies, RADA16, is now marketed,
primarily for research purposes, under the commercial name of PuraMatrix™. Several studies
have employed these hydrogels for cell culture, demonstrating its potential for tissue
engineering applications. [108-110]
The mechanical properties of the final assembly are a function of length and hydrophobicity of
the peptide building block. In a systematic study performed by Caplan et al., the effect of
certain monomer aspects on the shear moduli of the attained gel was assessed. The authors
found that increased hydrogel rigidity may be achieved by simply increasing peptide
length.[111] The potential of applying the RADA16 hydrogel as a carrier for controlled drug
release was investigated by Nagai et al. through the quantification of the diffusion of different
molecules.[112] Their results showed that release kinetics is not only dependent on the structure
and charge of the diffusant but also on the peptide concentration in the hydrogel. They point out
that the interaction of the drugs with the nanofibers might also play an important role, which can
lead to tailor-made structures for drug release. By introducing a phenylalanine residue on the
RADA16 sequence, Zhao et al. intentionally created a motif for interaction with hydrophobic
drugs.[113] The research group investigated two peptide sequences, RADAF1 and RADAF2,
similar except for the phenylalanine residue, which in one case is positioned in the centre
(RADAF1) and in the other closer to the terminus (RADAF2) of the peptide sequence. Self-
assembly resulted in twisted and flat β-sheet nanofibers, as examined by AFM and FTIR. This
study revealed how such a small difference in spatial disposition of an amino acid can induce a
surprising disparity on the assembly mechanism and on final hydrogel characteristics.
Furthermore, the hydrogels were shown to entrap molecules containing the phenyl group,
apparently by π- π interaction, providing another ground evidence of the potential of these
materials for drug delivery. The release of larger molecules, such as proteins and cytokines has
also been tested.[109] Koutsopoulos et al. encapsulated proteins of different sizes and
isoelectric points within the Ac-(RADA)4-CONH2 peptide hydrogel.[114] They found,
corroborating the results of the previously mentioned paper that release kinetics was essentially
a function of the size of the protein and hydrogel mesh. Noteworthy is also the fact that proteins
encapsulated within the hydrogel were released while maintaining their conformation and
functionality. The same investigators studied the release kinetics of human immunoglobulin
(IgG) through a two-layered hydrogel system consisting of concentric spheres of a ac-(RADA)4-
CONH2 core and a ac-(KLDL)3-CONH2 shell of self-assembling peptides.[115] This two-
layered system allowed 100% encapsulation efficiency, while providing the means for slow and
controlled in vitro release of structural and functional IgG for more than 3 months.
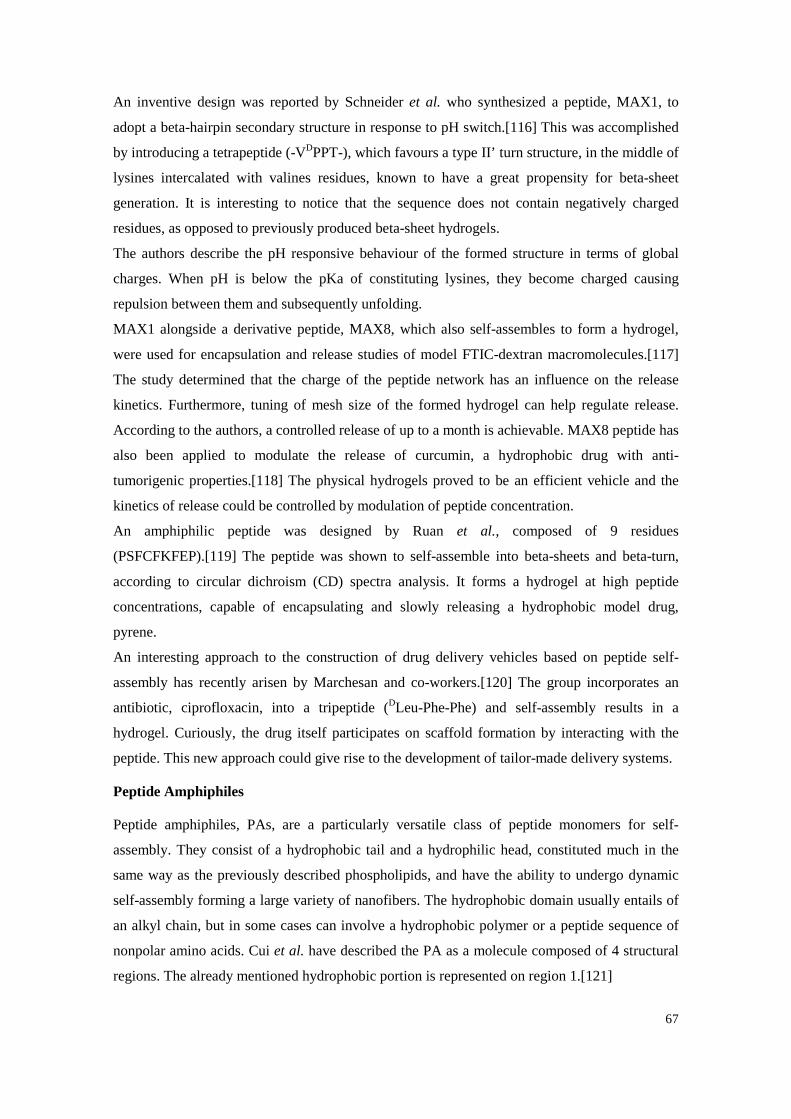
67
An inventive design was reported by Schneider et al. who synthesized a peptide, MAX1, to
adopt a beta-hairpin secondary structure in response to pH switch.[116] This was accomplished
by introducing a tetrapeptide (-VDPPT-), which favours a type II’ turn structure, in the middle of
lysines intercalated with valines residues, known to have a great propensity for beta-sheet
generation. It is interesting to notice that the sequence does not contain negatively charged
residues, as opposed to previously produced beta-sheet hydrogels.
The authors describe the pH responsive behaviour of the formed structure in terms of global
charges. When pH is below the pKa of constituting lysines, they become charged causing
repulsion between them and subsequently unfolding.
MAX1 alongside a derivative peptide, MAX8, which also self-assembles to form a hydrogel,
were used for encapsulation and release studies of model FTIC-dextran macromolecules.[117]
The study determined that the charge of the peptide network has an influence on the release
kinetics. Furthermore, tuning of mesh size of the formed hydrogel can help regulate release.
According to the authors, a controlled release of up to a month is achievable. MAX8 peptide has
also been applied to modulate the release of curcumin, a hydrophobic drug with anti-
tumorigenic properties.[118] The physical hydrogels proved to be an efficient vehicle and the
kinetics of release could be controlled by modulation of peptide concentration.
An amphiphilic peptide was designed by Ruan et al., composed of 9 residues
(PSFCFKFEP).[119] The peptide was shown to self-assemble into beta-sheets and beta-turn,
according to circular dichroism (CD) spectra analysis. It forms a hydrogel at high peptide
concentrations, capable of encapsulating and slowly releasing a hydrophobic model drug,
pyrene.
An interesting approach to the construction of drug delivery vehicles based on peptide self-
assembly has recently arisen by Marchesan and co-workers.[120] The group incorporates an
antibiotic, ciprofloxacin, into a tripeptide (DLeu-Phe-Phe) and self-assembly results in a
hydrogel. Curiously, the drug itself participates on scaffold formation by interacting with the
peptide. This new approach could give rise to the development of tailor-made delivery systems.
Peptide Amphiphiles
Peptide amphiphiles, PAs, are a particularly versatile class of peptide monomers for self-
assembly. They consist of a hydrophobic tail and a hydrophilic head, constituted much in the
same way as the previously described phospholipids, and have the ability to undergo dynamic
self-assembly forming a large variety of nanofibers. The hydrophobic domain usually entails of
an alkyl chain, but in some cases can involve a hydrophobic polymer or a peptide sequence of
nonpolar amino acids. Cui et al. have described the PA as a molecule composed of 4 structural
regions. The already mentioned hydrophobic portion is represented on region 1.[121]
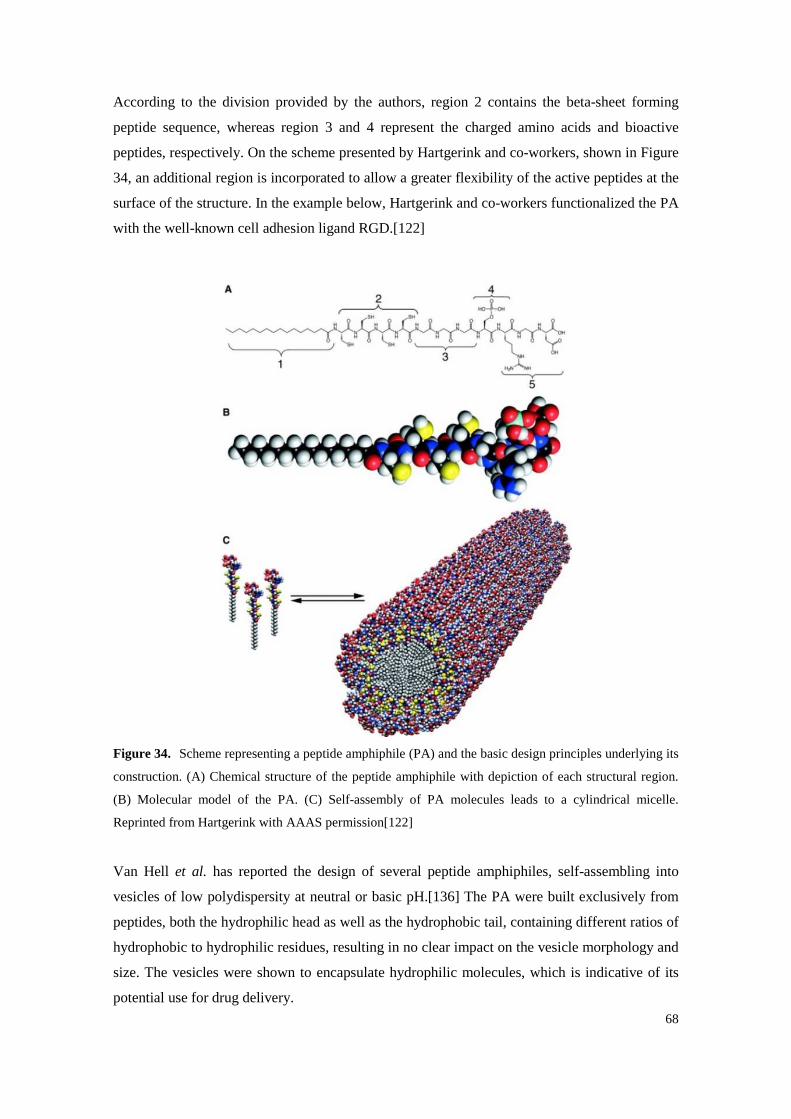
68
According to the division provided by the authors, region 2 contains the beta-sheet forming
peptide sequence, whereas region 3 and 4 represent the charged amino acids and bioactive
peptides, respectively. On the scheme presented by Hartgerink and co-workers, shown in Figure
34, an additional region is incorporated to allow a greater flexibility of the active peptides at the
surface of the structure. In the example below, Hartgerink and co-workers functionalized the PA
with the well-known cell adhesion ligand RGD.[122]
Figure 34. Scheme representing a peptide amphiphile (PA) and the basic design principles underlying its
construction. (A) Chemical structure of the peptide amphiphile with depiction of each structural region.
(B) Molecular model of the PA. (C) Self-assembly of PA molecules leads to a cylindrical micelle.
Reprinted from Hartgerink with AAAS permission[122]
Van Hell et al. has reported the design of several peptide amphiphiles, self-assembling into
vesicles of low polydispersity at neutral or basic pH.[136] The PA were built exclusively from
peptides, both the hydrophilic head as well as the hydrophobic tail, containing different ratios of
hydrophobic to hydrophilic residues, resulting in no clear impact on the vesicle morphology and
size. The vesicles were shown to encapsulate hydrophilic molecules, which is indicative of its
potential use for drug delivery.
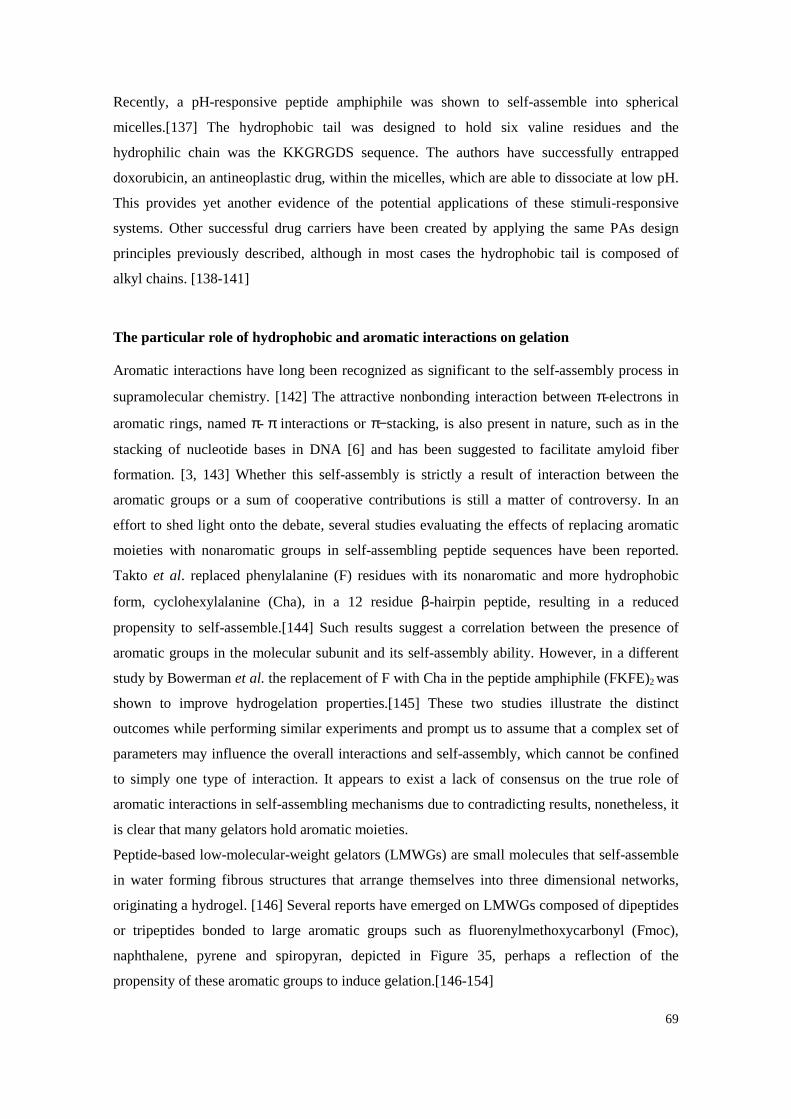
69
Recently, a pH-responsive peptide amphiphile was shown to self-assemble into spherical
micelles.[137] The hydrophobic tail was designed to hold six valine residues and the
hydrophilic chain was the KKGRGDS sequence. The authors have successfully entrapped
doxorubicin, an antineoplastic drug, within the micelles, which are able to dissociate at low pH.
This provides yet another evidence of the potential applications of these stimuli-responsive
systems. Other successful drug carriers have been created by applying the same PAs design
principles previously described, although in most cases the hydrophobic tail is composed of
alkyl chains. [138-141]
The particular role of hydrophobic and aromatic interactions on gelation
Aromatic interactions have long been recognized as significant to the self-assembly process in
supramolecular chemistry. [142] The attractive nonbonding interaction between π-electrons in
aromatic rings, named π- π interactions or π−stacking, is also present in nature, such as in the
stacking of nucleotide bases in DNA [6] and has been suggested to facilitate amyloid fiber
formation. [3, 143] Whether this self-assembly is strictly a result of interaction between the
aromatic groups or a sum of cooperative contributions is still a matter of controversy. In an
effort to shed light onto the debate, several studies evaluating the effects of replacing aromatic
moieties with nonaromatic groups in self-assembling peptide sequences have been reported.
Takto et al. replaced phenylalanine (F) residues with its nonaromatic and more hydrophobic
form, cyclohexylalanine (Cha), in a 12 residue β-hairpin peptide, resulting in a reduced
propensity to self-assemble.[144] Such results suggest a correlation between the presence of
aromatic groups in the molecular subunit and its self-assembly ability. However, in a different
study by Bowerman et al. the replacement of F with Cha in the peptide amphiphile (FKFE)2 was
shown to improve hydrogelation properties.[145] These two studies illustrate the distinct
outcomes while performing similar experiments and prompt us to assume that a complex set of
parameters may influence the overall interactions and self-assembly, which cannot be confined
to simply one type of interaction. It appears to exist a lack of consensus on the true role of
aromatic interactions in self-assembling mechanisms due to contradicting results, nonetheless, it
is clear that many gelators hold aromatic moieties.
Peptide-based low-molecular-weight gelators (LMWGs) are small molecules that self-assemble
in water forming fibrous structures that arrange themselves into three dimensional networks,
originating a hydrogel. [146] Several reports have emerged on LMWGs composed of dipeptides
or tripeptides bonded to large aromatic groups such as fluorenylmethoxycarbonyl (Fmoc),
naphthalene, pyrene and spiropyran, depicted in Figure 35, perhaps a reflection of the
propensity of these aromatic groups to induce gelation.[146-154]
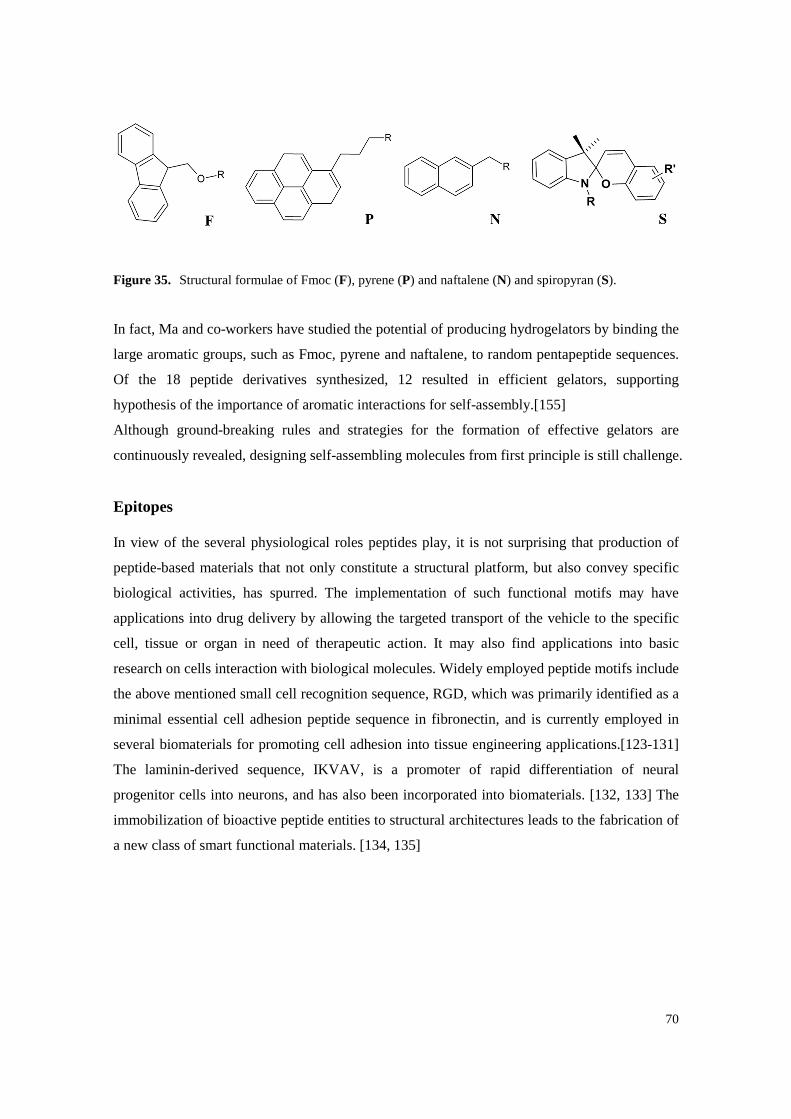
70
Figure 35. Structural formulae of Fmoc (F), pyrene (P) and naftalene (N) and spiropyran (S).
In fact, Ma and co-workers have studied the potential of producing hydrogelators by binding the
large aromatic groups, such as Fmoc, pyrene and naftalene, to random pentapeptide sequences.
Of the 18 peptide derivatives synthesized, 12 resulted in efficient gelators, supporting
hypothesis of the importance of aromatic interactions for self-assembly.[155]
Although ground-breaking rules and strategies for the formation of effective gelators are
continuously revealed, designing self-assembling molecules from first principle is still challenge.
Epitopes
In view of the several physiological roles peptides play, it is not surprising that production of
peptide-based materials that not only constitute a structural platform, but also convey specific
biological activities, has spurred. The implementation of such functional motifs may have
applications into drug delivery by allowing the targeted transport of the vehicle to the specific
cell, tissue or organ in need of therapeutic action. It may also find applications into basic
research on cells interaction with biological molecules. Widely employed peptide motifs include
the above mentioned small cell recognition sequence, RGD, which was primarily identified as a
minimal essential cell adhesion peptide sequence in fibronectin, and is currently employed in
several biomaterials for promoting cell adhesion into tissue engineering applications.[123-131]
The laminin-derived sequence, IKVAV, is a promoter of rapid differentiation of neural
progenitor cells into neurons, and has also been incorporated into biomaterials. [132, 133] The
immobilization of bioactive peptide entities to structural architectures leads to the fabrication of
a new class of smart functional materials. [134, 135]

71
III.2. Antimicrobial Self-assembled Peptide
hydrogel with wound healing properties
72
Abstract
Nitric oxide is an endogenously produced molecule which is implicated in several wound
healing mechanisms. Its topical delivery may improve healing in acute or chronic wounds. In
this study we synthesized an antimicrobial peptide which self-assembled upon a pH shift,
forming a hydrogel. The peptide was chemically functionalized to incorporate an NO-donor
moiety on the lysine residues. Extent of reaction was measured by the ninhydrin assay and the
NO-release rate was quantified via Griess reaction method. The resulting compound was
evaluated for its antimicrobial activity against Escherichia coli and its effect on collagen
production by fibroblasts was assessed.
73
Introduction
NO and wound healing
Nitric oxide (NO) is an important biosignalling molecule with regulatory functions in the
cardiovascular, immune and central and peripheral nervous systems. Its synthesis is catalysed
by NO synthase (NOS), an enzyme known to exist in three distinct isoforms: neuronal (nNOS),
endothelial (eNOS) and inducible (iNOS).[156] In general, they are thought to catalyse the
oxidation of L-Arginine to L-citrulline and NO, although it is still a matter of debate whether
NO or reactive nitrogen species (RNS) are the actual product of reaction. Regardless, all
isoforms are expressed in skin tissue, even if in different cell types. Both nNOS and eNOS are
constitutively active, via a calcium-dependent pathway, and generate low concentrations of NO
(in the nM range), while iNOS is activated in inflammatory conditions, releasing higher NO
concentrations (in µM range).[157]
Different studies have suggested that nitric oxide synthesis is correlated to the successful
outcome of wound healing. In a study by Shaffer et al., the authors administered a competitive
inhibitor of NOS – S-methyl isothiouronium – to mice with a dorsal skin incision. They
observed a reduction of nitrite/nitrate concentration – the oxidation products of NO – in the
wound fluid, which was dependant on the concentration of NOS inhibitor administered. A
concomitant decrease in collagen accumulation and wound breaking strength was also
reported.[158] Yamasaki and co-workers compared wound closure in inducible nitric oxide
synthase (iNOS) knockout mice with wildtype animals.[159] They observed a 31% delay on
time required for wound closure in the knockout mice, which was reversed by application of an
adenoviral vector containing human iNOS cDNA.[159] Endothelial NOS has also been shown
to play a critical role in wound healing mechanisms. A study of an excisional wound repair in
eNOS knockout mice resulted in a delayed wound closure time when compared with wildtype
controls, as well as decreased incisional wound tensile strength. [160] Results also suggest an
abnormal angiogenic process as a result of eNOS deficiency. NO has been described to promote
angiogenesis by several mechanisms, such as enhancing endothelial cell proliferation and
migration, increasing the expression of vascular endothelial growth factor (VEGF) and acting as
a vasodilator.[161] Thus, NO deficient wounds may lack the capillary network that would allow
the appropriate transportation of oxygen and nutrients and the removal of waste products.
Altogether, their results provide evidence to the critical role that NOSs play in the wound
healing process.
74
It has also been shown that wounds of diabetic-induced rats, with the characteristic defective
healing, are accompanied by a decrease of NO products in wound fluid.[162] To counteract this
reduction of NO synthesis, a research group purposed the supplementation of diabetic-induced
rats’ diet with L-arginine, the main substrate of NOS. Their study revealed that increasing L-
arginine in the animals’ diet was able to, at least partially, restore NO production to normal
levels and improve wound healing.[163]
Given that impaired wound healing has been associated with the reduced availability of NO, it
is reasonable to expect that exogenous sources of NO might be a therapeutic option for
improving wound healing. Studies employing NO-releasing materials have shown promising
results in improving wound repair.[164-166]
NO donors
Nitric Oxide has been shown to be an important mediator in many biological processes and has
the potential to function as a therapeutic agent. However, NO is a free radical and a highly
reactive specie, greatly limiting its action radius. In order to prevent unwanted reactions to take
place before NO reaches the site of action, NO donor drugs, that help stabilize the NO molecule,
are being developed.
NO-releasing drugs currently used in clinical practice, mostly belong to the organic nitric
category, which encompasses nitroglycerin (GTN) and isosorbide mononitrate (ISMN),
employed in the treatment of angina. However, these have been reported to lead to the
development of tolerance with prolonged continuous use.[167] Other NO-releasing drugs used
clinically include sodium nitroprusside (SNP), which is applied in hypertensive crises for an
immediate reduction of blood pressure. Since this molecule is broken down by hemoglobin into
cyanide, its administration encompasses the risk of cyanide poisoning.[168] Currently, NO
donor drugs belonging to the S-nitrosothiols and Diazeniumdiolates classes are settling in as
promising therapeutic agents. [169, 170]
S-nitrosothiols are compounds with the generic structure RSNO, where a thiol group (R-SH) is
bound to the NO moiety.[171] Although they are not yet used in clinical practice, S-
nitrosothiols are widely studied. The systemic administration of S-nitroso-glutathione (GSNO)
to rats, revealed an increased collagen deposition at wound sites.[172] GSNO has also been
topically administered, by application of a hydrogel containing the NO donor, to the wound bed
of rats, resulting in accelerated wound closure and re-epithelialization.[173] The same
procedure was implemented to ischaemic wounds, where a faster wound contraction and re-
epithelisation as well as an increase in collagen fiber density and organization were observed in
GSNO-treated animals when compared to control group.[174]
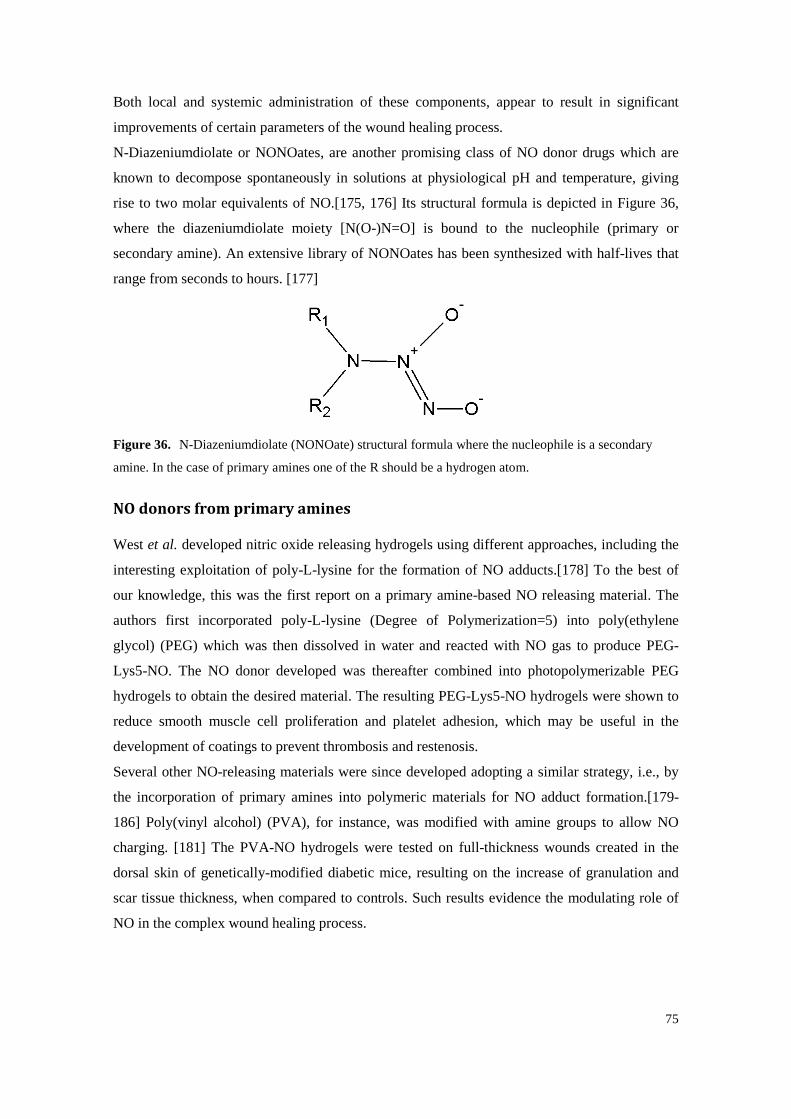
75
Both local and systemic administration of these components, appear to result in significant
improvements of certain parameters of the wound healing process.
N-Diazeniumdiolate or NONOates, are another promising class of NO donor drugs which are
known to decompose spontaneously in solutions at physiological pH and temperature, giving
rise to two molar equivalents of NO.[175, 176] Its structural formula is depicted in Figure 36,
where the diazeniumdiolate moiety [N(O-)N=O] is bound to the nucleophile (primary or
secondary amine). An extensive library of NONOates has been synthesized with half-lives that
range from seconds to hours. [177]
Figure 36. N-Diazeniumdiolate (NONOate) structural formula where the nucleophile is a secondary
amine. In the case of primary amines one of the R should be a hydrogen atom.
NO donors from primary amines
West et al. developed nitric oxide releasing hydrogels using different approaches, including the
interesting exploitation of poly-L-lysine for the formation of NO adducts.[178] To the best of
our knowledge, this was the first report on a primary amine-based NO releasing material. The
authors first incorporated poly-L-lysine (Degree of Polymerization=5) into poly(ethylene
glycol) (PEG) which was then dissolved in water and reacted with NO gas to produce PEG-
Lys5-NO. The NO donor developed was thereafter combined into photopolymerizable PEG
hydrogels to obtain the desired material. The resulting PEG-Lys5-NO hydrogels were shown to
reduce smooth muscle cell proliferation and platelet adhesion, which may be useful in the
development of coatings to prevent thrombosis and restenosis.
Several other NO-releasing materials were since developed adopting a similar strategy, i.e., by
the incorporation of primary amines into polymeric materials for NO adduct formation.[179-
186] Poly(vinyl alcohol) (PVA), for instance, was modified with amine groups to allow NO
charging. [181] The PVA-NO hydrogels were tested on full-thickness wounds created in the
dorsal skin of genetically-modified diabetic mice, resulting on the increase of granulation and
scar tissue thickness, when compared to controls. Such results evidence the modulating role of
NO in the complex wound healing process.
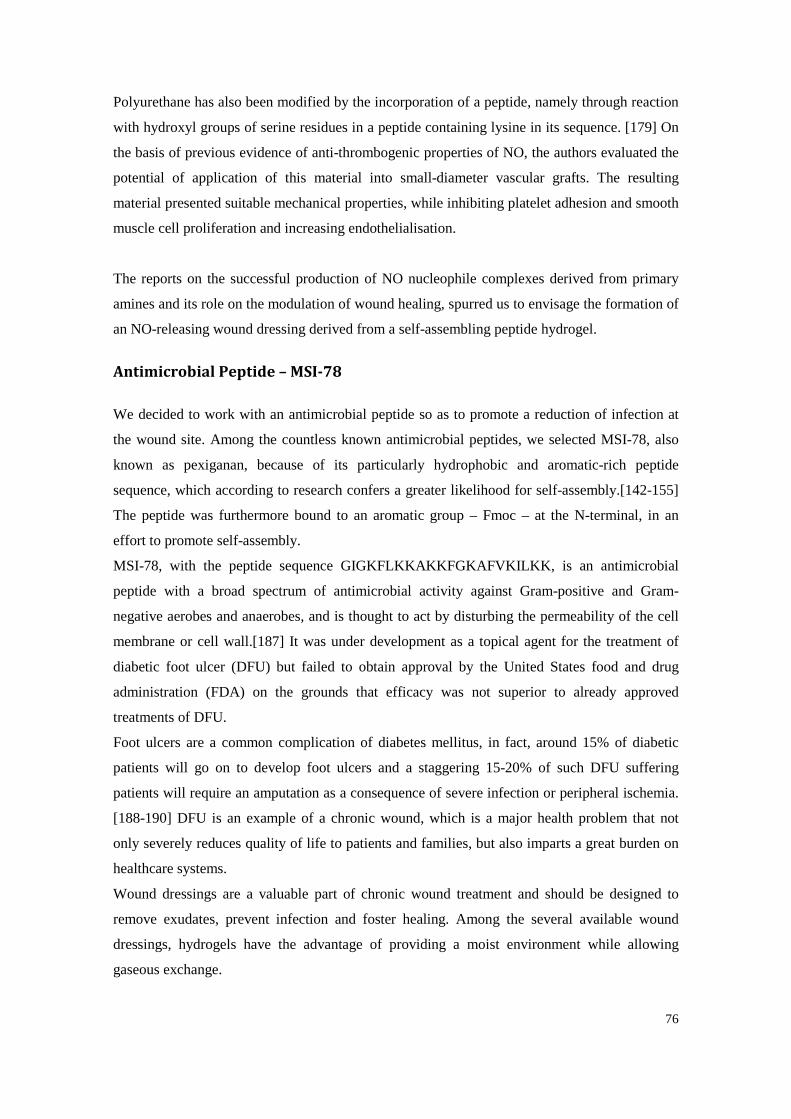
76
Polyurethane has also been modified by the incorporation of a peptide, namely through reaction
with hydroxyl groups of serine residues in a peptide containing lysine in its sequence. [179] On
the basis of previous evidence of anti-thrombogenic properties of NO, the authors evaluated the
potential of application of this material into small-diameter vascular grafts. The resulting
material presented suitable mechanical properties, while inhibiting platelet adhesion and smooth
muscle cell proliferation and increasing endothelialisation.
The reports on the successful production of NO nucleophile complexes derived from primary
amines and its role on the modulation of wound healing, spurred us to envisage the formation of
an NO-releasing wound dressing derived from a self-assembling peptide hydrogel.
Antimicrobial Peptide – MSI-78
We decided to work with an antimicrobial peptide so as to promote a reduction of infection at
the wound site. Among the countless known antimicrobial peptides, we selected MSI-78, also
known as pexiganan, because of its particularly hydrophobic and aromatic-rich peptide
sequence, which according to research confers a greater likelihood for self-assembly.[142-155]
The peptide was furthermore bound to an aromatic group – Fmoc – at the N-terminal, in an
effort to promote self-assembly.
MSI-78, with the peptide sequence GIGKFLKKAKKFGKAFVKILKK, is an antimicrobial
peptide with a broad spectrum of antimicrobial activity against Gram-positive and Gram-
negative aerobes and anaerobes, and is thought to act by disturbing the permeability of the cell
membrane or cell wall.[187] It was under development as a topical agent for the treatment of
diabetic foot ulcer (DFU) but failed to obtain approval by the United States food and drug
administration (FDA) on the grounds that efficacy was not superior to already approved
treatments of DFU.
Foot ulcers are a common complication of diabetes mellitus, in fact, around 15% of diabetic
patients will go on to develop foot ulcers and a staggering 15-20% of such DFU suffering
patients will require an amputation as a consequence of severe infection or peripheral ischemia.
[188-190] DFU is an example of a chronic wound, which is a major health problem that not
only severely reduces quality of life to patients and families, but also imparts a great burden on
healthcare systems.
Wound dressings are a valuable part of chronic wound treatment and should be designed to
remove exudates, prevent infection and foster healing. Among the several available wound
dressings, hydrogels have the advantage of providing a moist environment while allowing
gaseous exchange.
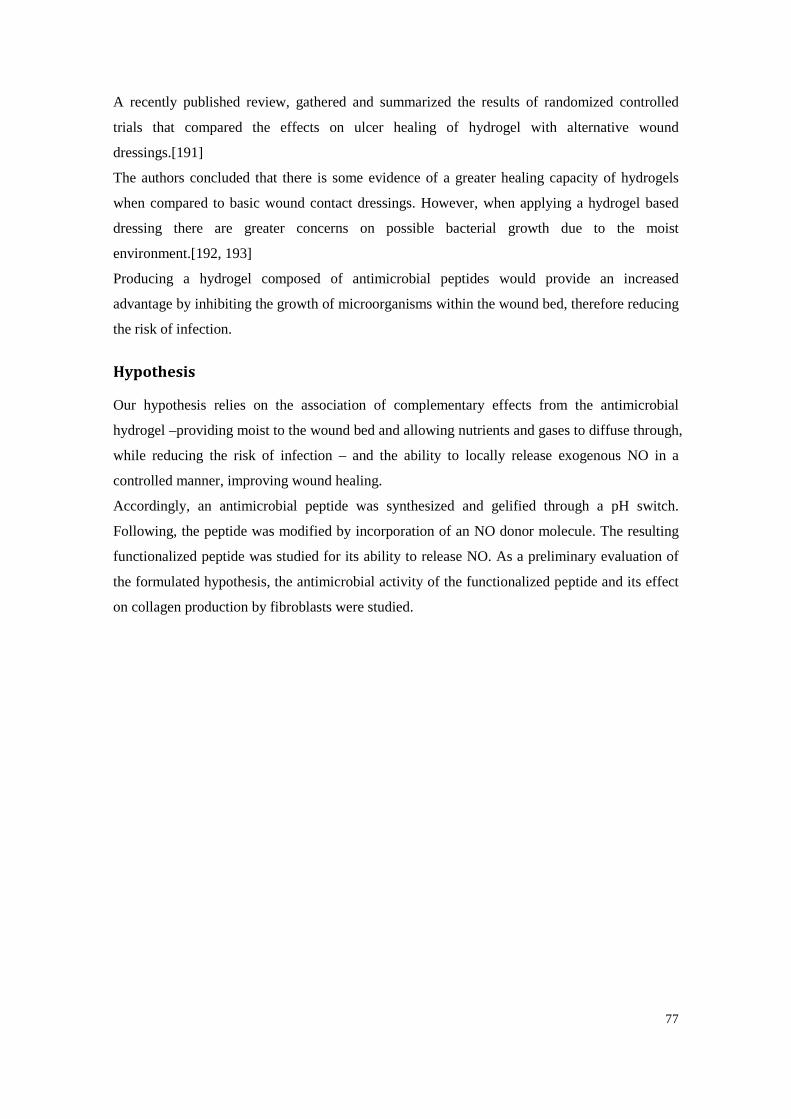
77
A recently published review, gathered and summarized the results of randomized controlled
trials that compared the effects on ulcer healing of hydrogel with alternative wound
dressings.[191]
The authors concluded that there is some evidence of a greater healing capacity of hydrogels
when compared to basic wound contact dressings. However, when applying a hydrogel based
dressing there are greater concerns on possible bacterial growth due to the moist
environment.[192, 193]
Producing a hydrogel composed of antimicrobial peptides would provide an increased
advantage by inhibiting the growth of microorganisms within the wound bed, therefore reducing
the risk of infection.
Hypothesis
Our hypothesis relies on the association of complementary effects from the antimicrobial
hydrogel –providing moist to the wound bed and allowing nutrients and gases to diffuse through,
while reducing the risk of infection – and the ability to locally release exogenous NO in a
controlled manner, improving wound healing.
Accordingly, an antimicrobial peptide was synthesized and gelified through a pH switch.
Following, the peptide was modified by incorporation of an NO donor molecule. The resulting
functionalized peptide was studied for its ability to release NO. As a preliminary evaluation of
the formulated hypothesis, the antimicrobial activity of the functionalized peptide and its effect
on collagen production by fibroblasts were studied.
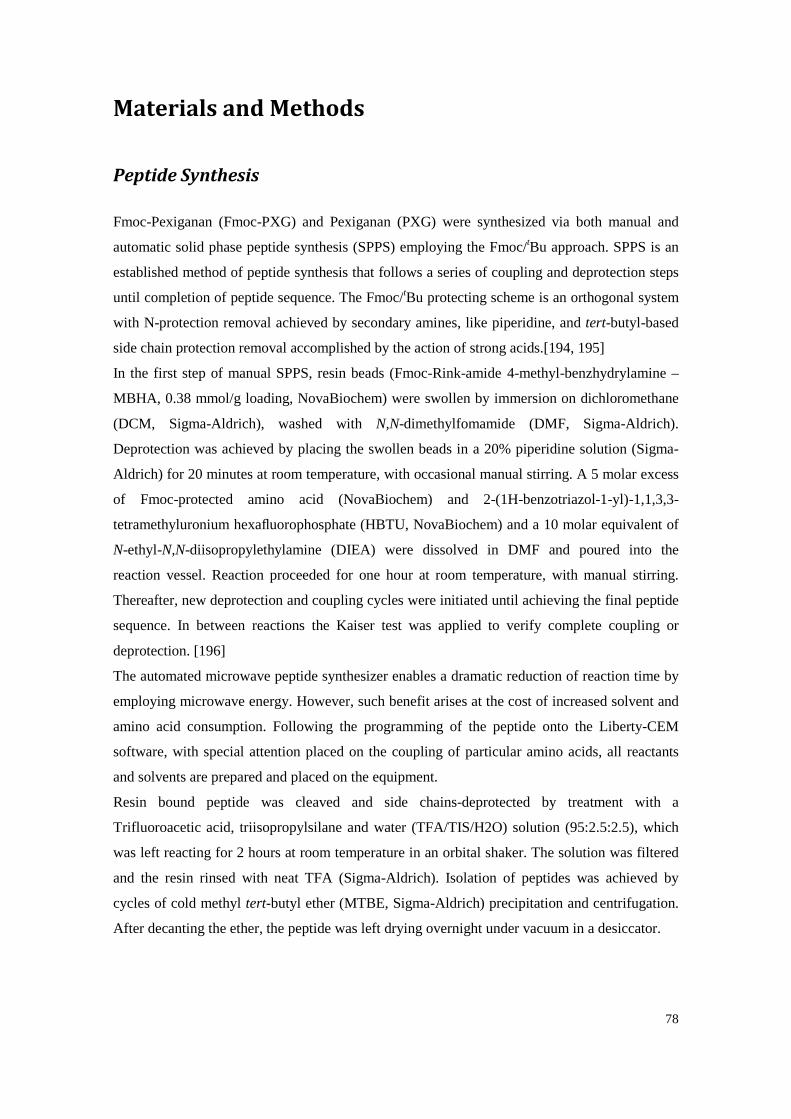
78
Materials and Methods
Peptide Synthesis
Fmoc-Pexiganan (Fmoc-PXG) and Pexiganan (PXG) were synthesized via both manual and
automatic solid phase peptide synthesis (SPPS) employing the Fmoc/tBu approach. SPPS is an
established method of peptide synthesis that follows a series of coupling and deprotection steps
until completion of peptide sequence. The Fmoc/tBu protecting scheme is an orthogonal system
with N-protection removal achieved by secondary amines, like piperidine, and tert-butyl-based
side chain protection removal accomplished by the action of strong acids.[194, 195]
In the first step of manual SPPS, resin beads (Fmoc-Rink-amide 4-methyl-benzhydrylamine –
MBHA, 0.38 mmol/g loading, NovaBiochem) were swollen by immersion on dichloromethane
(DCM, Sigma-Aldrich), washed with N,N-dimethylfomamide (DMF, Sigma-Aldrich).
Deprotection was achieved by placing the swollen beads in a 20% piperidine solution (Sigma-
Aldrich) for 20 minutes at room temperature, with occasional manual stirring. A 5 molar excess
of Fmoc-protected amino acid (NovaBiochem) and 2-(1H-benzotriazol-1-yl)-1,1,3,3-
tetramethyluronium hexafluorophosphate (HBTU, NovaBiochem) and a 10 molar equivalent of
N-ethyl-N,N-diisopropylethylamine (DIEA) were dissolved in DMF and poured into the
reaction vessel. Reaction proceeded for one hour at room temperature, with manual stirring.
Thereafter, new deprotection and coupling cycles were initiated until achieving the final peptide
sequence. In between reactions the Kaiser test was applied to verify complete coupling or
deprotection. [196]
The automated microwave peptide synthesizer enables a dramatic reduction of reaction time by
employing microwave energy. However, such benefit arises at the cost of increased solvent and
amino acid consumption. Following the programming of the peptide onto the Liberty-CEM
software, with special attention placed on the coupling of particular amino acids, all reactants
and solvents are prepared and placed on the equipment.
Resin bound peptide was cleaved and side chains-deprotected by treatment with a
Trifluoroacetic acid, triisopropylsilane and water (TFA/TIS/H2O) solution (95:2.5:2.5), which
was left reacting for 2 hours at room temperature in an orbital shaker. The solution was filtered
and the resin rinsed with neat TFA (Sigma-Aldrich). Isolation of peptides was achieved by
cycles of cold methyl tert-butyl ether (MTBE, Sigma-Aldrich) precipitation and centrifugation.
After decanting the ether, the peptide was left drying overnight under vacuum in a desiccator.
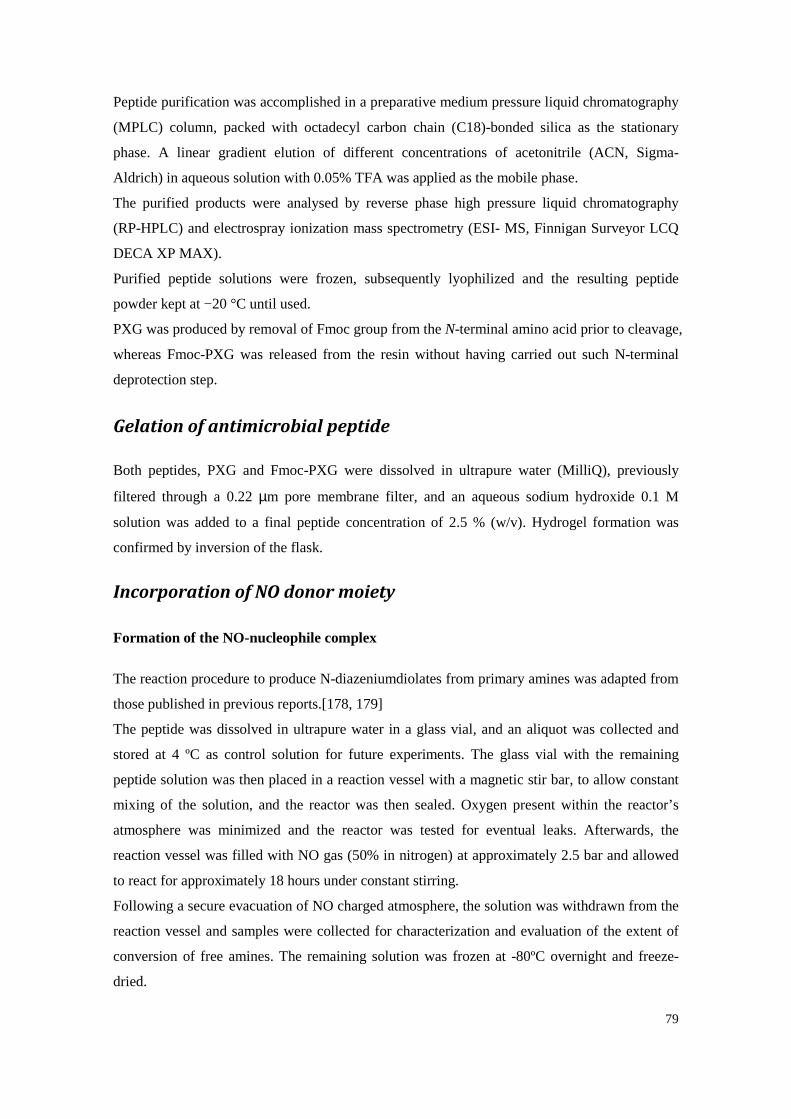
79
Peptide purification was accomplished in a preparative medium pressure liquid chromatography
(MPLC) column, packed with octadecyl carbon chain (C18)-bonded silica as the stationary
phase. A linear gradient elution of different concentrations of acetonitrile (ACN, Sigma-
Aldrich) in aqueous solution with 0.05% TFA was applied as the mobile phase.
The purified products were analysed by reverse phase high pressure liquid chromatography
(RP-HPLC) and electrospray ionization mass spectrometry (ESI- MS, Finnigan Surveyor LCQ
DECA XP MAX).
Purified peptide solutions were frozen, subsequently lyophilized and the resulting peptide
powder kept at −20 °C until used.
PXG was produced by removal of Fmoc group from the N-terminal amino acid prior to cleavage,
whereas Fmoc-PXG was released from the resin without having carried out such N-terminal
deprotection step.
Gelation of antimicrobial peptide
Both peptides, PXG and Fmoc-PXG were dissolved in ultrapure water (MilliQ), previously
filtered through a 0.22 µm pore membrane filter, and an aqueous sodium hydroxide 0.1 M
solution was added to a final peptide concentration of 2.5 % (w/v). Hydrogel formation was
confirmed by inversion of the flask.
Incorporation of NO donor moiety
Formation of the NO-nucleophile complex
The reaction procedure to produce N-diazeniumdiolates from primary amines was adapted from
those published in previous reports.[178, 179]
The peptide was dissolved in ultrapure water in a glass vial, and an aliquot was collected and
stored at 4 ºC as control solution for future experiments. The glass vial with the remaining
peptide solution was then placed in a reaction vessel with a magnetic stir bar, to allow constant
mixing of the solution, and the reactor was then sealed. Oxygen present within the reactor’s
atmosphere was minimized and the reactor was tested for eventual leaks. Afterwards, the
reaction vessel was filled with NO gas (50% in nitrogen) at approximately 2.5 bar and allowed
to react for approximately 18 hours under constant stirring.
Following a secure evacuation of NO charged atmosphere, the solution was withdrawn from the
reaction vessel and samples were collected for characterization and evaluation of the extent of
conversion of free amines. The remaining solution was frozen at -80ºC overnight and freeze-
dried.
80
A sample of reaction product (Fmoc-PXG/NO) and control (Fmoc-PXG) were simultaneously
analysed via ninhydrin colorimetric assay to measure the extent of conversion of free amines.
Extent of reaction: Analysis of NO-nucleophile complex formation
The ninhydrin reagent was developed for the quantitative determination of amino acids by its
reaction with amino groups, producing the coloured ninhydrin chromophore named
Ruhemann’s purple (λmax=570 nm; є =22 000 M-1.cm-1).[197, 198] This assay was used as an
indirect method to quantify the extent of conversion of free amines to NO-nucleophile
complexes, which has been described as the established methodology for primary amine
functionalization with NONOates.
A myriad of different variations of the ninhydrin protocol can be found, however, in this work,
the optimized protocol that resulted from a systematic study on the effect of different variables
on the assay was used.[199]
Ninhydrin solution was made fresh for every experiment and quantities adjusted according to
the volume required. Briefly, for the preparation of a 10 ml solution, 30 mg of hydrindantin and
200 mg of ninhydrin were dissolved in 7.5 ml of dimethylsulfoxide (DMSO). Immediately prior
to analysis 2.5 mL of a 4 M sodium acetate buffer solution at pH 5.2 was added. Unknown
samples (0.5 ml) and ninhydrin solution (0.5 ml) were added to a screw-capped test tube and
heated in a boiling water bath for 15 min. After cooling the samples in an ice bath to stop the
reaction, 2.5 ml of a 50% ethanol solution was added and vigorously mixed. Absorbance was
monitored at 570 nm (Shimadzu UV-2401 PC).
Kinetics of NO Release
There are essentially three methods which are currently employed for measuring NO:
electrochemistry, chemiluminescence and Griess reaction. Chemiluminescence measures NO
directly, has a high sensitivity (around 0.5 ppb to 500 ppm NO) and is not easily influenced by
interfering species. However this systems are highly expensive, and the NO measured is
dependent on system configuration and flow rate of the carrier gas. Electrochemistry on the
other hand relies on the detection of NO via its reduction to N2O22- or its oxidation to NO3
-
following current measurement. This method is more affordable than chemiluminescence and
can be easily miniaturized to allow detection closer to NO source. However, a lot of biological
species interfere with the measurements, which forces the coating of electrodes with membranes,
thereby limiting the methods’ sensitivity.[200] The most popular method of quantification of
NO, due its simple execution and low price, is the Griess assay which measures NO indirectly
by quantifying nitrite, NO2-.
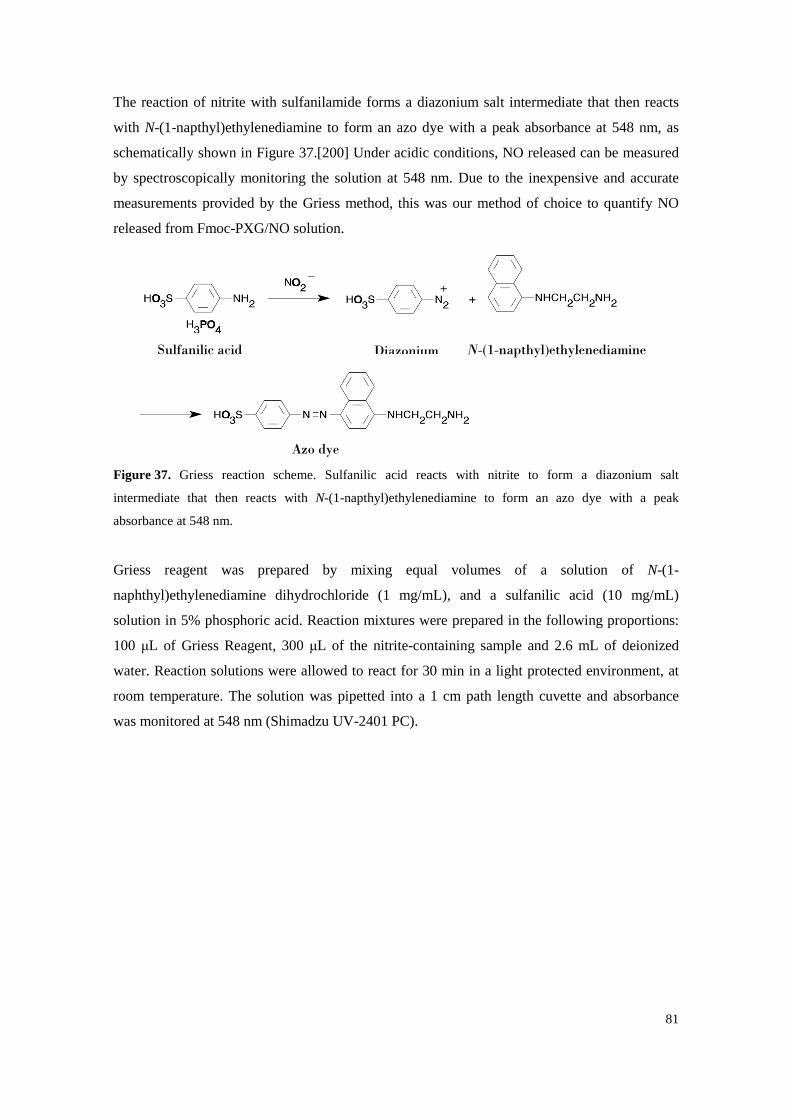
81
The reaction of nitrite with sulfanilamide forms a diazonium salt intermediate that then reacts
with N-(1-napthyl)ethylenediamine to form an azo dye with a peak absorbance at 548 nm, as
schematically shown in Figure 37.[200] Under acidic conditions, NO released can be measured
by spectroscopically monitoring the solution at 548 nm. Due to the inexpensive and accurate
measurements provided by the Griess method, this was our method of choice to quantify NO
released from Fmoc-PXG/NO solution.
Figure 37. Griess reaction scheme. Sulfanilic acid reacts with nitrite to form a diazonium salt
intermediate that then reacts with N-(1-napthyl)ethylenediamine to form an azo dye with a peak
absorbance at 548 nm.
Griess reagent was prepared by mixing equal volumes of a solution of N-(1-
naphthyl)ethylenediamine dihydrochloride (1 mg/mL), and a sulfanilic acid (10 mg/mL)
solution in 5% phosphoric acid. Reaction mixtures were prepared in the following proportions:
100 µL of Griess Reagent, 300 µL of the nitrite-containing sample and 2.6 mL of deionized
water. Reaction solutions were allowed to react for 30 min in a light protected environment, at
room temperature. The solution was pipetted into a 1 cm path length cuvette and absorbance
was monitored at 548 nm (Shimadzu UV-2401 PC).
Sulfanilic acid Diazonium N-(1-napthyl)ethylenediamine
Azo dye
82
Evaluation of antimicrobial properties
Functionalization of Fmoc-PXG
A 62 µM aqueous solution of Fmoc-PXG was reacted with NO gas (50% in nitrogen) for
approximately 18 hours in a closed reaction vessel as previously described.
Susceptibility Assay
E. coli (ATCC 25922) was tested by broth microdilution assay, following the procedure
outlined by the CLSI. [201]
The initial inoculum was prepared suspending bacteria from a colony onto approximately 50 ml
of Mueller-Hinton broth (MHB) and incubating for 16 to 24 hours in a thermostatic bath, set to
37ºC, with orbital shaking.
Peptide and ampicillin solutions were prepared in two-fold dilutions at twice the final desired
concentrations. Each solution was pipetted in triplicates into the 96 well plates, according to a
predefined disposition. The bacterial density of the inoculum was estimated by measuring its
optical density at 600 nm. It was then diluted in MHB to twice the final desired bacterial
concentration (5×10⁵ CFU/mL), expressed as colony forming units per millilitre. To allow the
quantification of E. Coli as CFU/mL, a calibration curve correlating this with optical density at
600 nm (OD600) was previously determined.
Each well containing the diluted peptide or antibiotic was inoculated with the prepared diluted
inoculum and the plate was covered and incubated for 20 hours at 37ºC. The absorbance was
monitored at 600 nm in a microplate reader (SynergyMx, Biotek).
Time-Kill Curve
The bactericidal action of the functionalized peptide against E. coli, was determined by
generating time-kill curves.
Glass tubes containing different concentrations of either control, functionalized peptide or blank
solutions, were inoculated with a suspension of E. coli at the final concentration of
approximately 1×10⁶ CFU/ml. The tubes were subsequently incubated at 37 ºC and viable
counts were performed at different time points (0, 0.5, 1, 2, 3 and 5 hours) after peptide addition.
To perform colony counts, aliquots of culture broth were taken after careful homogenization at
the predefined time points, serially diluted in sterile PBS and spread in duplicates over Nutrient
Agar plates. These were then incubated overnight at 37 ºC and colonies were counted.
83
In vitro assessment of Collagen expression
Cell Culture
Human Dermal Neonatal Fibroblasts (ZenBio, Inc) were grown in tissue culture flasks at 37 ºC
in a 5% CO2 controlled atmosphere in Dulbecco’s modified Eagle’s medium (Gibco/BRL,
Gaithersburg, MD) supplemented with 10% (v/v) fetal bovine serum (Gibco).
Subculturing was performed by tripsinizing cultures with 0.25% Trypsin (Sigma-Aldrich),
0.05% EDTA (Sigma-Aldrich). Experiments were performed at passage 15.
Fibroblasts were seeded at 2 × 10⁵ cells/well in four 6-well culture plates and incubated for
approximately 48 h at 37 ºC and 5% CO2. Upon reaching confluence the cells were subjected to
a serum starvation period of 6 hours, by replacing the culture medium with DMEM without
FBS. Following, culture medium was supplemented with 500 µM ascorbic acid (2-phospho-l-
ascorbic acid trisodium salt) and increasing Fmoc-PXG/NO and Fmoc-PXG concentrations [0,
5, 10, 20, 50 and 100] µM. The culture plates were then incubated at 37 ºC in a 5% CO2
controlled atmosphere for a period of 23 hours.
Functionalization of Fmoc-PXG
A 100 µM aqueous solution of Fmoc-PXG was reacted with NO gas (50% in nitrogen) for
approximately 18 hours in a closed reaction vessel as previously described.
Collagen quantification (Sircol assay)
Collagen released into the cell culture medium
Collagen was assessed by Sircol assay (Biocolor) according to instructions provided by the
manufacturer, with the exception of the Isolation and Concentration step, which was replaced
by an improved procedure recently published and tested in the laboratory as described in the
appendix section.[202]
Accordingly, 1 ml of Sircol reagent was added to 100 µl of sample volume and left reacting in a
shaker for 30 min at room temperature. The collagen-dye complex precipitate was deposited at
the bottom of the microcentrifuge tube by centrifugation and the solution drained. The
precipitate was then carefully washed to remove unbound dye from the surface of the pellet as
well as from the interior surface of the microcentrifuge tube. After solution centrifugation and
drainage, the precipitate was dissolved in 250 µl alkali reagent by applying vigorous mixing.
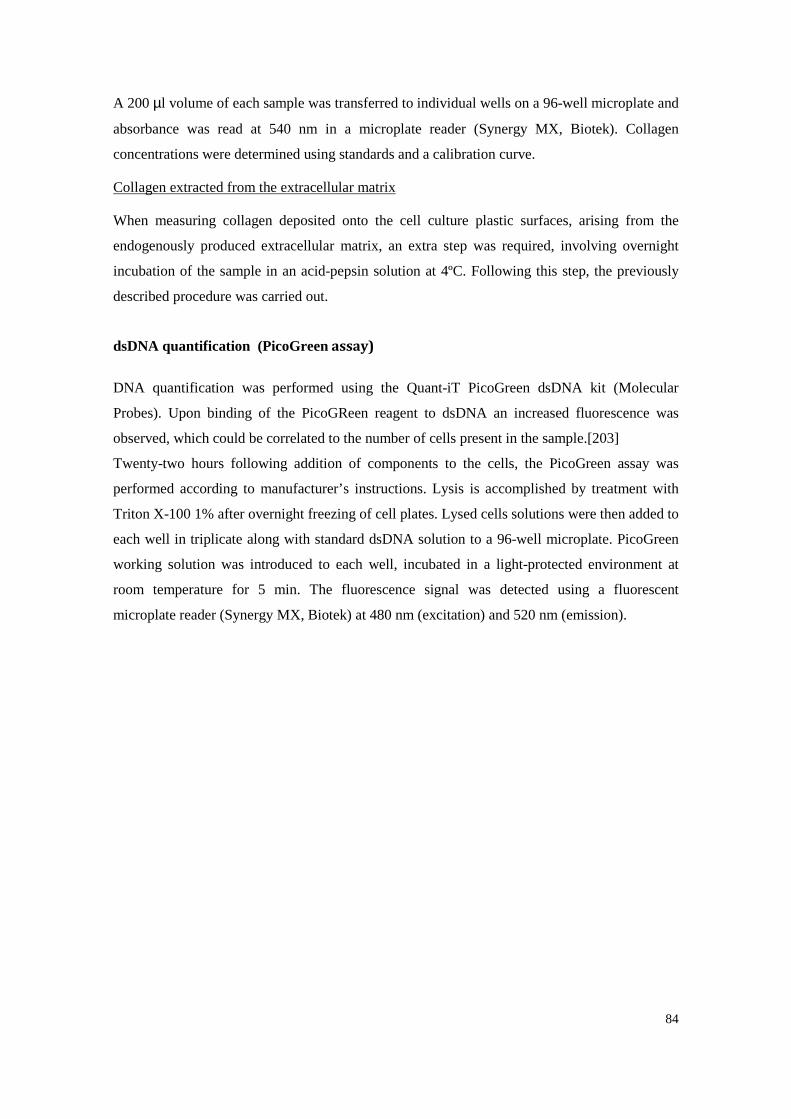
84
A 200 µl volume of each sample was transferred to individual wells on a 96-well microplate and
absorbance was read at 540 nm in a microplate reader (Synergy MX, Biotek). Collagen
concentrations were determined using standards and a calibration curve.
Collagen extracted from the extracellular matrix
When measuring collagen deposited onto the cell culture plastic surfaces, arising from the
endogenously produced extracellular matrix, an extra step was required, involving overnight
incubation of the sample in an acid-pepsin solution at 4ºC. Following this step, the previously
described procedure was carried out.
dsDNA quantification (PicoGreen assay)
DNA quantification was performed using the Quant-iT PicoGreen dsDNA kit (Molecular
Probes). Upon binding of the PicoGReen reagent to dsDNA an increased fluorescence was
observed, which could be correlated to the number of cells present in the sample.[203]
Twenty-two hours following addition of components to the cells, the PicoGreen assay was
performed according to manufacturer’s instructions. Lysis is accomplished by treatment with
Triton X-100 1% after overnight freezing of cell plates. Lysed cells solutions were then added to
each well in triplicate along with standard dsDNA solution to a 96-well microplate. PicoGreen
working solution was introduced to each well, incubated in a light-protected environment at
room temperature for 5 min. The fluorescence signal was detected using a fluorescent
microplate reader (Synergy MX, Biotek) at 480 nm (excitation) and 520 nm (emission).
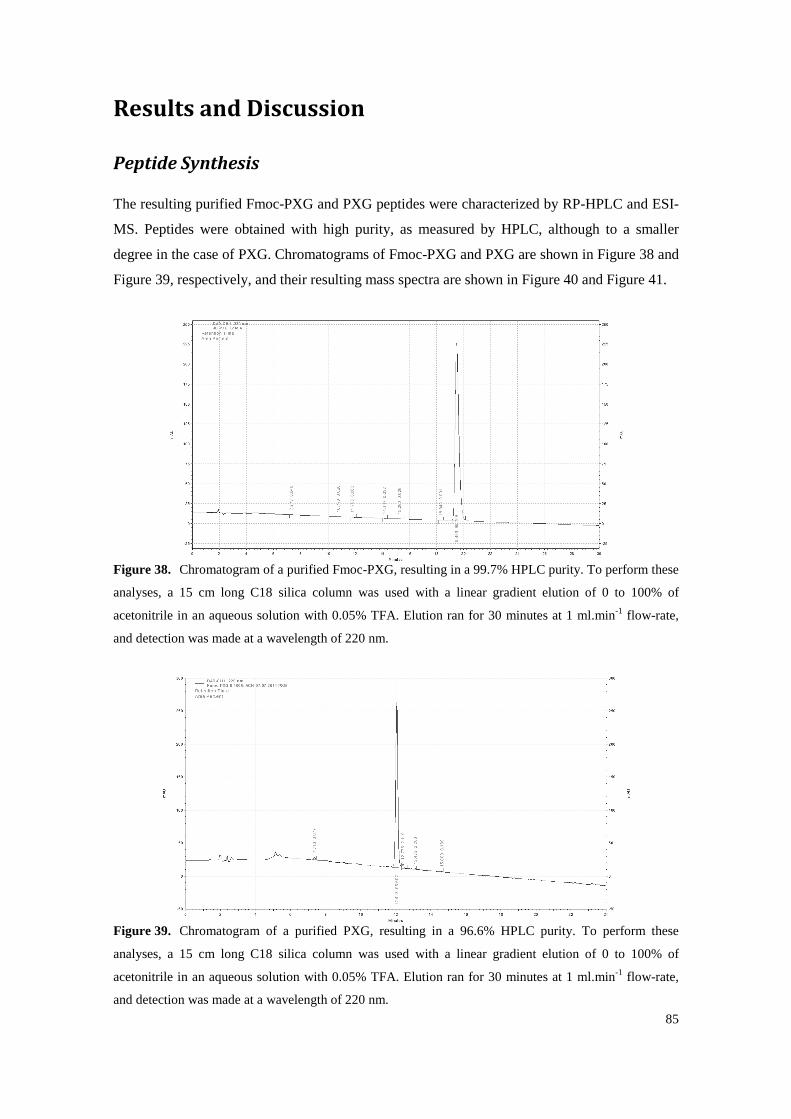
85
Results and Discussion
Peptide Synthesis
The resulting purified Fmoc-PXG and PXG peptides were characterized by RP-HPLC and ESI-
MS. Peptides were obtained with high purity, as measured by HPLC, although to a smaller
degree in the case of PXG. Chromatograms of Fmoc-PXG and PXG are shown in Figure 38 and
Figure 39, respectively, and their resulting mass spectra are shown in Figure 40 and Figure 41.
Figure 38. Chromatogram of a purified Fmoc-PXG, resulting in a 99.7% HPLC purity. To perform these
analyses, a 15 cm long C18 silica column was used with a linear gradient elution of 0 to 100% of
acetonitrile in an aqueous solution with 0.05% TFA. Elution ran for 30 minutes at 1 ml.min-1 flow-rate,
and detection was made at a wavelength of 220 nm.
Figure 39. Chromatogram of a purified PXG, resulting in a 96.6% HPLC purity. To perform these
analyses, a 15 cm long C18 silica column was used with a linear gradient elution of 0 to 100% of
acetonitrile in an aqueous solution with 0.05% TFA. Elution ran for 30 minutes at 1 ml.min-1 flow-rate,
and detection was made at a wavelength of 220 nm.
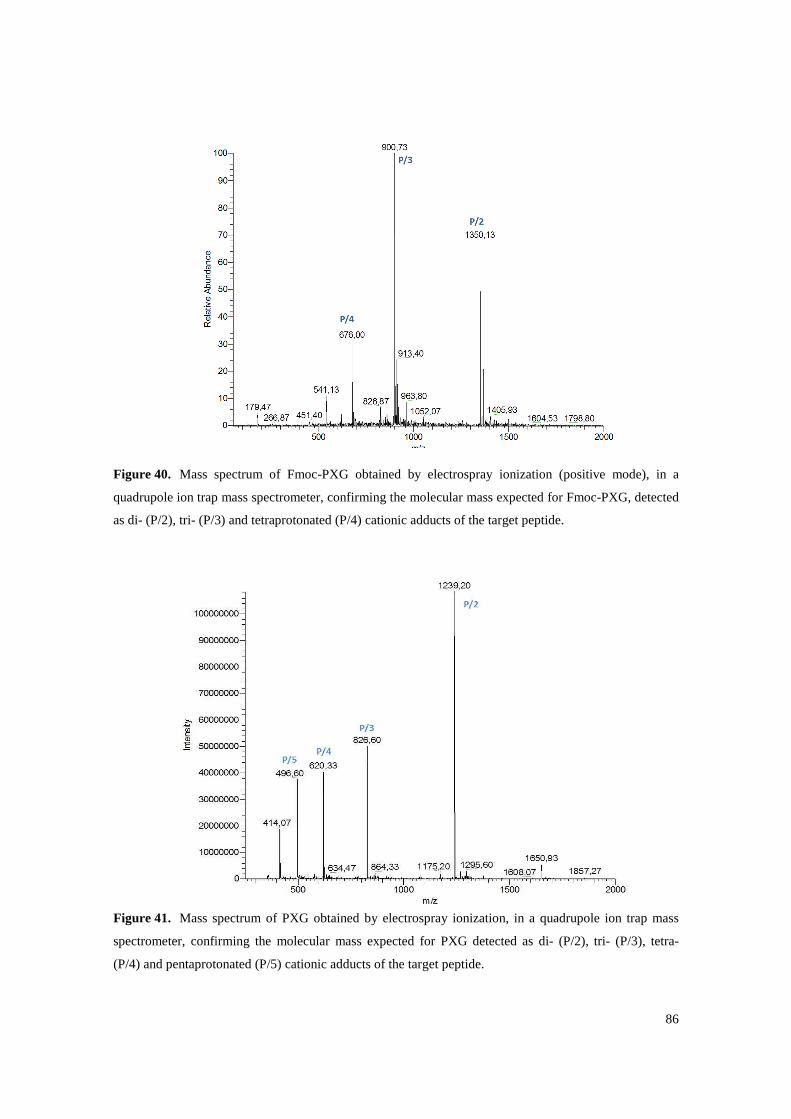
86
Figure 40. Mass spectrum of Fmoc-PXG obtained by electrospray ionization (positive mode), in a
quadrupole ion trap mass spectrometer, confirming the molecular mass expected for Fmoc-PXG, detected
as di- (P/2), tri- (P/3) and tetraprotonated (P/4) cationic adducts of the target peptide.
Figure 41. Mass spectrum of PXG obtained by electrospray ionization, in a quadrupole ion trap mass
spectrometer, confirming the molecular mass expected for PXG detected as di- (P/2), tri- (P/3), tetra-
(P/4) and pentaprotonated (P/5) cationic adducts of the target peptide.
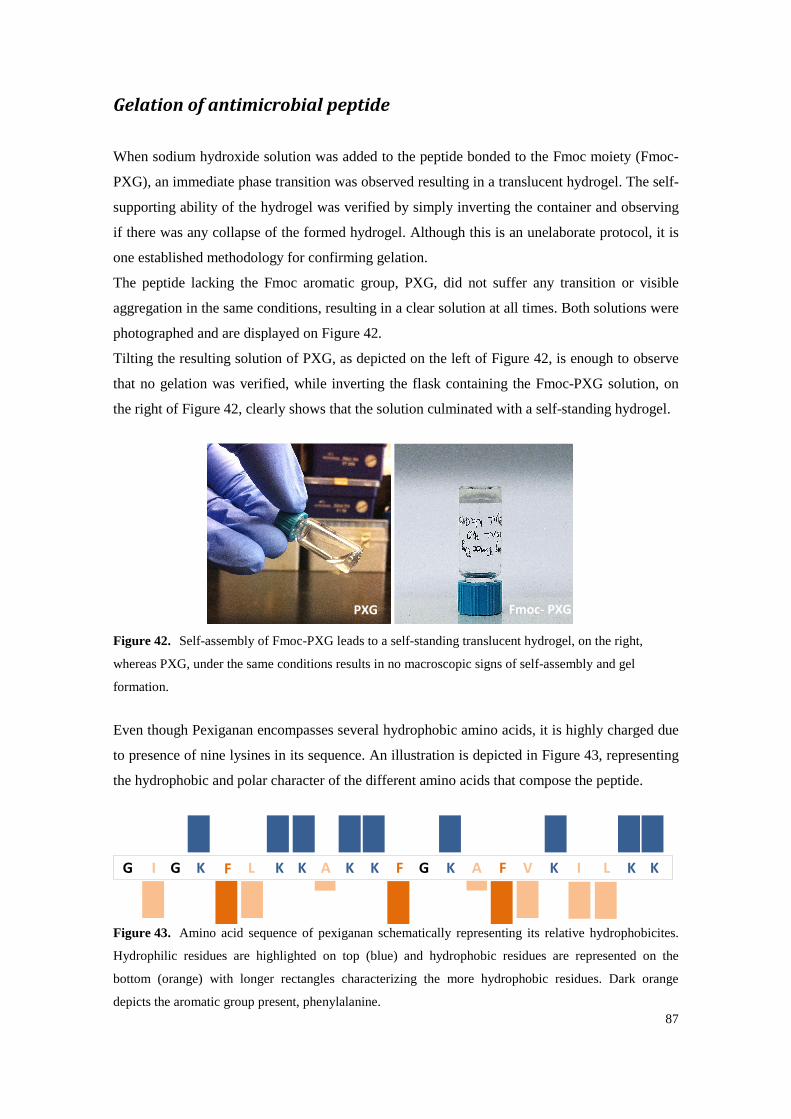
87
Gelation of antimicrobial peptide
When sodium hydroxide solution was added to the peptide bonded to the Fmoc moiety (Fmoc-
PXG), an immediate phase transition was observed resulting in a translucent hydrogel. The self-
supporting ability of the hydrogel was verified by simply inverting the container and observing
if there was any collapse of the formed hydrogel. Although this is an unelaborate protocol, it is
one established methodology for confirming gelation.
The peptide lacking the Fmoc aromatic group, PXG, did not suffer any transition or visible
aggregation in the same conditions, resulting in a clear solution at all times. Both solutions were
photographed and are displayed on Figure 42.
Tilting the resulting solution of PXG, as depicted on the left of Figure 42, is enough to observe
that no gelation was verified, while inverting the flask containing the Fmoc-PXG solution, on
the right of Figure 42, clearly shows that the solution culminated with a self-standing hydrogel.
Figure 42. Self-assembly of Fmoc-PXG leads to a self-standing translucent hydrogel, on the right,
whereas PXG, under the same conditions results in no macroscopic signs of self-assembly and gel
formation.
Even though Pexiganan encompasses several hydrophobic amino acids, it is highly charged due
to presence of nine lysines in its sequence. An illustration is depicted in Figure 43, representing
the hydrophobic and polar character of the different amino acids that compose the peptide.
Figure 43. Amino acid sequence of pexiganan schematically representing its relative hydrophobicites.
Hydrophilic residues are highlighted on top (blue) and hydrophobic residues are represented on the
bottom (orange) with longer rectangles characterizing the more hydrophobic residues. Dark orange
depicts the aromatic group present, phenylalanine.
KG I F L K A K K F GG K A F V K I L K KK
PXG Fmoc- PXG
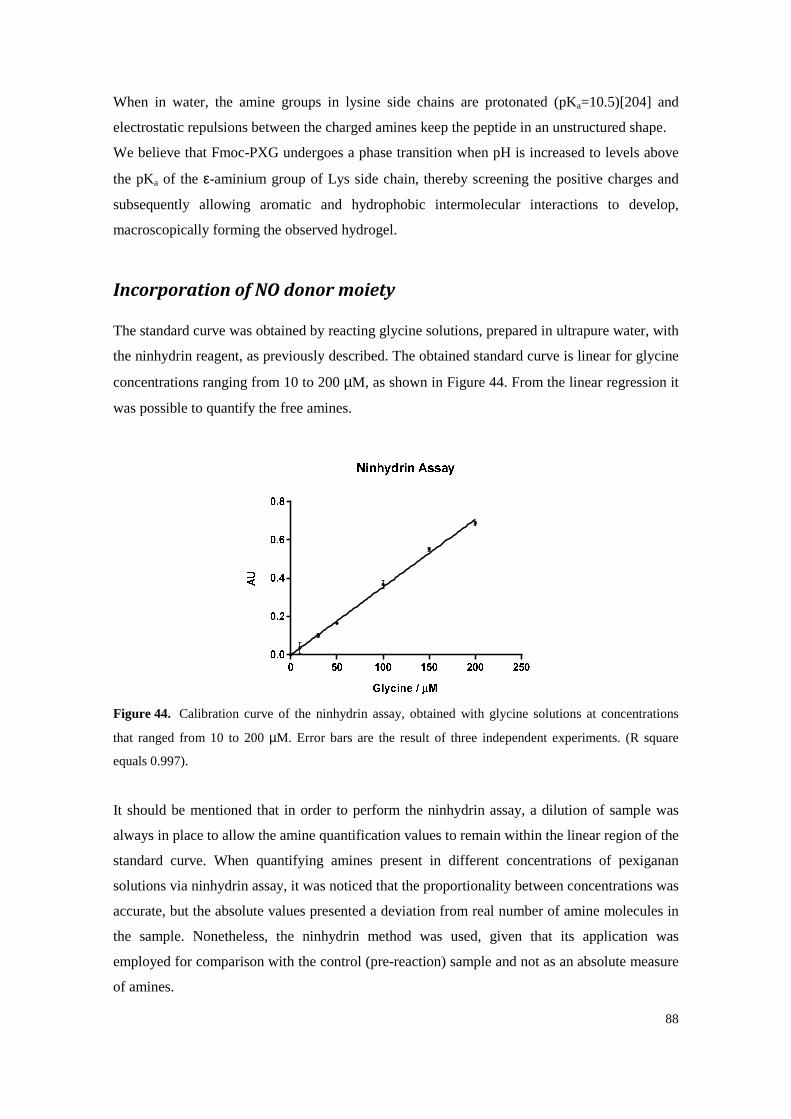
88
When in water, the amine groups in lysine side chains are protonated (pKa=10.5)[204] and
electrostatic repulsions between the charged amines keep the peptide in an unstructured shape.
We believe that Fmoc-PXG undergoes a phase transition when pH is increased to levels above
the pKa of the ε-aminium group of Lys side chain, thereby screening the positive charges and
subsequently allowing aromatic and hydrophobic intermolecular interactions to develop,
macroscopically forming the observed hydrogel.
Incorporation of NO donor moiety
The standard curve was obtained by reacting glycine solutions, prepared in ultrapure water, with
the ninhydrin reagent, as previously described. The obtained standard curve is linear for glycine
concentrations ranging from 10 to 200 µM, as shown in Figure 44. From the linear regression it
was possible to quantify the free amines.
Figure 44. Calibration curve of the ninhydrin assay, obtained with glycine solutions at concentrations
that ranged from 10 to 200 µM. Error bars are the result of three independent experiments. (R square
equals 0.997).
It should be mentioned that in order to perform the ninhydrin assay, a dilution of sample was
always in place to allow the amine quantification values to remain within the linear region of the
standard curve. When quantifying amines present in different concentrations of pexiganan
solutions via ninhydrin assay, it was noticed that the proportionality between concentrations was
accurate, but the absolute values presented a deviation from real number of amine molecules in
the sample. Nonetheless, the ninhydrin method was used, given that its application was
employed for comparison with the control (pre-reaction) sample and not as an absolute measure
of amines.
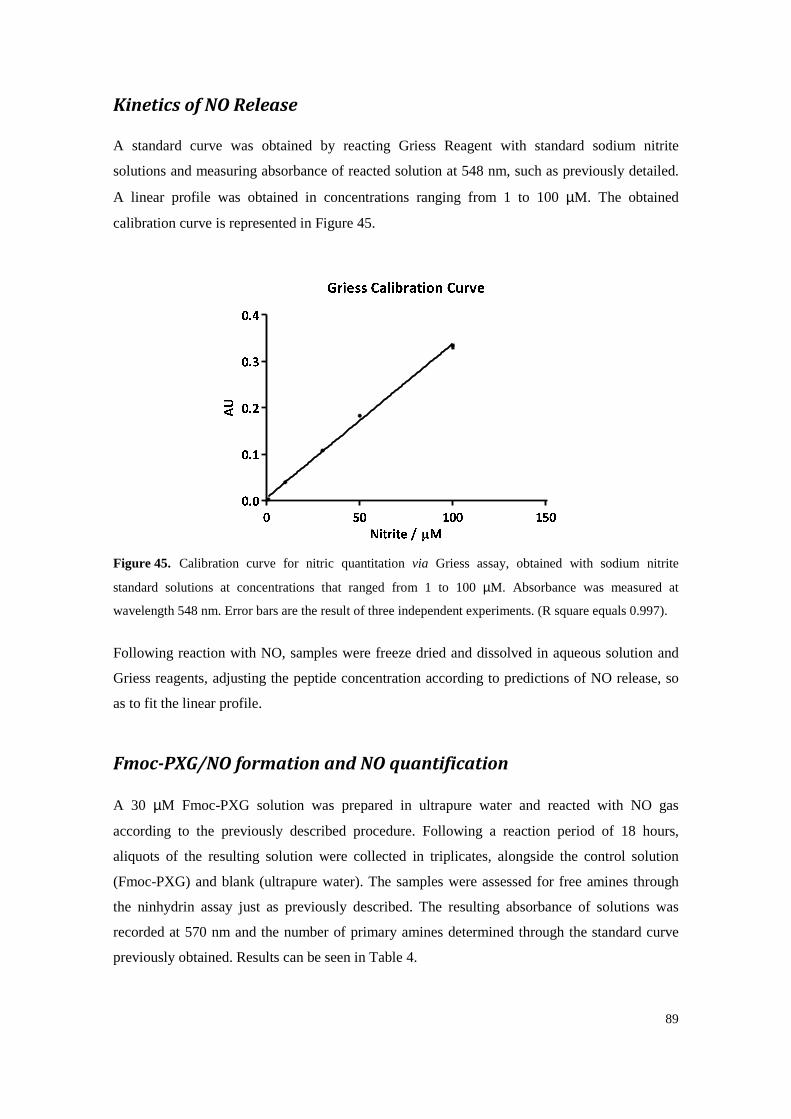
89
Kinetics of NO Release
A standard curve was obtained by reacting Griess Reagent with standard sodium nitrite
solutions and measuring absorbance of reacted solution at 548 nm, such as previously detailed.
A linear profile was obtained in concentrations ranging from 1 to 100 µM. The obtained
calibration curve is represented in Figure 45.
Figure 45. Calibration curve for nitric quantitation via Griess assay, obtained with sodium nitrite
standard solutions at concentrations that ranged from 1 to 100 µM. Absorbance was measured at
wavelength 548 nm. Error bars are the result of three independent experiments. (R square equals 0.997).
Following reaction with NO, samples were freeze dried and dissolved in aqueous solution and
Griess reagents, adjusting the peptide concentration according to predictions of NO release, so
as to fit the linear profile.
Fmoc-PXG/NO formation and NO quantification
A 30 µM Fmoc-PXG solution was prepared in ultrapure water and reacted with NO gas
according to the previously described procedure. Following a reaction period of 18 hours,
aliquots of the resulting solution were collected in triplicates, alongside the control solution
(Fmoc-PXG) and blank (ultrapure water). The samples were assessed for free amines through
the ninhydrin assay just as previously described. The resulting absorbance of solutions was
recorded at 570 nm and the number of primary amines determined through the standard curve
previously obtained. Results can be seen in Table 4.
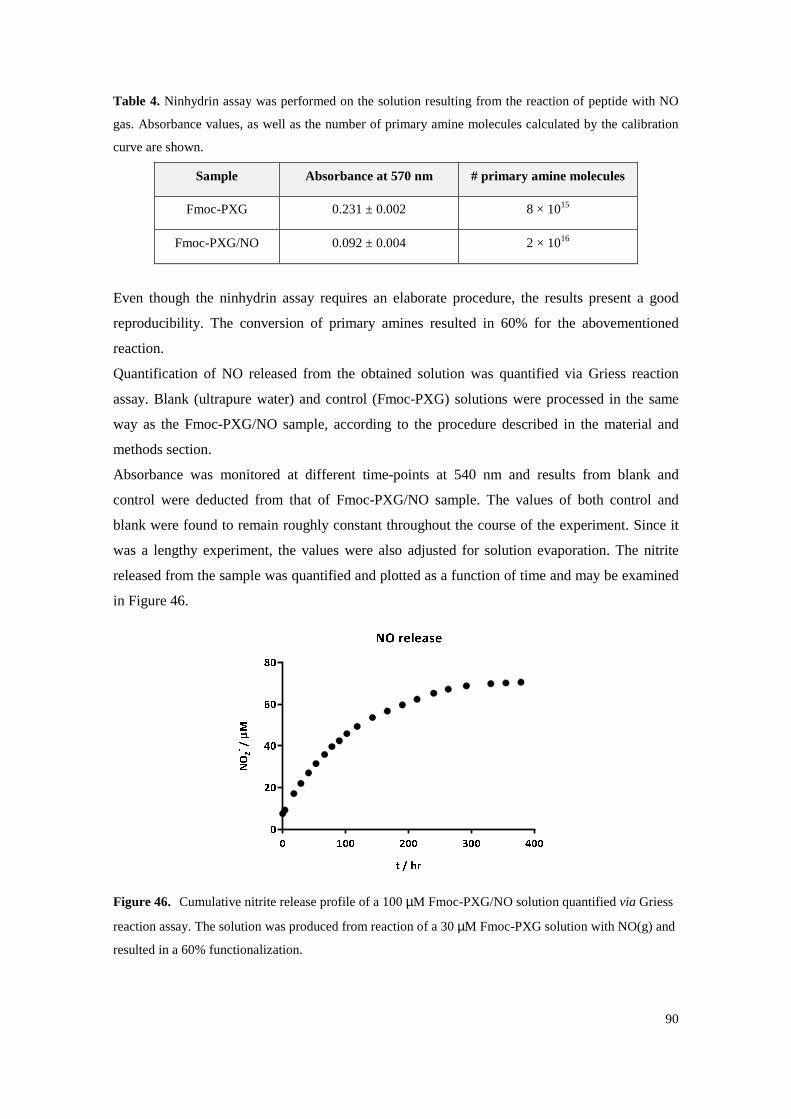
90
Table 4. Ninhydrin assay was performed on the solution resulting from the reaction of peptide with NO
gas. Absorbance values, as well as the number of primary amine molecules calculated by the calibration
curve are shown.
Sample Absorbance at 570 nm # primary amine molecules
Fmoc-PXG 0.231 ± 0.002 8 × 10¹⁵
Fmoc-PXG/NO 0.092 ± 0.004 2 × 10¹⁶
Even though the ninhydrin assay requires an elaborate procedure, the results present a good
reproducibility. The conversion of primary amines resulted in 60% for the abovementioned
reaction.
Quantification of NO released from the obtained solution was quantified via Griess reaction
assay. Blank (ultrapure water) and control (Fmoc-PXG) solutions were processed in the same
way as the Fmoc-PXG/NO sample, according to the procedure described in the material and
methods section.
Absorbance was monitored at different time-points at 540 nm and results from blank and
control were deducted from that of Fmoc-PXG/NO sample. The values of both control and
blank were found to remain roughly constant throughout the course of the experiment. Since it
was a lengthy experiment, the values were also adjusted for solution evaporation. The nitrite
released from the sample was quantified and plotted as a function of time and may be examined
in Figure 46.
Figure 46. Cumulative nitrite release profile of a 100 µM Fmoc-PXG/NO solution quantified via Griess
reaction assay. The solution was produced from reaction of a 30 µM Fmoc-PXG solution with NO(g) and
resulted in a 60% functionalization.
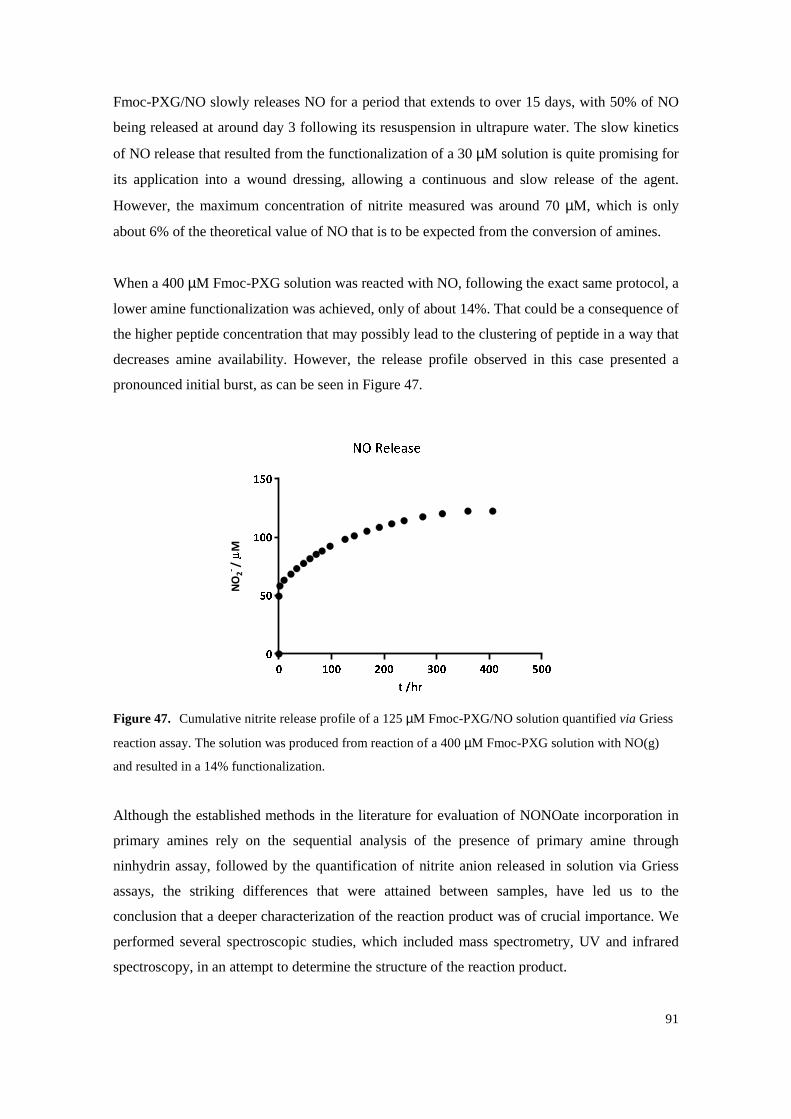
91
Fmoc-PXG/NO slowly releases NO for a period that extends to over 15 days, with 50% of NO
being released at around day 3 following its resuspension in ultrapure water. The slow kinetics
of NO release that resulted from the functionalization of a 30 µM solution is quite promising for
its application into a wound dressing, allowing a continuous and slow release of the agent.
However, the maximum concentration of nitrite measured was around 70 µM, which is only
about 6% of the theoretical value of NO that is to be expected from the conversion of amines.
When a 400 µM Fmoc-PXG solution was reacted with NO, following the exact same protocol, a
lower amine functionalization was achieved, only of about 14%. That could be a consequence of
the higher peptide concentration that may possibly lead to the clustering of peptide in a way that
decreases amine availability. However, the release profile observed in this case presented a
pronounced initial burst, as can be seen in Figure 47.
NO
2-/
M
Figure 47. Cumulative nitrite release profile of a 125 µM Fmoc-PXG/NO solution quantified via Griess
reaction assay. The solution was produced from reaction of a 400 µM Fmoc-PXG solution with NO(g)
and resulted in a 14% functionalization.
Although the established methods in the literature for evaluation of NONOate incorporation in
primary amines rely on the sequential analysis of the presence of primary amine through
ninhydrin assay, followed by the quantification of nitrite anion released in solution via Griess
assays, the striking differences that were attained between samples, have led us to the
conclusion that a deeper characterization of the reaction product was of crucial importance. We
performed several spectroscopic studies, which included mass spectrometry, UV and infrared
spectroscopy, in an attempt to determine the structure of the reaction product.
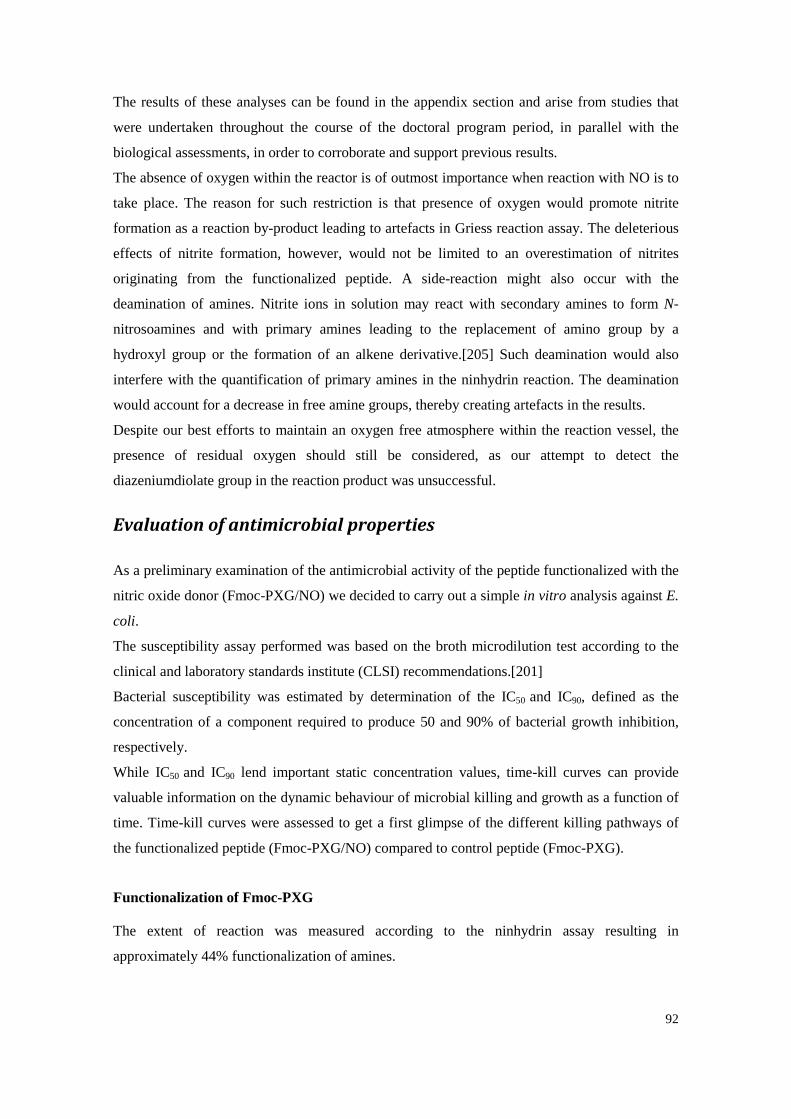
92
The results of these analyses can be found in the appendix section and arise from studies that
were undertaken throughout the course of the doctoral program period, in parallel with the
biological assessments, in order to corroborate and support previous results.
The absence of oxygen within the reactor is of outmost importance when reaction with NO is to
take place. The reason for such restriction is that presence of oxygen would promote nitrite
formation as a reaction by-product leading to artefacts in Griess reaction assay. The deleterious
effects of nitrite formation, however, would not be limited to an overestimation of nitrites
originating from the functionalized peptide. A side-reaction might also occur with the
deamination of amines. Nitrite ions in solution may react with secondary amines to form N-
nitrosoamines and with primary amines leading to the replacement of amino group by a
hydroxyl group or the formation of an alkene derivative.[205] Such deamination would also
interfere with the quantification of primary amines in the ninhydrin reaction. The deamination
would account for a decrease in free amine groups, thereby creating artefacts in the results.
Despite our best efforts to maintain an oxygen free atmosphere within the reaction vessel, the
presence of residual oxygen should still be considered, as our attempt to detect the
diazeniumdiolate group in the reaction product was unsuccessful.
Evaluation of antimicrobial properties
As a preliminary examination of the antimicrobial activity of the peptide functionalized with the
nitric oxide donor (Fmoc-PXG/NO) we decided to carry out a simple in vitro analysis against E.
coli.
The susceptibility assay performed was based on the broth microdilution test according to the
clinical and laboratory standards institute (CLSI) recommendations.[201]
Bacterial susceptibility was estimated by determination of the IC50 and IC90, defined as the
concentration of a component required to produce 50 and 90% of bacterial growth inhibition,
respectively.
While IC50 and IC90 lend important static concentration values, time-kill curves can provide
valuable information on the dynamic behaviour of microbial killing and growth as a function of
time. Time-kill curves were assessed to get a first glimpse of the different killing pathways of
the functionalized peptide (Fmoc-PXG/NO) compared to control peptide (Fmoc-PXG).
Functionalization of Fmoc-PXG
The extent of reaction was measured according to the ninhydrin assay resulting in
approximately 44% functionalization of amines.
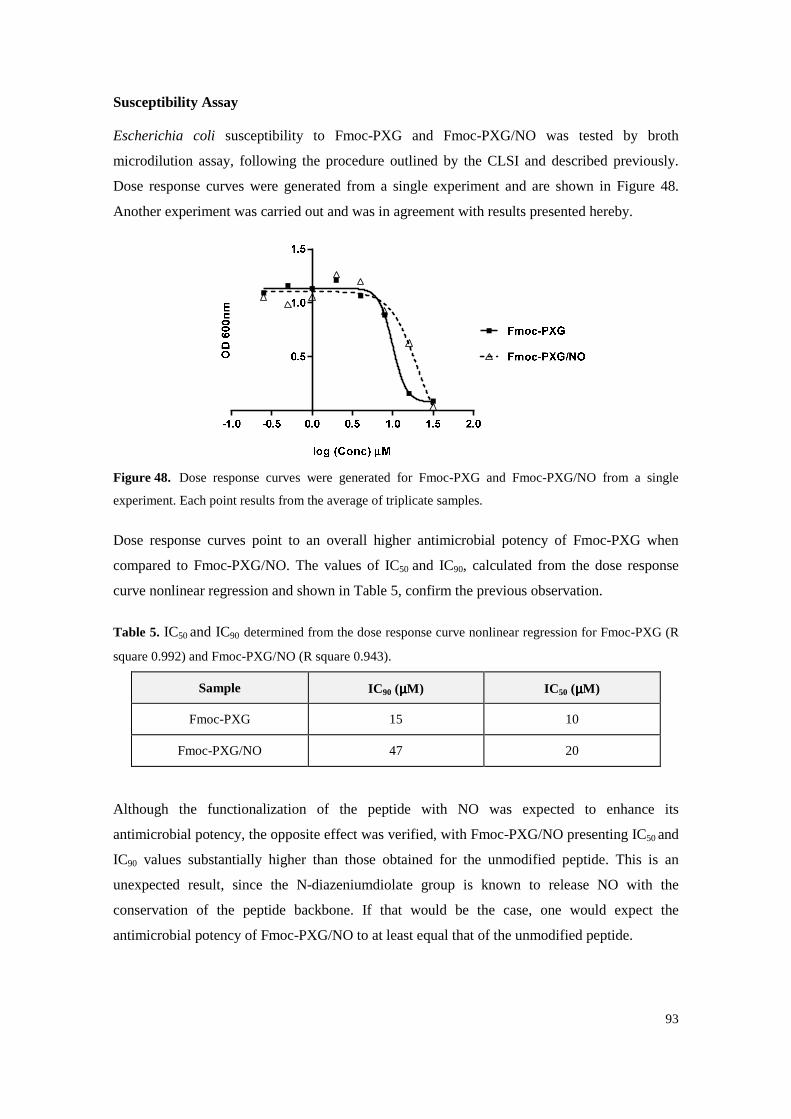
93
Susceptibility Assay
Escherichia coli susceptibility to Fmoc-PXG and Fmoc-PXG/NO was tested by broth
microdilution assay, following the procedure outlined by the CLSI and described previously.
Dose response curves were generated from a single experiment and are shown in Figure 48.
Another experiment was carried out and was in agreement with results presented hereby.
Figure 48. Dose response curves were generated for Fmoc-PXG and Fmoc-PXG/NO from a single
experiment. Each point results from the average of triplicate samples.
Dose response curves point to an overall higher antimicrobial potency of Fmoc-PXG when
compared to Fmoc-PXG/NO. The values of IC50 and IC90, calculated from the dose response
curve nonlinear regression and shown in Table 5, confirm the previous observation.
Table 5. IC50 and IC90 determined from the dose response curve nonlinear regression for Fmoc-PXG (R
square 0.992) and Fmoc-PXG/NO (R square 0.943).
Sample IC 90 (µµµµM) IC 50 (µµµµM)
Fmoc-PXG 15 10
Fmoc-PXG/NO 47 20
Although the functionalization of the peptide with NO was expected to enhance its
antimicrobial potency, the opposite effect was verified, with Fmoc-PXG/NO presenting IC50 and
IC90 values substantially higher than those obtained for the unmodified peptide. This is an
unexpected result, since the N-diazeniumdiolate group is known to release NO with the
conservation of the peptide backbone. If that would be the case, one would expect the
antimicrobial potency of Fmoc-PXG/NO to at least equal that of the unmodified peptide.
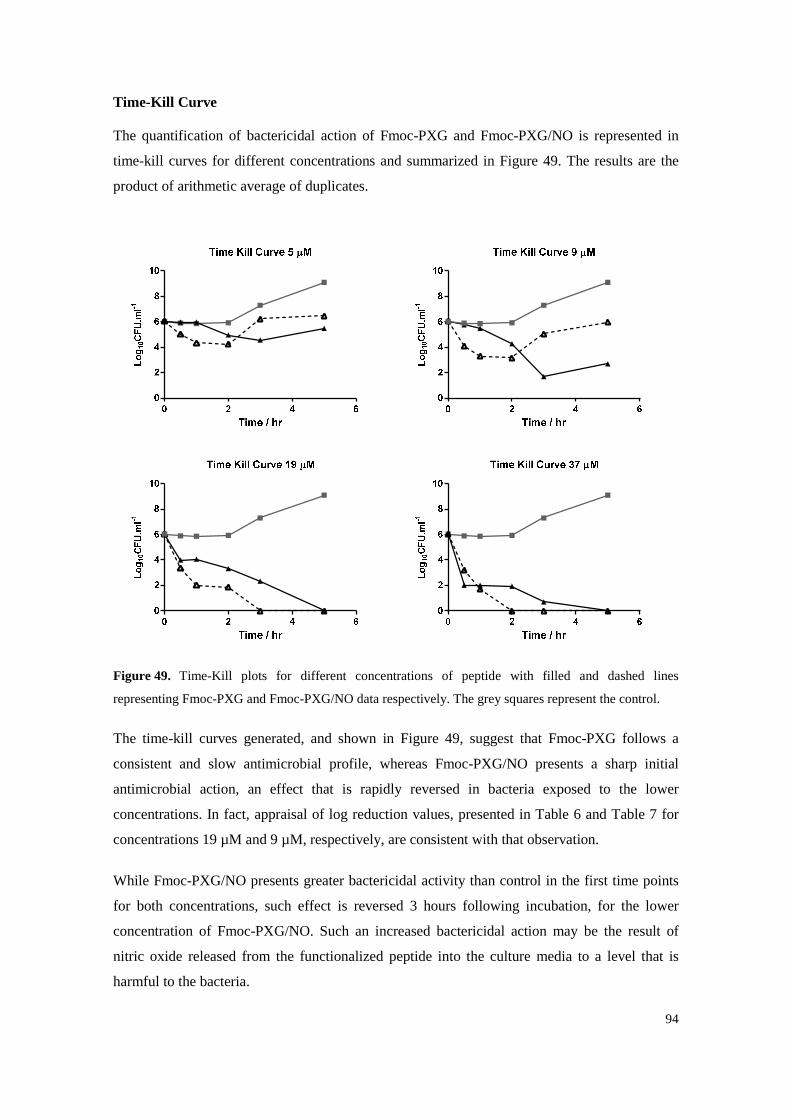
94
Time-Kill Curve
The quantification of bactericidal action of Fmoc-PXG and Fmoc-PXG/NO is represented in
time-kill curves for different concentrations and summarized in Figure 49. The results are the
product of arithmetic average of duplicates.
Figure 49. Time-Kill plots for different concentrations of peptide with filled and dashed lines
representing Fmoc-PXG and Fmoc-PXG/NO data respectively. The grey squares represent the control.
The time-kill curves generated, and shown in Figure 49, suggest that Fmoc-PXG follows a
consistent and slow antimicrobial profile, whereas Fmoc-PXG/NO presents a sharp initial
antimicrobial action, an effect that is rapidly reversed in bacteria exposed to the lower
concentrations. In fact, appraisal of log reduction values, presented in Table 6 and Table 7 for
concentrations 19 µM and 9 µM, respectively, are consistent with that observation.
While Fmoc-PXG/NO presents greater bactericidal activity than control in the first time points
for both concentrations, such effect is reversed 3 hours following incubation, for the lower
concentration of Fmoc-PXG/NO. Such an increased bactericidal action may be the result of
nitric oxide released from the functionalized peptide into the culture media to a level that is
harmful to the bacteria.
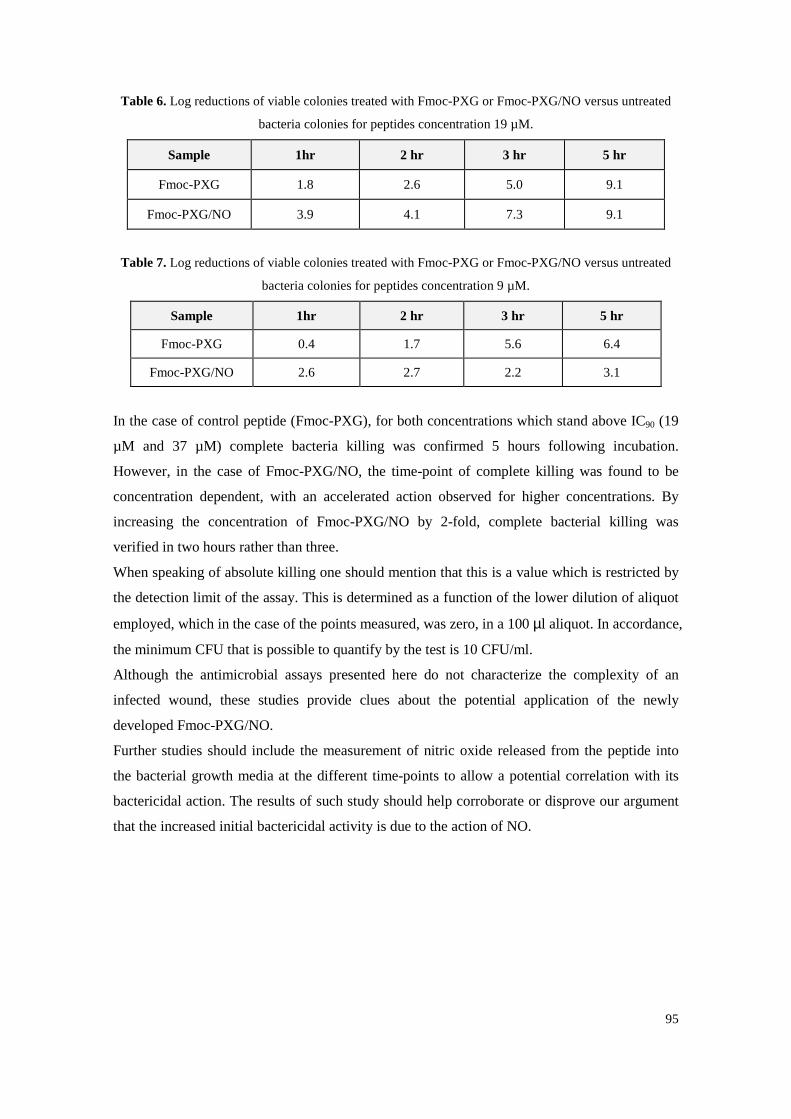
95
Table 6. Log reductions of viable colonies treated with Fmoc-PXG or Fmoc-PXG/NO versus untreated
bacteria colonies for peptides concentration 19 µM.
Sample 1hr 2 hr 3 hr 5 hr
Fmoc-PXG 1.8 2.6 5.0 9.1
Fmoc-PXG/NO 3.9 4.1 7.3 9.1
Table 7. Log reductions of viable colonies treated with Fmoc-PXG or Fmoc-PXG/NO versus untreated
bacteria colonies for peptides concentration 9 µM.
Sample 1hr 2 hr 3 hr 5 hr
Fmoc-PXG 0.4 1.7 5.6 6.4
Fmoc-PXG/NO 2.6 2.7 2.2 3.1
In the case of control peptide (Fmoc-PXG), for both concentrations which stand above IC90 (19
µM and 37 µM) complete bacteria killing was confirmed 5 hours following incubation.
However, in the case of Fmoc-PXG/NO, the time-point of complete killing was found to be
concentration dependent, with an accelerated action observed for higher concentrations. By
increasing the concentration of Fmoc-PXG/NO by 2-fold, complete bacterial killing was
verified in two hours rather than three.
When speaking of absolute killing one should mention that this is a value which is restricted by
the detection limit of the assay. This is determined as a function of the lower dilution of aliquot
employed, which in the case of the points measured, was zero, in a 100 µl aliquot. In accordance,
the minimum CFU that is possible to quantify by the test is 10 CFU/ml.
Although the antimicrobial assays presented here do not characterize the complexity of an
infected wound, these studies provide clues about the potential application of the newly
developed Fmoc-PXG/NO.
Further studies should include the measurement of nitric oxide released from the peptide into
the bacterial growth media at the different time-points to allow a potential correlation with its
bactericidal action. The results of such study should help corroborate or disprove our argument
that the increased initial bactericidal activity is due to the action of NO.
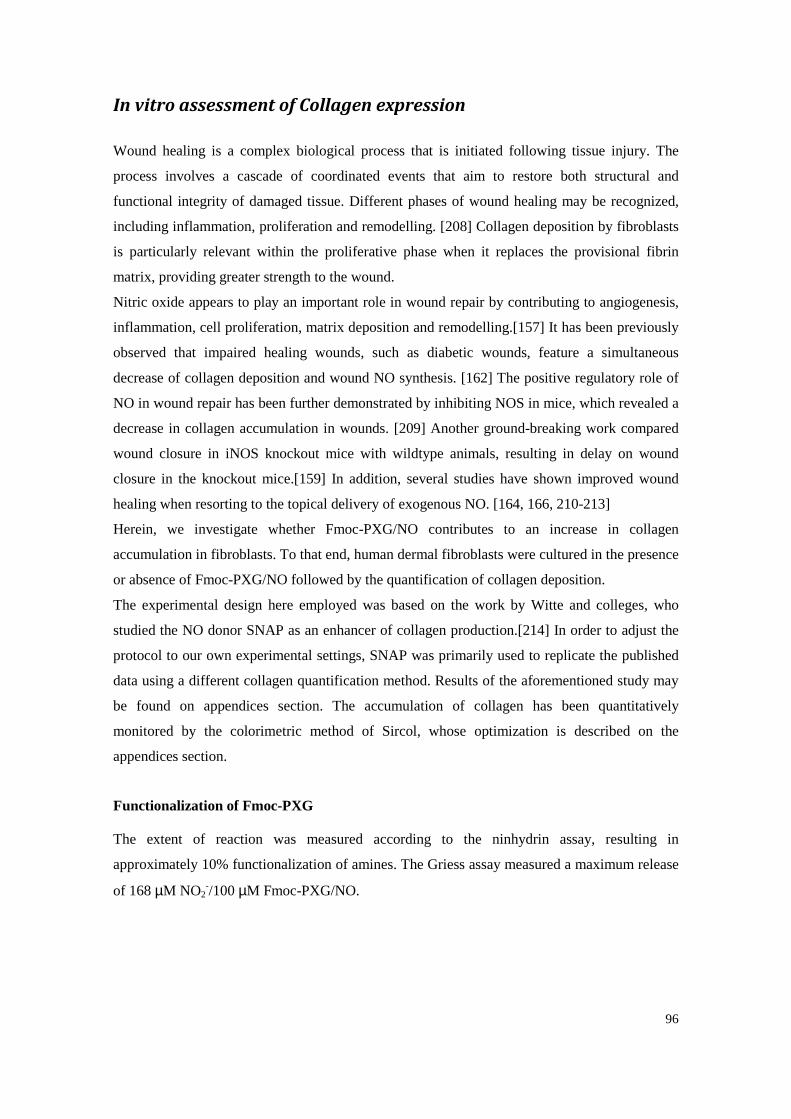
96
In vitro assessment of Collagen expression
Wound healing is a complex biological process that is initiated following tissue injury. The
process involves a cascade of coordinated events that aim to restore both structural and
functional integrity of damaged tissue. Different phases of wound healing may be recognized,
including inflammation, proliferation and remodelling. [208] Collagen deposition by fibroblasts
is particularly relevant within the proliferative phase when it replaces the provisional fibrin
matrix, providing greater strength to the wound.
Nitric oxide appears to play an important role in wound repair by contributing to angiogenesis,
inflammation, cell proliferation, matrix deposition and remodelling.[157] It has been previously
observed that impaired healing wounds, such as diabetic wounds, feature a simultaneous
decrease of collagen deposition and wound NO synthesis. [162] The positive regulatory role of
NO in wound repair has been further demonstrated by inhibiting NOS in mice, which revealed a
decrease in collagen accumulation in wounds. [209] Another ground-breaking work compared
wound closure in iNOS knockout mice with wildtype animals, resulting in delay on wound
closure in the knockout mice.[159] In addition, several studies have shown improved wound
healing when resorting to the topical delivery of exogenous NO. [164, 166, 210-213]
Herein, we investigate whether Fmoc-PXG/NO contributes to an increase in collagen
accumulation in fibroblasts. To that end, human dermal fibroblasts were cultured in the presence
or absence of Fmoc-PXG/NO followed by the quantification of collagen deposition.
The experimental design here employed was based on the work by Witte and colleges, who
studied the NO donor SNAP as an enhancer of collagen production.[214] In order to adjust the
protocol to our own experimental settings, SNAP was primarily used to replicate the published
data using a different collagen quantification method. Results of the aforementioned study may
be found on appendices section. The accumulation of collagen has been quantitatively
monitored by the colorimetric method of Sircol, whose optimization is described on the
appendices section.
Functionalization of Fmoc-PXG
The extent of reaction was measured according to the ninhydrin assay, resulting in
approximately 10% functionalization of amines. The Griess assay measured a maximum release
of 168 µM NO2-/100 µM Fmoc-PXG/NO.
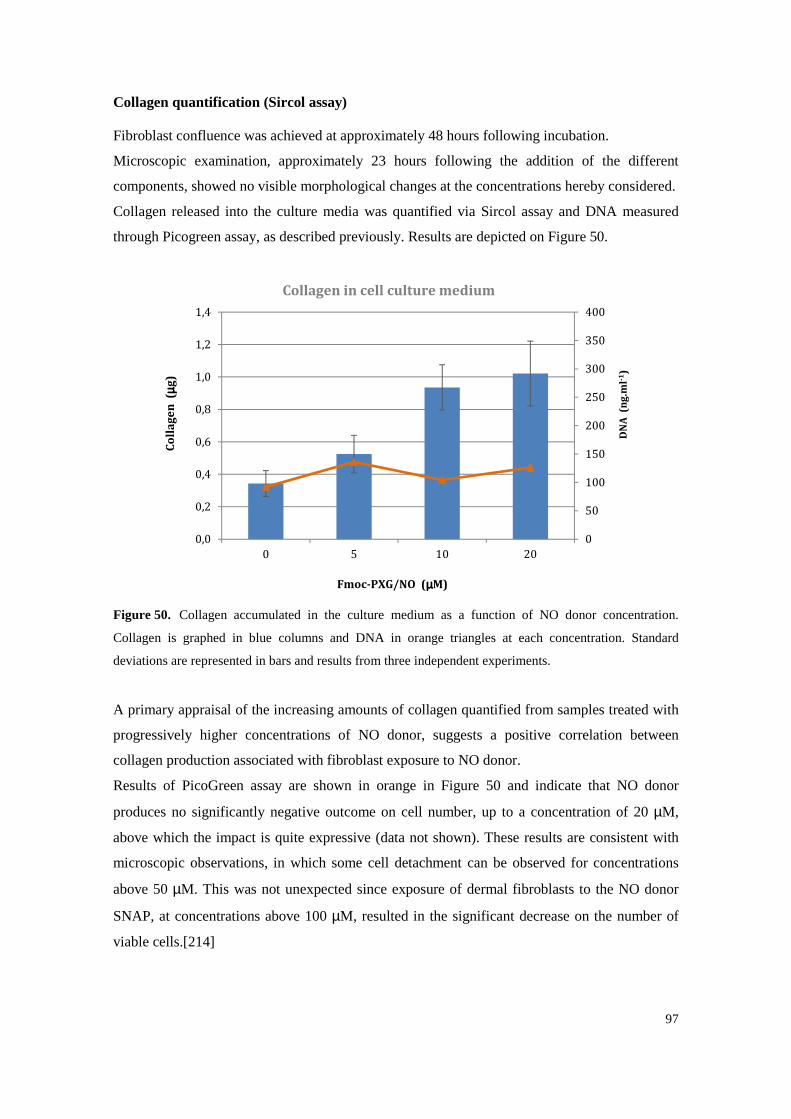
97
Collagen quantification (Sircol assay)
Fibroblast confluence was achieved at approximately 48 hours following incubation.
Microscopic examination, approximately 23 hours following the addition of the different
components, showed no visible morphological changes at the concentrations hereby considered.
Collagen released into the culture media was quantified via Sircol assay and DNA measured
through Picogreen assay, as described previously. Results are depicted on Figure 50.
Figure 50. Collagen accumulated in the culture medium as a function of NO donor concentration.
Collagen is graphed in blue columns and DNA in orange triangles at each concentration. Standard
deviations are represented in bars and results from three independent experiments.
A primary appraisal of the increasing amounts of collagen quantified from samples treated with
progressively higher concentrations of NO donor, suggests a positive correlation between
collagen production associated with fibroblast exposure to NO donor.
Results of PicoGreen assay are shown in orange in Figure 50 and indicate that NO donor
produces no significantly negative outcome on cell number, up to a concentration of 20 µM,
above which the impact is quite expressive (data not shown). These results are consistent with
microscopic observations, in which some cell detachment can be observed for concentrations
above 50 µM. This was not unexpected since exposure of dermal fibroblasts to the NO donor
SNAP, at concentrations above 100 µM, resulted in the significant decrease on the number of
viable cells.[214]
0
50
100
150
200
250
300
350
400
0,0
0,2
0,4
0,6
0,8
1,0
1,2
1,4
0 5 10 20
DN
A (
ng.
ml-1
)
Co
llag
en (
µµ µµg)
Fmoc-PXG/NO (µµµµM)
Collagen in cell culture medium
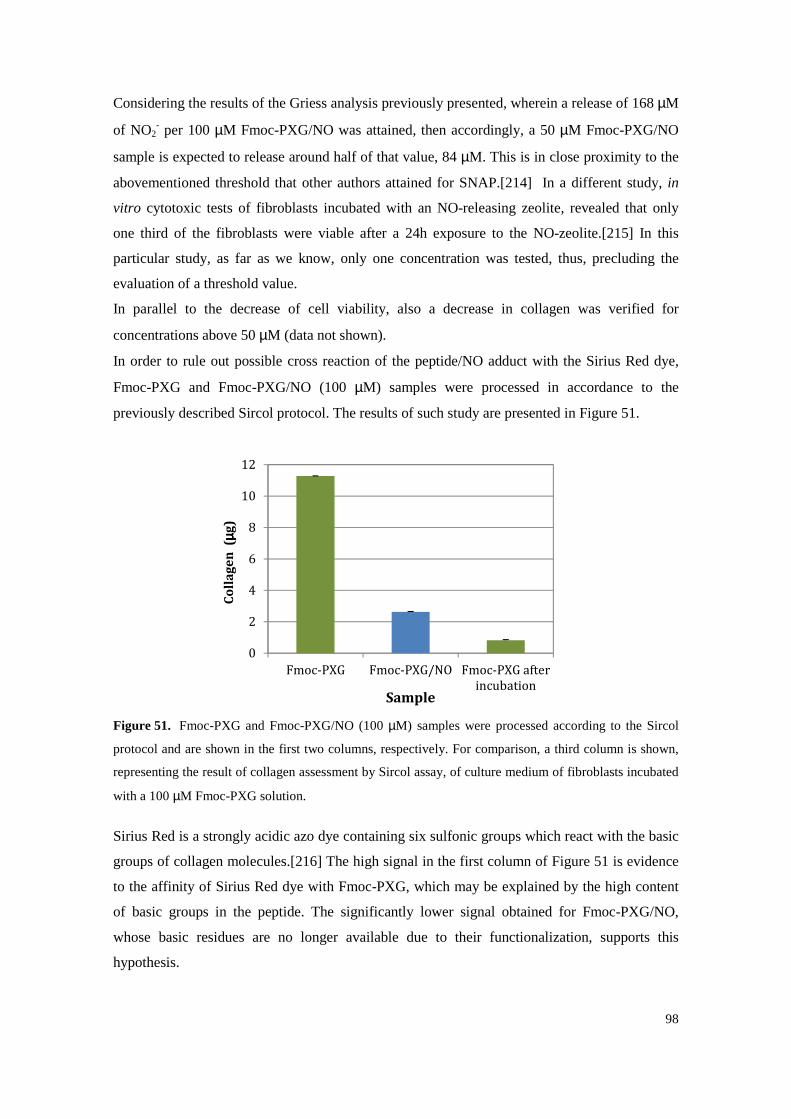
98
Considering the results of the Griess analysis previously presented, wherein a release of 168 µM
of NO2- per 100 µM Fmoc-PXG/NO was attained, then accordingly, a 50 µM Fmoc-PXG/NO
sample is expected to release around half of that value, 84 µM. This is in close proximity to the
abovementioned threshold that other authors attained for SNAP.[214] In a different study, in
vitro cytotoxic tests of fibroblasts incubated with an NO-releasing zeolite, revealed that only
one third of the fibroblasts were viable after a 24h exposure to the NO-zeolite.[215] In this
particular study, as far as we know, only one concentration was tested, thus, precluding the
evaluation of a threshold value.
In parallel to the decrease of cell viability, also a decrease in collagen was verified for
concentrations above 50 µM (data not shown).
In order to rule out possible cross reaction of the peptide/NO adduct with the Sirius Red dye,
Fmoc-PXG and Fmoc-PXG/NO (100 µM) samples were processed in accordance to the
previously described Sircol protocol. The results of such study are presented in Figure 51.
Figure 51. Fmoc-PXG and Fmoc-PXG/NO (100 µM) samples were processed according to the Sircol
protocol and are shown in the first two columns, respectively. For comparison, a third column is shown,
representing the result of collagen assessment by Sircol assay, of culture medium of fibroblasts incubated
with a 100 µM Fmoc-PXG solution.
Sirius Red is a strongly acidic azo dye containing six sulfonic groups which react with the basic
groups of collagen molecules.[216] The high signal in the first column of Figure 51 is evidence
to the affinity of Sirius Red dye with Fmoc-PXG, which may be explained by the high content
of basic groups in the peptide. The significantly lower signal obtained for Fmoc-PXG/NO,
whose basic residues are no longer available due to their functionalization, supports this
hypothesis.
0
2
4
6
8
10
12
Fmoc-PXG Fmoc-PXG/NO Fmoc-PXG after
incubation
Co
llag
en (
µµ µµg)
Sample
99
However, employing the same procedure for measuring collagen present in the culture medium
of fibroblasts upon incubation with Fmoc-PXG (100 µM) for approximately 23 h, results in a
drop in signal of about 14 times, when compared to control, as shown in the last column of
Figure 51. Moreover, when examining the values of collagen present in the culture medium of
fibroblasts incubated with different concentrations of Fmoc-PXG (10, 50 and 100 µM), no
concentration dependence is observed, as presented in Figure 52.
Figure 52. Collagen assessed by Sirius Red reaction. The left column represents the assessment of
Collagen of a sample of 100 µM Fmoc-PXG whereas C10, C50 and C100 are the result of collagen
quantification from culture medium samples of fibroblasts incubated with 10, 50 and 100 µM of Fmoc-
PXG, respectively.
Peptide hydrolysis or its uptake by cells may have direct implication on the significantly
different results in the signals before and after its incubation with fibroblasts. Given the abrupt
reduction in the signal and the lack of concentration dependency, it is reasonable to assume that
the chromogenic precipitation reaction of Sirius Red in incubated samples is mostly a result of
collagen production and not peptide interference.
Fmoc-PXG/NO, in turn, has a much lower affinity with the Sirius red dye, as shown in the
second column of Figure 51, possibly a result of its amino group functionalization, just as
previously mentioned. Supposing that for the same incubation period, a similar maximum
theoretical ratio of degradation or cell uptake is achieved, the interference resulting from the
functionalized peptide would be of the same order of magnitude as the standard deviation (± 0.2
µg), whence, its interference may be considered negligible. This hypothesis should, nonetheless,
be corroborated by employing other collagen quantification methods as well as by determining
degradation of the peptide within the timeframe of incubation period.
0
2
4
6
8
10
12
Fmoc-PXG C10 C50 C100
Co
llag
en (
µµ µµg)
Sample
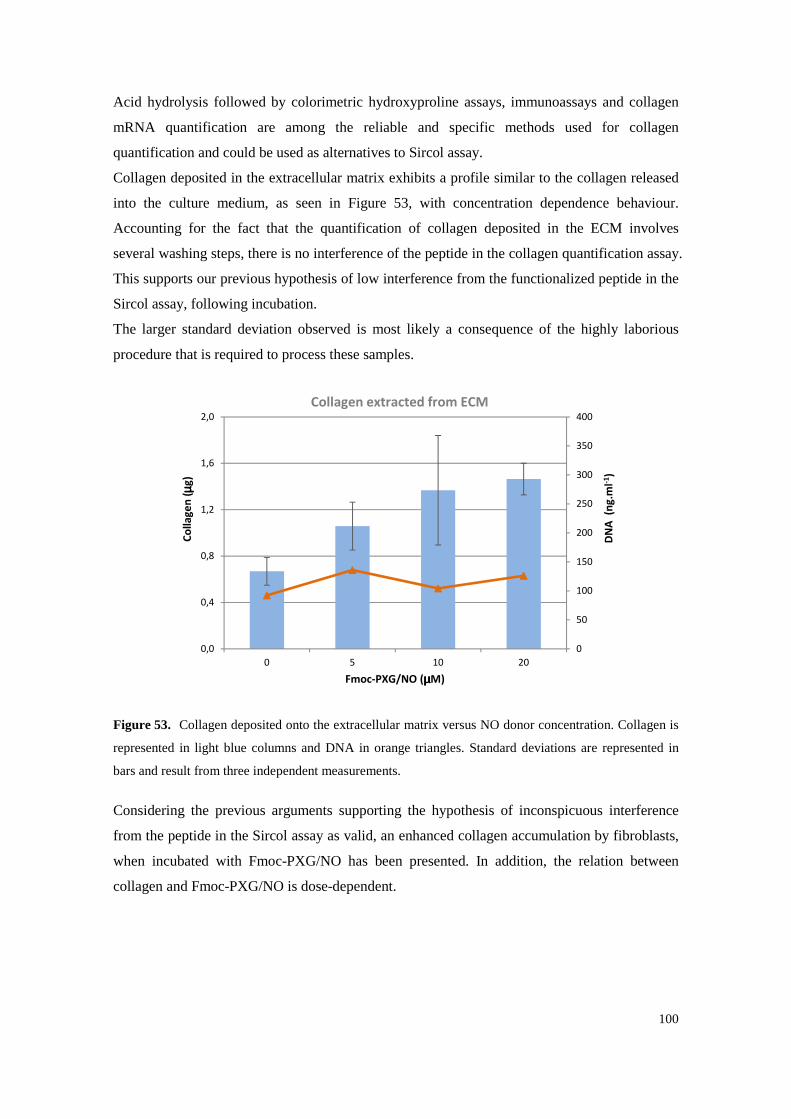
100
Acid hydrolysis followed by colorimetric hydroxyproline assays, immunoassays and collagen
mRNA quantification are among the reliable and specific methods used for collagen
quantification and could be used as alternatives to Sircol assay.
Collagen deposited in the extracellular matrix exhibits a profile similar to the collagen released
into the culture medium, as seen in Figure 53, with concentration dependence behaviour.
Accounting for the fact that the quantification of collagen deposited in the ECM involves
several washing steps, there is no interference of the peptide in the collagen quantification assay.
This supports our previous hypothesis of low interference from the functionalized peptide in the
Sircol assay, following incubation.
The larger standard deviation observed is most likely a consequence of the highly laborious
procedure that is required to process these samples.
Figure 53. Collagen deposited onto the extracellular matrix versus NO donor concentration. Collagen is
represented in light blue columns and DNA in orange triangles. Standard deviations are represented in
bars and result from three independent measurements.
Considering the previous arguments supporting the hypothesis of inconspicuous interference
from the peptide in the Sircol assay as valid, an enhanced collagen accumulation by fibroblasts,
when incubated with Fmoc-PXG/NO has been presented. In addition, the relation between
collagen and Fmoc-PXG/NO is dose-dependent.
0
50
100
150
200
250
300
350
400
0,0
0,4
0,8
1,2
1,6
2,0
0 5 10 20
DN
A
(ng
.ml-1
)
Co
lla
ge
n (
µµ µµg)
Fmoc-PXG/NO (µµµµM)
Collagen extracted from ECM
101
The regulatory role of NO on wound healing has been previously shown, either by
pharmacological inhibition or gene deletion of NOS, which leads to impaired healing, or by
improving wound repair via exogenous NO topical delivery.
Several roles have been ascribed to NO in the wound healing mechanism, such as vasodilation,
inflammation, angiogenesis through the increase expression of vascular endothelium growth
factor [217] as well as enhancing collagen production. However, this is a highly concentration-
dependent mechanism, where both low levels as well as too high levels of NO present
detrimental effects on wound repair, and on collagen deposition in particular. Recently, a study
has shown that high levels of NO within the wound environment reduce wound collagen
deposition, which is restored upon inhibition of NO generation. [218, 219]
We have shown that the product of reaction of Fmoc-PXG with NO, produces a positive effect
on collagen accumulation. However, to allow translation of NO releasing materials into clinical
practice, the unification of studies with normalization of NO concentrations is imperative.
Different measurement techniques produce distinct results which compromises the final
application of these materials. This is particularly relevant when the active molecule displays
antagonist biological responses as a function of concentration. Determination of thresholds for
each of the desired function is crucial to allow incorporation of NO donor molecules into
biomaterials.
102
Conclusions
This study has describes the production of an antimicrobial hydrogel formed by self-assembly
of the peptide pexiganan bonded at the N-terminal to the Fmoc group, triggered by a pH shift.
The peptide, which was subsequently reacted with gaseous NO to allow the incorporation of an
NO donor moiety (NONOate), proved to release NO in aqueous conditions.
Susceptibility assays revealed an overall decrease in antimicrobial activity of Fmoc-PXG/NO,
when compared to Fmoc-PXG. However, time kill-curves pointed to an initial increased
bactericidal activity of the functionalized peptide, which was reversed with time. We believe
that this effect may be a direct consequence of the release of NO, which is known to act as an
antimicrobial agent. Optimization of reaction conditions may allow the increase of the level of
functionalization of the peptide, which can further raise the antimicrobial potential of Fmoc-
PXG/NO. However, further studies are needed to confirm the correlation between the released
NO and the observed bactericidal action.
Collagen production by human dermal fibroblasts when incubated with Fmoc-PXG/NO was
quantified, showing a dose-dependent increase in the presence of NO donor within a range of 0
to 20 µM.
Although additional experiments are still required to achieve the final goal of obtaining a
hydrogel with optimized antimicrobial activity and wound healing properties, this work already
constituted an essential step towards that end.

103
CHAPTER IV
GENERAL CONCLUSIONS AND
FUTURE PERSPECTIVES

104
105
The present PhD thesis explored peptide-based self-assembled materials while recognizing
some of its potential applications.
Some dipeptides crystals, particularly those composed of amino acids with hydrophobic
residues, were found to result in an unusual crystal packing arrangement, forming
nanotubes.[24] The unidimensional channels within these crystals are quite heterogeneous in
size, with different dipeptides forming channels of different widths and inner surfaces that may
be hydrophobic or hydrophilic. These dipeptide crystals have great potential for a number of
applications, comprising those which are typical for the class of microporous materials, such as
gas storage, separation and catalysis. Notably, several dipeptides belonging to the VA class,
have been shown to present high CO2/CH4 and Ar/O2 adsorption selectivities.[31, 32] Although
they now represent a class of highly attractive, environmentally friendly, microporous materials,
its application is not limited to gas separation processes. In fact, their voids have been shown to
function as reaction vessels for polymerization reactions.[220]
Detailed studies of diffusion in these one dimensional channels may allow an optimization of its
potential applications. Leucyl-Serine (LS) crystals, which possess a remarkable crystal packing,
with hexagonal symmetry forming a 5.2 Å van der Waals diameter channel, are unique
platforms to experimentally determine diffusivities in one dimensional channels. We have
determined transport diffusivities of CO2, CH4, N2, O2, and Ar in LS channels and studied the
influence of several parameters, such as crystal length, temperature, pore loading and molecular
size of guest molecules. We showed that the mass transport in LS crystals is fast, with
diffusivity values standing within the upper limit of zeolites. This could be a result of the low
tortuosity in the channels, when compared to the complex matrix of voids within zeolites, as
well as a consequence of the uniform chemical environment within the inner surface of the
tubes, which are lined with leucine residues. Interestingly, no correlation between the size of
guest molecules and diffusivities was found. As previously mentioned, dipeptide crystals
belonging to the VA class have been reported to possess greater affinity to certain molecules,
quantified by its adsorption selectivity. These results suggest that the interactions between host-
guest within the channels might play a role in diffusion mechanisms in nanotubes. Therefore,
rather than simply functioning as a molecular sieve, the dipeptide crystal appear to able to
distinguish between similarly sized guest species due to the interactions that occur between
them. We found that there was some propensity for obstruction to permeation with Ar and CH4,
which we attributed to a pore blockage effect. Possible sources of pore blockages may include
defects to the crystal framework, presence of amorphous materials or other species.
The original work that we executed enabled the acquisition of quantitative values that provide a
good contribution to the field of porous organic materials.
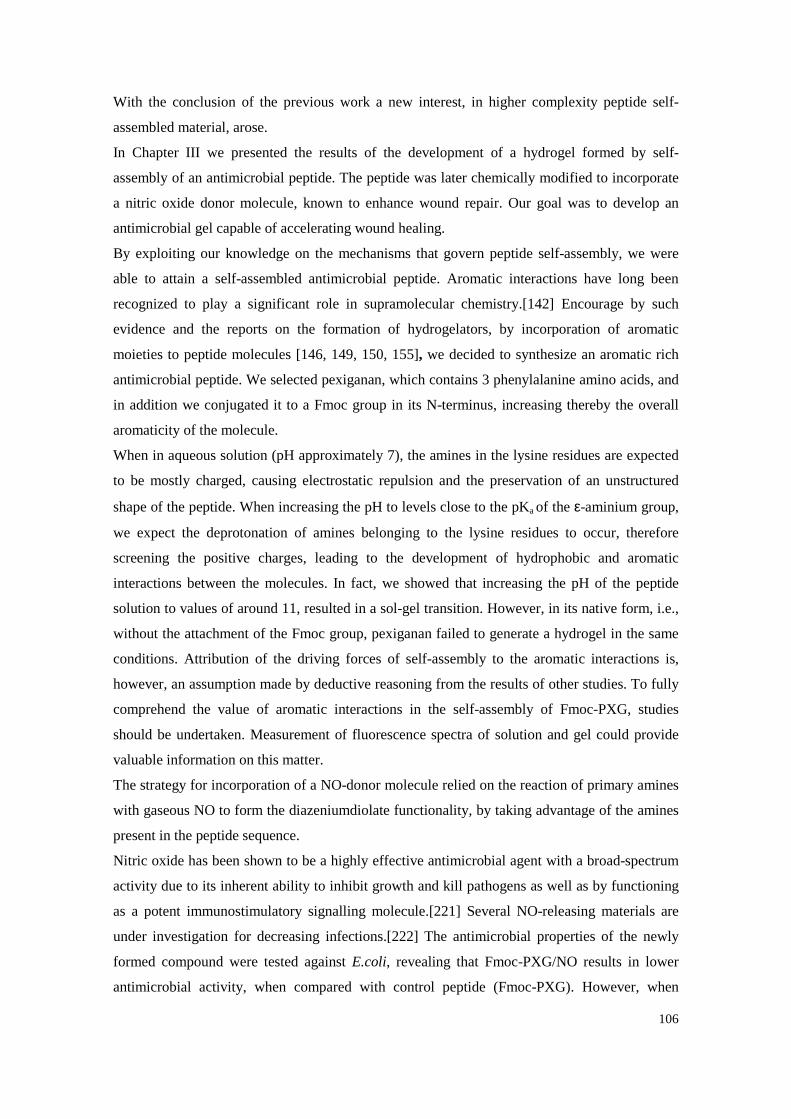
106
With the conclusion of the previous work a new interest, in higher complexity peptide self-
assembled material, arose.
In Chapter III we presented the results of the development of a hydrogel formed by self-
assembly of an antimicrobial peptide. The peptide was later chemically modified to incorporate
a nitric oxide donor molecule, known to enhance wound repair. Our goal was to develop an
antimicrobial gel capable of accelerating wound healing.
By exploiting our knowledge on the mechanisms that govern peptide self-assembly, we were
able to attain a self-assembled antimicrobial peptide. Aromatic interactions have long been
recognized to play a significant role in supramolecular chemistry.[142] Encourage by such
evidence and the reports on the formation of hydrogelators, by incorporation of aromatic
moieties to peptide molecules [146, 149, 150, 155], we decided to synthesize an aromatic rich
antimicrobial peptide. We selected pexiganan, which contains 3 phenylalanine amino acids, and
in addition we conjugated it to a Fmoc group in its N-terminus, increasing thereby the overall
aromaticity of the molecule.
When in aqueous solution (pH approximately 7), the amines in the lysine residues are expected
to be mostly charged, causing electrostatic repulsion and the preservation of an unstructured
shape of the peptide. When increasing the pH to levels close to the pKa of the ε-aminium group,
we expect the deprotonation of amines belonging to the lysine residues to occur, therefore
screening the positive charges, leading to the development of hydrophobic and aromatic
interactions between the molecules. In fact, we showed that increasing the pH of the peptide
solution to values of around 11, resulted in a sol-gel transition. However, in its native form, i.e.,
without the attachment of the Fmoc group, pexiganan failed to generate a hydrogel in the same
conditions. Attribution of the driving forces of self-assembly to the aromatic interactions is,
however, an assumption made by deductive reasoning from the results of other studies. To fully
comprehend the value of aromatic interactions in the self-assembly of Fmoc-PXG, studies
should be undertaken. Measurement of fluorescence spectra of solution and gel could provide
valuable information on this matter.
The strategy for incorporation of a NO-donor molecule relied on the reaction of primary amines
with gaseous NO to form the diazeniumdiolate functionality, by taking advantage of the amines
present in the peptide sequence.
Nitric oxide has been shown to be a highly effective antimicrobial agent with a broad-spectrum
activity due to its inherent ability to inhibit growth and kill pathogens as well as by functioning
as a potent immunostimulatory signalling molecule.[221] Several NO-releasing materials are
under investigation for decreasing infections.[222] The antimicrobial properties of the newly
formed compound were tested against E.coli, revealing that Fmoc-PXG/NO results in lower
antimicrobial activity, when compared with control peptide (Fmoc-PXG). However, when
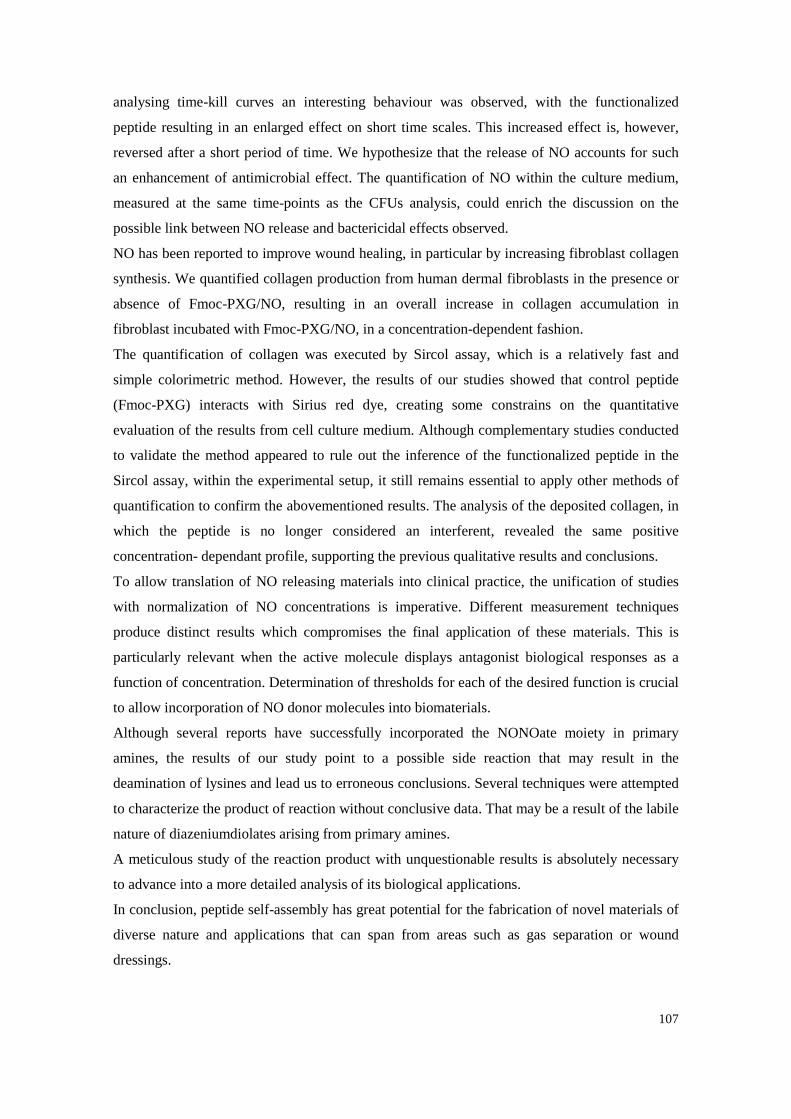
107
analysing time-kill curves an interesting behaviour was observed, with the functionalized
peptide resulting in an enlarged effect on short time scales. This increased effect is, however,
reversed after a short period of time. We hypothesize that the release of NO accounts for such
an enhancement of antimicrobial effect. The quantification of NO within the culture medium,
measured at the same time-points as the CFUs analysis, could enrich the discussion on the
possible link between NO release and bactericidal effects observed.
NO has been reported to improve wound healing, in particular by increasing fibroblast collagen
synthesis. We quantified collagen production from human dermal fibroblasts in the presence or
absence of Fmoc-PXG/NO, resulting in an overall increase in collagen accumulation in
fibroblast incubated with Fmoc-PXG/NO, in a concentration-dependent fashion.
The quantification of collagen was executed by Sircol assay, which is a relatively fast and
simple colorimetric method. However, the results of our studies showed that control peptide
(Fmoc-PXG) interacts with Sirius red dye, creating some constrains on the quantitative
evaluation of the results from cell culture medium. Although complementary studies conducted
to validate the method appeared to rule out the inference of the functionalized peptide in the
Sircol assay, within the experimental setup, it still remains essential to apply other methods of
quantification to confirm the abovementioned results. The analysis of the deposited collagen, in
which the peptide is no longer considered an interferent, revealed the same positive
concentration- dependant profile, supporting the previous qualitative results and conclusions.
To allow translation of NO releasing materials into clinical practice, the unification of studies
with normalization of NO concentrations is imperative. Different measurement techniques
produce distinct results which compromises the final application of these materials. This is
particularly relevant when the active molecule displays antagonist biological responses as a
function of concentration. Determination of thresholds for each of the desired function is crucial
to allow incorporation of NO donor molecules into biomaterials.
Although several reports have successfully incorporated the NONOate moiety in primary
amines, the results of our study point to a possible side reaction that may result in the
deamination of lysines and lead us to erroneous conclusions. Several techniques were attempted
to characterize the product of reaction without conclusive data. That may be a result of the labile
nature of diazeniumdiolates arising from primary amines.
A meticulous study of the reaction product with unquestionable results is absolutely necessary
to advance into a more detailed analysis of its biological applications.
In conclusion, peptide self-assembly has great potential for the fabrication of novel materials of
diverse nature and applications that can span from areas such as gas separation or wound
dressings.

108
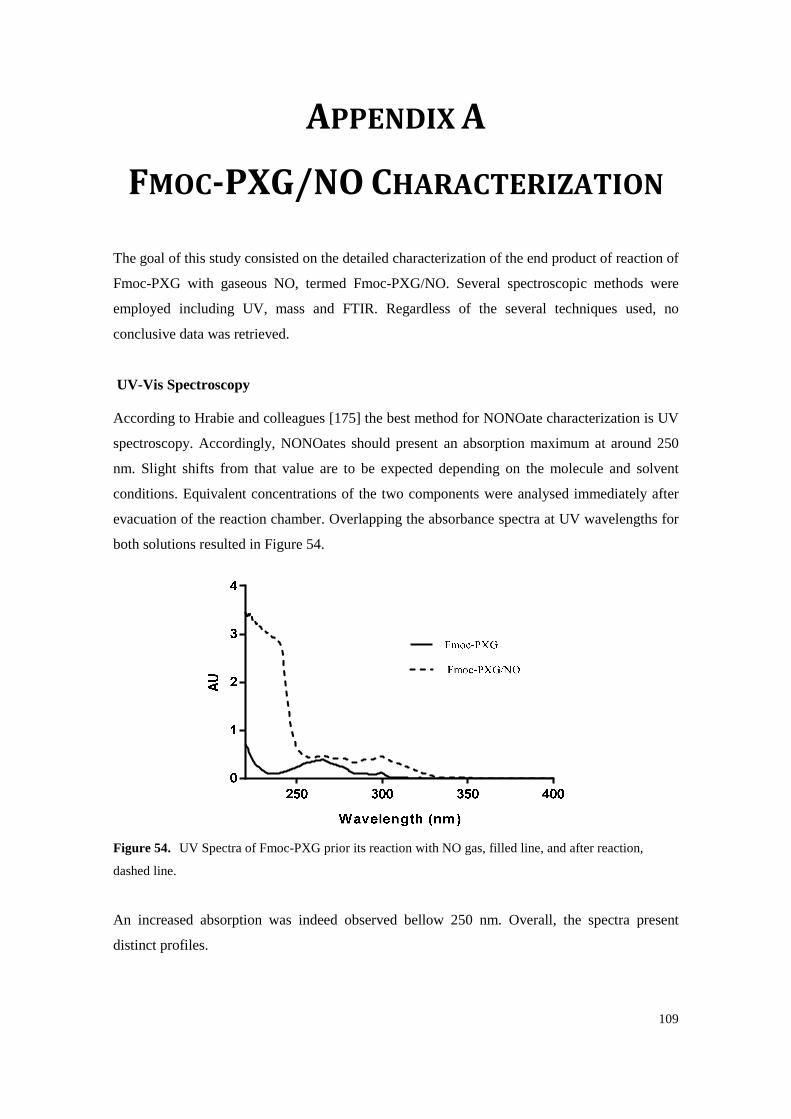
109
APPENDIX A
FMOC-PXG/NO CHARACTERIZATION
The goal of this study consisted on the detailed characterization of the end product of reaction of
Fmoc-PXG with gaseous NO, termed Fmoc-PXG/NO. Several spectroscopic methods were
employed including UV, mass and FTIR. Regardless of the several techniques used, no
conclusive data was retrieved.
UV-Vis Spectroscopy
According to Hrabie and colleagues [175] the best method for NONOate characterization is UV
spectroscopy. Accordingly, NONOates should present an absorption maximum at around 250
nm. Slight shifts from that value are to be expected depending on the molecule and solvent
conditions. Equivalent concentrations of the two components were analysed immediately after
evacuation of the reaction chamber. Overlapping the absorbance spectra at UV wavelengths for
both solutions resulted in Figure 54.
Figure 54. UV Spectra of Fmoc-PXG prior its reaction with NO gas, filled line, and after reaction,
dashed line.
An increased absorption was indeed observed bellow 250 nm. Overall, the spectra present
distinct profiles.
110
Mass Spectrometry
Peptide solution alongside the reaction product with NO were analysed by electrospray
ionisation mass spectrometry (ESI-MS) and matrix-assisted laser desorption/ionization time-of-
flight mass spectrometry (MALDI-TOF MS).
Mass spectra for both Fmoc-PXG and Fmoc-PXG/NO, obtained by electrospray ionization are
shown in Figure 55 and Figure 56, respectively.
Figure 55. Mass spectrum of Fmoc-PXG, prior to its reaction with NO gas, obtained by electrospray
ionization (positive mode), in a quadrupole ion trap mass spectrometer. It confirms the molecular mass
expected for Fmoc-PXG, detected as di- (P/2), tri- (P/3), tetra- (P/4), penta- (P/5) and hexaprotonated
(P/6) cationic adducts of the target peptide.
Figure 56. Mass spectrum of Fmoc-PXG following reaction with NO gas, abbreviated as Fmoc-
PXG/NO. Mass spectrum was obtained by electrospray ionization (positive mode), in a quadrupole ion
trap mass spectrometer.
PGFmoc-PXG #544-638 RT: 13,72-16,00 AV: 95 NL: 3,10E6T: + p ESI Full ms [ 250,00-2000,00]
500 1000 1500 2000m/z
0
200000
400000
600000
800000
1000000
1200000
1400000
1600000
1800000
2000000
2200000
2400000
2600000
2800000
3000000
Intens
ity
675,87
541,00
900,60
451,13
1350,13
912,13718,20938,00 1113,20392,07 1444,00 1581,20 1941,20
PG-Fmoc-PXG-NO #543-581 RT: 13,85-14,77 AV: 39 NL: 3,08E6T: + p ESI Full ms [ 250,00-2000,00]
500 1000 1500 2000m/z
0
200000
400000
600000
800000
1000000
1200000
1400000
1600000
1800000
2000000
2200000
2400000
2600000
2800000
3000000
Intens
ity
676,00
900,67
541,00
451,13
1350,13
974,07700,60 1724,67
1385,271154,33392,001614,27 1820,13
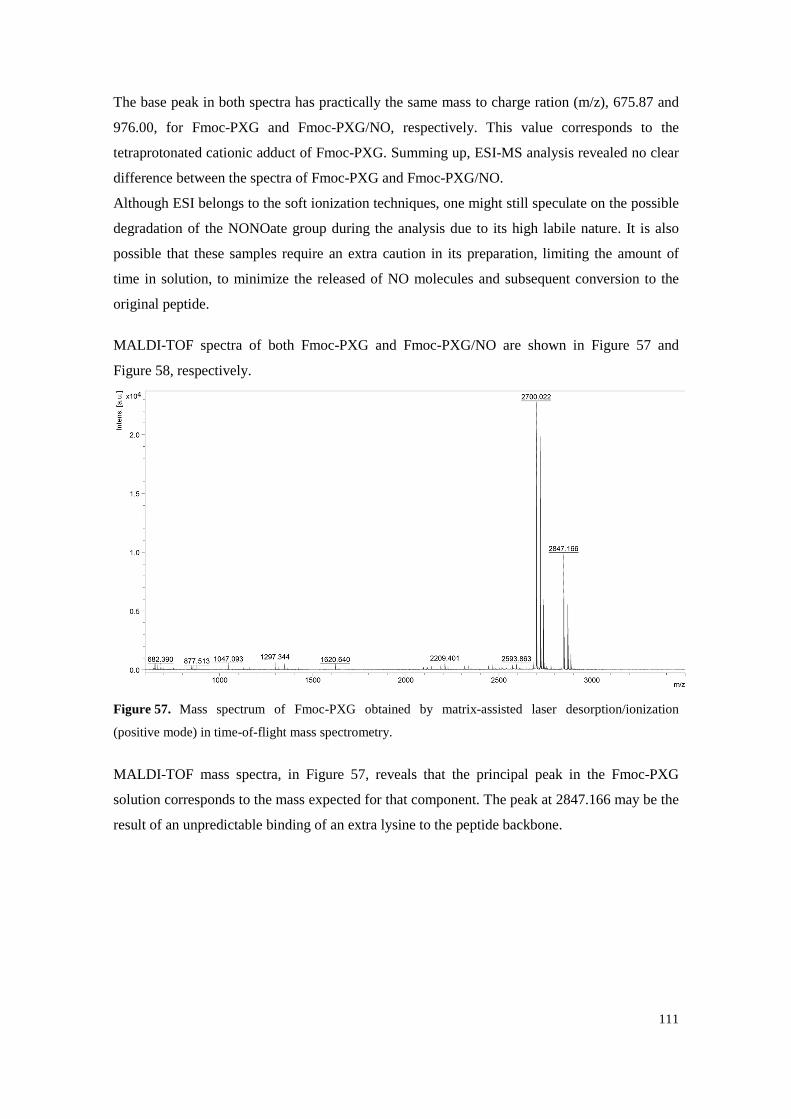
111
The base peak in both spectra has practically the same mass to charge ration (m/z), 675.87 and
976.00, for Fmoc-PXG and Fmoc-PXG/NO, respectively. This value corresponds to the
tetraprotonated cationic adduct of Fmoc-PXG. Summing up, ESI-MS analysis revealed no clear
difference between the spectra of Fmoc-PXG and Fmoc-PXG/NO.
Although ESI belongs to the soft ionization techniques, one might still speculate on the possible
degradation of the NONOate group during the analysis due to its high labile nature. It is also
possible that these samples require an extra caution in its preparation, limiting the amount of
time in solution, to minimize the released of NO molecules and subsequent conversion to the
original peptide.
MALDI-TOF spectra of both Fmoc-PXG and Fmoc-PXG/NO are shown in Figure 57 and
Figure 58, respectively.
Figure 57. Mass spectrum of Fmoc-PXG obtained by matrix-assisted laser desorption/ionization
(positive mode) in time-of-flight mass spectrometry.
MALDI-TOF mass spectra, in Figure 57, reveals that the principal peak in the Fmoc-PXG
solution corresponds to the mass expected for that component. The peak at 2847.166 may be the
result of an unpredictable binding of an extra lysine to the peptide backbone.
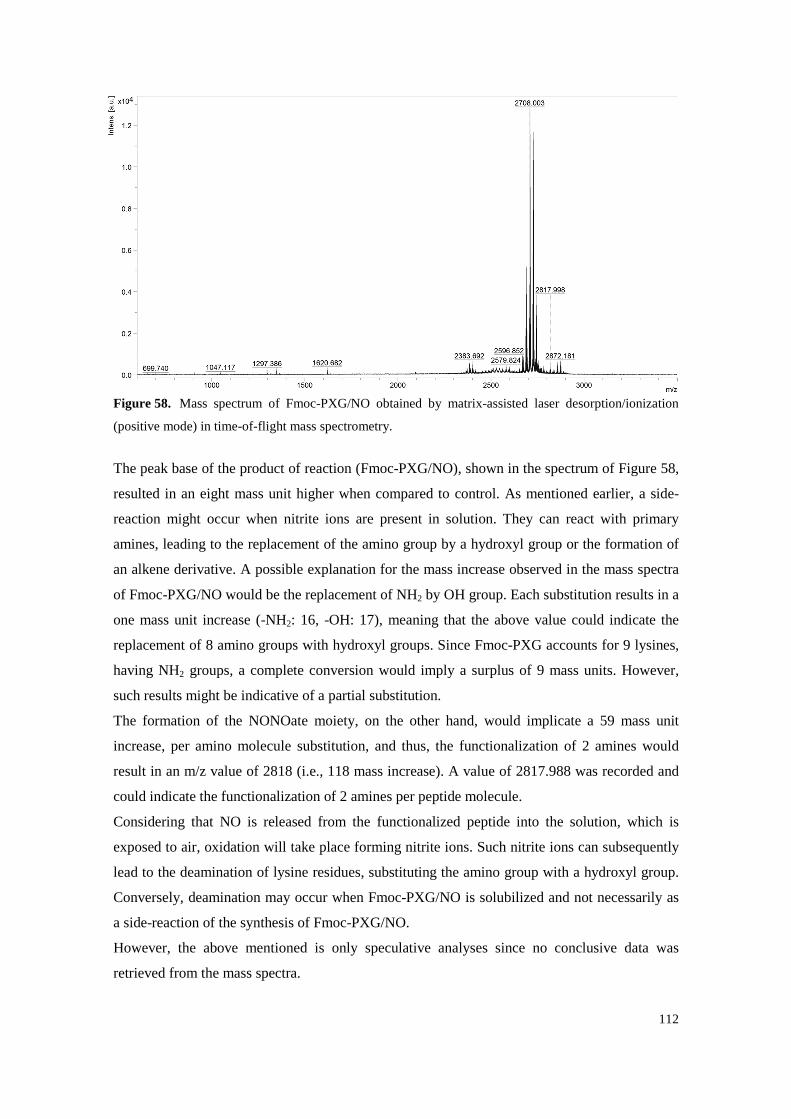
112
Figure 58. Mass spectrum of Fmoc-PXG/NO obtained by matrix-assisted laser desorption/ionization
(positive mode) in time-of-flight mass spectrometry.
The peak base of the product of reaction (Fmoc-PXG/NO), shown in the spectrum of Figure 58,
resulted in an eight mass unit higher when compared to control. As mentioned earlier, a side-
reaction might occur when nitrite ions are present in solution. They can react with primary
amines, leading to the replacement of the amino group by a hydroxyl group or the formation of
an alkene derivative. A possible explanation for the mass increase observed in the mass spectra
of Fmoc-PXG/NO would be the replacement of NH2 by OH group. Each substitution results in a
one mass unit increase (-NH2: 16, -OH: 17), meaning that the above value could indicate the
replacement of 8 amino groups with hydroxyl groups. Since Fmoc-PXG accounts for 9 lysines,
having NH2 groups, a complete conversion would imply a surplus of 9 mass units. However,
such results might be indicative of a partial substitution.
The formation of the NONOate moiety, on the other hand, would implicate a 59 mass unit
increase, per amino molecule substitution, and thus, the functionalization of 2 amines would
result in an m/z value of 2818 (i.e., 118 mass increase). A value of 2817.988 was recorded and
could indicate the functionalization of 2 amines per peptide molecule.
Considering that NO is released from the functionalized peptide into the solution, which is
exposed to air, oxidation will take place forming nitrite ions. Such nitrite ions can subsequently
lead to the deamination of lysine residues, substituting the amino group with a hydroxyl group.
Conversely, deamination may occur when Fmoc-PXG/NO is solubilized and not necessarily as
a side-reaction of the synthesis of Fmoc-PXG/NO.
However, the above mentioned is only speculative analyses since no conclusive data was
retrieved from the mass spectra.
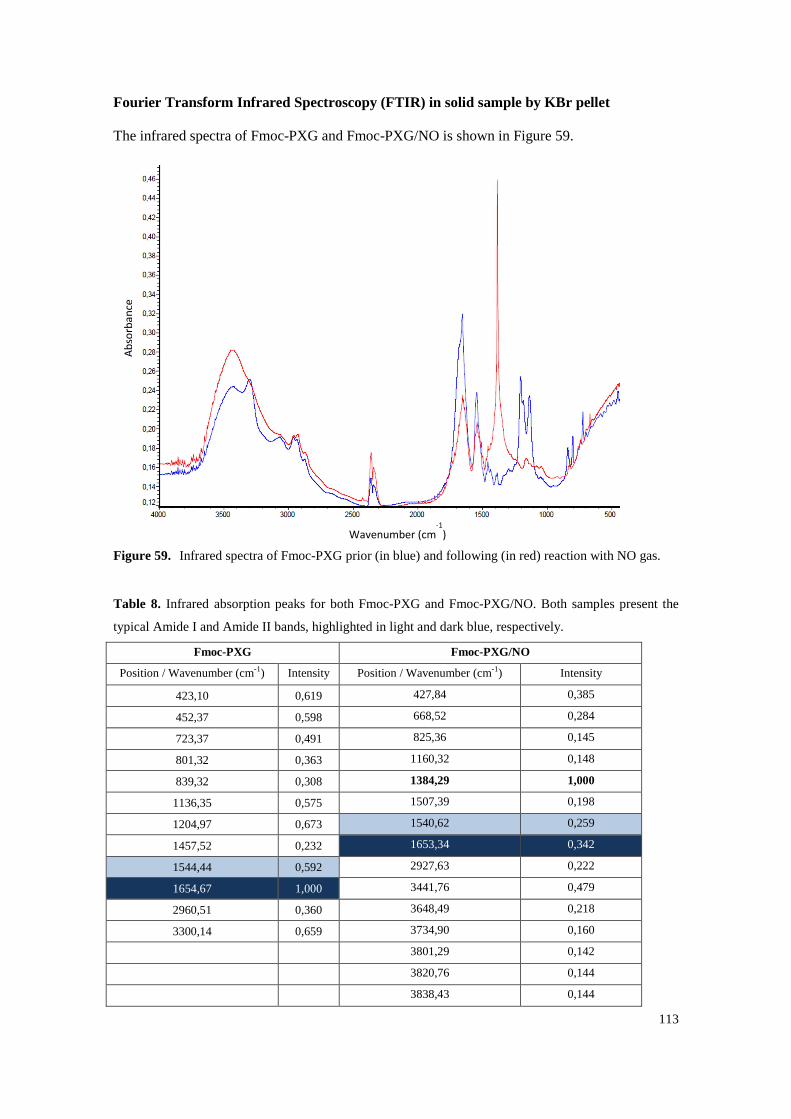
113
Fourier Transform Infrared Spectroscopy (FTIR) in solid sample by KBr pellet
The infrared spectra of Fmoc-PXG and Fmoc-PXG/NO is shown in Figure 59.
Figure 59. Infrared spectra of Fmoc-PXG prior (in blue) and following (in red) reaction with NO gas.
Table 8. Infrared absorption peaks for both Fmoc-PXG and Fmoc-PXG/NO. Both samples present the
typical Amide I and Amide II bands, highlighted in light and dark blue, respectively.
Fmoc-PXG Fmoc-PXG/NO
Position / Wavenumber (cm-1) Intensity Position / Wavenumber (cm-1) Intensity
423,10 0,619 427,84 0,385
452,37 0,598 668,52 0,284
723,37 0,491 825,36 0,145
801,32 0,363 1160,32 0,148
839,32 0,308 1384,29 1,000
1136,35 0,575 1507,39 0,198
1204,97 0,673 1540,62 0,259
1457,52 0,232 1653,34 0,342
1544,44 0,592 2927,63 0,222
1654,67 1,000 3441,76 0,479
2960,51 0,360 3648,49 0,218
3300,14 0,659 3734,90 0,160
3801,29 0,142
3820,76 0,144
3838,43 0,144
Wavenumber (cm-1
)
Ab
sorb
an
ce
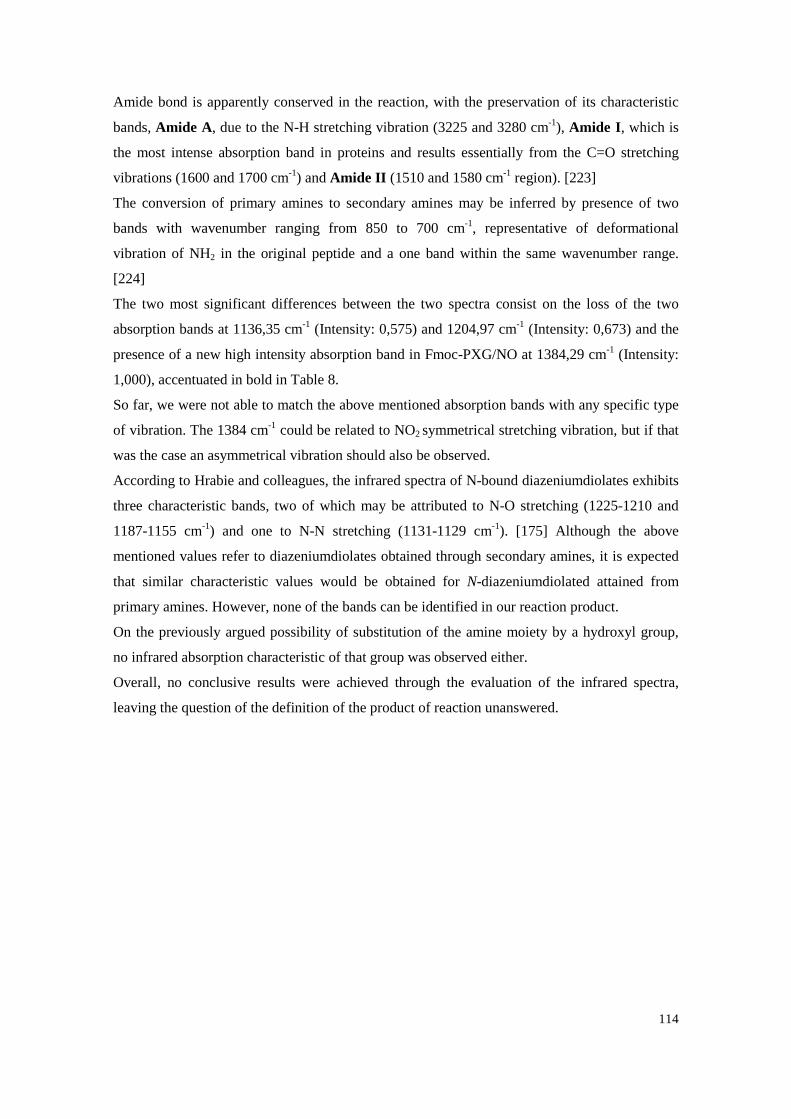
114
Amide bond is apparently conserved in the reaction, with the preservation of its characteristic
bands, Amide A, due to the N-H stretching vibration (3225 and 3280 cm-1), Amide I , which is
the most intense absorption band in proteins and results essentially from the C=O stretching
vibrations (1600 and 1700 cm-1) and Amide II (1510 and 1580 cm-1 region). [223]
The conversion of primary amines to secondary amines may be inferred by presence of two
bands with wavenumber ranging from 850 to 700 cm-1, representative of deformational
vibration of NH2 in the original peptide and a one band within the same wavenumber range.
[224]
The two most significant differences between the two spectra consist on the loss of the two
absorption bands at 1136,35 cm-1 (Intensity: 0,575) and 1204,97 cm-1 (Intensity: 0,673) and the
presence of a new high intensity absorption band in Fmoc-PXG/NO at 1384,29 cm-1 (Intensity:
1,000), accentuated in bold in Table 8.
So far, we were not able to match the above mentioned absorption bands with any specific type
of vibration. The 1384 cm-1 could be related to NO2 symmetrical stretching vibration, but if that
was the case an asymmetrical vibration should also be observed.
According to Hrabie and colleagues, the infrared spectra of N-bound diazeniumdiolates exhibits
three characteristic bands, two of which may be attributed to N-O stretching (1225-1210 and
1187-1155 cm-1) and one to N-N stretching (1131-1129 cm-1). [175] Although the above
mentioned values refer to diazeniumdiolates obtained through secondary amines, it is expected
that similar characteristic values would be obtained for N-diazeniumdiolated attained from
primary amines. However, none of the bands can be identified in our reaction product.
On the previously argued possibility of substitution of the amine moiety by a hydroxyl group,
no infrared absorption characteristic of that group was observed either.
Overall, no conclusive results were achieved through the evaluation of the infrared spectra,
leaving the question of the definition of the product of reaction unanswered.
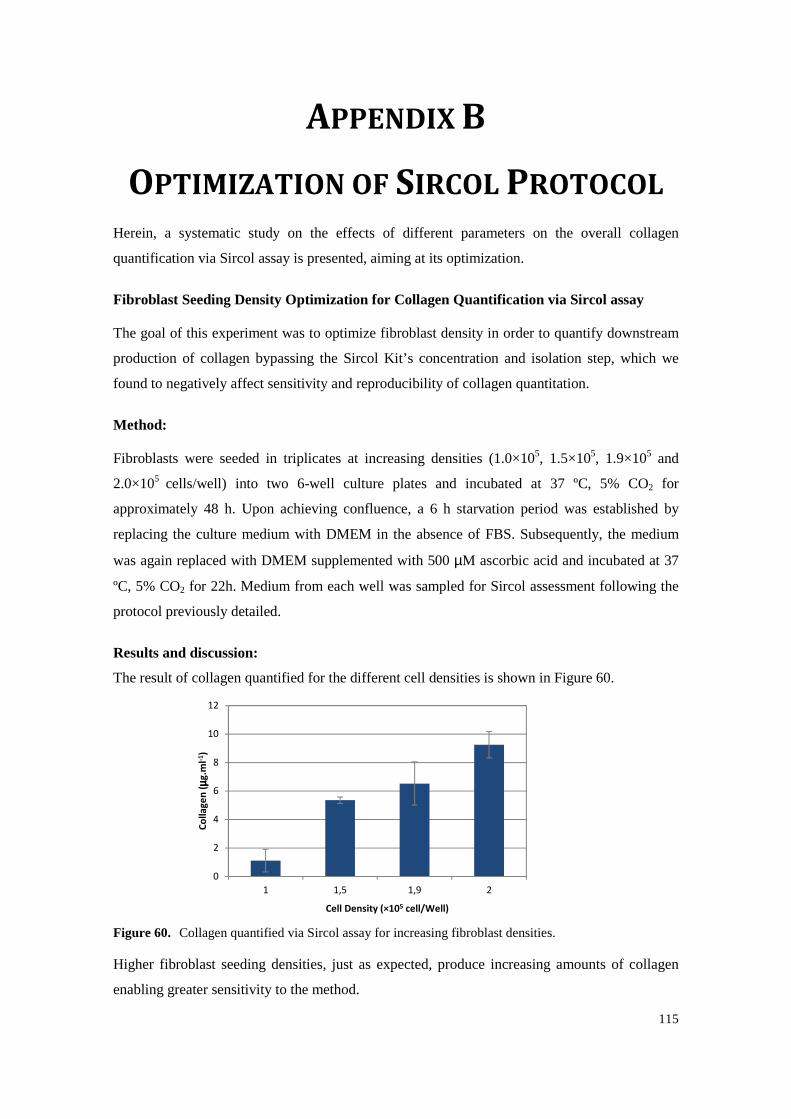
115
APPENDIX B
OPTIMIZATION OF SIRCOL PROTOCOL Herein, a systematic study on the effects of different parameters on the overall collagen
quantification via Sircol assay is presented, aiming at its optimization.
Fibroblast Seeding Density Optimization for Collagen Quantification via Sircol assay
The goal of this experiment was to optimize fibroblast density in order to quantify downstream
production of collagen bypassing the Sircol Kit’s concentration and isolation step, which we
found to negatively affect sensitivity and reproducibility of collagen quantitation.
Method:
Fibroblasts were seeded in triplicates at increasing densities (1.0×10⁵, 1.5×10⁵, 1.9×10⁵ and
2.0×10⁵ cells/well) into two 6-well culture plates and incubated at 37 ºC, 5% CO2 for
approximately 48 h. Upon achieving confluence, a 6 h starvation period was established by
replacing the culture medium with DMEM in the absence of FBS. Subsequently, the medium
was again replaced with DMEM supplemented with 500 µM ascorbic acid and incubated at 37
ºC, 5% CO2 for 22h. Medium from each well was sampled for Sircol assessment following the
protocol previously detailed.
Results and discussion:
The result of collagen quantified for the different cell densities is shown in Figure 60.
Figure 60. Collagen quantified via Sircol assay for increasing fibroblast densities.
Higher fibroblast seeding densities, just as expected, produce increasing amounts of collagen
enabling greater sensitivity to the method.
0
2
4
6
8
10
12
1 1,5 1,9 2
Co
lla
ge
n (
µµ µµg.m
l-1)
Cell Density (×105 cell/Well)
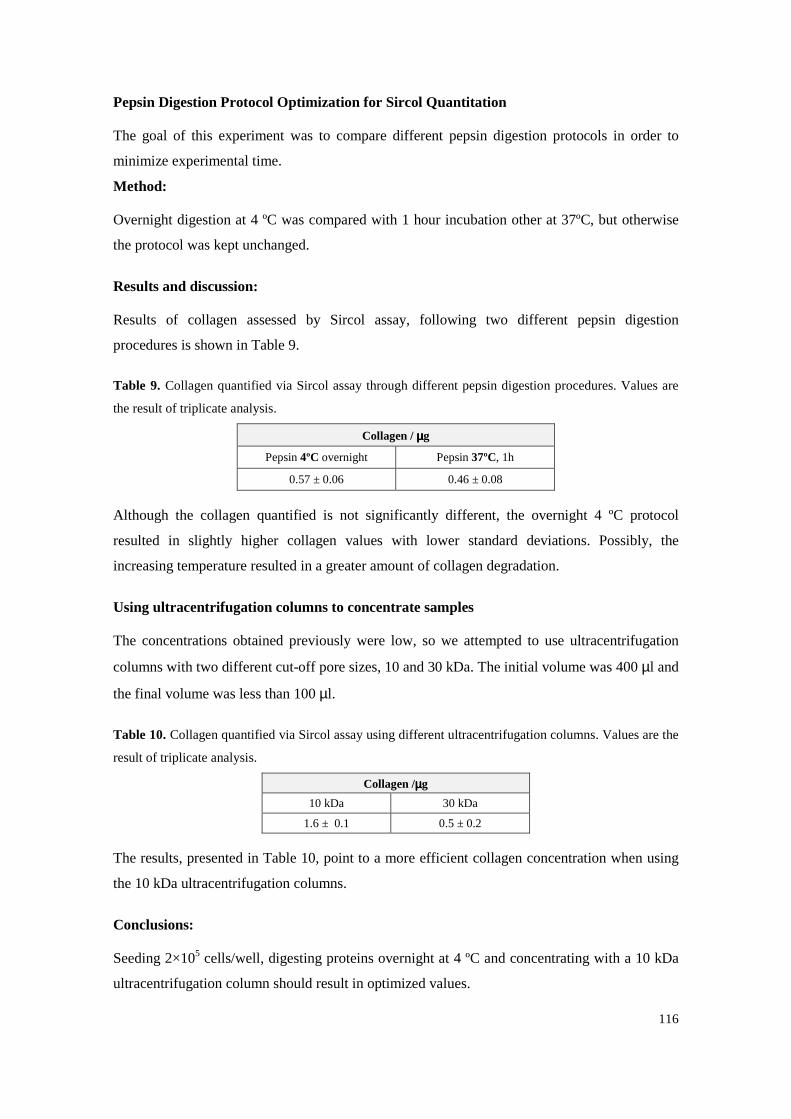
116
Pepsin Digestion Protocol Optimization for Sircol Quantitation
The goal of this experiment was to compare different pepsin digestion protocols in order to
minimize experimental time.
Method:
Overnight digestion at 4 ºC was compared with 1 hour incubation other at 37ºC, but otherwise
the protocol was kept unchanged.
Results and discussion:
Results of collagen assessed by Sircol assay, following two different pepsin digestion
procedures is shown in Table 9.
Table 9. Collagen quantified via Sircol assay through different pepsin digestion procedures. Values are
the result of triplicate analysis.
Collagen / µµµµg
Pepsin 4ºC overnight Pepsin 37ºC, 1h
0.57 ± 0.06 0.46 ± 0.08
Although the collagen quantified is not significantly different, the overnight 4 ºC protocol
resulted in slightly higher collagen values with lower standard deviations. Possibly, the
increasing temperature resulted in a greater amount of collagen degradation.
Using ultracentrifugation columns to concentrate samples
The concentrations obtained previously were low, so we attempted to use ultracentrifugation
columns with two different cut-off pore sizes, 10 and 30 kDa. The initial volume was 400 µl and
the final volume was less than 100 µl.
Table 10. Collagen quantified via Sircol assay using different ultracentrifugation columns. Values are the
result of triplicate analysis.
Collagen /µµµµg
10 kDa 30 kDa
1.6 ± 0.1 0.5 ± 0.2
The results, presented in Table 10, point to a more efficient collagen concentration when using
the 10 kDa ultracentrifugation columns.
Conclusions:
Seeding 2×10⁵ cells/well, digesting proteins overnight at 4 ºC and concentrating with a 10 kDa
ultracentrifugation column should result in optimized values.
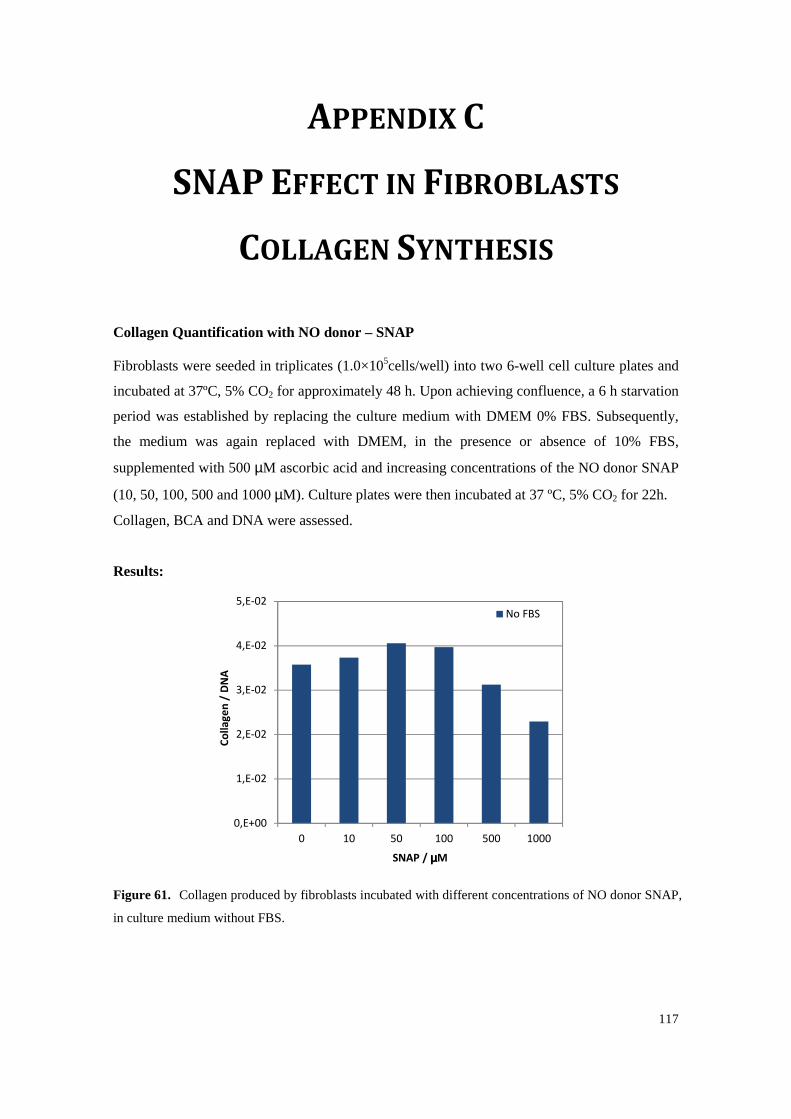
117
APPENDIX C
SNAP EFFECT IN FIBROBLASTS
COLLAGEN SYNTHESIS
Collagen Quantification with NO donor – SNAP
Fibroblasts were seeded in triplicates (1.0×10⁵cells/well) into two 6-well cell culture plates and
incubated at 37ºC, 5% CO2 for approximately 48 h. Upon achieving confluence, a 6 h starvation
period was established by replacing the culture medium with DMEM 0% FBS. Subsequently,
the medium was again replaced with DMEM, in the presence or absence of 10% FBS,
supplemented with 500 µM ascorbic acid and increasing concentrations of the NO donor SNAP
(10, 50, 100, 500 and 1000 µM). Culture plates were then incubated at 37 ºC, 5% CO2 for 22h.
Collagen, BCA and DNA were assessed.
Results:
Figure 61. Collagen produced by fibroblasts incubated with different concentrations of NO donor SNAP,
in culture medium without FBS.
0,E+00
1,E-02
2,E-02
3,E-02
4,E-02
5,E-02
0 10 50 100 500 1000
Co
lla
ge
n /
DN
A
SNAP / µµµµM
No FBS
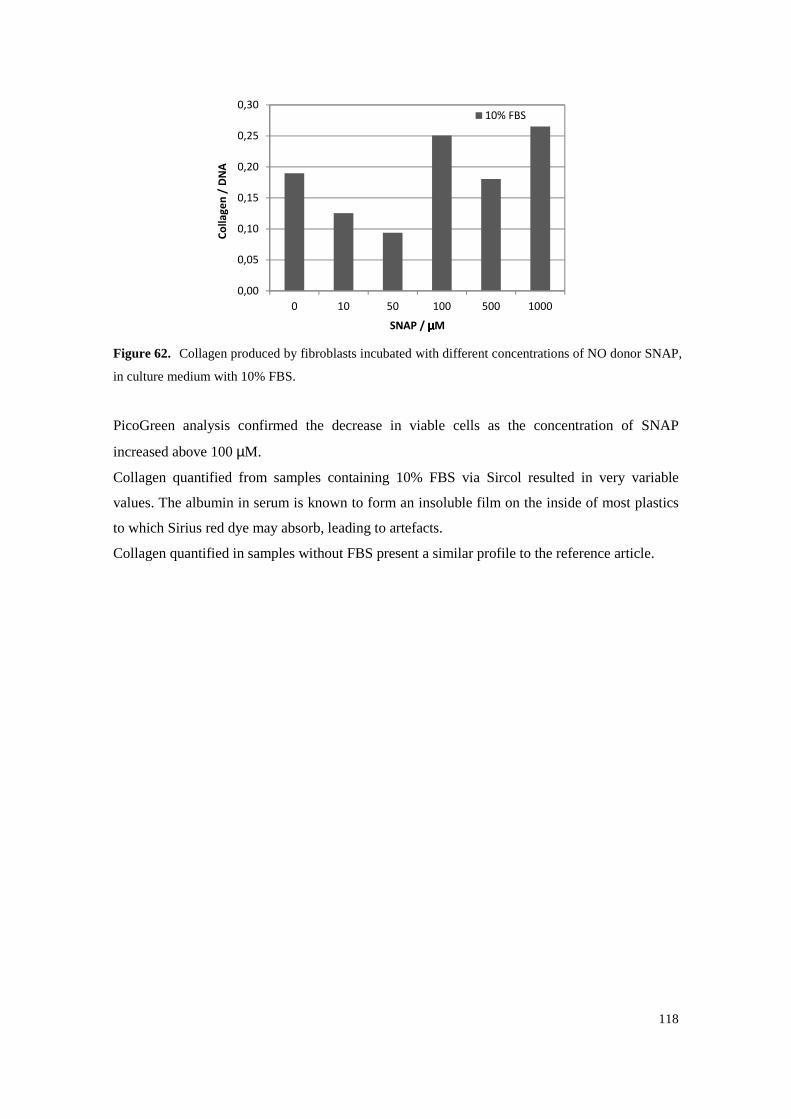
118
Figure 62. Collagen produced by fibroblasts incubated with different concentrations of NO donor SNAP,
in culture medium with 10% FBS.
PicoGreen analysis confirmed the decrease in viable cells as the concentration of SNAP
increased above 100 µM.
Collagen quantified from samples containing 10% FBS via Sircol resulted in very variable
values. The albumin in serum is known to form an insoluble film on the inside of most plastics
to which Sirius red dye may absorb, leading to artefacts.
Collagen quantified in samples without FBS present a similar profile to the reference article.
0,00
0,05
0,10
0,15
0,20
0,25
0,30
0 10 50 100 500 1000
Co
lla
ge
n /
DN
A
SNAP / µµµµM
10% FBS
119
REFERENCES 1. Nie, S., et al., Nanotechnology applications in cancer. Annu Rev Biomed Eng, 2007. 9: p. 257-
88.
2. Marcato, P.D. and N. Duran, New aspects of nanopharmaceutical delivery systems. J Nanosci Nanotechnol, 2008. 8(5): p. 2216-29.
3. Gazit, E., Self-assembled peptide nanostructures: the design of molecular building blocks and their technological utilization. Chem Soc Rev, 2007. 36(8): p. 1263-9.
4. Zhang, S., Fabrication of novel biomaterials through molecular self-assembly. Nat Biotechnol, 2003. 21(10): p. 1171-8.
5. Cui, H., M.J. Webber, and S.I. Stupp, Self-assembly of peptide amphiphiles: From molecules to nanostructures to biomaterials. Peptide Science, 2010. 94(1): p. 1-18.
6. Yakovchuk, P., E. Protozanova, and M.D. Frank-Kamenetskii, Base-stacking and base-pairing contributions into thermal stability of the DNA double helix. Nucleic Acids Res, 2006. 34(2): p. 564-74.
7. Ke, Y., et al., Three-dimensional structures self-assembled from DNA bricks. Science, 2012. 338(6111): p. 1177-83.
8. Ke, Y., Designer three-dimensional DNA architectures. Curr Opin Struct Biol, 2014. 27: p. 122-8.
9. Lodish, H.F., Molecular cell biology2000, New York: W.H. Freeman.
10. Branco, M.C. and J.P. Schneider, Self-assembling materials for therapeutic delivery. Acta Biomaterialia, 2009. 5(3): p. 817-831.
11. Allen, T.M. and P.R. Cullis, Liposomal drug delivery systems: From concept to clinical applications. Advanced Drug Delivery Reviews, 2013. 65(1): p. 36-48.
12. Bozzuto, G. and A. Molinari, Liposomes as nanomedical devices. International Journal of Nanomedicine, 2015. 10: p. 975-999.
13. Mandal, D., A. Nasrolahi Shirazi, and K. Parang, Self-assembly of peptides to nanostructures. Org Biomol Chem, 2014. 12(22): p. 3544-61.
14. Mart, R.J., et al., Peptide-based stimuli-responsive biomaterials. Soft Matter, 2006. 2(10): p. 822-835.
15. Ryan, D.M., et al., Self-assembly and hydrogelation promoted by F5-phenylalanine. Soft Matter, 2010. 6(3): p. 475-479.
16. Rughani, R.V. and J.P. Schneider, Molecular Design of β-Hairpin Peptides for Material Construction. MRS bulletin / Materials Research Society, 2008. 33(5): p. 530-535.
120
17. Leite, J.P., et al., Structure-Guided Engineering of Molinate Hydrolase for the Degradation of Thiocarbamate Pesticides. PLoS One, 2015. 10(4): p. e0123430.
18. Zelzer, M. and R.V. Ulijn, Next-generation peptide nanomaterials: molecular networks, interfaces and supramolecular functionality. Chem Soc Rev, 2010. 39(9): p. 3351-3357.
19. Rajagopal, K. and J.P. Schneider, Self-assembling peptides and proteins for nanotechnological applications. Curr Opin Struct Biol, 2004. 14(4): p. 480-6.
20. Ghadiri, M.R., et al., Self-assembling organic nanotubes based on a cyclic peptide architecture. Nature, 1993. 366(6453): p. 324-7.
21. Bong, D.T., et al., Self-Assembling Organic Nanotubes. Angew Chem Int Ed Engl, 2001. 40(6): p. 988-1011.
22. Granja, J.R. and M.R. Ghadiri, Channel-Mediated Transport of Glucose across Lipid Bilayers. J Am Chem Soc, 1994. 116(23): p. 10785-10786.
23. Görbitz, C.H. and E. Gundersen, l-Valyl-l-alanine. Acta Crystallographica Section C, 1996. 52(7): p. 1764-1767.
24. Görbitz, C.H., Microporous Organic Materials from Hydrophobic Dipeptides. Chemistry – A European Journal, 2007. 13(4): p. 1022-1031.
25. Dalhus, B. and C.H. Gorbitz, Glycyl-L-leucyl-L-tyrosine dihydrate 2-propanol solvate. Acta Crystallogr C, 1996. 52 ( Pt 8): p. 2087-90.
26. Gorbitz, C.H. and F. Rise, Template-directed supramolecular assembly of a new type of nanoporous peptide-based material. J Pept Sci, 2008. 14(2): p. 210-6.
27. Henrik Gorbitz, C., Nanotubes from hydrophobic dipeptides: pore size regulation through side chain substitution. New Journal of Chemistry, 2003. 27(12): p. 1789-1793.
28. Görbitz, C.H., Peptide structures. Current Opinion in Solid State and Materials Science, 2002. 6(2): p. 109-116.
29. Gorbitz, C.H., Nanotube formation by hydrophobic dipeptides. Chemistry, 2001. 7(23): p. 5153-9.
30. Soldatov, D.V., I.L. Moudrakovski, and J.A. Ripmeester, Dipeptides as microporous materials. Angew Chem Int Ed Engl, 2004. 43(46): p. 6308-11.
31. Comotti, A., et al., Methane, carbon dioxide and hydrogen storage in nanoporous dipeptide-based materials. Chem Commun (Camb), 2009(3): p. 284-6.
32. Afonso, R., A. Mendes, and L. Gales, Hydrophobic dipeptide crystals: a promising Ag-free class of ultramicroporous materials showing argon/oxygen adsorption selectivity. Physical Chemistry Chemical Physics, 2014. 16(36): p. 19386-19393.
33. Afonso, R.V., et al., Dipeptide crystals as excellent permselective materials: sequential exclusion of argon, nitrogen, and oxygen. Angew Chem Int Ed Engl, 2010. 49(17): p. 3034-6.
34. Soldatov, D.V., et al., Micropores in crystalline dipeptides as seen from the crystal structure, He pycnometry, and 129Xe NMR spectroscopy. J Am Chem Soc, 2006. 128(20): p. 6737-44.
121
35. Imaz, I., et al., Metal-biomolecule frameworks (MBioFs). Chemical Communications, 2011. 47(26): p. 7287-7302.
36. Rabone, J., et al., An adaptable peptide-based porous material. Science, 2010. 329(5995): p. 1053-7.
37. Martí Gastaldo, C., et al., Side-chain control of porosity closure in single- and multiple-peptide-based porous materials by cooperative folding. Nat Chem, 2014. 6(4): p. 343-351.
38. Emami, S., et al., Toward the Construction of 3D Dipeptide–Metal Frameworks. Crystal Growth & Design, 2014. 14(9): p. 4777-4780.
39. Ruoslahti, E., RGD and other recognition sequences for integrins. Annu Rev Cell Dev Biol, 1996. 12: p. 697-715.
40. Varner, J.A. and D.A. Cheresh, Integrins and cancer. Current Opinion in Cell Biology, 1996. 8(5): p. 724-730.
41. Durao, J. and L. Gales, Guest diffusion in dipeptide crystals. CrystEngComm, 2013. 15(8): p. 1532-1535.
42. Holst, J.R., A. Trewin, and A.I. Cooper, Porous organic molecules. Nature Chemistry, 2010. 2(11): p. 915-920.
43. Barbour, L.J., Crystal porosity and the burden of proof. Chemical Communications, 2006(11): p. 1163-1168.
44. Afonso, R., A. Mendes, and L. Gales, Peptide-based solids: porosity and zeolitic behavior. Journal of Materials Chemistry, 2012. 22(5): p. 1709-1723.
45. Moggach, S.A., C.H. Gorbitz, and J.E. Warren, The effect of pressure on the porous peptide l-alanyl-l-valine. CrystEngComm, 2010. 12(8): p. 2322-2324.
46. Gorbitz, C.H., et al., Microporous organic crystals: an unusual case for L-leucyl-L-serine. Chem Commun (Camb), 2005(34): p. 4288-90.
47. de Vries, E.J.C., D.C. Levendis, and H.A. Reece, A hexagonal solvate of the neurotransmitter [gamma]-aminobutyric acid. CrystEngComm, 2011. 13(10): p. 3334-3337.
48. Chen, H., J.K. Johnson, and D.S. Sholl, Transport Diffusion of Gases Is Rapid in Flexible Carbon Nanotubes. The Journal of Physical Chemistry B, 2006. 110(5): p. 1971-1975.
49. Karger, J., The Beauty of the Different Views on Diffusion. Diffusion in Solids and Liquids Vii, 2012. 326-328: p. 1-11.
50. Krishna, R. and J.A. Wesselingh, The Maxwell-Stefan approach to mass transfer. Chemical Engineering Science, 1997. 52(6): p. 861-911.
51. Cheng, C.-Y. and C.R. Bowers, Observation of Single-File Diffusion in Dipeptide Nanotubes by Continuous-Flow Hyperpolarized Xenon-129 NMR Spectroscopy. ChemPhysChem, 2007. 8(14): p. 2077-2081.
122
52. Cheng, C.-Y. and C.R. Bowers, Direct Observation of Atoms Entering and Exiting l-Alanyl-l-valine Nanotubes by Hyperpolarized Xenon-129 NMR. J Am Chem Soc, 2007. 129(45): p. 13997-14002.
53. Sheldrick, G., A short history of SHELX. Acta Crystallographica Section A, 2008. 64(1): p. 112-122.
54. Ray, M.S., Diffusion in Zeolites and Other Microporous Solids, by J. Karger and D. M. Ruthven, John Wiley, New York, USA (1992). 605 pages. ISBN 0-47 1-50907-8. Developments in Chemical Engineering and Mineral Processing, 1996. 4(3-4): p. 254-254.
55. Schüring, A., et al., On entropic barriers for diffusion in zeolites: A molecular dynamics study. The Journal of Chemical Physics, 2002. 116(24): p. 10890-10894.
56. Hibbe, F., et al., Monitoring Molecular Mass Transfer in Cation-Free Nanoporous Host Crystals of Type AlPO-LTA. J Am Chem Soc, 2012. 134(18): p. 7725-7732.
57. Durão, J. and L. Gales, Permeation of Light Gases through Hexagonal Ice. Materials, 2012. 5(9): p. 1593.
58. Bernardo, P., E. Drioli, and G. Golemme, Membrane Gas Separation: A Review/State of the Art. Industrial & Engineering Chemistry Research, 2009. 48(10): p. 4638-4663.
59. Robeson, L.M., The upper bound revisited. Journal of Membrane Science, 2008. 320(1–2): p. 390-400.
60. Bux, H., et al., Zeolitic Imidazolate Framework Membrane with Molecular Sieving Properties by Microwave-Assisted Solvothermal Synthesis. J Am Chem Soc, 2009. 131(44): p. 16000-16001.
61. Bae, T.-H., et al., A High-Performance Gas-Separation Membrane Containing Submicrometer-Sized Metal–Organic Framework Crystals. Angewandte Chemie International Edition, 2010. 49(51): p. 9863-9866.
62. Kameta, N., H. Minamikawa, and M. Masuda, Supramolecular organic nanotubes: how to utilize the inner nanospace and the outer space. Soft Matter, 2011. 7(10): p. 4539-4561.
63. Pauling, L., The Structure and Entropy of Ice and of Other Crystals with Some Randomness of Atomic Arrangement. J Am Chem Soc, 1935. 57(12): p. 2680-2684.
64. Geil, B., T.M. Kirschgen, and F. Fujara, Mechanism of proton transport in hexagonal ice. Physical Review B, 2005. 72(1): p. 014304.
65. Markland, T.E. and D.E. Manolopoulos, An efficient ring polymer contraction scheme for imaginary time path integral simulations. The Journal of Chemical Physics, 2008. 129(2): p. 024105.
66. Rottger, K., et al., Lattice constants and thermal expansion of H2O and D2O Ice Ih between 10 and 265 K. Addendum. Acta Crystallographica Section B, 2012. 68(1): p. 91.
67. Dantl, G., Wärmeausdehnung von H2O- und D2O-Einkristallen. Zeitschrift für Physik, 1962. 166(1): p. 115-118.
68. Kuhs, W.F. and M.S. Lehmann, The structure of the ice Ih by neutron diffraction. The Journal of Physical Chemistry, 1983. 87(21): p. 4312-4313.
123
69. Kuhs, W.F., et al., Ice perfection and onset of anomalous preservation of gas hydrates. Physical Chemistry Chemical Physics, 2004. 6(21): p. 4917-4920.
70. Szejtli, J., J.L. Atwood, and J.M. Lehn, Comprehensive supramolecular chemistry. Volume 3, Volume 31996, New York: Pergamon.
71. Ripmeester, J.A., et al., A new clathrate hydrate structure. Nature, 1987. 325(6100): p. 135-136.
72. Udachin, K.A., et al., Structure H Hydrate: A Single Crystal Diffraction Study of 2,2-dimethylpentane·5(Xe, H2S)·34H2O. Supramolecular Chemistry, 1997. 8(3): p. 173-176.
73. Lu, H., et al., Complex gas hydrate from the Cascadia margin. Nature, 2007. 445(7125): p. 303-306.
74. Alavi, S. and J.A. Ripmeester, Hydrogen-Gas Migration through Clathrate Hydrate Cages. Angewandte Chemie International Edition, 2007. 46(32): p. 6102-6105.
75. Takeya, S. and J.A. Ripmeester, Dissociation Behavior of Clathrate Hydrates to Ice and Dependence on Guest Molecules. Angewandte Chemie International Edition, 2008. 47(7): p. 1276-1279.
76. Fray, N., et al., Equilibrium Data of Methane, Carbon Dioxide, and Xenon Clathrate Hydrates below the Freezing Point of Water. Applications to Astrophysical Environments. Journal of Chemical & Engineering Data, 2010. 55(11): p. 5101-5108.
77. Strobel, T.A., M. Somayazulu, and R.J. Hemley, Phase Behavior of H2 + H2O at High Pressures and Low Temperatures. The Journal of Physical Chemistry C, 2011. 115(11): p. 4898-4903.
78. Buch, V., et al., Clathrate hydrates with hydrogen-bonding guests. Physical Chemistry Chemical Physics, 2009. 11(44): p. 10245-10265.
79. Ikeda-Fukazawa, T., et al., Molecular dynamics studies of molecular diffusion in ice Ih. The Journal of Chemical Physics, 2002. 117(8): p. 3886-3896.
80. Ikeda-Fukazawa, T., K. Kawamura, and T. Hondoh, Diffusion of nitrogen gas in ice Ih. Chemical Physics Letters, 2004. 385(5–6): p. 467-471.
81. Ikeda-Fukazawa, T., K. Kawamura, and T. Hondoh, Mechanism of Molecular Diffusion in Ice Crystals. Molecular Simulation, 2004. 30(13-15): p. 973-979.
82. Demurov, A., R. Radhakrishnan, and B.L. Trout, Computations of diffusivities in ice and CO2 clathrate hydrates via molecular dynamics and Monte Carlo simulations. The Journal of Chemical Physics, 2002. 116(2): p. 702-709.
83. Mitlin, S., et al., Surface Adsorption and Trapping of Xe on Hexagonal Ice at 180 K by Molecular Dynamics Simulations. The Journal of Physical Chemistry B, 2003. 107(37): p. 9958-9963.
84. Peters, B., et al., Path Sampling Calculation of Methane Diffusivity in Natural Gas Hydrates from a Water-Vacancy Assisted Mechanism. J Am Chem Soc, 2008. 130(51): p. 17342-17350.
85. Ballenegger, V., S. Picaud, and C. Toubin, Molecular dynamics study of diffusion of formaldehyde in ice. Chemical Physics Letters, 2006. 432(1–3): p. 78-83.
124
86. Hori, A. and T. Hondoh, Theoretical study on the diffusion of gases in hexagonal ice by the molecular orbital method. Canadian Journal of Physics, 2003. 81(1-2): p. 251-259.
87. Ocampo, J. and J. Klinger, Adsorption of N2 and CO2 on ice. Journal of Colloid and Interface Science, 1982. 86(2): p. 377-383.
88. Pascal, T.A., C. Boxe, and W.A. Goddard, An Inexpensive, Widely Available Material for 4 wt % Reversible Hydrogen Storage Near Room Temperature. The Journal of Physical Chemistry Letters, 2011. 2(12): p. 1417-1420.
89. Shamoto, T., Y. Tasaki, and T. Okada, Chiral Ice Chromatography. J Am Chem Soc, 2010. 132(38): p. 13135-13137.
90. Woolfson, D.N. and M.G. Ryadnov, Peptide-based fibrous biomaterials: some things old, new and borrowed. Curr Opin Chem Biol, 2006. 10(6): p. 559-567.
91. Banwell, E.F., et al., Rational design and application of responsive [alpha]-helical peptide hydrogels. Nat Mater, 2009. 8(7): p. 596-600.
92. Woolfson, D.N., Building fibrous biomaterials from α-helical and collagen-like coiled-coil peptides. Peptide Science, 2010. 94(1): p. 118-127.
93. Woolfson, D.N. and M.G. Ryadnov, Peptide-based fibrous biomaterials: some things old, new and borrowed. Current Opinion in Chemical Biology, 2006. 10(6): p. 559-567.
94. Wagner, D.E., et al., Toward the development of peptide nanofilaments and nanoropes as smart materials. Proceedings of the National Academy of Sciences of the United States of America, 2005. 102(36): p. 12656-12661.
95. Zimenkov, Y., et al., Rational design of a nanoscale helical scaffold derived from self-assembly of a dimeric coiled coil motif. Tetrahedron, 2004. 60(34): p. 7237-7246.
96. Burkhard, P., J. Stetefeld, and S.V. Strelkov, Coiled coils: a highly versatile protein folding motif. Trends in Cell Biology, 2001. 11(2): p. 82-88.
97. Parry, D.A.D., R.D.B. Fraser, and J.M. Squire, Fifty years of coiled-coils and α-helical bundles: A close relationship between sequence and structure. Journal of Structural Biology, 2008. 163(3): p. 258-269.
98. Grigoryan, G. and A.E. Keating, Structural specificity in coiled-coil interactions. Curr Opin Struct Biol, 2008. 18(4): p. 477-483.
99. Zhou, N.E., C.M. Kay, and R.S. Hodges, The Role of Interhelical Ionic Interactions in Controlling Protein Folding and Stability: De Novo Designed Synthetic Two-stranded α-Helical Coiled-Coils. Journal of Molecular Biology, 1994. 237(4): p. 500-512.
100. Zimenkov, Y., et al., Rational Design of a Reversible pH-Responsive Switch for Peptide Self-Assembly. Journal of the American Chemical Society, 2006. 128(21): p. 6770-6771.
101. Dong, H., S.E. Paramonov, and J.D. Hartgerink, Self-Assembly of α-Helical Coiled Coil Nanofibers. Journal of the American Chemical Society, 2008. 130(41): p. 13691-13695.
102. Matson, J.B. and S.I. Stupp, Self-assembling peptide scaffolds for regenerative medicine. Chemical Communications (Cambridge, England), 2012. 48(1): p. 26-33.
125
103. ERIKSSON, M., et al., Utilization of a Right-handed Coiled-coil Protein from Archaebacterium Staphylothermus marinus as a Carrier for Cisplatin. Anticancer Research, 2009. 29(1): p. 11-18.
104. More, H.T., et al., Gene delivery from supercharged coiled-coil protein and cationic lipid hybrid complex. Biomaterials, 2014. 35(25): p. 7188-7193.
105. Apostolovic, B., et al., Cell Uptake and Trafficking Behavior of Non-covalent, Coiled-coil Based Polymer–Drug Conjugates. Macromolecular Rapid Communications, 2011. 32(1): p. 11-18.
106. Zhang, S., et al., Spontaneous assembly of a self-complementary oligopeptide to form a stable macroscopic membrane. Proceedings of the National Academy of Sciences, 1993. 90(8): p. 3334-3338.
107. Zhang, S., Emerging biological materials through molecular self-assembly. Biotechnology Advances, 2002. 20(5–6): p. 321-339.
108. Zhang, S., et al., Self-complementary oligopeptide matrices support mammalian cell attachment. Biomaterials, 1995. 16(18): p. 1385-1393.
109. Gelain, F., et al., Designer Self-Assembling Peptide Nanofiber Scaffolds for Adult Mouse Neural Stem Cell 3-Dimensional Cultures. PLoS One, 2006. 1(1): p. e119.
110. Genové, E., et al., The effect of functionalized self-assembling peptide scaffolds on human aortic endothelial cell function. Biomaterials, 2005. 26(16): p. 3341-3351.
111. Caplan, M.R., et al., Effects of systematic variation of amino acid sequence on the mechanical properties of a self-assembling, oligopeptide biomaterial. Journal of Biomaterials Science, Polymer Edition, 2002. 13(3): p. 225-236.
112. Nagai, Y., et al., Slow release of molecules in self-assembling peptide nanofiber scaffold. Journal of Controlled Release, 2006. 115(1): p. 18-25.
113. Zhao, Y., et al., Nanofibrous scaffold from self-assembly of β-sheet peptides containing phenylalanine for controlled release. Journal of Controlled Release, 2010. 142(3): p. 354-360.
114. Koutsopoulos, S., et al., Controlled release of functional proteins through designer self-assembling peptide nanofiber hydrogel scaffold. Proceedings of the National Academy of Sciences, 2009. 106(12): p. 4623-4628.
115. Koutsopoulos, S. and S. Zhang, Two-layered injectable self-assembling peptide scaffold hydrogels for long-term sustained release of human antibodies. Journal of Controlled Release, 2012. 160(3): p. 451-458.
116. Schneider, J.P., et al., Responsive Hydrogels from the Intramolecular Folding and Self-Assembly of a Designed Peptide. Journal of the American Chemical Society, 2002. 124(50): p. 15030-15037.
117. Branco, M.C., et al., Macromolecular diffusion and release from self-assembled β-hairpin peptide hydrogels. Biomaterials, 2009. 30(7): p. 1339-1347.
118. Altunbas, A., et al., Encapsulation of curcumin in self-assembling peptide hydrogels as injectable drug delivery vehicles. Biomaterials, 2011. 32(25): p. 5906-5914.
126
119. Ruan, L., et al., Designed amphiphilic peptide forms stable nanoweb, slowly releases encapsulated hydrophobic drug, and accelerates animal hemostasis. Proceedings of the National Academy of Sciences, 2009. 106(13): p. 5105-5110.
120. Marchesan, S., et al., Self-assembly of ciprofloxacin and a tripeptide into an antimicrobial nanostructured hydrogel. Biomaterials, 2013. 34(14): p. 3678-3687.
121. Cui, H., M.J. Webber, and S.I. Stupp, Self-Assembly of Peptide Amphiphiles: From Molecules to Nanostructures to Biomaterials. Biopolymers, 2010. 94(1): p. 1-18.
122. Hartgerink, J.D., E. Beniash, and S.I. Stupp, Self-assembly and mineralization of peptide-amphiphile nanofibers. Science, 2001. 294(5547): p. 1684-8.
123. Bellis, S.L., Advantages of RGD peptides for directing cell association with biomaterials. Biomaterials, 2011. 32(18): p. 4205-4210.
124. Burdick, J.A. and K.S. Anseth, Photoencapsulation of osteoblasts in injectable RGD-modified PEG hydrogels for bone tissue engineering. Biomaterials, 2002. 23(22): p. 4315-4323.
125. Castelletto, V., et al., Self-assembly of Fmoc-tetrapeptides based on the RGDS cell adhesion motif. Soft Matter, 2011. 7(24): p. 11405-11415.
126. Cheng, G., et al., Hydrogelation of self-assembling RGD-based peptides. Soft Matter, 2011. 7(4): p. 1326-1333.
127. Hersel, U., C. Dahmen, and H. Kessler, RGD modified polymers: biomaterials for stimulated cell adhesion and beyond. Biomaterials, 2003. 24(24): p. 4385-4415.
128. VandeVondele, S., J. Vörös, and J.A. Hubbell, RGD-grafted poly-l-lysine-graft-(polyethylene glycol) copolymers block non-specific protein adsorption while promoting cell adhesion. Biotechnology and Bioengineering, 2003. 82(7): p. 784-790.
129. Yang, F., et al., The effect of incorporating RGD adhesive peptide in polyethylene glycol diacrylate hydrogel on osteogenesis of bone marrow stromal cells. Biomaterials, 2005. 26(30): p. 5991-5998.
130. Zhou, M., et al., Self-assembled peptide-based hydrogels as scaffolds for anchorage-dependent cells. Biomaterials, 2009. 30(13): p. 2523-2530.
131. Niece, K.L., et al., Self-assembly combining two bioactive peptide-amphiphile molecules into nanofibers by electrostatic attraction. J Am Chem Soc, 2003. 125(24): p. 7146-7.
132. Silva, G.A., et al., Selective differentiation of neural progenitor cells by high-epitope density nanofibers. Science (New York, N.Y.), 2004. 303(5662): p. 1352-1355.
133. Zou, Z., et al., Growth of rat dorsal root ganglion neurons on a novel self-assembling scaffold containing IKVAV sequence. Materials Science and Engineering: C, 2009. 29(7): p. 2099-2103.
134. Fleming, S. and R.V. Ulijn, Design of nanostructures based on aromatic peptide amphiphiles. Chemical Society Reviews, 2014. 43(23): p. 8150-8177.
135. Gazit, E., Self-assembled peptide nanostructures: the design of molecular building blocks and their technological utilization. Chemical Society Reviews, 2007. 36(8): p. 1263-1269.
127
136. van Hell, A.J., et al., Self-Assembly of Recombinant Amphiphilic Oligopeptides into Vesicles. Biomacromolecules, 2007. 8(9): p. 2753-2761.
137. Liang, J., et al., pH Responsive micelle self-assembled from a new amphiphilic peptide as anti-tumor drug carrier. Colloids and Surfaces B: Biointerfaces, 2014. 114(0): p. 398-403.
138. Kim, J.-K., et al., Self-Assembling Peptide Amphiphile-Based Nanofiber Gel for Bioresponsive Cisplatin Delivery. Molecular Pharmaceutics, 2009. 6(3): p. 978-985.
139. Webber, M.J., et al., Controlled release of dexamethasone from peptide nanofiber gels to modulate inflammatory response. Biomaterials, 2012. 33(28): p. 6823-6832.
140. Bulut, S., et al., Slow Release and Delivery of Antisense Oligonucleotide Drug by Self-Assembled Peptide Amphiphile Nanofibers. Biomacromolecules, 2011. 12(8): p. 3007-3014.
141. Matson, J.B., et al., Nanostructure-templated control of drug release from peptide amphiphile nanofiber gels. Soft Matter, 2012. 8(13): p. 3586-3595.
142. Claessens, C.G. and J.F. Stoddart, π–π INTERACTIONS IN SELF-ASSEMBLY. Journal of Physical Organic Chemistry, 1997. 10(5): p. 254-272.
143. Gazit, E., A possible role for π-stacking in the self-assembly of amyloid fibrils. The FASEB Journal, 2002. 16(1): p. 77-83.
144. Tatko, C.D. and M.L. Waters, Selective Aromatic Interactions in β-Hairpin Peptides. J Am Chem Soc, 2002. 124(32): p. 9372-9373.
145. Bowerman, C.J., et al., The effect of increasing hydrophobicity on the self-assembly of amphipathic [small beta]-sheet peptides. Molecular BioSystems, 2009. 5(9): p. 1058-1069.
146. Adams, D.J., Dipeptide and tripeptide conjugates as low-molecular-weight hydrogelators. Macromol Biosci, 2011. 11(2): p. 160-73.
147. Jayawarna, V., et al., Nanostructured Hydrogels for Three-Dimensional Cell Culture Through Self-Assembly of Fluorenylmethoxycarbonyl–Dipeptides. Advanced Materials, 2006. 18(5): p. 611-614.
148. Wang, Y., et al., Silver mineralization on self-assembled peptide nanofibers for long term antimicrobial effect. Journal of Materials Chemistry, 2012. 22(6): p. 2575-2581.
149. Adams, D.J., et al., Relationship between molecular structure, gelation behaviour and gel properties of Fmoc-dipeptides. Soft Matter, 2010. 6(9): p. 1971-1980.
150. Chen, L., et al., Self-assembly mechanism for a naphthalene-dipeptide leading to hydrogelation. Langmuir, 2010. 26(7): p. 5232-42.
151. Chen, L., et al., Effect of Molecular Structure on the Properties of Naphthalene−Dipeptide Hydrogelators. Langmuir, 2010. 26(16): p. 13466-13471.
152. Sutton, S., et al., Controlled Release from Modified Amino Acid Hydrogels Governed by Molecular Size or Network Dynamics. Langmuir, 2009. 25(17): p. 10285-10291.
153. Johnson, E.K., D.J. Adams, and P.J. Cameron, Peptide based low molecular weight gelators. Journal of Materials Chemistry, 2011. 21(7): p. 2024-2027.
128
154. Orbach, R., et al., Self-Assembled Fmoc-Peptides as a Platform for the Formation of Nanostructures and Hydrogels. Biomacromolecules, 2009. 10(9): p. 2646-2651.
155. Ma, M., et al., Aromatic−Aromatic Interactions Induce the Self-Assembly of Pentapeptidic Derivatives in Water To Form Nanofibers and Supramolecular Hydrogels. J Am Chem Soc, 2010. 132(8): p. 2719-2728.
156. Alderton, W.K., C.E. Cooper, and R.G. Knowles, Nitric oxide synthases: structure, function and inhibition. Biochemical Journal, 2001. 357: p. 593-615.
157. Luo, J.-d. and A.F. Chen, Nitric oxide: a newly discovered function on wound healing. Acta Pharmacol Sin, 2005. 26(3): p. 259-264.
158. Schaffer, M.R., et al., Nitric oxide regulates wound healing. J Surg Res, 1996. 63(1): p. 237-40.
159. Yamasaki, K., et al., Reversal of impaired wound repair in iNOS-deficient mice by topical adenoviral-mediated iNOS gene transfer. The Journal of Clinical Investigation, 1998. 101(5): p. 967-971.
160. Lee, P.C., et al., Impaired wound healing and angiogenesis in eNOS-deficient mice. American Journal of Physiology - Heart and Circulatory Physiology, 1999. 277(4): p. H1600-H1608.
161. Cooke, J.P. and D.W. Losordo, Nitric oxide and angiogenesis. Circulation, 2002. 105(18): p. 2133-5.
162. Schäffer, M.R., et al., Diabetes-impaired healing and reduced wound nitric oxide synthesis: A possible pathophysiologic correlation. Surgery, 1997. 121(5): p. 513-519.
163. Witte, M.B., et al., L-Arginine supplementation enhances diabetic wound healing: Involvement of the nitric oxide synthase and arginase pathways. Metabolism, 2002. 51(10): p. 1269-1273.
164. Shabani, M., et al., Enhancement of wound repair with a topically applied nitric oxide-releasing polymer. Wound Repair and Regeneration, 1996. 4(3): p. 353-362.
165. Kim, J.O., et al., Nitric oxide-releasing chitosan film for enhanced antibacterial and in vivo wound-healing efficacy. International Journal of Biological Macromolecules, 2015. 79: p. 217-225.
166. Blecher, K., et al., Nitric oxide-releasing nanoparticles accelerate wound healing in NOD-SCID mice. Nanomedicine: Nanotechnology, Biology, and Medicine, 2012. 8(8): p. 1364-1371.
167. Miller, M.R. and I.L. Megson, Recent developments in nitric oxide donor drugs. Br J Pharmacol, 2007. 151(3): p. 305-21.
168. Hottinger, D.G., et al., Sodium nitroprusside in 2014: A clinical concepts review. Journal of Anaesthesiology, Clinical Pharmacology, 2014. 30(4): p. 462-471.
169. Al-Sa'Doni, H. and A. Ferro, S-Nitrosothiols: a class of nitric oxide-donor drugs. Clinical Science, 2000. 98(5): p. 507-520.
170. Keefer, L.K., Fifty Years of Diazeniumdiolate Research. From Laboratory Curiosity to Broad-Spectrum Biomedical Advances. ACS Chemical Biology, 2011. 6(11): p. 1147-1155.

129
171. Singh, R.J., et al., Mechanism of Nitric Oxide Release from S-Nitrosothiols. Journal of Biological Chemistry, 1996. 271(31): p. 18596-18603.
172. Achuth, H.N., et al., Nitrosoglutathione triggers collagen deposition in cutaneous wound repair. Wound Repair and Regeneration, 2005. 13(4): p. 383-389.
173. Amadeu, T.P., et al., S-nitrosoglutathione-containing hydrogel accelerates rat cutaneous wound repair. Journal of the European Academy of Dermatology and Venereology, 2007. 21(5): p. 629-637.
174. Georgii, J.L., et al., Topical S-nitrosoglutathione-releasing hydrogel improves healing of rat ischaemic wounds. Journal of Tissue Engineering and Regenerative Medicine, 2011. 5(8): p. 612-619.
175. Hrabie, J.A. and L.K. Keefer, Chemistry of the nitric oxide-releasing diazeniumdiolate ("nitrosohydroxylamine") functional group and its oxygen-substituted derivatives. Chem Rev, 2002. 102(4): p. 1135-54.
176. Davies, K.M., et al., Chemistry of the diazeniumdiolates. 2. Kinetics and mechanism of dissociation to nitric oxide in aqueous solution. J Am Chem Soc, 2001. 123(23): p. 5473-81.
177. Morley, D., et al., Mechanism of Vascular Relaxation Induced by the Nitric Oxide (NO)/Nucleophile Complexes, a New Class of NO-Based Vasodilators. Journal of Cardiovascular Pharmacology, 1993. 21(4): p. 670-676.
178. Bohl, K.S. and J.L. West, Nitric oxide-generating polymers reduce platelet adhesion and smooth muscle cell proliferation. Biomaterials, 2000. 21(22): p. 2273-2278.
179. Jun, H.-W., L.J. Taite, and J.L. West, Nitric Oxide-Producing Polyurethanes. Biomacromolecules, 2005. 6(2): p. 838-844.
180. Kushwaha, M., et al., A nitric oxide releasing, self assembled peptide amphiphile matrix that mimics native endothelium for coating implantable cardiovascular devices. Biomaterials, 2010. 31(7): p. 1502-1508.
181. Masters, K.S.B., et al., Effects of nitric oxide releasing poly(vinyl alcohol) hydrogel dressings on dermal wound healing in diabetic mice. Wound Repair and Regeneration, 2002. 10(5): p. 286-294.
182. Safdar, S. and L.J. Taite, Targeted diazeniumdiolates: localized nitric oxide release from glioma-specific peptides and proteins. Int J Pharm, 2012. 422(1-2): p. 264-70.
183. Stasko, N.A. and M.H. Schoenfisch, Dendrimers as a Scaffold for Nitric Oxide Release. J Am Chem Soc, 2006. 128(25): p. 8265-8271.
184. Taite, L.J. and J.L. West, Poly(ethylene glycol)-lysine dendrimers for targeted delivery of nitric oxide. Journal of Biomaterials Science, Polymer Edition, 2006. 17(10): p. 1159-1172.
185. Taite, L. and J. West, Sustained Delivery of Nitric Oxide from Poly(ethylene glycol) Hydrogels Enhances Endothelialization in a Rat Carotid Balloon Injury Model. Cardiovascular Engineering and Technology, 2011. 2(2): p. 113-123.
186. Zhang, H., et al., Nitric Oxide-Releasing Fumed Silica Particles: Synthesis, Characterization, and Biomedical Application. J Am Chem Soc, 2003. 125(17): p. 5015-5024.
130
187. Ge, Y., et al., In vitro susceptibility to pexiganan of bacteria isolated from infected diabetic foot ulcers. Diagn Microbiol Infect Dis, 1999. 35(1): p. 45-53.
188. Pendsey, S.P., Understanding diabetic foot. International Journal of Diabetes in Developing Countries, 2010. 30(2): p. 75-79.
189. Frykberg, R.G., Diabetic foot ulcers: pathogenesis and management. American Family Physician, 2002. 66(9): p. 1655-1662.
190. McLennan , S.Y., DK Twigg, SM, Molecular Aspects of Wound Healing in Diabetes.
191. Dumville, J.C., et al., Hydrogel dressings for healing diabetic foot ulcers. Cochrane Database Syst Rev, 2011(9): p. CD009101.
192. Yazdanpanah, L., M. Nasiri, and S. Adarvishi, Literature review on the management of diabetic foot ulcer. World Journal of Diabetes, 2015. 6(1): p. 37-53.
193. Hilton, J.R., et al., Wound Dressings in Diabetic Foot Disease. Clinical Infectious Diseases, 2004. 39(Supplement 2): p. S100-S103.
194. Benoiton, N.L., Chemistry Of Peptide Synthesis2006: Taylor & Francis Group.
195. Amblard, M., et al., Methods and protocols of modern solid phase Peptide synthesis. Mol Biotechnol, 2006. 33(3): p. 239-54.
196. Coin, I., M. Beyermann, and M. Bienert, Monitoring solid phase peptide synthesis. 2007.
197. Friedman, M., Applications of the Ninhydrin Reaction for Analysis of Amino Acids, Peptides, and Proteins to Agricultural and Biomedical Sciences. Journal of Agricultural and Food Chemistry, 2004. 52(3): p. 385-406.
198. Moore, S., Amino Acid Analysis: Aqueous Dimethyl Sulfoxide As Solvent for the Ninhydrin Reaction. Journal of Biological Chemistry, 1968. 243(23): p. 6281-6283.
199. Sun, S.-W., et al., Efficiency improvements on ninhydrin method for amino acid quantification. Journal of Food Composition and Analysis, 2006. 19(2–3): p. 112-117.
200. Coneski, P.N. and M.H. Schoenfisch, Nitric oxide release: part III. Measurement and reporting. Chem Soc Rev, 2012. 41(10): p. 3753-8.
201. Wikler, M.A., Clinical, and L.S. Institute, Performance Standards for Antimicrobial Susceptibility Testing: Seventeenth Informational Supplement2007: Clinical and Laboratory Standards Institute.
202. Lareu, R.R., et al., Essential modification of the Sircol Collagen Assay for the accurate quantification of collagen content in complex protein solutions. Acta Biomaterialia, 2010. 6(8): p. 3146-3151.
203. Wiegand, C. and U.-C. Hipler, Methods for the measurement of cell and tissue compatibility including tissue regeneration processes. GMS Krankenhaushygiene Interdisziplinar, 2008. 3(1): p. Doc12.
204. Solomons, T.W.G. and C.B. Fryhle, Organic chemistry. 8th ed2004, Hoboken, NJ: J. Wiley & Sons.
131
205. Deng, H., Nitrite anions induce nitrosative deamination of peptides and proteins. Rapid Communications in Mass Spectrometry, 2006. 20(24): p. 3634-3638.
206. Fuchs, P.C., A.L. Barry, and S.D. Brown, In vitro antimicrobial activity of MSI-78, a magainin analog. Antimicrob Agents Chemother, 1998. 42(5): p. 1213-6.
207. Lee, D.-K., et al., Lipid Composition-Dependent Membrane Fragmentation and Pore-Forming Mechanisms of Membrane Disruption by Pexiganan (MSI-78). Biochemistry, 2013. 52(19): p. 3254-3263.
208. Gurtner, G.C., et al., Wound repair and regeneration. Nature, 2008. 453(7193): p. 314-321.
209. Schäffer, M.R., et al., Inhibition of nitric oxide synthesis in wounds: pharmacology and effect on accumulation of collagen in wounds in mice. The European Journal Of Surgery = Acta Chirurgica, 1999. 165(3): p. 262-267.
210. Bauer, J.A., W. Rao, and D.J. Smith, Evaluation of linear polyethyleneimine/nitric oxide adduct on wound repair: therapy versus toxicity. Wound Repair and Regeneration, 1998. 6(6): p. 569-577.
211. Weller, R. and M.J. Finnen, The effects of topical treatment with acidified nitrite on wound healing in normal and diabetic mice. Nitric Oxide, 2006. 15(4): p. 395-399.
212. Han, G., et al., Nitric Oxide–Releasing Nanoparticles Accelerate Wound Healing by Promoting Fibroblast Migration and Collagen Deposition. Am J Pathol, 2012. 180(4): p. 1465-1473.
213. Schanuel, F.S., et al., Combined nitric oxide-releasing poly(vinyl alcohol) film/F127 hydrogel for accelerating wound healing. Colloids and Surfaces B: Biointerfaces, 2015. 130(0): p. 182-191.
214. Witte, M.B., et al., Enhancement of Fibroblast Collagen Synthesis by Nitric Oxide. Nitric Oxide, 2000. 4(6): p. 572-582.
215. Neidrauer, M., et al., Antimicrobial efficacy and wound-healing property of a topical ointment containing nitric-oxide-loaded zeolites. Journal of Medical Microbiology, 2014. 63(2): p. 203-209.
216. Montes, G.S. and L.C.U. Junqueira, The use of the Picrosirius-polarization method for the study of the biopathology of collagen. Memórias do Instituto Oswaldo Cruz, 1991. 86: p. 1-11.
217. FRANK, S., et al., Nitric oxide triggers enhanced induction of vascular endothelial growth factor expression in cultured keratinocytes (HaCaT) and during cutaneous wound repair. The FASEB Journal, 1999. 13(14): p. 2002-2014.
218. Cobbold, C.A., The role of nitric oxide in the formation of keloid and hypertrophic lesions. Medical Hypotheses, 2001. 57(4): p. 497-502.
219. Park, J.E., et al., Excessive nitric oxide impairs wound collagen accumulation. Journal of Surgical Research, 2013. 183(1): p. 487-492.
220. Distefano, G., et al., Porous Dipeptide Crystals as Polymerization Nanoreactors. Angewandte Chemie International Edition, 2012. 51(37): p. 9258-9262.
132
221. Schairer, D., et al., Nitric oxide nanoparticles: Pre-clinical utility as a therapeutic for intramuscular abscesses. Virulence, 2012. 3(1): p. 62-67.
222. Englander, L. and A. Friedman, Nitric Oxide Nanoparticle Technology: A Novel Antimicrobial Agent in the Context of Current Treatment of Skin and Soft Tissue Infection. The Journal of clinical and aesthetic dermatology, 2010. 3(6): p. 45-50.
223. Barth, A., Infrared spectroscopy of proteins. Biochimica et Biophysica Acta (BBA) - Bioenergetics, 2007. 1767(9): p. 1073-1101.
224. Pretsch, E., Structure determination of organic compounds: Tables of spectral data2000: Springer Berlin Heidelberg.
Top Related