
2015 DEPARTAMENTO DE CIÊNCIAS DA VIDA FACULDADE … · Agradecer, em segundo lugar, ao meu...
71
i DEPARTAMENTO DE CIÊNCIAS DA VIDA FACULDADE DE CIÊNCIAS E TECNOLOGIA UNIVERSIDADE DE COIMBRA Mechanisms and possible function of SIRT3 in mESC Marcelo Filipe Maleiro Ribeiro 2015 Dissertação apresentada à Universidade de Coimbra para cumprimento dos requisitos necessários à obtenção do grau de Mestre em Bioquímica, realizada sob a orientação científica do Professor Doutor João Ramalho- Santos (Universidade de Coimbra).
Transcript of 2015 DEPARTAMENTO DE CIÊNCIAS DA VIDA FACULDADE … · Agradecer, em segundo lugar, ao meu...
i
DEPARTAMENTO DE CIÊNCIAS DA
VIDA FACULDADE DE CIÊNCIAS E TECNOLOGIA
UNIVERSIDADE DE COIMBRA
Mechanisms and possible function of SIRT3
in mESC
Marcelo Filipe Maleiro Ribeiro
2015
2015
Dissertação apresentada à
Universidade de Coimbra para
cumprimento dos requisitos
necessários à obtenção do grau de
Mestre em Bioquímica, realizada
sob a orientação científica do
Professor Doutor João Ramalho-
Santos (Universidade de Coimbra).

ii
“We must understand the Cosmos as it is
and not confuse how it is with how we
wish it to be.”
― Carl Sagan, Cosmos
iii
Agradecimentos
Quero agradecer, em primeiro lugar, ao Professor João Ramalho-Santos, por me ter orientado, por me ter aceitado no seu grupo, e por me ter dado condições para que este ano, altamente educativo, tenha sido possível. Quero agradecer-lhe ainda, por me ter, logo no início, chamado à razão sobre a impraticabilidade de alguns projectos, por ter sido directo, e por me ensinar a distinguir entre o que vale ou não a pena.
Agradecer, em segundo lugar, ao meu homónimo, o Marcelo, porque me ensinou tudo o
que sei, e a quem devo todas as boas práticas, pensamento crítico, e potencial de organizar o meu trabalho. Agradeço-lhe a paciência, o tempo que dispensou comigo, sem nada pedir em troca. Não há palavras que consigam descrever o quão verdadeiramente lhe estou agradecido, por tudo.
À Inês, companheira de aventuras e de temporadas no laboratório, de momentos de cariz
aleatório, por me ter ajudado a tornar fáceis as coisas difíceis, a aprender a dar valor às coisas simples que há no dia-a-dia no laboratório, estou seriamente grato!
Gostava de agradecer também à “malta de stem”, e também a todos os restantes
elementos do grupo, que além de me terem integrado nos seus quotidianos científicos, também deixaram em mim uma pequena marca de quem são. Mesmo não pertencendo ao grupo, não podia deixar de agradecer à Ana Fernandes, que na sua curta permanência no laboratório, fez-me ver que nunca sabemos tudo sobre nada, por muito que achemos que sim.
Aos professores que possam ou não ter hipótese de ler este agradecimento, deixo
também o meu obrigado, porque de um ou outro modo, permitiram que este momento se proporcionasse.
Os meus amigos de sempre, que por escolha própria, pouco vacilando, e sempre
voltando, pelos momentos de alento, e por fazerem tão parte de mim como os meses fazem um calendário, deviam agradecer-me, tal como (mas não tanto) eu lhes agradeço a eles! Assim como aos colegas, os mais novos, os mais velhos, os mais antigos e os mais recentes. Mas mesmo no meio destes irmãos e irmãs de armas existem aqueles que se distinguem, agradeço especialmente aos meus “brothers from other mothers”.
E por fim, mas nunca menos importante, quero agradecer aos meus familiares, o meu
pai, a minha mãe e a minha irmã, pela compreensão, pela paciência, pelo apoio, por tudo o que fizeram, pelo que não fizeram, por tudo o que ainda fazem, e nunca deixarão de fazer.
“Somos o reflexo das pessoas que nos rodeiam.” Obrigado.

iv
Abbreviations
3T3 3 day Transfer, inoculum 3x10⁵ cells AcLys Acetylated Lysine AFP Alpha-fetoprotein ATP / ADP Adenosine Triphosphate; Adenosine Diphosphate BCA Bichonic Acid Bp Base Pair(s) BSA Bovine Serum Albumin cDNA Complementary DNA ddH2O Double Distilled Water DMEM Dulbecco’s Modified Eagle Medium DNA Deoxyribonucleic Acid dsRNA Double-stranded RNA E.coli Escherichia coli EB Embryoid Body ECL Electrochemiluminescence ESC Embryonic Stem Cell ETC Electron Transport Chain FBS Fetal Bovine Serum H1 Histone 1 HDAC Histone Deacetylase Class hESC Human Embryonic Stem Cell HIF Hypoxia-Inducible Factor hiPSC Human induced Pluripotent Stem Cells ICC Immunocytochemistry ICM Inner Cell Mass KD Knockdown KLF-4 Kruppel-like factor 4 KO Knockout KODMEM Knockout DMEM KSR Knockout Serum Replacement LB Lysogeny Broth LIF Leukemia Inhibitory Factor LTR Long Tandem Repeat(s) MEF Mouse Embryonic Fibroblast mESC Mouse Embryonic Stem Cell MMP Mitochondrial Membrane Potential Mn-SOD Manganese Superoxide Dismutase mqH2O Ultrapure Water mRNA Messenger RNA mtDNA Mitochondrial DNA NADH/NAD+ Nicotinamide adenine dinucleotide NANOG Nanog homebox (Tír na nÓg, ancient irish for “Land of Eternal Youth”) NIH-3T3 National Institute of Health – 3T3 cells OCT4 Octamer-binding transcription factor 4 OXPHOS Oxidative phosphorylation PAC Puromycin N-acetyltransferase PAGE Poly-Acrylamide Gel Electrophoresis PBS Phosphate Saline Buffer PDH Pyruvate Dehydrogenase

v
PDHK Pyruvate Dehydrogenase Kinase PFA Para-formaldehyde PVDF Polyvinylidene fluoride qRT-PCR Quantitative, Reverse Transcriptase Polymerase Chain Reaction RNA Ribonucleic Acid ROS Reactive Oxygen Species rRNA Ribosomal RNA Scr Scramble/Scrambled SDS Sodium Dodecyl Sulfate shRNA Short hairpin RNA siRNA Small interference RNA SIRT Sirtuin, Sir-two homologue protein SOC Super Optimum broth with catabolite repression Sox2 Sex determining region Y – box 2 SRB Sulforhodamine B SSEA Stage specific embryonic antigen SV40 Simian vacuolating virus 40 TBS-T Tris-buffered Saline with Tween TOM20 Translocase of outer mitochondrial membrane 20 homolog WB Western Blot WT Wild Type αSMA Alpha-Smooth Muscle Actin

vi
Resumo Isoladas do pluriblasto do blastocisto de murganho, as células estaminais
embrionárias, com a sua capacidade de auto-renovação e de diferenciação em todos os
tecidos adultos, providenciam simultaneamente um excelente modelo de estudo das fases
iniciais do desenvolvimento embrionário, com um potencial papel no campo da medicina
regenerativa. Longe de compreender todos os mecanismos que governam a regulação da
pluripotência e da diferenciação destas células pluripotentes, o metabolismo tem emergido
como uma ferramenta para modular estes intricados processos de desenvolvimento celular.
O paradigma actual em investigação em células estaminais é de que, durante a diferenciação,
alterações metabólicas precedem alterações ao nível genético. Por outro lado, o controlo da
actividade de enzimas relevantes para o metabolismo pode trazer também controlo da
pluripotência de mESC.
A sirtuína 3, principal deacetilase mitocondrial, tem como alvos enzimas do ciclo de
Krebs, a cadeia transportadora de electrões, e da sua actividade advém um aumento da
actividade dessas enzimas. É, por isso, associada á activação do metabolismo mitocondrial.
Por esse motivo, seria interessante saber se a SIRT3 possui um papel na regulação da
pluripotência e/ou diferenciação de mESC.
O silenciamento da expressão de uma proteína providencia um modo de avaliar a
importância dessa mesma proteína numa rede de sinalização ou numa via metabólica.
Enquanto knockouts genéticos são algo difícil de obter, um knockdown de um gene é
relativamente mais fácil de conseguir, enquanto se mantém uma especificidade de alvo que
não é conseguida pelo uso de inibição farmacológica. Estes sistemas de knockdown baseiam-
se na tecnologia de interferência por RNA, um processo que inibe a expressão de uma proteína
ao nível do transcriptoma. Para conseguir este silenciamento, introduzimos um siRNA, tendo
como alvo a sequência de mRNA da proteína de interesse.
Deste modo, pretendemos realizar o silenciamento da SIRT3, em mESC, através do uso
de um shRNA que tem como alvo o mRNA da SIRT3. Como o propósito deste ensaio é realizar
um silenciamento estável, utilizámos um plasmídeo que expressa o supracitado shRNA,
incorporado pelas células estaminais por lipofecção. Assim, neste trabalho, pretendeu-se
estabelecer um protocolo de silenciamento de uma proteína, com recurso à transfecção de
um plasmídeo que expressa um shRNA que tem como alvo a SIRT3.
Os resultados mostram que a transfecção de mESC não é tão simples e directa como
previsto, e não pudemos obter uma cultura principalmente composta por células E14Tg2.a
transfectadas. No entanto, conseguimos transfectar fibroblastos embriónicos de murganho
(NIH-3T3) e ainda obtivemos uma cultura enriquecida em células transfectadas. Apesar disto,
o silenciamento de SIRT3 não foi claro, e portanto, a avaliação deste silenciamento deve ser
repetida.
Palavras-chave: Células estaminais embrionárias de murganho; metabolismo; Sirtuína3;
interferência de RNA; Lipofecção.
vii
Abstract
First derived from the inner cell mass of the mouse blastocyst, Embryonic Stem Cells,
with their capability of self-renewal and of differentiation in all adult tissues, simultaneously
provide an excellent model for studying early development and can play a role in regenerative
medicine. Far from understanding all the mechanisms that rule the regulation of pluripotency
and differentiation of these pluripotent cells, metabolism has emerged as a tool to modulate
these intricate cell development processes. The current paradigm in stem cell research is that,
during differentiation, metabolic alterations precede changes in gene expression, and also,
that through the control of the activity of certain, metabolically relevant enzymes, one can
modify the “stemness” of mESC.
SIRT3, regarded as the main mitochondrial deacetylase, targets metabolic enzymes belonging to the Krebs’ Cycle and also the Electron Transport Chain, and its deacetylating activity promotes the activity of these enzymes. It is then associated with the activation of the mitochondrial metabolism. Therefore, we took interest in whether there is role of SIRT3 in the regulation of pluripotency and differentiation of mESC.
Protein silencing provides a means of assaying the importance of a given protein to
signaling network or a metabolic pathway. While specific genetic knockouts are rather difficult
to obtain, a gene knockdown is relatively easier to obtain while maintaining a specificity
degree that can’t be achieved through pharmacological inhibition. These knockdown systems
are often based on RNA interference, a process by which the cell inhibits gene expression on
the transcriptome level.
Here, we expected to silence the expression of SIRT3 in mESC by using a SIRT3 mRNA-
targeting shRNA. As we aim for a relatively stable protein knockdown, we used shRNA
expressing plasmids that were incorporated in mESC by Lipofection (a form of transfection).
Thus, in this work, we aimed to establish a protein silencing protocol, with a SIRT3 shRNA-
encoding plasmid, previously transfected into the targeted cells.
Results show that mESC are not as easy to transfect and select as previously reported,
as we were not able to obtain a culture majorly composed of transfected E14Tg2.a cells.
Nonetheless, we successfully transfected mouse embryonic fibroblasts (NIH-3T3), and
obtained an enriched culture in transfected cells. Even so, the SIRT3 silencing rate was not
clear, and further evaluation of this silencing should be performed.
Keywords: mouse Embryonic Stem Cells; metabolism; Sirtuin3; RNA interference; Lipofection
viii
TABLE OF CONTENTS
1 Introduction .................................................................................................................................... 1
1.1 mESC ........................................................................................................................................ 1
1.1.1 Historical context ............................................................................................................ 1
1.1.2 Characterization of mouse ESC (mESC) ........................................................................... 2
1.1.3 Potential uses of stem cells ............................................................................................. 4
1.1.4 Metabolism: Warburg-like effect & Metabolic Shift ....................................................... 5
1.2 Modulation of Metabolism and Pluripotency ......................................................................... 6
1.3 SIRTUINS .................................................................................................................................. 8
1.4 Silencing Mechanistic .............................................................................................................. 9
2 Objectives ...................................................................................................................................... 11
3 Methods ........................................................................................................................................ 11
3.1 Tasks ...................................................................................................................................... 11
3.1.1 Task #1 – Cell culture..................................................................................................... 11
3.1.2 Task #2 – Plasmid choice, preparation and Lipofectamine® transfection .................... 12
3.1.3 Task #3 – Assay for knockdown effectiveness and stability .......................................... 14
3.2 Cell lines, cell culture and differentiation ............................................................................. 15
3.3 E.coli transformation; plasmid amplification, isolation and analysis .................................... 16
3.4 Selection conditions .............................................................................................................. 17
3.4.1 Antibiotic Concentration ............................................................................................... 17
3.4.2 Sulforhodamine B (SRB) colorimetric assay .................................................................. 17
3.4.3 Cell counting .................................................................................................................. 18
3.5 Transfection........................................................................................................................... 19
3.6 Flow-cytometry ..................................................................................................................... 19
3.7 RNA ........................................................................................................................................ 20
3.7.1 RNA isolation ................................................................................................................. 20
3.7.2 DNA cleanup, quantification and first strand cDNA synthesis ...................................... 20
3.7.3 qRT-PCR ......................................................................................................................... 21
3.8 Protein Expression Analysis ................................................................................................... 22
3.8.1 Immunocytochemistry .................................................................................................. 22
3.8.2 Western Blot ................................................................................................................. 23
4 Results and Discussion .................................................................................................................. 27
4.1 mESC Culturing ...................................................................................................................... 27
4.1.1 Pluripotency in mouse Embryonic Stem Cells ............................................................... 27
4.1.2 Differentiation of mESC ................................................................................................. 30
ix
4.2 Molecular Biology: Plasmid Characterization, Bacterial Culture and DNA
amplification/Isolation ...................................................................................................................... 36
4.2.1 Plasmid elements and description ................................................................................ 36
4.2.2 Bacterial transformation ............................................................................................... 38
4.2.3 DNA isolation, quantification, characterization ............................................................ 40
4.3 SIRT3 Silencing in mESC ......................................................................................................... 42
4.3.1 mESC selection conditions (SRB and cell counting) ...................................................... 42
4.3.2 Transfection protocol and optimization (DNA:Lipofectamine ratios, incubation times)
43
4.4 SIRT3 Silencing in a differentiated cell line: 3T3 ................................................................... 45
4.4.1 3T3 cell line culturing .................................................................................................... 46
4.4.2 Selection conditions (SRB) ............................................................................................. 47
4.4.3 Transfection & selection efficiency ............................................................................... 47
4.4.4 Cytometry analysis of Transfected/Non-Transfected cells ........................................... 49
4.4.5 Evaluating SIRT3 silencing ............................................................................................. 50
4.4.6 Individual shRNA transfection ....................................................................................... 53
5 Conclusion and final remarks ........................................................................................................ 56
6 References ..................................................................................................................................... 57

1
1 INTRODUCTION
1.1 MESC
1.1.1 Historical context
Embryonic Stem Cells (ESCs) are derived from the inner cell mass (ICM) of the blastocyst
and were first identified in 1981 by Martin Evans, Matthew Kaufman (Evans and Kaufman,
1981) and Gail R. Martin (Martin, 1981), from mouse embryos.
As seen in Figure 1, ESCs have two main features: the ability to continuously self-renew
(maintaining their pools by symmetric division) and the capacity to differentiate into cells from
the three germ lineages (endo, meso and ecotderm). During this process cells change size,
shape, and responsiveness to outer and internal signaling, and alter gene expression, in order
to perform specific biological roles.
Figure 1 – Derivation of embryonic stem cells (ESCs) from the ICM of the Blastocyst, and schematic differentiation and self-
renewal capabilities. Image acquired from https://www.umassmed.edu/iscr/stemcellfacts.aspx, accessed in 28/07/2014)
Firstly appeared to describe an evolutionary, “family”-like relationship by using a
phylogenetic tree, the term “stem cell” was coined in the late 19th century by the German
biologist Ernst Haeckel (Haeckel, 1879), who employed the term “stembäume” for these
phylogenetic trees – family trees, or stem trees, as was adapted to English. Thus, he chose the
term “stammzelle’’, German for Stem cell, to address an unicellular organism ancestor from
all the other organisms originated. Later, in 1892, Theodor Boveri used the term stem cell with
the same “family lineage” purpose in mind (Ramalho-Santos and Willenbring, 2007). Again, in
the beginning of the 20th century, the term was once more used by Alexander Maximow, in
his Unitarian theory of Hematopoiesis (Maximow, 2009), where the stem cells were described
to be the undifferentiated hematopoietic progenitors, that were “neither red nor white blood
corpuscles”. But only during the 1960’s the term resurfaced, when proof of adult neurogenesis
in the brain pointed to the existence of stem cells (Altman and Das, 1967). In the late 1970’s

2
it was established that stem cells were capable to support bone marrow transplants, a practice
that is commonly employed today (Peister et al., 2004).
1.1.2 Characterization of mouse ESC (mESC)
Along with their ability to generate all three germ layers, ESCs are characterized by the
increased expression of “core pluripotency markers”: Oct4, Sox2 and Nanog (Hanna et al.,
2010). These factors form a hierarchical pluripotency core network signaling that converges
towards activation of self-renewal and pluripotency through Oct4, while exhibiting a strong
self-regulation mechanism (Kim et al., 2008). As cells differentiate there is a loss of this
network signaling and the levels of the aforementioned factors decreases over time. This is
common to both human ESC (hESC) and mESC. This network can be stimulated exogenously,
in order to maintain pluripotency of these cells while in culture. Leukemia inhibitory factor
(LIF, an interleukin 6-class cytokine) is reported to keep the pluripotent phenotype of mESC
mainly through activation of the Jak2/Stat3 signaling pathway, which culminates in an
increased expression of Oct4. Nonetheless, LIF acts through other pathways culminating with
the same effect. Figure 2 shows two alternative pathways by which LIF regulates pluripotency:
1) through PI(3)K-Akt axis, increasing the expression of Tbx3 which will, in turn, strengthen the
expression of the pluripotency core factors (Storm et al., 2007); and 2) also through mitogen-
activated protein kinase (MAPK). Incidentally, LIF-mediated activation of MAPK culminates in
the inhibition of Tbx3 expression and thus, weakening pluripotency (Ying et al., 2008). Other
works supporting this notion have demonstrated that inhibition of MAPK increases
pluripotency of mESC (Wray et al., 2011). Alkaline phosphatase staining is regarded as a simple
assay to access pluripotency, as ESCs express high levels of this enzyme, constituting therefore
as another marker for pluripotency (Singh et al., 2012), that can be easily performed routinely
to evaluate pluripotency in culture. Other surface markers for mESC include E-cadherin, CD
133 (prominin-1), Integrin β-1; Epithelial cell adhesion molecule (EpCAM), and stage-specific
embryonic antigen (SSEA) 3. (Zhao et al., 2012).

3
Figure 2 - LIF signals through both Jak/Stat and Akt pathways to stimulate the core pluripotency network and assure the pluripotent phenotype and self-renewal, in mESC.(Niwa et al., 2009)
mESCs are morphologically distinguishable from their differentiated counterparts.
Cultured pluripotent colonies are characterized by their round and compact morphology,
growing not only in width but also in height; high optical refringence (brilliant, white borders);
and a high nucleus/cytoplasm volume ratio. As these colonies start the differentiation process
and lose their pluripotent phenotype, cells tend to spread away from the center of the colony,
increasing their size (cells can be visually distinguished with the proper magnification), and
decreasing refringence. An example of two very different mESC cultures can be seen in Figure
3. Figure 3A shows colonies with good size and morphology, and are ready to be passaged. In
Figure 3B, although the pluripotent phenotype is still perceivable in some of the colonies, most
of the colonies begun the differentiation process. Strict monitoring of the culture’s pluripotent
state is essential for its maintenance in culture, as well as confluence (higher or very low
confluences may impact pluripotency).
Figure 3 - Pluripotent E14 mESC culture in KODMEM medium. (A) – E14 culture, at day 3, with good morphology; (B) E14 culture at day 3 with poor pluripotent morphology.
(B) (A)
4
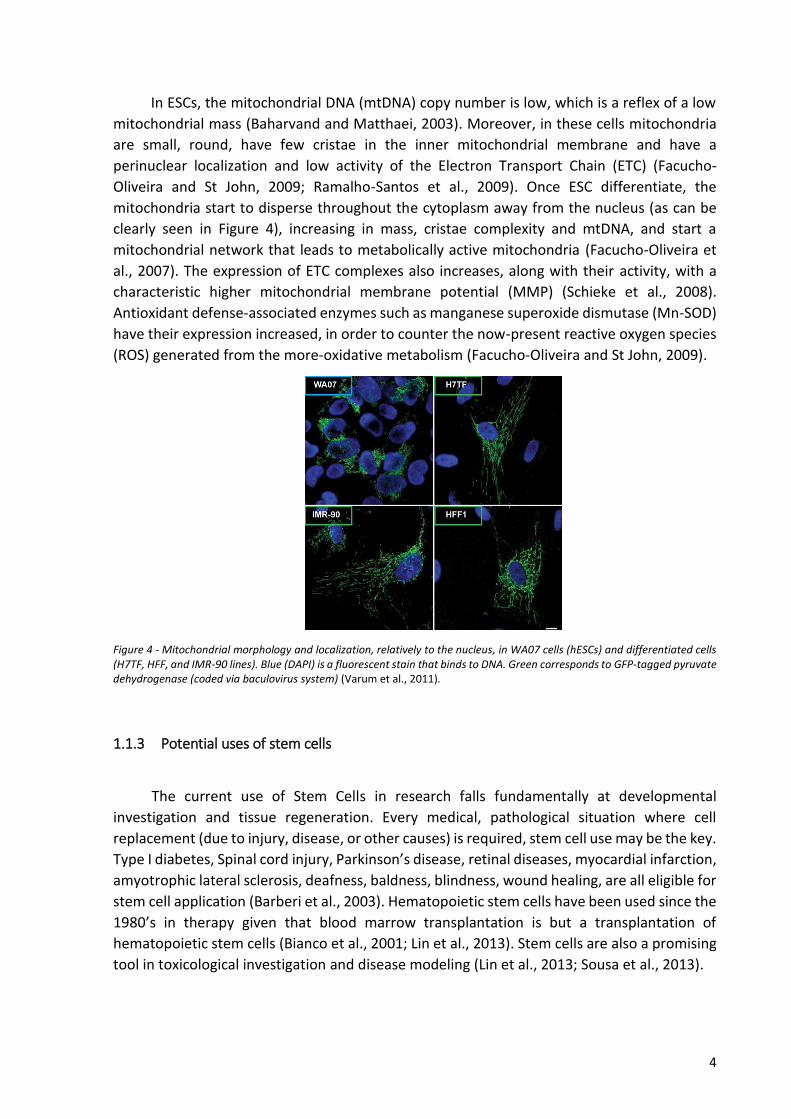
In ESCs, the mitochondrial DNA (mtDNA) copy number is low, which is a reflex of a low
mitochondrial mass (Baharvand and Matthaei, 2003). Moreover, in these cells mitochondria
are small, round, have few cristae in the inner mitochondrial membrane and have a
perinuclear localization and low activity of the Electron Transport Chain (ETC) (Facucho-
Oliveira and St John, 2009; Ramalho-Santos et al., 2009). Once ESC differentiate, the
mitochondria start to disperse throughout the cytoplasm away from the nucleus (as can be
clearly seen in Figure 4), increasing in mass, cristae complexity and mtDNA, and start a
mitochondrial network that leads to metabolically active mitochondria (Facucho-Oliveira et
al., 2007). The expression of ETC complexes also increases, along with their activity, with a
characteristic higher mitochondrial membrane potential (MMP) (Schieke et al., 2008).
Antioxidant defense-associated enzymes such as manganese superoxide dismutase (Mn-SOD)
have their expression increased, in order to counter the now-present reactive oxygen species
(ROS) generated from the more-oxidative metabolism (Facucho-Oliveira and St John, 2009).
Figure 4 - Mitochondrial morphology and localization, relatively to the nucleus, in WA07 cells (hESCs) and differentiated cells (H7TF, HFF, and IMR-90 lines). Blue (DAPI) is a fluorescent stain that binds to DNA. Green corresponds to GFP-tagged pyruvate dehydrogenase (coded via baculovirus system) (Varum et al., 2011).
1.1.3 Potential uses of stem cells
The current use of Stem Cells in research falls fundamentally at developmental
investigation and tissue regeneration. Every medical, pathological situation where cell
replacement (due to injury, disease, or other causes) is required, stem cell use may be the key.
Type I diabetes, Spinal cord injury, Parkinson’s disease, retinal diseases, myocardial infarction,
amyotrophic lateral sclerosis, deafness, baldness, blindness, wound healing, are all eligible for
stem cell application (Barberi et al., 2003). Hematopoietic stem cells have been used since the
1980’s in therapy given that blood marrow transplantation is but a transplantation of
hematopoietic stem cells (Bianco et al., 2001; Lin et al., 2013). Stem cells are also a promising
tool in toxicological investigation and disease modeling (Lin et al., 2013; Sousa et al., 2013).
5
Another field where stem cells are involved is cancer research: stem cells, in their
pluripotent state, resemble carcinogenic cells in terms of their metabolism, growth rate,
migration and signaling pathways. Many scientific aspects, described decades ago and that
apply to cancer cells, also apply for stem cells(Martin, 1981). The term “Warburg effect”,
which addressed the metabolism of cancer cells, coined in 1956, is being now applied for both
cancer and ESC alike (Upadhyay et al., 2013; Warburg, 1956). So, whatever we may be able
to learn from one field, may be transposed to the other.
1.1.4 Metabolism: Warburg-like effect & Metabolic Shift
Along with self-renewal and pluripotency, ESCs should be also noted by their
characteristic metabolism. ESCs use glycolysis as their primary source of energy and
biosynthetic building blocks, in contrast with differentiated cells, who rely more on the Krebs’
Cycle and Oxidative Phosphorylation (OXPHOS) for the same purpose (Pereira et al., 2014).
Each pathway requires different enzymatic machinery. Krebs’ Cycle shows increased energetic
efficiency, complexity, need for oxygen availability, but decreased kinetics. Due to the
elevated proliferation and hypoxic niche location in the ICM, in vivo, ESCs require a high
demand of energy and biomolecules (that should be quickly available) in order to support their
proliferation, and thus, ESCs favor glycolysis over oxidative metabolism (Stanley et al., 2013).
The Warburg effect, first described by Otto Heinrich Warburg in 1956, reflects the high aerobic
glycolysis by malignant tumors even in the presence of oxygen, and this Warburg-like effect
in ESCs disappears over the course of differentiation, suggesting that a metabolic shift occurs
somewhere along the process. This metabolic shift, requires a reshaping in many cellular
aspects, such as mitochondrial morphology and subsequent activity, gene expression,
antioxidant defenses, and metabolic reprograming (by activation of mitochondrial
metabolism, namely Krebs’ Cycle, OXPHOS and the intermediary metabolism (displayed in
Figure 5) (Pereira et al., 2014)) precedes alteration of genomic expression (Chen et al., 2012;
Cho et al., 2006; Folmes et al., 2011a, 2012; Varum et al., 2011). Recent studies revealed that
stem cell metabolism might be a tool for comprehension and fine tuning of differentiation
(Chen et al., 2012; Chung and Dzeja, 2007; Folmes et al., 2011a, 2012, 2011b; Grayson and
Zhao, 2006; Pattappa et al., 2011; Pereira et al., 2013, 2014; Rafalski et al., 2012; Ramalho-
Santos et al., 2009; Robinson et al., 1997; Signer and Morrison, 2013; Simsek et al., 2010;
Sousa et al., 2013; Suda et al., 2011; Varum et al., 2011; Weisbart and Kwan, 1987; Yanes et
al., 2010; Yoshida et al., 2009). By controlling the metabolic conditions of the medium, such
as oxygen availability, forcing the expression of certain genes, such as HIF1-α (Mathieu et al.,
2014), or even by inhibiting enzymes that are crucial for key metabolic pathways, stem cell
pluripotency /differentiation might be modulated. It has been shown by our group that
inhibition of normal mitochondrial metabolism (namely through inhibition of Complex III of
the ETC) can block mESC neuronal differentiation (Pereira et al., 2013). Moreover, blocking
Complex III of the ETC can enhance the pluripotent phenotype in hESC (Varum et al., 2009).
Also, inhibiting PDHK (and thus increasing PDH activity) would favor differentiation in mESC

6
(Rodrigues et al., 2015). Regulation of both human and mouse ESCs metabolism seems to be
linked to their pluripotency and differentiation capacities.
Figure 5 - Primary pathways of glucose metabolism. Both glycolysis, Krebs’ cycle, the pentose-phosphate pathway (PPP) and
biosynthetic mechanisms are presented. (Pereira et al., 2014)
1.2 MODULATION OF METABOLISM AND PLURIPOTENCY
The metabolic remodeling that mESC undergo when they differentiate implicate two
distinct metabolic profiles. This point is summarized in Figure 6. In this section, I will show
evidence of metabolic changes during differentiation, and just how this process may even
precede changes in genetic expression.

7
Figure 6 - The metabolic regulation and mitochondrial changes in the maintenance of self-renewal capability and induction of differentiation of different types of stem cells. Adapted from Chen et al. 2012.
There are different metabolic statuses in mESCs, and differentiated cells (MEFs) have
been reported, summarized in Figure 6. In order to assay their metabolic profile, lactate and
acetate production (by-products of the glycolytic pathway) was measured, as well as the
energetic ratio of ADP/ATP, and values of oxygen consumption (which determine the degree
of oxidative metabolism), demonstrating that mouse iPSC and mESC show higher
concentrations of these metabolites than their more differentiated counterparts, MEFs
(Folmes et al., 2011b). Other works saw similar results regarding hESC and hiPSC vs somatic
cells (Varum et al., 2011).
Knowing that the metabolic profile is different for each type of cell, and that the aerobic
metabolism requires mitochondrial activity, this analysis of the mitochondrial membrane
potential of ESC vs MEFs concludes that stem and stem-like cells present higher values of
MMP, while differentiated MEFs showed low MMP, as visible in Figure 7, reflecting changes
towards a mature and metabolically active organelle (Schieke et al., 2008).
Figure 7 - Live mitochondrial membrane potential (MMP) obtained via TMRM fluorescence. (Folmes et al. 2011)

8
Further characterization of this change in metabolism, focusing in genetic adaptations,
revealed that expression of glycolytic enzymes precedes the expression of pluripotency
markers, leading to the conclusion that metabolic adaptations occur before the cell can
change its potency degree (Folmes et al., 2012). Again, this pattern was also verified in
comparison studies in hESC/iPSCs and differentiated cells (Varum et al., 2011).
1.3 SIRTUINS
Sir-two homologue proteins – Sirtuins (SIRT) are NAD+-dependent lysine deacetylases.
Homologues to Sir-two (first described in yeast), they are considered part of the Histone
Deacetylase (HDAC) class I family. Although Sirtuins possess the ability to deacetylate
histones, that does not seem to be their only role (Imai et al., 2000). There are seven known
mammalian Sirtuins, with varying roles and sub-cellular localizations. Sirtuins 6 and 7 are
present in the nucleus, while Sirtuin 1 and 2 allocate both in the cytoplasm and nucleus alike.
The last three Sirtuins (3, 4 and 5) take residence in the mitochondrion (Finkel et al., 2009;
Haigis and Guarente, 2006).
Apart from Sirtuins 6 and 4 (which have the activity of ADP-ribosyl-transferase), the
primary role of sirtuins is deacetylation, the removal of an acetyl group from a target protein
or other molecule. This reaction is dependent on NAD+ (Imai et al., 2000), and for this reason,
sirtuins can act as a metabolic and redox sensor, as their activity is sensitive to the cell
NAD+/NADH ratio (Abdel Khalek et al., 2014).
Some studies have tried to bridge sirtuins and pluripotency/differentiation in ESC, via
their histone deacetylation activity, as well as deacetylation of other proteins (Rodriguez et
al., 2013). SIRT1 has been implicated in histone deacetylation, as the sirtuin with the highest
histone-deacetylation capability. SIRT1 KO mice die either in late stages of development or
shortly after birth (Cheng et al., 2003). By deacetylating their respective histones, SIRT1
deactivates and thus suppresses neuronal development-related genes (Calvanese et al.,
2010). Concomitantly, inhibition of SIRT1 seems to promote differentiation of mouse iPSC in
neuronal stem cells (Hu et al., 2014). Also, SIRT1 appears to also be relevant in a pluripotency
context by deacetylating elements of the FOXO-family (Brunet, 2004), and p53 (Langley,
2002), mitigating their activity, which may facilitate differentiation (Gonzales and Ng, 2011; Li
et al., 2012).
Some studies hint that the cytoplasmic sirtuin SIRT2 may influence neuronal
differentiation through targeting the α-tubulin subunit of microtubules (Southwood et al.,
2007). Other sirtuins have yet to be definitively linked to differentiation and/or pluripotency
of ESC.
Sir-two homologue protein 3 – Sirtuin 3 (SIRT3) is a NAD-dependent lysine deacetylase.
Of the seven known Sirtuins, SIRT3 has been shown to be predominantly at the mitochondria,
where it regulates mitochondrial acetylation profiles. There are two other sirtuins in this
organelle, SIRT4 and SIRT5, but it is believed that SIRT3 is responsible for 90% of total

9
mitochondrial deacetylation (Brown et al., 2013). SIRT3 activates the global mitochondrial
metabolism by deacetylating key proteins in different metabolic pathways, namely in the
Krebs cycle (Acetyl-CoA sintetase, Isocitrate Dehydrogenase 2, and Succinate Dehydrogenase,
Succinate Dehydrogenase and Complex I), and also Antioxidant defense (Mn-SOD2).
Therefore, SIRT3’s primary action is the activation of mitochondrial metabolism. Along with
these well-established roles, SIRT3 has been shown to regulate metabolic shift in cancer, as
well as inducing proliferation of cancer stem cells. One study determined that SIRT3 appears
to be necessary for in vitro differentiation of brown adipocytes, from HIB1B pre-adipocytes
(Shi et al., 2005). Incidentally, SIRT3 is mostly expressed in brown adipose tissue, in adulthood.
Thus, it would be of interest to assay if SIRT3 could have similar effects on mESC.
It is relevant to report that there are SIRT3 knockout systems available, with both SIRT3 KO cells and mice being commercialized. Studies performed on these systems show that both present overall similar phenotypes to their wild-type counterparts, the only difference residing in metabolic pathologies due to mitochondrial dysfunction (changes in ACeCS2, ATP levels and mitochondrial protein acetylation, deficient oxidative stress defenses) in older, KO mice model.
1.4 SILENCING MECHANISTIC
There are different methods for silencing or suppressing a protein or its activity.
Pharmacological inhibition is perhaps the first obvious tool to achieve this purpose. However,
there are other more specific and effective methods for this purpose, notably involving genetic
silencing, which considers both genetic knockout (gene KO, genetic information is deleted
from the organism’s genome, resulting in complete suppression of a protein) and knockdown
(protein expression levels are diminished, usually by interfering with either DNA transcription,
or mRNA stability/translation). Genetic knockdown (KD) is regularly achieved through the use
of RNA interference (RNAi). RNAi consists in the use of small RNA nucleotides with sequences
specific for an mRNA coding the protein of interest. There are several classes of interfering
RNA molecules, namely shRNA (short-hairpin RNA), dsRNA (double-stranded RNA, avoided as
it may activate interferon I pathway (Lambeth and Smith, 2013)), or siRNA (small interfering
RNA). There is another RNAi system in the cell, which is natively used as part of its protein
expression regulation, miRNA (microRNA). All of these interfering RNAs have similar
mechanisms, in spite of slight differences between them, as their source or processing
enzymes (Fellmann and Lowe, 2014).
After being transcribed from the transfected DNA sequence, shRNA is processed by
Dicer (an endoribonuclease (RNAse III family), typically expressed by cells for their own native
RNA-interference processes), giving rise to a siRNA (double stranded, with an anti-sense
strand and a sense strand). siRNA binds to RISC (Ameres et al., 2007) (RNA-interference
silencing complex), being the antisense strand used to recognize the target mRNA (the sense
strand), and bind to it, as shown in Figure 8. Perfect binding to sequences result in cleavage
and degradation of target mRNAs, whereas imperfect binding, commonly seen with miRNAs,

10
results in translational repression (Fellmann and Lowe, 2014). Both these effects are managed
through the catalytic component of RISC, the Argonaute protein group (Ameres et al., 2007).
Figure 8 - Mechanism of shRNA silencing action. Pol II: RNA polymerase II. Ago: Argonaute protein. RISC: RNA-interference Silencing Complex. Adapted from: (Fellmann and Lowe, 2014)
Some of the advantages of shRNA KD over other silencing techniques include its
relatively stable expression (compared to direct siRNA transfection, but still not as stable as
when virus are employed), the fact that DNA delivery methodologies are well established, it
is cost-effective advantageous for long-term experiments (cheaper than KO models), and
provides an elegant solution for silencing proteins that may be crucial for the cell’s regulation,
in which a KO would result in immediate cellular death (Wittmann, 2006). The greatest
advantage for this type of silencing is its adaptability for the target: having established a
silencing protocol in a certain cell line, we can virtually silence any protein as long as a specific
shRNA-containing plasmid is available. Therefore we aimed to introduce and optimize this
method in our laboratory in order to be available as a tool to understand pluripotency and
differentiation mechanisms of ESCs.

11
2 OBJECTIVES
The primary objective of this work was to establish a silencing protocol, via
genetic knockdown in mouse Embryonic Stem Cells. This method was established by
targeting a mitochondrial protein, Sirtuin3, with capacity for metabolism modulation,
by transfection of a shRNA-expressing plasmid, ending with an evaluation of the
knockdown level of the said protein.
3 METHODS
3.1 TASKS
3.1.1 Task #1 – Cell culture
The first task involved learning how to culture and maintain a mES cell line, E14Tg2.a, in
which part of the study was performed. The prominence of this task is justified by its own
complexity: mESCs culture requires a great amount of experience and awareness during their
maintenance, as they are particularly sensitive to different stress stimuli, such as temperature,
pH, nutrient availability, as well as various other different (toxic) molecules that can
accumulate in the culture medium due to both normal cell metabolism and cell death, which
can lead to its unwanted spontaneous differentiation.
An example of mESCs co-cultured with mouse embryonic fibroblasts (MEFs) can be seen
in Figure 9. It should be noted that some cells are starting to leave its most pluripotent state
(red arrows) relatively to blue-arrowed colonies (stronger pluripotent phenotype from the
morphological point of view). In this figure it can be seen how heterogeneous a mES cell
culture can be. It is possible that, in a good stem cell culture, up to 10% differentiation levels
can be seen as acceptable. Pluripotent colonies are characterized by their round morphology,
high optical refringence (brilliant, white borders), and small cell size. As these colonies start
the differentiation process and lose their pluripotent phenotype, cells tend to spread away
from the center of the colony, increasing their size, and decreasing refringence. Strict
monitoring of the culture’s pluripotent state is essential in the process of its maintenance, as
well as confluence (higher or very low confluences may lead to spontaneous differentiation).

12
Unlike mES R1 cells, E14Tg2.a cells do not require MEFs in order to proliferate and
maintain pluripotency (Ward et al., 2004), and thus were be cultured in (0.1%) gelatin coated
dishes, yielding cultures very much like those of Figure 3. Cells were be kept undifferentiated
by adding Leukemia inhibitory factor (LIF) (1000 U / ml), as LIF integrates signals into mESC to
maintain pluripotency (Niwa et al., 2009).
3.1.2 Task #2 – Plasmid choice, preparation and Lipofectamine® transfection
SIRT3 activates the global mitochondrial metabolism by deacetylating key proteins in
different metabolic pathways in the mitochondria, and previous studies determined that
SIRT3 appears to be necessary for in vitro differentiation of brown adipocytes (Giralt et al.,
2011; Shi et al., 2005), it would be valuable to assay if SIRT3 could have similar effects on
mESC.
In spite of the availability of a SIRT3 inhibiting drug, 4-hydroxynonenal (4-HNE), its
inhibiting effect is not specific towards SIRT3, inhibiting other deacetylases and having targets
beyond Sirtuins. Therefore, this pharmacological approach is unadvisable if SIRT3-specific
silencing is desired. Additionally, the possible inhibitory effect of 4-HNE on SIRT3 was already
tested in our laboratory, and no effect was seen, at least regarding mESC E14. Thereby, in this
project we attempted to use a different and hopefully better solution to study the effects of
SIRT3 on mESCs.
A group of four shRNA expressing plasmids (against different regions of SIRT3’s mRNA,
Genecopeia™ #MSH032833-LVRH1MP) was chosen for our silencing protocol. Cells will be
grown in a puromycin containing medium. As each plasmid contains a puromycin resistance
gene (antibiotic selection marker), only transfected cells will be able to survive and form
Figure 9 - Phase contrast microscopy of a mES R1 cell line co-cultured with MEFs. Examples of mESC colonies marked with blue arrows, a colony losing its pluripotent phenotype with reds arrows and MEF with green arrows.

13
colonies. These plasmids also contain a fluorescent reporter gene, which allows us to directly
monitor the plasmid’s presence in the cells. Taken together, these elements aim to provide an
effective RNA interference and knockdown of SIRT3’s levels. This plasmid contemplates the
possibility of genomic integration of the shRNA coding region via HIV infection, providing an
alternative way of transfecting the cells. The use of shRNA is favored over siRNA and dsRNA
as it mimics the endogenous miRNA pathway, therefore it is significantly more efficient,
assures increased knockdown stability, and mitigates a possible activation of interferon I
pathways. Moreover, DNA handling and delivery methods are easier and well established in
literature for mESC. Nonetheless, shRNA technologies are not devoid of disadvantages, as they
require either a frequent re-acquisition of the plasmids, or expansion of plasmids in bacteria,
and thus, conditions to work and manipulate bacteria.
Plasmids were expanded in E.coli and transfected in mESC using lipofectamine-mediated
transfection. This method takes advantage of the interaction between the positive charges of
lipofectamine and the negative charges of the plasmidic DNA. The resulting complex is then
internalized into the cell. The choice of this transfection protocol above others of the kind
(electroporation, heat shock) is due to the reported efficiency for the stem cell line E14Tg2.a
(Christophorou et al., 2014).
Figure 10 - Transfection protocol for Lipofectamine® mediated transfection. (Lipofectamine® 2000 DNA Transfection Reagent Protocol)
E14Tg2.a cells were transfected in the third day after passaging, using the Lipofectamine
2000® (Invitrogen™) reagent as described in the manufacturer’s protocol (Invitrogen(tm) by

14
life technologies, 2000), shown in Figure 10, and later with Lipofectamine® 3000, using a
similar protocol.
3.1.3 Task #3 – Assay for knockdown effectiveness and stability
In order to assay knockdown effectiveness and stability, both Western Blot and qRT-PCR
were employed.
Quantitative Reverse-Transcription Polymerase Chain Reaction (qRT-PCR), which allows
us to measure the expression and the existing amount of a given mRNA strand, by using the
appropriate primers, was applied to conclude about the levels of SIRT3’s coding mRNA in the
cell. Nonetheless, taking into account that shRNA silencing can culminate with both the
degradation of the target mRNA or solely the repression of its translation by rRNA (the
multitude of effects is dependent of the Argonaute protein present in the catalytic domain of
the RISC complex), SIRT3 mRNA levels may or may not be significantly different between KD
and control cases.
After collecting the total protein contents of transfected cell cultures, SIRT3 levels were
be measured by Western Blot.
In order to perform the two aforementioned techniques, both the protein and mRNA
contents of cultured cells were collected. In case of a successful SIRT3 knockdown, the same
protein and mRNA samples would be used to measure the expression of pluripotency markers
such as Nanog and Oct4, thus allowing to infer on how SIRT3 may or may not affect
pluripotency, and also differentiation.
Being a lysine deacetylase responsible for the acetylation of 90% of mitochondrial
proteins (Lombard et al., 2007), and taking into account that SIRT3 primarily operates in this
organelle, SIRT3 KD cells should reveal increased acetylation in their mitochondrial proteins.
This measurement was possible by using an antibody against Acetylated lysine (a measure of
activity), by Western Blot analysis.
15
3.2 CELL LINES, CELL CULTURE AND DIFFERENTIATION
E14Tg2.a mES cell line was chosen to perform all ESC assays. mESCs were cultured in
0.1% gelatin-coated dishes, with the denominated “KODMEM medium” consisting in
Knockout™ Dulbecco modified Eagle medium (Gibco #10829-018) supplemented with 15%
Knockout Serum Replacement (KSR; Gibco #10828-028), 1000 U/mL LIF (Merckmillipore
#ESG1107), 100U/mL penicillin, 100 µg/mL streptomycin (Gibco #151910-122), 2 mM L-
Glutamine (Gibco #25030-024), 0.1 mM non-essential amino acids (Sigma #M7145), and 0.1
mM β-mercaptoethanol (Sigma M17522-100mL) at 37°C / 5% CO2. Media was replaced daily,
and cells passaged every 2 to 3 days, with a density of 6000 cells/ cm2. StemPro® Accutase®
(Gibco #A1110501) was used as dissociation agent. Briefly, old culture medium was removed,
and the cells were then rinsed with warm PBS, and accutase was added. After a 5 minutes
incubation at 37°C, new, warm culture medium was added to inactivate the enzyme, and cells
were collected into a 15mL conical tube. Then, cells were centrifuged at 200g for 5 minutes at
room temperature. Supernatant was discarded, and the cells were then resuspended in
KODMEM. Cells were then counted as described in section 3.4.3, and the appropriate volume
containing the wanted cell number was plated in a new, gelatin coated dish with warm
KODMEM.
Non-directed differentiation into embryoid bodies (EBs) was made using E14Tg2.a cells.
This differentiation was conducted to assay changes in the expression of both pluripotency
and differentiation markers. Therefore, 106 cells were plated in non-adherent 60mm dishes
with 5 mL KODMEM medium. Cells were then incubated for 3 days at 37°C and 5%CO2, while
replacing the culture medium daily. At the third day, EBs were plated in 100mm tissue-culture
dishes coated with 0.1% gelatin, with 10% Fetal Bovine Serum (FBS, Gibco #10270-106))-
supplemented KODMEM culture medium. On the following day, “normal” KODMEM culture
medium was added and medium was daily replaced from the fourth day onwards. Total
protein contents were collected every two days during 14 days of protocol.
A differentiated cell line (NIH-3T3, mouse embryonic fibroblasts), 3T3, was employed to
validate that the plasmid and as a control for the low efficiency of transfection. 3T3 cells were
grown in Dulbecco modified Eagle medium, hereby referred to as “DMEM medium”,
consisting of DMEM (DMEM, Gibco #41965-039) with 10% FBS, 100U/mL penicillin, 100 µg/mL
streptomycin, 0.1 mM nonessential amino acids, and 1mM sodium pyruvate (Gibco #11360-
039), while being incubated at 37°C and 5% CO2. Cells were detached with TrypLE (Gibco
#12605-028), and passaged with dilutions ranging from 1:30 to 1:60, when 70-80% confluence
was achieved. The passaging protocol is very much alike the one described for mESC: DMEM
medium was removed, cells were washed with warm PBS and TrypLE was added. After a 5
minutes incubation at 37°C, new, warm culture medium was added. Cells in suspension were
collected into a 15mL conical tube. Then, cells were also centrifuged at 200g for 5 minutes.
The supernatant was removed, and the cells were then resuspended in new DMEM. Cells were
then counted; the appropriate volume of cells was plated in new, cell culture flasks with
DMEM.

16
3.3 E.COLI TRANSFORMATION; PLASMID AMPLIFICATION, ISOLATION AND ANALYSIS
LB-agar plates for bacterial culture were prepared following the manufacturer’s
instructions (Nzytech #MB14502) in 90mm bacterial dishes. Briefly, 50g of LB broth (Nzytech
#MB14502) and 40g of agar (Becton Dickson #214050) per liter of distilled water were
sterilized through autoclaving (121°C for 45 minutes). Following this process, the broth was
kept at 60°C, averting solidification. The appropriate antibiotic was then added to get a
final/working concentration of 100 µg /mL for carbenicillin (Fisher Scientific #BP26481) or 50
µg /mL for kanamycin (AcrosOrganics® #450810100), whenever the LB-agar plates were meant
for antibiotic-based selection. Approximately 20mL of LB-agar broth was poured directly into
the 90mm bacterial dishes, in sterile conditions (flux chamber), and left to cool until
solidification. Each dish was then inverted (lid facing down), date, user, antibiotic name and
concentration were written, and lastly, sealed with parafilm (PARAFILM #05170002). Sealed
sterile dishes were kept in a sealed bag at 4°C until needed.
E. coli was transformed via the heat-shock transformation protocol (Nzytech, 2013). 40
µL of glycerolated stock NZY5 E.coli (Nzytech #MB00401) was transfected with 2ng of
plasmidic DNA. The eppendorf containing the bacteria and DNA was incubated on ice for 5
minutes and then, heat-shocked in a water bath at 42°C for 45 seconds. After, the eppendorfs
were returned to ice for another 2 minutes. 500 µL SOC broth (Nzytech #MB11901) was then
added to each eppendorf and incubated in a 37°C incubator with agitation for 20 minutes,
allowing bacteria to recover from the ice-heat cycles. 150 µL were plated in LB-agar plates with
100 µg /mL carbenicillin or 50 µg /mL for kanamycin, which allows plasmid positive and
negative (respectively) E.coli selection, as the chosen plasmids encode for an
ampicillin/carbenicillin resistance-conferring gene. A Bunsen burner was employed to achieve
sterile conditions and thus minimize contamination chances of all reagents and materials.
Plasmid amplification was attained by two steps of E.coli culture. Plasmid-positive
colonies were picked early in the morning to a 15 ml falcon tube containing 5 mL SOC broth
with 100 µg /mL carbenicillin, and incubated at 37°C and 180 rpm, over day. Then, the pre-
culture was transferred to a 500 mL Erlenmeyer flask with 200mL SOC broth with 100 µg /mL
carbenicillin and incubated overnight in the aforementioned conditions. Next morning, E.coli
were harvested (by centrifuging the bacterial suspension, at 4000g) in order to perform DNA
isolation via the PureLink® HiPure Plasmid Filter Maxiprep Kit (Invitrogen #K2100-17). This
isolation process includes the sequential additions of kit buffers, such as RNAse containing
buffers. The procedure was performed as recommended by the manufacturers.
After elution of the DNA-binding columns, the isolated DNA was precipitated with 2-
propanol (Sigma #59304-1L-F) and centrifuged at 16000g for 30 minutes. The supernatant was
discarded; the pellets were rinsed with 70% ethanol (MerckMillipore #1085430250) and then
centrifuged again at 16000g for 10 minutes. Ethanol was removed; the DNA pellets were left
to dry, and then resuspended in Molecular Biology-grade water (MerckMillipore
#H20MB0501).
17
DNA concentration was determined via a NanoDrop® 1000 Spectrophotometer.
Molecular Biology-grade water was used as blank for the measurements, and 1 µL of DNA
solution was pipetted in order to determine the concentration and purity of the nucleic acid.
Following this procedure, DNA samples were aliquoted and kept at -20°C pending use.
3.4 SELECTION CONDITIONS
3.4.1 Antibiotic Concentration
The minimum concentration of puromycin that was able to kill every cell/colony was
determined in order to select plasmid-positive cells/colonies. As the chosen plasmid for
transfection carries a puromycin resistance-conferring gene (PAC - puromycin N-acetyl-
transferase), an enzyme that disables the inhibition of protein synthesis from puromycin, by
acetylation of a moiety of the said antibiotic (Gómez Lahoz et al., 1991; Vara et al., 1985)),
successfully transfected cells must be resistant to concentrations of puromycin that would
otherwise kill them. So, both non-transfected cell lines were plated in 12-well plates and
cultured in the presence of increasing concentrations of puromycin (ranging from 0.5 µg/mL
to 2.5 µg/mL. Puromycin concentrations were chosen according to existing data (Aubert et al.,
2002; Chambers et al., 2003; Conti et al., 2005; Simsek et al., 2010; Wang et al., 2007; Zhang
et al., 2006)). Then, cells were treated with different concentrations of puromycin, 24 hours
after plating. Antibiotic selection was conducted for 3 days (ESCs) and 7 days (3T3). The next
step was to determine the antibiotic’s effectiveness by cell counting under a microscope, and
Sulforhodamine B colorimetric assay.
3.4.2 Sulforhodamine B (SRB) colorimetric assay
Cells were fixed with 4% Para-formaldehyde (Sigma #P6148-500G) for 15 minutes at
room temperature. After removing the fixative solution, cells were washed with PBS for three
times, 5 minutes each. PBS was then removed and the plate was allowed to dry overnight. In
the following day, 500 µL of 0.1% SRB (Sigma #S9012-256) solution was added to each well
containing cells exposed to different concentrations of SRB. After an incubation period of 1
hour at 37°C, the SRB solution was removed, and washed trice with a 1% acetate solution.
Following this step, the plates were left to dry overnight, at room temperature. Next day, 1
mL of 10mM TRIS, pH=10 buffer was added to each well. The plates were then subject to
stirring for 15 minutes. From each well, 200 µL of the TRIS buffer was collected to a
transparent, 96-well plate, and read with a spectrophotometer (at 540nm) in order to
determine the amount of remaining SRB, which had bound to proteins, and would give a
measure of total protein content.

18
3.4.3 Cell counting
Cell counting allowed the quantification of the number of surviving cells in each selecting
condition. Cells were detached with either Accutase® (E14 cells) or TrypLE™ (3T3 cells), having
previously rinsed the cells with PBS, to ensure maximum enzyme activity. Following the
addition of the detaching agent, both cell lines were incubated at 37°C for 5 minutes. The
detaching action of both reagents was inhibited with the addition of culture medium (with a
total volume of 4 times the volume of detaching enzyme employed), and the cell suspension
was collected then centrifuged at 1200 rpm for 5 minutes. Supernatant was promptly
discarded and the cells were ressuspended in 1 mL of the corresponding culture medium. An
aliquot of 20 µL was mixed with 20 µL of Trypan Blue Solution, 0.4% (Sigma #T8154). A total
volume of 10 µL of the resulting cell suspension was pipetted to a Nebauer Improved Counting
Chamber (Marienfeld #0610010, as shown in Figure , with 0.1 mm of depth) and counted
under a microscope. The four outer quadrants (with 1mm2 areas) were counted.
Figure - Grid size for the Nebauer Improved Counting Chamber.
The total number of counted cells is calculated according to Equation 1. As each
quadrant has an area of 1mm2, and a depth of 0.1mm, the corresponding volume, per
quadrant, is of 0.1mm3 (1mm*1mm*0.1mm), or 0.1µL. In order to obtain a cell concentration
in the order of the mL, the total number of cells must thus be multiplied by 10000. Four
quadrants were counted in order to decrease the chance of systematic counting errors, which
implies that the total number of cells counted (in the four quadrants) must be normalized to
obtain a fixed number of cells per quadrant. As cells were diluted in Trypan Blue prior to
counting, this dilution must be taken into account.
𝐶𝑒𝑙𝑙 𝑐𝑜𝑛𝑐𝑒𝑛𝑡𝑟𝑎𝑡𝑖𝑜𝑛 (𝑐𝑒𝑙𝑙
𝑚𝐿) =
#𝑐𝑒𝑙𝑙𝑠 𝑐𝑜𝑢𝑛𝑡𝑒𝑑
#𝑞𝑢𝑎𝑑𝑟𝑎𝑛𝑡𝑠 𝑐𝑜𝑢𝑛𝑡𝑒𝑑∗ 10000 ∗ 𝑑𝑖𝑙𝑢𝑡𝑖𝑜𝑛
[1]

19
After obtaining the total number per condition, those values were divided by the
number of cells in the control condition and the result is expressed in a percentage of live cells
relatively to control, as calculated using Equation 2.
𝑃𝑒𝑟𝑐𝑒𝑛𝑡𝑎𝑔𝑒 𝑜𝑓 𝑠𝑢𝑟𝑣𝑖𝑣𝑖𝑛𝑔 𝐶𝑒𝑙𝑙𝑠 =#𝑐𝑒𝑙𝑙𝑠 𝑖𝑛 𝑐𝑢𝑙𝑡𝑢𝑟𝑒
#𝑐𝑒𝑙𝑙𝑠 𝑖𝑛 𝑐𝑜𝑛𝑡𝑟𝑜𝑙 ∗ 100
3.5 TRANSFECTION
Both cell lines were transfected using Lipofectamine 2000 (Invitrogen #11668-030) and
Lipofectamine 3000 (Invitrogen L3000-008) reagents. Transfection was made according to
manufacturer’s instructions, albeit modified.
Cells were passaged as described, and seeded on 12 well plates at 15000 cells per cm2
(NIH-3T3 cells) and 5000 cells/cm2 (E14Tg2.a cells), with 1 mL of the corresponding culture
medium (KODMEM for E14 cells and DMEM for 3T3 cells). Concomitantly, different ratios of
DNA:Lipofectamine (DNA mass: Lipofectamine volume) were tested, starting with 0.5 µg of
Plasmidic DNA.
Two references of Lipofectamine were used: Lipofectamine 2000 and Lipofectamine
3000. DNA and Lipofectamine 2000 solutions were prepared, separately, by dilution in
OptiMEM medium (Gibco #31985-047). Each mixture was incubated at room temperature for
5 minutes, before adding the contents of the DNA-OptiMEM tube to the Lipofectamine 2000-
OptiMEM containing tube. This DNA-Lipofectamine 2000-OptiMEM mixture was then
incubated for another 5 minutes at room temperature in the dark, and finally added to each
well dropwise. The plates were incubated at 37°C, 5% CO2 overnight. On the next day the
plates were assayed for the emission of fluorescence (caused by expression of mCherry), and
1 mL of culture medium was added. On the third day, the culture was monitored for
fluorescence and confluence the culture medium was removed and replaced with fresh
culture medium supplemented with puromycin in order to select plasmid-positive cells.
Transfection with Lipofectamine 3000 followed the same guidelines, except the addition
of the reagent dubbed “P3000 reagent” to the DNA-OptiMEM mixture. For each µg of DNA
added, 2 µL of P3000 reagent were added. With both methods, following antibiotic selection,
cells were passaged, as described, for wild type E14 and 3T3 cells.
3.6 FLOW-CYTOMETRY
Flow-cytometry was performed with transfected 3T3 cells in order to quantitatively
evaluate transfection efficiency. The transfection efficiency could be measured through the
[2]

20
red fluorescence of positively transfected cells, conferred by the mCherry-expressing plasmid.
Therefore, 3T3 cells (two samples of transfected and non-transfected cells) were detached
with TrypLE, as described. Following the centrifugation step, the supernatant was discarded
and the cell pellet was resuspended in warm PBS, and analyzed with a BD FACSCalibur flow-
cytometer. For each “cell line”, a total of 20.000 events were recorded. After a quick run, the
aberrant cells and cellular debris was gated out, based on light scattering, and by designing a
region that only included those who were considered to possess a “normal” forward and side
light scattering. Red fluorescence (mCherry absorbs at the wavelength of 387nm, emitting
maximally at 610nm) was promptly measured in the FL2 channel. Data was analyzed using the
Cell Quest Pro Acquisition software, and the percentage of Fluorescent/non-fluorescent 3T3
cells was calculated.
3.7 RNA
3.7.1 RNA isolation
Cells were washed with warm PBS and the adequate detaching agent was added. After
a 5 minutes incubation period at 37°C, medium was added to inactivate the enzyme, and cells
were collected into a 15mL conical tube. Then, cells were centrifuged at 200g for 5 minutes at
room temperature. Supernatant was discarded; cells were washed in PBS 1x and centrifuged
again.
Afterwards, in an RNAse free environment and using RNAse-free pipette tips, pipettes,
and eppendorf tubes, the supernatant was removed, 1 ml of TRIZOL reagent (Invitrogen
#15596026) was added and the samples were vortexed for 10 seconds. Then, 200 µL of
chloroform (Sigma #C242-25mL) was added to the mixture, and vortexed for 30 seconds. The
samples were then centrifuged at 4000 rpm for 5 minutes (room-temperature), and the
transparent/aqueous phase was collected to an RNAse/DNase-free eppendorf tube, without
disturbing the phenol red-containing phase. Lastly, 600 µL of isopropanol were added to each
eppendorf tube, the tubes were labeled and kept at -20°C, until DNA clean-up.
3.7.2 DNA cleanup, quantification and first strand cDNA synthesis
Following the isolation step, RNA samples were centrifuged at 16.000g at 4°C for 30
minutes, and the resulting supernatant was discarded. 1ml of 75% ethanol, previously
prepared with molecular biology-grade water, was added and the RNA samples were
centrifuged at 16000g at 4°C for 10 minutes. The supernatant was discarded and the pellets
were left to air-dry. 20 µL of nuclease-free water was added. These samples were then ready
to undergo DNA clean-up. DNAse I buffer (0.2 µL, Ambion #816962)) and rDNase I (2 µL,
Ambion #2224G) were then added to the RNA samples, and the contents were gently mixed.
These RNA-containing tubes were incubated at 37°C for 30 minutes. After, DNAse Inactivation
reagent (0.2µL, Ambion #8174G) was added to each sample, and incubated at room
temperature for 2 minutes, while mixing occasionally. Finally, the samples were centrifuged
21
at 10.000g for 1.5 minutes, and the RNA-containing supernatant was transferred to a new,
labeled, RNAse free tube.
The resulting RNA was then quantified via Nanodrop®, as described before, albeit
choosing a different quantification profile (one adequate for RNA instead of DNA).
In order to perform cDNA synthesis, a reaction mix with a total volume of 20 µL,
containing 4µL of iScript reaction mix (BIORAD #170-8890), 1µL iScript reverse transcriptase
(BIORAD #720001205), and the volume equivalent to 1.5µg of RNA (20µL total volume was
achieved by adding Nuclease free water), was prepared in PCR-ready tubes. These tubes were
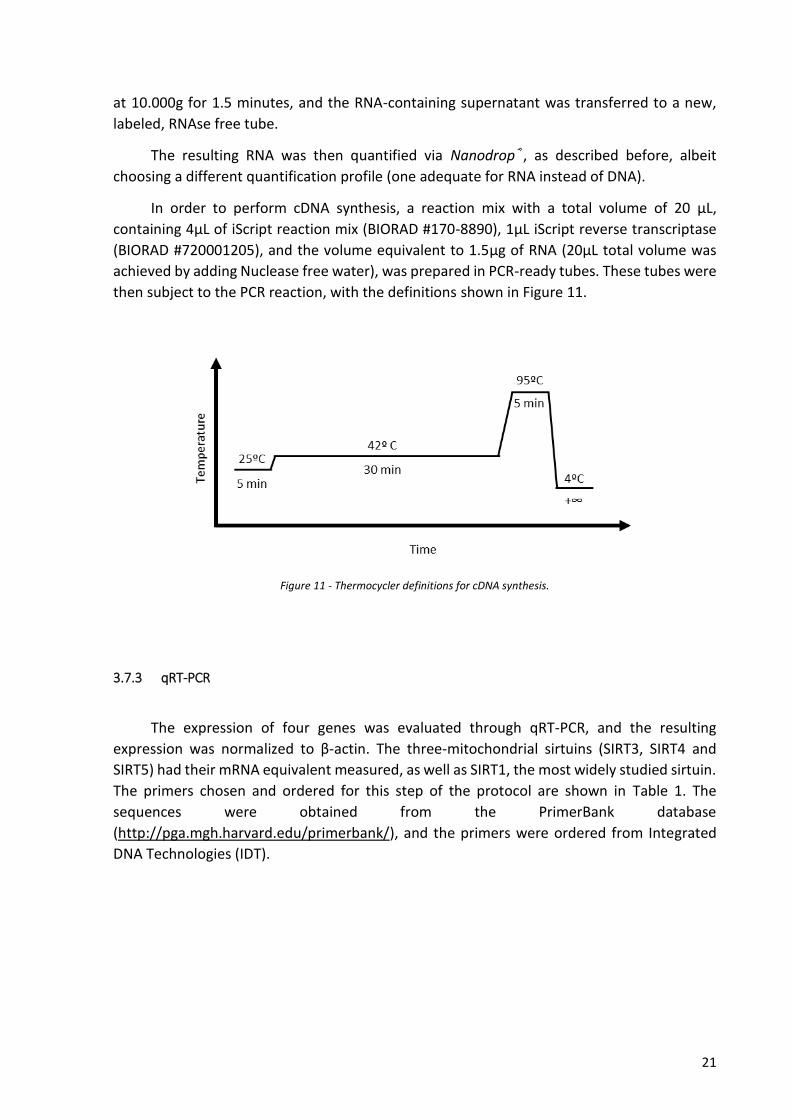
then subject to the PCR reaction, with the definitions shown in Figure 11.
Figure 11 - Thermocycler definitions for cDNA synthesis.
3.7.3 qRT-PCR
The expression of four genes was evaluated through qRT-PCR, and the resulting
expression was normalized to β-actin. The three-mitochondrial sirtuins (SIRT3, SIRT4 and
SIRT5) had their mRNA equivalent measured, as well as SIRT1, the most widely studied sirtuin.
The primers chosen and ordered for this step of the protocol are shown in Table 1. The
sequences were obtained from the PrimerBank database
(http://pga.mgh.harvard.edu/primerbank/), and the primers were ordered from Integrated
DNA Technologies (IDT).

22
Table 1 - Identification and characterization of the primers chosen to perform qRT-PCR.
TARGET GENE
FW/RV SEQUENCE AMPLICON SIZE
(BP) PRIMERBANK ID
β-ACTIN Forward GGCTGTATTCCCCTCCATCG
154 6671509a1 Reverse CCAGTTGGTAACAATGCCATGT
SIRT1 Forward GCTGACGACTTCGACGACG
101 9790229a1 Reverse TCGGTCAACAGGAGGTTGTCT
SIRT3 Forward ATCCCGGACTTCAGATCCCC
126 11967963a1 Reverse CAACATGAAAAAGGGCTTGGG
SIRT4 Forward CAAGAAACTCCTCGTGATGACA
97 267844848c2 Reverse GTCAGTGCGGGCGTAAAGT
SIRT5 Forward CTCCGGGCCGATTCATTTCC
130 30578432a1 Reverse GCGTTCGCAAAACACTTCCG
For each gene to be analyzed, a master mix (with a total volume of 20µL) was prepared
by adding: 10µL SsoFast™ EvaGreen® Supermix (Biorad #750000117); 1µM of both Forward
and Reverse primers, cDNA template of the desired sample, and 5µL of nuclease free water,
to a 96 well RT-PCR plate (Biorad). qRT-PCR is run in CFX96 Touch™ Real-Time PCR Detection
System, and mRNA fold change was calculated using the -∆∆Ct method.
3.8 PROTEIN EXPRESSION ANALYSIS
3.8.1 Immunocytochemistry
Cells were plated at 10.000 cells/cm2 in cell culture 13mm coverslips (Thermanox
174950) and grown for three days. The cells were then fixed with 4% paraformaldehyde in PBS
for 15 minutes, at room temperature. After fixation, cells were washed with cold PBS and kept
at 4°C in 0.1% sodium azide in PBS 1x, pending use. For the immunocytochemistry protocol
per se, cells were firstly permeabilized and blocked with a 1% Triton-X100 and a 3% BSA,
solution in PBS respectively, for 30 minutes. Cell-containing coverslips were incubated with
the primary antibodies (antibodies employed can be consulted in Table 2) overnight diluted in
a 1% BSA, 0.25% Triton-X in PBS solution. In the following morning, the coverslips were
incubated with the corresponding secondary antibody for 1h at room temperature, after three
washes in PBS for 5 minutes each. Incubation with Hoechst 33342 (to allow staining of the
nucleus) was also performed, diluted 1:1000 in PBS, for 10 minutes at room temperature. Cell-
containing coverslips were washed three times with PBS before mounting. Samples were
mounted in slides with a drop of Vectashield® (Vector H1000) with a glass coverslip, and sealed
with nail polish to prevent samples from drying.

23
Table 2 - List of Antibodies used in immunocytochemistry, their sources, and dilutions.
Antibody Strain Manufacturer Reference Dilution Incubation Time
OCT4 rabbit Cell Signaling #2840 1:750 overnight SOX2 goat Santa Cruz sc-17320 1:500 overnight TOM-20 rabbit Santa Cruz sc-11415 1:200 overnight SIRT3 rabbit Abcam ab86671 1:1000 overnight
3.8.2 Western Blot
3.8.2.1 Protein Extraction & Quantification
Total protein content was obtained from cell extracts for later characterization through
Western Blot. Cells were washed with PBS, and detached with either Accutase® (for E14 ES
cells) or TrypLE® (for 3T3 cells), centrifuged at 200g for 5 minutes. The pellet was washed with
PBS and centrifuged again. Having discarded the supernatant, the pellet was then digested
with RIPA® buffer (Sigma #R0278-50mL) supplemented with protease inhibitors (Protease
Inhibitor Cocktail (Sigma #P8340) and PMSF (Sigma #78830)) and phosphatase inhibitors
(Thermo Fisher Scientific #78830) for a minimum of 5 minutes, on ice. Following this process,
samples were centrifuged at 500g for 15 minutes. The supernatant was carefully collected to
a 1.5 ml eppendorf tube, labeled, and stored at -80°C. Protein concentration must be
determined before sample preparation for blotting, to allow the loading of 30 µg of protein
into each well, to standardize the amount of protein in each lane/sample. Protein
concentration determination for each sample was accomplished using the Pierce™ BCA
Protein Assay Kit.
3.8.2.2 Western Blot
Quantified protein extracts were subject to sodium dodecylsulphate polyacrylamide gel
electrophoresis (SDS-PAGE), in a 12% acrylamide gel and the electrophoretic conditions were
selected according to the characteristics of the proteins of interest. Protein samples were
denatured prior to the electrophoresis. In order to do so, 30 µg of protein from each sample
(determined after the quantification process) were diluted in water and to each tube, an equal
volume of Laemmli buffer (BioRad #161-0737) with β-mercaptoethanol (Sigma M7522-
100mL) (a denaturing buffer) was added. The protein samples were then subject to heating,
at 70°C, for 10 minutes, and vortexed for 1 minute afterwards. Electrophoresis gels were
prepared accordingly to Table 3 (running gel portion) and Table 4 (stacking gel portion).

24
Table 3 - Chemical components of the Acrylamide running gel for protein electrophoresis.
REAGENT/SOLUTION VOLUME (PER GEL)
ddH2O 3.4 mL 40% ACRYLAMIDE (BIORAD #161-0148) 2.4 mL 1.5M TRIS, pH 8.8 (BIORAD #161-0798) 2 mL 10% SDS (BIORAD #161-0418) 80 µL 10% APS (BIORAD #161-0737) 80 µL TEMED (BIORAD #161-0800) 8 µL
Table 4 - Chemical components of the Acrylamide stacking gel for protein electrophoresis.
REAGENT/SOLUTION VOLUME (PER GEL)
ddH2O 2,48 mL 40% ACRYLAMIDE (BIORAD #161-0148) 0.4 mL 0.5M TRIS, pH 6.8 (BIORAD #161-0799) 1 mL 10% SDS (BIORAD #161-0418) 40 µL 10% APS (BIORAD #161-0737) 40 µL TEMED (BIORAD #161-0800) 4 µL
After polymerization, the gel was placed in an electrophoresis buffer chamber.
Denatured samples were loaded into each well (30 µL, with 30 µg protein), as well as 5 µL of
the adequate protein standard/ladder (Precision Plus Protein™ Dual Color Standards #161-
0374). Electrophoresis was carried out with TGS buffer (10x Tris/Glycine/SDS #161-0772).
Firstly, electrophoresis is run at 60V for 30 minutes, allowing the steady and efficient
incorporation of the protein samples in the stacking gel, and at 140 V, for approximately one
hour allowing the separation by size of the loaded proteins. In the meantime, PVDF
membranes were activated with methanol (AppliChem Pancreac #131091.1212) for 15
seconds, then with water for 5 minutes, and lastly with transfer buffer (whose constituents
are shown in Table 5) for at least 15 minutes, always under stirring.
Table 5 - Electrotransference buffer chemical constitution.
Following electrophoresis, proteins were electrotransfered from the acrylamide gel to a
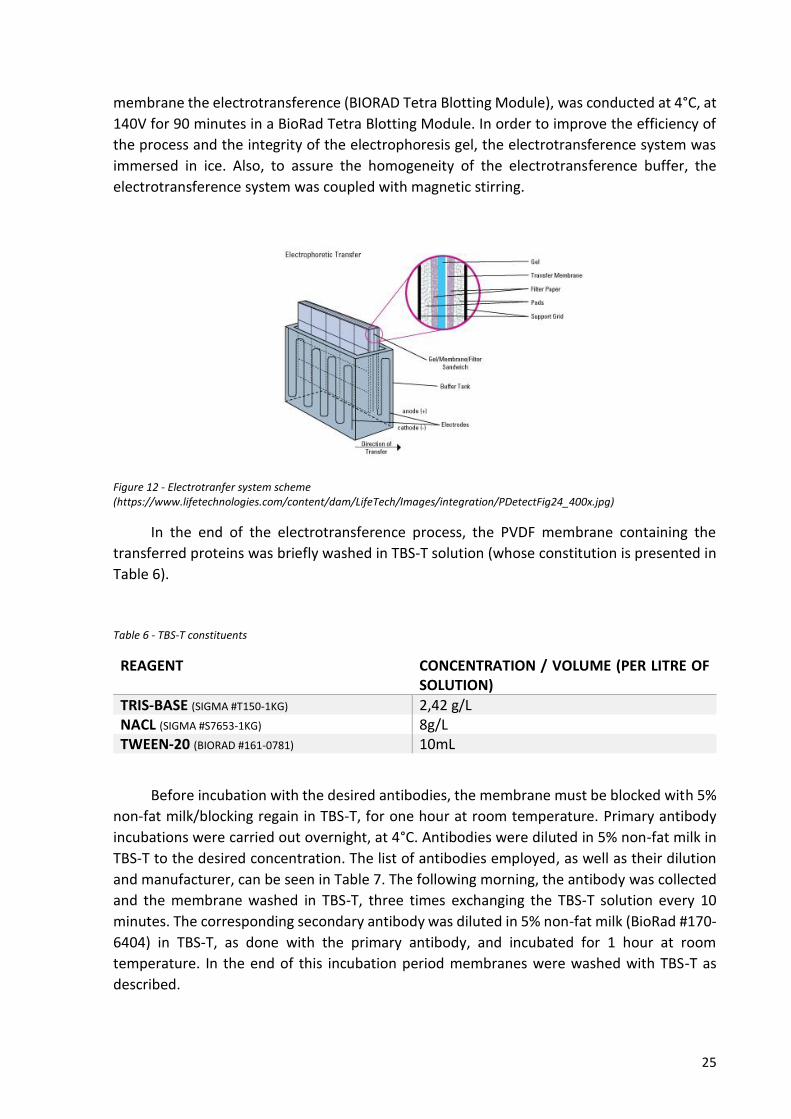
PVDF membrane. All the components of the “electrotransference cassette” of the Mini Trans-
Blot cell (BIORAD) were also soaked in transfer buffer, and then mounted as shown in Figure
12. After the assembly of the cassette containing both the electrophoresis gel and the PVDF
REAGENT CONCENTRATION / VOLUME
TRIS-BASE (SIGMA #T150-1KG) 25mM GLYCINE (SIGMA #G7126-1KG) 190mM METHANOL (APPLICHEM PANCREAC #131091.1212) 200 mL DISTILED WATER Enough to 1 L of transfer buffer
25
membrane the electrotransference (BIORAD Tetra Blotting Module), was conducted at 4°C, at
140V for 90 minutes in a BioRad Tetra Blotting Module. In order to improve the efficiency of
the process and the integrity of the electrophoresis gel, the electrotransference system was
immersed in ice. Also, to assure the homogeneity of the electrotransference buffer, the
electrotransference system was coupled with magnetic stirring.
Figure 12 - Electrotranfer system scheme (https://www.lifetechnologies.com/content/dam/LifeTech/Images/integration/PDetectFig24_400x.jpg)
In the end of the electrotransference process, the PVDF membrane containing the
transferred proteins was briefly washed in TBS-T solution (whose constitution is presented in
Table 6).
Table 6 - TBS-T constituents
REAGENT CONCENTRATION / VOLUME (PER LITRE OF SOLUTION)
TRIS-BASE (SIGMA #T150-1KG) 2,42 g/L NACL (SIGMA #S7653-1KG) 8g/L TWEEN-20 (BIORAD #161-0781) 10mL
Before incubation with the desired antibodies, the membrane must be blocked with 5%
non-fat milk/blocking regain in TBS-T, for one hour at room temperature. Primary antibody
incubations were carried out overnight, at 4°C. Antibodies were diluted in 5% non-fat milk in
TBS-T to the desired concentration. The list of antibodies employed, as well as their dilution
and manufacturer, can be seen in Table 7. The following morning, the antibody was collected
and the membrane washed in TBS-T, three times exchanging the TBS-T solution every 10
minutes. The corresponding secondary antibody was diluted in 5% non-fat milk (BioRad #170-
6404) in TBS-T, as done with the primary antibody, and incubated for 1 hour at room
temperature. In the end of this incubation period membranes were washed with TBS-T as
described.
26
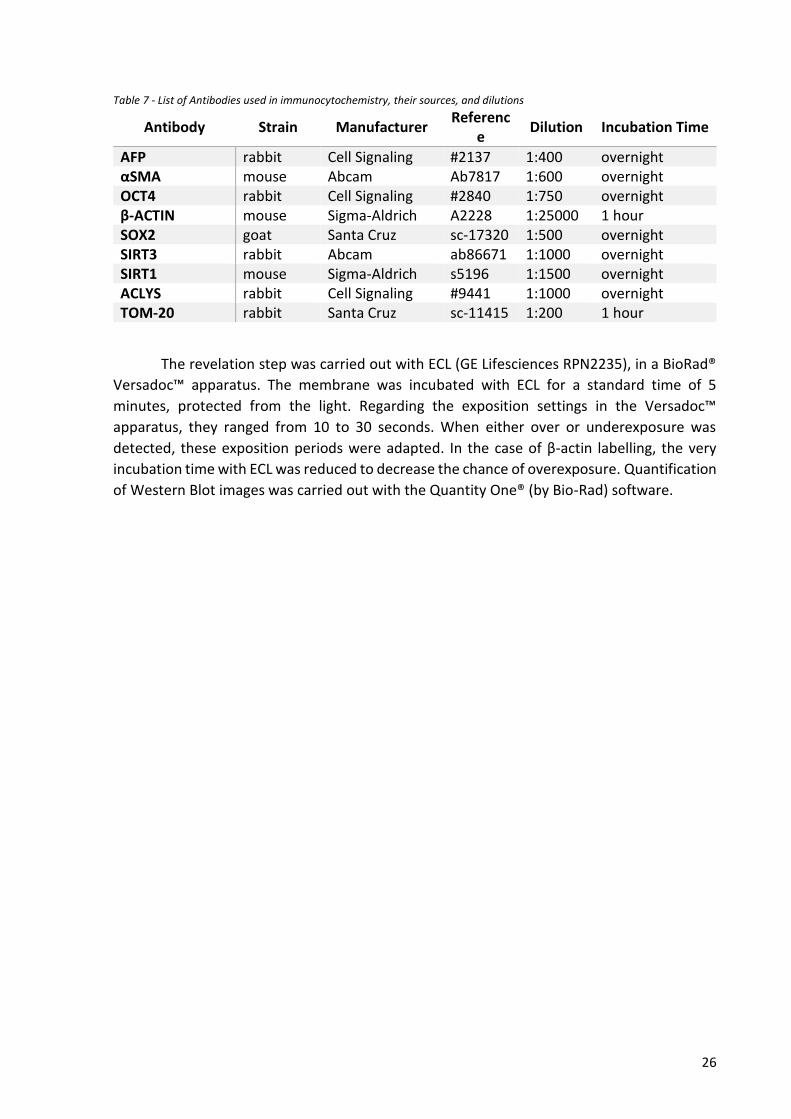
Table 7 - List of Antibodies used in immunocytochemistry, their sources, and dilutions
Antibody Strain Manufacturer Referenc
e Dilution Incubation Time
AFP rabbit Cell Signaling #2137 1:400 overnight αSMA mouse Abcam Ab7817 1:600 overnight OCT4 rabbit Cell Signaling #2840 1:750 overnight β-ACTIN mouse Sigma-Aldrich A2228 1:25000 1 hour SOX2 goat Santa Cruz sc-17320 1:500 overnight SIRT3 rabbit Abcam ab86671 1:1000 overnight SIRT1 mouse Sigma-Aldrich s5196 1:1500 overnight ACLYS rabbit Cell Signaling #9441 1:1000 overnight TOM-20 rabbit Santa Cruz sc-11415 1:200 1 hour
The revelation step was carried out with ECL (GE Lifesciences RPN2235), in a BioRad®
Versadoc™ apparatus. The membrane was incubated with ECL for a standard time of 5
minutes, protected from the light. Regarding the exposition settings in the Versadoc™
apparatus, they ranged from 10 to 30 seconds. When either over or underexposure was
detected, these exposition periods were adapted. In the case of β-actin labelling, the very
incubation time with ECL was reduced to decrease the chance of overexposure. Quantification
of Western Blot images was carried out with the Quantity One® (by Bio-Rad) software.

27
4 RESULTS AND DISCUSSION
4.1 MESC CULTURING
4.1.1 Pluripotency in mouse Embryonic Stem Cells
mESC cultures are, to say the least, more sophisticated than other cultured cells. These
cultures require daily medium exchange, while always monitoring the morphology, size and
density of stem cell colonies. This is due to the fact that mESC cultured in the absence of feeder
cells tend to differentiate in a spontaneous manner. They are also very sensitive to sudden
changes in their environment: temperature, acidity, micronutrient concentration, and so on.
While many other cell cultures only require passaging when certain levels of confluence are
reached, mESCs morphology must be followed, as it is, by itself, a good indicator of the level
of “stemness” of the colonies. When passaging, these cells must be plated within certain
density values: if plated too densely, mESC will tend to differentiate (more on mESC
differentiation ahead); and if plated too sparsely, the cells won’t be able to form colonies and
will eventually differentiate or die.
As a result, the culture medium for mESC culturing must be well defined and favor not
only growth, but also pluripotency. KSR replaces the more common form of serum, FBS, in
order to avoid unwanted animal contaminants (such as cytokines) present in the serum itself,
as they may lead the cells to differentiate (Cheng et al., 2004). β-mercaptoethanol, which acts
as an antioxidant, helps to regulate the redox potential of the culture medium and also
contributes towards stem cell pluripotency, allegedly through sequestration of reactive
oxygen species, and creating conditions that allow the uptake of cysteine (this uptake is easier
in reductive environment, and cysteine and its metabolism are important for endogenous
redox balancing (Bannai, 1992; Janjic and Wollheim, 1992)). The medium’s base is KODMEM,
as opposed to the usual DMEM, as it contains less serum-derived animal contaminants. In
conclusion, all these components increase the quality of the stem cell culture, causing them
to be notoriously expensive when compared to traditional cell lines.
Figure 13 shows microphotographs of E14 mESC cultured in two different conditions,
with LIF (images A, B, and C) and without LIF (D, E and F), up to three days after passaging, and
the most distinguishable characteristic of both groups is colony morphology: colonies cultured
in pluripotency-sustaining conditions (i.e. with LIF) are rounder, have smaller cells (visually
indistinguishable at this magnification), and light refraction is very different, when comparing
to the less pluripotent colonies, which resembles which is commonly referred in the literature
(Cahan and Daley, 2013). While maintaining E14 mESC cells in culture, one must seek to
passage when colonies are rather large (in order to assure enough cells to maintain the culture
and also plate for the ongoing experiments), but still pluripotent. As stated before, such can
only be attained if the culture is strictly monitored.

28
Figure 13 – Microphotographs of mESC cultures in different days after passaging, and with and without added LIF. Figures A, B and C refer to mESC cultured in KODMEM supplemented with LIF, 1, 2 and 3days after plating, respectively. Figures D, E and F present the same cell line cultured in KODMEM but with no LIF supplementation. Scale bar is 100µm.
Nevertheless, there are other, more accurate means to determine the pluripotency (or
“stemness”) of a cell culture. ESCs possess various specific markers that indicate their
pluripotency, such as transcription factors OCT4, SOX2 and NANOG (“pluripotency core”).
Therefore, immunocytochemistry was performed on both LIF-supplemented and non-
supplemented E14 cultures, to show that the morphology observed in the previous figure is
concomitant with the stronger or weaker pluripotent phenotype. In Figure 14 shows the
results for this technique. The first row of each sets of images refer to ESC cultured with LIF,
the second, cultured without LIF.

29
Figure 14 - Immunocytochemistry for Oct4 and Sox2 (pluripotency markers) and TOM20 (mitochondrial marker), with and without LIF. Phalloidin (actin-binding probe) and Hoecsht (DNA binding dye) staining allow co-localization all three proteins. 63x magnification.
Both SOX2 and OCT4 staining seem to be higher in cells cultured with LIF-supplemented
medium, which suggests they could be labeled as having a more pluripotent phenotype than
those in the second row, which were cultivated in medium without LIF. This result supports
the theory that the morphology of mESC colonies is a fairly good indicator of the “stemness”
of these E14 cells.
Along with transcription factors, immunocytochemistry was also performed against
TOM20, a mitochondrial surface protein, commonly used as a measure of total mitochondrial
mass and cell localization. These results suggest that mESC possess a diminished mitochondrial
mass, which increases with differentiation.
Besides the use of antibodies for the aforementioned pluripotency markers, two
molecular probes for actin (phalloidin) and the nucleus (Hoecsht), which were meant to
With LIF
Without LIF
With LIF
Without LIF
With LIF
Without LIF

30
provide structural context and, in a way, co-localize the proteins assayed. In this case, both
SOX2 and OCT4 co-localize with Hoechst, indicating their nuclear localization, while TOM20 is
located in the cytoplasm, as expected, through its co-localization with phalloidin.
Being able to both culture and handle ESC, we then proceeded to perform
differentiation protocols for these cells, to further characterize their stem profile.
4.1.2 Differentiation of mESC
4.1.2.1 Embryoid Body differentiation
ESC are able to differentiate into the three germ layers (endoderm, mesoderm and
ectoderm). While some (metabolic) modulators may affect the pluripotent phenotype of ESCs,
some of them only reveal modulating action when cells start to differentiate. Therefore, an
established protocol for ESC differentiation is required, if the mechanisms of said modulators
are to be assayed.
In vitro, the differentiation process can be either directed towards a (rather) specific cell
type or tissue, or it may be unspecific, generating embryoid bodies (EBs). EBs consists of
disordered, differentiated tissue, presenting a heterogeneous mixture of cell types. In order
to achieve both directed and undirected differentiation, the first step requires for an exchange
of medium, abandoning the use of a pluripotency-inducing medium. In the case of the
undirected differentiation, the difference resides in ceasing to supplement the KODMEM
culture medium with LIF, and plating cells considerably more densely in non-adherent cell
culture dishes to let them to aggregate and then, at day three putting them in normal growth
dishes coated with gelatin.
Figure 15 - Embroyd body differentiation through days 2, still in suspension (A); 4, adhered 1 day (B); 7, adhered 4 days (C); 9, adhered 6 days (D); 11, adhered 8 days (E); and adhered for 11 days 14 (F). Scale bar is 100 µm.
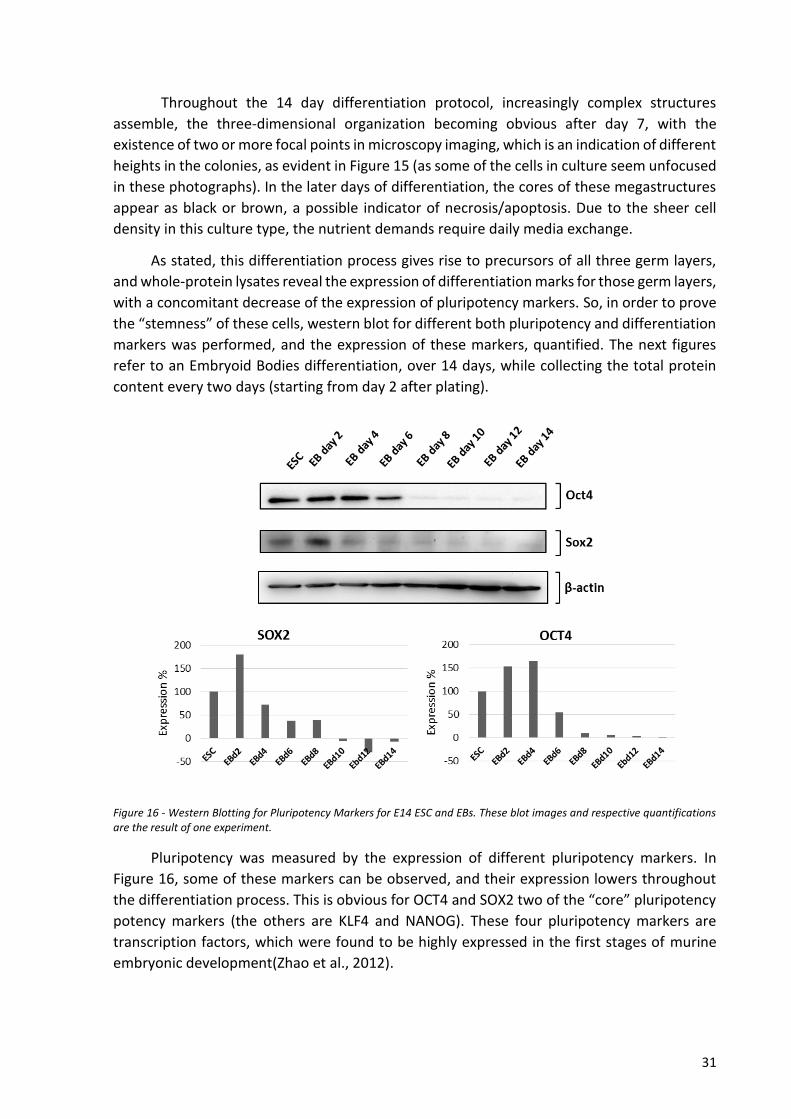
31
Throughout the 14 day differentiation protocol, increasingly complex structures
assemble, the three-dimensional organization becoming obvious after day 7, with the
existence of two or more focal points in microscopy imaging, which is an indication of different
heights in the colonies, as evident in Figure 15 (as some of the cells in culture seem unfocused
in these photographs). In the later days of differentiation, the cores of these megastructures
appear as black or brown, a possible indicator of necrosis/apoptosis. Due to the sheer cell
density in this culture type, the nutrient demands require daily media exchange.
As stated, this differentiation process gives rise to precursors of all three germ layers,
and whole-protein lysates reveal the expression of differentiation marks for those germ layers,
with a concomitant decrease of the expression of pluripotency markers. So, in order to prove
the “stemness” of these cells, western blot for different both pluripotency and differentiation
markers was performed, and the expression of these markers, quantified. The next figures
refer to an Embryoid Bodies differentiation, over 14 days, while collecting the total protein
content every two days (starting from day 2 after plating).
Figure 16 - Western Blotting for Pluripotency Markers for E14 ESC and EBs. These blot images and respective quantifications are the result of one experiment.
Pluripotency was measured by the expression of different pluripotency markers. In
Figure 16, some of these markers can be observed, and their expression lowers throughout
the differentiation process. This is obvious for OCT4 and SOX2 two of the “core” pluripotency
potency markers (the others are KLF4 and NANOG). These four pluripotency markers are
transcription factors, which were found to be highly expressed in the first stages of murine
embryonic development(Zhao et al., 2012).

32
This steady decrease shows that loss of pluripotency is a gradual process and that cells
do not immediately start to lose pluripotency after ceasing to be cultured in pluripotency-
sustaining conditions.
Figure 17 - Western Blotting for Differentiation Markers for E14 ESC and EBs. Resulting quantifications are the result of one experiment each.
Along with a progressive loss of pluripotency, cells differentiating in this way will show
increasing levels of specific markers for specific tissues. Therefore, to further characterize
these differentiating culture, western blotting for markers of primordial germ layers. Figure
17 shows that overtime, markers for all two germ layers (AFP for primordial endoderm(Abe et
al., 1996), αSMA for mesoderm (Skalli et al., 1989)) are increasing somewhat steadily. The
different expression rates (in cases, decreasing, as seen for the levels of αSMA) may not refer
to a lesser increase of that specific cell type, but that its increase may be lessened when
compared with other cell types: seeing as this quantification is normalized to β-actin, that is a
measure of total protein mass, there could be more cells contributing to the whole protein
content, but not specifically expressing one cell marker. Case in point, and while not evident
because of the very different scale, it appears that AFP-positive cells show an approximate
enrichment of 400% on day six, having increased through the whole assayed period in a stable
manner, greatly outmatching the apparent enrichment of αSMA–positive cells. In order to
fully understand and measure the true enrichment for each germ layer, flow-cytometry could
be performed. But as the purpose of the aforementioned assay was to show the
differentiation capabilities of E14 cells, the WB analysis clearly showed that capability.
A similar assay should have been performed to characterize the capability of these cells
to commit to a neuronal lineage, but the antibody did not work for western blot. Nonetheless,
these cells are able to generate neuronal germ line, as shown in Figure 21.
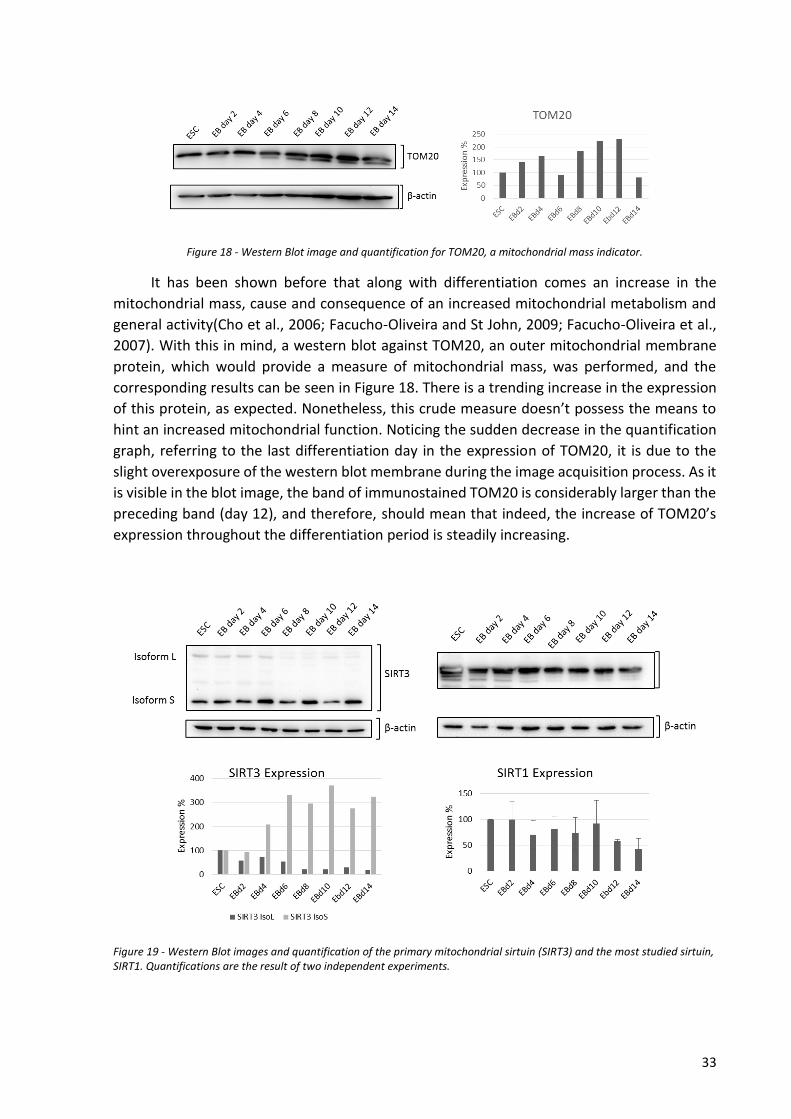
33
Figure 18 - Western Blot image and quantification for TOM20, a mitochondrial mass indicator.
It has been shown before that along with differentiation comes an increase in the
mitochondrial mass, cause and consequence of an increased mitochondrial metabolism and
general activity(Cho et al., 2006; Facucho-Oliveira and St John, 2009; Facucho-Oliveira et al.,
2007). With this in mind, a western blot against TOM20, an outer mitochondrial membrane
protein, which would provide a measure of mitochondrial mass, was performed, and the
corresponding results can be seen in Figure 18. There is a trending increase in the expression
of this protein, as expected. Nonetheless, this crude measure doesn’t possess the means to
hint an increased mitochondrial function. Noticing the sudden decrease in the quantification
graph, referring to the last differentiation day in the expression of TOM20, it is due to the
slight overexposure of the western blot membrane during the image acquisition process. As it
is visible in the blot image, the band of immunostained TOM20 is considerably larger than the
preceding band (day 12), and therefore, should mean that indeed, the increase of TOM20’s
expression throughout the differentiation period is steadily increasing.
Figure 19 - Western Blot images and quantification of the primary mitochondrial sirtuin (SIRT3) and the most studied sirtuin, SIRT1. Quantifications are the result of two independent experiments.
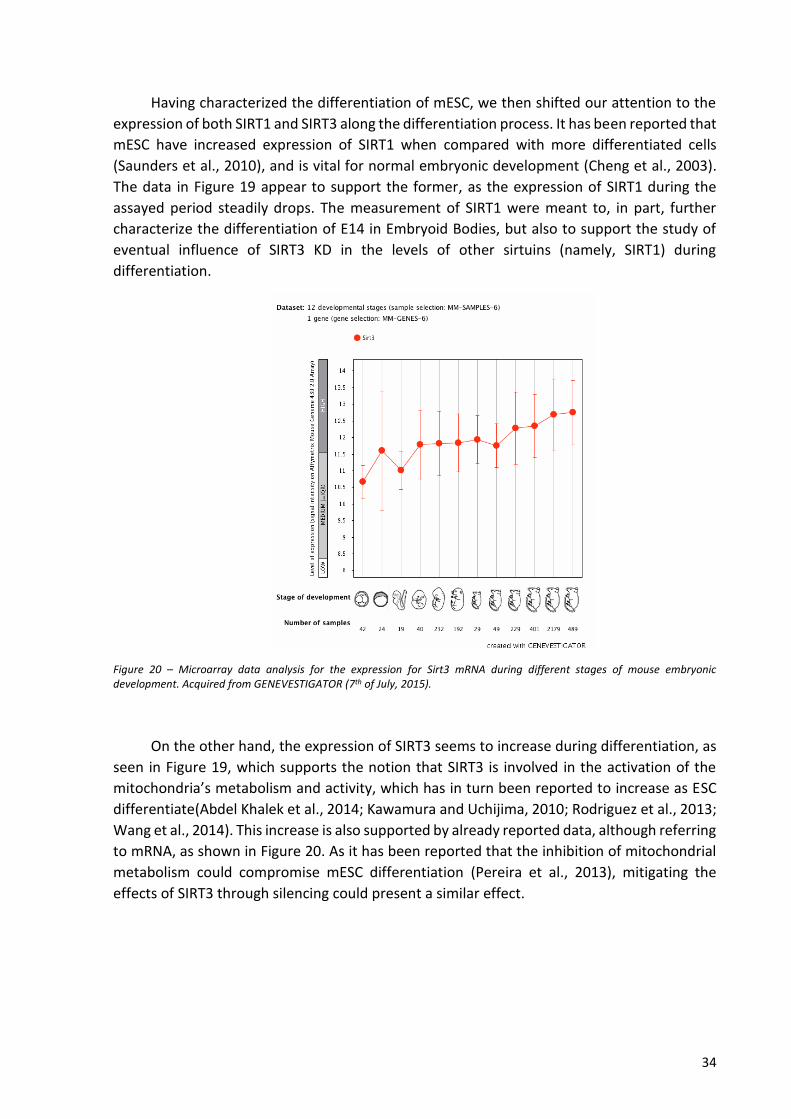
34
Having characterized the differentiation of mESC, we then shifted our attention to the
expression of both SIRT1 and SIRT3 along the differentiation process. It has been reported that
mESC have increased expression of SIRT1 when compared with more differentiated cells
(Saunders et al., 2010), and is vital for normal embryonic development (Cheng et al., 2003).
The data in Figure 19 appear to support the former, as the expression of SIRT1 during the
assayed period steadily drops. The measurement of SIRT1 were meant to, in part, further
characterize the differentiation of E14 in Embryoid Bodies, but also to support the study of
eventual influence of SIRT3 KD in the levels of other sirtuins (namely, SIRT1) during
differentiation.
Figure 20 – Microarray data analysis for the expression for Sirt3 mRNA during different stages of mouse embryonic development. Acquired from GENEVESTIGATOR (7th of July, 2015).
On the other hand, the expression of SIRT3 seems to increase during differentiation, as
seen in Figure 19, which supports the notion that SIRT3 is involved in the activation of the
mitochondria’s metabolism and activity, which has in turn been reported to increase as ESC
differentiate(Abdel Khalek et al., 2014; Kawamura and Uchijima, 2010; Rodriguez et al., 2013;
Wang et al., 2014). This increase is also supported by already reported data, although referring
to mRNA, as shown in Figure 20. As it has been reported that the inhibition of mitochondrial
metabolism could compromise mESC differentiation (Pereira et al., 2013), mitigating the
effects of SIRT3 through silencing could present a similar effect.
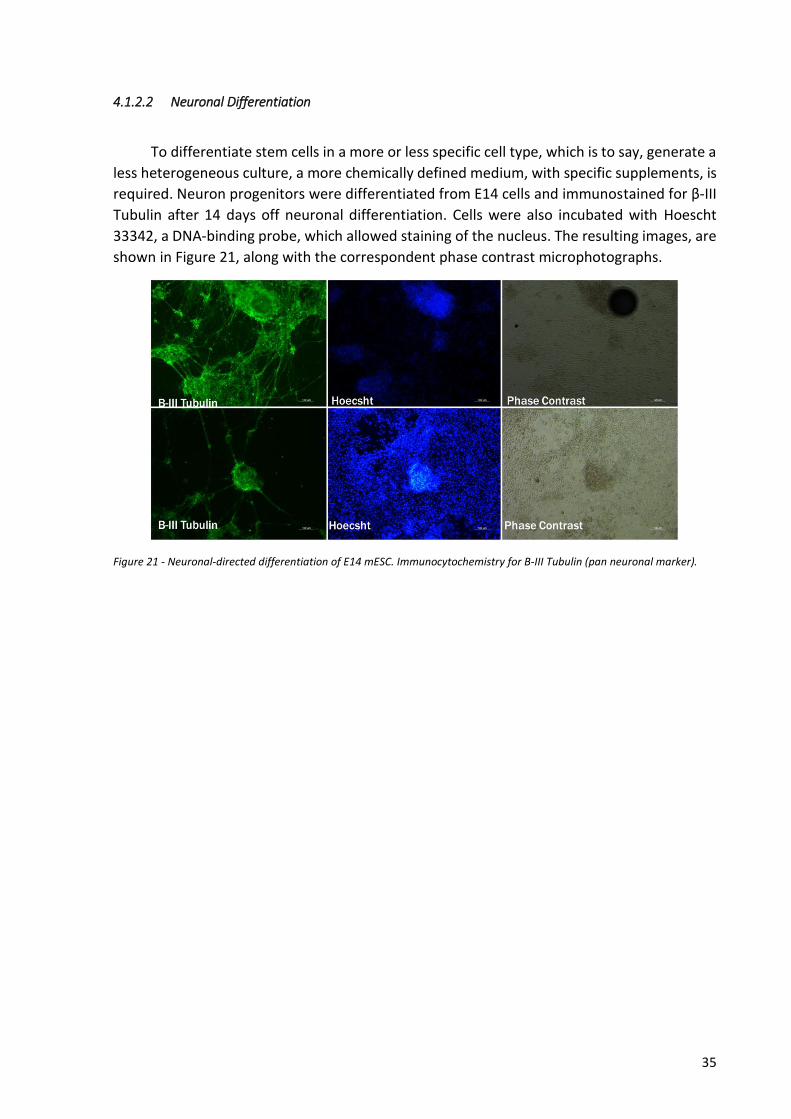
35
4.1.2.2 Neuronal Differentiation
To differentiate stem cells in a more or less specific cell type, which is to say, generate a
less heterogeneous culture, a more chemically defined medium, with specific supplements, is
required. Neuron progenitors were differentiated from E14 cells and immunostained for β-III
Tubulin after 14 days off neuronal differentiation. Cells were also incubated with Hoescht
33342, a DNA-binding probe, which allowed staining of the nucleus. The resulting images, are
shown in Figure 21, along with the correspondent phase contrast microphotographs.
Figure 21 - Neuronal-directed differentiation of E14 mESC. Immunocytochemistry for B-III Tubulin (pan neuronal marker).

36
4.2 MOLECULAR BIOLOGY: PLASMID CHARACTERIZATION, BACTERIAL CULTURE AND DNA
AMPLIFICATION/ISOLATION
4.2.1 Plasmid elements and description
Figure 22 – mRNA sequences for the three main alternative splicings for Sirtuin3, with the shRNA targets highlighted. A – mRNA sequence for the SIRT3 transcript variant 1, regarded as cytoplasmic. B - mRNA sequence for the SIRT3 transcript variant 2, regarded as cytoplasmic. C - mRNA sequence for the SIRT3 transcript variant 3, regarded mitochondrial. D – mRNA target sequences for plasmid-expressed shRNAs. E – shRNA-expressing plasmid chosen for transfection.
The first step we must take when aiming to perform a protein knockdown is to have
knowledge of the target protein’s mRNA sequence, in order to design short nucleotide
sequences that will later be used by the cell’s enzymatic silencing machinery, as described
before. These short sequences, typically of 19 to 30 nucleotides should be specific to the target
sequence and, very much like primer designing, shouldn’t align with other sequences. In
Figure 22, the canonical mRNA sequences for SIRT3 are shown, where sequences A and C give
rise to the shorter isoform of SIRT3 (Isoform S, 28kDa), which is regarded as cytoplasmic and
not possessing relevant deacetylating activity. The remaining sequence (B) may equally code
for the three isoforms of SIRT3, and therefore, a longer isoform (Isoform L, 36kDa), will surely
A 1 acttccgcta aacttctccc gggtttctgg ccctgccctt gaggcattaa agagtagagg
61 tgcctgggga cagctagcca ctgactggtc acgtagcctc aagcctgcag acttgggtcc
121 tctgaaaccg gatggcgttt ggcgaggact agtgttacag gtgggagaag gcccatatcc
181 ctctgtgtgg gagcctcagg cggctttgga ggtggaggaa gcagtgagaa gaagttttct
241 ctgcaggatg tagctgagct gcttcggacc agagcctgca gtagggtggt ggtcatggtg
301 ggggccggca tcagcacacc cagtggcatc ccggacttca gatccccagg gagcggcctc
361 tacagcaacc ttcagcagta tgacatcccg taccctgaag ccatctttga acttggcttt 421 ttctttcaca accccaagcc ctttttcatg ttggccaagg agctgtaccc tgggcactac
481 aggcccaatg tcactcacta cttcctgagg ctcctccacg acaaggagct gcttctgcgg
541 ctctatacac agaacatcga cgggcttgag agagcatctg ggatccctgc ctcaaagctg
601 gttgaagccc acgggacctt tgtaacagct acatgcacgg tctgtcgaag gtccttccca
661 ggggaagaca tatgggctga tgtgatggcg gacagggtgc cccgctgccc tgtctgtact
721 ggcgttgtga aacccgacat tgtgttcttt ggggagcagc tgcctgcaag gttcctactc
781 catatggctg acttcgcttt ggcagatctg ctactcattc ttgggacctc cctggaggtg
841 gagccttttg ccagcttgtc tgaagcagta cagaaatcag tgccccgact gctcatcaat 901 cgagacttgg tggggccgtt cgttctgagt cctcgaagga aagatgtggt ccagctaggg
961 gatgtagttc atggtgtgga aaggctggtg gacctcctgg ggtggacaca agaactgctg
1021 gatcttatgc agcgggaacg tggcaagctg gatggacagg acagataaga ctatggcttc
1081 ttcacctggg gaagtcacac agcagatcat cctatgtcca gcaagacttc atgcctgaag
1141 acagctccaa cacgtttaca aacatgaacc agaccacaac atgtggcctg gacagtggtc
1201 ctccgaggct gcctttggaa aggctgacca gggatgtcta cccttggggc ccctccatgt
1261 gtgcgccctg tccacctcat cactgctgaa ggtgtagtgc aggtgctgct ttctgcagcg
1321 gcccttaagt tatcacgagg gcagcacagc acgcccgtcg ccaggcaggc gatgcactag
1381 ggcaatctag catgttgatc ggtaaagtgg catctttaac tacaacatca tttcttgcat 1441 gaaataaact tagtataaaa acttggcaaa aaaaaaaaaa aaaa
B 1 ggggattcgg atggcgcttg accctctagg cgccgtcgtc ctgcagagca tcatggcgct
61 aagcggtcga ctggcattgg ccgcgctcag actgtggggt ccgggagtgt tacaggtggg
121 agaaggccca tatccctctg tgtgggagcc tcaggcggct ttggaggtgg aggaagcagt
181 gagaagaagt tttctctgca ggatgtagct gagctgcttc ggaccagagc ctgcagtagg
241 gtggtggtca tggtgggggc cggcatcagc acacccagtg gcatcccgga cttcagatcc
301 ccagggagcg gcctctacag caaccttcag cagtatgaca tcccgtaccc tgaagccatc
361 tttgaacttg gctttttctt tcacaacccc aagccctttt tcatgttggc caaggagctg
421 taccctgggc actacaggcc caatgtcact cactacttcc tgaggctcct ccacgacaag
481 gagctgcttc tgcggctcta tacacagaac atcgacgggc ttgagagagc atctgggatc
541 cctgcctcaa agctggttga agcccacggg acctttgtaa cagctacatg cacggtctgt
601 cgaaggtcct tcccagggga agacatatgg gctgatgtga tggcggacag ggtgccccgc
661 tgccctgtct gtactggcgt tgtgaaaccc gacattgtgt tctttgggga gcagctgcct 721 gcaaggttcc tactccatat ggctgacttc gctttggcag atctgctact cattcttggg
781 acctccctgg aggtggagcc ttttgccagc ttgtctgaag cagtacagaa atcagtgccc
841 cgactgctca tcaatcgaga cttggtgggg ccgttcgttc tgagtcctcg aaggaaagat
901 gtggtccagc taggggatgt agttcatggt gtggaaaggc tggtggacct cctggggtgg
961 acacaagaac tgctggatct tatgcagcgg gaacgtggca agctggatgg acaggacaga
1021 taagactatg gcttcttcac ctggggaagt cacacagcag atcatcctat gtccagcaag
1081 acttcatgcc tgaagacagc tccaacacgt ttacaaacat gaaccagacc acaacatgtg
1141 gcctggacag tggtcctccg aggctgcctt tggaaaggct gaccagggat gtctaccctt
1201 ggggcccctc catgtgtgcg ccctgtccac ctcatcactg ctgaaggtgt agtgcaggtg
1261 ctgctttctg cagcggccct taagttatca cgagggcagc acagcacgcc cgtcgccagg
1321 caggcgatgc actagggcaa tctagcatgt tgatcggtaa agtggcatct ttaactacaa
1381 catcatttct tgcatgaaat aaacttagta taaaaacttg gcaaaaaaaa aaaaaaaaa
C 1 ggggattcgg atggcgcttg accctctagg cgccgtcgtc ctgcagagca tcatggcgct
61 aagcggtcga ctggcattgg ccgcgctcag actgtggggt ccgggaggtg ggagaaggcc
121 catatccctc tgtgtgggag cctcaggcgg ctttggaggt ggaggaagca gtgagaagaa
181 gttttctctg caggatgtag ctgagctgct tcggaccaga gcctgcagta gggtggtggt
241 catggtgggg gccggcatca gcacacccag tggcatcccg gacttcagat ccccagggag
301 cggcctctac agcaaccttc agcagtatga catcccgtac cctgaagcca tctttgaact
361 tggctttttc tttcacaacc ccaagccctt tttcatgttg gccaaggagc tgtaccctgg
421 gcactacagg cccaatgtca ctcactactt cctgaggctc ctccacgaca aggagctgct
481 tctgcggctc tatacacaga acatcgacgg gcttgagaga gcatctggga tccctgcctc
541 aaagctggtt gaagcccacg ggacctttgt aacagctaca tgcacggtct gtcgaaggtc
601 cttcccaggg gaagacatat gggctgatgt gatggcggac agggtgcccc gctgccctgt
661 ctgtactggc gttgtgaaac ccgacattgt gttctttggg gagcagctgc ctgcaaggtt 721 cctactccat atggctgact tcgctttggc agatctgcta ctcattcttg ggacctccct
781 ggaggtggag ccttttgcca gcttgtctga agcagtacag aaatcagtgc cccgactgct 841 catcaatcga gacttggtgg ggccgttcgt tctgagtcct cgaaggaaag atgtggtcca
901 gctaggggat gtagttcatg gtgtggaaag gctggtggac ctcctggggt ggacacaaga
961 actgctggat cttatgcagc gggaacgtgg caagctggat ggacaggaca gataagacta
1021 tggcttcttc acctggggaa gtcacacagc agatcatcct atgtccagca agacttcatg
1081 cctgaag aca gctccaacac gtttac aaac atgaaccaga ccacaacatg tggcctggac
1141 agtggtcctc cgaggctgcc tttggaaagg ctgaccaggg atgtctaccc ttggggcccc
1201 tccatgtgtg cgccctgtcc acctcatcac tgctgaaggt gtagtgcagg tgctgctttc
1261 tgcagcggcc cttaagttat cacgagggca gcacagcacg cccgtcgcca ggcaggcgat 1321 gcactagggc aatctagcat gttgatcggt aaagtggcat ctttaactac aacatcattt
1381 cttgcatgaa ataaacttag tataaaaact tggcaaaaaa aaaaaaaaaa a
scr - GCTTCGCGCCGTAGTCCTA
sh1- CGGCTCTATACACAGAACA
sh2- TGCAAGGTTCCTACTCCAT
sh3- GACTGCTCATCAATCGAGA
sh4- ACAGCTCCAACACGTTTAC
E
D

37
derived from this sequence(Yang et al., 2010). Yang and colleagues demonstrated the
differential expression of SIRT3’s isoforms, and also established their localization and activity,
which have been previously hinted by others (Bao et al., 2010; Cooper et al., 2009; Shi et al.,
2005). As we were interested in the mitochondrial portion of the cell metabolism, and SIRT3
is documented to mainly deacetylate mitochondrial proteins, we will focus on SIRT3 Isoform
L (Sirt3-L).
Many knockdown solutions are commercially available, depending on the specific
silencing one wishes to achieve. siRNAs can be directly transfected and very transiently
knockdown a target protein. Viral vectors allow for the chromosomal integration of shRNA
expressing DNA sequences, generating a genetic, stable, knockdown. Or, if a balanced solution
is sought, plasmids expressing those shRNAs are perhaps the most adequate choice. The
advantage of using this type of construct, along with increased stability, is that other elements
can be included in the same plasmid, such as reporter proteins and/or selection markers. The
first allows the user to quickly identify if the transfection was successful, and the second
provides a way to obtain a more or less homogeneously transfected culture.
Therefore, we for a plasmid construct that would provide all the elements described.
Among many suppliers, the best plasmid choices were given by Genecopeia™, which allowed
us to choose the target protein, selection marker and the reporter gene. Figure 22E shows the
chosen plasmid for transfection. It includes the fluorescent reporter protein mCherry (allows
us to fluorescently track the transfection status of cultured cells), and also a selection marker
(a puromycin resistance gene). The plasmid also includes two “strong” promoters, H1
(histone1) and SV40 (Simian vacuolating virus 40), to assure extensive expression of both the
shRNA and annex components of the plasmid. 4 plasmids expressing shRNA for 4 different
regions of SIRT3 mRNA and one plasmid encodes for a “mock” shRNA (shRNAscr, which does
not recognize none of the presented sequences. This plasmid, therefore, is meant to show
that the decrease in SIRT3 is due to the shRNA sequences present, and not to the plasmid
itself. The sequences targeted by each shRNA in mRNA of SIRT3 are highlighted, and each color
corresponds to a different shRNA-targeting sequence. BLAST analysis for both the shRNAscr
and each individual shRNA (1-4), showed that a) the target sequence for the shRNAscr has a
low sequence alignment score for mus musculus transcripts, and b) shRNA (1-4) have
maximum sequence alignment score to the aforementioned SIRT3 mRNA sequences, and a
low score for every other mRNA sequence in Mus musculus transcripts.
It should be noted that this plasmid also incorporates elements that allow it to be
integrated in a host genome if lentiviral vectors were to be used. These elements (5’ and 3’
LTR and Psi (Ψ)) are used by retroviruses to integrate their genetic information on the host
genome, allowing the virus to replicate.(Klimo et al., 2004; Xu, 2011).
4.2.2 Bacterial transformation
After choosing the plasmid that will be employed to transfect and silence SIRT3 in
mammalian cell lines, we proceeded to transform E.coli in order to amplify the initial amount
38
of DNA. This would allow me to have a steady stock of plasmidic DNA for each shRNA, without
needing to continuously order new plasmids. As the chosen plasmid contains, among other
elements, a prokaryote origin of replication (pUC ori), it allows for this type of procedure. After
transformed with each shRNA-expressing plasmid (separately) through heat-shock, bacteria
were plated in different LB-agar plates, as shown in Figure 23, and incubated overnight. To
assure both the sterility of our work, and the stability of the antibiotics in the LB-agar plates,
adequate controls were used. Therefore, WT (non-transformed E.coli, putatively sensitive to
carbenicillin) were plated in LB-agar plates with and without antibiotic, as presented in Figure
23A and Figure 23B. As they are not resistant to carbenicillin, WT E.coli does not proliferate,
as seen in LB-agar without addition of any antibiotic. Nevertheless, plasmid positive E.coli
colonies are seen throughout Figure 23C to Figure 23H, as they are resistant to carbenicillin,
the resistance being conferred by the shRNA-expressing plasmid. Before following up to
plasmid DNA isolation, these colonies must be visually analyzed, and only E.coli colonies
without satellite colonies (indicators of antibiotic depletion) were picked and cultured in SOC
medium to increase the plasmid-containing bacterial mass.
Figure 23 -Transformed E.coli in LB-agar plates, after overnight incubation. A - Bacterial streaking of WT E.coli in LB-agar plate. B -Bacterial streaking of WT E.coli in LB-agar plate with 50ug/mL carbenicillin antibiotic. C – LB-agar plate with 50ug/mL carbenicillin, plated with shRNA1 transformed E.coli. D –Zoomed section of plate C, with two plasmid-positive E.coli colonies, ready to be picked to the DNA isolation process. E - LB-agar plate with 50ug/mL carbenicillin, plated with shRNA2 transformed E.coli. F - LB-agar plate with 50ug/mL carbenicillin, plated with shRNA3 transformed E.coli. G - LB-agar plate with 50ug/mL carbenicillin, plated with shRNA4 transformed E.coli. H - Zoomed section of plate C, with an already picked plasmid-positive colony circled in blue ink.
To achieve an initial mass of plasmid positive bacteria large enough to assure a profitable
amount of amplified plasmid DNA, two SOC broth cultures were performed. This broth is
somewhat similar to LB broth, while differing in cation presence (increased Ca2+ and Mg2+) and
also increased glucose content, important for catabolite repression, which, in short, allows
bacteria to adapt and have increased growth rate. The choice of this medium over LB was due
to it being reported to increase the efficiency of bacterial transformation (Hanahan, 1983).
An overnight culture starting with a single colony, picked as described above, and
inoculated in a typical volume of 5 mL, with 50ug/mL carbenicillin. Again, to assure the sterility
39
of the process and the stability of the components, three controls were performed, as shown
in Figure 24. WT E.coli were picked from the corresponding LB-agar plate (shown above) in
SOC broth with and without antibiotic (Figure 24A and D), proving that the antibiotic is still
selecting bacteria based on the plasmid presence (or rather absence). Another experiment,
meant to show that in fact, antibiotic resistance conferred by the shRNA-expressing plasmid
is specific for carbenicillin was conducted, by inoculating shRNA-expressing plasmid colonies
in SOC broth with added kanamycin (100ug/mL). As seen in Figure 24C, by the lack of turbidity
of the medium, transformed E.coli aren’t able to grow.
Figure 24 – SOC cultures of both WT and transformed E.coli, after 8 hours of incubation at 37°C with agitation. Turbidity indicates bacterial growth. (A) - WT E.coli + SOC broth + 50ug/mL carbenicillin. B – Plasmid positive E.coli + SOC broth + 50ug/mL carbenicillin. C – Plasmid positive E.coli + SOC broth + 100ug/mL kanamycin. D - WT E.coli + SOC broth.
In the following morning, these containers are observed to confirm bacterial growth
(visible turbidity), and then prepared to undergo the DNA extraction/isolation process.
4.2.3 DNA isolation, quantification, characterization
Nowadays DNA isolation is usually performed with premade kits that rely in
chromatographic isolation of DNA, with adequate chromatographic columns. Various kits are
commercially available, the distinguishing attribute being mainly the bacterial culture volume
that we want to start from. As we were unsure of the efficiency of our transformation
protocol, we started by ordering a smaller kit (dubbed “Miniprep”, short for minipreparation,
a fast and small-scaled isolation process), starting with bacterial cultures up to 5 mL. After
conducting the aforementioned process, we proceeded to quantify the DNA isolates (as seen
in Figure 25). We also electrophorectically confirmed the plasmid size through a 1% agarose
gel, which showed well-defined bands of approximately 8500 bp, as expected.

40
Figure 25 - Quantification of shRNA-expressing plasmids isolated from E.coli through the Miniprep kit.
Having both our transformation and bacterial growth protocols validated, and having an
increased pool of plasmid DNA to work with (so we could save the ordered aliquots of both
consumption and freeze-thaw-derived degradation), we scaled up the process, to increase the
yield of plasmid DNA. Therefore, we tested the DNA yield of a Maxiprep kit, which required at
least 200 mL of bacterial culture. This large culture required a pre-culture of picked E.coli.
After the “overday” incubation of picked colonies, very much alike the one shown in
Figure 24, a scaled up culture is prepared. The contents of the shRNA-expressing plasmid-
positive colonies were transferred to a 1L Erlenmeyer flask with 300 mL of SOC broth with
50µg/mL carbenicillin, labelled, and incubated overnight at 37°C with agitation.
In the morning following this incubation period, the Maxiprep kit for DNA isolation is
used according to the manufacturer’s instructions. The isolated DNA is then precipitated with
isopropanol, and “cleaned” with ethanol before being diluted in water. This water-diluted
DNA is, like before, characterized by quantification and agarose electrophoresis, the resulting
images visible in Figure 26. The plasmid DNA isolates were aliquoted and frozen, pending
transfection.
Figure 26 - Characterization of shRNA expressing plasmids isolated via the Maxiprep kit. A - Quantification of plasmid DNA for each isolate. B - Agarose gel electrophoresis for plasmid DNA, along with a DNA ladder.
0
50
100
150
shRNA 1 ShRNA 2 shRNA 3 shRNA4 scr shRNADN
A C
on
cen
trat
ion
ng/
µL
shRNA-expressing Plasmids
Miniprep DNA Quantification

41
In addition to the plasmid size and concentration, another factor we took into
consideration in order to further characterize the DNA isolates were the absorvance ratios for
each samples. During the quantification process by the Nanodrop® apparatus, two absorbance
ratios are obtained, as seen in Table 8. These ratios reflect the purity of the DNA sample,
regarding both protein contamination (proteins absorb mainly at 280nm, while double-
stranded DNA absorbs at 260 nm), but also contamination with organic reagents, often used
during the isolation of nucleic acids (some of these reagents, like TRIzol, absorb primarily at
230nm). Therefore, relatively high values for both absorbance ratios is a good indicator of DNA
purity. The values for both absorbance ratios, for all the assayed samples, are higher than
those regarded as the “minimum optimal values” by the manufacturer (Thermo Scientific,
2011), and so, we consider that our samples are pure, and were rather satisfied with the new
DNA pool and turned to this kit whenever new DNA samples were required.
Table 8 - DNA quantification for Maxiprep kit isolates. Quantification was performed in a Nanodrop® apparatus.
shRNA-expressing
plasmid Concentration (ng/µL) Absorbance Ratios
260/280 260/230
shRNA 1 1400.1 2.01 2,44
shRNA 2 1072.7 1.99 2,39
shRNA 3 1207 1.98 2,38
shRNA 4 1347.5 2.02 2,42
Scrambled shRNA 2152 1.93 2,38
4.3 SIRT3 SILENCING IN MESC
4.3.1 mESC selection conditions (SRB and cell counting)
After cell transfection, the plasmid-positive cells must be selected, so that the most
homogeneous culture of positively transfected cells can be achieved. As explained above, the
chosen plasmid contains a gene that gives resistance to puromycin in mammalian cells. This
allows us to use the antibiotic puromycin to select the plasmid-positive cells, while killing all
other, non-transfected cells. Therefore, we must determine beforehand which amount of
puromycin is enough to eliminate all cells without the resistance-conferring gene:
unstransfected cells are plated, and then, different concentrations of puromycin are added in
the following day. Media was exchanged daily until day 7, when the highest of puromycin was
able to eliminate every cell in culture. After, the surviving cell number and total cell density
was assayed, in order to select the adequate puromycin concentration.
This procedure was conducted for E14 mESCs, and the results for both cell counting and
cell density (attained through SRB) is seen in Figure 27. We have chosen 1µg/mL puromycin
as an adequate concentration to select puromycin-resistant cells, once it was the lowest
tested concentration of puromycin that was able to eliminate all cultured cells.

42
Figure 27 - Selection conditions for transfected E14 cells. Cells were either manually counted (A) or subject to sulforhodamine B (B). These results were obtained from three independent experiments.
4.3.2 Transfection protocol and optimization (DNA:Lipofectamine ratios, incubation times)
Having prepared all the elements required to achieve transfection in mESC, the first step
of the process was to assay for the eventual toxicity of Lipofectamine® 2000 in these cells. As
seen in Figure 28, there was no apparent toxic effect of lipofectamine on the cultured cells.
The amount of both OptiMEM and Lipofectamine® 2000 added was concomitant with those
employed in the following transfections with shRNA-expressing plasmids.
Figure 28 - Microscopy imaging for E14 cells 24 hours after plating with (A) OptiMEM and (B) OptiMEM with Lipofectamine®2000
The next step in transfecting mESC and optimizing the transfection protocol was to use
different Lipofectamine:DNA ratios, as it has been reported that these ratios may influence
the transfection efficiency(Maurisse et al., 2010). This lead us to, based on literature, select a
total of 4 DNA:Lipofectamine® 2000 ratios (DNA:Lipofectamine®2000 1:1, 1:2, 1:3 and 1:4
ratio), preparing the transfections accordingly, and evaluating the transfection efficiency after
the application of the protocol. Without any antibiotic selection, the cells were observed with
fluorescence microscopy 48 hours after transfection, as shown in Figure 29.
Increasing concentrations of Lipofectamine® seem to increase the total number of
mCherry-fluorescent cells, even when comparing with the total cell number as visible in phase
contrast images. Based in these results, subsequent transfections were performed using a 1:4
ratio for DNA:Lipofectamine® 2000.

43
Figure 29 - Representative images of E14 mESC transfected with different Lipofectamine®2000:DNA ratios, with the DNA:Lipofectamine 3000 ratios adjacent. A, C, E and G represent phase contrast images, while B, D, F and H represent fluorescence images. Scale bar is 100µm.
While we understand, to some extent, that the transfection had been successful, as the
plasmid entered the cells, and its reporter gene (mCherry) is being expressed, the ratio of
transfected/non-transfected cells was low, revealing that the process was inefficient. As it was
been reported that Lipofectamine® 3000 would yield better transfection rates, we repeated
the protocol while using this improved reagent. Figure 30 presents the results for the new
transfected mESCs, and better rates for transfected/non-transfected colonies greatly
improved. A parallel, control experiment was performed in order to, as before, determine if
there is a toxic effect of Lipofectamine® 3000 on mESC. Like before, no visible effects were
seen, yielding results very much alike those of Figure 28.
Figure 30 – Representative images of E14 mESC transfected with different Lipofectamine®3000:DNA ratios, with the DNA:Lipofectamine 3000 ratios adjacent. A, C, E and G represent phase contrast images, while B, D, F and H represent fluorescence images. Scale bar is 100µm.
Following transfection, transfected cells were meant to be selected through addition of
puromycin, which would kill all unstransfected cells, while leaving plasmid-positive cells
44
unaffected. So, 48 hours after transfecting, puromycin was added with every medium
exchange, as per determined in section 4.3.1. Nevertheless, using a concentration of 1µg/mL,
which was the minimum concentration that would kill non-transfected cells, would result in
the death of all cells in culture, either plasmid-positive or negative. As no cells survived this
process, no further experiments were possible. After a new transfection, we applied a
concentration of 0.5µg/mL puromycin, instead of 1µg/mL. This would provide a milder
selection and allow us to obtain, in the very least, an enriched population of positively
transfected cells. Alas, this smaller concentration would reveal itself to have the same effects
as the preceding one. Again, there are no results to support this. This effect may be explained
by the relatively low rate of transfection for these cells: as some colonies are only partly
transfected (an example of a partially transfected mESC colony with an GFP-tagged protein
can be seen in Figure 31, courtesy of a fellow lab colleague), killing the non-resistant cells may
compromise the entire colonial structure, leading to further loss of both transfected and non-
transfected cells. Another cause that may be contributing to the lack of general survivability
may be the apoptotic cytokines and factors released by cells dying due to puromycin.
Figure 31 - Partly transfected mESC colony. This transfection was achieved by using the protocol described above, albeit with a GFP reporter-expressing plasmid. This image was kindly provived by a lab colleague.
As we weren’t able to generate an enriched, much less pure, culture of transfected E14
mESC, three courses of action were considered: transfect these cells recurring to a different
transfection method, as viral vectors or osmotic shock; or experiment with the same reagents
(the same DNA samples and Lipofectamine® reagents) in another cell line. As it is reported to
be easy to transfect (Tekle et al., 1991), are not as expensive to culture as mESC, and possess
an active mitochondrial metabolism, the NIH-3T3 cell line was chosen for the next segment of
the study.
4.4 SIRT3 SILENCING IN A DIFFERENTIATED CELL LINE: 3T3
As mESCs proved difficult to both efficiently transfect and select, we chose another cell
line to proceed with the transfection protocol. This cell line would validate not only the

45
transfection protocol, but also the plasmid construct itself. If the transfection protocol would
not work in these (documented to be easy to transfect) cells, this would point out that the
transfection protocol was inadequate. If we manage to transfect these cells and observe a
diminished levels of SIRT3, we must procure another transfection protocol, as the plasmid
itself performs its inherent function.
4.4.1 3T3 cell line culturing
NIH-3T3 cells (hereby designated by 3T3 cells) are a cell line of mouse embryonic
fibroblasts, firstly isolated in 1962 from National Institute of Health (NIH) Swiss mouse
embryos. These cells, which are inhibited by benzodiazepines as well as contact, got their
designation according to the “3 day transfer, inoculum 3x10⁵ cells” method of passaging, and
are nowadays a standardized and widely used fibroblast cell line.
Figure 32 - The 3T3 cell line in culture with 60% confluence. Scale bar is 100µm.
Figure 32 shows 3T3 cells in culture, nearing adequate density of passaging. When
compared with ESC, 3T3 cells are also cultured while adherent, but are much easier to culture:
while they are contact-inhibited, their growth is fairly easy to follow, and the cell density does
not hinder their growth nor survival. Therefore, they can be plated with much less accuracy
than their pluripotent counterparts. Also, they grow in a basic, much cheaper culture medium,
which does not need to be exchanged daily. Moreover, the detaching reagent used for these
cells (TrypLE, an animal origin-free replacement for trypsin enzyme) is also less expensive than
the Accutase used for mESC while maintaining a low toxicity and high efficiency. 3T3 cells
suffer less from external factors as temperature or medium acidity. Finally, as 3T3 grow in a
single-cell fashion (unlike E14 cells, which grow in colony structures), they should be easier to
both transfect and select.

46
4.4.2 Selection conditions (SRB)
Similar to E14 cells, 3T3 cells were tested for the concentration of puromycin would kill
all non-transfected cells and then will allow the selection of resistant cells. In a protocol very
similar to that which was applied before, 3T3 cells were plated with a density of 5000
cells/cm2, and exposed to different concentrations of the antibiotic. After 7 days after plating
and 6 days of puromycin selection, the cells were fixed with PFA 4% and subjected to the SRB
assay. The result for this assay are in Figure 33, which shows that concentrations of puromycin
starting at 1.5µg/mL were able to virtually kill all non-resistant cells.
Figure 33 - Selection conditions for 3T3 cells. Cells were subject to sulforhodamine B colorimetric assay. Cells were fixed after 7 days in culture. These results were obtained from three independent experiments.
While selecting transfected cells, however, this concentration proved insufficient to kill
all non-transfected cells in culture, forcing us to increase the amount of puromycin added to
2 µg/mL. This was probably due to the sheer number of plasmid-positive cells in the culture.
As the puromycin resistance gene expressed by the plasmid encodes for Puromycin N-
acetyltransferase, which inactivates puromycin by acetylation (Gómez Lahoz et al., 1991),
puromycin degradation by these resistant cells does occur, thus lowering the effective
puromycin concentration in the culture medium, to levels in which the available antibiotic is
not enough to eliminate plasmid-negative cells.
4.4.3 Transfection & selection efficiency
As stated before, 3T3 cells were transfected following the same protocol as with E14
cells. Cells were transfected with a 1:1:1:1 mixture of all 4 shRNA-expressing plasmids. The
first transfection, like before, was meant to assay the most effective ratio of
DNA:Lipofectamine. Surprisingly, the most effective ratio of DNA:Lipofectamine was of 1:1,
and so, this ratio was chosen for subsequent transfections. Transfections with 3T3 cells were
-20
30
80
130
Control 0,5ug/ml 1ug/ml 1,5ug/ml 2ug/ml 2,5ug/ml
Cel
l Den
sity
%
Cell Density (SRB assay)

47
performed with Lipofectamine 2000, as it is considerately cheaper than Lipofectamine 3000,
and we verified this reagent to be good enough in the 3T3 cells.
Figure 34 – Representative microphotographs of 3T3 cells, 24h after transfection, 48h after transfection. 3T3 cells, 7 days after transfecting, and 6 days after starting puromycin (2µg/ml) selection. Transfected 3T3 cell culture, 14 days after transfection, cultured in 2µg/ml puromycin. Scale bar is 100 µm.
Figure 34 shows the result of this transfection protocol in 3T3 cells, and subsequent
selection, up to the point of obtaining a visually “pure” culture of fluorescent, puromycin
resistant 3T3 cells. These cells able to be were cultured for a period of two months, circling 15
passages. During this period, both RNA and total protein content were collected to evaluate
the silencing by SIRT3 shRNA expressed by the plasmids. In order to assure a transfected stock
of 3T3 cells, cultures were also frozen and stored at -80°C. Furthermore, and in spite of not
24h, w/o
puromycin
48h, w/o
puromycin
7 days (5 with
puromycin)
14 days (12 with
puromycin),
passaged once

48
knowing if in fact the levels of SIRT3 were knocked down, positive plasmid cells were dubbed
“Knockdown”, of KD, for short.
4.4.4 Cytometry analysis of Transfected/Non-Transfected cells
In order to further characterize the transfection efficiency in 3T3 cells, we performed a
flow cytometry analysis to measure the percentage of cells with red fluorescence, which
would be exclusive to cells expressing the mCherry fluorescent reporter protein, encoded by
our plasmid.
Figure 35 – Flow-cytometry results for the analysis of both transfected and non-transfected 3T3 cells. A and B refer to WT 3T3 cells. C and D refer to KD 3T3 cells. E shows the merge for both FL2 fluorescence analysis.
Figure 35 shows the flow-cytometry profiles for both transfected and non-transfected
cells. After selecting the adequate gates for each cell sample (A and C), the percentage of red
fluorescent cells was measured. While WT 3T3 cells show autofluorescence, as seen in Figure
35B, this fluorescence is lower than that of plasmid-positive cells (Figure 35D) and proper
compensation was done when settings were defined during data acquisition. In spite of the
entirety of transfected and selected 3T3 cells being visibly fluorescent (by fluorescence
(A) (B)
(C) (D)
(E)

49
microscopy), only approximately 70% of the KD 3T3 cells were fluorescent. As these cells were
being cultured in selected conditions, we assume that this lack of fluorescence can be caused
by photobleaching of mCherry, once the detaching of these cells was not conducted in the
dark. Therefore, and although it couldn’t be quantified, some of the low-fluorescing cells (as
seen in Figure 35D) could be plasmid-positive cells, and not just autofluorescent cells.
Nevertheless, these results show that both the transfection and selection of 3T3 cells was
successful, and mean that we can now focus on evaluating the effectiveness of protein
knockdown.
4.4.5 Evaluating SIRT3 silencing
Because transfection of 3T3 cells with the shRNA-expressing plasmid doesn’t necessarily
mean that the target protein is being silenced, we must evaluate the knockdown of SIRT3
levels, firstly through qRT-PCR (which is the quantification of expressed Sirt3 mRNA), and then
by Immunocytochemistry and Western Blot (the protein).
4.4.5.1 qRT-PCR analysis
As explained before, shRNA-mediated silencing is done at the mRNA level. Therefore, it
seemed logic to evaluate the silencing extension by qRT-PCR, the measurement of the levels
of Sirt3 mRNA. The result for this evaluation (with a single experiment) is shown in Figure 36,
and interestingly contrasts with the expected knockdown of Sirt3 mRNA, as there appears to
be a slightly increased expression of these mRNA in transfected cells (KD) when compared
with non-transfected cells (WT). The levels of the other two mitochondrial Sirtuins (Sirt4 and
5), as well as of Sirtuin1 (the major cellular deacetylase) were also evaluated to verify a
possible unspecific silencing or a possible compensatory effect for Sirt3 silencing, but no effect
could be visible to in Sirt1, 4 and 5 mRNA levels, similarly to Sirt3. As these results correspond
to only one sample, a new qRT-PCR should be performed, with new RNA samples.
Figure 36 - qRT-PCR analysis for expression of mitochondrial Sirtuins (Sirt3, Sirt4, Sirt5) and also Sirt1 mRNA for both non-transfected (WT) and transfected (KD) cells. This image is the result of one experiment with 2 replicas for the same sample.
50
In spite of this unexpected result, there was a plausible and logical explanation for an
increased expression of mRNA for Sirt3 in theoretically silenced cells. With siRNA mediated
silencing, the mRNA for the target protein is either signaled to degradation by processed siRNA
binding or, in an alternative manner, the siRNA binds to the target mRNA and blocks its
translation in the ribosome. In this case, we hypothesize that Sirt3 mRNA is not being primarily
targeted for degradation, but can be instead being repressed and hindered from being
translated, and thus accumulating in the cells(Fellmann and Lowe, 2014; Rao et al., 2009).
Besides, this repression of translation could be in fact lowering the levels of SIRT3 (protein),
and the cell could try and compensate this by expressing more and more Sirt3 mRNA. All these
factors would end up increasing the total levels of mRNA as measured by qRT-PCR. Therefore,
the knockdown of SIRT3 must be confirmed through other techniques, specifically,
downstream of mRNA, which is, the protein level.
4.4.5.2 Immunocytochemistry
The first manner by which the protein levels of SIRT3 was assayed was through
Immunocytochemistry. Both transfected and non-transfected cells were plated in plastic
cover-slips in which ICC would be performed. When the cells reached 70% confluence, they
were fixed with a 4% PFA solution, blocked and incubated with an anti-SIRT3 primary antibody
and correspondent secondary antibody. Cells were also stained with Hoecsht 33342 (DNA-
binding dye) for co-localization purposes. This can be seen in Figure 37. mCherry fluorescence
can be faintly perceived in transfected cells, and its weak fluorescence is most likely derived
from the fixation process and the time that separates the moment of fixation from the time
in which this ICC was performed. Nonetheless, said fluorescence could not be seen in non-
transfected (WT) cells, as was expected. This proves that 3T3 cells do not possess auto
fluorescence for this wavelength.
The resulting images for ICC failed to show a clear, definitive and obvious decrease in
SIRT3. We were led to believe that either the silencing of SIRT3 was at least minimum, or
entirely absent. Nevertheless, while it is possible to quantify protein expression by ICC, this
measure is not precise, and would be more qualitative than quantitative. So, we took the total
protein contents isolated from transfected 3T3 cultures and performed Western Blotting for
SIRT3.

51
Figure 37 - Microphotographs of Immunostained 3T3 cultures. SIRT3 expression was evaluated, as well as the presence and absence of plasmid-derived mCherry. The first row shows transfected 3T3 cells, while the lower row shows non-transfected cells.
4.4.5.3 Western Blot analysis
Western Blotting provides the means to detect and quantify specific proteins with the
use of an antibody, specific for a target protein. We performed western blotting for whole-
cell protein samples from both WT and KD 3T3 cells.
Figure 38 - Western blotting for transfected (KD) and non-transfected (WT) 3T3 cells.
In Figure 38, the various isoforms described for SIRT3 are evident. Considering, as
mentioned above, that isoforms L (36kDa) and S (28kDa) as the two primary isoforms for
SIRT3. Again, as expected after ICC, the differences between the levels of SIRT3 of non-
transfected (WT) and transfected (KD) 3T3 cells are not visually evident, for neither isoform.
Quantification was then performed, and the resulting image is shown in Figure 39.
WT
KD
W
T K
D
WT
KD
SIRT3
β-actin
36 kDa -
28 kDa -
Isoform L
Isoform S

52
Figure 39 - Quantification for the expression of SIRT3's two canonical isoforms. This quantification is the result of a total of 6 individual protein samples.
As shown in section 4.2.1, the mRNA sequences targeted by all four shRNAs are common
to both canonical isoforms of SIRT3. Therefore, we expected a similar silencing of both
mitochondrial (isoform L) and cytoplasmic (isoform S) SIRT3, an observation that did not occur
as per Figure 39: only the Isoform L appears to have its expression levels diminished. This led
us to theorize that while both the fluorescence and puromycin resistance is conferred to 3T3
cells by all four plasmids, the knockdown capability of each shRNA sequence could differ from
one another. The most logical step to take, from that moment on, was to transfect 3T3 cells
with each individual plasmid, and yet again, verify the existence of SIRT3 knockdown.
4.4.6 Individual shRNA transfection
As stated, there could be a competitive effect between the four shRNA-expressing
plasmids (once all them have the same promoter sequences and require the same machinery
to be transcribed), with a specific mRNA-recognizing sequence being favored over the others.
If a shRNA sequence with low knockdown capacity was being favored, this could explain the
absence of obvious SIRT3 silencing. Therefore, each plasmid was individually transfected
through the same protocol as before. Transfected cells were selected and cultured, also as
described, and total protein contents were collected in order to perform Western Blot
analysis.
4.4.6.1 Western Blot analysis
As before, Western Blot analysis for the protein contents of both transfected and non-
transfected 3T3 cells was conducted. What was thought to be a turning point was yet again
the inception for an inconclusive result. Again, antibody binding proved unreliable (Figure 40).
0
50
100
150
SIRT3 ISOFORM L SIRT3 ISOFORM S
SIR
T3 R
elat
ive
Exp
ress
ion
SIRT3 Expression in Transfected/Non-Transfected 3T3 cells
WT KD

53
Labelling for the cytoplasmic isoform (28kDa, isoform S) largely surpassed the labelling on the
longer isoform (36kDa, isoform L), and quantification suffered from this labeling.
Figure 40 - Western blot for SIRT3 expression in non-transfected (WT), transfected with a scrambled shRNA (scr), and the individual SIRT3 shRNAs, 3T3 cells.
In Figure 41 lies the resulting quantification. In spite of what we postulated about the
competition of each shRNA expression, the expression of one shRNA at a time doesn’t seem
to increase the knockdown efficiency. Strangely, the “silencing” pattern changed: it would
appear that now, SIRT3 isoform S has a lesser expression when compared with its sibling
isoform. Nonetheless, as this analysis is the result of one set of protein samples, the assay
should be repeated and statistically analyzed.
Figure 41 - Quantification for the expression of SIRT3's two canonical isoforms. This quantification is the result of a total of one individual set of protein samples.
Because this experiment also failed to clearly knockdown SIRT3’s expression (of either
isoform), we couldn’t prove if a) some of the shRNA-expressing plasmids present a stronger
knockdown capability (although shRNA4 could be thought as unable to knockdown SIRT3,
when comparing with the other shRNA sequences), and b) using all four shRNAs at the same
0
50
100
150
200
WT SCR sh1 sh2 sh3 sh4
Exp
ress
ion
(%
)
SIRT3 Expression in individual shRNA transfection in 3T3 cells
SIRT3 Isoform L SIRT3 Isoform S
SIRT3
β-actin
36 kDa -
28 kDa -
WT
SCR
shR
NA
1
shR
NA
2
shR
NA
3
shR
NA
4
Isoform L
Isoform S

54
time presents a more pronounced knockdown of SIRT3’s levels. Again, more assays should be
performed, and perhaps, validated with a different anti-SIRT3 antibody (because, as visible
throughout this essay, SIRT3 immunostaining presented different labeling, even when using
the same samples).
After these negative results, we searched for what could be negatively affecting our
silencing, because, as has been shown, the cells are definitely transfected. Many causes could
potentially explain why the silencing appears non-existent. We looked for clues to what
mechanisms could inhibit this silencing (as the shRNA was, most likely, and alike mCherry and
PAC, being expressed). It has been reported that the expression of SIRT3 vary, depending on
the proliferative state of cells (Abdel Khalek et al., 2014). Khalek and collaborators found that
during the proliferative state of mouse myoblasts (C2C12), the expression of SIRT3 is
negligible, and greatly increased when cells stopped proliferating and started to differentiate.
Unfortunately, this work does not specify the silenced isoform(s) of SIRT3. Nevertheless, a
parallelism could be drawn to our work: the assayed protein samples for transfected and non-
transfected 3T3 were all collected nearing confluence. If the SIRT3 expression pattern in 3T3
cells mimics that of C2C12 cells, one could argue that SIRT3 expression would be also greatly
increased, and the short-hairpin silencing mechanisms could not mitigate this increase of their
target sequence. Therefore, in the future, these assays should be repeated bearing this work
in mind. Also, the selected sequences may not be the right/adequate sequences to block
translation/degrade SIRT3 mRNA. Furthermore, plasmids should be sequenced to confirm the
sequences provided by the manufacturer, as the slightest mis-match of the shRNA sequence
can void its silencing capability (Taxman et al., 2006).

55
5 CONCLUSION AND FINAL REMARKS
This work was meant to be a stepping stone to the establishment of a silencing protocol,
aiming to provide means to protein silencing in mouse Embryonic Stem Cells, by specifically
targeting a mitochondrial protein, SIRT3, a metabolically relevant protein with the ability to,
overall, regulate the mitochondrial metabolism. Besides a possible evaluation of the
mechanisms and relevance of SIRT3 in the pluripotency and differentiation of mESC, this work
would provide a tool to silence any given protein in our working models, as long as its coding
sequence was known. It can be said that the basis for this tool are set.
Transfection couldn’t be performed on E14 ES cells, but it seemed relatively stable in
3T3 cells. The transfection and selection of 3T3 cells was accomplished: cells were both
resistant to antibiotic and fluorescent; both attributes are conferred by the transfected
plasmid. If mESC transfection is to be achieved, a possible solution to surpass the inability to
obtain an enriched, transfected mESC culture would be by turning to viral vectors. Increasing
the starting number of plasmid positive cells would indubitably ease the selection process,
yielding sturdier colonies, and generating steadier cultures.
In spite of the success in transfecting 3T3 cells with our shRNA-expressing plasmids, the
silencing rates are, at the very least, dubious. The results in 3T3 cells, when transfecting either
all four shRNA-expressing plasmids, or each plasmid individually, the silencing rate hardly
reached 50%, was regarded as an underachievement, compared to the promising and
reported capabilities of this silencing technique. The next steps should include the return to
the laboratory, and re-evaluate the silencing rate in 3T3 cells in a non-confluent state. If this
does not prove to surpass the low silencing rate, we must look into de shRNA sequences. As
discussed before, the shRNA sequences may not be the most adequate for our sequence, and
so, the next step would be that of the choice of different shRNA sequences for SIRT3.
Closing this work, I’d like to state that this work, the establishment of the said protocol,
while not as successful as initially predicted, should not be entirely abandoned. This work
served, at least to show the hurdles of both transfection, and protein silencing. Seeing as
numerous reports of transfection (and protein silencing) are achieved in mESC, in general, and
E14Tg2.a in particular, and Armed with this knowledge, we may yet succeed, if only should we
press on.
56
6 REFERENCES
Abdel Khalek, W., Cortade, F., Ollendorff, V., Lapasset, L., Tintignac, L., Chabi, B., and Wrutniak-Cabello, C. (2014). SIRT3, a Mitochondrial NAD+-Dependent Deacetylase, Is Involved in the Regulation of Myoblast Differentiation. PLoS One 9, e114388.
Abe, K., Niwa, H., Iwase, K., Takiguchi, M., Mori, M., Abé, S.-I., Abe, K., and Yamamura, K.-I. (1996). Endoderm-Specific Gene Expression in Embryonic Stem Cells Differentiated to Embryoid Bodies. Exp. Cell Res. 229, 27–34.
Altman, J., and Das, G.D. (1967). Postnatal Neurogenesis in the Guinea-pig. Nature 214, 1098–1101.
Ameres, S.L., Martinez, J., and Schroeder, R. (2007). Molecular basis for target RNA recognition and cleavage by human RISC. Cell 130, 101–112.
Aubert, J., Dunstan, H., Chambers, I., and Smith, A. (2002). Functional gene screening in embryonic stem cells implicates Wnt antagonism in neural differentiation. Nat. Biotechnol. 20, 1240–1245.
Baharvand, H., and Matthaei, K.I. (2003). The ultrastructure of mouse embryonic stem cells. Reprod. Biomed. Online 7, 330–335.
Bannai, S. (1992). Use of 2-mercaptoethanol in cell culture. Hum. Cell Off. J. Hum. Cell Res. Soc. 5, 292–297.
Bao, J., Lu, Z., Joseph, J.J., Carabenciov, D., Dimond, C.C., Pang, L., Samsel, L., McCoy, J.P., Leclerc, J., Nguyen, P., et al. (2010). Characterization of the murine SIRT3 mitochondrial localization sequence and comparison of mitochondrial enrichment and deacetylase activity of long and short SIRT3 isoforms. J. Cell. Biochem. 110, n/a – n/a.
Barberi, T., Klivenyi, P., Calingasan, N.Y., Lee, H., Kawamata, H., Loonam, K., Perrier, A.L., Bruses, J., Rubio, M.E., Topf, N., et al. (2003). Neural subtype specification of fertilization and nuclear transfer embryonic stem cells and application in parkinsonian mice. Nat. Biotechnol. 21, 1200–1207.
Bianco, P., Riminucci, M., Gronthos, S., and Robey, P. (2001). Bone marrow stromal stem cells: nature, biology, and potential applications. Stem Cells 180–192.
Brown, K., Xie, S., Qiu, X., Mohrin, M., Shin, J., Liu, Y., Zhang, D., Scadden, D.T., and Chen, D. (2013). SIRT3 reverses aging-associated degeneration. Cell Rep. 3, 319–327.
Brunet, A. (2004). Stress-Dependent Regulation of FOXO Transcription Factors by the SIRT1 Deacetylase. Science (80-. ). 303, 2011–2015.
Cahan, P., and Daley, G.Q. (2013). Origins and implications of pluripotent stem cell variability and heterogeneity. Nat. Rev. Mol. Cell Biol. 14, 357–368.
Calvanese, V., Lara, E., Suarez-Alvarez, B., Abu Dawud, R., Vazquez-Chantada, M., Martinez-Chantar, M.L., Embade, N., Lopez-Nieva, P., Horrillo, A., Hmadcha, A., et al. (2010). Sirtuin 1 regulation of developmental genes during differentiation of stem cells. Proc. Natl. Acad. Sci. 107, 13736–13741.
Chambers, I., Colby, D., Robertson, M., Nichols, J., Lee, S., Tweedie, S., and Smith, A. (2003). Functional expression cloning of Nanog, a pluripotency sustaining factor in embryonic stem cells. Cell 113, 643–655.
57
Chen, C.-T., Hsu, S.-H., and Wei, Y.-H. (2012). Mitochondrial bioenergetic function and metabolic plasticity in stem cell differentiation and cellular reprogramming. Biochim. Biophys. Acta 1820, 571–576.
Cheng, H.-L., Mostoslavsky, R., Saito, S., Manis, J.P., Gu, Y., Patel, P., Bronson, R., Appella, E., Alt, F.W., and Chua, K.F. (2003). Developmental defects and p53 hyperacetylation in Sir2 homolog (SIRT1)-deficient mice. Proc. Natl. Acad. Sci. U. S. A. 100, 10794–10799.
Cheng, J., Dutra, A., Takesono, A., Garrett-Beal, L., and Schwartzberg, P.L. (2004). Improved generation of C57BL/6J mouse embryonic stem cells in a defined serum-free media. Genesis 39, 100–104.
Cho, Y.M., Kwon, S., Pak, Y.K., Seol, H.W., Choi, Y.M., Park, D.J., Park, K.S., and Lee, H.K. (2006). Dynamic changes in mitochondrial biogenesis and antioxidant enzymes during the spontaneous differentiation of human embryonic stem cells. Biochem. Biophys. Res. Commun. 348, 1472–1478.
Christophorou, M. a, Castelo-Branco, G., Halley-Stott, R.P., Oliveira, C.S., Loos, R., Radzisheuskaya, A., Mowen, K. a, Bertone, P., Silva, J.C.R., Zernicka-Goetz, M., et al. (2014). Citrullination regulates pluripotency and histone H1 binding to chromatin. Nature 507, 104–108.
Chung, S., and Dzeja, P. (2007). Mitochondrial oxidative metabolism is required for the cardiac differentiation of stem cells. Nat. Clin. Pract. … 4, 1–12.
Conti, L., Pollard, S.M., Gorba, T., Reitano, E., Toselli, M., Biella, G., Sun, Y., Sanzone, S., Ying, Q.-L., Cattaneo, E., et al. (2005). Niche-independent symmetrical self-renewal of a mammalian tissue stem cell. PLoS Biol. 3, e283.
Cooper, H.M., Huang, J.-Y., Verdin, E., and Spelbrink, J.N. (2009). A new splice variant of the mouse SIRT3 gene encodes the mitochondrial precursor protein. PLoS One 4, e4986.
Evans, M.J., and Kaufman, M.H. (1981). Establishment in culture of pluripotential cells from mouse embryos. Nature 292, 154–156.
Facucho-Oliveira, J.M., and St John, J.C. (2009). The relationship between pluripotency and mitochondrial DNA proliferation during early embryo development and embryonic stem cell differentiation. Stem Cell Rev. 5, 140–158.
Facucho-Oliveira, J.M., Alderson, J., Spikings, E.C., Egginton, S., and St John, J.C. (2007). Mitochondrial DNA replication during differentiation of murine embryonic stem cells. J. Cell Sci. 120, 4025–4034.
Fellmann, C., and Lowe, S.W. (2014). Stable RNA interference rules for silencing. Nat. Cell Biol. 16, 10–18.
Finkel, T., Deng, C.-X., and Mostoslavsky, R. (2009). Recent progress in the biology and physiology of sirtuins. Nature 460, 587–591.
Folmes, C., Nelson, T., and Terzic, A. (2011a). Energy metabolism in nuclear reprogramming. Biomark. Med. 5, 715–729.
Folmes, C., Dzeja, P., Nelson, T., and Terzic, A. (2012). Metabolic plasticity in stem cell homeostasis and differentiation. Cell Stem Cell 11, 596–606.
Folmes, C.D.L., Nelson, T.J., Martinez-Fernandez, A., Arrell, D.K., Lindor, J.Z., Dzeja, P.P., Ikeda, Y., Perez-Terzic, C., and Terzic, A. (2011b). Somatic oxidative bioenergetics transitions into pluripotency-dependent glycolysis to facilitate nuclear reprogramming. Cell Metab. 14, 264–271.

58
Giralt, A., Hondares, E., Villena, J.A., Ribas, F., Díaz-Delfín, J., Giralt, M., Iglesias, R., and Villarroya, F. (2011). Peroxisome proliferator-activated receptor-gamma coactivator-1alpha controls transcription of the Sirt3 gene, an essential component of the thermogenic brown adipocyte phenotype. J. Biol. Chem. 286, 16958–16966.
Gómez Lahoz, E., López de Haro, M.S., Nieto, a, and Esponda, P. (1991). Use of puromycin N-acetyltransferase (PAC) as a new reporter gene in transgenic animals. Nucleic Acids Res. 19, 3465.
Gonzales, K.A.U., and Ng, H.-H. (2011). FoxO: A New Addition to the ESC Cartel. Cell Stem Cell 9, 181–183.
Grayson, W., and Zhao, F. (2006). Effects of hypoxia on human mesenchymal stem cell expansion and plasticity in 3D constructs. J. Cell. … 339, 331–339.
Haeckel, E. (1879). Natürliche Schöpfungsgeschichte (Berlin: G. Reimer).
Haigis, M.C., and Guarente, L.P. (2006). Mammalian sirtuins - Emerging roles in physiology, aging, and calorie restriction. Genes Dev. 20, 2913–2921.
Hanahan, D. (1983). Studies on transformation of Escherichia coli with plasmids. J. Mol. Biol. 166, 557–580.
Hanna, J.H., Saha, K., and Jaenisch, R. (2010). Pluripotency and cellular reprogramming: Facts, hypotheses, unresolved issues. Cell 143, 508–525.
Hu, B., Guo, Y., Chen, C., Li, Q., Niu, X., Guo, S., Zhang, A., Wang, Y., and Deng, Z. (2014). Repression of SIRT1 Promotes the Differentiation of Mouse Induced Pluripotent Stem Cells into Neural Stem Cells. Cell. Mol. Neurobiol. 34, 905–912.
Imai, S., Armstrong, C.M., Kaeberlein, M., and Guarente, L. (2000). Transcriptional silencing and longevity protein Sir2 is an NAD-dependent histone deacetylase. Nature 403, 795–800.
Invitrogen(tm) by life technologies (2000). Lipofectamine ® 2000 Reagent. 1–2.
Janjic, D., and Wollheim, C.B. (1992). Effect of 2-mercaptoethanol on glutathione levels, cystine uptake and insulin secretion in insulin-secreting cells. Eur. J. Biochem. 210, 297–304.
Kawamura, Y., and Uchijima, Y. (2010). Sirt3 protects in vitro–fertilized mouse preimplantation embryos against oxidative stress–induced p53-mediated developmental arrest. J. … 120.
Kim, J., Chu, J., Shen, X., Wang, J., and Orkin, S.H. (2008). An Extended Transcriptional Network for Pluripotency of Embryonic Stem Cells. Cell 132, 1049–1061.
Klimo, P., Kestle, J.R.W., MacDonald, J.D., and Schmidt, R.H. (2004). Marked reduction of cerebral vasospasm with lumbar drainage of cerebrospinal fluid after subarachnoid hemorrhage. J. Neurosurg. 100, 215–224.
Lambeth, L.S., and Smith, C.A. (2013). siRNA Design (Totowa, NJ: Humana Press).
Langley, E. (2002). Human SIR2 deacetylates p53 and antagonizes PML/p53-induced cellular senescence. EMBO J. 21, 2383–2396.
Li, M., He, Y., Dubois, W., Wu, X., Shi, J., and Huang, J. (2012). Distinct Regulatory Mechanisms and Functions for p53-Activated and p53-Repressed DNA Damage Response Genes in Embryonic Stem Cells. Mol. Cell 46, 30–42.
Lin, H.-T., Otsu, M., and Nakauchi, H. (2013). Stem cell therapy: an exercise in patience and prudence. Philos. Trans. R. Soc. Lond. B. Biol. Sci. 368, 20110334.
59
Lombard, D.B., Alt, F.W., Cheng, H.-L., Bunkenborg, J., Streeper, R.S., Mostoslavsky, R., Kim, J., Yancopoulos, G., Valenzuela, D., Murphy, A., et al. (2007). Mammalian Sir2 homolog SIRT3 regulates global mitochondrial lysine acetylation. Mol. Cell. Biol. 27, 8807–8814.
Martin, G.R. (1981). Isolation of a pluripotent cell line from early mouse embryos cultured in medium conditioned by teratocarcinoma stem cells. Proc. Natl. Acad. Sci. U. S. A. 78, 7634–7638.
Mathieu, J., Zhou, W., Xing, Y., Sperber, H., Ferreccio, A., Agoston, Z., Kuppusamy, K.T., Moon, R.T., and Ruohola-Baker, H. (2014). Hypoxia-inducible factors have distinct and stage-specific roles during reprogramming of human cells to pluripotency. Cell Stem Cell 14, 592–605.
Maurisse, R., De Semir, D., Emamekhoo, H., Bedayat, B., Abdolmohammadi, A., Parsi, H., and Gruenert, D.C. (2010). Comparative transfection of DNA into primary and transformed mammalian cells from different lineages. BMC Biotechnol. 10, 9.
Maximow, A.A. (2009). The lymphocyte as a stem cell, common to different blood elements in embryonic development and during the post-fetal life of mammals: Lecture with a demonstration, held at a special meeting of the Berlin Hematological Society on 1 June 1909. Cell. Ther. Transplant. 1, 14–24.
Niwa, H., Ogawa, K., Shimosato, D., and Adachi, K. (2009). A parallel circuit of LIF signalling pathways maintains pluripotency of mouse ES cells. Nature 460, 118–122.
Nzytech (2013). NZY5a Competent Cells - Transformation Protocol.
Pattappa, G., Heywood, H.K., de Bruijn, J.D., and Lee, D. a (2011). The metabolism of human mesenchymal stem cells during proliferation and differentiation. J. Cell. Physiol. 226, 2562–2570.
Peister, A., Mellad, J. a, Larson, B.L., Hall, B.M., Gibson, L.F., and Prockop, D.J. (2004). Adult stem cells from bone marrow (MSCs) isolated from different strains of inbred mice vary in surface epitopes, rates of proliferation, and differentiation potential. Blood 103, 1662–1668.
Pereira, S.L., Grãos, M., Rodrigues, A.S., Anjo, S.I., Carvalho, R. a, Oliveira, P.J., Arenas, E., and Ramalho-Santos, J. (2013). Inhibition of Mitochondrial Complex III Blocks Neuronal Differentiation and Maintains Embryonic Stem Cell Pluripotency. PLoS One 8, e82095.
Pereira, S.L., Rodrigues, A.S., Sousa, M.I., Correia, M., Perestrelo, T., and Ramalho-Santos, J. (2014). From gametogenesis and stem cells to cancer: Common metabolic themes. Hum. Reprod. Update 0, 1–20.
Rafalski, V. a, Mancini, E., and Brunet, A. (2012). Energy metabolism and energy-sensing pathways in mammalian embryonic and adult stem cell fate. J. Cell Sci. 125, 5597–5608.
Ramalho-Santos, M., and Willenbring, H. (2007). On the Origin of the Term “Stem Cell.” Cell Stem Cell 1, 35–38.
Ramalho-Santos, J., Varum, S., Amaral, S., Mota, P.C., Sousa, A.P., and Amaral, A. (2009). Mitochondrial functionality in reproduction: from gonads and gametes to embryos and embryonic stem cells. Hum. Reprod. Update 15, 553–572.
Rao, D.D., Vorhies, J.S., Senzer, N., and Nemunaitis, J. (2009). siRNA vs. shRNA: similarities and differences. Adv. Drug Deliv. Rev. 61, 746–759.
Robinson, J.P., Narayanan, K., Ragheb, K., and Lawler, G. (1997). Defects in intracellular oxidative undergoing apoptosis metabolism of neutrophils. 61, 481–488.
60
Rodrigues, A.S., Correia, M., Gomes, A., Pereira, S.L., Perestrelo, T., Sousa, M.I., and Ramalho-Santos, J. (2015). Dichloroacetate, the Pyruvate Dehydrogenase Complex and the Modulation of mESC Pluripotency. PLoS One 10, e0131663.
Rodriguez, R.M., Fernandez, a F., and Fraga, M.F. (2013). Role of sirtuins in stem cell differentiation. Genes Cancer 4, 105–111.
Saunders, L.R., Sharma, A.D., Tawney, J., Nakagawa, M., Okita, K., Yamanaka, S., Willenbring, H., and Verdin, E. (2010). miRNAs regulate SIRT1 expression during mouse embryonic stem cell differentiation and in adult mouse tissues. Aging (Albany. NY). 2, 415–431.
Schieke, S.M., Ma, M., Cao, L., McCoy, J.P., Liu, C., Hensel, N.F., Barrett, A.J., Boehm, M., and Finkel, T. (2008). Mitochondrial Metabolism Modulates Differentiation and Teratoma Formation Capacity in Mouse Embryonic Stem Cells. J. Biol. Chem. 283, 28506–28512.
Shi, T., Wang, F., Stieren, E., and Tong, Q. (2005). SIRT3, a mitochondrial sirtuin deacetylase, regulates mitochondrial function and thermogenesis in brown adipocytes. J. Biol. Chem. 280, 13560–13567.
Signer, R.A.J., and Morrison, S.J. (2013). Mechanisms that Regulate Stem Cell Aging and Life Span. Cell Stem Cell 12, 152–165.
Simsek, T., Kocabas, F., Zheng, J., Deberardinis, R.J., Mahmoud, A.I., Olson, E.N., Schneider, J.W., Zhang, C.C., and Sadek, H. a (2010). The distinct metabolic profile of hematopoietic stem cells reflects their location in a hypoxic niche. Cell Stem Cell 7, 380–390.
Singh, U., Quintanilla, R.H., Grecian, S., Gee, K.R., Rao, M.S., and Lakshmipathy, U. (2012). Novel Live Alkaline Phosphatase Substrate for Identification of Pluripotent Stem Cells. Stem Cell Rev. Reports 8, 1021–1029.
Skalli, O., Pelte, M.F., Peclet, M.C., Gabbiani, G., Gugliotta, P., Bussolati, G., Ravazzola, M., and Orci, L. (1989). Alpha-smooth muscle actin, a differentiation marker of smooth muscle cells, is present in microfilamentous bundles of pericytes. J. Histochem. Cytochem. 37, 315–321.
Sousa, M.I., Rodrigues, A.S., Pereira, S., Perestrelo, T., Correia, M., and Ramalho-Santos, J. (2013). Mitochondrial mechanisms of metabolic reprogramming in proliferating cells. University of Coimbra.
Southwood, C.M., Peppi, M., Dryden, S., Tainsky, M. a., and Gow, A. (2007). Microtubule deacetylases, SirT2 and HDAC6, in the nervous system. Neurochem. Res. 32, 187–195.
Stanley, I. a, Ribeiro, S.M., Giménez-Cassina, A., Norberg, E., and Danial, N.N. (2013). Changing appetites: the adaptive advantages of fuel choice. Trends Cell Biol. 24.
Storm, M.P., Bone, H.K., Beck, C.G., Bourillot, P.Y., Schreiber, V., Damiano, T., Nelson, A., Savatier, P., and Welham, M.J. (2007). Regulation of nanog expression by phosphoinositide 3-kinase-dependent signaling in murine embryonic stem cells. J. Biol. Chem. 282, 6265–6273.
Suda, T., Takubo, K., and Semenza, G.L. (2011). Metabolic regulation of hematopoietic stem cells in the hypoxic niche. Cell Stem Cell 9, 298–310.
Taxman, D.J., Livingstone, L.R., Zhang, J., Conti, B.J., Iocca, H. a, Williams, K.L., Lich, J.D., Ting, J.P.-Y., and Reed, W. (2006). Criteria for effective design, construction, and gene knockdown by shRNA vectors. BMC Biotechnol. 6, 7.

61
Tekle, E., Astumian, R.D., and Chock, P.B. (1991). Electroporation by using bipolar oscillating electric field: an improved method for DNA transfection of NIH 3T3 cells. Proc. Natl. Acad. Sci. U. S. A. 88, 4230–4234.
Thermo Scientific, D. (2011). NanoDrop: Assessment of Nucleic Acid Purity. Protoc. Prod. Manuals 1–2.
Upadhyay, M., Samal, J., Kandpal, M., Singh, O.V., and Vivekanandan, P. (2013). The Warburg effect: insights from the past decade. Pharmacol. Ther. 137, 318–330.
Vara, J., Malpartida, F., Hopwood, D. a., and Jimenez, a. (1985). Cloning and expression of a puromycin N-acetyl transferase gene from Streptomyces alboniger in Streptomyces lividans and Escherichia coli. Gene 33, 197–206.
Varum, S., Momcilović, O., Castro, C., Ben-Yehudah, A., Ramalho-Santos, J., and Navara, C.S. (2009). Enhancement of human embryonic stem cell pluripotency through inhibition of the mitochondrial respiratory chain. Stem Cell Res. 3, 142–156.
Varum, S., Rodrigues, A.S., Moura, M.B., Momcilovic, O., Easley IV, C.A., Ramalho-Santos, J., van Houten, B., and Schatten, G. (2011). Energy metabolism in human pluripotent stem cells and their differentiated counterparts. PLoS One 6, e20914.
Wang, X.-Q., Shao, Y., Ma, C.-Y., Chen, W., Sun, L., Liu, W., Zhang, D.-Y., Fu, B.-C., Liu, K.-Y., Jia, Z.-B., et al. (2014). Decreased SIRT3 in aged human mesenchymal stromal/stem cells increases cellular susceptibility to oxidative stress. J. Cell. Mol. Med. XX, 1–13.
Wang, Z.-X., Teh, C.H.-L., Kueh, J.L.L., Lufkin, T., Robson, P., and Stanton, L.W. (2007). Oct4 and Sox2 directly regulate expression of another pluripotency transcription factor, Zfp206, in embryonic stem cells. J. Biol. Chem. 282, 12822–12830.
Warburg, O. (1956). On the origin of cancer cells. Science (80-. ). 123, 309–314.
Ward, C.M., Barrow, K.M., and Stern, P.L. (2004). Significant variations in differentiation properties between independent mouse ES cell lines cultured under defined conditions. Exp. Cell Res. 293, 229–238.
Weisbart, R., and Kwan, L. (1987). Human GM-CSF primes neutrophils for enhanced oxidative metabolism in response to the major physiological chemoattractants. … 18–21.
Wittmann, J. (2006). siRNA , shRNA , miRNA - different approaches for gene silencing.
Wray, J., Kalkan, T., Gomez-Lopez, S., Eckardt, D., Cook, A., Kemler, R., and Smith, A. (2011). Inhibition of glycogen synthase kinase-3 alleviates Tcf3 repression of the pluripotency network and increases embryonic stem cell resistance to differentiation. Nat. Cell Biol. 13, 838–845.
Xu, J. (2011). Viral and Plasmid Transduction Systems : Methods to Modify Immune Cells for Cancer Immunotherapy.
Yanes, O., Clark, J., and Wong, D. (2010). Metabolic oxidation regulates embryonic stem cell differentiation. Nat. Chem. … 6, 411–417.
Yang, Y., Hubbard, B.P., Sinclair, D.A., and Tong, Q. (2010). Characterization of murine SIRT3 transcript variants and corresponding protein products. J. Cell. Biochem. 111, 1051–1058.
Ying, Q.-L., Wray, J., Nichols, J., Batlle-Morera, L., Doble, B., Woodgett, J., Cohen, P., and Smith, A. (2008). The ground state of embryonic stem cell self-renewal. Nature 453, 519–523.
Yoshida, Y., Takahashi, K., Okita, K., Ichisaka, T., and Yamanaka, S. (2009). Hypoxia enhances the generation of induced pluripotent stem cells. Cell Stem Cell 5, 237–241.

62
Zhang, J., Tam, W.-L., Tong, G.Q., Wu, Q., Chan, H.-Y., Soh, B.-S., Lou, Y., Yang, J., Ma, Y., Chai, L., et al. (2006). Sall4 modulates embryonic stem cell pluripotency and early embryonic development by the transcriptional regulation of Pou5f1. Nat. Cell Biol. 8, 1114–1123.
Zhao, W., Ji, X., Zhang, F., Li, L., and Ma, L. (2012). Embryonic stem cell markers. Molecules 17, 6196–6236.