Aluno Online - Solicitacao de Inscricao em Disciplinas (Crítica)
Upload
luis-enriqueCategory
view
217download
0
8/3/2019 bibliografia_38
http://slidepdf.com/reader/full/bibliografia38 1/5
____________________________
* Corresponding author: [email protected] Associated Web Site: http://www2.dlr.de/VT Proceedings of the European Combustion Meeting 2005
Experimental investigations of an oscillating lean premixed CH4 /air swirl flame
in a gas turbine model combustor
P. Weigand1*, X.R. Duan1, W. Meier 1, U. Meier 1, M. Aigner 1, C. Bérat2 1Institut für Verbrennungstechnik, Deutsches Zentrum für Luft- und Raumfahrt, Stuttgart, D
2
DT/CP/CTE, Turbomeca S.A., Bordes, F
AbstractIn order to gain a deeper understanding of the phenomenon of thermo-acoustic instabilities, the GermanAerospace Center (DLR) has performed comprehensive experimental investigations on premixed swirlingCH4/air flames at atmospheric pressure in a gas turbine-like combustor with optical access. The flameinvestigated exhibited self-excited oscillations at about 290 Hz. The measurement techniques applied were Laser
Doppler Velocimetry for the measurement of the flow velocities, OH chemiluminescence for the flame zone andheat release, and laser Raman scattering for the major species concentrations, temperature and mixture fraction.All measurements were performed phase-resolved with respect to the pressure oscillation. The experimentsshowed large periodic variations of the measured quantities, e.g., the heat release varied by more than a factor of 6. The Raman measurements revealed inhomogeneities of the premixedness and periodic variations of thefuel/air ratio. The combination of the results led to the conclusion that the pulsations were sustained via a
convective transport of varying CH4/air-mixtures to the flame zone.
IntroductionIn modern stationary gas turbine applications lean
premixed combustion is often chosen as the strategy
to reduce pollutants, i.e., NOx, CO and UHC. Inaddition, this concept allows to achieve a morehomogeneous temperature distribution at the turbineinlet and thus less thermal wear [1]. Unfortunately,this combustion regime often tends to fall into instablemodes creating strong pressure oscillations that are
known as thermo-acoustic instabilities and in generalare harmful (sometimes even detrimental) to the
combustion system [2, 3]. To date no systematicsolution for avoiding or predicting this phenomenon isavailable. This leads to “single system solutions” thatare on one hand barely transferable to other systems
and on the other hand mostly very time consumingand expensive.
In order to gain a deeper understanding of the phenomenon of thermo-acoustic instabilities the DLR has performed comprehensive experimental
investigations on an atmospheric model swirlcombustor with a premixed CH4/air flame that
exhibits self-excited oscillations. The measurementtechniques applied were non-intrusive opticalmethods, i.e., laser based diagnostics and chemi-luminescence measurements. The measurements have
been triggered and processed with respect to the phaseof the self-excited pressure oscillations yielding
phase-resolved results that give an insight into the periodic behaviour of the flame.
Test rig and measurement techniquesThe nozzle design used for this investigation is
close to technical applications and has been provided
by Turbomeca S.A. in the context of the EU projectPRECCINSTA. Dry air at ambient conditions was fed
via a plenum through a radial type swirler to the burner nozzle with a conical bluff body (see Fig. 1).
Figure 1: schematic drawing of the combustor
The fuel was injected through small holes in eachof the swirler slots with a rather high momentum
(Ma≈0.2) in order to achieve very good premixing.The swirl number calculated from the velocity profilemeasured at h=1.5 mm was about 0.6 and theReynolds number for the cold inflow at the nozzleexit was Re≈35000. The exit diameter of the nozzlewas about 30 mm. A square combustion chamber (85
x 85 mm², h=114 mm) with large quartz windows at
all four sides gave unobstructed access to thecomplete flame zone and thus allowed the use of
m i c r o p h o n e
p r o b e s
fuel
air
8/3/2019 bibliografia_38
http://slidepdf.com/reader/full/bibliografia38 2/5
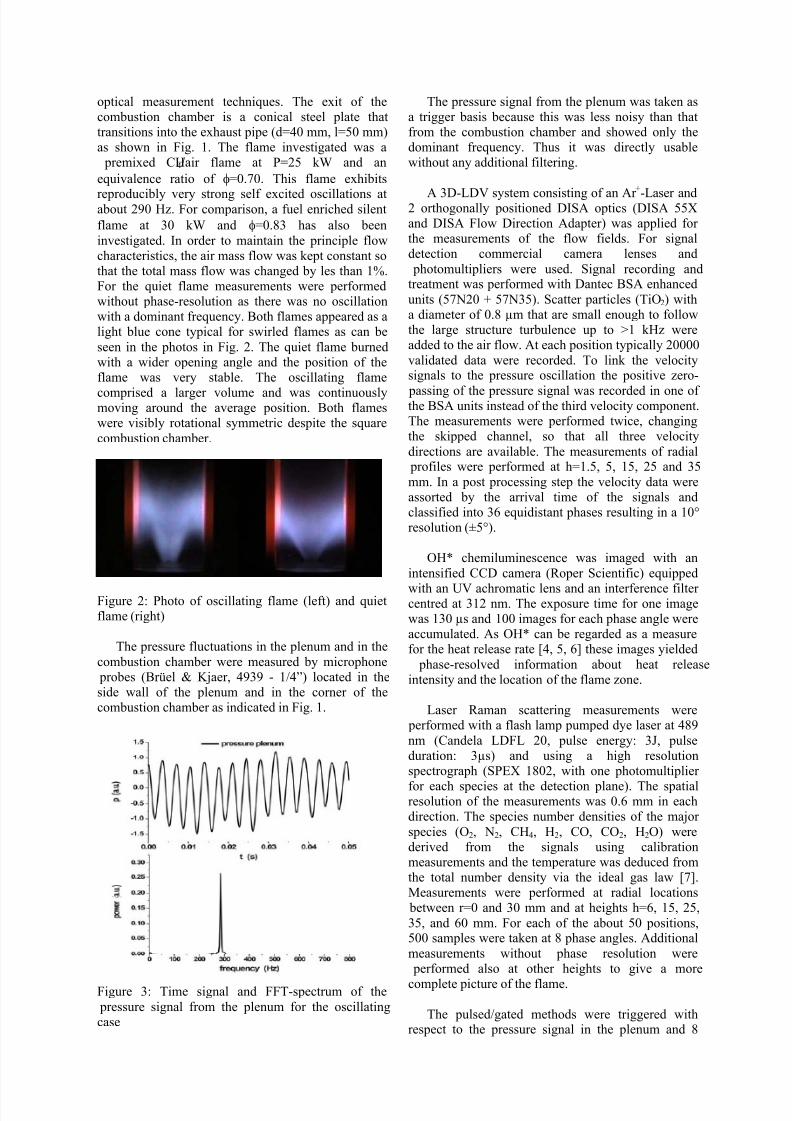
optical measurement techniques. The exit of thecombustion chamber is a conical steel plate thattransitions into the exhaust pipe (d=40 mm, l=50 mm)as shown in Fig. 1. The flame investigated was a premixed CH4/air flame at P=25 kW and an
equivalence ratio of φ=0.70. This flame exhibits
reproducibly very strong self excited oscillations atabout 290 Hz. For comparison, a fuel enriched silent
flame at 30 kW and φ=0.83 has also been
investigated. In order to maintain the principle flowcharacteristics, the air mass flow was kept constant sothat the total mass flow was changed by les than 1%.For the quiet flame measurements were performedwithout phase-resolution as there was no oscillationwith a dominant frequency. Both flames appeared as alight blue cone typical for swirled flames as can be
seen in the photos in Fig. 2. The quiet flame burnedwith a wider opening angle and the position of theflame was very stable. The oscillating flame
comprised a larger volume and was continuouslymoving around the average position. Both flameswere visibly rotational symmetric despite the square
combustion chamber.
Figure 2: Photo of oscillating flame (left) and quietflame (right)
The pressure fluctuations in the plenum and in the
combustion chamber were measured by microphone probes (Brüel & Kjaer, 4939 - 1/4”) located in theside wall of the plenum and in the corner of thecombustion chamber as indicated in Fig. 1.
Figure 3: Time signal and FFT-spectrum of the
pressure signal from the plenum for the oscillatingcase
The pressure signal from the plenum was taken asa trigger basis because this was less noisy than thatfrom the combustion chamber and showed only thedominant frequency. Thus it was directly usablewithout any additional filtering.
A 3D-LDV system consisting of an Ar +
-Laser and2 orthogonally positioned DISA optics (DISA 55Xand DISA Flow Direction Adapter) was applied for the measurements of the flow fields. For signaldetection commercial camera lenses and
photomultipliers were used. Signal recording andtreatment was performed with Dantec BSA enhanced
units (57N20 + 57N35). Scatter particles (TiO2) witha diameter of 0.8 µm that are small enough to followthe large structure turbulence up to >1 kHz wereadded to the air flow. At each position typically 20000
validated data were recorded. To link the velocitysignals to the pressure oscillation the positive zero-
passing of the pressure signal was recorded in one of the BSA units instead of the third velocity component.The measurements were performed twice, changingthe skipped channel, so that all three velocity
directions are available. The measurements of radial profiles were performed at h=1.5, 5, 15, 25 and 35
mm. In a post processing step the velocity data wereassorted by the arrival time of the signals andclassified into 36 equidistant phases resulting in a 10°resolution (±5°).
OH* chemiluminescence was imaged with an
intensified CCD camera (Roper Scientific) equipped
with an UV achromatic lens and an interference filter centred at 312 nm. The exposure time for one imagewas 130 µs and 100 images for each phase angle wereaccumulated. As OH* can be regarded as a measurefor the heat release rate [4, 5, 6] these images yielded
phase-resolved information about heat releaseintensity and the location of the flame zone.
Laser Raman scattering measurements were performed with a flash lamp pumped dye laser at 489
nm (Candela LDFL 20, pulse energy: 3J, pulseduration: 3µs) and using a high resolutionspectrograph (SPEX 1802, with one photomultiplier
for each species at the detection plane). The spatialresolution of the measurements was 0.6 mm in eachdirection. The species number densities of the major
species (O2, N2, CH4, H2, CO, CO2, H2O) werederived from the signals using calibrationmeasurements and the temperature was deduced fromthe total number density via the ideal gas law [7].Measurements were performed at radial locations between r=0 and 30 mm and at heights h=6, 15, 25,
35, and 60 mm. For each of the about 50 positions,500 samples were taken at 8 phase angles. Additional
measurements without phase resolution were performed also at other heights to give a more
complete picture of the flame.
The pulsed/gated methods were triggered withrespect to the pressure signal in the plenum and 8

8/3/2019 bibliografia_38
http://slidepdf.com/reader/full/bibliografia38 3/5
phase angles were recorded resulting in a resolution of 45° (±5°). Assuming rotational symmetry the pointwise measurement techniques (LDV and laser Raman scattering) were applied for only half of the“diameter”.
Results and DiscussionPressure signal
The pressure oscillation in the plenum exhibits avery discrete frequency as can be seen in the timesignal and the FFT-spectrum shown in Fig. 3. The
frequency is very stable and reproducible allowing thecomparison of the results of different measurement
techniques that were applied separately. The quietreference case exhibits only a weak broadband noisewithout any dominant frequency. The phase shift between the pressure signal in the plenum and the
pressure signal in the combustion chamber wasevaluated to be about 80°.
OH*-Chemiluminescence
From the phase-resolved images it can clearly beseen that the intensity of the OH*-chemiluminescence
- being a qualitative measure for the heat release rate -changes significantly during one cycle. As can be
seen in the images in Fig. 4, the main flame zone is ath≈50 mm above the nozzle exit. The most intense heatrelease is observed at a phase angle of 170° close tothe walls of the combustion chamber (r>20 mm). As
these images stem from line of sight measurementsand are thus integrated over the whole volume, it can
be assumed that the flame is shaped like a hollow
cone. From close-up photos of the nozzle exit (notshown) it becomes evident that the flame on averageattaches to the inner nozzle tip and even reaches below the exit plane.
Figure 4: OH*-chemiluminescence images of the
oscillating flame at 4 phases (80°, 170°, 260°, 350°;0°=pressure minimum in combustion chamber). The
displayed images cover the whole width of thecombustion chamber (r=-42.5 – 42.5 mm) and thelower part of the combustion chamber (h≈0 – 66 mm).
The integrated signal intensity (taken over thewhole image) is oscillating by a factor of more than 6
as shown in Fig. 5. The maximum in OH*-
chemiluminescence intensity (and hence the heatrelease rate) measured at 170° correlates very wellwith the maximum pressure in the combustionchamber (at 180°), thus fulfilling the Rayleighcriterion for self-sustaining oscillation in flames.
0 200 400 600 8000.0
0.2
0.4
0.6
0.8
1.0
mean
integral OH-chemiluminescence
n o r m a l i z e d i n t e n s i t y
phase angle relative to min pressure in combustion chamber (°)
Figure 5: Integrated intensity of OH*-chemiluminescence as a function of pressure cycle; 0°
refers to minimum pressure in combustion chamber
Flow field
In the vector plot of the time-averaged combinedaxial (u) and radial (v) velocities, shown in Fig. 6, thecoloured negative u-velocities indicate clearly a
strong inner recirculation zone (irz) as is expected for confined swirl flames of this swirl number. From the
directions of uv-velocities at r=25 – 34 mm it may beconcluded that there ought to be a small outer recirculation zone (orz) in the lower corner of thecombustion chamber. The inflow is on the average
forming a cone with a half angle of about 24°.
-50 -40 -30 -20 -10 0 10 20 30 40 50
0
10
20
30
40
50
25 m/s
mean uv-velocities 25 kW, phi=0,70
H ö h e
( m m )
Radius (mm)
Figure 6: Vector plot of mean uv-velocities; the half profiles measured were mirrored for a more complete
impression of the flow field; negative axial velocitiesare displayed in red; the lines indicate the contours of the combustion chamber
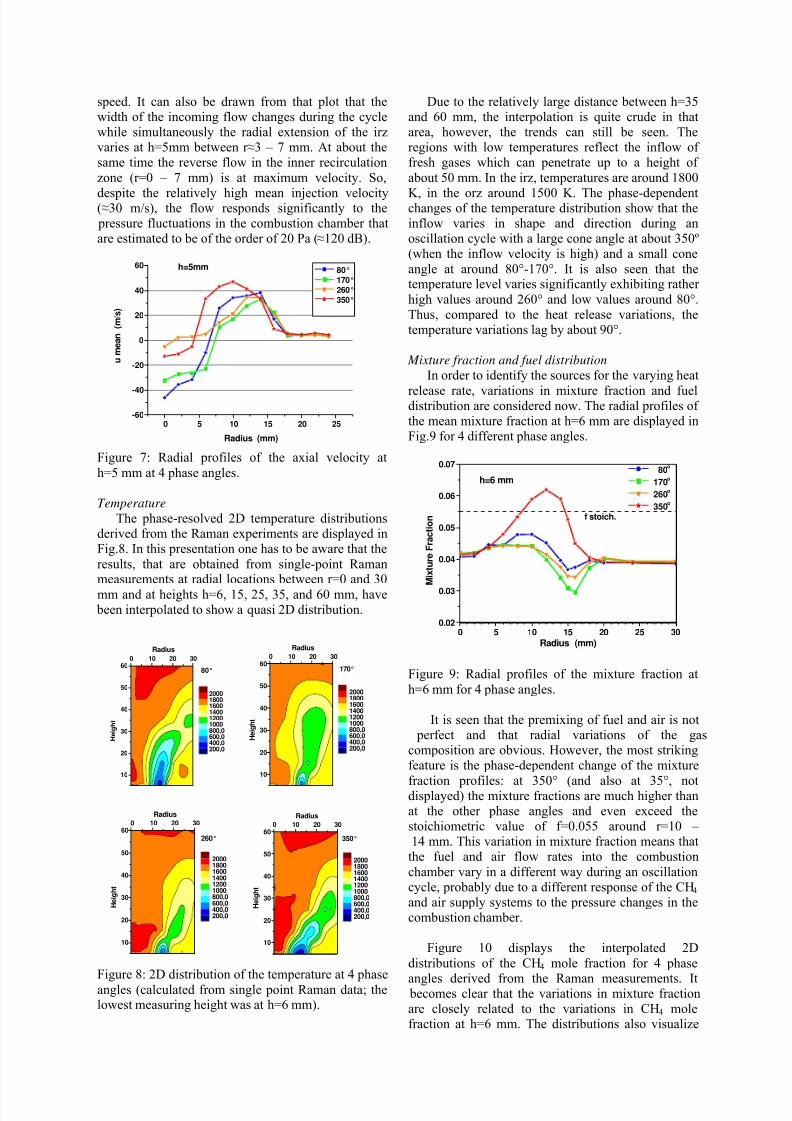
From the phase-resolved velocity data it can beseen that for the oscillating flame the inner recirculating flow (r ≈0 – 7 mm) varies with
surprisingly large amplitudes (│umean│≈ 0 – 40 m/s)during one cycle as can be seen in the plot of the phase-resolved axial velocity at h=5 mm in Fig. 7. Incontrast, the axial velocity in the outer zone of the
combustor (r>17 mm) remains almost constant at thatheight during one oscillation cycle. One notes that at
maximum pressure in the combustion chamber (at180°) the injected flow (r ≈8 –17 mm) is at a minimum
80° 170°
260° 350°
8/3/2019 bibliografia_38
http://slidepdf.com/reader/full/bibliografia38 4/5
speed. It can also be drawn from that plot that thewidth of the incoming flow changes during the cyclewhile simultaneously the radial extension of the irzvaries at h=5mm between r ≈3 – 7 mm. At about thesame time the reverse flow in the inner recirculation
zone (r=0 – 7 mm) is at maximum velocity. So,
despite the relatively high mean injection velocity(≈30 m/s), the flow responds significantly to the pressure fluctuations in the combustion chamber thatare estimated to be of the order of 20 Pa (≈120 dB).
0 5 10 15 20 25-60
-40
-20
0
20
40
60 h=5mm
u m e a n
( m / s )
Radius (mm)
80° 170° 260° 350°
Figure 7: Radial profiles of the axial velocity at
h=5 mm at 4 phase angles.
Temperature
The phase-resolved 2D temperature distributionsderived from the Raman experiments are displayed inFig.8. In this presentation one has to be aware that the
results, that are obtained from single-point Ramanmeasurements at radial locations between r=0 and 30
mm and at heights h=6, 15, 25, 35, and 60 mm, have been interpolated to show a quasi 2D distribution.
10
20
30
40
50
600 10 20 30
80°
Radius
H e i g h t
200,0400,0600,0800,0100012001400160018002000
10
20
30
40
50
600 10 20 30
170°
Radius
H e i g h t
200,0400,0600,0800,0100012001400160018002000
10
20
30
40
50
600 10 20 30
260°
Radius
H e i g h t
200,0400,0600,0800,0100012001400160018002000
10
20
30
40
50
600 10 20 30
350°
Radius
H e i g h t
200,0400,0600,0800,0100012001400160018002000
Figure 8: 2D distribution of the temperature at 4 phase
angles (calculated from single point Raman data; thelowest measuring height was at h=6 mm).
Due to the relatively large distance between h=35and 60 mm, the interpolation is quite crude in thatarea, however, the trends can still be seen. Theregions with low temperatures reflect the inflow of fresh gases which can penetrate up to a height of
about 50 mm. In the irz, temperatures are around 1800
K, in the orz around 1500 K. The phase-dependentchanges of the temperature distribution show that theinflow varies in shape and direction during anoscillation cycle with a large cone angle at about 350º(when the inflow velocity is high) and a small cone
angle at around 80°-170°. It is also seen that thetemperature level varies significantly exhibiting rather
high values around 260° and low values around 80°.Thus, compared to the heat release variations, thetemperature variations lag by about 90°.
Mixture fraction and fuel distribution
In order to identify the sources for the varying heat
release rate, variations in mixture fraction and fueldistribution are considered now. The radial profiles of the mean mixture fraction at h=6 mm are displayed inFig.9 for 4 different phase angles.
0 5 10 15 20 25 300.02
0.03
0.04
0.05
0.06
0.07
f stoich.
h=6 mm 80
o
170o
260o
350o
M i x t u r e F r a c t i o n
Radius (mm)
Figure 9: Radial profiles of the mixture fraction at
h=6 mm for 4 phase angles.
It is seen that the premixing of fuel and air is not perfect and that radial variations of the gascomposition are obvious. However, the most strikingfeature is the phase-dependent change of the mixture
fraction profiles: at 350° (and also at 35°, notdisplayed) the mixture fractions are much higher thanat the other phase angles and even exceed thestoichiometric value of f=0.055 around r=10 – 14 mm. This variation in mixture fraction means thatthe fuel and air flow rates into the combustion
chamber vary in a different way during an oscillationcycle, probably due to a different response of the CH4 and air supply systems to the pressure changes in thecombustion chamber.
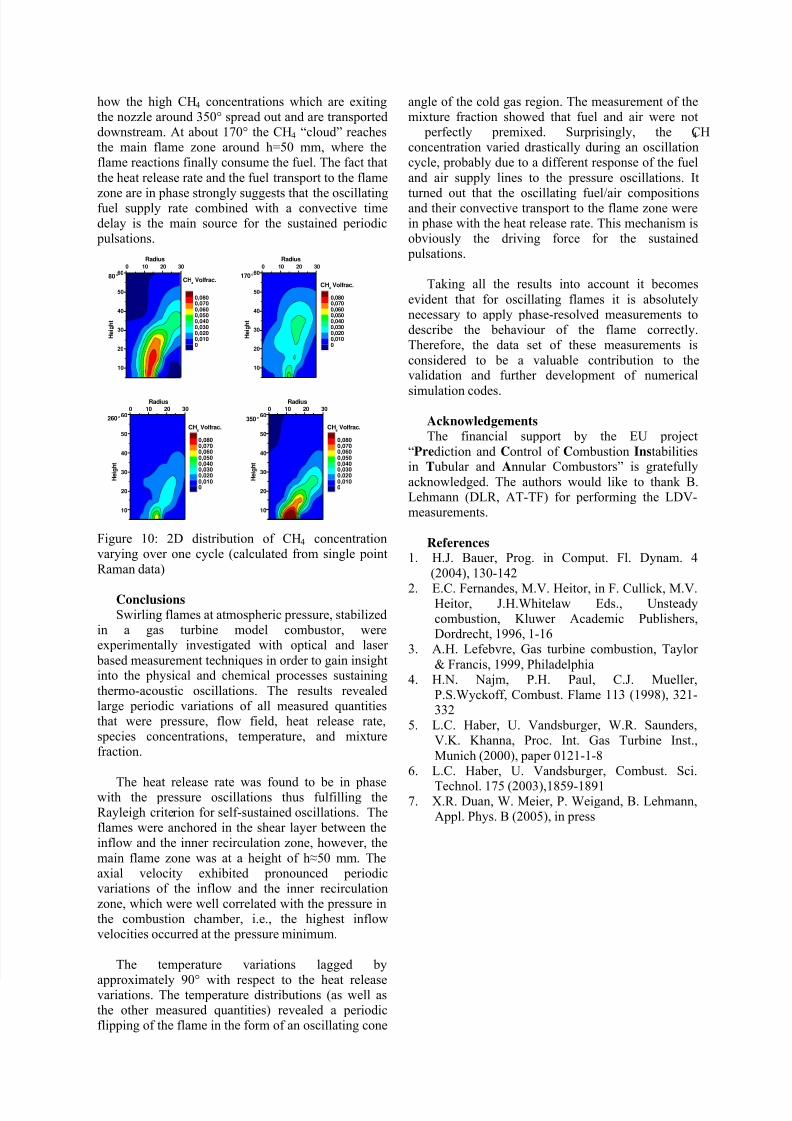
Figure 10 displays the interpolated 2D
distributions of the CH4 mole fraction for 4 phase
angles derived from the Raman measurements. It becomes clear that the variations in mixture fractionare closely related to the variations in CH4 molefraction at h=6 mm. The distributions also visualize
8/3/2019 bibliografia_38
http://slidepdf.com/reader/full/bibliografia38 5/5
how the high CH4 concentrations which are exitingthe nozzle around 350° spread out and are transporteddownstream. At about 170° the CH4 “cloud” reachesthe main flame zone around h=50 mm, where theflame reactions finally consume the fuel. The fact that
the heat release rate and the fuel transport to the flame
zone are in phase strongly suggests that the oscillatingfuel supply rate combined with a convective timedelay is the main source for the sustained periodic pulsations.
10
20
30
40
50
600 10 20 30
80°CH
4Volfrac.
Radius
H e i g h t
00,0100,0200,0300,0400,0500,0600,0700,080
10
20
30
40
50
600 10 20 30
170°
CH4
Volfrac.
Radius
H e i g h t
00,0100,0200,0300,0400,0500,0600,0700,080
10
20
30
40
50
600 10 20 30
260°
CH4
Volfrac.
Radius
H e i g h t
00,0100,0200,0300,0400,0500,0600,0700,080
10
20
30
40
50
600 10 20 30
350°
CH4
Volfrac.
Radius
H e i g h t
00,0100,0200,0300,0400,0500,0600,0700,080
Figure 10: 2D distribution of CH4 concentrationvarying over one cycle (calculated from single point
Raman data)
ConclusionsSwirling flames at atmospheric pressure, stabilized
in a gas turbine model combustor, wereexperimentally investigated with optical and laser
based measurement techniques in order to gain insightinto the physical and chemical processes sustaining
thermo-acoustic oscillations. The results revealedlarge periodic variations of all measured quantitiesthat were pressure, flow field, heat release rate,species concentrations, temperature, and mixturefraction.
The heat release rate was found to be in phasewith the pressure oscillations thus fulfilling theRayleigh criterion for self-sustained oscillations. Theflames were anchored in the shear layer between theinflow and the inner recirculation zone, however, the
main flame zone was at a height of h≈50 mm. Theaxial velocity exhibited pronounced periodicvariations of the inflow and the inner recirculationzone, which were well correlated with the pressure inthe combustion chamber, i.e., the highest inflowvelocities occurred at the pressure minimum.
The temperature variations lagged by
approximately 90° with respect to the heat releasevariations. The temperature distributions (as well asthe other measured quantities) revealed a periodicflipping of the flame in the form of an oscillating cone
angle of the cold gas region. The measurement of themixture fraction showed that fuel and air were not perfectly premixed. Surprisingly, the CH4 concentration varied drastically during an oscillationcycle, probably due to a different response of the fuel
and air supply lines to the pressure oscillations. It
turned out that the oscillating fuel/air compositionsand their convective transport to the flame zone werein phase with the heat release rate. This mechanism isobviously the driving force for the sustained pulsations.
Taking all the results into account it becomes
evident that for oscillating flames it is absolutelynecessary to apply phase-resolved measurements todescribe the behaviour of the flame correctly.Therefore, the data set of these measurements is
considered to be a valuable contribution to thevalidation and further development of numerical
simulation codes.
AcknowledgementsThe financial support by the EU project
“Prediction and Control of Combustion Instabilitiesin Tubular and Annular Combustors” is gratefully
acknowledged. The authors would like to thank B.Lehmann (DLR, AT-TF) for performing the LDV-measurements.
References1. H.J. Bauer, Prog. in Comput. Fl. Dynam. 4
(2004), 130-142
2. E.C. Fernandes, M.V. Heitor, in F. Cullick, M.V.Heitor, J.H.Whitelaw Eds., Unsteadycombustion, Kluwer Academic Publishers,Dordrecht, 1996, 1-16
3. A.H. Lefebvre, Gas turbine combustion, Taylor
& Francis, 1999, Philadelphia4. H.N. Najm, P.H. Paul, C.J. Mueller,
P.S.Wyckoff, Combust. Flame 113 (1998), 321-332
5. L.C. Haber, U. Vandsburger, W.R. Saunders,V.K. Khanna, Proc. Int. Gas Turbine Inst.,
Munich (2000), paper 0121-1-86. L.C. Haber, U. Vandsburger, Combust. Sci.
Technol. 175 (2003),1859-18917. X.R. Duan, W. Meier, P. Weigand, B. Lehmann,
Appl. Phys. B (2005), in press