DEPARTAMENTOI DE C ÊNCIAS DA VIDA - Estudo Geral Bodies... · imensa, eterna e contagiante alegria...
81
DEPARTAMENTO DE CIÊNCIAS DA VIDA FACULDADE DE CIÊNCIAS E TECNOLOGIA UNIVERSIDADEDE COIMBRA Ketone Bodies as Brain Substrates Dissertação apresentada à Universidade de Coimbra para cumprimento dos requisitos necessários à obtenção do grau de Mestre em Bioquímica, realizada sob a orientação científica do Professor Doutor John G. Jones (CNC/Biocant- UC-Biotech) e do Professor Doutor Ângelo Tomé (Universidade de Coimbra) Paula Sofia Valente da Silva 2015
Transcript of DEPARTAMENTOI DE C ÊNCIAS DA VIDA - Estudo Geral Bodies... · imensa, eterna e contagiante alegria...

DEPARTAMENTO DE CIÊNCIAS DA VIDA
FACULDADE DE CIÊNCIAS E TECNOLOGIA UNIVERSIDADEDE COIMBRA
Ketone Bodies as Brain Substrates
Dissertação apresentada à Universidade de Coimbra para cumprimento dos requisitos necessários à obtenção do grau de Mestre em Bioquímica, realizada sob a orientação científica do Professor Doutor John G. Jones (CNC/Biocant- UC-Biotech) e do Professor Doutor Ângelo Tomé (Universidade de Coimbra)
Paula Sofia Valente da Silva
2015

i
When a door closes, you open it back. That’s how doors work…
Common Sense

ii
Acknowledgments/Agradecimentos
To Professor John G. Jones, for accepting me in his group all those years ago and for never giving
up on me. For all his time and patience, and for trusting me with this project, for all the motivation
and for always seeing the potential in me. For helping me grow, as a person and as a scientist, and
for showing me that what makes a good scientist is the ability to always be amazed by new
discoveries. For being an amazing supervisor. Also, thanks for the beer!
To Professor Rodrigo Cunha, for accepting this partnership and being part of this project, and
welcoming me to the Purines group. For all the fruitful meeting and discussions, and the smacks
on the head when I needed them.
To doctor Attila Köfalvi, for giving me a place to do my experiments and making me feel like one of
his own students! For all the discussions, the laughs and the shared frustrations.
To Professor Rui de Carvalho, for all his help with the analysis and the “borrowed” standards. For
the fruitful discussions and for taking a special interest in me and my work.
To all of my colleagues of the “Intermediary Metabolism” Group, in particular to Margarida for all
the rides to Cantanhede – and also the gossip that got us through lunch and coffee breaks.
To all of my colleagues at the “Purines at CNC” Group, in particular to Cristina Lemos and Anna, for
helping me keep my sanity when all seemed lost – and for rejoicing with me in my little victories.
For all the teas, the talks, the laughs and the cries. To Carolina Xavier, with whom it is an absolute
joy to work with! To Daniel Rial, for all the help, the jokes and for never thinking my questions
were stupid. To Filipe Matheus, for kindly supplying the 6-OHDA rats. To Henrique Silva, who can
fix pretty much everything around the lab and keeps our experiments running. To António for,
well, for being António.
To Yarmo, for all his curiosity and neverending questions, reminding me why we love science so
much!
Aos meus amigos, de Coimbra e do Entroncamento, que me ajudaram a ser o que sou hoje: à
Catarina Cajada, que sofreu tanto como eu com esta tese e ouviu as minha infinitas lamentações
quando tudo corria mal com infinita paciência; ao Rudolfinho, ao Nini Faloan, ao Cerca, à Minês,
ao Scratcha (pelas revisões … e pelos scratchas), à Daniela, ao Tiago alfa, ao Tiago beta, à Cláudia,
à minha (sempre) caloirinha Rita Leão e ao meu caloiro André Santiago. Ao Mário Carvalho pelos
cafés espontâneos e conversas intermináveis.

iii
Um agradecimento muito especial à Isabel, por toda a ajuda, companheirismo e conselhos. I could
not have made it without you giiirl!
À Luísa, por de vez em quando me fazer sair para ver a luz do sol e comer um pastelinho, e me
relembrar constantemente que nunca é tarde para perseguirmos os nossos sonhos. Pela sua
imensa, eterna e contagiante alegria de simplesmente ser e viver! Pela sua forma muito própria de
ver sempre o mundo como algo novo e fantástico a explorar.
Ao meu querido Paulo, um agradecimento muito especial, por me aturar em todos os bons e maus
momentos, por sempre me fazer ver o silver lining, por todo o apoio e amor incondicional que me
dá e por acreditar em mim pelos dois quando eu não acreditei em mim mesma. Por estar tão, tão
perto, mesmo estando longe.
À família do Paulo, em especial à mãe Alda, à irmã Margarida e aos primos Firefox, por me
acolherem como se fosse da família.
Aos meus pais, Carlos e Antónia, que sempre me apoiaram e ajudaram incondicionalmente, e
sempre fizeram de tudo para que nada me faltasse. A eles que há 18 anos atrás correram a cidade
porque tudo o que eu queria pelo Natal era um microscópio. Por manterem sempre esse meu
sonho vivo, e por constantemente me lembrarem que eu podia ser o que quisesse “quando fosse
grande”.
À minha irmã, por de vez em quando me “salvar” do amor dos meus pais. Por ser minha irmã e
fazer essas coisas de irmãs. E depois mais ainda.
Aos meus avós, Cuca e Mimi, que durante estes anos em Coimbra me deram mais do que cama,
comida e roupa lavada, trataram de mim, mimaram-me e fizeram-me sentir em casa. Garantiram
que nunca me faltasse nada, fosse gelado, chocolates, bolachinhas ou miminhos. Ou comida da
avó!
A todos os cientistas e investigadores que fazem da ciência algo belo, onde as descobertas são
partilhadas com alegria, onde a curiosidade é fomentada, e a sede de saber sempre mais e
“porquê” fala sempre mais alto. Que nunca nos falte essa curiosidade infantil, essa sede do saber,
e o amor à camisola (ou melhor, à bata?)
Muito obrigado.

iv
Index Acknowledgments/Agradecimentos .................................................................................................... ii
Abreviations ........................................................................................................................................ vi
Abstract ............................................................................................................................................. viii
Keywords ........................................................................................................................................... viii
Sumário ............................................................................................................................................... ix
Palavras-chave .................................................................................................................................... ix
1. Introduction ............................................................................................................................... 10
1.1. Ketone Bodies: an overview ................................................................................................ 11
1.2. Physiology of Ketogenesis ................................................................................................... 14
1.3. Ketone Bodies as alternative brain fuels to glucose ........................................................... 16
1.4. Ketone bodies, Monocarboxylate Transporters and the Lactate-Shuttle Hypothesis ....... 18
1.5. Ketogenic Diet ..................................................................................................................... 19
1.6. Parkinson’s disease ............................................................................................................. 21
1.7. Nuclear Magnetic Resonance (NMR) .................................................................................. 21
1.7.1. 13C NMR spectroscopy ................................................................................................. 22
1.7.2. 1H NMR spectroscopy .................................................................................................. 23
2. Aim of the Project ...................................................................................................................... 24
3. Materials and Methods .............................................................................................................. 26
3.1. Solutions and buffers .............................................................................................................. 27
Isotopomers ............................................................................................................................... 27
Non-labeled metabolites ........................................................................................................... 27
Chemicals and Reagents ............................................................................................................ 28
Others ......................................................................................................................................... 29
Animals ....................................................................................................................................... 29
3.2. Superfusion of hippocampus, cortex and striatum of WT Wistar Rats .................................. 29
3.2.1. Supra-physiological saturating levels of glucose and 3-β hydroxybutyrate in
hippocampus .............................................................................................................................. 30
3.2.2. Regional metabolism of in situ levels of glucose, lac/pyr and 3HB ................................. 30
3.2.3. Non-recirculating superfusion of hippocampal slices...................................................... 30
3.3. Regional metabolism of a 6-OHDA Rat Model of Parkinson’s disease ................................... 31
i) Pilot study 1 - Provision of 5 mM [U-13C]glucose and 1/0.1 mM sodium [3-13C]lactate/unlabeled pyruvate ................................................................................................. 31

v
ii) Pilot study 2 - Provision of 5 mM [U-13C]glucose, 1/0.1 mM sodium [3-13C]lactate/unlabeled pyruvate and unlabeled 3HB .................................................................. 31
3.4. Metabolite extraction ............................................................................................................. 31
3.5. Protein Quantification ............................................................................................................. 32
3.6. NMR Sample preparation ....................................................................................................... 32
3.7. NMR spectra acquisition ......................................................................................................... 32
3.8. NMR spectra analysis .............................................................................................................. 32
3.8.1. Experiments using [2-13C]lactate/pyruvate, [1-13C]glucose, [U-13C]3HB ......................... 34
3.8.2. Experiments using, [U-13C]glucose, [3-13C]lactate and unlabeled pyruvate .................... 34
3.8.3. Experiments using, [U-13C]glucose, [3-13C]lactate and unlabeled pyruvate and 3HB ..... 35
3.8.4. Glutamate 13C Natural Abundance Correction ................................................................ 36
3.9. Statistical analysis ................................................................................................................... 36
4. Results and Discussion ............................................................................................................... 37
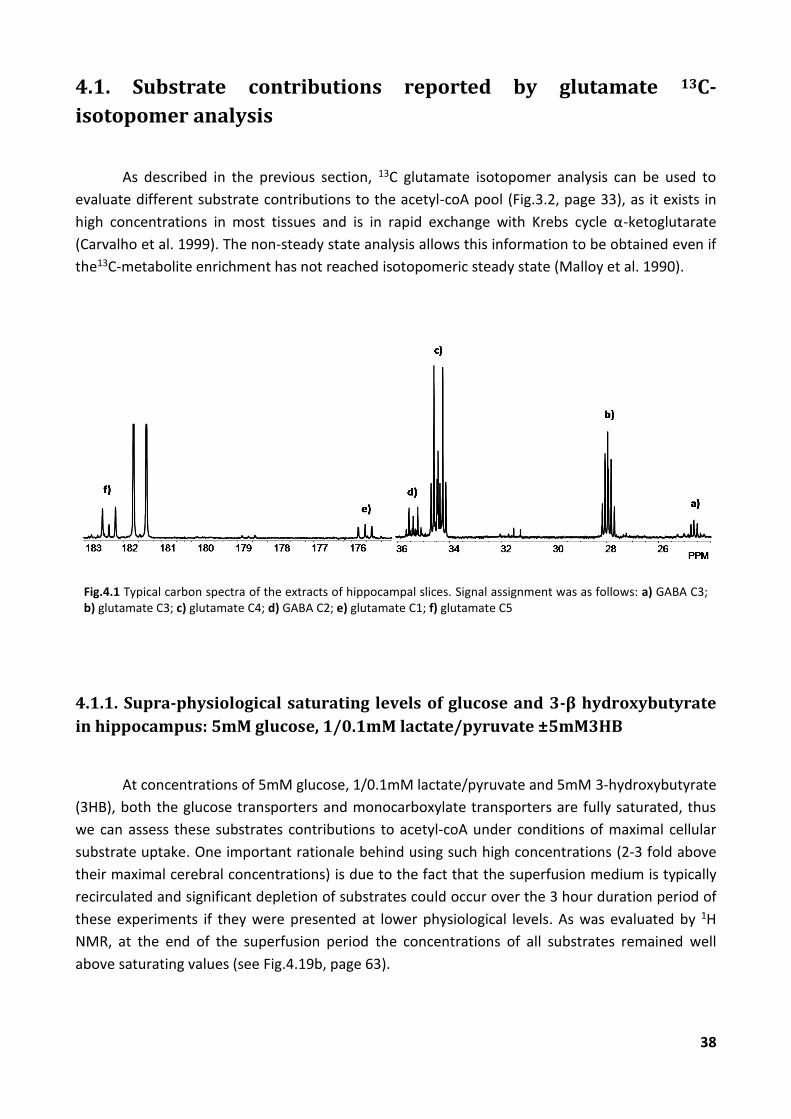
4.1. Substrate contributions reported by glutamate 13C-isotopomer analysis ............................. 38
4.1.1. Supra-physiological saturating levels of glucose and 3-β hydroxybutyrate in
hippocampus: 5mM glucose, 1/0.1mM lactate/pyruvate ±5mM3HB....................................... 38
4.1.2. Regional metabolism of 2mM glucose, 1/0.1mM lac/pyr ± 1.7mM 3-hydroxybutyrate 42
4.1.3. Regional metabolism of a 6-OHDA rat model of Parkinson’s disease ............................. 45
i) Pilot study 1 – [U-13C]glucose (5mM) vs [3-13C]lactate (1mM) ........................................... 45
ii) Pilot study 2 – [U-13C]glucose (5mM) vs [3-13C]lactate (1mM) vs unlabeled 3HB (5mM)
……………………………………………………………………………………………………………………………………46
4.1.4. C4/C3 glutamate ratios .................................................................................................... 49
4.2. 1H extract analysis: cell content quantification ...................................................................... 52
4.2.1. Supra-physiological saturating levels of glucose and 3-β hydroxybutyrate in
hippocampus: 5mM glucose, 1/0.1mM lactate/pyruvate ±5mM 3HB ...................................... 53
4.2.2. Regional metabolism of 2mM glucose, 1/0.1mM lac/pyr ± 1.7mM 3-hydroxybutyrate 55
4.2.3. Regional metabolism of a 6-OHDA rat model of Parkinson’s disease ............................. 58
4.3. 1H analysis of superfusates ..................................................................................................... 62
4.3.1. Supra-physiological saturating levels of glucose and 3-β hydroxybutyrate in
hippocampus: 5mM glucose, 1/0.1mM lactate/pyruvate ± 5mM 3HB ..................................... 62
4.3.2. Regional metabolism of 2mM glucose, 1/0.1mM lac/pyr ± 1.7mM 3-hydroxybutyrate 67
5. Concluding Remarks and Future Work ...................................................................................... 73
References.......................................................................................................................................... 75

vi
Abreviations
°C – degrees Celsius
12C – carbon 12
13C – carbon 13
13C3 – carbon 3 labeled as 13C
13C4 – carbon 4 labeled as 13C
1H - proton
1JC-H – heteronuclear (C-H) coupling constant J from interactions 1 atomic bond apart
2JC-H – heteronuclear (C-H) coupling constant J from interactions 2 atomic bonds apart
2H– deuterium
31P – phosphorous 31
3HB – 3-D-β-hydroxybutyrate
3-KT – 3-kethotiolase
4-AP – 4 aminopyridine
6-OHDA – 6-hydroxydopamine
AcAc – acetoacetate
AceSS1– acetyl-coA synthetase isoform 1
AceSS2– acetyl-coA synthetase isoform 2
Acetyl-coA – acetyl-coenzyme A
ACSF – artificial cerebral-spinal fluid
ADP – adenosine diphosphate
Ala – alanine
AP – antero-posterior
ATP – adenosine triphosphate
BBB – blood brain barrier
BCA – Bicinchoninic Acid
BSA – bovine serum albumin
coA – coenzyme A
CPT 1 - carnitine palmitoyltransferase 1
Cre – creatine
D2O – deuterated water
DV – dorso-ventral
Fc0 – fraction of glutamate pool that originated in acetyl-coA without any 13C label
Fc1 – fraction of glutamate pool that originated in acetyl-coA labeled with 13C in carbon 1
Fc2 – fraction of glutamate pool that originated in acetyl-coA labeled with 13C in carbon 2
Fc3 – fraction of glutamate pool that originated in acetyl-coA labeled with 13C in both carbons
GABA – y-aminobutyric acid
GABA C2D12 - doublet in the carbon 2 region, due to 13C label in the adjacent C1
GABA C2S - GABA labeled with 13C only in carbon 2 giving rise to a Singlet peak
GLUT1 – glucose transporter protein 1
GLUT3 – glucose transporter protein 3
Glutamate C3 – glutamate labeled 13C in carbon 3, regardless of other existing 13C labels on adjacent carbons
Glutamate C4 – glutamate labeled with 13C in carbon 4, regardless of other existing 13C labels on adjacent carbons
Glutamate C4D34 - doublet in the carbon 4 region, due to 13C label in the adjacent C3
Glutamate C4Q – quartet in the carbon 4 region, due to label in the adjacent C5 and the adjacent C3

vii
Glutamate C5D45 – doublet in the carbon 5 region, due to 13C label in the adjacent C4
Glutamate C5S – glutamate labeled with 13C only in carbon 5 giving rise to a Singlet peak
H2O2 – hydrogen peroxide
HBD – 3-D-β-hydroxybutyrate dehydrogenase
HL – HMG-coA lyase
HMG-coA - 3-hydroxy-3-methylglutaryl CoA
ip – intraperitoneally
J – apparent coupling constant J
KB- Ketone Bodies
KD – Ketogenic Diet
KOH – potassium hydroxide
Lac – lactate
LCFA – long chain fatty acids
LDH – lactate dehydrogenase
MAT – methylacetoacetyl-coA thiolase
MCT – monocarboxylate transporter protein
MCTr – medium chain triglycerides
mHS - HMG-coA synthase
ML – medium-lateral
MPP+–1-methyl-4-phenylpyridinium
MPTP–1-methyl-4-phenyl-1,2,3,6-tetrahydropyridine
MRS – Magnetic Resonance Spectroscopy
N - nitrogen
NAA – N-acetyl-aspartate
NAD+ - oxidated form of nicotinamide adenine dinucleotide
NADH - reduced form of nicotinamide adenine dinucleotide
NADP+ - oxidated form of nicotinamide adenine dinucleotide phosphate
NADPH – reduced form of nicotinamide adenine dinucleotide phosphate
NEFA – non-esterified fatty acids
NMR – Nuclear Magnetic Resonance
NR – non-recirculating
OCT – 3-oxoacid-coA transferase
PC – pyruvate carboxylase
PCA – perchloric acid
PCre – phosphocreatine
PD – Parkinson’s disease
PDH – pyruvate dehydrogenase
ppm – parts per million
Pyr – pyruvate
Rec – recirculating
ROS – reactive oxygen species
SCOT – succinil-coA oxoacid transferase
SN – Substantia Nigra
TSP – trimethylsilyl propanoic acid
VLDL– very low density lipoproteins
WT – Wild Type
ΔG’ – Gibbs free energy

viii
Abstract Since their discovery as a marker for diabetic ketoacidosis, ketone bodies have become
known for their therapeutic role as effective agents in refractory epilepsy and a diet specifically designed to increase ketone bodies’ levels in circulation has been often prescribed as treatment. In the classical ketogenic diet, intake of even small additional amounts of carbohydrates drastically drops the level of circulating ketone bodies and abolishes their therapeutical effects (in epilepsy, the immediate re-appearance of seizures is the most obvious sign of reversal). Novel dietary supplements have been developed to produce ketone bodies under less restrictive dietary conditions and are able to generate a significant amount of ketone bodies even in the presence of considerable dietary carbohydrate.
Since previous studies of cerebral ketone body utilization had always been performed under conditions of low glucose availability, the aim of this project was to evaluate the competition between glucose and ketone bodies for cerebral energy production with saturating concentrations of both substrates and probe for possible cell-type substrate preference.
Thus, we evaluated the contribution of saturating (5mM) levels of the ketone body 3-hydroxybutyrate (3HB) to cerebral energy generation in the presence of non-limiting glucose levels (5mM) in hippocampal slices. Following administration of selectively 13C-enriched exogenous glucose, ketone bodies and lactate/pyruvate, we used 13C-NMR isotopomer analysis of tissue glutamate and GABA to determine the contribution of each substrate to glutamatergic and GABA-ergic Krebs cycle utilization. We demonstrated that 3HB effectively competed with glucose for acetyl-coA formation in both metabolic compartments, but with greater efficacy in the glutamatergic compared to the GABA-ergic compartment.
3HB did not decrease lactate/pyruvate utilization for Krebs cycle oxidation, suggesting that it did not downregulate pyruvate oxidation to acetyl-coA via pyruvate dehydrogenase. Instead, it may downregulate glycolysis upstream of PDH, a hypothesis supported by the observation that levels of superfusate lactate derived from glycolysis of the 13C-enriched glucose substrate showed a strong tendency to be reduced in the presence of the ketone body. Ketone bodies also seem to contribute to a more reduced cytosolic redox state as revealed by higher tissue lactate/alanine ratios when 3HB was included as a substrate.
Brain slice preparations also secreted a significant amount of acetate into the superfusion medium. All four possible isotopomers of acetate ([1-13C], [2-13C], [U-13C] and [U-12C]acetate) were resolved by 1H NMR of superfusate samples. Acetate 13C-isotopomers originating from [1-13C]glucose, [U-13C]glucose, [3-13C]lactate and [2-13C]lactate/pyruvate were observed, but in experiments where [U-13C]3HB was present, its predicted [U-13C]acetate product was never detected. Hence, we conclude that this acetate was derived from a metabolic pool that was not in exchange with acetyl-CoA that was derived from 3HB oxidation. While not contributing any carbons to secreted acetate, the presence of 3HB seemed to attenuate its production. Further experiments are needed to identify the enzymes and cell compartments that are involved in its production.
Keywords: brain metabolism; Krebs cycle; ketone bodies; NMR spectroscopy
ix
Sumário Desde a sua descoberta como um marcador de cetoacidose diabética, os corpos cetónicos
tornaram-se conhecidos pelo seu papel terapêutico em epilepsia refractária, e uma dieta desenhada especificamente para aumentar os níveis de corpos cetónicos em circulação tem sido prescrita como tratamento. Na dieta cetogénica clássica, o consumo de pequenas quantidades de hidratos de carbono diminui drasticamente os níveis de corpos cetónicos em circulação e suprime o seu efeito terapêutico (em pacientes epilépticos, o re-aparecimento imediato das convulsões é o sinal mais óbvio de reversão). Têm sido desenvolvidos novos suplementos dietéticos para produzir corpos cetónicos sob condições alimentares menos restritas, e estes são capazes de gerar uma quantidade significativa de corpos cetónicos mesmo na presença de níveis de carbohidratos consideráveis.
Dado que os estudos prévios sobre a utilização cerebral de corpos cetónicos foram sempre realizados com baixa disponibilidade de glucose, o objectivo deste trabalho foi o de avaliar a competição entre glucose e corpos cetónicos para a produção de energia cerebral em condições saturantes de ambos os substratos, e explorar possíveis preferências ao nível de tipo de célula.
Assim, avaliámos a contribuição de concentrações saturantes (5mM) do corpo cetónico 3-hidroxibutirato (3HB) para a produção energética cerebral na presença de níveis de glucose não-restritivos (5mM) em fatias de hipocampo. Após a administração de glucose, lactato/piruvato e corpos cetónicos selectivamente marcados com 13C, analisámos os isotopómeros de glutamato e GABA por 13C-RMN para determinar a contribuição de cada substrato para a oxidação no ciclo de Krebs nos neurónios glutamatergicos e GABAérgicos, respectivamente. Demonstrámos que o 3HB compete eficazmente com a glucose para a formação de acetil-coA em ambos os compartimentos, mas com maior eficácia no compartimento glutamatérgico, quando comparado com o compartimento GABAérgico.
O 3HB não diminuiu a utilização de lactato/piruvato pelo ciclo de Krebs, sugerindo que não diminui a oxidação do piruvato a acetil-coA via piruvato desidrogenase. Em vez disso, poderá diminuir o fluxo glicolítico acima da pirvato desidrogenase, uma hipótese suportada pela observação de que os níveis de lactato proveniente da glucose marcada no superfusato mostram uma forte tendência para serem mais baixos na presença do corpo cetónico. Os corpos cetónicos também parecem contribuir para um estado citosólico mais reduzido, demonstrado pelo maior rácio lactato/alanina observado quando o 3HB era incluído como substrato.
As fatias de estruturas cerebrais também parecem excretar uma quantidade significativa de acetato para o meio superfusato. Todos os isotopómeros possíveis do acetato ([1-13C], [2-13C], [U-13C] e [U-12C]acetato) foram determinados no superfusato por 1H RMN. Foram observados os isotopómeros de 13C de acetato proveniente de [1-13C]glucose, [U-13C]glucose, [3-13C]lactato e [2-13C]lactato/piruvato mas nas experiências em que [U-13C]3HB estava presente, o esperado [U-13C]acetato nunca foi observado. Deste modo, concluímos que este acetato é formado de um compartimento metabólico que não está em contacto com o acetil-coA derivado da oxidação de 3HB. Ainda que não contribuindo para a formação de acetato, a presença do 3HB pareceu atenuar a sua produção. Serão necessárias mais experiências para identificar as enzimas e compartimentos celulares envolvidos na produção de acetato.
Palavras-chave: metabolismo cerebral; ciclo de Krebs; corpos cetónicos; espectroscopia NMR

10
1. Introduction

11
1.1. Ketone Bodies: an overview
Ketone bodies (KB) are a class of metabolites that are synthesized in the liver from fatty-
acid derived acetyl-coA (Fig.1.1). They were first discovered in the late 19th century in the urine of
patients in diabetic coma and soon associated with the symptoms that we now refer to as
“diabetic ketoacidosis” (Vanitallie & Nufert 2003). In diabetic ketoacidosis, ketone bodies’ levels in
blood can rise up to 25mM which results in severe acidosis and consequent death if untreated
(Laffel 1999; Veech et al. 2001; Veech 2004).
Fig.1.1 Structure of the main ketone bodies, 3-β-hydroxybutyrate, acetoacetate and acetone. Figure from Laffel 1999
However, it is now well established that a mild, controlled ketosis may have beneficial
effects (Veech et al. 2001; Vanitallie & Nufert 2003; Veech 2004; Hashim & Vanitallie 2014).
Particularly, ketone bodies have been widely reported as helping to control seizures in retractable
epilepsy (Kinsman et al. 1992; Erecińska et al. 1996; Daikhin & Yudkoff 1998; Puchowicz et al.
2000; Vanitallie & Nufert 2003; Ma et al. 2007; Hasebe et al. 2010). In the early 20th century,
epilepsy was believed to be caused by intestinal intoxication, and fasting was prescribed as a
treatment (Veech et al. 2001). In 1921, Russel Wilder came to the conclusion that ketone bodies
themselves were the effective agent, and proposed that the same effects could be achieved from
a high fat-low carbohydrate diet (Wilder 1921). The “ketogenic diet” (KD) is also known as the 4:1
diet because it provides a ratio of approximately 4 parts (by weight) fat to 1 part (by weight) of a
mixture of protein and carbohydrate. In practice, it means a daily uptake of 1g of protein/kg body
weight (considerably less in adults), 10 to 15g of carbohydrate, and the remainder of the calories
as fat (Wilder 1921; Vanitallie & Nufert 2003; Veech 2004; Hallböök et al. 2012).

12
With the development of anti-epileptic drugs, the ketogenic diet became less prescribed as
treatment. Nonetheless, there are still many cases of retractable epilepsy for which current anti-
epileptic drugs are ineffective, and ketogenic diets are indicated. For example it was reported that
for a group of patients with refractory epilepsy to over 6 anti-epileptic drugs and reporting over 20
seizures a day, a ketogenic diet had beneficial effects. 20% of these patients had virtually complete
seizure control, while in 38% of the patients, seizure frequency was reduced by half (Kinsman et al.
1992). In animal models, ketogenic feeding was shown to significantly increase the threshold
against seizures induced either chemically via pentylenetetrazol infusion or electrically via the
electroconvulsive shock test (Thavendiranathan et al. 2003). In resolving epilepsy resulting from
GLUT1 deficiency (the major glucose transporter across the blood-brain barrier), ketone bodies
were hypothesized to provide an alternative substrate for energy generation, thereby
compensating for low glucose uptake (Veech et al. 2001; Veech 2004; Marin-Valencia et al.
2012).The mechanism of action of ketone bodies in resolving other forms of epilepsy remains
unknown (Veech et al. 2001; Laffel 1999; Vanitallie & Nufert 2003; McNally & Hartman 2012);
some authors have cited the effects of increased brain inhibitory neurotransmitter gamma-
aminobutyric acid (GABA) (Erecińska et al. 1996; Daikhin & Yudkoff 1998; Yang et al. 2007; Kang &
Macdonald 2009; McNally & Hartman 2012; Kernig et al. 2012). Others have attributed the
therapeutic efficacy of the ketogenic diet to a decrease in circulating blood glucose (Greene et al.
2001). It is accepted that the metabolism of KB in the brain is likely to improve the overall energy
cellular state since ATP/ADP ratio is significantly increased in the brain of rats fed a high-fat diet.
This improves the maintenance of Na+ and Ca2+gradients thereby decreasing the resting
membrane potential and inhibiting the synchronous neuronal discharge characteristic of epilepsy.
This may, at least partially, explain the increased neuronal stability that develops during chronic
ketosis (Vanitallie & Nufert 2003; Veech 2004).
Recently, ketone bodies have become the focus of attention regarding their
neuroprotective and antioxidant roles, particularly in neurodegenerative diseases such as
Alzheimer’s disease (Henderson 2008; Henderson & Poirier 2011) as well conditions of limited
glucose delivery. This may be due in part to their capacity to supplement compromised cerebral
energy generation from glucose. As an example, KB were shown to increase survival in a rodent
model of bilateral carotid occlusion and hypoxia (Suzuki et al. 2001).
Unlike glucose, which can be oxidized for energy via acetyl-CoA or supply anaplerotic
carbons via pyruvate carboxylase (PC), four-carbons KB such as 3-hydroxybutyrate (3HB) and
acetoacetate (AcAc) can only be converted to acetyl-coA. Hence, their utilization by the Krebs
cycle is limited to that of energy production and they cannot increase the overall pool sizes of
Krebs cycle metabolites and associated amino acids. However, it is possible that through
bypassing pyruvate dehydrogenase-mediated control of acetyl-coA production, they can cause a
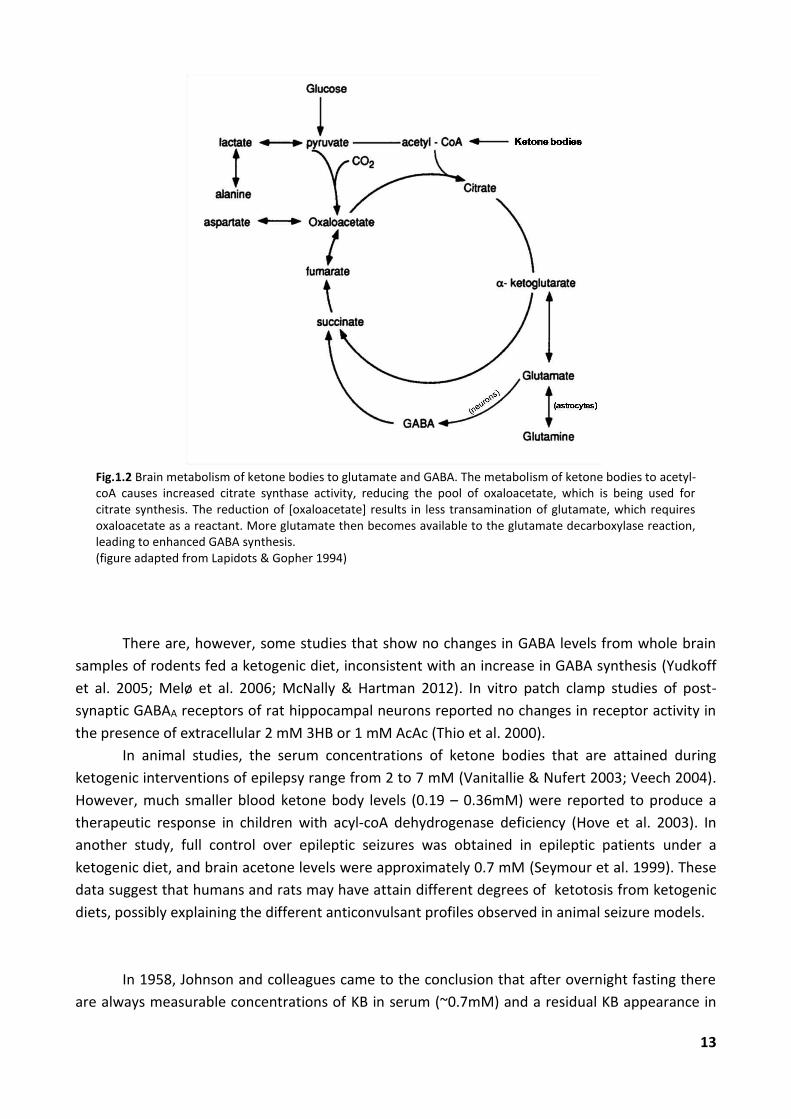
redistribution of these metabolite pools resulting in increased GABA levels (Fig.1.2).
13
Fig.1.2 Brain metabolism of ketone bodies to glutamate and GABA. The metabolism of ketone bodies to acetyl-coA causes increased citrate synthase activity, reducing the pool of oxaloacetate, which is being used for citrate synthesis. The reduction of [oxaloacetate] results in less transamination of glutamate, which requires oxaloacetate as a reactant. More glutamate then becomes available to the glutamate decarboxylase reaction, leading to enhanced GABA synthesis. (figure adapted from Lapidots & Gopher 1994)
There are, however, some studies that show no changes in GABA levels from whole brain
samples of rodents fed a ketogenic diet, inconsistent with an increase in GABA synthesis (Yudkoff
et al. 2005; Melø et al. 2006; McNally & Hartman 2012). In vitro patch clamp studies of post-
synaptic GABAA receptors of rat hippocampal neurons reported no changes in receptor activity in
the presence of extracellular 2 mM 3HB or 1 mM AcAc (Thio et al. 2000).
In animal studies, the serum concentrations of ketone bodies that are attained during
ketogenic interventions of epilepsy range from 2 to 7 mM (Vanitallie & Nufert 2003; Veech 2004).
However, much smaller blood ketone body levels (0.19 – 0.36mM) were reported to produce a
therapeutic response in children with acyl-coA dehydrogenase deficiency (Hove et al. 2003). In
another study, full control over epileptic seizures was obtained in epileptic patients under a
ketogenic diet, and brain acetone levels were approximately 0.7 mM (Seymour et al. 1999). These
data suggest that humans and rats may have attain different degrees of ketotosis from ketogenic
diets, possibly explaining the different anticonvulsant profiles observed in animal seizure models.
In 1958, Johnson and colleagues came to the conclusion that after overnight fasting there
are always measurable concentrations of KB in serum (~0.7mM) and a residual KB appearance in

14
urine (0.9-2.8µmol/min). They also observed that moderate daily physical activity seems to
increase the capacity of muscle to use KB (Johnson et al. 1958). Prolonged exercise is now known
to be associated with mild hyperketonemia, with ketone body levels rising up to 2 mM. Under
these conditions there is significant oxidation of KB by peripheral tissue, including skeletal muscle
(Laffel 1999; Vanitallie & Nufert 2003). It has also been shown in suckling rodents that KB derived
from oxidation of the fatty acids contained in maternal milk represent a significant source of
energy, particularly for the developing brain (Hawkins et al. 1971; Vannucci & Simpson 2003;
Pierre & Pellerin 2005).
1.2. Physiology of Ketogenesis
Ketosis may be seen as the response of tissue to carbohydrate deprivation during
starvation or as a result of insulin deficiency. The formation of ketone bodies, ketogenesis, is
stimulated by a high glucagon/insulin ratio (as happens in fasting and Type 1 diabetes) through
activation of lipolysis of the adipocyte tissue and β-oxidation in the liver (Laffel 1999). Fatty acids
enter the hepatocytes’ mitochondria as fatty acyl-coA and undergo β-oxidation to acetyl-coA.
Then, acetoacetyl-coA is formed (catalyzed by 3-kethotiolase – 3KT), and converted to 3-hydroxy-
3-methylglutaryl-coA (HMG CoA) by HMG-coA synthase (mHS). This step is stimulated under
conditions of starvation, low levels of insulin, and the consumption of a high fat diet. Acetoacetate
is then formed, in a step catalyzed by HMG-coA lyase (HL). Acetoacetate is reduced to 3HB by 3-
hydroxybutyrate dehydrogenase (HBD), or undergoes spontaneous decarboxylation, forming
acetone (Fig.1.3) (Laffel 1999; Vanitallie & Nufert 2003). 3-hydroxybutyrate dehydrogenase (HBD)
is a phosphatidylcholine-dependent enzyme.
During the reduction step of AcAc to 3HB catalyzed by HBD, NADH is oxidized to NAD+, and
as a consequence, the ultimate ratio of 3HB to AcAc (KB ratio) in the blood is dependent on the
redox potential (i.e. the NADH/NAD+ ratio) within hepatic mitochondria. This KB ratio is often used
as an indirect indicator of the redox state of the hepatocyte mitochondria (Laffel 1999), whereas
lactate/pyruvate ratio is used as an indicator of cytosolic redox state (Cruz et al. 2001; Alves et al.
2011).

15
Fig.1.3 Ketone bodies formation from fatty acids. Fatty acyl-coA is transported into mitochondria via the carnitine shuttle, driven by carnitine palmitoyltransferase 1 (CPT 1). Excess of acetyl-coA is converted to acetoacetate via 3-ketothiolase (3-KT), HMG CoA synthase (mHS) and HMG CoA lyase (HL). Acetoacetate is reduced to 3HB by 3HB dehydrogenase (HBD), and acetone is formed by the spontaneous decarboxylation of acetoacetate. Acetyl-coA carboxylase catalyzes the production of malonyl-coA from acetyl-coA. Malonyl-coA inhibits CPT1, so if excess acetyl-coA is shunt to ketone bodies’ production, there will be decreased activity of acetyl-coA carboxylase and increased transport of fatty acids into the mitochondria. Acetyl-coA carboxylase activity is also upregulated by insulin. In low insulin conditions such as Diabetes Type1 or fasting there is no production of malonyl-coA, hence CPT 1 is not inhibited. Figure from Laffel 1999
KB supply 2 to 6% of the body’s energetic needs after an overnight fast and 30 to 40% after
a 3-day fast (Laffel 1999; Vanitallie & Nufert 2003). When people are deprived of food for 3 days
or longer, they become hyperketonemic, with ketone bodies concentration in blood reaching
levels up to 5-7mM (Vanitallie & Nufert 2003; Veech 2004; Hashim & Vanitallie 2014) and liver
production of KB achieves 150g/day (Veech 2004). In healthy individuals, the buffering capacity of
blood is capable of dealing with this level of ketoacidosis (Hashim & Vanitallie 2014). Bates and
colleagues showed that in starved rats, the mean total KB concentration in the blood rises about
11-fold compared to fed animals (Bates et al. 1968). This is essential to preserve muscular mass
from being consumed by providing non-glucose substrate for the brain and preventing muscle
protein breakdown for glucose synthesis. Thus, humans can survive for up to 2 months without
food, compared to an estimated 2–3 weeks if ketone bodies were not available (Veech et al. 2001;
Vanitallie & Nufert 2003).

16
1.3. Ketone Bodies as alternative brain fuels to glucose
The human brain has a high energy demand: it represents2% of body weight but accounts
for about 20% of whole-body oxygen and glucose consumption (Veech et al. 2001; Vanitallie &
Nufert 2003; Pellerin 2010). Most of the neural ATP and NADPH produced are used to maintain
the electrochemical (Na+/K+) gradient needed for electrical and chemical signaling and to restore
membrane resting potential after depolarization by the Na+, K+-ATPase. The remainder is used to
recycle neurotransmitters (Castro et al. 2009). The brain also consumes other substrates including
lactate and pyruvate (Bouzier et al. 2000; Hassel & Bråthe 2000; Bergersen et al. 2001; Bouzier-
Sore et al. 2002; Vannucci & Simpson 2003; Pierre & Pellerin 2005; Pellerin 2010; Dienel 2012) but
non-esterified fatty acids are unable to cross the blood-brain barrier (BBB), and are therefore
unavailable as an energy source even when blood glucose levels are low (Laffel 1999; Vanitallie &
Nufert 2003). With glucose as the main source of energy and with very little endogenous
carbohydrate stored as glycogen, there is a need for constant cerebral glucose uptake (Lapidots &
Gopher 1994).
Protein catabolism would be a feasible source of energy for a short period of time.
Theoretically, 57 g of glucose can be derived from 100 g of protein breakdown. Generation of the
required 100 to 150 g of glucose/day for sustenance of the brain would require the gluconeogenic
breakdown of about 172 to 259 g/day of body protein, representing an unsustainable loss of lean
body mass. In fact, during prolonged fasting 4–9 g of nitrogen per day are excreted. If we assume
that 1 g of urinary nitrogen corresponds to 6.25 g of protein catabolism, this rate of urinary
nitrogen appearance represents the catabolism of 25–55 g protein/day. This amount of protein
catabolism could supply between 17 and 32 g of glucose for the brain per day which is far below
the daily requirement (Gamble et al. 1923; Owen et al. 1967; Vanitallie & Nufert 2003; Veech
2004).
Ketone bodies were found to replace glucose as the brain’s main fuel during prolonged
fasting in 1967 (Owen et al. 1967). They are uptaken via monocarboxylate transporters (MCTs)
through the BBB (Bouzier-Sore et al. 2002; Vannucci & Simpson 2003; Pierre & Pellerin 2005;
Pellerin 2010; Hashim & Vanitallie 2014). During starvation, increased KB levels in blood are
partially due to a decrease in KB utilization by skeletal muscles thereby sparing KB to fuel the brain
(see Table 1-1). Glucose utilization in the brain drops to 1/3 of the values for the fed state, with KB
filling the energy gap (Owen et al. 1967; Laffel 1999; Vanitallie & Nufert 2003) for both neurons
and astrocytes, with higher rates of utilization for neurons (70% of total KB consumption) than for
astrocytes (30%) (Jiang et al. 2011). During prolonged fasting, blood glucose concentrations can
decrease to below 1mM without either convulsions or any notable impairment of cognitive
function (Cahill & Aoki 1980; Veech 2004). Interestingly, some early studies have shown that even
in the presence of glucose, the brain is able to metabolize KB in significant amounts (Hawkins et al.
1971; Pan et al. 2002; Henderson & Poirier 2011), showing that KB utilization may be independent
of the nutritional state.

17
Table 1-1 Proportion of brain energy metabolism supported by ketone bodies, as a function of plasma ketone bodies concentration (in mM). From Hashim & Vanitallie 2014
In stress situations such as ischemia, trauma or low glucose, the brain adapts by increasing
the expression and activities of enzymes and transporters for KB metabolism (Vanitallie & Nufert
2003; Prins 2008; Jiang et al. 2011). There is increased transport from the blood through MCTs
(Jiang et al. 2011) as it has been demonstrated in the brain of starved rats and an upregulation of
3-oxoacid-CoA transferase (OCT) activity (Vanitallie & Nufert 2003). Succinyl-coA-oxoacid
transferase (SCOT) is the enzyme responsible for the conversion of AcAc back into acetoacetyl-
coA, and is the rate-determining step in ketolysis (Fig.1.4). SCOT activity is highest in the heart and
kidney, central nervous system and skeletal muscle, with only residual activity in the liver. SCOT
activity is down-regulated by high (>5 mM) intracellular levels of acetoacetyl-coA. This
phenomenon is responsible for the observed increase in circulating levels of ketone bodies during
the early phases of starvation (3 days to 2 weeks), despite relatively constant rates of hepatic
ketogenesis during this period. The acetoacetyl-coA produced is then cleaved by
methylacetoacetyl-coA thiolase (MAT), producing free acetyl-coA, which can then enter the Krebs
cycle (Laffel 1999).
Fig.1.4 Utilization of ketone bodies in extra-hepatic tissues, particularly the brain. 3-β-hydroxybutyrate and acetoacetate enter the cells by the monocarboxylic transport proteins and enter the Krebs cycle after being converted to acetyl-coA by succinyl-coA-oxoacid transferase (SCOT) and methylacetoacetyl-coA thiolase (MAT). Figure adapted from Laffel 1999
18
A study of acute hyperketonemia in overnight-fasted humans infused intravenously with
[2,4-13C2]3HB revealed a dynamic enrichment pattern of brain glutamate and glutamine labeling
similar to that from [1-13C]glucose, indicating that oxidation of 3HB, like glucose, occurs mostly in
neurons (Pan et al. 2002). Later experiments in rats support this hypothesis (Jiang et al. 2011;
Chowdhury et al. 2014). Experiments in hyperketonic rats showed that 3HB is oxidized to a greater
extent in neurons than in astrocytes (70:30), and follows a pattern closely similar to the
metabolism of glucose, while Krebs cycle flux remained similar to values reported for normal rats
(Jiang et al. 2011).
Neural lipid synthesis preferentially uses AcAc over glucose (Patel & Owen 1976; Koper et
al. 1984). Both oligodendrocytes and astrocytes were shown to use AcAc for lipogenesis and
cholesterogenesis, and the incorporation of AcAc in lipid synthesis exceeds glucose contributions
(Koper et al. 1984). This suggests that some of the benefits of KB in brain lesion models may
involve the more rapidly recuperation of damaged neurons.
The literature is contradictory about the effects of ketone bodies on brain glucose
consumption. There are reports that KB do not reduce glucose oxidation (Zhang et al. 2013),
whereas others report that glucose metabolism decreases with increasing oxidation, consistent
with the down regulation of the glycolytic path at various levels such as phosphofructokinase
and/or hexokinase (LaManna et al. 2009; Jiang et al. 2011).
1.4. Ketone bodies, Monocarboxylate Transporters and the
Lactate-Shuttle Hypothesis
Ketone bodies are transported across cell membranes via MCTs – the monocarboxylate
transporters. In newborn rodents, during the suckling period there is a high expression of these
transporters in the brain, coinciding with active ketonegenis from the fat of maternal milk
(Vannucci & Simpson 2003; Simpson et al. 2007). After weaning, MCT2 seems to be expressed
predominantly in neurons. MCT4 appears to be astrocyte-specific and MCT1 is observed in brain
capillaries (Bergersen et al. 2001; Pierre & Pellerin 2005; Hashim & Vanitallie 2014). Glucose
transporters also seem to have tissue specificity. GLUT1 exists in the endothelial cells of capillaries,
and to some extent in astrocytes (Bouzier-Sore et al. 2002; Simpson et al. 2007), whereas neurons
seem to almost exclusively express GLUT3 (Leino et al. 1997; Bouzier-Sore et al. 2002; Simpson et
al. 2007), although neuronal GLUT1 expression increases in response to environmental stressors or
when neurons are placed in culture (Simpson et al. 2007).
The different MCT and GLUT isoform expression seems to suggest differential substrate
preference between these types of cells. MCT2 has the highest affinity for lactate, with a Km of
0.7mM. MCT4 has the highest Km for lactate (35mM) and MCT1 has an intermediary affinity with a
Km value of 3.5mM (Pellerin et al. 2005; Bergersen 2007). MCT4 has been well documented in

19
glycolytic muscle as an exporter of lactate, and some authors suggest it may have an analogous
function in the brain (Bergersen et al. 2001; Bergersen et al. 2002; Pierre & Pellerin 2005),
suggesting an astrocyte-to-neuron lactate shuttle hypothesis. Further supporting this hypothesis is
the GLUT3 astrocyte localization, as GLUT3 is characteristic of cells with high rates of glucose
metabolism (Simpson et al. 2007). Moreover, studies using labeled lactate show higher
enrichments of labeling in GABA and glutamate pools in comparison to glutamine (Hassel & Bråthe
2000; Bouzier et al. 2000; Bouzier-Sore et al. 2002). This specific MCT distribution also explains the
greater extent of KB oxidation by neurons than by astrocytes.
1.5. Ketogenic Diet
The ketogenic diet (KD) was invented to purposely increase circulating KB. It is also known
as the “4:1 diet” because it provided a ratio of approximately 4 parts (by weight) fat to 1 part (by
weight) of a mixture of protein and carbohydrate. In practice, it means a daily uptake of 1 g of
protein/kg body weight (considerably less in adults), 10 to 15 g of carbohydrate, and the
remainder of the calories as fat (Wilder 1921; Vanitallie & Nufert 2003; Veech 2004; Hallböök et al.
2012). In the ketogenic diet, the liver produces ketone bodies by shunting excess acetyl-coA to
ketogenesis (McNally & Hartman 2012). One might argue that ketone bodies increase acetyl-coA
production and thus should Krebs cycle flux, but in fact, ketone bodies’ increased metabolism
causes a depletion of free coenzyme A, by converting it to acetoacetyl-coA in β-oxidation. This
induces a decrease of α-ketoglutarate dehydrogenase activity, since it requires free coA, and
consequent reduction of flux throughout the rest of the cycle (Silver & Erecińska 1994; Daikhin &
Yudkoff 1998). When applied properly, the KD should minimize circulating glucose levels without
causing caloric restriction or malnutrition (Hallböök et al. 2012).
Although the high fat-low protein diet has been proved to have remarkable effects in
epilepsy, it is not without downside. A common problem of following a high fat-low carbohydrate
diet in adults is the elevation of triglycerides or cholesterol or both (Veech 2004): the mean blood
cholesterol has been reported in levels over 250, significantly above the recommended levels
(Veech 2004). Changing the fat portion by medium chain triglycerides (MCTr) may avoid these
effects and give approximately equal results in reducing seizures (Vanitallie & Nufert 2003; Veech
2004). Another major problem with the classical ketogenic diet is that ingestion of even small
amounts of carbohydrate cause insulin release and an immediate drop in ketone body levels
(followed by seizures in epileptic patients) (Veech et al. 2001), since carbohydrates are
metabolized to pyruvate, which is then converted to oxaloacetate, increasing acetyl-coA flux
through the Krebs cycle and thus, decreasing the KB synthesis pathway. Ketone bodies’ levels do
not rise after ingestion of long chain triglycerides within a normal diet (with carbohydrates), but
they do after MCTr ingestion (Bach et al. 1977). MCTr are fatty acids with between 6 and 12
carbons (Bach et al. 1977). They are well known to cause hyperketonemia in human, dogs (Bach
et al. 1977), pigs and rats (Yeh & Zee 1975). One of the advantages of MCTr is that rather than

20
being incorporated into lipid synthesis in the liver via chain elongation, they are converted to
ketone bodies regardless of nutritional state (Bach et al. 1977), with severe and long-lasting
hyperketonemia developing rapidly (15-30min after ingestion) (Yeh & Zee 1975; Bach et al. 1977).
Early experiments show that MCTr-induced ketosis does not impair utilization of glucose by
the liver: the level of plasma glucose was increased at 1 and 2 hours after MCTr plus glucose
administration, but was decreased at 1 hour after administration of MCTr alone. The
concentration of immune-reactive insulin in plasma was increased by MCTr but not by corn oil
(long chain fatty acid) suggesting that MCTr stimulates insulin release by the pancreas (Yeh & Zee
1975). Of note, MCTr-induced hyperketonemia was slightly but significantly reduced when co-
administrated with glucose (Yeh & Zee 1975).
Long-chain fatty acids (LCFA), insoluble in water, are absorbed by the lymphatic system in
the form of chylomicrons. When they reach the liver they are preferentially incorporated into
lipids synthesis, especially triglycerides. On the other hand, the medium-chain fatty acids, being
water soluble, are directly transported through the portal vein in the form of NEFA (non-esterified
fatty acids) bound to albumin. Hence they rapidly reach the liver, which takes them up almost
completely and does not integrate them into triglyceride and VLDL (very low density lipoproteins)
synthesis, but instead converts them to ketone bodies. This explains why an LCFA load increases
plasma triglycerides while MCTr does not (Yeh & Zee 1975; Bach et al. 1977). Oxidation of fatty
acids elevates acetyl-coA concentration and consequently increases the production of ketone
bodies (Yeh & Zee 1975). Further supporting this idea, in liver slices of MCTr-fed rats, ketosis was
depressed by administration of 4-pentenoic acid, a potent inhibitor of fatty acid oxidation. These
results support the hypothesis that ketosis induced by MCTr results from rapid oxidation of
medium chain fatty acids (Yeh & Zee 1975). Of note, ketonemia was considerably less severe in
genetically obese rats than in control normal-weight rats (Bach et al. 1977).
Because of its more complete hydrolysis and rapid absorption, MCTr have replaced long-
chain triglyceride in diets of patients with malabsorption syndrome. Also, cholesterol levels of
several mammalian species were lower after MCTr feedings when compared to LCFA rich diets
(Yeh & Zee 1975), but many of the children given MCTr diets complained of nausea, diarrhea, and
occasional vomiting (Vanitallie & Nufert 2003; Veech 2004).
The newest classes of ketogenic substrates are the ketone esters. The prototype consists of
two molecules of 3HB linked by esterification of the carboxyl functionality of one with the alcohol
functionality of the other. On ingestion, the ester is hydrolyzed by intestinal esterases thereby
directly releasing 3HB into the circulation and acutely raising blood 3HB levels.

21
1.6. Parkinson’s disease
Recently, ketone bodies have received a lot of attention for their apparently
neuroprotective role in neurodegenerative diseases, such as Parkinson’s disease (PD). PD is
characterized by a loss of dopaminergic neurons in the substantia nigra (SN), which can be up to
80% when clinical symptoms of the disease appear. Dopaminergic neurons’ numbers normally
decline with aging, but the rate of destruction is accelerated in patients with clinical Parkinsonism
(Veech 2004). Symptoms include bradykinesia, rigidity and tremor (Veech 2004). Non-motor
symptoms include depression, anxiety and cognitive impairment (Tadaiesky et al. 2008). This rapid
destruction of neurons is thought to result from continued free radical damage to dopaminergic
neurons, which are particularly sensitive to this toxicity given their high iron content. The disease
is manageable for some time with L-dopa administration, but as damage and death of
dopaminergic neurons continues, L-dopa therapy becomes either ineffective or limited by its
toxicity (Veech 2004).
Mitochondrial impairment in dopamine neurons could lead to increased dependence on
the glycolytic pathway for ATP production: reduced levels of high energy phosphates in SN and the
striatum in early and advanced PD were observed (Hattingen et al. 2009), and it was shown in a
MPTP mouse model of PD that energetic impairment is not due to diminishing of GLUT1 or MCT2
expression (Puchades et al. 2013). In this frame, mitochondrial dysfunction due to ROS damage
could result in impaired energetic metabolism, which in turn would contribute to PD development.
As we previously suggested, ketone bodies can fulfill the energy gap, offering an attractive
possibility for improving the quality of life of patients with these diseases, although its role may be
more than just an energetic one: reports show that primary cultures of mesencephalic
dopaminergic neurons exposed to MPP+ (a molecule that inhibits NADH dehydrogenase [complex
1] and causes oxygen free radical formation) can be protected from death by addition of 4 mM
3HB (Kashiwaya et al. 2000) and in a study using a rat PD model injected with 6-hydroxydopamine
(6-OHDA), a ketogenic diet protected dopaminergic neurons of the SN against neurotoxicity
(Cheng et al. 2009). Veech et al. suggest that 3HB probably acts by decreasing the source of
mitochondrial oxygen radical formation by oxidizing the co-enzyme Q couple while at the same
time reducing the redox potential of the NADP couple which, through glutathione, is the final
detoxification step for H2O2 (Veech et al. 2001).
1.7. Nuclear Magnetic Resonance (NMR)
NMR spectroscopy is a non-destructive, non-invasive technique that provides detailed
information on molecular structure, both for pure compounds and in complex mixtures as well as
information on absolute or relative concentrations (Beckmann et al. 1995; Lindon et al. 2007;

22
Zwingmann & Leibfritz 2003), making it a useful tool for in vivo studies. The most commonly used
atoms for NMR are 1H, 2H, 12C, 13C, 15N and 31P. NMR spectroscopy allows the detection of several
compounds present in the sample, allowing a very complete analysis in one single spectrum.
1.7.1. 13C NMR spectroscopy
The enrichment of molecules in 13C has many advantages. 13C natural abundance is very
low, of about 1.1%, allowing the possibility of tagging a specific carbon position by selective
enrichment with 13C (Beckmann et al. 1995; Lindon et al. 2007). 13C nucleus is a stable carbon
isotope and hence is not subject to the radiation hazards related to radioactive tracers (Beckmann
et al. 1995). To eliminate the splitting of the 13C-signal that occurs due to J-coupling with attached
hydrogens and to enhance the intensity of the resulting simplified 13C-resonance via the nuclear
Overhauser effect, continuous 1H decoupling is applied (Lindon et al. 2007). The chemical shifts of 13C within substrates and metabolites are dispersed over a wide range, so separate resonances for
numerous metabolites can be simultaneously detected, identified and quantified without need for
prior separation. Incorporation of labeling in specific carbons provides information about the fate
of that specific carbon, and allows simultaneous monitoring of carbon fluxes through converging
metabolic pathways, such as those that generate acetyl-coA for Krebs cycle utilization (Malloy et
al. 1990; Badar-Goffer et al. 1990; Beckmann et al. 1995; Zwingmann & Leibfritz 2003).
Labeling with 13C of two (or more) adjacent carbons results in homonuclear 13C-13C spin-
spin couplings, which can provide even more biochemical information. The spin coupling is
detected in the form of doublets (for two) or multiplets (for >2) adjacent carbons. This resonance
splitting is a well-defined parameter known as the coupling constant J for each isotopomer,
(Beckmann et al. 1995). Spin coupling gives information not only about which adjacent carbons are
labeled, but also the ratio of labeling between them. With this information, and choosing carefully
the labeling in the precursor molecules, it is possible to study substrate competition and
preference; competition and contribution of alternative pathways, and fluxes that involve cycling
of metabolites such as pyruvate (Beckmann et al. 1995),
13C NMR Isotopomer analysis is limited to intracellular metabolites that are present in
sufficient amounts to be detected, and typically include glutamate, glutamine, aspartate, alanine,
lactate, or glucose. For NMR isotopic analysis of Krebs cycle intermediates, whose concentrations
are typically too low for direct NMR observation, their more abundant amino-acid transamination
products are analyzed. For this, it is assumed that glutamate accurately reflects the labeling of α-
ketoglutarate, since the two metabolites are in a fast equilibrium via transamination. The same
assumption is made for lactate and alanine, which reflect the labeling of pyruvate, and aspartate,
which reflects the labeling of oxaloacetate (Beckmann et al. 1995; Carvalho et al. 1999).

23
1.7.2. 1H NMR spectroscopy
Almost all metabolites possess a chemically-bound hydrogen that can be detected by 1H
NMR. While having a smaller chemical shift dispersion than 13C NMR, signals from an array of
metabolites can nevertheless be resolved in the 1H NMR spectrum allowing a reasonably detailed
profile of tissue metabolites to be obtained. 1H NMR is also inherently more sensitive than 13C
NMR and can therefore detect lower levels of metabolites, including true Krebs cycle
intermediates such as succinate and other low-abundance metabolites such as pyruvate. 1H signal
areas relate directly to the number of protons giving rise to that signal, hence absolute metabolite
concentrations can be obtained from a 1H NMR spectrum by adding an internal standard of known
concentration whose resonance does not coincide with those of the sample metabolites (Lindon et
al. 2007).
The concept of resolving complex metabolite 13C-isotopomer distributions via spin-coupling
interactions using 13C NMR can also be extended to 1H NMR as a result of heteronuclear J
couplings between 13C and neighboring 1H nuclei (Beckmann et al. 1995). The 1H signal splitting
thus provides information about 13C-enrichment of nearby carbons (Lindon et al. 2007) and
determination of different metabolite 13C-isotopomer populations. This is illustrated in Fig.1.5 for
various isotopomers of lactate.
Fig.1.5 Different 13C isotopomers of lactate give distinct peaks in the 1H-NMR spectrum, with well-defined J-coupling constants.
Isotopomer information obtained by 1H NMR analysis can be integrated with that obtained
by 13C NMR thereby maximizing the information content from the experiment and allowing more
realistic and detailed descriptions of cellular and tissue metabolic fluxes to be obtained.

24
2. Aim of the
Project

25
Despite all the research regarding ketone bodies as therapeutic agents in the brain, and ketone
bodies formation from variations of the ketogenic diet, little information is known about the
energetic metabolism changes occurring due to ketone bodies’ presence, especially for dietary
supplements designed to generate ketone bodies in the presence of sufficient dietary
carbohydrate. As such, the main objectives of this study were:
i. Understand how ketone bodies compete with glucose and lactate/pyruvate for acetyl-coA
formation when none of the substrates is of limited supply and possible cell-type
compartmentation;
ii. Investigate if time-dependent changes occur during the experimental time-frame, that can
hint in the direction of substrate swap and/or other metabolic state changes;
iii. Explore the relationship between ketone body and glucose utilization in a pre-symptomatic
model of Parkinson’s disease.

26
3. Materials and
Methods
27
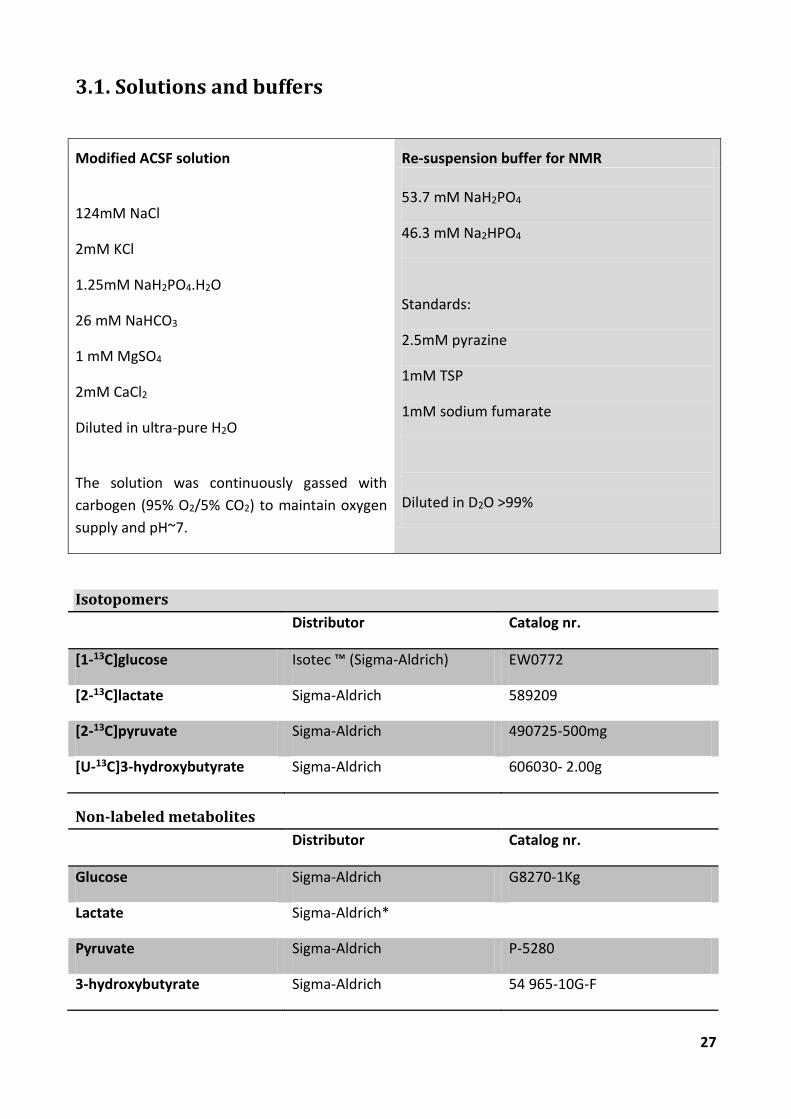
3.1. Solutions and buffers
Modified ACSF solution Re-suspension buffer for NMR
124mM NaCl
2mM KCl
1.25mM NaH2PO4.H2O
26 mM NaHCO3
1 mM MgSO4
2mM CaCl2
Diluted in ultra-pure H2O
The solution was continuously gassed with
carbogen (95% O2/5% CO2) to maintain oxygen
supply and pH~7.
53.7 mM NaH2PO4
46.3 mM Na2HPO4
Standards:
2.5mM pyrazine
1mM TSP
1mM sodium fumarate
Diluted in D2O >99%
Isotopomers
Distributor Catalog nr.
[1-13C]glucose Isotec ™ (Sigma-Aldrich) EW0772
[2-13C]lactate Sigma-Aldrich 589209
[2-13C]pyruvate Sigma-Aldrich 490725-500mg
[U-13C]3-hydroxybutyrate Sigma-Aldrich 606030- 2.00g
Non-labeled metabolites
Distributor Catalog nr.
Glucose Sigma-Aldrich G8270-1Kg
Lactate Sigma-Aldrich*
Pyruvate Sigma-Aldrich P-5280
3-hydroxybutyrate Sigma-Aldrich 54 965-10G-F

28
Chemicals and Reagents
Distributor Catalog nr.
3-(trimethylsilyl)propionic-
2,2,3,3,d4 acid sodium salt
(TSP)
Sigma-Aldrich 269913
4-aminopyridine (4-AP) Ascent Scientific Asc-122
6-hydroxydopamine hydrochloride (6-OHDA)
Sigma H4381
Calcium chloride (CaCl2) Fluka 21114
Carbogen gas Linde Sogás, Lda
Deutered water (D2O) CortecNet Lot No. MKBG8156V
Dissodium phosphate
Pentahydrated
(Na2HPO4.5H2O)
May&Baker
LTD Dangenham England
S312/18/67-1
Fumarate Sigma-Aldrich**
Magnesium sulfate (MgSO4) Fluka 63126
Monossodium phosphate
(NaH2PO4)
Merck 808 B 798170
Perchoric acid 70-72% Merck UN1873
Potassium chloride (KCl) Riedel-de-Haën 31248
Potassium hydroxide (KOH) Merck UN1813
Pyrazine Sigma-Aldrich**
Sodium bicarbonate (NaHCO3) Sigma-Aldrich S5761
Sodium chloride (NaCl) Fluka 71381
Sodium phosphate monobasic
monohydrate (NaH2PO4∙H2O)
Sigma-Aldrich S9638-500G
Sodium hydroxide (NaOH) Merck 1.06498.1000
*Kindly donated by Dr. Attila Köfalvi, Center for Neuroscience and Cell Biology of Coimbra (CNC),
Universidade de Coimbra
**Kindly donated by Dr. Rui A. de Carvalho, Departamento de Ciências da Vida, Universidade de
Coimbra

29
Others
Distributor
3mm NMR tubes Wilmad LabGlass/CortecNet
Superfusion chambers (67mm x 163mm x 118mm) Schlee GmbH & Co, Germany
Superfusion pump Gilson
Animals
Male Wistar rats (Charles River, Barcelona, Spain) were used throughout this study and
were handled according to the principles and procedures outlined as “3Rs” in the guidelines of
European Union guidelines (86/609/EEC), FELASA and ARRIVE, and were approved by the Animal
Welfare Committee of the Center for Neuroscience and Cell Biology of Coimbra. Animals were
housed in a controlled animal facility (temperature 22°C and 12:12-h light:dark cycle) and given
commercial food and water ad libitum.
3.2. Superfusion of hippocampus, cortex and striatum of WT
Wistar Rats
Male (wild-type) Wistar rats, 8-11 weeks old, were anesthetized with halothane, sacrificed
by decapitation and their brains excised and put in ice-cold artificial cerebral-spinal fluid (ACSF)
containing 5mM glucose during 1 minute. The structures of interest (hippocampus, striatum and
frontal cortex) were dissected and cut in 400µm slices with a McIlwain tissue chopper. For each
structure, the slices were divided into 2 chambers and left to recover under superfusion (Fig.3.1)
with re-circulating 700mL of ACSF 5 mM glucose continuously gassed with carbogen (pH7.4) at a
rate of 3mL/min, for 1hour at room temperature. After, the chambers were submerged in a water
bath at 35°C. For each structure, one chamber was superfused with re-circulating 300mL
containing glucose, sodium lactate and sodium pyruvate, and the other chamber was superfused
with the same volume of ACSF with the same substrates, plus sodium 3HB, to achieve metabolic
stability under the new substrate conditions. After 1 hour, the superfusion media were replaced
with identical concentrations of 13C-enriched substrates: [1-13C]glucose; [2-13C]lactate and [2-13C]pyruvate, all 99% enriched, and [U-13C]3HB, 50% enriched. In addition, this new solution of
labeled substrates also contained 50 µM of4-aminopyridine (4-AP) to induce basal neuronal
activity and achieve isotopic steady state within a 3 hour period, before tissue degradation starts
(Duarte et al. 2007). The superfusate was sampled every 30minutes and the samples kept in ice
(4ºC).
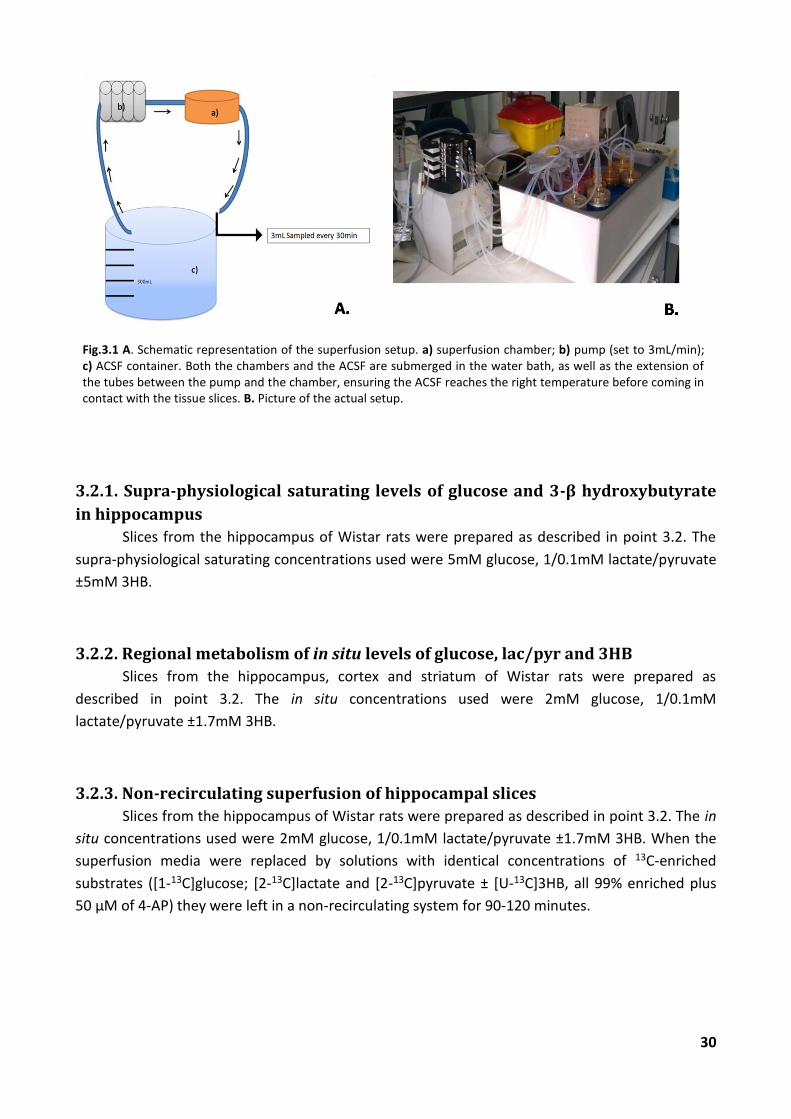
30
Fig.3.1 A. Schematic representation of the superfusion setup. a) superfusion chamber; b) pump (set to 3mL/min); c) ACSF container. Both the chambers and the ACSF are submerged in the water bath, as well as the extension of the tubes between the pump and the chamber, ensuring the ACSF reaches the right temperature before coming in contact with the tissue slices. B. Picture of the actual setup.
3.2.1. Supra-physiological saturating levels of glucose and 3-β hydroxybutyrate
in hippocampus
Slices from the hippocampus of Wistar rats were prepared as described in point 3.2. The
supra-physiological saturating concentrations used were 5mM glucose, 1/0.1mM lactate/pyruvate
±5mM 3HB.
3.2.2. Regional metabolism of in situ levels of glucose, lac/pyr and 3HB
Slices from the hippocampus, cortex and striatum of Wistar rats were prepared as
described in point 3.2. The in situ concentrations used were 2mM glucose, 1/0.1mM
lactate/pyruvate ±1.7mM 3HB.
3.2.3. Non-recirculating superfusion of hippocampal slices
Slices from the hippocampus of Wistar rats were prepared as described in point 3.2. The in
situ concentrations used were 2mM glucose, 1/0.1mM lactate/pyruvate ±1.7mM 3HB. When the
superfusion media were replaced by solutions with identical concentrations of 13C-enriched
substrates ([1-13C]glucose; [2-13C]lactate and [2-13C]pyruvate ± [U-13C]3HB, all 99% enriched plus
50 µM of 4-AP) they were left in a non-recirculating system for 90-120 minutes.
31
3.3. Regional metabolism of a 6-OHDA Rat Model of Parkinson’s
disease
Wistar rats of 12 weeks old, weighing ≥250g were anesthetized intraperitoneally (ip) with
75 mg/kg of ketamine (Bayer Healthcare) and 8mg/kg of xylazine (Rompun, Bayer Healthcare).
They were also injected with a solution of dezipramine (20mg/kg), an inhibitor of norepinephrine
transporters, assuring the selectivity of the 6-OHDA toxin for the dopamine transporters. Rats
were then placed in a stereotaxic frame. From Bregma deep to the skull surface (AP=+0.2,
ML=±3.5 and DV=-4.8), 10µg of 6-OHDA dissolved in sodium metabisulphite 0.1% were infused
bilaterally in each striatum at a rate of 1 µL/min. After the injection, the cannula was left in place
for 5minutes to avoid reflux of the toxin and afterwards it was removed slowly. Controls were
submitted to the same procedure and injected with saline solution.
After 21 days of surgical procedure, the superfusion protocol was performed. This model
has been reported as a pre-symptomatic stage of the disease, in which depressive and anxious
behavior, as well as a mild cognitive impairment are already observed (Tadaiesky et al. 2008).
Given the opportunity, we decided to test whether energetic metabolism changes also occurred.
For the pilot studies in the 6-OHDA animal model of Parkinson’s disease, superfusion of
hippocampus, cortex and striatum was performed. Tissue preparation and recovery period were
as described in point 3.2. The slices were presented with unlabeled metabolites for 1hour to
adjust to the new substrates available, as already described above, and afterwards the solutions
were switched for ones with similar concentrations but labeled substrates.
i) Pilot study 1 - Provision of 5 mM [U-13C]glucose and 1/0.1 mM sodium
[3-13C]lactate/unlabeled pyruvate
ii) Pilot study 2 - Provision of 5 mM [U-13C]glucose, 1/0.1 mM sodium [3-13C]lactate/unlabeled pyruvate and unlabeled 3HB
3.4. Metabolite extraction Metabolites were extracted using the perchloric acid (PCA) method. Ice-cold PCA 7.0-7.2%
was added to the samples (~300 µL per hippocampus and striatum, ~500µL per cortex) and left at
~4ºC for 30 minutes. Samples were centrifuged for 15min at 16 000g, 10ºC (Sigma 3-18K
centrifuge) and the protein in pellet stored at -80ºC for protein quantification. The supernatant
was removed to a new vial and the pH was neutralized with KOH on ice-cold conditions; the
precipitated salt was removed by centrifugation and the samples lyophilized.

32
3.5. Protein Quantification The protein pellet was thawed and added to 5mL NaOH 0.5M and left to dissolve
overnight. Protein was quantified by the bicinchoninic acid (BCA) method. Briefly, a calibration
curve was built for each experimental set, with BSA (Bovine Serum Albumine) as protein standard
(2, 1, 0.5, 0.25, 0.125, 0.0625 mg/mL) and r2 value no less than 0.98 was used. To each well of a 96
multiwell-plate were added: 25µL H2O, 25µL sample/calibration curve standard and 200µL of BCA
reagent. The plate was protected from light and incubated at 37ºC for 60min. Absorbance values
were measured at 562nm in a SpectraMax plus 384 spectrophotometer using SoftMaxPro5.2
software.
3.6. NMR sample preparation Samples for NMR spectra analysis were dissolved in 250µL of phosphate buffer
(NaH2PO4/Na2HPO4) made in D2O, pD 7.0±0.2 containing TSP, fumarate and pyrazine as proton
standards. Buffer added to each sample were normalized to mass. All samples, including the
samples from the superfusate, were centrifuged for 10min, 13 500rcf, 10ºC (eppendorf centrifuge
5418R) to remove excess of salt. The supernatant (~200µL) was transferred to 3mm NMR tubes.
3.7. NMR spectra acquisition Spectra (proton and 1H-decoupled 13C NMR) were obtained using an Agilent 600 MHz
system with 3mm broadband probe. For 13C spectrum, a 60-degree pulse, 30 kHz spectral width,
2.5 seconds acquisition time and 0.5 second pulse delay were used.
Quantitative 1H spectra were acquired at 25°C with a 90° pulse and a 60 second acquisition
time, as pyrazine T1 was measured at 11.6±0.4sec. Typically 4-16 free induction decays were
collected per sample.
3.8. NMR spectra analysis All the acquired spectra were processed using the NUTSTM software (Acorn NMR, Fremont,
CA, USA). Free induction decays were baseline corrected and line broadening applied (0.5 Hz for 1H and 1.0 Hz for 13C) prior to Fourier transformation. For proton, chemical shifts were referenced
to TSP at 0.0 ppm (Cerdan et al. 1990) and quantified relative to pyrazine (8.60 ppm) and fumarate
(6.52ppm). 13C chemical shifts were referenced to the C1 β-glucose peak at 96.9ppm.

33
The contribution to acetyl-coA entering the Krebs cycle from each labeled of the four possible acetyl-coA 13C-isotopomers (designated as Fc0, Fc1, Fc2 and Fc3) was calculated using the nonsteady-state 13C NMR isotopomer analysis from the glutamate carbon 4 and 5 multiplet ratios and the ratio of glutamate carbon 4 to carbon 3 enrichment (13C4/13C3) (Fig.3.2) according to equations 1 to 4 (Malloy et al. 1990). Each multiplet area was assigned as a fraction of the total area of that specific carbon resonance. The glutamate 13C4/13C3 ratio was corrected for partial saturation and nOe effects.
Glutamate enrichment was assumed to reflect the neuronal metabolic profile. Previous studies have shown that glial glutamate contributions are bellow the detection threshold of NMR (Chassain et al. 2005).
Fig.3.2 Peak assignment of the multiplets in the 13C spectra, in the regions corresponding to glutamate carbon 4 and 5.
(eq1)
(eq2)
(eq3)
(eq4) )123(10
3443
344342
3551
FcFcFcFc
CCQCFc
DCCCFc
FcDCSCFc
33
The contribution to acetyl-coA entering the Krebs cycle from each labeled of the four
possible acetyl-coA 13C-isotopomers (designated as Fc0, Fc1, Fc2 and Fc3) was calculated using the
nonsteady-state 13C NMR isotopomer analysis from the glutamate carbon 4 and 5 multiplet ratios
and the ratio of glutamate carbon 4 to carbon 3 enrichment (13C4/13C3) (Fig.3.2) according to
equations 1 to 4 (Malloy et al. 1990). Each multiplet area was assigned as a fraction of the total
area of that specific carbon resonance. The glutamate 13C4/13C3 ratio was corrected for partial
saturation and nOe effects.
Glutamate enrichment was assumed to reflect the neuronal metabolic profile. Previous
studies have shown that glial glutamate contributions are bellow the detection threshold of NMR
(Chassain et al. 2005).
Fig.3.2 Peak assignment of the multiplets in the 13C spectra, in the regions corresponding to glutamate carbon 4 and 5.
(eq1)
(eq2)
(eq3)
(eq4) )123(10
3443
344342
3551
FcFcFcFc
CCQCFc
DCCCFc
FcDCSCFc

34
3.8.1. Experiments using [2-13C]lactate/pyruvate, [1-13C]glucose, [U-13C]3HB
The fractional contribution to acetyl-coA of each labeled substrate was assigned as [2-13C]lactate/pyruvate (Fc1), [1-13C]glucose (Fc2), [U-13C]3HB (Fc3), and unlabeled endogenous
substrates (Fc0) (Fig.3.3). Both glucose and unlabeled substrate concentration calculations are
corrected for the 1:1 factor of [labeled lactate]:[unlabeled lactate] that comes from the
breakdown of one molecule of [1-13C]glucose through the glycolytic pathway. 3HB is also
corrected for the 50% fractional enrichment used.
Fig.3.3 Expected labeling pattern in glutamate pool when using [2-13C]lactate/pyruvate (Fc1), [1-13C]glucose (Fc2) and [U-13C]3HB (Fc3) as precursors. Glutamate pool labeling is assumed to reflect the labeling in α-ketoglutarate and. Unlabeled and endogenous substrates are calculated as Fc0.
3.8.2. Experiments using, [U-13C]glucose, [3-13C]lactate and unlabeled pyruvate
The fractional contribution to acetyl-coA of each labeled substrate was assigned as [U-13C]glucose (Fc3), [3-13C]lactate (Fc2), and unlabeled pyruvate/endogenous substrates (Fc0)
(Fig.3.4).The contribution of lactate is slightly underestimated, as contributions from the
equilibrium with pyruvate may form some unlabeled lactate. This contribution, although
significative, does not compromise any possible discoveries that would come from this pilot study.

35
3.8.3. Experiments using, [U-13C]glucose, [3-13C]lactate and unlabeled pyruvate
and 3HB
The fractional contribution to acetyl-coA of each labeled substrate was assigned the same
as in the previous pilot study (3.8.2): [U-13C]glucose (Fc3), [3-13C]lactate (Fc2). Unlabeled 3HB was
assigned as Fc0, along with pyruvate and endogenous substrates (Fc0). Like in the previous pilot
study, lactate contribution may be underestimated due to contributions from the pyruvate pool.
Contribution of 3HB may not be accurately quantified, but big contributions in the unlabeled pool
are assigned to this substrate.
Fig.3.4 Expected labeling pattern in glutamate pool when using [U-13C]glucose (Fc3) and [3-13C]lactate (Fc2) as precursors. Glutamate pool labeling is assumed to reflect the labeling in α-ketoglutarate and, consequentially, the labeling throughout the cycle may be deduced. Unlabeled and endogenous substrates are calculated as Fc0.

36
3.8.4. Glutamate 13C Natural Abundance Correction
Natural abundance for 13C was measured for glutamate and included in isotopomer
analysis as correction factor. A fresh solution of 20mM glutamate in D2O phosphate buffer
(NaH2PO4/Na2HPO4) pD 7.0 ± 0.1was made, and the 13C spectrum acquired overnight. The
following correction ratios were obtained:
C4/C3 C5/C4
0.912992 0.2125
3.9. Statistical analysis The Welch unpaired t-test was used to test for statistical significance in substrate utilization
profiles between groups assuming unequal variance.
37
4. Results and
Discussion
38
4.1. Substrate contributions reported by glutamate 13C-
isotopomer analysis
As described in the previous section, 13C glutamate isotopomer analysis can be used to
evaluate different substrate contributions to the acetyl-coA pool (Fig.3.2, page 33), as it exists in
high concentrations in most tissues and is in rapid exchange with Krebs cycle α-ketoglutarate
(Carvalho et al. 1999). The non-steady state analysis allows this information to be obtained even if
the13C-metabolite enrichment has not reached isotopomeric steady state (Malloy et al. 1990).
Fig.4.1 Typical carbon spectra of the extracts of hippocampal slices. Signal assignment was as follows: a) GABA C3; b) glutamate C3; c) glutamate C4; d) GABA C2; e) glutamate C1; f) glutamate C5
4.1.1. Supra-physiological saturating levels of glucose and 3-β hydroxybutyrate
in hippocampus: 5mM glucose, 1/0.1mM lactate/pyruvate ±5mM3HB
At concentrations of 5mM glucose, 1/0.1mM lactate/pyruvate and 5mM 3-hydroxybutyrate
(3HB), both the glucose transporters and monocarboxylate transporters are fully saturated, thus
we can assess these substrates contributions to acetyl-coA under conditions of maximal cellular
substrate uptake. One important rationale behind using such high concentrations (2-3 fold above
their maximal cerebral concentrations) is due to the fact that the superfusion medium is typically
recirculated and significant depletion of substrates could occur over the 3 hour duration period of
these experiments if they were presented at lower physiological levels. As was evaluated by 1H
NMR, at the end of the superfusion period the concentrations of all substrates remained well
above saturating values (see Fig.4.19b, page 63).

39
Fractional contribution of substrates to acetyl-coA pool at saturating conditions in hippocampal slices
-3 H B + 3 H B
0
5 0
1 0 0
G lu c o s e
3 H B
L a c ta te /P y ru v a te
E n d o g e n o u s u n la b e le d s o u rc e s
Fra
cti
on
of
ac
ety
l-c
oA
(%
)
Fig.4.2 Fractional contribution of substrates to acetyl-coA pool entering the Krebs cycle in the absence (-3HB) and presence (+3HB) of 3-hydroxybutyrate, in rat hippocampus slices. Exogenous glucose*** is presented in green, lactate/pyruvate in blue, 3HB in pink and unlabeled endogenous sources in light grey*. Values are presented as means ±SEM of the results obtained from 6 independent experiments. *p<0.05, *** p<0.0001 (presence vs absence of 3HB), unpaired t-test with Welch correction.
When the slices were presented with 5mM [1-13C]glucose and 1/0.1mM [2-13C]lactate/pyruvate, contributions to acetyl-CoA were 70±7% and 10±2%, respectively, with
20±8% from unlabeled endogenous sources (Fig.4.2, left). In the presence of 5mM [U-13C]3HB,
glucose contributions significantly fell (21±3%), lactate/pyruvate contributions were unchanged
(10±1%) and endogenous contributions fell (1±3%), while [U-13C]3HB became the major acetyl-coA
contributor (68±3%) (Fig.4.2, right). These values are in agreement with recently reported
contributions measured in vivo by 13C NMR (Chowdhury et al. 2014).
These results indicate that when neither glucose nor 3HB were in limited supply, the
hippocampal slices showed a clear preference for the ketone body as a source of acetyl-coA
generation. While acetyl-coA flux from glucose was highly attenuated, contributions from
exogenous lactate/pyruvate were not affected. This suggests that 3HB did not attenuate Krebs
cycle glucose utilization by inhibition of pyruvate dehydrogenase (PDH), since PDH inhibition
would also affect lactate/pyruvate contributions. This is also consistent with our observation of
reduced output of glycolytic lactate (i.e. [3-13C]lactate derived from [1-13C]glucose) into the
superfusion medium when 3HB was present (Fig.4.20d page 64; Fig.4.26b page 70). This metabolic
alteration was also found previous studies of ketone body metabolism (Yudkoff et al. 2005;
LaManna et al. 2009; Jiang et al. 2011).
***
*

40
The rate of 3HB (k) utilization relative to lactate/pyruvate (L) can be calculated from the
glutamate carbon 5 (C5) doublet-to-singlet ratio (Fig.4.3, k/L). Our data shows that 3HB
contribution to glutamate C5 enrichment was 7-fold higher than that of lactate/pyruvate.
Following the same logic, 3HB (k) rate of utilization relative to glucose (G) can also be calculated
analyzing the relative contributions to glutamate carbon 4 (Fig.4.3, k/G). 3HB contributed 3 times
more to glutamate enrichment in comparison to glucose.
Fig.4.3 Relationship between glutamate carbon 4 and 5 13C isotopomers derived from different substrates: [2-13C]lactate/pyruvate (L), [1-13C]glucose (G) and [U-13C]3HB (k). The letters above each 13C signal component indicate the contributing 13C-enriched substrate. k/L indicates the rate of 3HB utilization relative to lactate, k/G indicate the ratio of 3HB utilization relative to glucose. These ratios are adjusted for different enrichments of the precursor 13C enriched substrates. Values are presented as mean±SEM for 6 individual experimental procedures.
The GABA 13C-multiplet intensities were much lower than those of glutamate (Fig.4.1;
Fig.4.4) due to a lower amount of GABA compared to glutamate, as seen by 1H NMR (data not
shown). This meant that some of the low-abundance GABA isotopomer signals, notably C2Q and
C2D23 could not be reliably quantified for application of the nonsteady-state analysis to GABA as
previously described (Duarte et al. 2007). Because of this, the k/G ratio was quantified from the
ratio of the GABA C2D12 to C2S components on the basis that C2S is solely derived from [1-13C]glucose while C2D12 can only originate from [U-13C]3HB. We tested this method on glutamate
by calculating k/G ratios from the analogous glutamate C4S and C4D45 signals, and compared with
k/G ratios derived from the glutamate nonsteady state isotopomer analysis. The two methods
yielded equivalent k/G ratios for glutamatergic neurons (2.9±0.3 using all isotopomers of 3HB vs
2.7±0.2 using only the C4D45). Using this approach, we found that the GABA k/G ratio was
significantly lower than that of glutamate (mean±SEM 1.1±0.12 vs 2.7±0.2, *p < 0.0005) (Fig.4.4).
These results indicate that for hippocampus slices, GABAergic neurons oxidized a lower fraction of
ketone bodies relative to glucose in comparison to glutamatergic neurons.

41
Fig.4.4 Relationship between glutamate carbon 4 and GABA carbon 213C isotopomers derived from[1-13C]glucose (G) and [U-13C]3HB (k).The letters above each 13C signal component indicate the contributing 13C-enriched substrate.k/G indicate the ratio of 3HB utilization relative do glucose, that is clearly higher in glutamate relative to GABA (*p<0.0005). These ratios are adjusted for different enrichments of the percursor13C enriched substrates. Values are presented as mean±SEM for 6 individual experimental procedures.
In contrast to studies using in situ brain tissue provided with 13C-substrates where in
addition to glutamate and GABA, glutamine signals were also prominent (Kunnecke et al. 1993;
Bouzier et al. 2000; Chowdhury et al. 2014), tissue glutamine 13C-signals were generally absent in
our brain slice preparations. There was no indication of glutamine washout into the superfusate.
Duarte and colleagues have also reported a depletion of glutamine in superfused slices of
hippocampus (Duarte et al. 2007), suggesting this might be related to the methodology used.
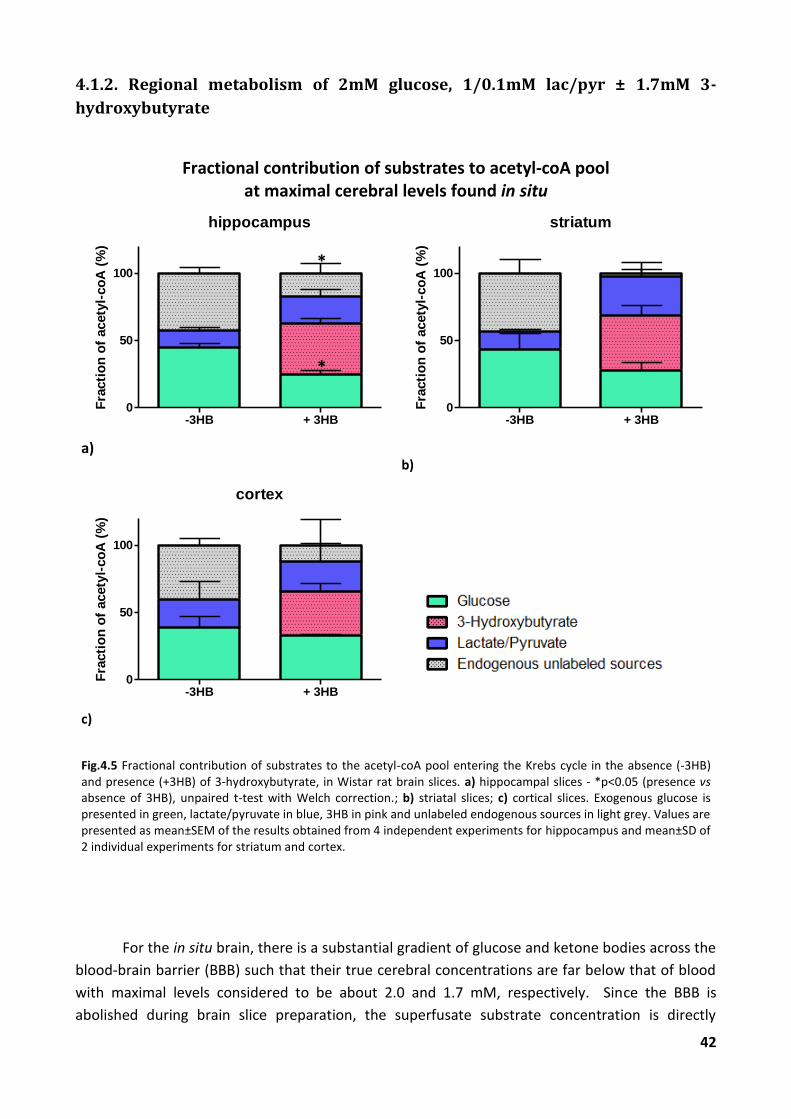
42
4.1.2. Regional metabolism of 2mM glucose, 1/0.1mM lac/pyr ± 1.7mM 3-
hydroxybutyrate
Fractional contribution of substrates to acetyl-coA pool at maximal cerebral levels found in situ
hippocampus
-3HB + 3HB0
50
100
Fra
cti
on
of
acety
l-co
A (
%)
a)
striatum
-3HB + 3HB0
50
100
Fra
cti
on
of
acety
l-co
A (
%)
b)
cortex
-3HB + 3HB0
50
100
Fra
cti
on
of
acety
l-co
A (
%)
c)
Fig.4.5 Fractional contribution of substrates to the acetyl-coA pool entering the Krebs cycle in the absence (-3HB) and presence (+3HB) of 3-hydroxybutyrate, in Wistar rat brain slices. a) hippocampal slices - *p<0.05 (presence vs absence of 3HB), unpaired t-test with Welch correction.; b) striatal slices; c) cortical slices. Exogenous glucose is presented in green, lactate/pyruvate in blue, 3HB in pink and unlabeled endogenous sources in light grey. Values are presented as mean±SEM of the results obtained from 4 independent experiments for hippocampus and mean±SD of 2 individual experiments for striatum and cortex.
For the in situ brain, there is a substantial gradient of glucose and ketone bodies across the
blood-brain barrier (BBB) such that their true cerebral concentrations are far below that of blood
with maximal levels considered to be about 2.0 and 1.7 mM, respectively. Since the BBB is
abolished during brain slice preparation, the superfusate substrate concentration is directly
*
*

43
experienced by cerebral tissues in this setting. To recreate realistic cerebral glucose and ketone
body concentrations, slices were perfused with 2.0 mM glucose, 1.0/0.1 mM lactate/pyruvate ±
1.7 mM 3HB. Under these conditions, contributions of glucose and lactate/pyruvate to acetyl-coA
in hippocampus were (mean±SEM) 45±4% and 13±2%, respectively, with 43±4% from unlabeled
endogenous sources. In the presence of 1.7mM [U-13C]3HB, glucose contributions fell significantly
(25±3%, *p<0.0053), lactate/pyruvate contributions were not significantly altered (20±5%),
endogenous contributions significantly decreased to 18±7% (*p<0.027), while [U-13C]3HB became
the major acetyl-coA source (38±4%) Fig.4.5a.
In the striatum (Fig.4.5b), contributions of glucose in the absence and presence of 3HB
were (mean±SD) 44±12% and 28±6%, respectively. Lactate/pyruvate contributions went from
13±2% (without 3HB) to 29±5% in the presence of 3HB. Endogenous contributions had a major
decrease from 43±10% (without 3HB) to 3±8% in the presence of the ketone body. 3HB became
the biggest contributor, accounting for 41±7% of the pool.
Surprisingly, in cortex slices (Fig.4.5c), glucose contributions did not seem to vary much
when in the absence or presence of 3HB (mean±SD: 39±8 vs 33±0.6%, respectively).
Lactate/pyruvate contributions also did not vary, contributing 21±13% in the absence and 22±13%
in the presence of the ketone body. 3HB contributed 32±6% for the cortical acetyl-coA pool.
Endogenous contributions follow the trend of the other structures, with 40±5% in the absence and
12±19% in the presence of 3HB.
Under these saturating physiological conditions in hippocampus slices, glucose
contributions decreased in the presence of 3HB, with 3HB becoming an important but not a
dominant source of acetyl-coA as was observed with supra-physiological substrate levels (5mM
glucose ± 5mM 3HB). The striatum also seemed to follow this trend. However, 3HB oxidation and
its displacement of glucose utilization was less pronounced in cortical slices, possibly due to
different energetic requirements from different neuronal/astrocytic populations.
Although we failed to obtain statistical significant data for this test due to the small
number of replicates, some tentative conclusions were reached. In the presence of the ketone
body 3-hydroxybutyrate, lactate/pyruvate contributions seemed to increase in hippocampus and
striatum. This could be due to the fact that these substrates are transported into the cells by a
common set of transporters (MCT). The higher availability of substrates could have induced an
upregulation of MCT expression, thus increasing the uptake of all the monocarboxylates available
in the medium. This may have been feasible within the 4-hour incubation with lactate/pyruvate
and ketone body, as significant increases (>50%) in MCT1 and MTC4 expression in rat muscle were
observed after only 2hours of exercise (Coles et al. 2004). The fact that no apparent stimulation of
lactate/pyruvate utilization was observed with supra-physiological levels could be due to a much
higher availability of the ketone body (5mM) versus lactate/pyruvate (~1mM) resulting in more
effective competition of ketone bodies for the transporters.
Another consistent observation regardless of the brain region was an unexpectedly high
contribution of unlabeled endogenous substrates (accounting for over 40% of acetyl-coA) in slices

44
supplied with glucose and lactate/pyruvate, whereas in the presence of 3HB, endogenous
contributions were only residual. It is known that brain glycogen storages exist (Lapidots & Gopher
1994; Choi et al. 2003; Gruetter 2003; Pierre & Pellerin 2005) mainly in glia, as there is evidence
that glycogen is toxic to neurons (Pierre & Pellerin 2005). This reservoir is able to maintain
function for 2hours of mild hypoglycemia (Choi et al. 2003), so one possible explanation would be
that this stored glycogen was mobilized to compensate for the decreased glucose availability.
Whether this could sustain a significant contribution to cerebral energy generation over a 4 hour
period (1hour of adaptation period + 3hours of recirculated labeled compounds) is questionable
based on typical brain glycogen concentrations. Alternatively, these data may simply represent
outliers, and a that more realistic estimate of endogenous contributions would arise with more
replicate measurements.
Ratios of 3HB relative to lactate utilization (k/L) and 3HB relative to glucose utilization (k/G)
(see Fig.4.3) also show increased ketone body utilization relative to the other substrates (Table 4-
1).
Table 4-1 k/L ratio indicates the rate of 3HB utilization (k) relative to lactate (L) and k/G represents 3HB (k) rate of utilization relative to glucose (G) evaluated by all 13C isotopomers derived from different substrates, as represented in Fig.4.3 (page 40). Values are presented as mean±SD for 2 individual experimental procedures.
Cortex Hippocampus Striatum k/L 3.4±1.5 3.2±1.6 2.9±1 k/G 2.2±0.7 2.7±0.9 2.8±0.9
In the same fashion, when using only the C4D45/S of glutamate for k/G values, we get a
good agreement to the values when using all multiplets (Table 4-2), allowing for a comparison of
ketone bodies vs glucose contribution to glutamate and GABA pools. As was observed before,
although the GABA pool has a significant contribution from 3HB (with striatum a possible
exception), its utilization relative to glucose (k/G) is lower compared to that reported by glutamate
(Table 4-2).
Table 4-2 k/G represents ketone bodies (k) rate of utilization relative to glucose (G) evaluated by C4D45/C4S for glutamate and C2D12/C2S for GABA, as represented in Fig.4.4 (page 41). Values are presented as mean±SD for 2 individual experimental procedures.
Cortex Hippocampus Striatum Glutamate k/G 2.4±0.8 2.6±0.9 2.8±1.2 GABA k/G 1.1±0.5 1.0±0.7 0.9±0.2

45
4.1.3. Regional metabolism of a 6-OHDA rat model of Parkinson’s disease
Given that we had access to a 6-OHDA Parkinson’s disease (PD) rat model in our lab, we
decided to test if there were changes in cerebral substrate selection in this pre-symptomatic
model (Tadaiesky et al. 2008), since previous studies have hinted at such modifications in other
models (Chassain et al. 2005). First, we tested competition between glucose and lactate, and later
included 3HB as a substrate. Due to the limited number of superfusion chambers available, these
two experiments were conducted separately.
i) Pilot study 1 – [U-13C]glucose (5mM) vs [3-13C]lactate (1mM)
Fractional contribution of substrates to acetyl-coA in a 6-OHDA Parkinson’s disease model – pilot 1
h ip o c a m p u s
s a lin e t r e a te d
0
5 0
1 0 0
Fra
cti
on
of
ac
ety
l-c
oA
(%
)
a)
s tr ia tu m
S a lin e T r e a te d
0
5 0
1 0 0
Fra
cti
on
of
ac
ety
l-c
oA
(%
)
b)
c o r te x
S a lin e t r e a te d
0
5 0
1 0 0
Fra
cti
on
of
ac
ety
l-c
oA
(%
)
c)
Fig.4.6 Fractional contribution of substrates to acetyl-coA pool entering the Krebs cycle in Wistar rat brain slices from animals that were injected with saline or 6-OHDA (treated). a) hippocampal slices; b) striatal slices; c) cortical slices. Exogenous glucose is presented in green, lactate in blue and unlabeled sources in light grey. Values are presented for a single experimental procedure.

46
In the presence of both glucose and lactate, there was no major difference in substrate
selection when comparing slices from different structures or for slices obtained from saline vs
treated animals, with glucose being the main contributor of acetyl-coA in glutamatergic neurons
(Fig.4.6). In hippocampus, glucose and lactate contributions were 58% and 35% for saline,
respectively, and 53% and 20% for treated. Endogenous contributions were 7% in control animals
versus 27% for treated (Fig.4.6a). For striatum, glucose contribution was 52% in saline, with no
change in the treated (56%). Lactate contributed 31% for saline and 21% for treated. Endogenous
contributions were of 17% for saline injected animals, and 23% for the 6-OHDA treated (Fig.4.6b).
In cortex, glucose and lactate contributed 56% and 13% for rats injected with saline, respectively,
versus 54% and 20% in the ones injected with 6-OHDA. Endogenous substrates fill the remaining
percentual gap, with 31% for saline and 25% for treated (Fig.4.6c). This sizable endogenous
contribution in this experiment is at least partially accounted for by the 0.1 mM unlabeled
pyruvate.
When slices were presented with glucose and lactate, while they preferred glucose for
oxidation, exogenous lactate was also effectively utilized, in accordance with the literature
(Bergersen et al. 2001; Pierre & Pellerin 2005; Bouzier-Sore et al. 2002; Dienel 2012; Pellerin
2010). In this pre-symptomatic 6-OHDA model of PD, our very preliminary data suggests no
changes in relative utilization of these substrates.
ii) Pilot study 2 – [U-13C]glucose (5mM) vs [3-13C]lactate (1mM) vs
unlabeled 3HB (5mM)
In this study, we supplemented the superfusing medium with 5mM of unlabeled 3HB. The
rationale behind this was that a drop in either glucose or lactate contributions, accompanied by an
increase in the contribution of unlabeled would indicate significant competition from 3HB for
acetyl-coA production.

47
In the presence of unlabeled 3HB, no significant changes in substrate contribution to
glutamatergic acetyl-coA generation were observed between saline-injected and 6-OHDA injected
animals. In hippocampus, glucose and lactate contributed 23% and 9% for saline, respectively,
versus (mean±SD) 23±3% and 9±4% for 6-OHDA treated animals. Unlabeled sources contributed
68% in saline and 68±8% in treated (Fig.4.7a). For striatum, glucose and lactate had contributions
of 24% and 14% for saline, and 20±5% and 9±1% for treated. Unlabeled sources contributed 62%
for saline and 71±4% for treated (Fig.4.7b). In cortex, glucose contributed 19±3% and 17±1% in
saline-injected and treated, respectively. Lactate contributed 8±1% in saline and 9±0.1% in
treated, while unlabeled sources contributed 73±2% in saline and 74±1% in treated animals
(Fig.4.7c).
Fractional contribution of substrates to acetyl-coA in a 6-OHDA Parkinson’s disease model – pilot 2
h ip p o c a m p u s
S a lin e T r e a te d
0
5 0
1 0 0
Fra
cti
on
of
ac
ety
l-c
oA
(%
)
a)
s tr ia tu m
S a lin e T r e a te d
0
5 0
1 0 0
Fra
cti
on
of
ac
ety
l-c
oA
(%
)
b)
c o r te x
S a lin e T r e a te d
0
5 0
1 0 0
Fra
cti
on
of
ac
ety
l-c
oA
(%
)
c)
Fig.4.7 Fractional contribution of substrates to acetyl-coA pool entering the Krebs cycle in Wistar rat brain slices that were injected with saline or 6-OHDA. a) hippocampal slices; b) striatal slices; c) cortical slices. Exogenous glucose is presented in green, lactate in blue and unlabeled sources (endogenous, pyruvate and 3HB) in grey with pink dots. Values are presented as mean±SD for 2 independent experiments for cortex (both saline and treated), treated striatum and treated hippocampus and for 1 experiment for saline striatum and saline hippocampus.

48
There were no significant changes in substrate preference between saline and 6-OHDA
injected animals, for either of the pilot experiments. Comparing both experiments, in the presence
of 3HB the glucose contributions seem to decrease, with 3HB becoming the major contributor, as
happened in the previous experiments using WT animals. However, and contradicting the WT
results, lactate contributions seem to decrease when in the presence of 3HB. One possible
explanation could be that in the WT experiments, lactate was supplemented in a 1:10 ratio with
pyruvate of similar labeling, due to the close isotopic equilibrium between these two molecules. In
the 6-OHDA animals experiments, [3-13C]lactate was supplemented in a 1:10 ratio with unlabeled
pyruvate, since no [3-13C]pyruvate was available at the time. Another possibility could be an
impaired metabolism of this pathway due to the lesion suffered from the injection.
The rate of glucose (G) utilization relative to lactate (L) contributions to glutamate and
GABA can be calculated similarly to what was done before (see Fig.4.4, page 41). Since in this
experiment [U-13C]glucose and [3-13C]lactate were used, relative contributions of each substrate
were corrected for the isotopomers generated (Fig.4.8). While the GABA signals were lower than
that of glutamate, we were still able to quantify all multiplets from contributing isotopomers
(Table 4-3; Table 4-4).
Fig.4.8 Relationship between glutamate carbon 4 and GABA carbon 2 13C isotopomers derived from [U-13C]glucose (G) and [3-13C]lactate (L).The letters above each 13C signal component indicate the contributing 13C-enriched substrate.

49
Table 4-3 Ratio of glucose utilization relative to lactate (G/L) in glutamate and GABA pools for the three brain structures analyzed in pilot study 1. These ratios are adjusted for different enrichments of the precursor 13C enriched substrates. Values are presented for a single experimental procedure.
Pilot 1 Cortex Hippocampus Striatum
Glutamate GABA Glutamate GABA Glutamate GABA
Saline 3.63 2.46 2.02 2.19 1.95 2.36 Treated 2.62 2.87 2.4 2.4 2.61 2.06
Table 4-4 Ratio of glucose utilization relative to lactate (G/L) in glutamate and GABA pools for the three brain structures analyzed in pilot study 2. These ratios are adjusted for different enrichments of the precursors 13C enriched substrates. Values are presented as mean±SD for 2 individual experimental procedures for cortex (both saline and treated), treated striatum and treated hippocampus. Saline striatum and saline hippocampus values are presented for a single experimental procedure.
Pilot 2 Cortex Hippocampus Striatum
Glutamate GABA Glutamate GABA Glutamate GABA
Saline 2.8±0.6 3.1±1.1 2.51 2.11 1.7 1.49 Treated 2.6±0.5 2.8±0.6 3.4±0.6 2.6±1.3 2.6±1.3 2.4±0.8
According to the data from the tables 4-3 and 4-4, for slices from a given brain structure,
glucose was preferred over lactate for both glutamate and GABA formation, either in the presence
or absence of 3HB. G/L values obtained from glutamate and GABA analyses were similar to each
other, suggesting equal preference of substrates, and were also similar between saline and 6-
OHDA injected animals, suggesting no changes at this level for this particular model of PD.
4.1.4. C4/C3 glutamate ratios
Table 4-5 Glutamate C4/C3 ratio of WT Wistar rats different brain structures superfused with different concentrations of substrates.
5mM glucose, 1/0.1mM lac/pyr ± 5mM 3HB recirculating conditions
2mM glucose, 1/0.1mM lac/pyr, ± 1.7mM 3HB recirculating conditions
2mM glucose, 1/0.1mM lac/pyr, ± 1.7mM 3HB non - recirculating conditions
hippocampus (mean ± SEM) (n=6)
cortex (mean±SD) (n=2)
striatum (mean±SD) (n=2)
hippocampus (mean±SD) (n=2)
hippocampus (mean±SD) (n=2)
-3HB 2.2 ± 0.2 1.6±0.5 1.7±0.1 1.7±0.4 2.5±0.02 +3HB 2 ± 0.1 1.8±0.03 2±0.1 1.8±0.04 2.7±0.2

50
Table 4-7 Glutamate C4/C3 ratio of tissue extracts from Wistar rats injected with saline/6-OHDA and superfused with glucose, lactate, pyruvate and 3HB (Pilot 2). Values are presented as one individual experiment (n=1) or mean±SD for 2 individual experiments (n=2).
hippocampus (n=1)s; (n=2)t
striatum (n=1)s; (n=2)t
cortex (n=2)
Saline 1.3 1.3 1.4±0.05 Treated 1.3±0.02 1.3±0.17 1.7±0.3
The glutamate C4/C3 ratio is sensitive to both the extent of isotopic enrichment of Krebs
cycle intermediates - converging to a minimum value at isotopic steady-state - as well as
anaplerotic flux. The effects of anaplerosis on the C4/C3 ratio depend on the extent to which the
anaplerotic substrate is labeled. To the extent that the anaplerotic substrate is unlabeled, the
glutamate C4/C3 ratio is increased by anaplerotic activity. Previous experiments have shown that
in the presence of 50µM 4-AP, a C4/C3 ratio of 1.4 was achieved after 3hours (Duarte et al. 2007).
However, the C4/C3 ratios derived from our experiments were consistently above this value (Table
4-5, Table 4-6 and Table 4-7). There are several reasons for this. Perhaps the most likely is that
isotopic steady state was not achieved. The ex-vivo nature of the experiment means that the
basal functioning of neuronal transmission no longer occurs on its own, resulting in a slower
turnover of the cycle since very little neurotransmitters need to be produced. This is the reason
why we supply the medium with 4-AP, which obligates neurons to have some activity and
increases cycle flux, but other stimuli options should be explored if more appropriate. A second
factor that could contribute to higher C4/C3 ratios is increased anaplerotic activity. Anaplerotic
substrates supply the Krebs cycle at points other than acetyl-coA; for example propionate supplies
the cycle at the level of succinyl-coA while pyruvate may supply the cycle at the level of
oxaloacetate (see Fig.1.2 page 13). Pyruvate (re)cycling, by conversion of pyruvate to oxaloacetate
through pyruvate carboxylase (PC) has been reported in brain glia (Kunnecke et al. 1993; Lapidots
& Gopher 1994; Beckmann et al. 1995). In our study, we used [1-13C]glucose, from which derives
one unlabeled pyruvate and one [3-13C]pyruvate. If we consider them entering the PC pathway at
the same rate, we would get 50% unlabeled oxaloacetate, 25% oxaloacetate labeled at C2 and
25% labeled at C3 due to scrambling of the label via malate and fumarate. If this oxaloacetate pool
condenses with [2-13C]acetyl-coA, only 25% of the resulting glutamate/glutamine would be labeled
in both C3 and C4, while the remaining 75% would not be labeled in C3, even at steady state.
Table 4-6 Glutamate C4/C3 ratio of tissue extracts from Wistar rats injected with saline/6-OHDA and superfused with glucose, lactate and pyruvate (Pilot 1). Values are presented for one individual experiment.
hippocampus (n=1)
striatum (n=1)
cortex (n=1)
Saline 2.9 2 2.4 Treated 1.8 1.8 1.9

51
Some authors (Chowdhury et al. 2014) have suggested that in the presence of ketone bodies,
these become the main acetyl-coA producer while glucose is diverted to anaplerotic oxaloacetate
synthesis and Krebs cycle flux upregulation. Since we did not perform a longitudinal study to
determine if the glutamate C4/C3 ratio had converged to a constant value at the time of tissue
harvesting, we cannot determine to what extent the elevated glutamate C4/C3 ratios that we
observed reflect anaplerotic activity or isotopic nonsteady-state.

52
4.2. 1H extract analysis: cell content quantification
1H analysis of extracts allows us to quantify the metabolites present (Fig.4.9), a
complementary data for the selection of substrates for acetyl-coA generation. By using internal
standards of known concentration, we are able to determine absolute amounts of the substances
analyzed.
Fig.4.9 Representative 1H spectra of an extract. a) TSP standard; b) [U-13C]3HB; c) unlabelled 3HB; d) unlabelled lactate; e) [2-13C]lactate; f) [3-13C]lactate; g) alanine; h) acetate; i) N-acetyl-aspartate (NAA); j) creatine/phosphocreatine; k) unlabelled glucose; L) [1-13C]glucose; m) fumarate standard; n) pyrazine standard.

53
4.2.1. Supra-physiological saturating levels of glucose and 3-β hydroxybutyrate
in hippocampus: 5mM glucose, 1/0.1mM lactate/pyruvate ±5mM 3HB
All metabolites were efficiently uptaken and retained in the cells (Fig.4.10). We can also
infer glycolytic contributions to total lactate pool, as [3-13C]lactate is only produced by the
breakdown of [1-13C]glucose. The breakdown of one molecule of [1-13C]glucose originates one [3-13C]lactate and one unlabeled lactate (Fig.3.3, page 34), so the actual contribution of glycolytic
lactate pool is the value represented in the graphic. The bars represented as “unlabeled
endogenous lactate” are also corrected for this contribution. The glycolytic contribution to the
lactate pool did not change significantly between the two conditions, with (mean± SEM) 57±8%
contribution in the presence of 3HB and 57±6% in the absence of the ketone body. A residual
amount of unlabeled glucose representing the 1% unlabeled fraction in the 99%-enriched
commercial [1-13C]glucose and/or incomplete washout of unlabeled glucose from the preceding
stabilization solutions.
Different metabolites and their isotopomers present in PCA extracts
[3-1
3C
] L
ac
[2-1
3C
] L
ac
en
do
gen
ou
s L
ac
To
tal L
acta
te
0 .0 0
0 .0 5
0 .1 0
0 .1 5
0 .2 0
0 .2 5
µm
ol/
mg
pro
tein
a)
[1-1
3C
]glu
co
se
12C
glu
co
se
To
tal g
luco
se
0 .0
0 .2
0 .4
0 .6
µm
ol/
mg
pro
tein
b)
12C
3H
B
[U-1
3C
]3H
B
To
tal 3H
B
0 .0
0 .1
0 .2
0 .3
0 .4
µm
ol/
mg
pro
tein
c)
Fig.4.10 Different substrates isotopomers observed by 1H NMR analysis of tissue extracts of slices superfused with 5mM [1-13C]glucose, 1/0.1mM [2-13C]lactate/pyruvate ± 5mM [U-13C]3HB. a) lactate; b) glucose; c) 3-hydroxybutyrate. Values are presented as mean±SEM of the results obtained from 5 independent experiments.

54
Of note, not all substrates were found in all extracts. For example, NAA (see Fig.4.11) was
only found in 3 sets of experiments (and in those, both in -3HB and +3HB groups) and glucose was
sometimes absent from some extracts. One possible explanation for this would be the extraction
method used; PCA at 7% drops the pH to levels close to 0. This acidic environment for a
considerable period of time like the one used (aprox.30minutes) may result in degradation of
some of these compounds. In some cases, glucose signals were buried in the water peak (at
4.8ppm) and also suffer the effect spectral artifacts arising from the 1H NMR water suppression
procedure, making their quantification more unreliable.
Cell activity markers: NAA, total creatine and lactate/alanine ratio of PCA tissue extracts
N AA
0 .0 0
0 .0 2
0 .0 4
0 .0 6
µm
ol/
mg
pro
tein
T o ta l C r e a t in e
0 .0 0
0 .0 3
0 .0 6
0 .0 9
µm
ol/
mg
pro
tein
L a c /Ala
0
5
1 0
1 5
ra
tio
Fig.4.11 Quantification of NAA, total creatine and lactate/alanine ratio (*p<0.05, multiple t-tests) from tissue extracts of slices superfused with 5mM [113C]glucose, 1/0.1mM [2-13C]lactate/pyruvate ± 5mM [U-13C]3HB. Values are presented as mean±SEM of the results obtained from 3 independent experiments for NAA and 4 independent experiments for total creatine and lac/ala ratio.
The neuronal marker NAA showed no significant changes between conditions, and total
creatine levels also showed no alterations (Fig.4.11). We did not observe any labeled NAA, in
agreement with previous reports of NAA being a pool that does not exchange with other cell
metabolites over the timeframe of the experiment (Lapidots & Gopher 1994). We were not able to
measure metabolic energy indicators such as PCre/ATP and ATP/ADP, due to technical difficulties
in acquiring 31P spectra. PCre/Cre was theoretically possible to measure by 1H, but the spectral
resolution was insufficient to distinguish both signals separately, as they resonate too close to
each other (3.0360ppm for creatine and 3.0280ppm for phosphocreatine) (Duarte et al. 2007;
Govindaraju et al. 2000).
*

55
Pyruvate and lactate reflect the cytosolic redox state, and their ratio is usually found to be
around 1:10, but may be as low as 1:50 (Barros 2013). Lactate dehydrogenase (LDH) is an enzyme
that regulates lactate and pyruvate in a manner to reflect the cytosolic pair NADH/NAD+ (eq 5,
where K is the equilibrium constant of PDH and [H+] is the cytosolic proton concentration). Alanine
is in close equilibrium with pyruvate and often substitutes pyruvate in the equation, as alanine has
a defined isolated resonance in the 1H, unlike pyruvate that is usually buried under glucose peaks
(Cruz et al. 2001; Ben-Yoseph et al. 1993; Duarte et al. 2007; Alves et al. 2011).
This ratio was slightly increased in the +3HB group, when comparing to the -3HB condition
(Fig.4.11, *p<0.05). This increased ratio reflects a more reduced redox cytosolic environment
within the cells, resulting from increased NADH availability from increased glycolytic production
(Cruz et al. 2001). These results are in agreement with the literature that shows ketone bodies to
be effective anti-oxidants (Veech et al. 2001; Cheng et al. 2009).
As was mentioned, alanine is usually in close isotopomer equilibrium with pyruvate. In the 13C spectra, a small amount of [3-13C]alanine was observed, as well as a very small amount of [2-13C]alanine. In the 1H spectra, the signal-to-noise resolution is too low for any isotopomers
quantification.
4.2.2. Regional metabolism of 2mM glucose, 1/0.1mM lac/pyr ± 1.7mM 3-
hydroxybutyrate
In Fig.4.12 are represented the lactate and 3HB isotopomers quantified from tissue extracts
of hippocampus, cortex and striatum slices superfused in 2mM [1-13C]glucose, 1/0.1mM [2-13C]lac/pyr, ± 1.7mM [U-13C]3HB at recirculating conditions, and for hippocampus slices at non-
recirculating conditions. As was observed before, we can see that all labeled substrates are
efficiently taken up by the cells. In some extracts, some metabolites were unmeasurable and
repetition of this protocol is likely to supply the missing data.
(eq5)
].[.][
][
][
][
HK
NAD
NADH
Pyr
Lac

56
Different metabolites and their isotopomers present in PCA extracts
Lactate 3-Hydroxybutyrate
Rec
ircu
lati
ng
cort
ex
[3-1
3C
] L
ac
[2-1
3C
] L
ac
en
do
gen
ou
s L
ac
To
tal L
acta
te
0 .0 0
0 .0 5
0 .1 0
0 .1 5
0 .2 0
0 .2 5
µm
ol/
mg
pro
tein
12C 3
-HB
[U-1
3C] 3
-HB
Total 3
-HB
0.00
0.01
0.02
0.03
0.04
0.05
0.06
µm
ol/
mg
pro
tein
stri
atu
m
[3-1
3C] L
ac
[2-1
3C] L
ac
endogen
ous Lac
Total L
acta
te
0.0
0.2
0.4
0.6
0.8
µm
ol/
mg
pro
tein
12C 3
-HB
[U-1
3C] 3
-HB
Total 3
-HB
0.0
0.2
0.4
0.6
0.8
µm
ol/
mg
pro
tein
hip
po
cam
pu
s
[3-1
3C] L
ac
[2-1
3C] L
ac
endogen
ous Lac
Total L
acta
te
0.00
0.05
0.10
0.15
µm
ol/
mg
pro
tein
12C
3H
B
[U-1
3C
] 3H
B
To
tal 3H
B
0 .0 0 0
0 .0 1 5
0 .0 3 0
0 .0 4 5
0 .0 6 0
µm
ol/
mg
pro
tein
No
n-r
ecir
cula
tin
g
hip
po
cam
pu
s
[3-1
3C] L
ac
[2-1
3C] L
ac
endogen
ous Lac
Total L
acta
te
0.00
0.05
0.10
0.15
µm
ol/
mg
pro
tein
12C
3H
B
[U-1
3C
] 3H
B
To
tal 3H
B
0 .0 0
0 .0 1
0 .0 2
0 .0 3
0 .0 4
0 .0 5
µm
ol/
mg
pro
tein
Fig.4.12 Substrate isotopomers observed by
1H NMR analysis of tissue extracts of slices from WT
wistar rats. Slices were superfused with 2mM [1-13
C]glucose, 1/0.1mM [2-13
C]lac/pyr, ± 1.7mM [U-
13C]3HB at either recirculating or non-recirculating conditions. Values are presented as
mean±SD of the results obtained from 2 independent experiments.

57
Fig.4.13 shows the quantification of NAA, total creatine and the lactate/alanine ratio from
tissue extracts of hippocampus, cortex and striatum slices superfused in 2mM [1-13C]glucose,
1/0.1mM [2-13C]lac/pyr, ± 1.7mM [U-13C]3HB at recirculating conditions, and for hippocampus
slices at non-recirculating conditions. The values are in accordance with the ones observed before.
Cell activity markers: NAA, total creatine and lactate/alanine ratio of PCA tissue extracts
NAA Total Creatine Lactate/Alanine
Rec
ircu
lati
ng
cort
ex
NAA0.00
0.02
0.04
0.06
0.08
µm
ol/
mg
pro
tein
Total Creatine0.00
0.02
0.04
0.06
0.08
0.10
µm
ol/
mg
pro
tein
Lac/ala 0
5
10
15
rati
o
stri
atu
m
NAA0.00
0.02
0.04
0.06
0.08
µm
ol/
mg
pro
tein
Total Creatine0.00
0.03
0.06
0.09
µm
ol/m
g p
rote
in
Lac/ala 0
5
10
15
20
25
rati
o
hip
po
cam
pu
s
NAA0.00
0.02
0.04
0.06
µm
ol/
mg
pro
tein
Total Creatine0.00
0.02
0.04
0.06
0.08
µm
ol/
mg
pro
tein
Lac/ala 0
5
10
15
rati
o
No
n-r
ecir
cula
tin
g
hip
po
cam
pu
s
NAA0.000
0.015
0.030
0.045
0.060
µm
ol/
mg
pro
tein
Total Creatine
0.00
0.03
0.06
0.09
0.12
µm
ol/
mg
pro
tein
Lac/ala 0
5
10
15
rati
o
Fig.4.13 Quantification of NAA, total creatine and lac/ala ratio in tissue extracts of slices from WT Wistar rats. Slices were superfused with recirculating 2mM [1-
13C]glucose, 1/0.1mM [2-
13C]lac/pyr, ± 1.7mM [U-
13C]3HB (top 3
rows) and same concentrations put at non-recirculating conditions (bottom row). Values are presented as mean ± SD of the results obtained from 2 independent experiments.
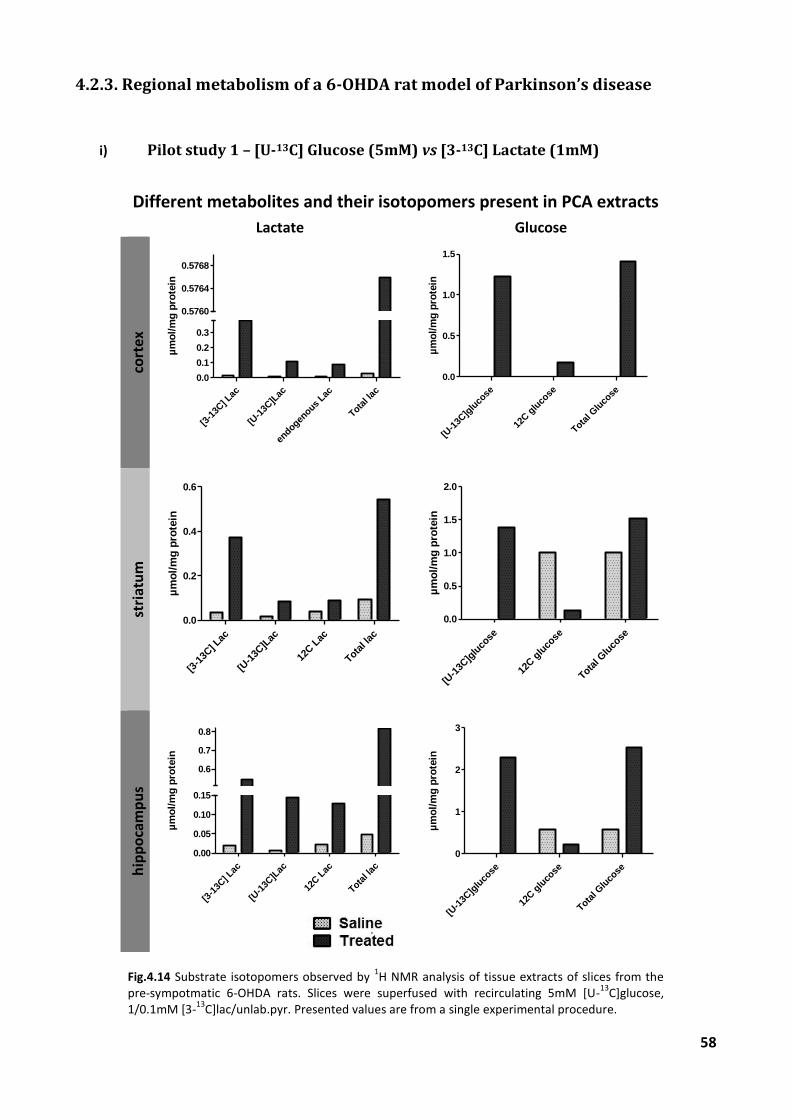
58
4.2.3. Regional metabolism of a 6-OHDA rat model of Parkinson’s disease
i) Pilot study 1 – [U-13C] Glucose (5mM) vs [3-13C] Lactate (1mM)
Different metabolites and their isotopomers present in PCA extracts
Lactate Glucose
cort
ex
[3-1
3C] L
ac
[U-1
3C]L
ac
endogen
ous Lac
Total l
ac
0.0
0.1
0.2
0.3
0.5760
0.5764
0.5768
µm
ol/
mg
pro
tein
[U-1
3C]g
luco
se
12C g
luco
se
Total G
luco
se
0.0
0.5
1.0
1.5
µm
ol/
mg
pro
tein
stri
atu
m
[3-1
3C] L
ac
[U-1
3C]L
ac
12C L
ac
Total l
ac
0.0
0.2
0.4
0.6
µm
ol/
mg
pro
tein
[U
-13C
]glu
cose
12C g
luco
se
Total G
luco
se
0.0
0.5
1.0
1.5
2.0
µm
ol/
mg
pro
tein
hip
po
cam
pu
s
[3-1
3C] L
ac
[U-1
3C]L
ac
12C L
ac
Total l
ac
0.00
0.05
0.10
0.15
0.6
0.7
0.8
µm
ol/
mg
pro
tein
[U-1
3C]g
luco
se
12C g
luco
se
Total G
luco
se
0
1
2
3
µm
ol/
mg
pro
tein
Fig.4.14 Substrate isotopomers observed by
1H NMR analysis of tissue extracts of slices from the
pre-sympotmatic 6-OHDA rats. Slices were superfused with recirculating 5mM [U-13
C]glucose, 1/0.1mM [3-
13C]lac/unlab.pyr. Presented values are from a single experimental procedure.

59
In Fig.4.14 are represented the various metabolites and their isotopomers quantified from
tissue extracts of hippocampus, cortex and striatum slices from saline or 6-OHDA injected rats
(treated) superfused in 5mM [U-13C]glucose and 1/0.1mM [3-13C]lac/unlabeled pyruvate. As was
observed before, we can see that all labeled substrates are efficiently taken up by the cells. In
some extracts, some metabolites could not be measured with adequate precision.
Cell activity markers: NAA and total creatine of PCA tissue extracts
NAA Total Creatine
cort
ex
NAA0.00
0.02
0.04
0.06
0.08
µm
ol/
mg
pro
tein
Total Creatine0.00
0.01
0.02
0.03
0.04
0.05
µm
ol/
mg
pro
tein
stri
atu
m
NAA0.00
0.02
0.04
0.06
0.08
µm
ol/
mg
pro
tein
Total Creatine0.00
0.02
0.04
0.06
0.08
0.10
µm
ol/
mg
pro
tein
hip
po
cam
pu
s
NAA0.00
0.02
0.04
0.06
µm
ol/
mg
pro
tein
Total Creatine
0.00
0.02
0.04
0.06
µm
ol/
mg
pro
tein
Fig.4.15 Quantification of NAA and total creatine in tissue extracts of slices from the pre-sympotmatic 6-OHDA rats. Slices were superfused with recirculating 5mM [U-
13C]glucose,
1/0.1mM [3-13
C]lac/unlabeled pyruvate. Presented values are from a single experimental procedure.
The quantification of the cell activity markers NAA and total creatine in both the 6-OHDA PD
model pilot studies (Fig.4.15 and Fig.4.17) were very difficult in these samples as these spectra
exhibited a particularly poor signal-to-noise ratio and were more contaminated. In fact, some
markers (for example, total creatine in the saline-injected striatum) were not possible at all to
quantify as it overlap with some contaminant that obliterated the signal. Alanine was also
particularly difficult to quantify, translating in low precision and high uncertainties in estimates of

60
the lac/ala ratio (not shown). As these were pilot samples with n=1 and n=2, no attempt
conclusions could be taken from these measurements, except that these molecules were present.
ii) Pilot study 2 – [U-13C]glucose (5mM) vs [3-13C]lactate (1mM) vs unlabeled
3HB (5mM)
Different metabolites and their isotopomers present in PCA extracts
Lactate 3-Hydroxybutyrate
cort
ex
[3-1
3C] L
ac
[U-1
3C]L
ac
12C L
ac
Total l
ac
0.0
0.1
0.2
0.3
0.4
0.5
µm
ol/
mg
pro
tein
unlabeled 3HB0.0
0.1
0.2
0.3
0.4
0.5
µm
ol/
mg
pro
tein
stri
atu
m
[3-1
3C] L
ac
[U-1
3C]L
ac
12C L
ac
Total l
ac
0.00
0.05
0.10
0.15
0.20
µm
ol/
mg
pro
tein
unlabeled 3HB0.00
0.05
0.10
0.15
µm
ol/
mg
pro
tein
hip
po
cam
pu
s
[3-1
3C] L
ac
[U-1
3C]L
ac
12C L
ac
Total l
ac
0.0
0.2
0.4
0.6
µm
ol/
mg
pro
tein
unlabeled 3HB0.0
0.1
0.2
0.3
0.4
0.5
µm
ol/
mg
pro
tein
Fig.4.16 Different substrates isotopomers observed by
1H NMR analysis of tissue extracts of slices from the
pre-sympotmatic 6-OHDA rats. Slices were superfused with recirculating 5mM [U-13
C]glucose, 1/0.1mM [3-13
C]lac/unlab.pyr, 5mM unlab.3HB. Values are presented as mean±SD of the results obtained from 2 independent experiments for cortex (both saline and treated), treated striatum and treated hippocampus and for 1 experiment for saline striatum and saline hippocampus.

61
In Fig.4.16 are represented the various metabolites and their isotopomers quantified from
tissue extracts of hippocampus, cortex and striatum slices from saline or 6-OHDA injected rats
(treated) superfused in 5mM [U-13C]glucose, 1/0.1mM [3-13C]lac/unlabeled pyruvate and 5mM
unlabeled 3HB. As in the previous pilot, quantification of some metabolite signals such as alanine
was imprecise because of low signal-to-noise.
Cell activity markers: NAA and total creatine of PCA tissue extracts
NAA Total Creatine
cort
ex
NAA0.00
0.05
0.10
0.15
0.20
µm
ol/
mg
pro
tein
Total Creatine0.00
0.05
0.10
0.15
0.20
µm
ol/
mg
pro
tein
stri
atu
m
NAA0.00
0.01
0.02
0.03
0.04
0.05
µm
ol/
mg
pro
tein
Total Creatine0.00
0.02
0.04
0.06
0.08µ
mo
l/m
g p
rote
in
hip
po
cam
pu
s
NAA0.00
0.05
0.10
0.15
0.20
µm
ol/
mg
pro
tein
Total Creatine
0.0
0.1
0.2
0.3
µm
ol/
mg
pro
tein
Fig.4.17 Quantification of NAA and total creatine in tissue extracts of slices from the pre-sympotmatic 6-OHDA rats. Slices were superfused with recirculating 5mM [U-13
C]glucose, 1/0.1mM [3-13
C]lac/unlab.pyr, 5mM unlab.3HB. Values are presented as mean±SD of the results obtained from 2 independent experiments for cortex (both saline and treated), treated striatum and treated hippocampus and for 1 experiment for saline striatum and saline hippocampus.

62
4.3. 1H analysis of superfusates
Samples from the superfusate coming out of the slice chambers were collected every
30minutes (Fig.3.1 page 30 and Fig.4.18, below) to quantify the output of metabolites over time.
The 1H NMR spectra of the superfusating medium allows us to analyze most metabolites being
output and not just the ones we were expecting. We scanned these spectra for molecules like
alanine and NAA, which are typically intracellular and are not expected to appear in the
extracellular medium in measurable amounts. The appearance of these molecules in the
superfusate would be taken as a signal of cell disrupture and of loss of tissue integrity.
Fig.4.18 Schematic representation of the experimental timeline, with the timepoints of superfusate collection.
4.3.1. Supra-physiological saturating levels of glucose and 3-β hydroxybutyrate
in hippocampus: 5mM glucose, 1/0.1mM lactate/pyruvate ± 5mM 3HB
In all the timepoint spectra for all the experiments performed, neither alanine nor NAA
were observed, suggesting the conditions provided (temperature, oxygen, pH, energetic
substrates) were sufficient to keep functional activity of the slices. In some samples from the end
of the “recovery period” (timepoint 00 in Fig.4.18), small peaks in the region of alanine and/or
NAA would appear, but would disappear throughout the experiment. We consider this to be
normal as the slicing process causes some cell damage, but the analysis of the remaining
timepoints reveals that this was not a systemic problem, and the death of some cells did not
compromise the activity of the remaining ones.
At the end of the recovery period (Fig.4.18, timepoint 00), when the slices only had contact
with the ACSF medium containing 5mM glucose, and before the new solution was added
(5mMglucose + 1/0.1mM lac/pyr ± 5mM 3HB), one sample was taken from the superfusate and
analyzed by 1H NMR (Fig.4.19a). The purpose of this sample was to evaluate the uptake of glucose
in this recovery.

63
From Fig.4.19a) we can conclude that there is a significant uptake of glucose from the
medium for the recovery of the slices, as the initial glucose concentration given was 5mM and
after 1hour it can decrease to as low as 2mM. As such, for all the experiments, even the ones at
low glucose concentration (2mM, see point 3.2.2) the recovery solution will always contain 5mM
glucose, as a lower concentration might compromise the viability of the slices at later times. Not
surprisingly, there is also some output of lactate; since this superfusing solution has only glucose,
this lactate is originated from the cells, indicating an active glycolytic pathway.
As was mentioned before, the high concentrations of glucose and 3HB given relate to the
recirculating nature of the experiment, and the need for the continuous saturation of the
transporters over time, which would not be achieved if there was depletion in substrate
availability. The 1H analysis of the last timepoint collected, 150minutes after the labeled substrates
are introduced (Fig.4.19b) shows that all substrates are still at saturating levels at this time.
Substrate concentration at the first and last time-points
Substrate concentration after recovery period
Substrate concentration at timepoint “150 minutes”
Glu
co
se
Lacta
te
0 .0
0 .1
3 .0
4 .5
co
nc
en
tra
tio
n m
M
(su
pe
rfu
sa
te o
utp
ut)
a)
Glu
co
se
3-H
B
Lacta
te
0
1
2
3
4
5
6
7
8
co
nc
en
tra
tio
n m
M
(su
pe
rfu
sa
te o
utp
ut)
b)
Fig.4.19 a) Glucose and lactate concentrations in the medium after the recovery period of 1 hour (ACSF with 5mM glucose) and before the new substrates are introduced (lactate, pyruvate ± 3-hydroxybutyrate). b) Substrate concentrations in the medium after the slices being in contact with the labeled substrates for 150 minutes. Each dot corresponds to an independent experiment (with vs without 3HB) of 4 independent experiments.

64
Lactate isotopomers output in the superfusate of hippocampal slices superfusated at supra-physiological saturating conditions
Lactate output in -3HB conditions
0 30 60 90 120 1500.00
0.05
0.10
0.4
0.6
0.8
time (min)
µm
ol/
min
/mg
pro
tein
(su
perf
usate
ou
tpu
t)
a)
Lactate output in +3HB conditions
0 30 60 90 120 1500.00
0.05
0.10
0.15
0.4
0.6
0.8 [3-13
C]Lactate
[2-13
C]Lactate12
C Lactate
Total Lactate
time (min)
µm
ol/
min
/mg
pro
tein
(su
perf
usate
ou
tpu
t)
b)
[12C] lactate
0 30 60 90 120 1500.00
0.05
0.10
0.15
0.20
time (min)
µm
ol/
min
/mg
pro
tein
(su
perf
usate
ou
tpu
t)
c)
[3-13C] lactate
0 30 60 90 120 1500.00
0.02
0.04
0.06
time (min)
µm
ol/
min
/mg
pro
tein
(su
perf
usate
ou
tpu
t)
d)
[2-13C] lactate
0 30 60 90 120 1500.3
0.4
0.5
0.6
0.7
0.8
time (min)
µm
ol/
min
/mg
pro
tein
(su
perf
usate
ou
tpu
t)
e)
Total lactate
0 30 60 90 120 1500.4
0.5
0.6
0.7
0.8
0.9
1.0
time (min)
µm
ol/
min
/mg
pro
tein
(su
perf
usate
ou
tpu
t)
f)
Fig.4.20 Comparison of output over time of lactate isotopomers of hippocampal slices superfused with 5mM glucose, 1/0.1mM lactate/pyruvate in the absence (-3HB) and presence (+3HB) of 5mM 3-Hydroxybutyrate. a) all isotopomers output in -3HB conditions; b) all isotopomers output in +3HB conditions; c) comparison of endogenous and unlabeled sources (12C) in both conditions, d) comparison of [3-13C]lactate output in both conditions, e) comparison of [2-13C]lactate in both conditions f) comparison of total lactate in both conditions. Values are presented as mean±SEM for 5 individual experiments.

65
Fig.4.20 shows the correlation of lactate isotopomers output over time. [3-13C]lactate
output was lower in the presence of 3HB comparing to the control (-3HB) conditions at all
timepoints, supporting the idea that 3HB inhibited glycolysis upstream of PDH. This analysis should
not be used for quantification of output metabolites purposes, since the recirculating conditions
induce an accumulation of metabolites that is not negligible as is shown in Fig.4.25 (page 69).
Amongst the expected metabolites (lactate, glucose, etc) in the medium, we observed a
peak at 1.92ppm, consistent with theCH3 resonance of acetate (Fig.4.21). This peak also had two
satellites (J=~7Hz) consistent with the signal from labeled 13C in C1 (2JC-H), and two other satellites
(J=~127Hz) consistent with signal from labeled 13C of C2 (1JC-H). In experiments with [U-13C]3HB, no
signals corresponding to [U-13C]acetate were ever observed, indicating that the origin of the
acetate isotopomers did not include the acetyl-coA pool that was fed by 3HB (Fig.4.21b).
Fig.4.21 1H spectra close-up on the acetate region. a) schematic representation of different expected labels and their correspondence to acetyl-coA label (Fc0, Fc1, Fc2 or Fc3). b) example of a1H spectrum from slices superfused with [1-13C]glucose, [2-13C]lactate/pyruvate and [U-13C]3HB. c) example of a 1H spectrum from slices of rats injected with 6-OHDA/saline superfused with [U-13C]glucose, and [3-13C]lactate/pyruvate.

66
Acetate has long been known to be a selective substrate for astrocytes and has been used
extensively as a substrate to distinguish astrocytic from neural metabolism (Badar-Goffer et al.
1990; Cerdan et al. 1990; Beckmann et al. 1995; Zwingmann & Leibfritz 2003; Melø et al. 2006;
Duarte et al. 2007). However, no acetate was used as an exogenous substrate in this work, so its
appearance (and labeling) means that it was produced by the tissue (Fig.4.22).
Fig.4.22 Acetate isotopomer synthesis from lactate/pyruvate and glucose precursors.
We only observe labeling from cytosolic substrates, i.e., there is some contribution of [1-13C]glucose to [2-13C]acetate, and a significant contribution of [2-13C]lactate/pyruvate to [1-13C]acetate, but no contribution from [U-13C]3HB, as no [U-13C]acetate is observed (Fig.4.21b). This
is also in agreement with Rae and colleges’ findings, as they have shown that pyruvate is the main
contributor for acetate formation (Rae et al. 2012). We therefore concluded that acetate can be
produced from glucose-, lactate- and pyruvate-derived acetyl-coA via acetyl-coA hydrolase
(Fig.4.22). The cytosolic isoform of the counterpart enzyme of this reaction (acetyl-coA synthetase
-AceSS1), which is responsible for the production of acetyl-coA for fatty acid synthesis, is found in
all brain regions. The mitochondrial isoform of acetyl-coA synthetase (AceSS2) exists in very low
amounts in the brain (Rae et al. 2012).
Further confirmation of the acetate isotopomer signals was provided from superfusion
experiments using [U-13C]glucose and [3-13C]lactate, where the predicted [U-13C]acetate and [2-13C]acetate products were observed (Fig.4.21c).

67
4.3.2. Regional metabolism of 2mM glucose, 1/0.1mM lac/pyr ± 1.7mM 3-
hydroxybutyrate
Fig.4.23 shows glucose and lactate concentrations after recovery period for all 3 structures
studied. As expected, for some experiments the consumption of glucose was considerable. As
before, lactate was observed after this recovery period and within the same range.
Metabolites output of the slices after recovery period
cortex (rec)
striatum (rec)
glu
co
se
lacta
te
0 .0
0 .1
0 .2
1
2
3
µm
ol/
min
/mg
pro
tein
(su
pe
rfu
sa
te o
utp
ut)
g
luco
se
lacta
te
0 .0 0
0 .0 5
0 .1 0
0 .1 5
0 .2 0
4
5
µm
ol/
min
/mg
pro
tein
(su
pe
rfu
sa
te o
utp
ut)
hippocampus (rec)
hippocampus (NR)
glu
co
se
lacta
te
0 .0 0
0 .0 5
0 .1 0
0 .1 5
3
4
5
6
µm
ol/
min
/mg
pro
tein
(su
pe
rfu
sa
te o
utp
ut)
g
luco
se
lacta
te
0 .0 0
0 .0 2
0 .0 4
0 .0 6
0 .0 8
3
4
5
6
µm
ol/
min
/mg
pro
tein
(su
pe
rfu
sa
te o
utp
ut)
Fig.4.23 Glucose and lactate concentrations in the medium after the recovery period of 1hour (ACSF with 5mM glucose) and before the new substrates are introduced (lactate, pyruvate ± 3-hydroxybutyrate). Each point corresponds to an independent experiment (with vs without 3HB) of 2 independent experiments.

68
Substrate concentration at timepoint “150min”
cortex (rec)
striatum (rec)
glu
co
se
3-H
B
lacta
te
0
1
2
3µ
mo
l/m
in/m
g p
ro
tein
(su
pe
rfu
sa
te o
utp
ut)
glu
co
se
3-H
B
lacta
te
0
1
2
3
4
5
µm
ol/
min
/mg
pro
tein
(su
pe
rfu
sa
te o
utp
ut)
hippocampus (rec)
glu
co
se
3-H
B
lacta
te
0
2
4
6
µm
ol/
min
/mg
pro
tein
(su
pe
rfu
sa
te o
utp
ut)
Fig.4.24 Substrate concentrations in the medium after the slices being in contact with the labeled substrates for 150minutes in recirculating (rec) conditions. Each point corresponds to an independent experiment (with vs without 3HB) of 2 independent experiments.
The analysis of the superfusate after 150 minutes of re-circulating superfusion with the
labeled metabolites (Fig.4.24) shows that while there was a tendency for starting substrate
concentrations to be lower at 150 min compared to 0 min, they were nevertheless sufficient to
maintain tissue viability. Lactate and acetate formation was also quantified (Fig.4.25) under both
circulating and non-recirculating conditions.

69
Comparison of hippocampal slices output of lactate and acetate over time in recirculating and non-recirculating conditions
to ta l la c ta te o u tp u t
t im e (m in )
µm
ol/
min
/mg
pro
tein
(su
pe
rfu
sa
te o
utp
ut)
-3 0 0 3 0 6 0 9 0 1 2 0 1 5 0
0
2
4
6
to ta l a c e ta te o u tp u t
t im e (m in )
µm
ol/
min
/mg
pro
tein
(su
pe
rfu
sa
te o
utp
ut)
-3 0 0 3 0 6 0 9 0 1 2 0 1 5 0
0 .0
0 .1
0 .2
0 .3
0 .4
-3 H B ( re c )
+ 3 H B ( re c )
-3 H B (N R )
+ 3 H B (N R )
Fig.4.25 Comparison of output over time of total lactate and acetate for recirculating (rec) and non-recirculating (NR) conditions, for hippocampal slices superfused with 2mM glucose, 1/0.1mM lactate/pyruvate in the absence (-3HB) and presence (+3HB) of 3-hydroxybutyrate. Values are presented as mean±SD for 2 individual experiments.
Although highly preliminary with only two replicates, we estimate that under recirculating
conditions, the cumulative amount of acetate that was secreted was about 5% that of lactate (i.e.
approximately 0.1 versus 2.0 mol/min/mg tissue protein.
Total lactate output increased over time indicating that overall, more lactate was secreted
into the medium than was taken up and oxidized by the tissue (Fig.4.26d). Levels of [2-13C]lactate
(Fig.4.26c) remained constant while unlabeled and endogenous sources (Fig.4.26a) decreased
over time, possibly due to a more effective washout under non-recirculating conditions. The
amount of [3-13C]lactate (Fig.4.26b) resulting from the breakdown of [1-13C]glucose appeared to
be greater in the absence than in the presence of 1.7 mM 3HB.

70
Lactate isotopomers output of hippocampal slices superfused in non-recirculating conditions
[12C] lactate
0 30 60 90 1200.00
0.01
0.02
0.03
time (min)
µm
ol/
min
/mg
pro
tein
(su
perf
usate
ou
tpu
t)
a)
[3-13C] lactate
30 60 90 120
-0.005
0.000
0.005
0.010
0.015
0.020
time (min)
µm
ol/
min
/mg
pro
tein
(su
perf
usate
ou
tpu
t)
b)
[2-13C] lactate
0 30 60 90 1200.0
0.2
0.4
0.6
0.8
time (min)
µm
ol/
min
/mg
pro
tein
(su
perf
usate
ou
tpu
t)
c)
Total lactate
0 30 60 90 1200.0
0.2
0.4
0.6
0.8
time (min)
µm
ol/
min
/mg
pro
tein
(su
perf
usate
ou
tpu
t)
d)
Fig.4.26 Comparison of output over time of lactate isotopomers for hippocampal slices superfused with 2mM glucose, 1/0.1mM lactate/pyruvate in the absence (-3HB) and presence (+3HB) of 3-hydroxybutyrate. a) Endogenous and unlabeled sources, b) [3-13C]lactate, c) [2-13C]lactate, d) total lactate. Values are presented as mean±SD for 2 individual experiments
Both labeled and unlabeled acetate output showed a tendency to increase over time with
the unlabeled isotopomer being the predominant species (Fig.4.27a,b). The production of [1-13C]acetate, presumably derived from [2-13C]lactate (see Fig.4.22, page 66), tended to be higher in
the absence than in the presence of 3HB (Fig.4.27d). Meanwhile, levels of [2-13C]acetate,
presumably derived from [1-13C]glucose via [3-13C]pyruvate were low, but detectable in
experiments with recirculated medium while under non-recirculating conditions it was not
detectable (Fig.4.28).

71
Acetate isotopomers output of hippocampal slices superfused in non-recirculating conditions
a c e ta te o u tp u t in -3 H B c o n d it io n s
0 3 0 6 0 9 0 1 2 0
0 .0 0
0 .0 2
0 .0 4
0 .0 6
0 .0 8
t im e (m in )
µm
ol/
min
/mg
pro
tein
(su
pe
rfu
sa
te o
utp
ut)
a)
a c e ta te o u tp u t in + 3 H B c o n d it io n s
0 3 0 6 0 9 0 1 2 0
0 .0 0
0 .0 1
0 .0 2
0 .0 3
0 .0 4
0 .0 5
[1 2
C ]a c e ta te
[1 -1 3
C ]a c e ta te
[2 -1 3
C ]a c e ta te
to ta l a c e ta te
t im e (m in )
µm
ol/
min
/mg
pro
tein
(su
pe
rfu
sa
te o
utp
ut)
b)
[12C] acetate
-30 0 30 60 90 120 1500.00
0.02
0.04
0.06
0.08
time (min)
µm
ol/
min
/mg
pro
tein
(su
perf
usate
ou
tpu
t)
c)
[1-13C] acetate
0 30 60 90 120 1500.000
0.005
0.010
0.015
0.020
0.025
time (min)
µm
ol/
min
/mg
pro
tein
(su
perf
usate
ou
tpu
t)
d)
total acetate
0 30 60 90 1200.00
0.02
0.04
0.06
0.08
time (min)
µm
ol/
min
/mg
pro
tein
(su
perf
usate
ou
tpu
t)
e)
Fig.4.27 Comparison of output over time of acetate isotopomers of hippocampal slices superfused with 2mM glucose, 1/0.1mM lactate/pyruvate in the absence (-3HB) and presence (+3HB) of 3-hydroxybutyrate. a) all isotopomers output in -3HB conditions; b) all isotopomers output in +3HB conditions; c) comparison of endogenous and unlabeled sources (12C) in both conditions, d) comparison of [1-13C]acetate output in both conditions, e) comparison of total acetate in both conditions. Values are presented as mean±SD for 2 individual experiments

72
Comparison of hippocampal slices [2-13C]Acetate output over time in recirculating and non-recirculating conditions
[2 -1 3
C ] a c e ta te o u tp u t
t im e (m in )
µm
ol/
min
/mg
pro
tein
(su
pe
rfu
sa
te o
utp
ut)
3 0 6 0 9 0 1 2 0 1 5 0
-0 .0 1
0 .0 0
0 .0 1
0 .0 2
0 .0 3
0 .0 4
0 .0 5
-3 H B ( re c )
+ 3 H B ( re c )
-3 H B (N R )
+ 3 H B (N R )
Fig.4.28 Comparison of output over time of [2-13C]acetate for recirculating (rec) and non-recirculating (NR) conditions, for hippocampal slices superfused with 2mM glucose, 1/0.1mM lactate/pyruvate in the absence (-3HB) and presence (+3HB) of 3-hydroxybutyrate. Values are presented as mean±SD for 2 individual experiments

73
5. Concluding
Remarks and
Future Work

74
In conclusion, ketone bodies are an effective substrate for hippocampal oxidative
metabolism and, surprisingly, seem to be preferred over glucose when both substrates are
available becoming the major contributor for acetyl-coA formation as evaluated by Glutamate 13C
isotopomer analysis. They also seem to be more extensively metabolized by glutamatergic
neurons than GABAergic neurons, suggesting a subtle but significant neuron-type
compartmentation.
The significant output of acetate to the superfusing medium was a surprise by itself, and
even more by the fact that it does not seem to be labeled by the ketone bodies at all.
Furthermore, even though ketone bodies do not contribute to this acetate pool, their presence
seems to downregulate acetate production. Acetyl-coA hydrolase is the most likely candidate for
acetate formation, but the reasons for this high activity rate is yet to be determined.
The pilot studies with the pre-symptomatic PD model suggest that no changes occur at the
metabolic flux and substrate selection. However, a more detailed study would be of use, namely
exploring glutamate and GABA pool absolute quantification values, which may be altered. Some
studies have suggested that the use of ketone bodies for PD patients relies more on their anti-
oxidant properties rather than fuel properties, so an analysis exploring this hypothesis may shed
some light on this matter.
A pressing issue is the increase of repetition of the experiments at physiological saturating
conditions and at non-recirculating conditions, to achieve significance in any findings related to
substrate selectivity at this concentrations and acetate output. An increase in the number of scans
acquired of the 13C NMR samples may also provide enough signal-to-noise ratio to better quantify
GABA signaling, and to evaluate if any glutamine signals are visible, since it was oddly missing from
our data.
Our findings may be useful for future applications of the ketogenic diet as a co-therapy for
numerous neuronal and neurodegenerative diseases that compromise metabolic function,
whether this aspect is a cause or a consequence of the disease.

75
References
Alves, M.G., Oliveira, P.J. & Carvalho, R. a, 2011. Substrate selection in hearts subjected to ischemia/reperfusion: role of cardioplegic solutions and gender. NMR in biomedicine, 24(9), pp.1029–37.
Bach, A. et al., 1977. Ketogenic Response to Medium-Chain Triglyceride Load in the Rat. The Journal of Nutrition, pp.1863–1870.
Badar-Goffer, R.S., Bachelard, H.S. & Morris, P.G., 1990. Cerebral metabolism of acetate and glucose studied by 13C-n . m . r . spectroscopy. Biochemistry Journal, 266, pp.133–139.
Barros, L.F., 2013. Metabolic signaling by lactate in the brain. Trends in neurosciences, 36(7), pp.396–404.
Bates, M.W., Krebs, H. a & Williamson, D.H., 1968. Turnover rates of ketone bodies in normal, starved and alloxan-diabetic rats. The Biochemical journal, 110(4), pp.655–61.
Beckmann, N. et al., 1995. Carbon-13 NMR spectroscopy of Biological Systems United Kin. N. Beckmann, ed., San Diego, California: Academic Press Limited.
Ben-Yoseph, O. et al., 1993. Glycerol 3-phosphate and lactate as indicators of the cerebral cytoplasmic redox state in severe and mild hypoxia respectively: a 13C- and 31P-n.m.r. study. The Biochemical journal, 291 Pt 3, pp.915–9.
Bergersen, L. et al., 2001. A novel postsynaptic density protein: the monocarboxylate transporter MCT2 is co-localized with δ-glutamate receptors in postsynaptic densities of parallel fiber-Purkinje cell synapses. Experimental Brain Research, 136(4), pp.523–534.
Bergersen, L., Rafiki, A. & Ottersen, O.P., 2002. Immunogold cytochemistry identifies specialized membrane domains for monocarboxylate transport in the central nervous system. Neurochemical research, 27(1-2), pp.89–96.
Bergersen, L.H., 2007. Is lactate food for neurons? Comparison of monocarboxylate transporter subtypes in brain and muscle. Neuroscience, 145(1), pp.11–9.
Bouzier, A.-K. et al., 2000. The metabolism of [3-(13)C]lactate in the rat brain is specific of a pyruvate carboxylase-deprived compartment.
Bouzier-Sore, A.-K. et al., 2002. Feeding active neurons: (re)emergence of a nursing role for astrocytes. Journal of physiology, Paris, 96(3-4), pp.273–82.
Cahill, G.F. & Aoki, T.T., 1980. Alternate fuel utilization by brain. In J. V. Passonneau et al., eds. Cerebral metabolism and neuronal function. Baltimore: Williams & Wilkins, pp. 234–42.
Carvalho, R. a et al., 1999. Multiple bond 13C-13C spin-spin coupling provides complementary information in a 13C NMR isotopomer analysis of glutamate. Magnetic resonance in
76
medicine : official journal of the Society of Magnetic Resonance in Medicine / Society of Magnetic Resonance in Medicine, 42(1), pp.197–200.
Castro, M.A. et al., 2009. A metabolic switch in brain: glucose and lactate metabolism modulation by ascorbic acid. Journal of neurochemistry, 110(2), pp.423–40.
Cerdan, S., Kunnecke, B. & Seelig, J., 1990. Cerebral Metabolism of [1 ,2-13C2] Acetate as Detected by in Vivo and in Vitro 13C NMR. Journal of Biological Chemistry, 265(22), pp.12916–12926.
Chassain, C. et al., 2005. Cerebral glutamate metabolism in Parkinson’s disease: an in vivo dynamic (13)C NMS study in the rat. Experimental neurology, 191(2), pp.276–84.
Cheng, B. et al., 2009. Ketogenic diet protects dopaminergic neurons against 6-OHDA neurotoxicity via up-regulating glutathione in a rat model of Parkinson’s disease. Brain research, 1286, pp.25–31.
Choi, I.-Y., Seaquist, E.R. & Gruetter, R., 2003. Effect of hypoglycemia on brain glycogen metabolism in vivo.
Chowdhury, G.M. et al., 2014. The contribution of ketone bodies to basal and activity-dependent neuronal oxidation in vivo. Journal of cerebral blood flow and metabolism : official journal of the International Society of Cerebral Blood Flow and Metabolism, 34(7), pp.1233–42..
Coles, L. et al., 2004. Exercise rapidly increases expression of the monocarboxylate transporters MCT1 and MCT4 in rat muscle. The Journal of physiology, 561(Pt 1), pp.253–61.
Cruz, F. et al., 2001. Intracellular Compartmentation of Pyruvate in Primary Cultures of Cortical Neurons As Detected by 13C NMR Spectroscopy With Multiple 13C Labels. Journal of neuroscience research, 781, pp.771–781.
Daikhin, Y. & Yudkoff, M., 1998. Ketone bodies and brain glutamate and GABA metabolism. Developmental neuroscience, 20(4-5), pp.358–64.
Dienel, G. a, 2012. Brain lactate metabolism: the discoveries and the controversies. Journal of cerebral blood flow and metabolism : official journal of the International Society of Cerebral Blood Flow and Metabolism, 32(7), pp.1107–38.
Duarte, J.M.N., Cunha, R. a & Carvalho, R. a, 2007. Different metabolism of glutamatergic and GABAergic compartments in superfused hippocampal slices characterized by nuclear magnetic resonance spectroscopy. Neuroscience, 144(4), pp.1305–13.
Erecińska, M. et al., 1996. Regulation of GABA level in rat brain synaptosomes: fluxes through enzymes of the GABA shunt and effects of glutamate, calcium, and ketone bodies. Journal of neurochemistry, 67(6), pp.2325–34.
Gamble, J.L., Ross, G.S. & Tisdall, F.F., 1923. THE METABOLISM OF FIXED BASE DURING FASTING. The Journal of biological chemistry, 57, pp.633–695.

77
Govindaraju, V., Young, K. & Maudsley, a a, 2000. Proton NMR chemical shifts and coupling constants for brain metabolites. NMR in biomedicine, 13(3), pp.129–53.
Greene, A.E. et al., 2001. Caloric restriction inhibits seizure susceptibility in epileptic EL mice by reducing blood glucose. Epilepsia, 42(11), pp.1371–8.
Gruetter, R., 2003. Glycogen: the forgotten cerebral energy store. Journal of neuroscience research, 74(2), pp.179–83.
Hallböök, T. et al., 2012. The effects of the ketogenic diet on behavior and cognition. Epilepsy research, 100(3), pp.304–9.
Hasebe, N. et al., 2010. Anticonvulsant effects of methyl ethyl ketone and diethyl ketone in several types of mouse seizure models. European journal of pharmacology, 642(1-3), pp.66–71.
Hashim, S.A. & Vanitallie, T.B., 2014. Ketone Body therapy: From the ketogenic Diet to the Oral Administration of Ketone Ester. Journal of lipid research, pp.1–35.
Hassel, B. & Bråthe, a, 2000. Cerebral metabolism of lactate in vivo: evidence for neuronal pyruvate carboxylation. Journal of cerebral blood flow and metabolism : official journal of the International Society of Cerebral Blood Flow and Metabolism, 20(2), pp.327–36.
Hattingen, E. et al., 2009. Phosphorus and proton magnetic resonance spectroscopy demonstrates mitochondrial dysfunction in early and advanced Parkinson’s disease. Brain : a journal of neurology, 132(Pt 12), pp.3285–97.
Hawkins, R. a, Williamson, D.H. & Krebs, H. a, 1971. Ketone-body utilization by adult and suckling rat brain in vivo. The Biochemical journal, 122(1), pp.13–8.
Henderson, S.T., 2008. Ketone Bodies as a Therapeutic for Alzheimer ’ s Disease. The Journal of the American Society for Experimental NeuroTherapeutics, 5(July), pp.470–480.
Henderson, S.T. & Poirier, J., 2011. Pharmacogenetic analysis of the effects of polymorphisms in APOE, IDE and IL1B on a ketone body based therapeutic on cognition in mild to moderate Alzheimer’s disease; a randomized, double-blind, placebo-controlled study. BMC medical genetics, 12(1), p.137.
Hove, J.L.K. Van et al., 2003. D , L-3-hydroxybutyrate treatment of multiple acyl-CoA dehydrogenase deficiency (MADD). Lancet, 361, pp.1433–1435.
Jiang, L. et al., 2011. Cortical substrate oxidation during hyperketonemia in the fasted anesthetized rat in vivo. Journal of cerebral blood flow and metabolism, 31(12), pp.2313–23.
Johnson, R.E., Sargent, F.I. & Passmore, R., 1958. Normal Variantions in total Ketone Bodies in Serum and Urine of Healthy Young Men. Journal of Experimental Phisiology, (43), pp.339–344.
Kang, J.-Q. & Macdonald, R.L., 2009. Making sense of nonsense GABA(A) receptor mutations associated with genetic epilepsies. Trends in molecular medicine, 15(9), pp.430–8.

78
Kashiwaya, Y. et al., 2000. D-B-Hydroxybutyrate protects neurons in models of Alzheimer’s and Parkinson’s disease. Proceedings of the National Academy of Sciences of the United States of America, 97(10), pp.5440–5444.
Kernig, K. et al., 2012. The afterhyperpolarizing potential following a train of action potentials is suppressed in an acute epilepsy model in the rat Cornu Ammonis 1 area. Neuroscience, 201, pp.288–96.
Kinsman, S.L. et al., 1992. Efficacy of the ketogenic diet for intractable seizure disorders: review of 58 cases. Epilepsia, 33(6), pp.1132–6.
Koper, J.W. et al., 1984. Acetoacetate and glucose as substrates for lipid synthesis by rat brain oligodendrocytes and astrocytes in serum-free culture. Biochimica et biophysica acta, 796, pp.20–26.
Kunnecke, B., Cerdan, S. & Seelig, J., 1993. Cerebral Metabolism of [1,2-13C2] Glucose and [U-13C4]3-Hydroxybutyrate in Rat Brain as Detected by 13C NMR Spectroscopy. NMR in biomedicine, 6(October 1992), pp.264–277.
Laffel, L., 1999. Ketone bodies: a review of physiology, pathophysiology and application of monitoring to diabetes. Diabetes/metabolism research and reviews, 15(6), pp.412–26.
LaManna, J.C. et al., 2009. Ketones supress brain glucose consumption P. Liss et al., eds. Advances in Experimental Medicine and Biology, 645, pp.301–306.
Lapidots, A. & Gopher, A., 1994. Cerebral metabolic compartmentation. Estimation of glucose flux via pyruvate carboxylase/pyruvate dehydrogenase by 13C NMR isotopomer analysis of D-[U-13C]glucose metabolites. The Journal of biological chemistry, 269, pp.27198–27208.
Leino, R.L. et al., 1997. Ultrastructural localization of GLUT 1 and GLUT 3 glucose transporters in rat brain. Journal of neuroscience research, 49(5), pp.617–26.
Lindon, J.C. et al., 2007. Handbook of Metabonomics and Metabolomics 1st editio. J. C. Lindon, J. K. Nicholson, & E. Holmes, eds., Oxford, UK.
Ma, W., Berg, J. & Yellen, G., 2007. Ketogenic diet metabolites reduce firing in central neurons by opening K ATP channels. The Journal of neuroscience : the official journal of the Society for Neuroscience, 27(14), pp.3618–25.
Malloy, C.R. et al., 1990. Contribution of exogenous substrates to acetyl coenzyme A: measurement by 13C NMR under non-steady-state conditions. Biochemistry, 29(29), pp.6756–61.
Marin-Valencia, I. et al., 2012. Glut1 deficiency (G1D): epilepsy and metabolic dysfunction in a mouse model of the most common human phenotype. Neurobiology of disease, 48(1), pp.92–101.
McNally, M. a & Hartman, A.L., 2012. Ketone bodies in epilepsy. Journal of neurochemistry, 121(1), pp.28–35.
79
Melø, T.M., Nehlig, A. & Sonnewald, U., 2006. Neuronal-glial interactions in rats fed a ketogenic diet. Neurochemistry international, 48(6-7), pp.498–507.
Owen, O.E. et al., 1967. Brain metabolism during fasting. The Journal of clinical investigation, 46(10), pp.1589–95.
Pan, J.W. et al., 2002. [2,4-13 C2 ]-β-Hydroxybutyrate Metabolism in Human Brain. Journal of cerebral blood flow and metabolism, 22(7), pp.890–898.
Patel, M.S. & Owen, O.E., 1976. Lipogenesis from Ketone Bodies in Rat Brain. Evidence for conversion of acetoacetate into acetyl-coenzyme A in the cytosol. Biochemistry Jounal, 156, pp.603–607.
Pellerin, L. et al., 2005. Cellular and subcellular distribution of monocarboxylate transporters in cultured brain cells and in the adult brain. Journal of neuroscience research, 79(1-2), pp.55–64.
Pellerin, L., 2010. Food for thought: the importance of glucose and other energy substrates for sustaining brain function under varying levels of activity. Diabetes & metabolism, 36 Suppl 3, pp.S59–63.
Pierre, K. & Pellerin, L., 2005. Monocarboxylate transporters in the central nervous system: distribution, regulation and function. Journal of neurochemistry, 94(1), pp.1–14.
Prins, M.L., 2008. Cerebral Metabolic Adaptation and Ketone Metabolism after Brain Injury. Journal of cerebral blood flow and metabolism, 28(1), pp.1–16.
Puchades, M. et al., 2013. Unaltered lactate and glucose transporter levels in the MPTP mouse model of Parkinson’s disease. Journal of Parkinson’s disease, 3(3), pp.371–85.
Puchowicz, M.A. et al., 2000. Dog model of therapeutic ketosis induced by oral administration of R,S-1,3-butanediol diacetoacetate. Journal of Nutritional Biochemistry, 11, pp.281–287.
Rae, C. et al., 2012. Metabolism, compartmentation, transport and production of acetate in the cortical brain tissue slice. Neurochemical research, 37(11), pp.2541–53.
Seymour, K.I. et al., 1999. Identification of Cerebral Acetone by 1H MRS in Patients with Seizures Controlled by Ketogenic Diet . MAGMA, (8), pp.33–42.
Silver, I. a & Erecińska, M., 1994. Extracellular glucose concentration in mammalian brain: continuous monitoring of changes during increased neuronal activity and upon limitation in oxygen supply in normo-, hypo-, and hyperglycemic animals. The Journal of neuroscience : the official journal of the Society for Neuroscience, 14(8), pp.5068–76.
Simpson, I. a, Carruthers, A. & Vannucci, S.J., 2007. Supply and demand in cerebral energy metabolism: the role of nutrient transporters. Journal of cerebral blood flow and metabolism, 27(11), pp.1766–1791.
80
Suzuki, M. et al., 2001. Effect of beta-hydroxybutyrate, a cerebral function improving agent, on cerebral hypoxia, anoxia and ischemia in mice and rats. Japanese journal of pharmacology, 87(2), pp.143–50.
Tadaiesky, M.T. et al., 2008. Emotional, cognitive and neurochemical alterations in a premotor stage model of Parkinson’s disease. Neuroscience, 156(4), pp.830–40.
Thavendiranathan, P. et al., 2003. The effect of the “classic” ketogenic diet on animal seizure models. Brain research, 959(2), pp.206–13.
Thio, L.L., Wong, M. & Yamada, K. a., 2000. Ketone bodies do not directly alter excitatory or inhibitory hippocampal synaptic transmission. Neurology, 54(2), pp.325–325.
Vanitallie, T.B. & Nufert, T.H., 2003. Ketones : Metabolism ’ s Ugly Duckling. Nutrition Reviews, 61(10), pp.327–341.
Vannucci, S.J. & Simpson, I. a, 2003. Developmental switch in brain nutrient transporter expression in the rat. American journal of physiology, Endocrinology and metabolism, 285(5), pp.E1127–34.
Veech, R.L. et al., 2001. Ketone bodies, potential therapeutic uses. IUBMB life, 51(4), pp.241–7.
Veech, R.L., 2004. The therapeutic implications of ketone bodies: the effects of ketone bodies in pathological conditions: ketosis, ketogenic diet, redox states, insulin resistance, and mitochondrial metabolism. Prostaglandins, leukotrienes, and essential fatty acids, 70(3), pp.309–19.
Wilder, R., 1921. The effects of ketonemia on the course of epilepsy. Mayo Clinic Proceedings.
Yang, L. et al., 2007. Anesthetic properties of the ketone bodies beta-hydroxybutyric acid and acetone. Anesthesia and analgesia, 105(3), pp.673–9.
Yeh, Y.-Y. & Zee, P., 1975. Relation of Ketosis to Metabolic Changes Induced by Acute Medium-Chain Triglyceride Feeding in Rats. The Journal of Nutrition, (3), pp.58–67.
Yudkoff, M. et al., 2005. Response of brain amino acid metabolism to ketosis. Neurochemistry international, 47(1-2), pp.119–28.
Zhang, Y. et al., 2013. Contribution of Brain Glucose and Ketone Bodies to Oxidative Metabolism. In W. J. Welch et al., eds. Oxygen Transport to Tissue XXXIV, Advances in Experimental Medicine and Biology. Advances in Experimental Medicine and Biology. New York, NY: Springer New York, pp. 365–370.
Zwingmann, C. & Leibfritz, D., 2003. Regulation of glial metabolism studied by 13C-NMR. NMR in biomedicine, 16(6-7), pp.370–99.