INSTITUTIONAL PRESENTATION 2Q18 -...
42
INSTITUTIONAL PRESENTATION 2Q18
Transcript of INSTITUTIONAL PRESENTATION 2Q18 -...

INSTITUTIONAL PRESENTATION2Q18

ReinoUnido
Arabia Saudita
França
Coreia do Sul
Brasil
Alemanha
Canadá
Rússia
Japão
Índia
EUA
China
336
345
551
579585
653
712
1.090
1.101
1.541
4.2516.529
2017
World’s Largest Producers (TWh)
8th POSITION
Source: Global Energy Statistical Yearbook 2017
ELECTRICITY GENERATION
2

3Source: EPE - Empresa de Pesquisa Energética
NATIONAL CONSUMPTION
Outros*= Consumption Rural; Public Service; Public Lighting
National Consumption by Class Acumulated (TWh)
33,942,2
22,4 19,3
117,8
32,841,7
21,8 19,1
115,4
2 T 18 2 T 17
Residential Industrial Commercial Others* Total
(+ 3.5%)( + 1.1%)
(+ 1.2%)( + 2.5%)
( + 2.1 %)

4Source: ONS
39,8%
10
20
30
40
50
60
70
80
90
Jan Fev Mar Abr Mai Jun Jul Ago Set Out Nov Dez
2015
2016
2017
2018
RESERVOIRS LEVEL
Subsystem Southeast / Midwest(70% country storage )
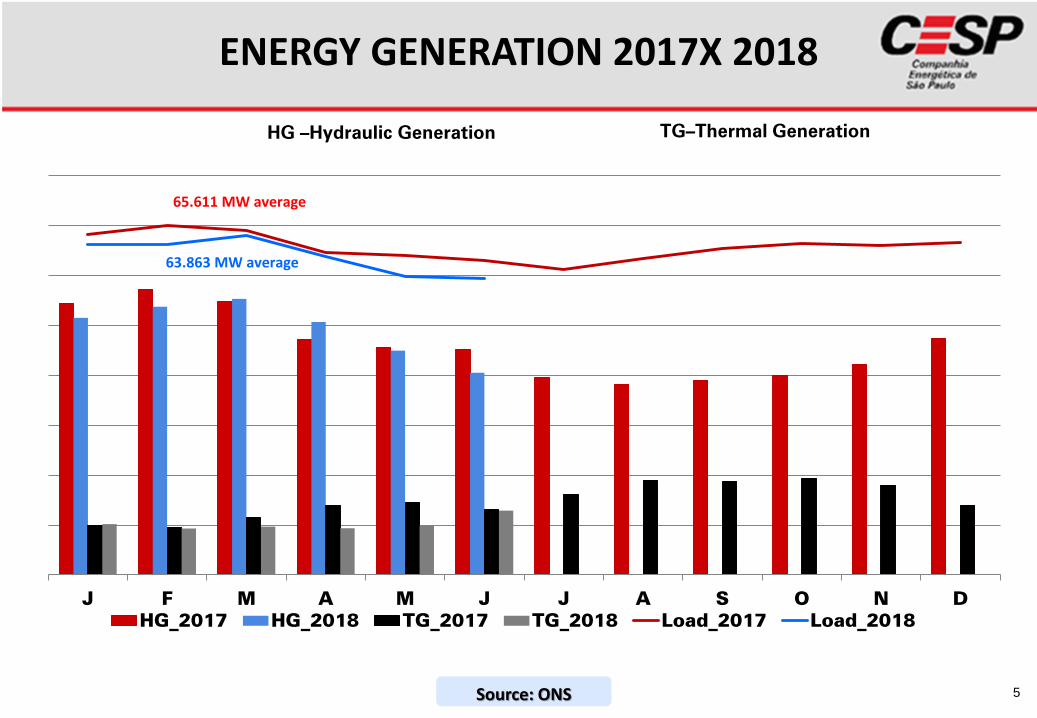
ENERGY GENERATION 2017X 2018
5Source: ONS
HG –Hydraulic Generation TG–Thermal Generation
J F M A M J J A S O N D
HG_2017 HG_2018 TG_2017 TG_2018 Load_2017 Load_2018
63.863 MW average
65.611 MW average
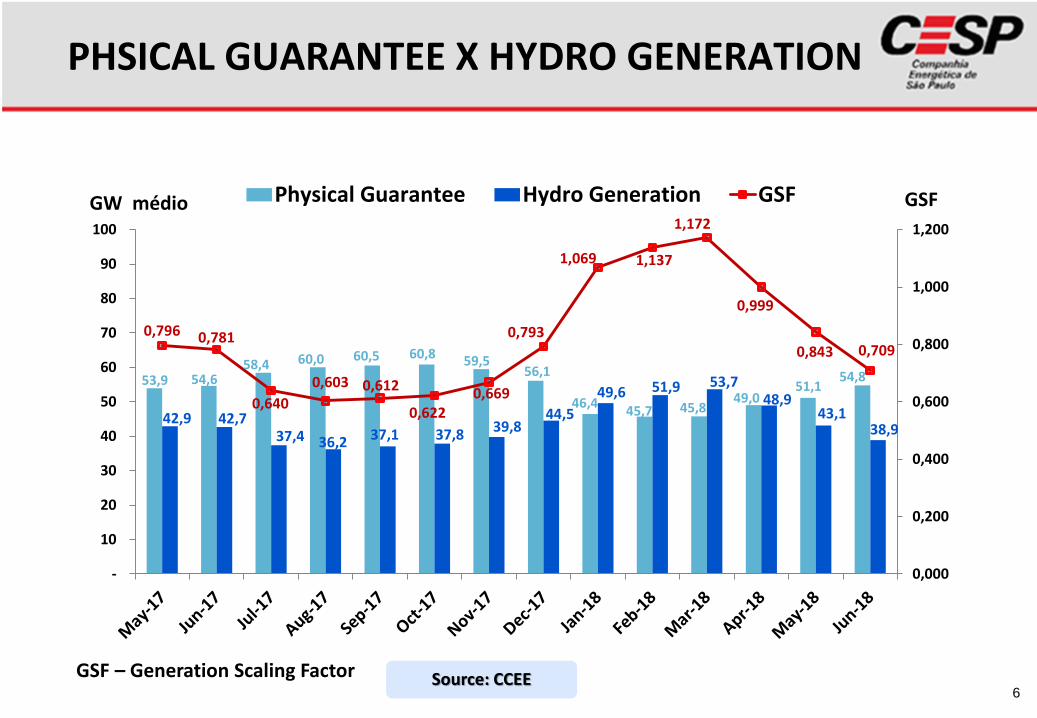
PHSICAL GUARANTEE X HYDRO GENERATION
6
GSF – Generation Scaling Factor
53,9 54,658,4 60,0 60,5 60,8 59,5
56,1
46,445,7 45,8
49,051,1
54,8
42,9 42,737,4 36,2 37,1 37,8 39,8
44,5
49,6 51,9 53,748,9
43,138,9
0,796 0,781
0,640
0,603 0,612
0,6220,669
0,793
1,069 1,137
1,172
0,999
0,843 0,709
0,000
0,200
0,400
0,600
0,800
1,000
1,200
-
10
20
30
40
50
60
70
80
90
100
Physical Guarantee Hydro Generation GSFGW médio GSF
Source: CCEE

2012 2013 2014 2015 2016 2017 2T17 2T18
166,69
263,07
688,88
287,20
94,10
324,17 303,75 302,93
AVERAGE PRICE PLD - R$/MWh
Subsystem Southeast / Midwest
Yearly Average Monthly/Quarter Average
7
Source: CCEE
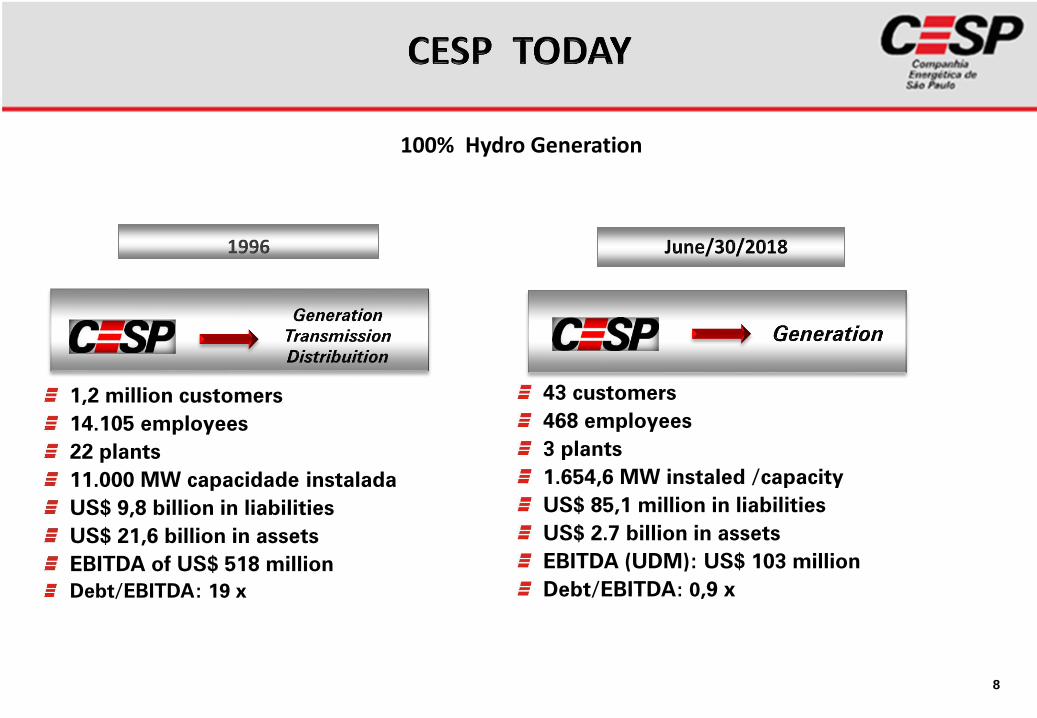
8
100% Hydro Generation
1,2 million customers
14.105 employees
22 plants
11.000 MW capacidade instalada
US$ 9,8 billion in liabilities
US$ 21,6 billion in assets
EBITDA of US$ 518 million
Debt/EBITDA: 19 x
43 customers
468 employees
3 plants
1.654,6 MW instaled /capacity
US$ 85,1 million in liabilities
US$ 2.7 billion in assets
EBITDA (UDM): US$ 103 million
Debt/EBITDA: 0,9 x

9
04/14/99
APRIL/ 01/99SPLIT UP
07/16/98
Privatized
11/05/97
HISTORICAL

10
CESP has the grant of three hydro generations acting on price regime. Total installed capacity is
1,654.6 MW.
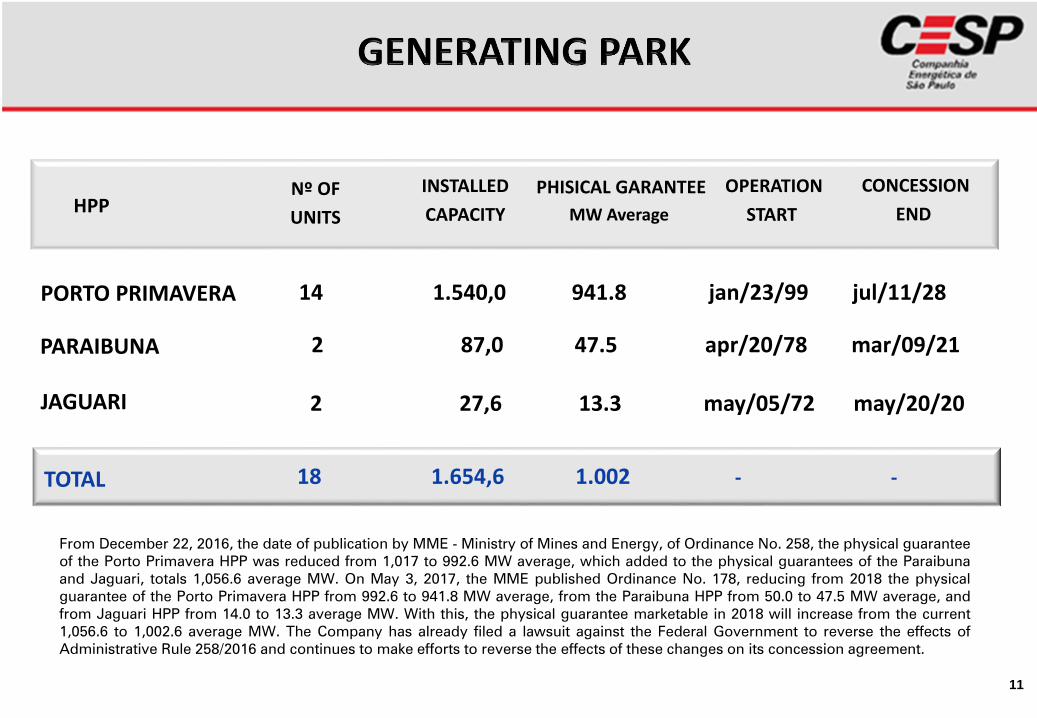
11
14 1.540,0 941.8 jan/23/99 jul/11/28
2 87,0 47.5 apr/20/78 mar/09/21
2 27,6 13.3 may/05/72 may/20/20
PORTO PRIMAVERA
PARAIBUNA
JAGUARI
18 1.654,6 1.002 - -TOTAL
From December 22, 2016, the date of publication by MME - Ministry of Mines and Energy, of Ordinance No. 258, the physical guarantee
of the Porto Primavera HPP was reduced from 1,017 to 992.6 MW average, which added to the physical guarantees of the Paraibuna
and Jaguari, totals 1,056.6 average MW. On May 3, 2017, the MME published Ordinance No. 178, reducing from 2018 the physical
guarantee of the Porto Primavera HPP from 992.6 to 941.8 MW average, from the Paraibuna HPP from 50.0 to 47.5 MW average, and
from Jaguari HPP from 14.0 to 13.3 average MW. With this, the physical guarantee marketable in 2018 will increase from the current
1,056.6 to 1,002.6 average MW. The Company has already filed a lawsuit against the Federal Government to reverse the effects of
Administrative Rule 258/2016 and continues to make efforts to reverse the effects of these changes on its concession agreement.
HPP INSTALLED
CAPACITY
Nº OF
UNITS
PHISICAL GARANTEE
MW Average
OPERATION
START
CONCESSION
END

12
(R$ million)June/30/2018
Occurrences / HPPTrês
IrmãosIlha
SolteiraJupiá Total
Amount of Plants 3,529 2,166 642 6,337
Provision - Contingent Assets / Impairment - -1,657 -338 -1995
Sub Total – Dec 31, 2014 3,529 509 304 4,342
Provision 4T15 -1,812 -379 -201 -2392
Balance of Available Assets to Reversal 1,717 129 103 1,949
Amount on dispute in Court 6,690 915 647 8,252
Base Period Apr-13 Jun-15 Jun-15
AVAILABLE ASSETS FOR REVERSAL

13

OPERATIONAL PERFORMANCE
2011 2012 2013 2014 2015 2016 2017 2T18
41.056 42.353
35.946
29.171 24.067
9.434 9.474
2.150
9.470
2.190
9.256
Energy Production X Physical Guarantee (GWh)
34.304
Physical Guarantee: 1.081 MW = 9.469 GWh Annual ; 4.696 1H17
14
32.399
21.282
34.304
34.304

2012 2013 2014 2015 2016 2017 2018
0,925 0,925 0,931 0,920
0,939 0,938 0,938
0,898
0,898
Source: ONS
0,0165
June/2018
15
Forced Unavailability Equivalent Rate – TEIFa
OPERATIONAL SITUATION
0,0251
0,0165
0,0095
0,0101
0,0097
0,0160
0,0048
0,0055
0,0057
2012 2013 2014 2015 2016 2017 2018
16
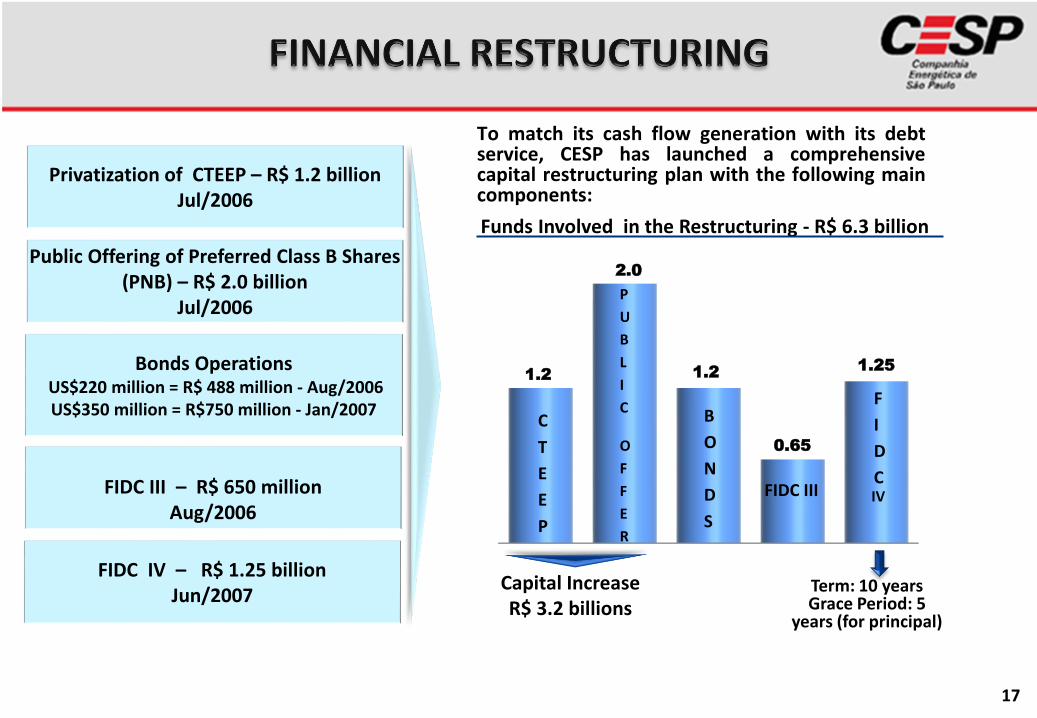
Capital Increase R$ 3.2 billions
Term: 10 yearsGrace Period: 5
years (for principal)
To match its cash flow generation with its debtservice, CESP has launched a comprehensivecapital restructuring plan with the following maincomponents:
Privatization of CTEEP – R$ 1.2 billionJul/2006
Public Offering of Preferred Class B Shares (PNB) – R$ 2.0 billion
Jul/2006
Bonds OperationsUS$220 million = R$ 488 million - Aug/2006US$350 million = R$750 million - Jan/2007
FIDC III – R$ 650 millionAug/2006
FIDC IV – R$ 1.25 billionJun/2007
Funds Involved in the Restructuring - R$ 6.3 billion
1.2
2.0
1.2
0.65
1.25
C
T
E
E
P
P
U
B
L
I
C
O
F
F
E
R
B
O
N
D
S
FIDC III
F
I
D
CIV
17
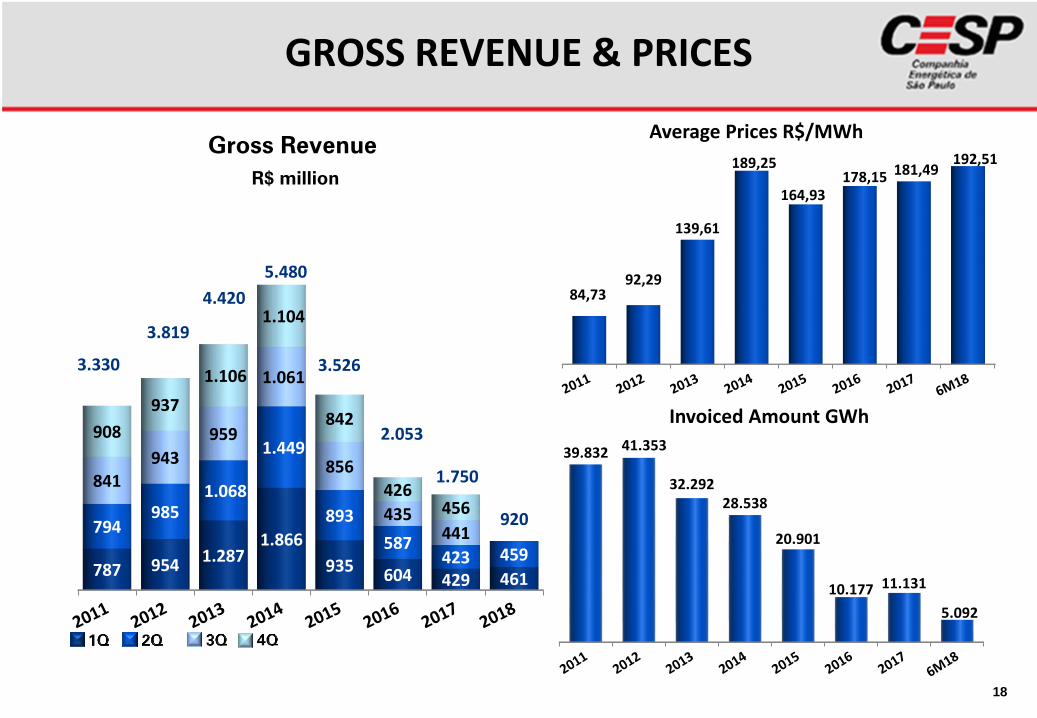
39.832 41.353
32.29228.538
20.901
10.177 11.131
5.092
84,7392,29
139,61
189,25
164,93178,15 181,49
192,51
5.480
3.330
Average Prices R$/MWh
Invoiced Amount GWh
3.526
18
4.420
2.053
Gross Revenue
R$ million
GROSS REVENUE & PRICES
920
787 9541.287
1.866
935 604 429 461
794985
1.068
1.449
893
587423 459
841943
959
1.061
856
435441
908
937
1.106
1.104
842
426456
3.819
1.750

69,162,2
78,4
85,5
58,954,6
26,3 52,6
EBITDA Margin (%)
2011 2012 2013 2014 2015 2016 2017 2018
726 842 1.1451.704
780 481 362 394
700875
940
1.300
748
468358 391
735831
867
939
715
374353
796805
951
913
708
345394
1.467
2.957
2.043 2.086
3.063
4.017
1.740
908
389 4133.354
Evolution of Net Revenue
3.904
Net Revenue & EBITDA
4.856
EBITDA (R$ million)
2.951
19
1.668
785

20
Customer Portfolio (MW average)
CONTRACTED ENERGY
2018 2019 2020 2021 2022 2023 2024
22%230
22%230
22%230
22%230
26%230
41%230
62%230
78%832
78%839
78%824
78%819 74%
646
59%330 38%
140
Distribuidores Mercado Livre
21
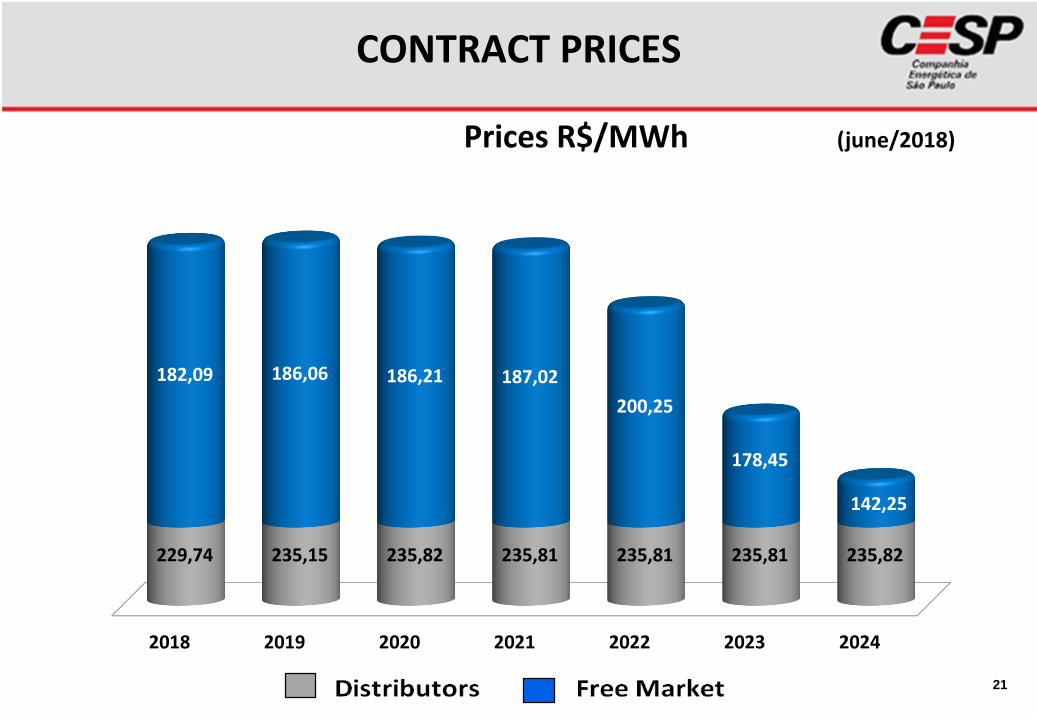
Prices R$/MWh (june/2018)
CONTRACT PRICES
2018 2019 2020 2021 2022 2023 2024
229,74 235,15 235,82 235,81 235,81 235,81 235,82
182,09 186,06 186,21 187,02
200,25
178,45
142,25
Distribuidores Mercado Livre

2011 2012 2013 2014 2015 2016 2017 6M18
1.771
2.223
1.694 1.7011.868
1.295
464 436
2011 2012 2013 2014 2015 2016 2017 6M18
1.330 1.283
1.038 922
802
568 466 468
2011 2012 2013 2014 2015 2016 2017 6M18
7,66,3
5,14,0
6,9
10,69,3 8,5
Costs & Operational Expenses
R$ million
Personnel Expenses/Net Revenue(%)
Employees
22
23
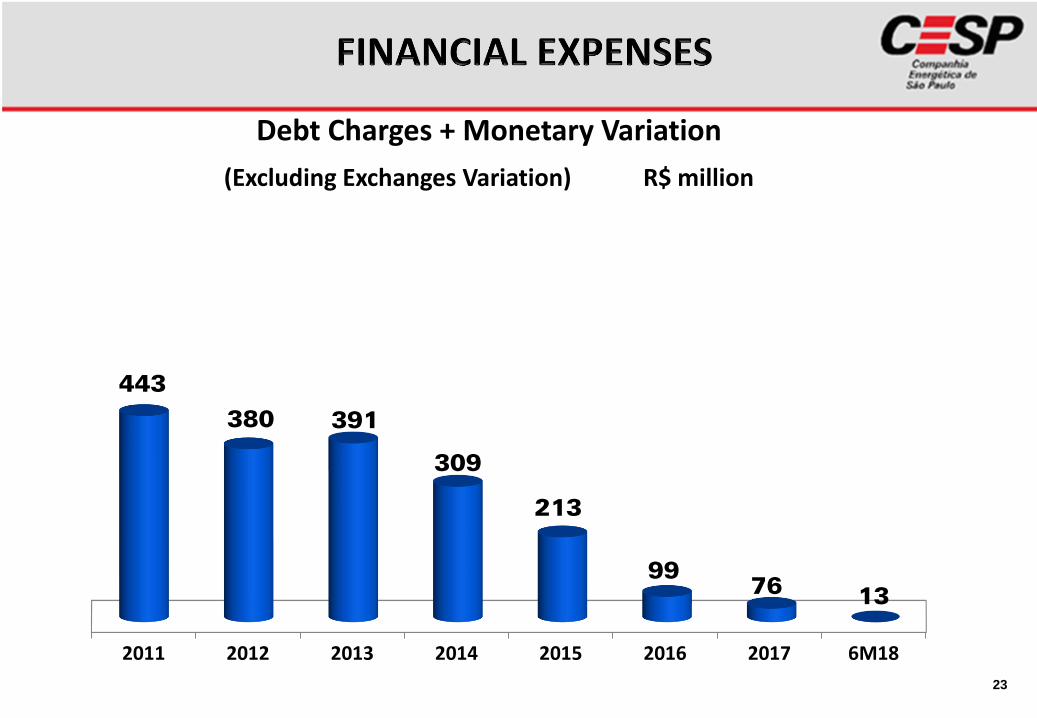
Debt Charges + Monetary Variation
(Excluding Exchanges Variation) R$ million
2011 2012 2013 2014 2015 2016 2017 6M18
443
380 391
309
213
9976
13

24
R$ million
2012 2013 2014 2015 2016 2017 6M18
129
86
32
75
13 9 6
Capital Investment

25
EBITDA Margin 26.2% 50.6% -24.4 pp
Operational Revenue 459 422 8.8%
Net Operational Revenue 391 358 9.4%
EBITDA Adjusted 102 181 - 43.4%
Net Income 341 67 410.3%
Financial Results (43) (1.5) 2,809%
R$ million
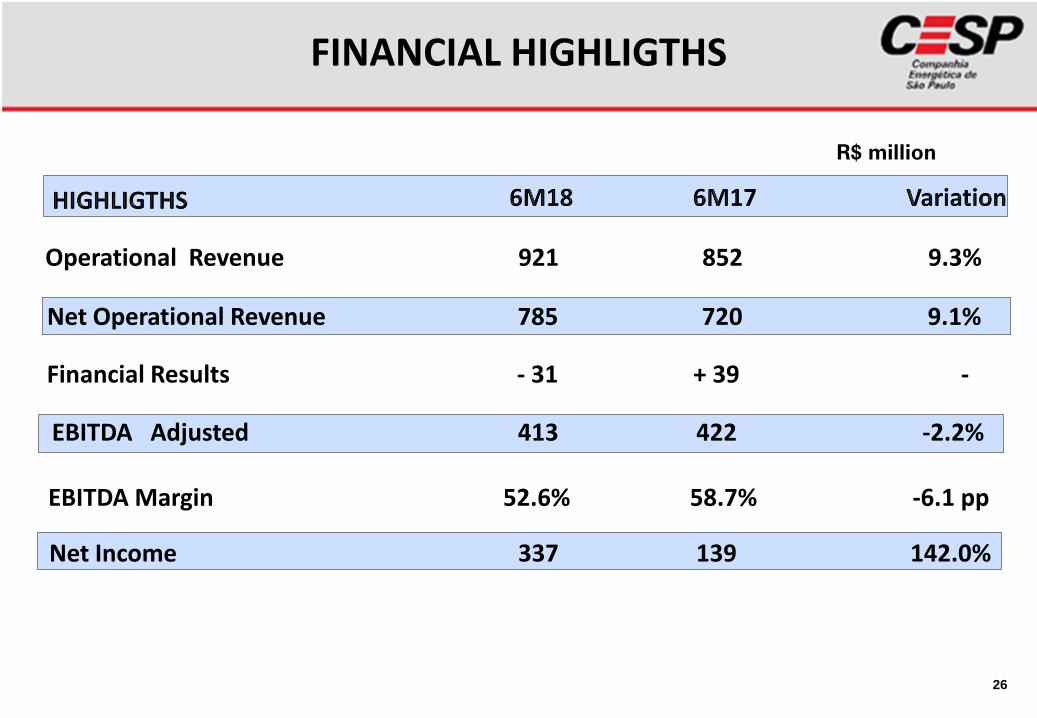
FINANCIAL HIGHLIGTHS
26
EBITDA Margin 52.6% 58.7% -6.1 pp
Operational Revenue 921 852 9.3%
Net Operational Revenue 785 720 9.1%
EBITDA Adjusted 413 422 -2.2%
Net Income 337 139 142.0%
Financial Results - 31 + 39 -
R$ million
FINANCIAL HIGHLIGTHS

27
28
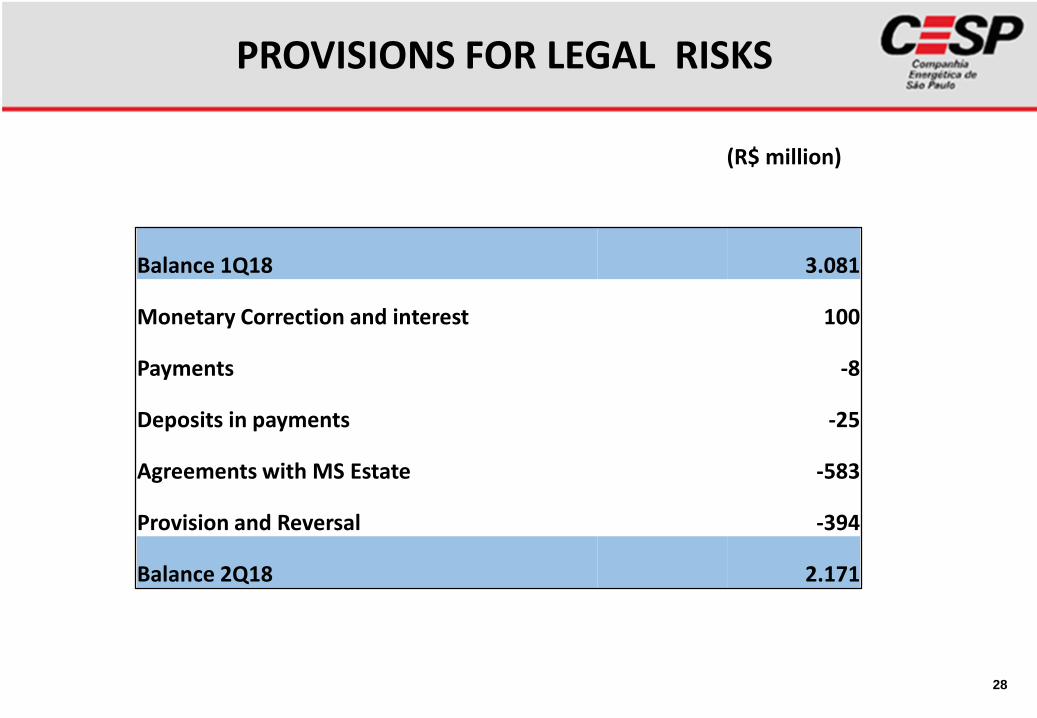
(R$ million)
PROVISIONS FOR LEGAL RISKS
Balance 1Q18 3.081
Monetary Correction and interest 100
Payments -8
Deposits in payments -25
Agreements with MS Estate -583
Provision and Reversal -394
Balance 2Q18 2.171

COURT LAWSUITS
29
Base: June/2018
Of the amounts related to lawsuits filed against CESP (judicial liabilities), 85% of them refer to theUHE Porto Primavera and are concentrated in lawsuits, most of which are filed in courts affiliatedto the Mato Grosso do Sul State.
Probability Quantity of
Lawsuits
Amount
06/2018
Relevant
Lawsuits
Amount
06/2018
PROBABLY 1,129 R$ 2.2 23 R$ 1.5
POSSIBLE 1,639 R$ 2.1 38 R$ 1.6
REMOTE 579 R$ 6.7 16 R$ 6.6
TOTAL 3,347 R$ 11.0 77 R$ 9.8
( R$ billion)

2009 2010 2011 2012 2013 2014 2015 2016 2017 2T18
30
Local Currency
Evolution by Currency(R$ billion)
5,3
4,54,2
3,7
3,0
-94%
2,8 2,2 2,1 1,7 1,1 0,7 1,0 0,9 0,9 0,9
Debt / EBITDA ratio
2,8
65% 63% 69% 66% 75% 74%
35%
37%
31%
34%
25%26%
Foreign Currency
51%
49%
1,7
FINANCIAL DEBT
32%97%
0,8
68%98%
0,40,3
3% 2%

FINANCIAL DEBT
31
June 30/2018 R$ 337.4 million
Debt in Foreign Currency
US$ 85.1 million (R$ 328.1 million)
Funcesp R$ 2,00,6%
Others R$ 1,20,4%
BNDES BradyR$ 326,996,8%
Eletrobrás R$ 7,32,2%
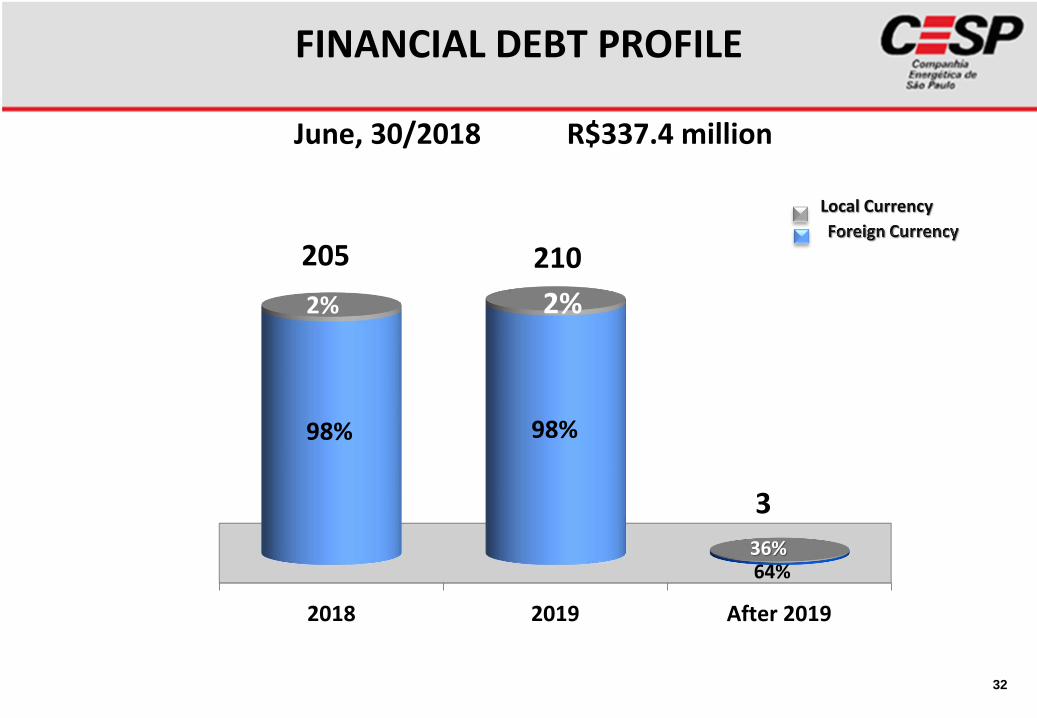
2018 2019 After 2019
205
FINANCIAL DEBT PROFILE
32
June, 30/2018 R$337.4 million
Local Currency
210
2%
3
36%
2%
98% 98%
99%
64%

1 -
2 -
3 -
4 -
Low Operational Costs
Low CAPEX Requirements
Low Working Capital Requirements (less than 5% of net revenues)
Tax Credits Reducing Future Tax Payments
(R$ 2.4 billion)
Several factors enable CESP to generate strong operational cash flow.
33

34

35
TOTAL CAPITAL COMMON x PREFERRED
Common (ON); 33,3%
Preferred (Class A);
2,3%
Preferred (Class B);
64,4%
Preferred; 2/3
Common 1/3

36
Common (ON) & Preferred (PNA + PNB)
Market; 5%
SP State; 95%
Market
87%
SP State13%
ON PNA + PNB

37Source : ITAU
June 2018 (%)
CONTROL GROUP
SHAREHOLDERS ON PNA PNB TOTAL
FAZENDA DO ESTADO DE SÃO PAULO 94.1 - 7.2 36.0
COMPANHIA PAULISTA DE PARCERIAS - - 6.5 4.2
OUTHER 1.1 - - 0.4
SUBTOTAL 95.2 - 13.7 40.6
FREE FLOAT
ELETROBRÁS 0.1 90.2 - 2.0
HSBC BANK PLC LONDON - - 9.5 6.1
SQUADRA INVESTIMENTOS - - 5.0 3.2
MORGAN STANLEY 4.4 2.8
UBS AG LONDON - - 5.4 3.4
WESTERN ASSET DTVM - - 4.7 3.0
OUTHER 4.7 9.8 57.3 38.9
SUBTOTAL 4.8 100 86.3 59.4
TOTAL 100 100 100 100
Main Shareholders

38
5,066
4.8
100.0
86.3
5.3
7.4
182.0
33.3
2.3
64.4
109.2
7.4
210.9
1,452
163
3,451
59.4 194.7 3,211 100.0 327.5
R$ million
June 30/2018
70
163
2,978

39

11,00
12,00
13,00
14,00
15,00
16,00
17,00
18,00
19,00
20,00
21,00
CESP6 SHARES QUOTATION
From Jan 1st/2018 to June 30th/2018
Source: AE Broadcast
IEE –Electric Energy Index IBOV – Bovespa Index
40

From Jan/2003 – July 2018
CESP CORPORATE RATING
41
Prime AAA AAA
AA+
High Grade AA
AA-
A+
Upper Medium Grade A
A-
BBB+
Lower Medium Grade BBB bbb-
BBB-
BB+
Speculative BB BB-
BB- Ba2
B+
Highly Speculative B
B-
CCC+
Insolvency Risk CCC
CCC-
Substancial Risk CC
Insolvency Probability C
SD
Default DDD
DD
D
jan/03 jul/03 jan/04 jan/06 jul/06 jan/07 jul/07 jan/08 jul/08 jan/09 jul/09 jul/10 jan/11 jul/11 ago/12 abr/13 fev/14 mai/14 dez/15 fev/16 jun/16 mai/17 Jan/18 Jul/18
S&P Local S&P Global S&P Stand Alone (SACP) Moody´s Global
Inve
stim
en
t G
rad
eD
isti
nct
ly
Spe
cula
tive
Pre
do
min
antl
y
Spe
cula
tive

42