Press Releases 2 Q05 En
11
Contacts Paulo Roberto Cruz Cozza Chief Financial Officer and Director of Investor Relations Joana Dark Fonseca Serafim Investor Relations +55 41 9913-0006 [email protected] Leonardo Marques Wanderley Investor Relations +55 41 9913-0927 [email protected] Cristiano Alves Pereira Investor Relations +55 41 9913-0059 [email protected] Website http://www.timpartri.com.br Rio de Janeiro, July 25 2005 – TIM Participações S.A. (BOVESPA: TCLS3 and TCLS4; and NYSE: TSU), the holding company of TIM Sul S.A. and TIM Nordeste Telecomunicações S.A., today announced the Company’s second quarter 2005 (2Q05) results. TIM Participações S.A. provides cellular telecommunications services in the states of Paraná, Santa Catarina, Piauí, Ceará, Rio Grande do Norte, Paraíba, Pernambuco, Alagoas and in the city of Pelotas (RS) through its operating subsidiaries. The financial and operational information below, except as otherwise indicated, is presented on a consolidated basis and in Reals, according to the Brazilian Corporate Law. The comparisons made refer to the second quarter 2004 (2Q04), except as otherwise indicated. TIM PARTICIPAÇÕES S.A. ANNOUNCES ITS CONSOLIDATED RESULTS FOR THE SECOND QUARTER 2005 The merger of TIM Sul and TIM Nordeste shares into TIM Participações has become effective on May 2005. Record-breaking base growth: 57.1% increase in net additions and 35.1% in the customer base when compared to 2Q04. 9.4% expansion of the postpaid base over 2Q04. Successful customer retention strategy: 4.9% churn in 2Q05 vs. 5.6% in 1Q05. Expanded GSM coverage: 86.4 % of the urban population in operating regions. 19.1% growth in total gross revenue over 2Q04. VAS (Value-Added-Service) revenues reach 7.1% of gross service revenues (+3.2 p.p. YoY). 23% decrease YoY in the Acquisition Cost per Subscriber (SAC) EBITDA reached R$ 210.7 million: an increase of + 19.6% compared to 2Q04. EBIT margin of 11% (+ 1.9 p.p. YoY). R$73.1 million net income, a 80.9% growth over 2Q04. 1
Transcript of Press Releases 2 Q05 En
Contacts
Paulo Roberto Cruz Cozza Chief Financial Officer and Director of Investor Relations
Joana Dark Fonseca Serafim Investor Relations +55 41 9913-0006 [email protected]
Leonardo Marques Wanderley Investor Relations +55 41 9913-0927 [email protected]
Cristiano Alves Pereira Investor Relations +55 41 9913-0059 [email protected]
Website http://www.timpartri.com.br
Rio de Janeiro, July 25 2005 – TIM Participações S.A. (BOVESPA: TCLS3 and TCLS4; and NYSE: TSU), the holding company of TIM Sul S.A. and TIM Nordeste Telecomunicações S.A., today announced the Company’s second quarter 2005 (2Q05) results. TIM Participações S.A. provides cellular telecommunications services in the states of Paraná, Santa Catarina, Piauí, Ceará, Rio Grande do Norte, Paraíba, Pernambuco, Alagoas and in the city of Pelotas (RS) through its operating subsidiaries. The financial and operational information below, except as otherwise indicated, is presented on a consolidated basis and in Reals, according to the Brazilian Corporate Law. The comparisons made refer to the second quarter 2004 (2Q04), except as otherwise indicated.
TIM PARTICIPAÇÕES S.A. ANNOUNCES ITS CONSOLIDATED RESULTS
FOR THE SECOND QUARTER 2005
The merger of TIM Sul and TIM Nordeste shares into TIM Participações has become effective on May 2005. Record-breaking base growth: 57.1% increase in net additions and 35.1% in the customer base when compared to 2Q04.
9.4% expansion of the postpaid base over 2Q04.
Successful customer retention strategy: 4.9% churn in 2Q05 vs. 5.6% in 1Q05.
Expanded GSM coverage: 86.4 % of the urban population in operating regions.
19.1% growth in total gross revenue over 2Q04. VAS (Value-Added-Service) revenues reach 7.1% of gross service revenues
(+3.2 p.p. YoY). 23% decrease YoY in the Acquisition Cost per Subscriber (SAC) EBITDA reached R$ 210.7 million: an increase of + 19.6% compared to
2Q04. EBIT margin of 11% (+ 1.9 p.p. YoY). R$73.1 million net income, a 80.9% growth over 2Q04.
1
Corporate Restructuring of TIM Participações Subsidiaries
All of the shares of TIM Sul and TIM Nordeste stock were merged into TIM Participações (ticker TCSL3 for common shares and TCSL4 for preferred shares), according to the resolutions adopted by their respective Special Shareholders’ Meetings held on May 30, 2005. Consequently, since July 07, 2005 TIM Sul and TIM Nordeste shares are no longer traded on Bovespa and SOMA, respectively.
Analysis of the Economic/Financial Performance
For the purpose of analyzing TIM Participações S.A. economic/financial performance in the quarter ended on June 30, 2005 (2Q05), and in the light of the corporate restructuring completed on August 30, 2004, pro-forma financial statements were prepared for the same period of the preceding year (2Q04), to enable the comparison with the information concerning the two quarters.
Highlights
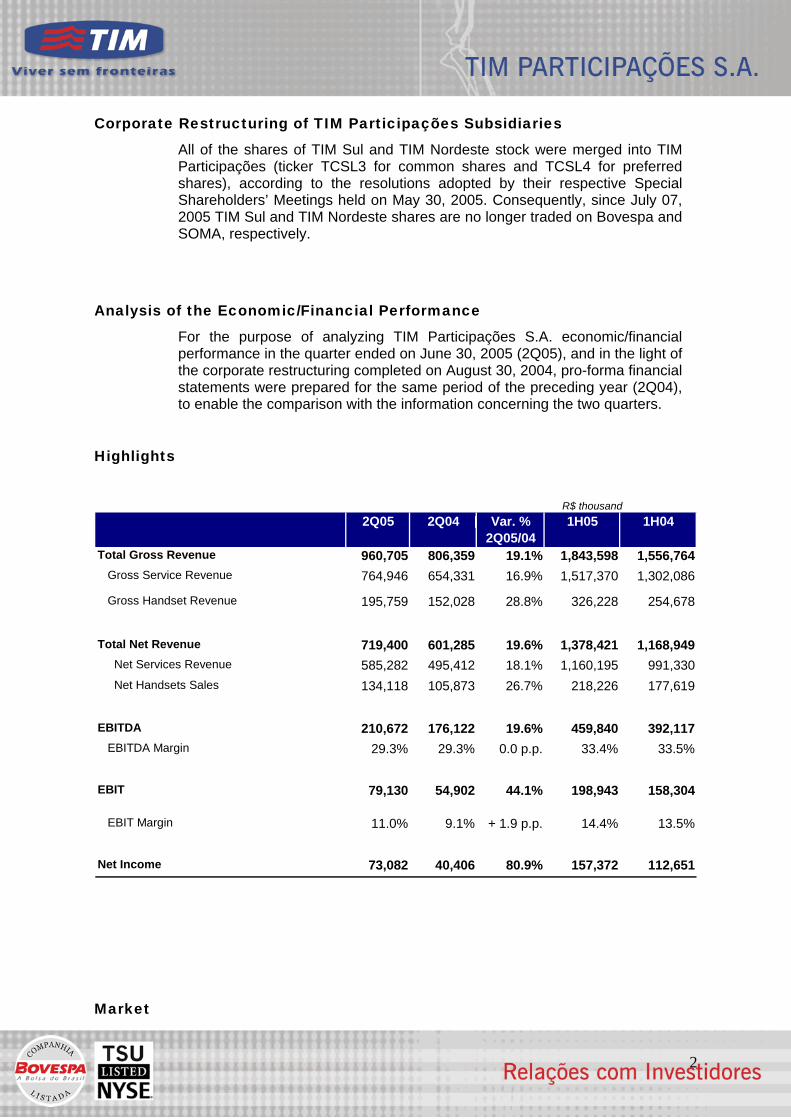
R$ thousand
2Q05 2Q04 Var. % 1H05 1H042Q05/04
Total Gross Revenue 960,705 806,359 19.1% 1,843,598 1,556,764 Gross Service Revenue 764,946 654,331 16.9% 1,517,370 1,302,086
Gross Handset Revenue 195,759 152,028 28.8% 326,228 254,678
Total Net Revenue 719,400 601,285 19.6% 1,378,421 1,168,949 Net Services Revenue 585,282 495,412 18.1% 1,160,195 991,330 Net Handsets Sales 134,118 105,873 26.7% 218,226 177,619
EBITDA 210,672 176,122 19.6% 459,840 392,117 EBITDA Margin 29.3% 29.3% 0.0 p.p. 33.4% 33.5%
EBIT 79,130 54,902 44.1% 198,943 158,304
EBIT Margin 11.0% 9.1% + 1.9 p.p. 14.4% 13.5%
Net Income 73,082 40,406 80.9% 157,372 112,651
Market
2
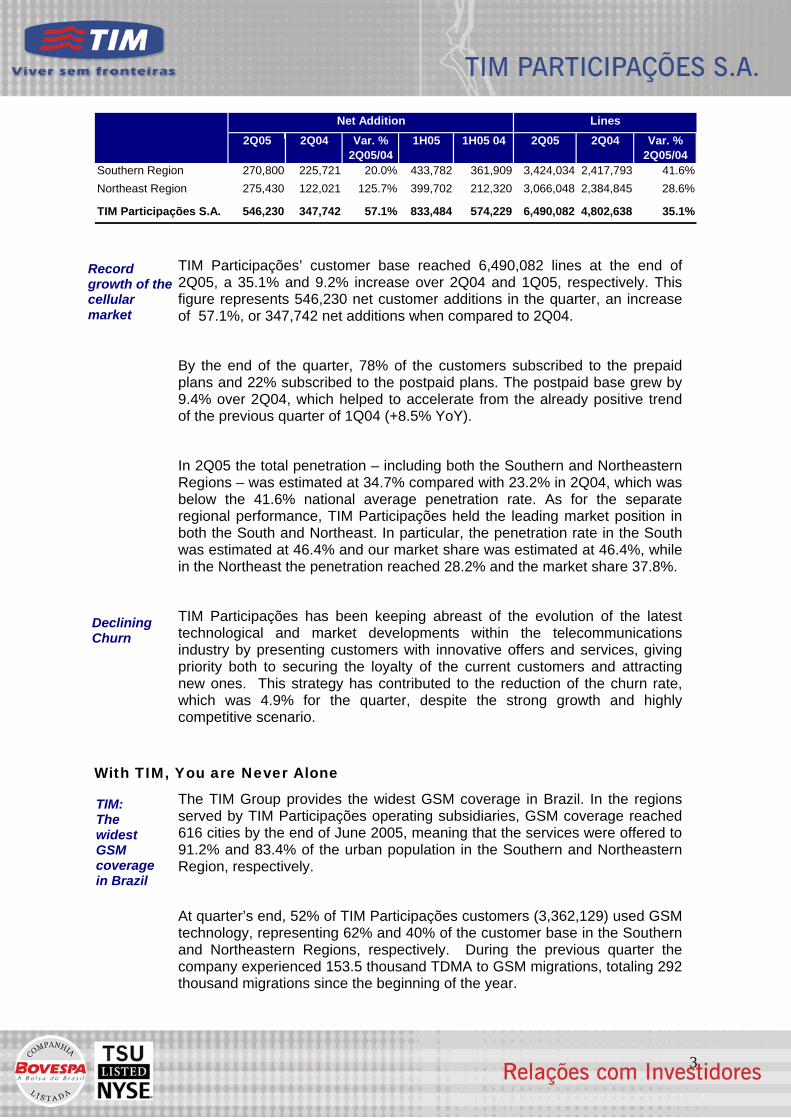
2Q05 2Q04 Var. % 1H05 1H05 04 2Q05 2Q04 Var. %2Q05/04 2Q05/04
Southern Region 270,800 225,721 20.0% 433,782 361,909 3,424,034 2,417,793 41.6%Northeast Region 275,430 122,021 125.7% 399,702 212,320 3,066,048 2,384,845 28.6%
TIM Participações S.A. 546,230 347,742 57.1% 833,484 574,229 6,490,082 4,802,638 35.1%
LinesNet Addition
TIM Participações’ customer base reached 6,490,082 lines at the end of 2Q05, a 35.1% and 9.2% increase over 2Q04 and 1Q05, respectively. This figure represents 546,230 net customer additions in the quarter, an increase of 57.1%, or 347,742 net additions when compared to 2Q04.
Record growth of the cellular market
By the end of the quarter, 78% of the customers subscribed to the prepaid plans and 22% subscribed to the postpaid plans. The postpaid base grew by 9.4% over 2Q04, which helped to accelerate from the already positive trend of the previous quarter of 1Q04 (+8.5% YoY).
In 2Q05 the total penetration – including both the Southern and Northeastern Regions – was estimated at 34.7% compared with 23.2% in 2Q04, which was below the 41.6% national average penetration rate. As for the separate regional performance, TIM Participações held the leading market position in both the South and Northeast. In particular, the penetration rate in the South was estimated at 46.4% and our market share was estimated at 46.4%, while in the Northeast the penetration reached 28.2% and the market share 37.8%.
TIM Participações has been keeping abreast of the evolution of the latest technological and market developments within the telecommunications industry by presenting customers with innovative offers and services, giving priority both to securing the loyalty of the current customers and attracting new ones. This strategy has contributed to the reduction of the churn rate, which was 4.9% for the quarter, despite the strong growth and highly competitive scenario.
Declining Churn
With TIM, You are Never Alone
The TIM Group provides the widest GSM coverage in Brazil. In the regions served by TIM Participações operating subsidiaries, GSM coverage reached 616 cities by the end of June 2005, meaning that the services were offered to 91.2% and 83.4% of the urban population in the Southern and Northeastern Region, respectively.
TIM: The widest GSM coverage in Brazil
At quarter’s end, 52% of TIM Participações customers (3,362,129) used GSM technology, representing 62% and 40% of the customer base in the Southern and Northeastern Regions, respectively. During the previous quarter the company experienced 153.5 thousand TDMA to GSM migrations, totaling 292 thousand migrations since the beginning of the year.
3
Differentiated Offers and Services
The second quarter was marked by a strong increase in sales thanks to promotions surrouding the holidays that occurred during the quarter, namely “Mother’s Day” and the Brazilian version of “Valentine’s Day”. The market strategy remains focused on customer acquisition and loyalty.
Inovation: a competitive edge
Inovation: a competitive edge
TIM Participações enlarged its already solid and successful service portfolio in the period by adding new countrywide plans and developing new teams to provide increasingly customized services, thereby enhancing our competitive edge in the corporate segment.
The corporate segment is one of the Company’s priorities, and we reinforced this strategy by offering a wider set of VAS solutions to our corporate clients. It is important to mention that TIM was the first Brazilian company to launch the blackberry, the most widely used tool to access corporate e-mails in the world. We also enlarged our national package of services.
We also have on count on new services for the prepaid segment, such as “Auto Recarga” (self recharge) and “Credito especial” (Special credit), both of which focus on increasing usage.
Operating Revenue
Boost on VAS revenue The gross service revenue in 2Q05 amounted to R$ 764.9 million,
representing a 16.9% increase over 2Q04. This increase was mainly driven by a 35.1% expansion of the customer base and to the 111.9% growth in Value Added Services (VAS) revenue.
The gross handset revenue for the quarter was R$ 195.8 million, 28.8% above 2Q04. In the quarter, 702.2 thousand handsets were sold versus 489.7 thousand in 2Q04 (+43%).
Thus, the total gross revenue was R$ 960.7 million in 2Q05, 19.1% higher than in 2Q04.
19.1% growth Total Gross Revenues YoY
ARPU: - New revenue makeup - Prepaid increase YoY
The 2Q05 average revenue per user (ARPU) was R$ 29.70, stable when compared to R$ 30.39 in the 1Q05, notwithstanding the impressive level net adds recorded in the quarter (+90%). The decrease in comparison with the 2Q04 (R$ 33.3) resulted mostly from the marked growth in the total customer base, as well as from the interruption of international and national long-distance services.
Operating Costs and Expenses
4
In 2Q05, the cost of services (including network and interconnection costs, before depreciation/amortization and personnel expenses) amounted to R$ 107.8 million, a 6.8% growth over the R$ 100.9 million in 2Q04. This increase was mainly driven by the strong expansion in the customer base and other costs related the GSM network roll-out as well as by the maintenance costs increase due to the overlap of the two existing networks (GSM and TDMA).
Network and clients expansion
The handset costs were R$ 158.2 million in the quarter, 15.5% higher than R$ 137.0 million in 2Q04, due to the greater number of handsets sold. Continued
sales growth: - 841.4 thou. gross adds - 702 thou. handsets sold
Selling and marketing expenses for the quarter (without depreciation/ amortization, bad debt and personnel expenses) were R$ 135.7 million, 32.9% above 2Q04, reflecting a marked growth in sales. Gross customer additions were 841,383 customers in the quarter versus 594,285 customers in 2Q04, a 41.6% increase. The higher sales in the period boosted manly the expenses related to sales commissions and the Fistel tax charged on the activation of each line.
Subscriber Acquisition Cost (SAC) for the quarter declined by 23% to R$ 121; compared to R$ 157 in 2Q04. This decrease was mainly driven by the average reduction in handset prices, the favorable exchange rates fluctuation, and a very rational commercial strategy.
SAC improvement: 23% reduction YoY
General and administrative expenses (G&A) – excluding depreciation/amortization and personnel expenses, totaled R$ 32.6 million, 23.6% above 2Q04. This increase was primarily due to higher IT equipment maintenance costs as, in a number of cases, the standard 1-year free maintenance period provided by suppliers expired.
Personnel expenses in the period added up to R$ 31.1 million – 3.4% above 2Q04.
Doubtful receivable accounts new provision criteria
Bad debt expenses went up to R$ 40.7 million in 2Q05 from R$ 33.2 million in 2Q04, representing 4% of the total gross revenue for both periods. We would like to point out that in the quarter, the criteria for provisioning bad debt were reviewed (including the previous quarter) in order to align the operating companies procedures and to adopt a more conservative approach taking into account the strong growth in postpaid customers.
5

EBITDA
TIM Participações posted an EBITDA – earnings before interest, tax, depreciation and amortization – of R$ 210.7 million in the quarter, 19.6% higher than the R$ 176.1 million recorded in 2Q04. The EBITDA margin was 29.3%, i.e., remaining stable when compared to the 2Q04. The EBITDA margin, excluding handsets revenue and costs was 40.5%, 0.4 p.p. over 2Q04.
19.6% increase in EBITDA
Depreciation and Amortization
Depreciations and Amortizations in the period were R$ 131.5 million, versus R$ 121.2 million, an 8.5% increase over 2Q04, due to the network expansion and technological innovation.
EBIT 44,1% increase in EBIT
The EBIT – earning before interest and tax – was R$ 79.1 million, versus R$ 54.9 million in 2Q04. The EBIT margin was 11.0%, 1.9 p.p. above that recorded in 2Q04.
Net Financial Income/Expense Financial revenue growth
Our net financial income for 2Q05 was R$ 17.9 million, versus R$ 12.5 million in 2Q04.
Net Income
The consolidated net income was R$ 73.1 million, 80.9% higher than in 2Q04, resulting mostly from the increased operational results.
80.9% increase in net income
Indebtedness
On June 30, 2005, our indebtedness amounted to R$ 160.9 million, of which 72.5% were long-term debts. The net cash position by period end was R$ 577.7 million.
CAPEX
Capital Expenditure in 2Q05 amounted to R$ 139.6 million, totaling R$ 188.2 million invested in the first half of the year, and primarily targeted to the expansion of the GSM network capacity and quality.
xxxxxxxxxxxxxxxxxxxxxxxxxxxxxxxxxxxxxxxxxxxxxxxxxxxxx
“This press release contains forward-looking statements and estimates. Such expectations are based on a series of assumptions, and subject to the risks and uncertainties inherent to forward-looking projections and/or estimates. The results may differ materially from the expectations expressed in the forward-looking statements or estimates if one or more of the assumptions and expectations prove to be incorrect or are not realized.”
6
List of Attachments
Attachment 1: Balance Sheet (BR GAAP) Attachment 2: Statement of Income (BR GAAP)
Attachment 3: Operating Indicators – Southern Region
Attachment 4: Operating Indicators – Northeastern Region
Attachment 5: Consolidated Operating Indicators – TIM Participações
Attachment 6: Glossary
7
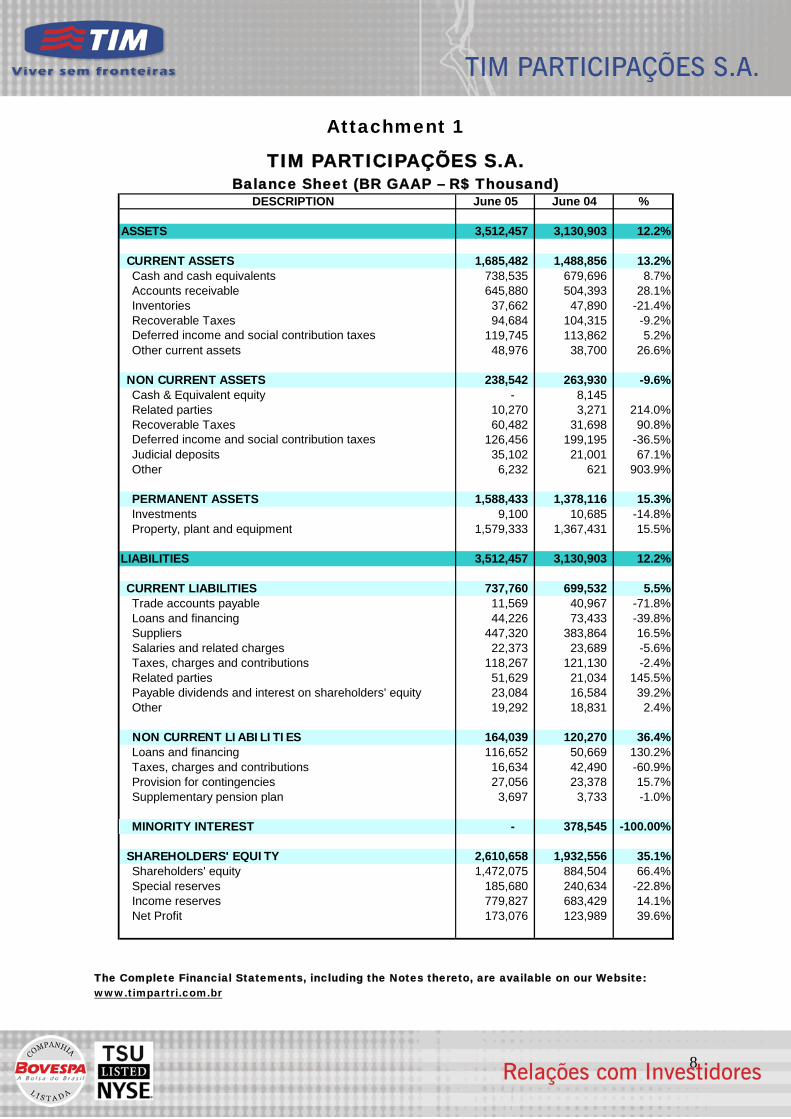
Attachment 1
TIM PARTICIPAÇÕES S.A. Balance Sheet (BR GAAP – R$ Thousand)
DESCRIPTION June 05 June 04 %
ASSETS 3,512,457 3,130,903 12.2%
CURRENT ASSETS 1,685,482 1,488,856 13.2%Cash and cash equivalents 738,535 679,696 8.7%Accounts receivable 645,880 504,393 28.1%Inventories 37,662 47,890 -21.4%Recoverable Taxes 94,684 104,315 -9.2%Deferred income and social contribution taxes 119,745 113,862 5.2%Other current assets 48,976 38,700 26.6%
NON CURRENT ASSETS 238,542 263,930 -9.6%Cash & Equivalent equity - 8,145 Related parties 10,270 3,271 214.0%Recoverable Taxes 60,482 31,698 90.8%Deferred income and social contribution taxes 126,456 199,195 -36.5%Judicial deposits 35,102 21,001 67.1%Other 6,232 621 903.9%
PERMANENT ASSETS 1,588,433 1,378,116 15.3%Investments 9,100 10,685 -14.8%Property, plant and equipment 1,579,333 1,367,431 15.5%
LIABILITIES 3,512,457 3,130,903 12.2%
CURRENT LIABILITIES 737,760 699,532 5.5%Trade accounts payable 11,569 40,967 -71.8%Loans and financing 44,226 73,433 -39.8%Suppliers 447,320 383,864 16.5%Salaries and related charges 22,373 23,689 -5.6%Taxes, charges and contributions 118,267 121,130 -2.4%Related parties 51,629 21,034 145.5%Payable dividends and interest on shareholders' equity 23,084 16,584 39.2%Other 19,292 18,831 2.4%
NON CURRENT LIABILITIES 164,039 120,270 36.4%Loans and financing 116,652 50,669 130.2%Taxes, charges and contributions 16,634 42,490 -60.9%Provision for contingencies 27,056 23,378 15.7%Supplementary pension plan 3,697 3,733 -1.0%
MINORITY INTEREST - 378,545 -100.00%
SHAREHOLDERS' EQUITY 2,610,658 1,932,556 35.1%Shareholders' equity 1,472,075 884,504 66.4%Special reserves 185,680 240,634 -22.8%Income reserves 779,827 683,429 14.1%Net Profit 173,076 123,989 39.6%
The Complete Financial Statements, including the Notes thereto, are available on our Website: www.timpartri.com.br
8
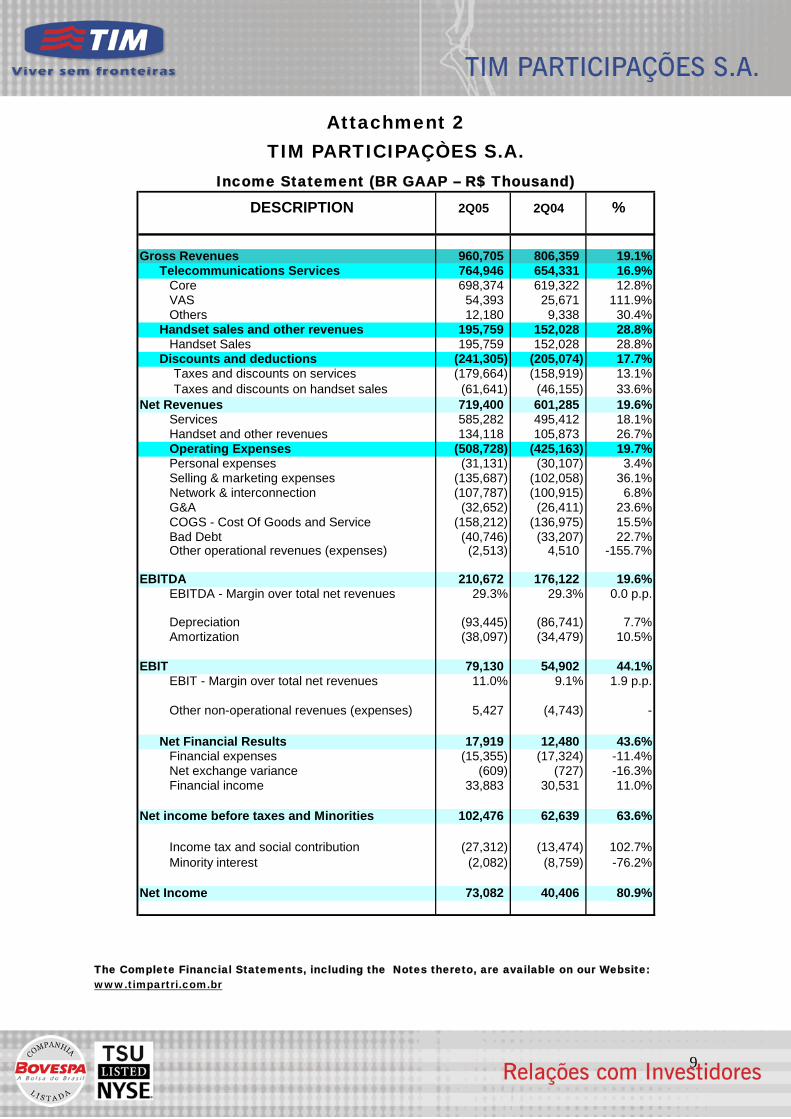
Attachment 2 TIM PARTICIPAÇÒES S.A.
Income Statement (BR GAAP – R$ Thousand) DESCRIPTION 2Q05 2Q04 %
Gross Revenues 960,705 806,359 19.1%Telecommunications Services 764,946 654,331 16.9%
Core 698,374 619,322 12.8%VAS 54,393 25,671 111.9%Others 12,180 9,338 30.4%
Handset sales and other revenues 195,759 152,028 28.8%Handset Sales 195,759 152,028 28.8%
Discounts and deductions (241,305) (205,074) 17.7%Taxes and discounts on services (179,664) (158,919) 13.1%Taxes and discounts on handset sales (61,641) (46,155) 33.6%
Net Revenues 719,400 601,285 19.6%Services 585,282 495,412 18.1%Handset and other revenues 134,118 105,873 26.7%Operating Expenses (508,728) (425,163) 19.7%Personal expenses (31,131) (30,107) 3.4%Selling & marketing expenses (135,687) (102,058) 36.1%Network & interconnection (107,787) (100,915) 6.8%G&A (32,652) (26,411) 23.6%COGS - Cost Of Goods and Service (158,212) (136,975) 15.5%Bad Debt (40,746) (33,207) 22.7%Other operational revenues (expenses) (2,513) 4,510 -155.7%
EBITDA 210,672 176,122 19.6%EBITDA - Margin over total net revenues 29.3% 29.3% 0.0 p.p.
Depreciation (93,445) (86,741) 7.7%Amortization (38,097) (34,479) 10.5%
EBIT 79,130 54,902 44.1%EBIT - Margin over total net revenues 11.0% 9.1% 1.9 p.p.
Other non-operational revenues (expenses) 5,427 (4,743) -
Net Financial Results 17,919 12,480 43.6%Financial expenses (15,355) (17,324) -11.4%Net exchange variance (609) (727) -16.3%Financial income 33,883 30,531 11.0%
Net income before taxes and Minorities 102,476 62,639 63.6%
Income tax and social contribution (27,312) (13,474) 102.7%Minority interest (2,082) (8,759) -76.2%
Net Income 73,082 40,406 80.9%
The Complete Financial Statements, including the Notes thereto, are available on our Website: www.timpartri.com.br
9
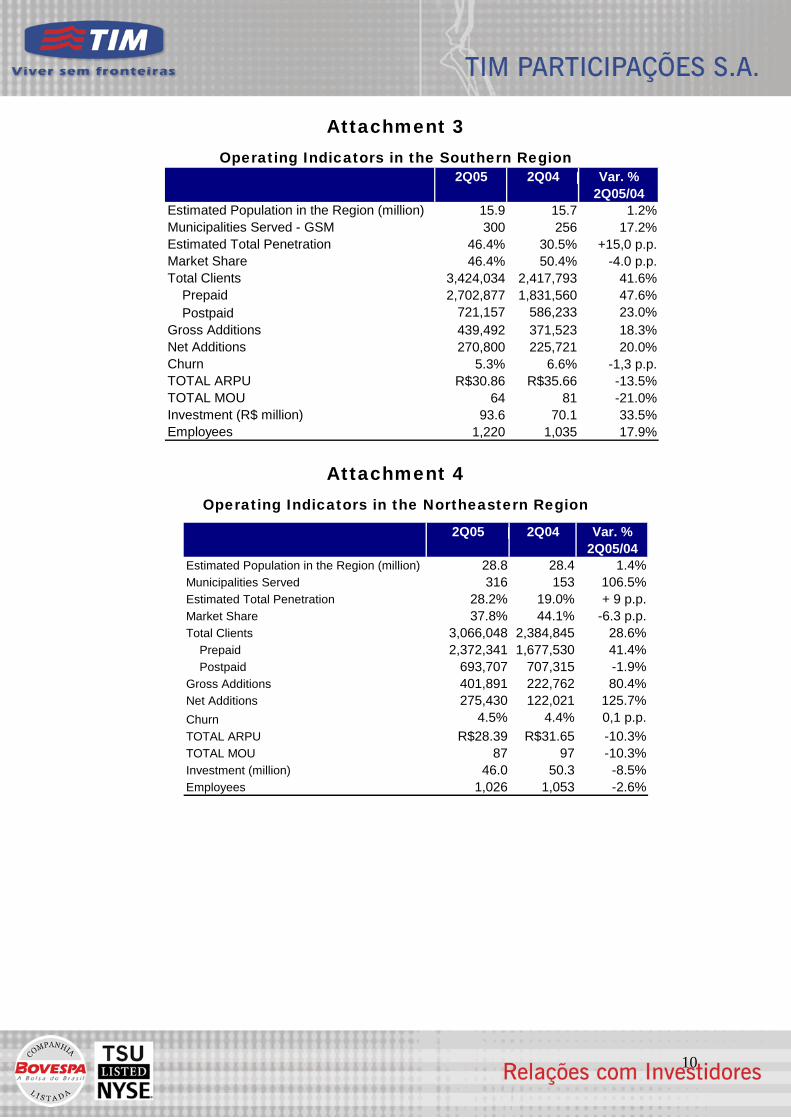
Attachment 3 Operating Indicators in the Southern Region
Var. %2Q05/04
Estimated Population in the Region (million) 15.9 15.7 1.2%Municipalities Served - GSM 300 256 17.2%Estimated Total Penetration 46.4% 30.5% +15,0 p.p.Market Share 46.4% 50.4% -4.0 p.p.Total Clients 3,424,034 2,417,793 41.6% Prepaid 2,702,877 1,831,560 47.6% Postpaid 721,157 586,233 23.0%Gross Additions 439,492 371,523 18.3%Net Additions 270,800 225,721 20.0%Churn 5.3% 6.6% -1,3 p.p.TOTAL ARPU R$30.86 R$35.66 -13.5%TOTAL MOU 64 81 -21.0%Investment (R$ million) 93.6 70.1 33.5%Employees 1,220 1,035 17.9%
2Q042Q05
Attachment 4 Operating Indicators in the Northeastern Region
Var. %2Q05/04
Estimated Population in the Region (million) 28.8 28.4 1.4%Municipalities Served 316 153 106.5%Estimated Total Penetration 28.2% 19.0% + 9 p.p.Market Share 37.8% 44.1% -6.3 p.p.Total Clients 3,066,048 2,384,845 28.6% Prepaid 2,372,341 1,677,530 41.4% Postpaid 693,707 707,315 -1.9%Gross Additions 401,891 222,762 80.4%Net Additions 275,430 122,021 125.7%Churn 4.5% 4.4% 0,1 p.p.TOTAL ARPU R$28.39 R$31.65 -10.3%TOTAL MOU 87 97 -10.3%Investment (million) 46.0 50.3 -8.5%Employees 1,026 1,053 -2.6%
2Q05 2Q04
10
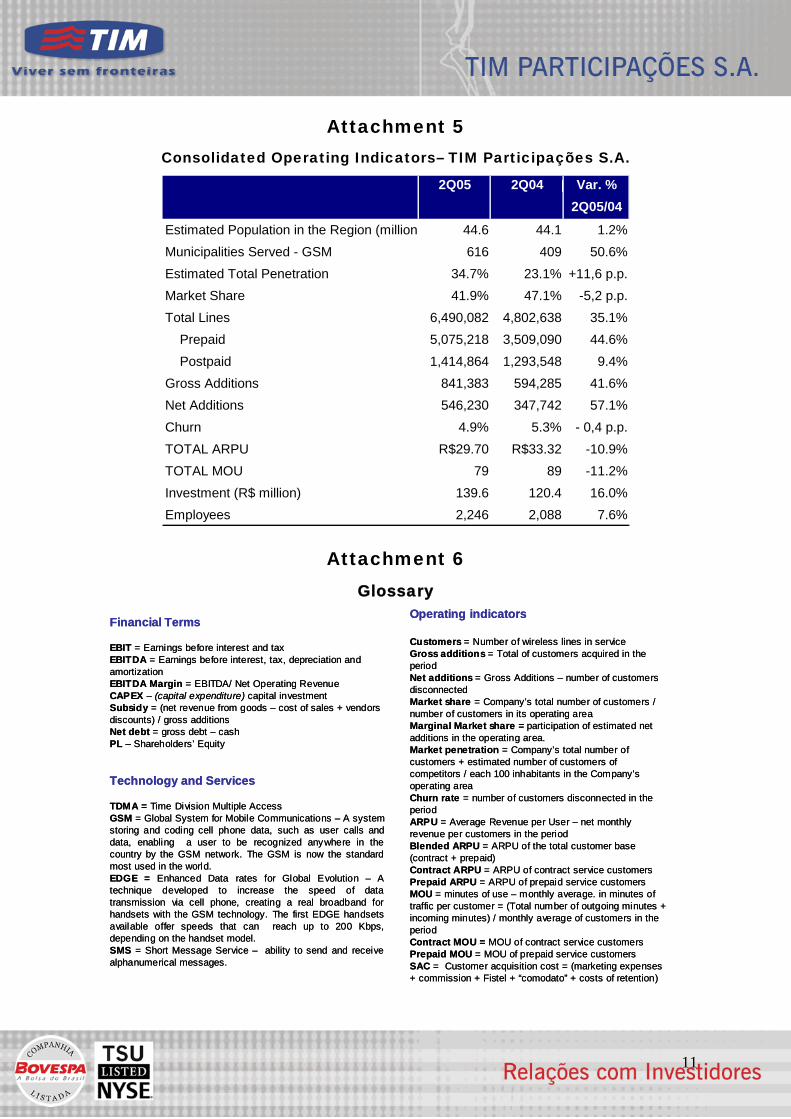
Attachment 5 Consolidated Operating Indicators– TIM Participações S.A.
Var. %2Q05/04
Estimated Population in the Region (million 44.6 44.1 1.2%Municipalities Served - GSM 616 409 50.6%Estimated Total Penetration 34.7% 23.1% +11,6 p.p.Market Share 41.9% 47.1% -5,2 p.p.Total Lines 6,490,082 4,802,638 35.1% Prepaid 5,075,218 3,509,090 44.6% Postpaid 1,414,864 1,293,548 9.4%Gross Additions 841,383 594,285 41.6%Net Additions 546,230 347,742 57.1%Churn 4.9% 5.3% - 0,4 p.p.TOTAL ARPU R$29.70 R$33.32 -10.9%TOTAL MOU 79 89 -11.2%Investment (R$ million) 139.6 120.4 16.0%Employees 2,246 2,088 7.6%
2Q042Q05
Attachment 6 Glossary
Financial Terms
EBIT = Earnings before interest and taxEBITDA = Earnings before interest, tax, depreciation and amortizationEBITDA Margin = EBITDA/ Net Operating RevenueCAPEX – (capital expenditure) capital investmentSubsidy = (net revenue from goods – cost of sales + vendors discounts) / gross additionsNet debt = gross debt – cashPL – Shareholders’ Equity
Technology and Services
TDMA = Time Division Multiple AccessGSM = Global System for Mobile Communications – A system storing and coding cell phone data, such as user calls and data, enabling a user to be recognized anywhere in the country by the GSM network. The GSM is now the standard most used in the world.EDGE = Enhanced Data rates for Global Evolution – A technique developed to increase the speed of data transmission via cell phone, creating a real broadband for handsets with the GSM technology. The first EDGE handsets available offer speeds that can reach up to 200 Kbps, depending on the handset model.SMS = Short Message Service – ability to send and receive alphanumerical messages.
Operating indicators
Customers = Number of wireless lines in serviceGross additions = Total of customers acquired in the periodNet additions = Gross Additions – number of customers disconnectedMarket share = Company’s total number of customers / number of customers in its operating areaMarginal Market share = participation of estimated net additions in the operating area.Market penetration = Company’s total number of customers + estimated number of customers of competitors / each 100 inhabitants in the Company’s operating areaChurn rate = number of customers disconnected in the periodARPU = Average Revenue per User – net monthly revenue per customers in the period Blended ARPU = ARPU of the total customer base (contract + prepaid)Contract ARPU = ARPU of contract service customersPrepaid ARPU = ARPU of prepaid service customersMOU = minutes of use – monthly average. in minutes of traffic per customer = (Total number of outgoing minutes + incoming minutes) / monthly average of customers in the periodContract MOU = MOU of contract service customersPrepaid MOU = MOU of prepaid service customersSAC = Customer acquisition cost = (marketing expenses + commission + Fistel + “comodato” + costs of retention)
11