PROSPECÇÃO POR ENZIMAS DA MICROBIOTA ...Dados Internacionais de Catalogação na Publicação...
125
UNIVERSIDADE ESTADUAL DE MARINGÁ CENTRO DE CIÊNCIAS AGRÁRIAS PROSPECÇÃO POR ENZIMAS DA MICROBIOTA RUMINAL CAPAZES DE AUMENTAR A CAPACIDADE ANTIOXIDANTE Autor: Thomer Durman Orientador: Dr. Geraldo Tadeu dos Santos Coorientadora: Drª. Sharon Ann Huws MARINGÁ Estado do Paraná Abril – 2018
Transcript of PROSPECÇÃO POR ENZIMAS DA MICROBIOTA ...Dados Internacionais de Catalogação na Publicação...

UNIVERSIDADE ESTADUAL DE MARINGÁ
CENTRO DE CIÊNCIAS AGRÁRIAS
PROSPECÇÃO POR ENZIMAS DA MICROBIOTA RUMINAL
CAPAZES DE AUMENTAR A CAPACIDADE ANTIOXIDANTE
Autor: Thomer Durman
Orientador: Dr. Geraldo Tadeu dos Santos
Coorientadora: Drª. Sharon Ann Huws
MARINGÁ
Estado do Paraná
Abril – 2018

UNIVERSIDADE ESTADUAL DE MARINGÁ
CENTRO DE CIÊNCIAS AGRÁRIAS
PROSPECÇÃO POR ENZIMAS DA MICROBIOTA RUMINAL
CAPAZES DE AUMENTAR A CAPACIDADE ANTIOXIDANTE (Prospecting enzymes from the rumen microbiota with the ability to
increase antioxidant capacity)
Autor: Thomer Durman
Orientador: Prof. Dr. Geraldo Tadeu dos Santos
Coorientadora: Drª. Sharon Ann Huws
MARINGÁ
Estado do Paraná
Abril – 2018
“Tese apresentada como parte das
exigências para obtenção do título de
DOUTOR EM ZOOTECNIA, no
Programa de Pós-Graduação em
Zootecnia da Universidade Estadual
de Maringá – Área de concentração
Produção Animal”

Dados Internacionais de Catalogação na Publicação (CIP)
(Biblioteca Central - UEM, Maringá, PR, Brasil)
Durman, Thomer
D963p Prospecção por enzimas da microbiota ruminal
capazes de aumentar a capacidade antioxidante /
Thomer Durman. -- Maringá, 2018.
104 f. : il. color., figs., tabs.
Orientador: Prof. Dr. Geraldo Tadeu dos Santos.
Coorientadora: Profa. Dra. Sharon Ann Huws.
Tese (doutorado) - Universidade Estadual de
Maringá, Centro de Ciências Agrárias, Programa de
Pós-Graduação em Zootecnia, 2018.
1. Rúmen. 2. Secoisolariciresinol diglicosídeo.
3. Linhaça. 4. Microbiota ruminal. I. Santos,
Geraldo Tadeu, orient. II. Huws, Sharon Ann,
coorient. III. Universidade Estadual de Maringá.
Centro de Ciências Agrárias. Programa de Pós-
Graduação em Zootecnia. IV. Título.
CDD 21.ed.636.2
ECSL-1202/9

ii
“In the field of observation, chance favors only the prepared mind”
Louis Pasteur
iii
Às pessoas que sempre depositaram
amor incondicional, coragem irrefutável,
força inenarrável, companheirismo inefável e sentido
na minha trajetória,
minha família e amigos
DEDICO

iv
AGRADECIMENTOS/ACKNOWLEDGMENTS
À Universidade Estadual de Maringá e Aberystwyth University, instituições que proporcionaram
excelente estrutura para desenvolvimento da pesquisa;
Ao Programa de Pós-Graduação em Zootecnia (PPZ/UEM) que me proporcionou todas as
oportunidades vivenciadas no período da pós-graduação;
À Coordenação de Aperfeiçoamento Pessoal de Nível Superior (CAPES) pela concessão de bolsa no
Brasil e de doutorado sanduíche no Reino Unido por meio do Projeto Pesquisador Visitante Especial
(PVE) - PROC. 88881.030408/2013-01/CAPES; CSF-PVE - 88887.115008/2015-00;
Ao Prof. Dr. Geraldo Tadeu dos Santos por depositar confiança no meu trabalho, por supervisionar e
amparar os projetos, e por todo crescimento profissional e pessoal que a orientação me proporcionou;
To Dr. Sharon Ann Huws, for allowing this great experience to take place in my life. For hosting me
and advising me during the whole project. For the irrefutable kindness and knowledge;
To Prof Dr. Paul Shaw for all the support to make this project possible;
To Dr. Barbara for all the patience in teaching me how to use lab equipment and read/understand
results;
To everyone involved in this project, from application to conclusion, especially Dr. Ana Schogor and
Dr. Rodolpho Martin Do Prado for the attention in advising me and sharing forms/data when I
needed the most; And to all lab mates helping me in all assays and top notch tea time breaks,
especially Dr. Linda, Dr. Lucy, and Cate Williams;
To all IBERS staff, students and friends that somehow helped me in the project and were part of all
the good times in Aberystwyth;
To the lab technicians, who were always willing to help, especially Pauline and Terry;
To Dr.Christopher Creevey and all the Bioinformatic team that helped a lot with data analysis,
essential to this project;
À Maithê, que sempre esteve disposta a ajudar quando precisei, por participar dos melhores
momentos e melhores memórias. Por ter sido essencial no desenvolvimento deste projeto, do início ao
fim. Por tudo, gratidão imensurável;

v
Ao corpo docente do Programa de Pós-Graduação em Zootecnia, pelos ensinamentos e por sempre
estarem dispostos a contribuir para o desenvolvimento dos trabalhos, em especial à Profª Drª Eliane
Gasparino, coordenadora do programa durante a execução do projeto, por não medir esforços na
confecção de documentação necessária para minha participação na pesquisa;
Aos colegas de programa, grupo NUPEL, amigos e todos aqueles que de alguma forma participam da
minha vida e que são essenciais para minha felicidade;
Aos membros da banca, que se dispuseram a contribuir para com o crescimento do trabalho;
À minha família, em especial Marcelo, Solânia e Liz Durman, peças vitais da minha felicidade e
combustível para seguir em frente, por todo apoio e amor irrefutável. Sou grato.

vi
BIOGRAFIA DO AUTOR
THOMER DURMAN, filho de Marcelo Humberto Durman e Solânia Durman, nasceu
em Beer-Sheva, Israel, no dia 08 de outubro de 1990.
Em dezembro de 2012, concluiu o curso de Medicina Veterinária pela Universidade
Estadual do Centro-Oeste do Paraná – UNICENTRO.
Em março de 2013, ingressou no Programa de Pós-Graduação em Zootecnia, nível de
Mestrado, área de concentração Produção Animal, na Universidade Estadual de Maringá.
março de 2015 submeteu-se à defesa da dissertação e recebeu título de Mestre em Produção
Animal pelo Programa de Pós-Graduação em Zootecnia da Universidade Estadual de
Maringá.
Em março de 2015 matriculou-se no doutorado em Produção Animal pelo Programa
de Pós-Graduação em Zootecnia da Universidade Estadual de Maringá. Em março de 2016
foi contemplado a participar de estágio de doutorado sanduíche na Aberystwyth University,
em Aberystwyth, País de Gales, Reino Unido, até março de 2017.
No dia 12 de abril de 2018 submeteu-se à banca de defesa de tese, requerimento para
obtenção do título de Doutor em Produção Animal pelo Programa de Pós-Graduação em
Zootecnia da Universidade Estadual de Maringá.

vii
ÍNDICE
Página
LISTA DE FIGURAS……………………………………………………………….... ix
LISTA DE TABELAS…………………………………………................................... xii
FIGURAS DO APÊNDICE…………........................................................................... xiv
LISTA DE ABREVIAÇÕES…………………………………………………………. xv
RESUMO……………………………………………………………………………... xvi
ABSTRACT…………………………………………………………………………... xvii
I LITERATURE REVIEW…………………………………………………………… 1
I.1 Reactive Oxygen Species (ROS) and oxidative stress………………………... 1
I.2 Effect of ROS on human health……………………………............................. 2
I.3 Reducing ROS through use of antioxidants…………………………………... 4
I.3.1 Enzymatic antioxidants as ROS scavengers……………………………….. 8
I.3.1.1 Superoxide dismutase…………………………………………………….. 9
I.3.1.2 Catalase……………………………………………………………………. 10
I.3.1.3 Glutathione peroxidase and Glutathione reductase…………………….... 11
I.3.2 Non-enzymatic antioxidants as ROS scavengers………………………...…. 12
I.3.2.1 Lignans and Flaxseed…………………………………………………… 13
I.4 Rumen…………………………………………………………………………. 18
I.4.1 Rumen microbiome…………………………………………………………. 18
I.4.2 Rumen microbiome contribution to the antioxidant content of
ruminant products……………………………………………………………………..
23
I.5 Rumen meta-omics……………………………………………………………. 29
I.5.1 Rumen plasmidome…………………………………………………………. 33

viii
I.5.2 Fosmid libraries……………………………………………………………... 34
I.6 REFERENCES……………………………………………………………………. 36
II GENERAL OBJECTIVES........................................................................................ 46
III. Assessing secoisolariciresinol diglucoside metabolism in the rumen by means of
a fosmid library………………………………………………………………………..
47
SUMMARY………………………………………………………………………. 47
INTRODUCTION………………………………………………………………... 48
RESULTS AND DISCUSSION………………………………………………….. 49
EXPERIMENTAL PROCEDURES……………………………………………… 59
REFERENCES…………………………………………………………………... 78
IV. Transcripts linked to secoisolariciresinol diglucoside metabolism in the rumen… 82
SUMMARY………………………………………………………………………. 82
INTRODUCTION………………………………………………………………... 82
RESULTS AND DISCUSSION………………………………………………….. 85
EXPERIMENTAL PROCEDURES……………………………………………… 88
REFERENCES…………………………………………………………………... 95
V. CONCLUSIONS...................................................................................................... 99
VI. APPENDICES……………………………………………………………………. 100
ix
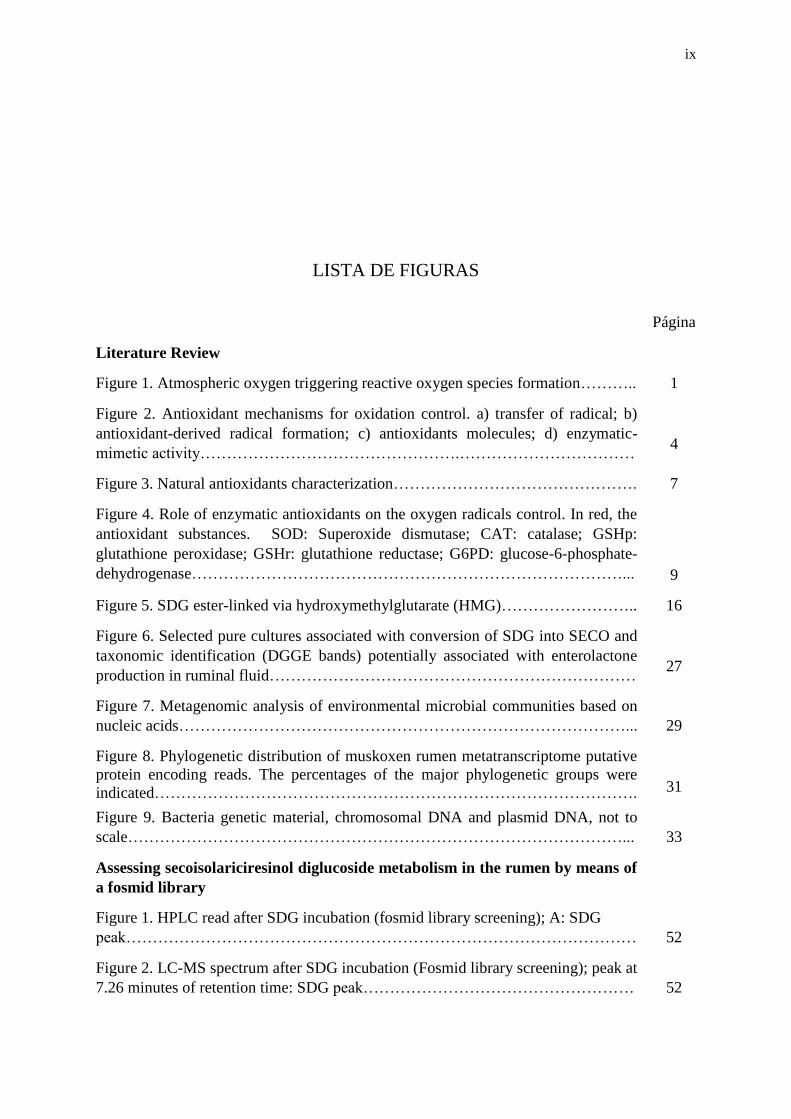
LISTA DE FIGURAS
Página
Literature Review
Figure 1. Atmospheric oxygen triggering reactive oxygen species formation……….. 1
Figure 2. Antioxidant mechanisms for oxidation control. a) transfer of radical; b)
antioxidant-derived radical formation; c) antioxidants molecules; d) enzymatic-
mimetic activity………………………………………….……………………………
4
Figure 3. Natural antioxidants characterization………………………………………. 7
Figure 4. Role of enzymatic antioxidants on the oxygen radicals control. In red, the
antioxidant substances. SOD: Superoxide dismutase; CAT: catalase; GSHp:
glutathione peroxidase; GSHr: glutathione reductase; G6PD: glucose-6-phosphate-
dehydrogenase………………………………………………………………………...
9
Figure 5. SDG ester-linked via hydroxymethylglutarate (HMG)…………………….. 16
Figure 6. Selected pure cultures associated with conversion of SDG into SECO and
taxonomic identification (DGGE bands) potentially associated with enterolactone
production in ruminal fluid……………………………………………………………
27
Figure 7. Metagenomic analysis of environmental microbial communities based on
nucleic acids…………………………………………………………………………...
29
Figure 8. Phylogenetic distribution of muskoxen rumen metatranscriptome putative
protein encoding reads. The percentages of the major phylogenetic groups were
indicated……………………………………………………………………………….
31
Figure 9. Bacteria genetic material, chromosomal DNA and plasmid DNA, not to
scale…………………………………………………………………………………...
33
Assessing secoisolariciresinol diglucoside metabolism in the rumen by means of
a fosmid library
Figure 1. HPLC read after SDG incubation (fosmid library screening); A: SDG
peak……………………………………………………………………………………
52
Figure 2. LC-MS spectrum after SDG incubation (Fosmid library screening); peak at
7.26 minutes of retention time: SDG peak……………………………………………
52

x
Figure 3. Fosmid library 8R4 clone genome (red bar bellow) aligned with E. coli
reference genome (above)…………………………………………………………….
54
Figure 4. Fosmid library 8R5 clone genome (red bar bellow) aligned with E. coli
reference genome (above)……………………………………………………………..
54
Figure 5. Fosmid library 14R1 clone genome (red bar bellow) aligned with E. coli
reference genome (above)…………………………………………………………….
54
Figure 6. Fosmid Library workflow………………………………………………..… 61
Figure 7. pCC1FOS™ Fosmid Vector Map……………………………………….… 62
Figure 8. Preparing insert of rumen bacteria DNA for Fosmid Library production….. 62
Figure 9. Fosmid Library Production overview; 1: fosmid vector and size-selected
plasmid DNA insertion + bacteriophages; 2:EPI300 + packaged bacteriophages; 3:
Clones grew in LB agar and chloramphenicol plates; 4: Picked clones in 384 – well
plate……………………………………………………………………………………
63
Figure 10. Fosmid Library organization (384 wells plate)…………………………… 63
Figure 11. DNA to be size-selected (Pooled DNA from treatments 10% and 15% of
flax meal (DM basis). Control DNA = 40 kb. Wells: 1: Size marker ladder; 2:
Control DNA; 3: Pooled DNA.……………………………………………………….
65
Figure 12. Shearing the insert size of the starting DNA sample…………………....... 65
Figure 13. LB + chloramphenicol agar plate with approximately 5,000 CFU of
packed EPI300 fosmid clones…………………………………………………………
67
Figure 14. Picking procedure for the infected fosmid clones into a 384-well plate….. 67
Figure 15. Fosmid clones average insert size (43,500 base pairs). First well
represents size ladder, all the following are plasmid DNA extracted from random
clones in the library…………………………………………………………………...
68
Figure 16. 384-well plate content printed on clear petri dish plate…………………... 70
Figure 17. SDG incubation: Fosmid clones pool + SDG + LB broth +
Chloramphenicol………………………………………………………………………
71
Figure 18. Sessions on selected 384-well plate; R1: Row A and B; R2: Row C and
D; R3: Row E and F; R4: Row G and H; R5: Row I and J; R6: Row K and L; R7: M
and N; R8: Row O and P……………………………………………………………...
71
Figure 19. Per base sequence quality of the 8R4, forward read……………………… 73
Figure 20. Per sequence quality score of the 8R4, forward read……………………... 74
Figure 21. Per base sequence content of 8R4, forward read…………………………. 75
Figure 22. Overrepresented sequences from 8R4, forward read……………………... 75

xi
Figure 23. Per base sequence quality of the 8R4, forward read, after trimming……... 76
Figure 24. Overrepresented sequences removal from 8R4, forward read……………. 77
Transcripts linked to secoisolariciresinol diglucoside metabolism in the rumen
Figure 1. 16S DNA band detected in the RNA sample before DNase treatment (left)
and 16S DNA band not detected in the RNA sample after the DNase treatment
(right) ). Wells: size ladder; 2: RC1H0; 3: RC2H0; 4: RC3H0; 5: RC1H6; 6:
RC2H6; 7: RC3H6; 8: RC1H24; 9: RC2H24; 10: RC3H24; 11: SRC1H6; 12:
SRC2H6; 13: SRC3H6; 14: SRC1H24; 15: SRC2H24; 16:
SRC3H24………………………………………………………………………...........
92
Figure 2. Per base sequence quality of the RC1H0, forward read……………………. 93
Figure 3. Per sequence quality score of the RC1H0, forward read…………………... 94
Figure 4. Per base sequence content of RC1H0, forward read……………………….. 94

xii
LISTA DE TABELAS
Página
Literature Review
Table 1. Oxidative stress implicating metabolic disorders………………………… 2
Table 2. Antioxidant reduction potential…………………………………………... 5
Table 3. Compilation of composition data in different flaxseed products………… 15
Table 4. Rumen ecosystem characteristics…………………………………………. 19
Table 5. Major rumen microbial community………………………………………. 20
Table 6. Rumen microbes identified by means of qPCR…………………………... 22
Table 7. Enzymes from different animal sources and their commercial application.. 32
Assessing secoisolariciresinol diglucoside metabolism in the rumen by means
of a fosmid library
Table 1. Whole plate (384 wells) SDG remaining after 24 hours 0.364 nM SDG
incubation…………………………………………………………………………….
50
Table 2. Sessions of selected plates (8 and 14) after 24 hours 0.364 nM SDG
incubation…………………………………………………………………………….
51
Table 3. Genes from reference genome that do not relate to fosmid clones………… 56
Table 4. Ingredients and chemical composition of experimental diets……………… 60
Table 5. End-repair of the insert DNA……………………………………………… 64
Table 6. Ligation reaction…………………………………………………………… 66
Transcripts linked to secoisolariciresinol diglucoside metabolism in the rumen
Table 1. Basic statistics for cDNA quality………………………………………….. 85

xiii
Table 2. Rumen metatranscriptome overrepresented sequences……………………. 86
Table 3. Anaerobic medium solutions for incubation……………………………….. 90
Table 4. Working conditions for anaerobic medium………………………………... 90
Table 5. Mixed culture RNA nucleic acid quantification…………………………… 91
xiv
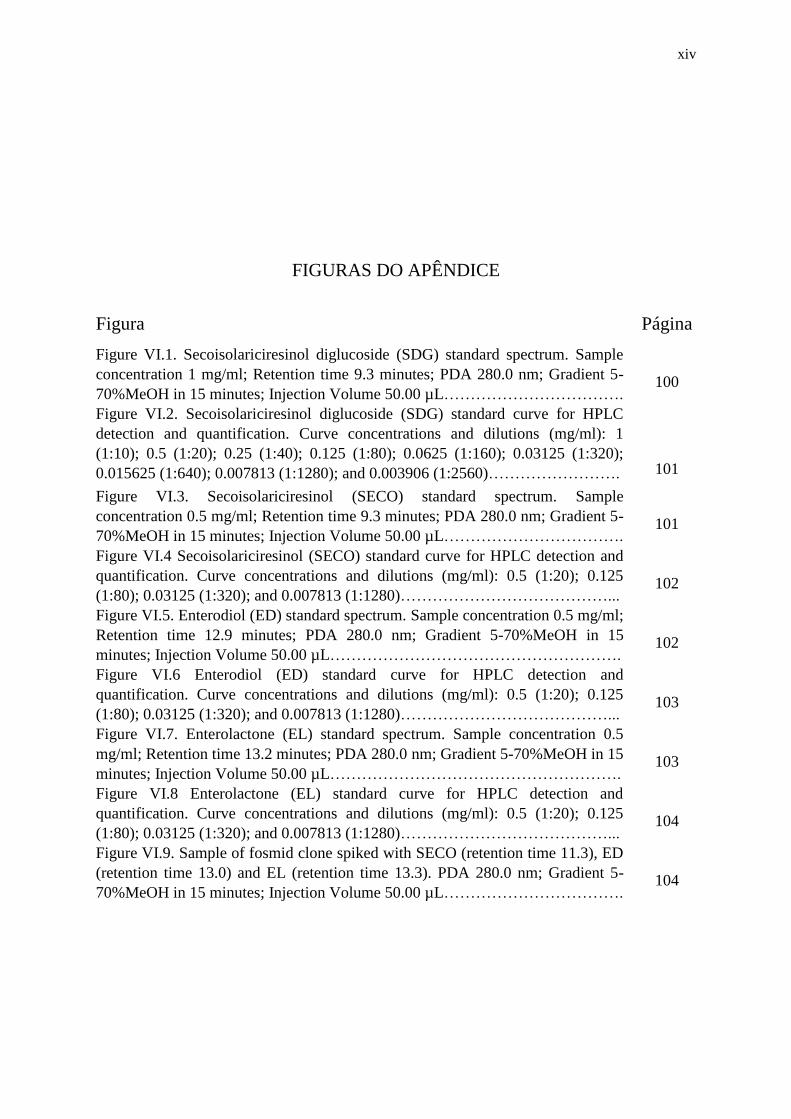
FIGURAS DO APÊNDICE
Figura Página
Figure VI.1. Secoisolariciresinol diglucoside (SDG) standard spectrum. Sample
concentration 1 mg/ml; Retention time 9.3 minutes; PDA 280.0 nm; Gradient 5-
70%MeOH in 15 minutes; Injection Volume 50.00 µL…………………………….
100
Figure VI.2. Secoisolariciresinol diglucoside (SDG) standard curve for HPLC
detection and quantification. Curve concentrations and dilutions (mg/ml): 1
(1:10); 0.5 (1:20); 0.25 (1:40); 0.125 (1:80); 0.0625 (1:160); 0.03125 (1:320);
0.015625 (1:640); 0.007813 (1:1280); and 0.003906 (1:2560)…………………….
101
Figure VI.3. Secoisolariciresinol (SECO) standard spectrum. Sample
concentration 0.5 mg/ml; Retention time 9.3 minutes; PDA 280.0 nm; Gradient 5-
70%MeOH in 15 minutes; Injection Volume 50.00 µL…………………………….
101
Figure VI.4 Secoisolariciresinol (SECO) standard curve for HPLC detection and
quantification. Curve concentrations and dilutions (mg/ml): 0.5 (1:20); 0.125
(1:80); 0.03125 (1:320); and 0.007813 (1:1280)…………………………………...
102
Figure VI.5. Enterodiol (ED) standard spectrum. Sample concentration 0.5 mg/ml;
Retention time 12.9 minutes; PDA 280.0 nm; Gradient 5-70%MeOH in 15
minutes; Injection Volume 50.00 µL……………………………………………….
102
Figure VI.6 Enterodiol (ED) standard curve for HPLC detection and
quantification. Curve concentrations and dilutions (mg/ml): 0.5 (1:20); 0.125
(1:80); 0.03125 (1:320); and 0.007813 (1:1280)…………………………………...
103
Figure VI.7. Enterolactone (EL) standard spectrum. Sample concentration 0.5
mg/ml; Retention time 13.2 minutes; PDA 280.0 nm; Gradient 5-70%MeOH in 15
minutes; Injection Volume 50.00 µL……………………………………………….
103
Figure VI.8 Enterolactone (EL) standard curve for HPLC detection and
quantification. Curve concentrations and dilutions (mg/ml): 0.5 (1:20); 0.125
(1:80); 0.03125 (1:320); and 0.007813 (1:1280)…………………………………...
104
Figure VI.9. Sample of fosmid clone spiked with SECO (retention time 11.3), ED
(retention time 13.0) and EL (retention time 13.3). PDA 280.0 nm; Gradient 5-
70%MeOH in 15 minutes; Injection Volume 50.00 µL…………………………….
104

xv
LISTA DE ABREVIAÇÕES A adenine
Aβ β-amyloid
ABCG2 ATP-binding cassete trasporter G2
ATP adenosine triphosphate
BLAST basic local alignment search tool
BHA butylated hydroxyanisole
BHT butylated hydroxytoluene
C cytosine
CAT catalase
cDNA complementary DNA
CFU colony forming units
DM dry matter
DNA deoxyribonucleic acid
DGGE denaturing gradient gel electrophoresis
ED enterodiol
EL enterolactone
FM flax meal
G guanine
GSSG glutathione disulphide
GSH glutathione
GSHp glutathione peroxidase
GSHr glutathione reductase
G6PD glucose-6-phosphate-dehydrogenase
HOCl hypochlorous acid
HPC high-performance computing
HMG hydroxymethylglutarate
HMGA hydroxymethyl glutaric acid
HPLC high-performance liquid chromatography
LC-MS liquid chromatograpgy-mass spectrometry
MPO neutrophil myeloperoxidase
NGS next-generation sequencing
NADPH nicotinamide adenine dinucleotide phosphate
ORFs open reading frames
PCR polymerase chain reaction
PUFA polyunsaturated fatty acids
ROS reactive oxygen species
RNA ribonucleic acid
SECO
SDEV
secoisolariciresinol
standard deviation
SDG secoisolariciresinol diglucoside
SOD enzyme superoxide dismutase
T thymine

xvi
RESUMO
A linhaça (Linum usitatissimum) é amplamente estudada por seu valor nutricional
excepcional e benefícios dos seus compostos na saúde humana e animal. Dentre eles, as
lignanas podem ser destacadas, capazes de afetar positivamente a capacidade antioxidante do
consumidor. Ainda, são capazes de serem transferidas aos produtos de origem animal,
promovendo benefícios à saúde de quem os consome; seus efeitos estão ligados ao controle
eficiente da oxidação, com papel principal na prevenção de diversas doenças, como doenças
cardiovasculares, diabetes, vários tipos de câncer, dentre outras. O rúmen é
comprovadamente um ambiente eficiente no metabolismo de lignanas vegetais, convertendo-
as à enterolignanas, as quais possuem capacidade antioxidante potencializada, sendo superior
a boa parte dos antioxidantes já conhecidos, como a vitamina E. Entretanto, uma porção
pequena das espécies ruminais pode ser cultivada em condições de laboratório, limitando os
estudos da biologia de diversas espécies. Portanto, o uso de técnicas metagenômicas para
prospecção por enzimas no rúmen é crucial para o avanço no conhecimento na área de
microbiologia do rúmen. Desta forma, foi proposto estudar os genes ligados ao metabolismo
de lignanas da linhaça. Ainda, se estudou a capacidade de degradação de lignanas vegetais e
seus produtos da degradação. Para alcançar os objetivos deste estudo foram realizados dois
ensaios experimentais. Primeiramente, foi preparada uma biblioteca metagenômica de 11.500
clones, com inserções de DNA de microrganismos ruminais alocadas em Escherichia coli
hospedeiras. Em seguida, foi realizada a análise genômica dos clones com atividade positiva
(144 clones) para degradação de secoisolariciresinol diglicosídeo, a qual foi avaliada frente à
análise por cromatografia. Ainda, um metatranscriptoma de microrganismos ruminais gerado
a partir de incubações de líquido ruminal com ou sem adição de secoisolariciresinol
diglicosídeo, a fim de estudar os transcritos e possíveis genes envolvidos com a degradação

xvii
da lignana vegetal. Como conclusão, não foram identificados produtos da degradação de
secoisolariciresinol diglicosídeo (enterodiol e enterolactona), bem como possíveis genes
envolvidos na degradação de lignanas vegetais nos clones positivos da biblioteca, o que
sugere que as inserções de DNA bacteriano ruminal não continham informações genômicas
que codificassem para enzimas capazes de aumentar a capacidade de degradação do
composto, ou que o método de análise adotado não foi eficiente na recuperação dos genes.
Em adição, o metatranscriptoma revelou sequências super-representadas que podem revelar
genes diferencialmente expressos da microbiota ruminal quando em contato com
secoisolariciresinol diglicosídeo.
Palavras-chave: rúmen, secoisolariciresinol diglicosídeo, metatranscriptoma, linhaça,
microbiota ruminal

xviii
ABSTRACT
The flaxseed (Linum usitatissimum) is widely studied by its exceptional nutritional value and
benefits of its compounds on animal and human health. Among them, the lignans can be
highlighted, capable to affect effectively the antioxidant capacity of the consumer, as well as
being able to be transferred to animal products, which can provide health benefits to the
consumer. It effects are linked to the effective oxidative stress control, with main role in the
prevention of many diseases, such as cardiovascular diseases, diabetes, many types of cancer,
and others. The rumen is proven to be an efficient environment to the metabolism of plant
lignans, converting them to enterolignans, which have their antioxidant capacity enhanced,
being higher than great part of the well-known antioxidants, such as vitamin E. However, just
a little portion of all rumen microorganisms can be cultivated in laboratory conditions,
limiting the studies of many rumen species and their biology. Therefore, the use of
metagenomic techniques for rumen prospection is crucial for the knowledge advance on the
rumen microbiota field. Thus, it was proposed in this project, to assess the genes linked to
flaxseed lignans metabolism. As well as, it was explored the capacity of flaxseed lignans
breakdown and its degradation products. In order to achieve the aims of the study two
experimental assays were carried out. Firstly, a metagenomic library, with rumen microbes
DNA insertions allocated in Escherichia coli host bacteria was prepared, followed by genome
analysis of clones with positive activity on secoisolariciresinol diglucoside breakdown,
assessed by chromatography analysis. Secondly, a metatranscriptome of rumen microbes,
based on rumen fluid incubations with and without secoisolariciresinol diglucoside was
studied regarding the transcripts and putative genes linked to the plant lignan breakdown. As
conclusion, it was not identified secoisolariciresinol diglucoside breakdown products, as well
as putative genes linked to plant lignans breakdown in positive clones of the library. This
suggests that the rumen bacteria DNA inserts did not contain genomic information that codes

xix
to enzymes capable of enhancing the compound breakdown capacity, or the analysis method
was not effective on the gene recovery. In addition, the metatranscriptome showed
overrepresented sequences which can reveal differentialy expressed genes from the rumen
microbiota when in contact with secoisolariciresiniol diglucoside.
Key-words: rumen, secoisolariciresinol diglucoside, metatranscriptome, flaxseed, rumen
microbiota

I LITERATURE REVIEW
I.1 Reactive Oxygen Species (ROS) and oxidative stress
Reactive Oxygen Species (ROS) are essential for many processes in the cell, such as
programmed cell death, which is crucial for both plant and animal tissue development and
homeostasis of cells (Kerr et al., 1972). However, ROS can be dangerous when there is an
imbalance between their production and their inhibition, delay or removal. The substances
capable of tackling oxidative damage can do it by direct scavenging ROS or indirect acting
up-regulating antioxidant defences (Halliwell, 2007; Khlebnikov et al., 2007).
The mitochondria are essential cellular organelles that have the prevailing role of
producing adenosine triphosphate (ATP) and metabolic regulation through cellular
respiration. However, this vital function fosters ROS formation as an unavoidable by-product
of the process (Donald et al., 2006). This process can be increased in case of oxidative
stressed mitochondria, leading to a drop in ATP production and higher induction of
programmed cell death (Levine et al., 1994; Levine et al., 1996; Tiwari et al., 2002).
According to Mittler (2002), the chemical reaction is triggered by atmospheric oxygen (O2),
forming singlet oxygen (O21) by O2 excitation or by electrons transfer forming superoxide
radical (O2∙-), hydrogen peroxide (H2O2) or a hydroxyl radical (HO
-) (Figure 1).
Figure 1. Atmospheric oxygen triggering reactive oxygen species formation.
Source: The author

2
I.2 Effect of ROS on human health
Free radicals are linked to the aging and cellular degenerative process and are
associated with several metabolic disorders (Table 1), such as cancer, cardiovascular disease,
immune-system decline, brain dysfunction, endocrine functions, cataracts and others (Ames
et al., 1993; Christen, 2000; Hitchon and El-Gabalawy, 2004; Vincent et al., 2004; Nunomura
et al., 2006; Wood-Kaczmar et al., 2006; Carreau et al., 2008). Therefore, in order to prolong
animal and human life expectancy and improve quality of life, understanding of free radicals,
oxidation process and antioxidants must keep advancing.
Table 1. Oxidative stress implicating metabolic disorders
Disorder ROS implication Reference
Alzheimer’s disease Oxidation of Nerve cells Christen (2000); Nunomura et al. (2006); Gella
and Durany (2009); Deibel et al. (1996);
Manczak et al. (2006); Wang et al. (2014)
Atherosclerosis Oxidation of endothelial cells, activation of matrix
metalloproteinases, altered vasomotor activity
Harrison et al. (2003);Rajendran et al. (2014)
Cancer Somatic mutations and neoplastic transformation Fang et al. (2009); Reuter et al. (2010)
Cardiovascular disease Drop in production of nitric oxide by endothelial cells Münzel et al. (2010)
Cataracts Oxidation of lens cells Spector (1995)
Huntington’s disease Oxidative phosphorylation in occipital cortex Jenkins et al. (1993)
Immune-system decline Oxidation of Immune system cells De la Fuente, 2002
Parkinson’s disease Oxidation of Dopaminergic neurons Wood-Kaczmar et al. (2006); Nakabeppu et al.
(2007); Pope et al. (2008); Brown and Neher
(2010); Nikolova (2012); Hwang (2013)
Pulmonary disease Increase in lung concentrations of elastase Repine et al. (1997)
Rheumatoid arthritis Autoimmune phenomena in Rheumatoid synovitis Vasanthi et al. (2009); Stamp et al. (2012)
Stroke Neuronal death Alexandrova et al. (2004)
Type 2 Diabetes Induced development of insulin resistance Urakawa et al. (2003); Vincent et al. (2004)
Oxidative stress can lead to several diseases linked to cellular degenerative process,
which might be delayed if the oxidation balance is controlled. For instance, the Alzheimer’s
disease, an age-related neurodegeneration causing progressive dementia, which might be
delayed if antioxidant defence mechanism slows down radical production of ROS (Gella and
Durany, 2009). Neurons have a high oxygen demand and a prominent metabolic rate;

3
moreover, the neuronal components as lipids, protein and nucleic acids can be oxidized due
to mitochondrial dysfunction, increased metal levels, inflammation, or β-amyloid (Aβ)
peptides (Deibel et al., 1996; Manczak et al., 2006; Wang et al., 2014). In addition, the brain
cells are susceptible to lipid oxidation (due to large amount of polyunsaturated fatty acids)
and have low levels of glutathione, a potent antioxidant (Pocernich and Butterfield, 2012;
Skoumalová and Hort, 2012). These factors, when put together, make the human brain very
vulnerable to oxidative stress. Thus, studies aiming to enhance the antioxidant defence
mechanism can be the most effective solution to prevent Alzheimer’s disease (Chen and
Zhong, 2014).
Parkinson’s disease is another progressive neurodegenerative disorder, which is
related to the demise of neurons in the midbrain area and it affects normal movements due to
resting tremor, muscular rigidity, brasykinesia, and postural imbalance. The pathological
mechanism can have idiopathic or genetic explanations but the cause is most likely linked to
oxidative stress as well (Hwang, 2013). The disease affects the nigral region of the human
brain, resulting in selective loss of dopaminergic neurons, followed by modifications that
compromise cell integrity. Moreover, mitochondrial dysfunction is also one possible cause of
disorder, since apoptosis that can be triggered by peroxidation of cardiolipin (mitochondrial
lipid) and by cytochrome c being released to the cytosol. Furthermore, neuroinflammatory
responses can be responsible for nitric oxide and superoxide production, free radicals, which
role is to remove cell debris and pathogens, however, unusual response can potentially cause
imbalance on cellular oxidation (Nakabeppu et al., 2007; Pope et al., 2008; Brown and Neher,
2010). The multifactorial etiology of the neurodegenerative movement disorder challenges
the ability to treat it; however, oxidative control seems to be a valid target to keep aiming
towards it (Nikolova, 2012).
Other diseases incidences can be controlled by oxidation regulation, such as
rheumatoid arthritis and many different cancers. The first one is a chronic and systemic
disease, where cells of immune system release pro-inflammatory mediators, which can cause
cartilage and bone damage in case of inordinate responses. The autoimmune phenomena
rheumatoid synovitis can be triggered by oxidant stress (Vasanthi et al., 2009; Stamp et al.,
2012). In a similar stressed microenvironment, where ROS are being generated progressively,
cell structure and functions was affected, inducing somatic mutations and neoplastic
transformation which leads to genome instability and cell proliferation, characterizing the
cancer etiology (Fang et al., 2009; Reuter et al., 2010).
4
Oxidative stress is a potential trigger and aggravates several diseases with different
etiology. Indeed, in human and animal health, studies aiming to increase antioxidant capacity,
in order to maintain a favourable balance between ROS production and antioxidant defence
mechanisms, are an effective tool for preventing a wide range of metabolic disorders and
hence, improving expectancy and quality of life.
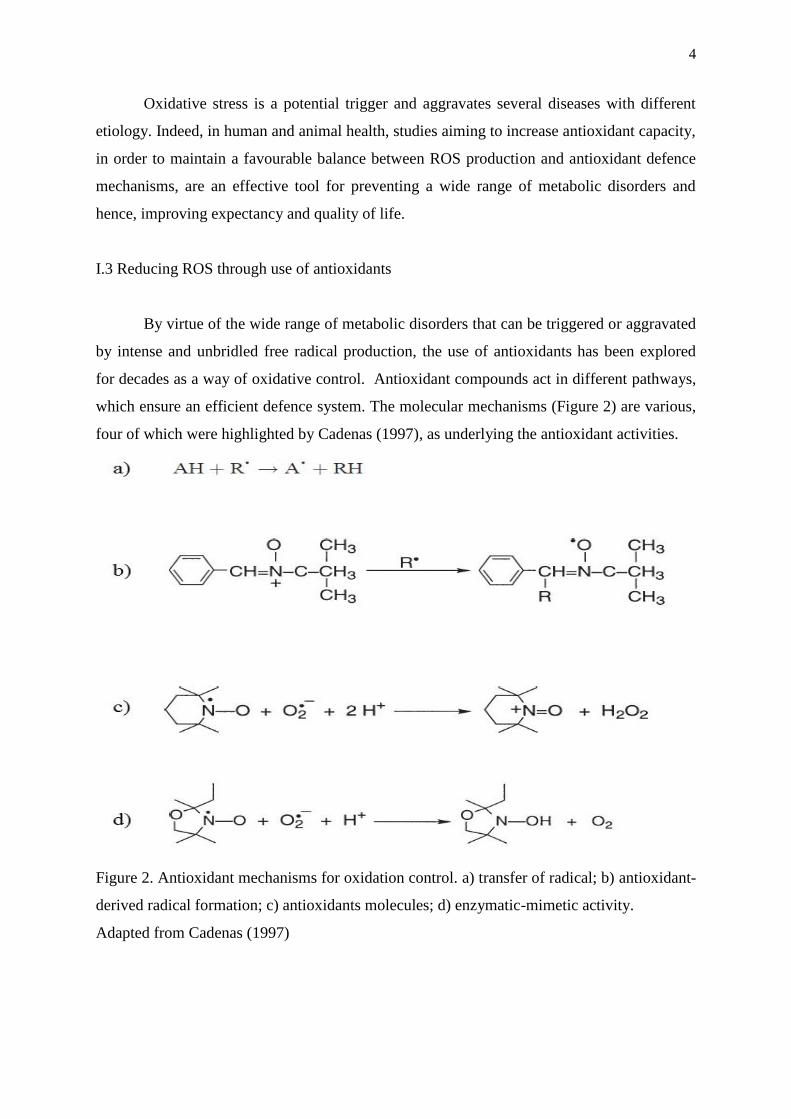
I.3 Reducing ROS through use of antioxidants
By virtue of the wide range of metabolic disorders that can be triggered or aggravated
by intense and unbridled free radical production, the use of antioxidants has been explored
for decades as a way of oxidative control. Antioxidant compounds act in different pathways,
which ensure an efficient defence system. The molecular mechanisms (Figure 2) are various,
four of which were highlighted by Cadenas (1997), as underlying the antioxidant activities.
Figure 2. Antioxidant mechanisms for oxidation control. a) transfer of radical; b) antioxidant-
derived radical formation; c) antioxidants molecules; d) enzymatic-mimetic activity.
Adapted from Cadenas (1997)
5
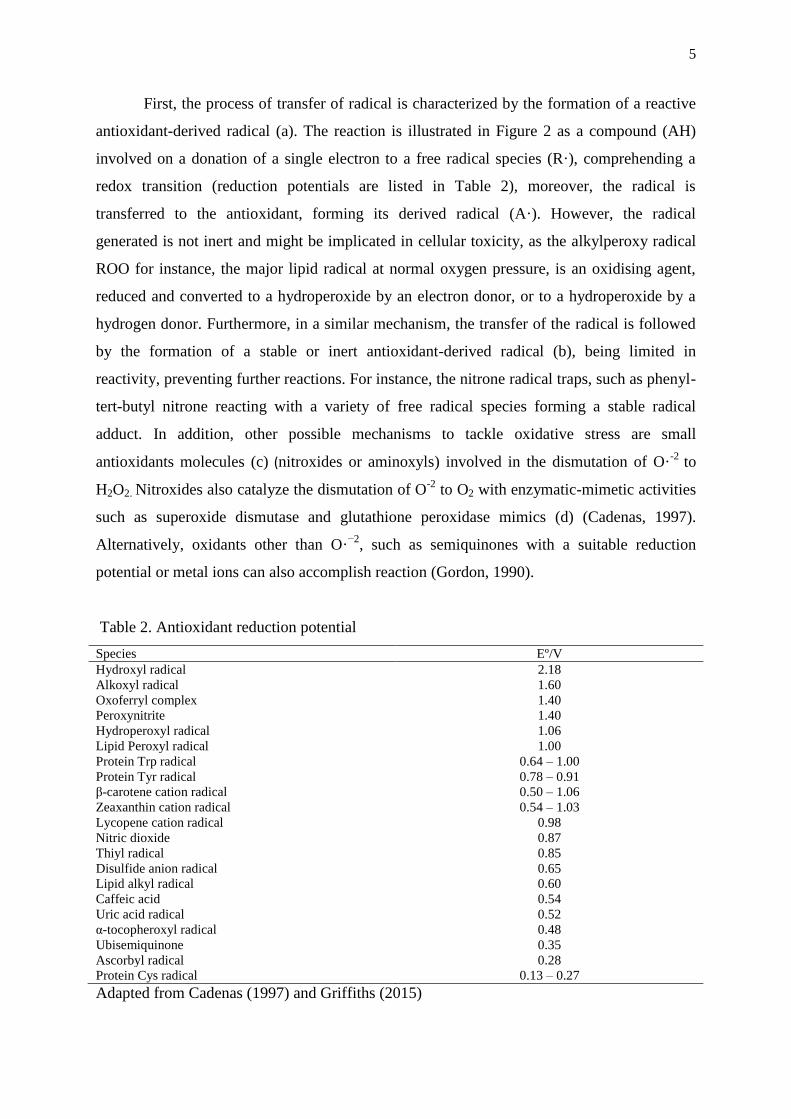
First, the process of transfer of radical is characterized by the formation of a reactive
antioxidant-derived radical (a). The reaction is illustrated in Figure 2 as a compound (AH)
involved on a donation of a single electron to a free radical species (R·), comprehending a
redox transition (reduction potentials are listed in Table 2), moreover, the radical is
transferred to the antioxidant, forming its derived radical (A·). However, the radical
generated is not inert and might be implicated in cellular toxicity, as the alkylperoxy radical
ROO for instance, the major lipid radical at normal oxygen pressure, is an oxidising agent,
reduced and converted to a hydroperoxide by an electron donor, or to a hydroperoxide by a
hydrogen donor. Furthermore, in a similar mechanism, the transfer of the radical is followed
by the formation of a stable or inert antioxidant-derived radical (b), being limited in
reactivity, preventing further reactions. For instance, the nitrone radical traps, such as phenyl-
tert-butyl nitrone reacting with a variety of free radical species forming a stable radical
adduct. In addition, other possible mechanisms to tackle oxidative stress are small
antioxidants molecules (c) (nitroxides or aminoxyls) involved in the dismutation of O·-2
to
H2O2. Nitroxides also catalyze the dismutation of O-2
to O2 with enzymatic-mimetic activities
such as superoxide dismutase and glutathione peroxidase mimics (d) (Cadenas, 1997).
Alternatively, oxidants other than O·−2
, such as semiquinones with a suitable reduction
potential or metal ions can also accomplish reaction (Gordon, 1990).
Table 2. Antioxidant reduction potential
Species Eº/V
Hydroxyl radical 2.18
Alkoxyl radical 1.60
Oxoferryl complex 1.40
Peroxynitrite 1.40
Hydroperoxyl radical 1.06
Lipid Peroxyl radical 1.00
Protein Trp radical 0.64 – 1.00
Protein Tyr radical 0.78 – 0.91
β-carotene cation radical 0.50 – 1.06
Zeaxanthin cation radical 0.54 – 1.03
Lycopene cation radical 0.98
Nitric dioxide 0.87
Thiyl radical 0.85
Disulfide anion radical 0.65
Lipid alkyl radical 0.60
Caffeic acid 0.54
Uric acid radical 0.52
α-tocopheroxyl radical 0.48
Ubisemiquinone 0.35
Ascorbyl radical 0.28
Protein Cys radical 0.13 – 0.27
Adapted from Cadenas (1997) and Griffiths (2015)

6
The oxidation defence mechanism can be diverse, where antioxidant substances
(Figure 3) can act in different pathways, directly or indirectly, in order to repress damage
caused by the products of aerobic metabolism. Most of the antioxidants can be found in
nature, some produced by the organism itself (endogenous antioxidants), others can be
obtained by dietary sources (exogenous antioxidants), and the intake of antioxidant rich foods
is essential to boost the defensive system against ROS. Moreover, antioxidants such as BHT
(butylated hydroxytoluene) and BHA (butylated hydroxyanisole) can be synthetically
developed and incorporated into food to prevent oxidation, especially fatty acids (Sen et al.,
2010; Carocho and Ferreira, 2013).
Antioxidants can be grouped according to their composition or function. The two
major clusters are enzymatic and non-enzymatic antioxidants, with enzymic antioxidants
being substances endogenously produced and most of the non-enzymatic antioxidants being
exogenous substances. The levels of both types of antioxidants is dependent on the dietary
intake, with some exceptions as metabolic antioxidants such as coenzyme Q10, vitamin A,
glutathione, uric acid and enterolignans (enterodiol and enterolactone), produced in the
gastrointestinal tract.
With respect to antioxidant activity, the mechanisms are diverse, for instance:
inhibiting free radical oxidation or the formation of lipid radicals; as chain breaking
antioxidants, interruption autoxidation chain reaction; supressing singlet oxygen; as oxygen
scavenger and reducing agents; chelating metals; and inhibiting pro-oxidative enzymes.
Moreover, antioxidants might present multiple functions (Gordon, 1990; Carocho and
Ferreira, 2013). Thus, antioxidant analyses are complex to be evaluated separately,
considering that, possible synergic interactions might occur.
The two main groups of antioxidants (enzymatic and non-enzymatic) also have
subdivisions dependent on their characteristics. The enzymatic antioxidants are divided into
primary defence (glutathione peroxidase, catalase and superoxide dismutase), which are
responsible for preventing the formation or neutralizing free radicals, and secondary defence
antioxidants such as glutathione reductase and glucose-6-phosphate dehydrogenase, which do
not neutralize free radicals directly, but have supporting roles in recycling and regenerating
other endogenous antioxidants. They are therefore essential for the continuity of the defence
mechanisms. On the other hand, the non-enzymatic antioxidants are divided in several
groups, mainly, regarding their composition (Rahman, 2007).

7
Figure 3. Natural antioxidants characterization. Adapted from Jacob (1995); Sen et al. (2010); Touré and Xueming (2010); Carocho and Ferreira (2013).
8
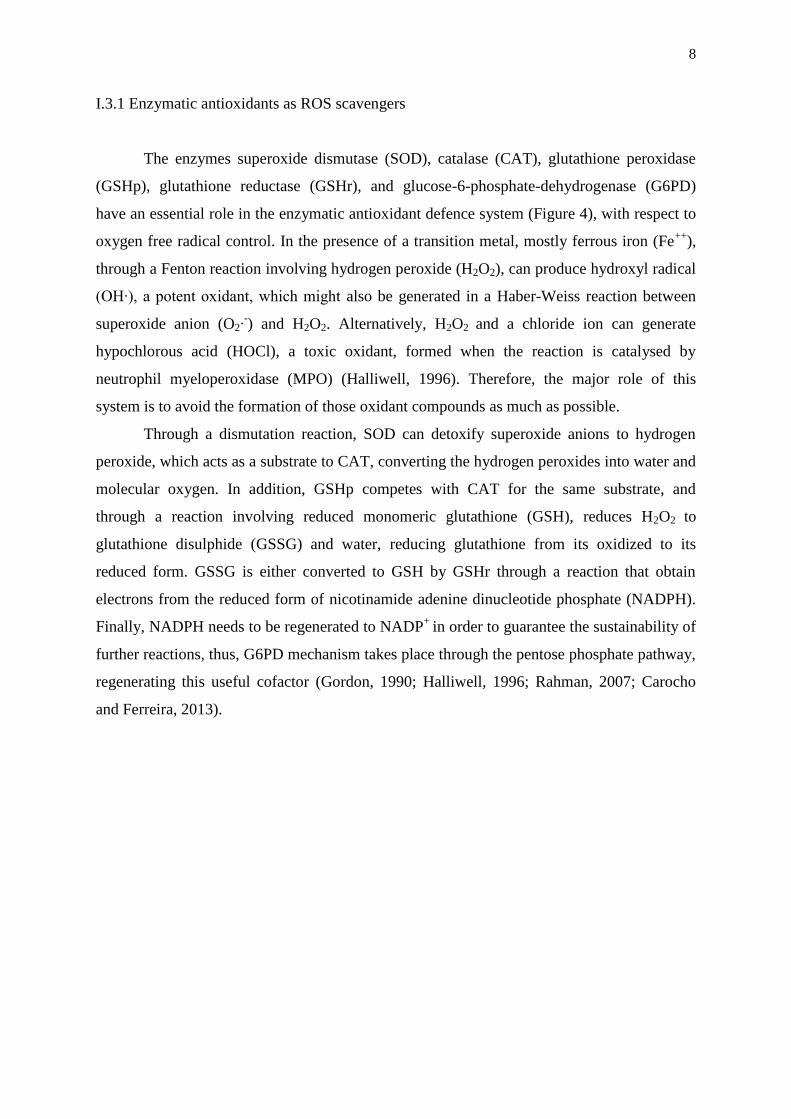
I.3.1 Enzymatic antioxidants as ROS scavengers
The enzymes superoxide dismutase (SOD), catalase (CAT), glutathione peroxidase
(GSHp), glutathione reductase (GSHr), and glucose-6-phosphate-dehydrogenase (G6PD)
have an essential role in the enzymatic antioxidant defence system (Figure 4), with respect to
oxygen free radical control. In the presence of a transition metal, mostly ferrous iron (Fe++
),
through a Fenton reaction involving hydrogen peroxide (H2O2), can produce hydroxyl radical
(OH∙), a potent oxidant, which might also be generated in a Haber-Weiss reaction between
superoxide anion (O2∙-) and H2O2. Alternatively, H2O2 and a chloride ion can generate
hypochlorous acid (HOCl), a toxic oxidant, formed when the reaction is catalysed by
neutrophil myeloperoxidase (MPO) (Halliwell, 1996). Therefore, the major role of this
system is to avoid the formation of those oxidant compounds as much as possible.
Through a dismutation reaction, SOD can detoxify superoxide anions to hydrogen
peroxide, which acts as a substrate to CAT, converting the hydrogen peroxides into water and
molecular oxygen. In addition, GSHp competes with CAT for the same substrate, and
through a reaction involving reduced monomeric glutathione (GSH), reduces H2O2 to
glutathione disulphide (GSSG) and water, reducing glutathione from its oxidized to its
reduced form. GSSG is either converted to GSH by GSHr through a reaction that obtain
electrons from the reduced form of nicotinamide adenine dinucleotide phosphate (NADPH).
Finally, NADPH needs to be regenerated to NADP+
in order to guarantee the sustainability of
further reactions, thus, G6PD mechanism takes place through the pentose phosphate pathway,
regenerating this useful cofactor (Gordon, 1990; Halliwell, 1996; Rahman, 2007; Carocho
and Ferreira, 2013).

9
Figure 4. Role of enzymatic antioxidants on the oxygen radicals control. In red, the
antioxidant substances. SOD: Superoxide dismutase; CAT: catalase; GSHp: glutathione
peroxidase; GSHr: glutathione reductase; G6PD: glucose-6-phosphate-dehydrogenase.
Adapted from Repine et al. (1997); Carocho and Ferreira (2013).
I.3.1.1 Superoxide dismutase
The knowledge surrounding SOD have evolved in the past 50 years since its
discovery by McCord and Fridovich in the 1960’s, and its purification from bovine
erythrocytes (McCord and Fridovich, 1969). Moreover, in the 1980’s, the studies regarding
the comprehension of the role of superoxide dismutase in basic biology of cells and tissues
metabolism began to take firm hold. Furthermore, the development of molecular biology
techniques in the 90’s allowed a new field to broaden knowledge. Since then, the studies
regarding determining the enzyme’s kinetics and mechanisms, as well as the adverse
oxidative reactions showed an exponential growth on the comprehension of redox biology
(Buettner, 2011).
Through conversion of superoxide anions into dioxygen and hydrogen peroxide, SOD
is known as one of the most effective intracellular enzymatic antioxidant (Rahman, 2007).
According to Landis and Tower (2005), there are three forms of this enzyme: Cu/Zn-SOD in
the cytoplasm and outer mitochondrial space; Mn-SOD in the inner mitochondrial space; and
Cu/Zn-SOD present in extracellular space. The different isoforms vary in nature of active
metal centre, amino acid composition, co-factors, molecular weight, chemical structure,
compounds affinity, and other features (Fridovich, 1995; Rahman, 2007).

10
The necessity to detoxify O2∙- in the compartment of origin explains the distinct forms
of SODs in the cytosol. The superoxide anion should not easily cross biological membranes,
with the exception of those rich in anion channels. However, O2- might also be originated in
the extracellular compartment, for instance, due to ultraviolet irradiation of water (Fridovich,
1995). Therefore, in order to guarantee an efficient ROS control, particularly superoxide
anion radicals, SODs must be present in intra and extracellular compartments.
According to Matés et al. (1999), CuZn-SOD has two subunits with a molecular
weight of 32 kDa, containing a dinuclear metal cluster (copper and zinc ions) as active site,
which is correlated with a signature motif related shared between CuZn-SOD genes (Landis
and Tower, 2005). On the other hand, Mn-SOD, has an unrelated active site, and is a complex
made up of four identical subunits, containing one manganese atom per subunit, exclusively
of the mitochondrial spaces. The molecular weight is 96 kDa, and it cycles in a two-step
dismutation of superoxide. Finally, SOD of extracellular compartment, is a tetrameric
secretary glycoprotein, containing copper and zinc and having high affinity for specific
glycosaminoglycans, however, the regulation in mammalian tissues occurs primarily
coordinated by cytokines, rather than oxidative stress response (Matés et al., 1999; Landis
and Tower, 2005; Rahman, 2007).
I.3.1.2 Catalase
Catalase, an intracellular enzyme, is present in both animals and plants, mostly in
aerobic cells, in mammalian and non-mammalian, with a few exceptions. In 1900, Loew first
reported the presence of CAT in plant and animal’s cells. Moreover, the purification of a
haemoglobin-free erythrocyte catalase was reported more than a century ago by Wolff and
De Stoecklin in 1910, and the activity has been intensively studied since then (Deisseroth and
Dounce, 1970; Kirkman and Gaetani, 2007). The genomic analysis tools have also allowed
novel perspectives of research regarding CAT regulatory mechanisms, such as gene
polymorphisms and mutations (Góth et al., 2016).
The enzyme catalase has a great turnover, allowing just one molecule to convert six
billion molecules of hydrogen peroxide into water and molecular oxygen (Carocho and
Ferreira, 2013). Mammalian CAT is formed from four monomers, and which, contains an
iron heme (porphyrin) group bond to the catalytic site. The subunits of CAT have four
domains: non-globular amino terminal arm; anti-parallel β barrel; exterior wrapping domain;
and a final α-helix structure (Góth et al., 2004). In addition, the H2O2 selectivity is aid by

11
non-polar pocket with narrow hydrophobic channels, and also provide protection to the heme
group (Day, 2009).
I.3.1.3 Glutathione peroxidase and glutathione reductase
Discovered in 1957 by Gordon C. Mills, glutathione peroxide catalyses the reduction
of hydrogen peroxide or organic hydroperoxides to water or corresponding alcohols. The
enzyme is involved besides the H2O2 removal, in the metabolism of lipid peroxides (Wendel,
1980). Moreover, there are two forms of GSHp, one selenium-dependent, which acts in
association with GSH (H2O2 reduction) and the other one, is selenium-independent, which is
active only with organic hydroperoxides (Matés et al., 1999). Regarding the evolutionary
rates, the complex relationship of this gene family suggest that basal GSHp classes, have
originated from gene duplication, gene losses, lateral gene transfer among invertebrates and
vertebrates or plants, or other independent evolutionary event (Margis et al., 2008).
The secondary enzymatic system acts indirectly on the ROS scavenging, and is
essential to maintain the constancy of the antioxidant defence system. For instance, GSHr,
which occurs in both prokaryotic and eukaryotic organisms, and belongs to the family of
NADPH-dependent oxidoreductase. This enzyme is located in chloroplasts, cytosol, and
mitochondria (Edwards et al., 1990), being important for maintaining the reduced pool of
GSH trough mechanisms cited above. Considering it importance, genetically engineered
plants for overexpressing of selected GSH and GSHr genes have been developed as a strategy
for improving performance (Gill et al., 2013).
Furthermore, playing an important role in keeping the constant flow of NAPH
available to the antioxidant defence system and production of ribose-5-phosphate, the enzyme
G6PD is essential for a cellular reduced environment (Yoshida and Beutler, 1986). In
addition, because of lack of mitochondria in erythrocytes, G6PD is the only source of
NADPH in red blood cells (Luzzatto L, 2001), therefore, a deficiency in this enzyme can lead
to several dysfunctions. Indeed, at least 400 million people worldwide carry the gene for
G6PD deficiency, thus, even 85 years since the discovery of the enzyme by Warburg and
Christian in 1931, it is important to keep advancing knowledge in this enzymatic pathway
(Yoshida and Beutler, 1986; Cappellini and Fiorelli, 2008).

12
I.3.2 Non-enzymatic antioxidants as ROS scavengers
The animal body is not self-sufficient in antioxidant compounds, with a dependency
on dietary antioxidants to complete the defence system against the oxidation process. In
humans for instance, during the evolution process, uric acid replaced the ascorbic acid as the
main biological fluids’ water-soluble antioxidant. Thus, humans lack the endogenous ability
to synthesize ascorbic acid, even having an expressive requirement (Nishikimi and Yagi,
1991). Therefore, the needs for ascorbic acid (vitamin C), as well as most of non-enzymatic
antioxidants (vitamin E, thiols carotenoids, polyphenols, flavonoids, etc.) can only be met
depending on the intake of dietary sources of antioxidants, mostly plants, rather than animal
origin foods. (Ratnam et al., 2006; Rahman, 2007; Sikora et al., 2008).
The mechanisms of the non-enzymatic compounds against ROS and oxidation
implications are diverse. Vitamin E (α-tocopherol), which is strongly connected with the
prevention of cancer and degenerative diseases, has a main role on lipid peroxidation control,
by the donation of a labile hydrogen to a lipid or lipid peroxyl radical. This compound might
be synergic to vitamin C (ascorbic acid), which is connected with several antioxidants
pathways and largely used in canned or bottled products for its oxygen scavenging activity.
Also, regenerating α-tocopherol from α-tocopherol radicals in membranes and
lipoproteins, as well as increasing intracellular glutathione level, thiol antioxidants as
tripeptide glutathione, are a multifunctional intracellular antioxidant, with important role in
ROS scavenging as described before. In addition to the group, carotenoids are plants
pigments containing double bonds which ease delocalizing unpaired electrons and physical
quenching of singlet oxygen, being lycopene the most effective compound. Those
compounds also are responsible to prevent lipophilic compartments by scavenging peroxyl
radical. Furthermore, flavonoids are other plant component capable of scavenging peroxyl
radicals, inhibiting lipid peroxidation, and chelating redox-active metals, preventing the
Fenton reaction (H2O2 producing OH∙). Finally, minerals such as selenium and zinc also play
an expressive role in the antioxidant defensive system and being intensively studied overtime.
The bioactivity of selenium is connected with GSHp, metalloenzymes and thioredoxin
reductase, playing a role similar to vitamin E. Zinc is also important in many pathways,
inhibiting NADPH oxidases, inducing the production of metallothionein (H2O2 scavenger),
competing with copper for binding to the cell (reducing H2O2 production), and is present in
the enzyme SOD, an important enzyme as discussed previously. Many others compounds and
substances with antioxidant activity have been studied overtime, however, facing the great

13
impact in animals and human health much effort should still be given to advance the
knowledge in the field (Gordon, 1990; Knekt et al., 1994; Halliwell, 1996; Ratnam et al.,
2006; Rahman, 2007; Sikora et al., 2008; Carocho and Ferreira, 2013).
The plant components are crucial for defence against oxidative stress and the activity
remains after intake, thus, benefiting the animal who consumed it. Antioxidant
supplementation is possible, although, might not be as effective as a complex diet rich in
those components (vegetables, fruits and herbs), which contains a mix of several antioxidants
that works as a continuous chain, whilst the supplementation might not enable completely the
antioxidant chain, since it is usually given using one or two substances (Mittler, 2002; Sen et
al., 2010; Rafieian-Kopaei et al., 2013).
Therefore, it is important to change our feeding behaviour in order to enhance the
amount of antioxidants being consumed. Although, according to Halliwell (2012), provided
one is not deficient in vitamins, the endogenous synthesis of antioxidant defences is far more
important than benefits from larger intakes of vitamins, carotenoids, flavonoids, etc.
Consequently, agents that challenge our defence system and enhance endogenous antioxidant
defences, and other protective systems may end up being more protective against oxidative
damage in cells and tissues than the intake of large amounts of vitamins. Thus, it is relevant
to not only evaluate the effects of antioxidant compounds separately, but also assess the
physiological interactions and real impact in health.
I.3.2.1 Lignans and flaxseed
Lignans, non-enzymatic antioxidants, can be found in many plants, such as flaxseed (the
richest source), pumpkin, sunflower, poppy, sesame, rye, oats, barley, wheat, beans, berries,
and vegetables (Meagher and Beecher, 2000; Adlercreutz, 2007).
Lignans, such as secoisolariciresinol diglucoside (SDG), enterodiol (ED) and
enterolactone (EL), have been proven to be effective at lowering lipid peroxidation in
different media systems (Kitts et al., 1999; Matumoto-Pintro et al., 2011). In addition, both
mammalian lignans (ED and EL) show great efficacy in reducing deoxyribose oxidation and
DNA strand breakage, as well as, none SDG, ED or EL demonstrate indirect prooxidant
activity in Fenton reagents (Kitts et al., 1999). Indeed, the lignans are a powerful ROS
scavenger. The hydroxyl radical (OH∙) scavenging activity of SDG, ED and EL at the
concentration of 10µM for non-site-specific is 4.20, 58.53, 60.83% respectively. Moreover,

14
for the same flax lignans, the site-specific scavenging activity is 6.74, 23.45, 31.93%
respectively (Kitts et al., 1999).
The metabolism of lignans might vary according to the host studied; therefore,
unreproducible results might complicate comparison between species. For instance, 7-
hydroxymatairesinol is metabolized to 7-hydroxyenterolactone in humans rather to
enterolactone as reported to happen in rats (Heinonen et al., 2001). The differences in
intestinal microflora might explain the different paths in lignans metabolism between species.
In addition, differences in structure or even mild variance in composition might lead to
completely different pathways. For example, isolariciresinol (C20H24O6), which is not
metabolized to enterolactone or enterodiol as secoisolariciresinol (C20H26O6) is. The possible
explanation is the rigid fused ring structure protecting the lignan from reactions (Heinonen et
al., 2001).
Linum usitatissimum, the Latin name of the flaxseed, which means “very useful”, has
been proven to have an accurate nomenclature. Firstly, being one of the oldest cultivated
plants, it was applied to produce fibre for clothing, and currently employed for several
products as linen production, linoleum, stain, paints and others. In addition, widely studied
for it outstanding nutritional value and benefit of its compounds in animals and human health,
preventing many diseases (Muir and Westcott, 2003; Adolphe et al., 2010; Goyal et al.,
2014).
Flaxseed composition (Table 3) is high in ω-3 fatty acid: α-linolenic acid, short chain
polyunsaturated fatty acids, soluble and insoluble fibres, proteins, as well as, is a rich source
of antioxidants, as the phytoestrogenic lignans (e.g. SDG) (Choo et al., 2007; Goyal et al.,
2014). Although, the composition might change according to the flaxseed maturity stage, as
described by Herchi et al. (2014), showing difference in composition when comparing
immature, half-mature, pre-mature, and mature flaxseeds (7, 21, 42 and 56 age days
respectively). In addition, there are several extraction methods being used, as well as results
expressed in diverse units of measure. The lack of standardization on analysis complicates
accurate comparisons.

15
Table 3. Compilation of composition data in different Flaxseed Products.
Item Flaxseed products
Hull Oil Flaxseed
Meal
Dry matter (g/100g) 93.64 n.e n.e
Total carbohydrate (g/100g) 100 n.e 29
Dietary fibre (g/100g) n.e 28.0
Neutral detergent fibre (g/100g) 19.4 n.e 25.6
Acid detergent fibre 14.3 n.e 17.7
Energy (kcal/100g) 460.90 n.e n.e
Crude protein (g/100g) 17.21–23.5 n.e 20-36.3
Albumin (g/100g) 1.40 n.e n.e
Globulin (g/100g) 0.54 n.e n.e
Prolamin (g/100g) 0.22 n.e n.e
Glutelin (g/100g) 0.35 n.e n.e
Fatty acids (g/100g) 20.32-29.8 n.e 41
C16:0 (Palmitic acid) 7.761 4.90-8
2 2.1
2
C18:0 (Stearic acid) 3.951 2.24-4.
59
2 1.3
2
C18:1 (Oleic acid) 20.541 13.44-19.39
2 7.3
2
C18:2 (Linoleic acid) 17.701 12.25-17.44
2 5.9
2
C18:3 (α-Linolenic acid) 48.951 39.90-60.42
2 22.8-23.0
2
∑ PUFA (%GC area) 66.65 n.e n.e
Ω3/ Ω6 (% GC area) 2.76 n.e n.e
Lignans (mg/100g) n.e n.e 35-70
SDG 0.991 / 32.0
3 n.e 6.1-30
4
SECO (g/100g) n.e n.e 0.3699
Ascorbic acid (mg/100g) n.e n.e 0.50
Thiamin (mg/100g) n.e n.e 0.53
Riboflavin (mg/100g) n.e n.e 0.23
Niacin (mg/100g) n.e n.e 3.21
Pyridoxin (mg/100g) n.e n.e 0.61
Pantothenic acid (mg/100g) n.e n.e 0.57
Folic acid (mg/100g) n.e n.e 112.0
Biotin (mg/100g) n.e n.e 6.0
α-Tocopherol (mg/100g) n.e n.e 7.0
δ-Tocopherol (mg/100g) n.e n.e 10.0
γ-Tocopherol (mg/100g) n.e n.e 552.0
Ash (g/100g) 2.37 n.e n.e
Calcium (mg/100g) n.e n.e 236.0
Copper (mg/100g) n.e n.e 1.0
Magnesium (mg/100g) n.e n.e 431.0
Manganese (mg/100g) n.e n.e 3.0
Phosphorus (mg/100g) n.e n.e 622.0
Potassium (mg/100g) n.e n.e 831.0
Sodium (mg/100g) n.e n.e 27.0
Zinc (mg/100g) n.e n.e 4.0 SDG: secoisolariciresinol diglucoside; SECO: secoisolariciresinol; PUFA: Polyunsaturated fatty acids
1: % GC area; 2: g/100g; 3: mg/g; 4: nmol/mg; n.e: not evaluated
Adapted from Johnsson et al. (2000); Raffaelli et al. (2002); Muir and Westcott (2003); Côrtes et al. (2008); Côrtes et al.
(2012); Bernacchia et al. (2014); Goyal et al. (2014); Herchi et al. (2014); Lima et al. (2016).

16
A wide variety of lignans might be found in the outer layer (hull) of the flaxseed:
secoisolariciresinol diglucoside (SDG); secoisolariciresinol (SECO); isolariciresinol;
pinoresinol; and matairesinol, and all of these compounds except isolariciresinol could be
enterediol (ED) and enterolactone (EL) precursors (Heinonen et al., 2001). SDG is the main
phytoestrogen of flaxseed, and the concentration will differ depending on the flax produt (9-
30 mg/g of defatted flax meal; 6.1-13.3 mg/g in whole flaxseeds) (Meagher et al., 1999;
Johnsson et al., 2000; Muir and Westcott, 2003; Côrtes et al., 2008).
As a complex, the flax lignans are connected with hydroxymethylglutarate (HMG).
SDG, for instance, is linked to this complex by the glucose, through an ester bond (Figure 5).
This lignan might not be readily hydrolysed by β-glucosidase, however, β-glucuronidase can
readily cleave the sugars, as well as being capable to hydrolyse mammalian lignan conjugates
and positively correlate with plant lignan intake and urinary excretion of ED and EL.
Although, the results concerning the activity of this enzyme are inconstant and remains
unclear if β-glucuronidase is capable of releasing significant amounts of SECO and which
sources of enzyme activity is responsible for it release from flaxseed (Jenab and Thompson,
1996; Muir and Westcott, 2003).
Figure 5. SDG ester-linked via hydroxymethylglutarate (HMG) SDG: secoisolariciresinol diglucoside; Glu: glucose
Source: The author
Despite of all nutritional benefits of flax products consumption, there are some
nutritional compounds present in flaxseed reported as negatively influence in health, as
cyanogenic glycosides and linatine, antiopyridoxine factors. However, those substances
might be in a risky level considering a daily basis of intake in other foods containing those
compounds, but not in flaxseed (Touré and Xueming, 2010).
The enterolignans (ED and EL) are not present in plant material and need to be
converted (Figure 6) by the microbial community within the host that is consuming the
compounds. The conversion of plant SDG into mammalian lignans in humans is described by
the following catalytic reactions: Firstly, SDG passes through a process of O-deglycosylation
forming SECO. The next process is O-demethylation, which form the intermediate metabolic
2,3-bis(3,4-dihydroxybenzyl)-butane-1,4 diol. Moreover, a dihydroxylation process takes

17
place, converting the compound into the enterolignan ED, which in finally converted to EL
after a dehydrogenation of the molecule (Wang et al., 2000b; Clavel et al., 2006).
In humans, most of the biological activities of SDG depend upon bacterial
transformations occurring in the colon, since dietary plant lignans reaches the colon poorly
digested. The first step of the transformation is dependent of gut microbiota, being the
removal of the glucose moieties from SDG performed by strains producing β-glucosidases
(Quartieri et al., 2016).
The health beneficial effects of the flax intake have been shown with respect to
prevention of many diseases, such as cardiovascular disorders (coronary heart disease and
cardiovascular disease), diabetes, several types of cancer and others. Since the first isolation
of ED and EL, increasing research efforts have been focussed on understanding their
mechanisms of action, especially in humans and rat. (Wang, 2002; Peterson et al., 2010).
Buck et al. (2010), used meta-analyses based on 24 publications to assess the association
between lignans and breast cancer risk. They observed that high plant-lignan intake was
associated with a risk decrease for breast cancer. The mechanism of action of phytoestrogens
in protection against breast cancer is linked to the attraction of the lignans to estrogen
receptors, a hormone which is associated to cellular proliferation, resulting in reduced
hormone activity in the presence of antioxidants (Carreau et al., 2008). However, overall,
lignans were not significantly inversely linked with breast cancer risk. The effect of lignans
on tumour development, regarding estrogen receptors, remains unclear. In summary,
consumption of flaxseed and it products are positively associated with reduced breast cancer
risk, especially in postmenopausal women (Buck et al., 2010; Lowcock et al., 2013).
Although, further studies concerning possible interactions with diverse variation factors
might be necessary to explain inconsistence results.
In another review regarding the beneficial effects of flaxseed consumption in animals
and human health, Adolphe et al. (2010), observed the same issues concerning comparison
between results with different hosts. Animal studies using rat, mice and rabbit models
showed that SDG supplementation offers protection against the development of chronic
diseases such as cardiovascular diseases, cancer, and diabetes. However, the outcomes of
these studies are variable depending on gender, age and host species. Therefore, direct
correlations cannot be made between different species regarding the health effects. In
addition, it was recently shown that, the phytoestrogen SDG might also have radioprotective
properties, as shown by Velalopoulou et al. (2015) in murine lung cells, as SDG
demonstrated capability of preventing DNA damage and enhancing the antioxidant capacity

18
of normal lung cells. Indeed, the health effects of lignans are gradually increasing, and
therefore, more studies concerning the intake of antioxidants must be carried out.
I.4 Rumen
I.4.1 Rumen microbiome
The ruminants’ competitive advantages over other species on feed digestibility can be
widely explained by their ability to digest fibre materials, not because they are efficient in
digesting fibre, but rather because they are efficient in hosting a wide range of
microorganisms that can do it for them and provide the degradation products (eg. volatile
fatty acids) for absorption (Russell et al., 1992).
The rumen metabolism has been explored for more than 100 years (Lindsay, 2006),
however, its population diversity and microbial ecosystem was first studied only in the 1950s
by Robert Hungate, one of the pioneers on rumen microbiology studies. By means of the
anaerobic culture techniques developed, anaerobic ecosystems such as the rumen could then
be assessed (Puniya et al., 2015).
Although all advances in material and methods to grow rumen microbes, most of the
species (>90%) are yet to be cultured (Flint et al., 2008; Kim et al., 2011). This is due to the
unique conditions found in the rumen (Table 4), and once the microbial community (Table 5)
is adapted to the physical conditions and nutrients available in the rumen, growing the
microbes in in vitro conditions is both a challenge and opportunity to advance the knowledge
on their biology.
Many rumen microbial populations can gain or lose dominance in the rumen
depending on the composition of the diet (Stiverson et al., 2011; Carberry et al., 2012; Huws
et al., 2012); (Friedman et al., 2017), age (Jami et al., 2013), host animal breed (King et al.,
2011), host animal species (Qi et al., 2011; Baraka, 2012) (eg. muskoxen rumen), feed
efficiency (Jami et al., 2014; Shabat et al., 2016), and other factors. However, a core
microbiome can be found across individuals within a wide geographical range (Jami and
Mizrahi, 2012; Henderson et al., 2015).

19
Table 4. Rumen ecosystem characteristics
Physical properties
Dry matter 10 - 18%
Osmolarity 250 - 350 mOsmol/Kg-1
pH 5.5 - 6.9
Redox potential -350 to -400 mV
Temperature 38 - 41ºC
Chemical properties
Amino acids and oligopeptides <1 mmol L-1
(2 - 3h post feeding)
Ammonia 2-12 mmol L-1
Dietary (cellulose, hemicelluloses, pectin) component Always present
Endogenous (mucopolysaccharides) Always present
Growth factors Branched-chain fatty acids, long-chain
fatty acids, purines, pyrimidines
Lignin Always present
Minerals Always present
Non-volatile acids Lactate <10mmol L-1
Soluble carbohydrates <1mmol L-1
(2 - 3h post feeding)
Trace elements/vitamins Always present; high B vitamins
Acetate 60-90 mmol L-1
Propionate 15-30 mmol L-1
Butyrate 10-25 mmol L-1
Branched chain and higher 2-5 mmol L-1
CO2 65%
CH4 27%
N2 7%
O2 0.6%
H2 0.2%
H2S 0.1%
CO 0.1%
Microbiological properties
Bacteria (40-50% of microbial mass) 109-11
g-1
(>300 species)
Ciliate protozoa (40-50% of microbial mass) 104-6
g-1
(25 genera, 40 species)
Anaerobic fungi (3-4% of microbial mass) 103-5
g-1
(6 genera, 30 species)
Archaea (2-3% of microbial mass) 106-8
g-1
(6 species)
Bacteriophage (<0.1% of microbial mass) 107-9
g-1
Adapted from McAllister and Cheng (1996) Stewart (1997), Dehority (2003), Castro-Montoya et al. (2011);
Puniya et al. (2015).
In addition, Puniya et al. (2015) numbered several other factors affecting rumen
bacterial community, such as antibiotic usage, health of the host animal, geographic location,
season, photoperiod, stress level, environment, and feeding regimen (intake and frequency).
Moreover, the manipulation techniques, such as dietary intervention and use of suitable
chemicals, probiotics, and bioactive plant secondary metabolites could be an efficient tool to
modify rumen fermentation and enhance the host animal performance, mainly by reducing
energy loss by mean of diminishing methane production, and by increasing feed utilization
and VFA production by mean of rumen microorganisms selection.

20
Table 5. Major rumen microbial community
Microbial species % of total
isolates
Secondary
substratesa
Net product in
mixed cultureb
Nutrient
requirementc
Hemicellulolytic/Cellulolytic
Bacteroides succinogenes 5 a 9 ST, P A, PS, CO2 VFA, V, NH3,
biotin, PAB
Ruminococcus albus 3 a 5 A, H2, CO2 VFA, NH3,
biotin, PAB
Ruminococcus flavefacients 3 a 5 A, PS, H2, CO2 VFA, NH3,
biotin, PAB
Fibrobacter succinogenes n.e
Eubacterium cellulosolvens n.e
Prevotella sp. 50%
Lipolytic
Anaerovibrio lipolytica n.e
Amylo and Dextrinolytic
Bacteroides amylophilus 1 a 10 P, PR A, PS, CO2 NH3
Streptococcus bovis 0 a 20 SS, PR A, L, CO2(H2) AA, biotin
Succinimonas amylolytica 1 a 3 A, PS, CO2 VFA
Succinivibrio dextrinosolvens 1 a 13 P A, PS, L, CO2(H2) AA
Saccharolytic
Bacteroides ruminicola 10 a 19 ST, P, PR A, P, CO2(H2) VFA
Butyrivibrio fibrisolvens 8 a 12 C, CT, PR A, B, L, CO2(H2)
NH3, AA,
biotin, folic acid,
pyridoxal
Megasphera elsdenii 0 a 1 L, PR A, P, B, V, H2, CO2 AA
Selenomonas ruminantium 4 a 12 ST, L A, P, L, H2, CO2 VFA, MET
Succinivibrio sp. n.e
Lactobacillus sp. n.e
Bifidobacterium sp. n.e
Hydrogen utilizers
Methanobrevibacter sp. 0 a 1 CH4 VFA, NH3
Methanobacterium formicicum n.e
Vibrio succionogenes 0 a 1 PS, NH3 NH3
Protozoa
Isotricha, Epidinium ST, SS A, B, L, H2, CO2
Dasytricha, Diplodinium sp. ST, SS A, B, L, H2, CO2 (Bacterial cells)
Entodinium sp. ST A, P, B, L, CO2(H2)
Bacteriophages
Methanobacterium phage Ψ
(M1, M10, M100, M2) n.e
Methanothermobacter phage Ψ
M100 n.e
Source: Adapted from Baldwin and Allison (1983),Pfister et al. (1998),Luo et al. (2001), Sirohi et al. (2012),
Kumar et al. (2014)
n.e: not evaluated aCoding for substrates is C for hemicellulose+cellulose, ST for starch, SS for soluble sugars, P for pectin , PR
for protein and L for lactate bCoding for products is A for acetate, P for propionate, B for butyrate, V for valerate and longer chained fatty
acids and L for lactate. Listing H2, CO2, indicates organism has a hydrogenase and procuces hydrogen while
CO2 (H2) indicates organisms producing formate that is converted to CO2 + H2 by another organism. PS codes
for succinate that is converted to proprionate and CO2 by other organisms in mixed culture. cCoding for nutrients is VFA for C4 – C5 (branched chain) volatile fatty acids, V for valerate, AA for amino
acids, MET for methionine, PAB for para-aminobenzoate.
Bacterial communities may also be specific and adapted to the harbouring
environment, as showed by Liu et al. (2015), comparing the compositional differences

21
between bacterial microbiota associated with the ruminal content, ruminal epithelium and
faeces. Significant dissimilarities were observed between all the portions. An abundance of
the predominant phyla Bacteroidetes was lower in the ruminal epithelium than in ruminal
content, while an abundance of Proteobacteria was observed in the epithelium rather than the
ruminal content. The faeces were prominent in abundance of Firmicutes and Verrucomicrobia
compared with ruminal content, which contained a greater abundance of Bacteroidetes and
Tenericutes. In addition, Butyrivibrio, Campylobacter, genera Turicibacter and Clostridium
also showed significant difference between the bacterial communities analysed.
According to Lindsay (2006), reviewing the ruminant metabolism studies in a 100
years period, microbial ecology studies have got a massive boost with the introduction and
development of molecular biology techniques. The 16S/18S DNA analyses supported the
development of phylogenetic base data, allowing the identification of the rumen microbiota
members. The molecular biology applied to the rumen studies have resulted in three main
lines. First line, linked to cloning techniques, allowing several genes from rumen micro-
organisms to be cloned (mainly into Escherichia coli cells), being the genes of interest mostly
related to polysaccharide degradation enzymes (Kobayashi and Onodera, 1999), such as
active beta-glucosidases (Del Pozo et al., 2012), carbohydrate-active enzymes (Wang et al.,
2013), lignocellulosic enzymes (Colombo et al., 2016), and others. Secondly, the analysis of
rumen species, enabling precise identification and quantification of the microbes present in
the rumen. Results can be shared between researchers in online databases, such as the
Hungate 1000, a catalogue of reference genomes from the rumen microbiome
(http://genome.jgi.doe.gov/TheHunmicrobiome/TheHunmicrobiome.info.html). This
information is essential for the development of novel primers for polymerase chain reaction
(PCR) assays. The third line of study is the introduction of enzymes into rumen microbes, in
order to transform them, aiming to enhance rates of digestion (Lindsay, 2006).
Real time PCR (qPCR) is still the main method of identification of rumen bacteria.
Many pairs of primers have been published to detect rumen microbes. For instance:
Anaerovibrio lipolytica, Butyrivibrio fibrisolvens, Eubacterium ruminantium, Prevotella
albenbacter, P. brevis, P. bryantii, P. ruminicola, Ruminobacter amylophilus, Selenomonas
ruminantium, Streptococcus bovis, Succinivibrio dextrinisolvens, Treponema bryantii, Genus
Prevotella. In addition, methanogens have also been isolated and quantified using qPCR
assays (Zhou et al., 2010; Carberry et al., 2012; Li et al., 2012) showing some microorganism
that can be identified and quantified in the rumen followed by primers and product size
(Table 6).
22
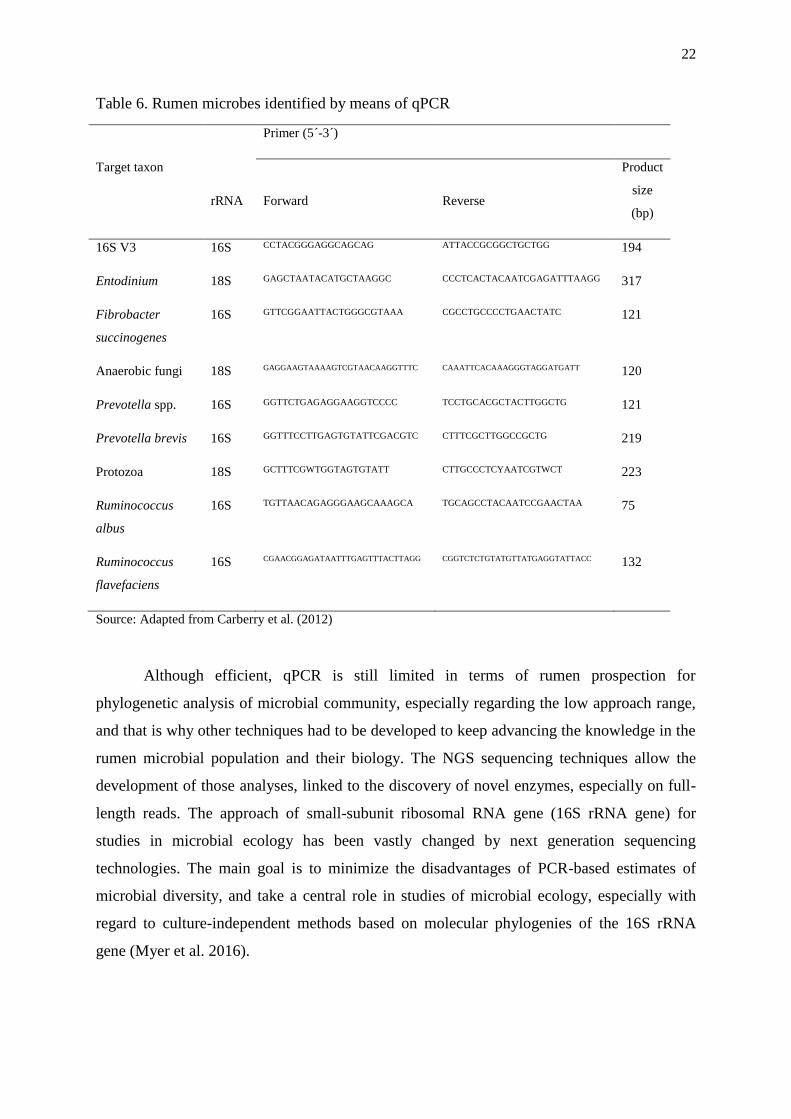
Table 6. Rumen microbes identified by means of qPCR
Primer (5´-3´)
Target taxon
rRNA
Forward
Reverse
Product
size
(bp)
16S V3 16S CCTACGGGAGGCAGCAG ATTACCGCGGCTGCTGG 194
Entodinium 18S GAGCTAATACATGCTAAGGC CCCTCACTACAATCGAGATTTAAGG 317
Fibrobacter
succinogenes
16S GTTCGGAATTACTGGGCGTAAA CGCCTGCCCCTGAACTATC 121
Anaerobic fungi 18S GAGGAAGTAAAAGTCGTAACAAGGTTTC CAAATTCACAAAGGGTAGGATGATT 120
Prevotella spp. 16S GGTTCTGAGAGGAAGGTCCCC TCCTGCACGCTACTTGGCTG 121
Prevotella brevis 16S GGTTTCCTTGAGTGTATTCGACGTC CTTTCGCTTGGCCGCTG 219
Protozoa 18S GCTTTCGWTGGTAGTGTATT CTTGCCCTCYAATCGTWCT 223
Ruminococcus
albus
16S TGTTAACAGAGGGAAGCAAAGCA TGCAGCCTACAATCCGAACTAA 75
Ruminococcus
flavefaciens
16S CGAACGGAGATAATTTGAGTTTACTTAGG CGGTCTCTGTATGTTATGAGGTATTACC 132
Source: Adapted from Carberry et al. (2012)
Although efficient, qPCR is still limited in terms of rumen prospection for
phylogenetic analysis of microbial community, especially regarding the low approach range,
and that is why other techniques had to be developed to keep advancing the knowledge in the
rumen microbial population and their biology. The NGS sequencing techniques allow the
development of those analyses, linked to the discovery of novel enzymes, especially on full-
length reads. The approach of small-subunit ribosomal RNA gene (16S rRNA gene) for
studies in microbial ecology has been vastly changed by next generation sequencing
technologies. The main goal is to minimize the disadvantages of PCR-based estimates of
microbial diversity, and take a central role in studies of microbial ecology, especially with
regard to culture-independent methods based on molecular phylogenies of the 16S rRNA
gene (Myer et al. 2016).

23
I.4.2 Rumen microbiome contribution to the antioxidant content of ruminant products
Rumen microorganisms can efficiently convert SDG to SECO, then to enterolignans
(ED, and then to EL) (Côrtes et al., 2008; Petit and Gagnon, 2009a, b; Zhou et al., 2009;
Schogor et al., 2014; Lima et al., 2016). Zhou et al. (2009), infused 1mg/kg body weight
SDG into the rumen of goats and reported an increase in the level of SDG, ED and EL in both
rumen fluid and serum. Moreover, Côrtes et al., (2008) demonstrated that, after ruminal fluid
and faecal incubation of flaxseed products, the lignans were converted by the microorganisms
present in the inoculum. The activity of β-glucuronidase has also been reported in dairy cows,
with five-fold higher activity in faecal material than in rumen fluid, suggesting that this
enzyme might play a more effective role of deconjugation on the intestinal level than in the
rumen (Gagnon et al., 2009). Moreover, supplementation with flax hulls in diet might
increase faecal β-glucuronidase activity (Côrtes et al., 2013). However, when introduced
directly in the rumen, flax hulls might have no effect on faecal β-glucuronidase activity
(Gagnon et al., 2009), indicating that the intake of the flax hulls and chewing movements
may contribute to greater breakdown of seed coat and greater release of flax lignans from
seeds.
The gastrointestinal environment can also cause variation in β-glucuronidase activity.
Gagnon et al. (2009) showed that flax oil supplementation in the rumen caused a decrease in
the microbial β-glucuronidase, indicating a negative effect of the n-3 fatty acids on the
enzyme activity. Furthermore, when introduced in the small intestine, by means of abomasal
flax oil infusion, β-glucuronidase activity also decrease, however, with no effect on the
absorption of EL. In addition, the lower activity of the enzyme in the rumen might not
interfere on the conversion of flax lignans into EL in the rumen (Côrtes et al., 2013).
Although, Lima et al. (2016), also supplied flaxseed oil through abomasal infusion, and
conversely showed no effect on microbial activity of β-glucuronidase in ruminal fluid and
faeces and EL concentrations, suggesting that n-3 fatty acids did not interfere with flax
lignans breakdown and absorption of mammalian lignans in dairy cows.
The environment of the rumen may also be affected by exposure of lignans. Changes
in the ruminal metabolism might occur due to SDG exposure for long periods, such as
decreases in pH value and NH3-N (ammonia–N), increase of total volatile fatty acids and
ratio of acetate and proprionate, and enhancement of rumen bacterial protein synthesis and
microbial crude protein, as well as possible changes in the microbial community (Zhou et al.,
2009; Côrtes et al., 2013). However, a recent study (Lima et al., 2016) showed that dietary

24
flax meal did not affect ruminal ammonia N and total VFA, although a small reduction on
molar proportion of acetate was observed, as well as, significant increase of propionate and
decrease of isovalerate. In addition, the acetate to proprionate ratio was lower in cows fed
flax meal than in those fed the control diet. Consequently, SDG may facilitate the anabolic
metabolism of carbohydrates and alter the fermentation pattern, therefore, studies regarding
the effects of lignans in the rumen may present inconstant results, depending on the period of
exposition of lignans to the ruminal microbiota, or the methods of incubation (in vivo or in
vitro), demanding attention in data comparison.
According to Zhou et al. (2009), the SDG may be released gradually, since the
concentration in the rumen fluid increased slowly after SDG infusion. A possible reason for
this observation is due the SDG being part of a macromolecule in which it is connected
through the linker molecule hydroxymethyl glutaric acid (HMGA). In addition, the same
study illustrated denaturing gradient gel electrophoresis (DGGE) of polymerase chain
reaction (PCR) products from rumen samples of goats being treated with SDG for different
period of time (7 and 14 days), showing that the ruminal community might change
composition depending on the exposure time to the plant lignan. Those results showed that
SDG supplement stimulates the growth of Ruminococcus gnavus, bacteria which activity in
the rumen is linked to glucuronidase. Therefore, different incubation time might be
considered when comparing lignans conversion results.
Studies concerning the elucidation of the microorganisms and reactions linked to the
plants lignans conversion processes are also necessary to understand the metabolism of those
compounds and to broaden knowledge in the area. Wang et al. (2000b) in a study
investigating the intestinal human microflora, in order to spot the bacteria connected to each
process, demonstrated that in the first conversion process of O-deglycosylation (SDG to
SECO), the microorganisms involved were: Bacteroides distasonis, Bacteroides fragilis,
Bacteroides ovatus, Clostridium cocleatum, Clostridium ramosum and Clostridium
saccharogumia. Moreover, in the O-demethylation process (SECO to 2,3-bis(3,4-
dihydroxybenzyl)-butane-1,4 diol or didemethyl-SECO), the following bacteria were
involved: Eubacterium limosum and Blautia spp. Furthermore, the dihydroxylation process
(didemethyl-SECO to ED) was linked to the activity of Eggerthella lenta, and finally, the
dehydrogenation (ED to EL) was attributed to the Lactonifactor longoviformis activity. In a
similar study, Clavel et al. (2006), showed high initial rate of SDG O-deglycosylation for the
strain Clostridium sp. SDGMt85-3Db, followed by O-demethylation activity in
Peptostreptococcus productus, demethylating the lignans pinoresinol, lariciresinol and
25
matairesinol, and finally, E. lenta catalysing the reduction of pinoresinol and lariciresinol.
Zhu et al. (2014), used in vitro assays with human intestinal bacteria and observed conversion
activity of SDG into ED. The strains implicated in the conversion were Bacteroides
uniformis, Eubacterium limosum and E. lenta. Eubacterium limosum species was observed to
possess the activities of O-demethylation, while E. lenta had the activities of dihydroxylation.
Schogor et al. (2014) also assessed the effects of inclusion of flax meal in the diet of dairy
cows on the ruminal microbiota using terminal restriction fragment length polymorphisms
(T-RFLP), PCR-DGGE and Q-PCR. DGGE bands potentially linked with SDG conversion to
SECO, ED and EL were sequenced. This study (Figure 6) demonstrated that Prevotella spp.
(Prevotella bryantii, Prevotella albensi, Prevotella ruminicola, Prevotella brevis), have a
high potential activity in SDG conversion in SECO, as well as other bacteria
(Peptostreptococcus anaerobius, Butyrivibrio fibrosolvens, Fibrobacter succinogens,
Ruminococcus albus, Eubacterium ruminantium, Butyrivibrio proteoclasticus, Ruminococcus
flavefaciens) having the same capacity, however, with lower conversion level. Moreover,
through taxonomic identification (DGGE bands), considering a nearest match (accession
number, maximum % sequence similarity) and Ribosomal Database Project Classification
(Cole et al., 2005), microorganisms potentially associated with EL production in ruminal
fluid, were identified as being: genus Prevotella, Succinivibrio, Fibrobacter, Anaerovorax,
unclassified Succinivibrionaceae, unclassified ‘‘Lachnospiraceae’’, unclassified
Alphaproteobacteria, unclassified ‘‘Bacteroidales’’, unclassified ‘‘Prevotellaceae’’. Most
matched to as yet uncultured rumen bacteria, showing that metagenomic approaches might be
a reliable tool to provide elucidation of the microorganisms involved in metabolic processes,
considering the limitation of pure culture assays. Even though culture-based studies should
continue identifying novel species linked to lignans metabolism, as demonstrated recently by
Gaya et al. (2017), showing Bifidobacterium adolescentis INIA P784 as the first probiotic
bacterium capable of producing enterodiol from lignan extracts.
In livestock, supplementation with antioxidants is intensively studied for its potential
to increase defensive system of the animal and improving the content of antioxidants in final
products (e.g. beef and milk), which offers a product with beneficial properties for human
health, as well as, increasing shelf life. α-tocopherol is one of the most studied antioxidants in
ruminants, and has been shown to be effective in its purpose. Vitamin E is used to increase
blood concentration for improvement in metabolic processes and for reducing lipid oxidation
in the final product. In beef cattle, vitamin E supplementation can improve the utilization
efficiency of dietary nitrogen (Wei et al., 2016), and increase vitamin E content in beef,
26
providing lipid oxidation protection (Gobert et al., 2010). In addition, in dairy cows’ vitamin
E content in plasma and milk might also be increased by vitamin E supplementation
(Lindqvist et al., 2011). Therefore, with a similar premise, the supplementation with flax
products to increase lignans levels in blood and milk have also been target of study, since the
presence of SDG, SECO, ED and EL might offer higher antioxidant capacity (lower amount
of oxygen species generated) compared to vitamin E (1.27, 4.86, 5.02 and 4.35%,
respectively) (Prasad, 2000). Indeed, recent published data shows that supplementation of
flax product in the diet of dairy cows effectively increase the EL concentration in milk
(Matumoto-Pintro et al., 2011; Côrtes et al., 2012; Côrtes et al., 2013; Lima et al., 2016).

27
Figure 6. Selected pure cultures associated with conversion of secoisolariciresinol diglucoside (SDG) into secoisolariciresinol (SECO) and
taxonomic identification (DGGE bands) potentially associated with enterolactone production in ruminal fluid. Adapted from Wang et al. (2000b)
and Schogor et al. (2014).

28
Matumoto-Pintro et al. (2011) also showed that the use of synthetic and purified EL
added to milk (0.20mg EL/kg) significantly protected the product against lipid oxidation,
which was not observed when increasing the mammalian lignan in milk (0.18 mg EL/kg) by
means of up to 15% of flax meal supplementation. Moreover, Côrtes et al. (2012),
supplementing 15.9% flax hulls in the diet (dry matter), observed EL concentration in milk of
0.39, 0.35 and 0.33 µmol/l after three level of infusion of flax oil in the abomasum (0, 250
and 500 g/d, respectively), where the abomasal infusion was not a variation factor.
Enterolignans antioxidant activity also improve physiological indexes in ruminants. For
instance, it was observed in recent published data, the positive correlation between
intrafollicular EL concentrations and estradiol concentrations in preovulatory follicles in
dairy cows (Zachut, 2015). Hence, supplementation with flax antioxidants have been proven
as an effective tool with the potential of enhancing the milk quality and physiological
processes in ruminants, nonetheless, the knowledge surrounding this application should keep
advancing.
Enterolactone might also have other very useful appliance, regarding the ability to
reduce the transfer of drugs (e.g. antibiotics) into milk. The mechanism is connected to the
potential linkage of EL and ATP-binding cassete trasporter G2 (ABCG2) (Miguel et al.,
2014), being the G2 a transporter member of the ABC protein superfamily, with
representative expression in mammary gland and connected to the active secretion of some
endogenous and exogenous substances (van Herwaarden et al., 2007). Otero et al. (2016),
demonstrated that enterolactone inhibited in vitro ABCG2-mediated transport of the drug
mitoxantrone, as a model substrate. In addition, the same study assessed the effects of the
Y581S polymorphism of the ABCG2, showing that this genetic variant affects positively the
accumulation of antioxidants as EL, and thus, demonstrating a potential tool for improvement
of lignans content in milk. Therefore, is irrefutable that several factors might interfere in milk
proprieties, and should be consider for further approaches to enhance milk quality.
Therefore, supplementation of flaxseed and flaxseed products in livestock can be used
as strategy in order to increase mammalian lignans levels of animal products as the
compounds are effectively transfer to physiological fluids. Flaxseed, flaxseed meal or clover
grass silages supplementation in dairy cows have been shown to increase EL concentration in
ruminal fluid, plasma, urine and milk (Steinshamn et al., 2008; Gagnon et al., 2009; Petit et
al., 2009; Lima et al., 2016). For instance, Matumoto-Pintro et al. (2011), supplying up to
15% of flax meal to cows increased EL concentration in milk to 0.18 mg/kg.

29
I.5 Rumen meta-omics
Microbial cells are well spread in all kinds of environments on Earth, being mainly
prokaryotes individuals and most of them uncultured species. Therefore, the meta-omics
technologies (metagenomics, metatranscriptomics, metaproteomics and metabolomics), are a
powerful tool to bypass the need for isolation or cultivation in laboratory conditions is
essential to compare and explore the ecology of microorganisms (Handelsman, 2004; Ferrer
et al., 2009; Simon and Daniel, 2011). Direct isolation of nucleic acids from environmental
samples is followed by metagenomic approaches, but the assay will depend on final aim of
the gene mining (Figure 7).
Figure 7. Metagenomic analysis of environmental microbial communities based on nucleic
acids.
Source: Simon and Daniel (2011)
The metabolic and functional capacity of a microbial community can be assessed by
means of metagenomics (DNA-based), metaproteomics and metabolomics. However, DNA-
based analyses cannot differentiate between expressed and non-expressed genes, and
therefore, do not reflect the actual community metabolic activity, which can be assessed by
metatranscriptomics (RNA-based). Moreover, the community immediate catalytic potential is
assessed by metaproteomics (Shrivastava. et al., 2015).
NGS techniques are becoming more affordable methods overtime, allowing large-
scale analysis of metagenomics studies, such as comparative metagenomics,

30
metatranscriptomics and mass spectrometry (Chistoserdova, 2010; Grada and Weinbrecht,
2013).
Microbial communities can be assessed based on nucleic acids from several different
environments, such as soil (Delmont et al., 2011), groundwater (Uchiyama et al., 2005),
hotspring (Rhee et al., 2005), glacier ice (Simon et al., 2009), buffalo rumen (Duan et al.,
2009), deer rumen (Jarvis et al., 1999) sheep rumen (Hobson and Mann, 1961; Prins et al.,
1975; Hazlewood and Dawson, 1979), cattle rumen (Ferrer et al., 2005; Cirne et al., 2006;
Hess et al., 2011), human gut (Glasner, 2017) and many others. In addition, from the
microbial environmental communities, different approaches (e.g bioprospecting, assessment
of taxonomic diversity, assessment of metabolic potential, analysis of community functions,
analysis of active community members) can be carried out by extracting and isolating DNA
or RNA.
Bioprospecting environmental samples regard the construction of metagenomic
libraries, which comprise the cloning of environmental small-insert or large-insert DNA into
a bacterial host (most cases Escherichia coli) for further screening (Simon and Daniel, 2010).
The two main approaches to recover novel biomolecules are: function-based, which do not
necessarily requires sequence information prior to DNA insertion, can be applied as activity-
driven screen with targeted genes encoding a bacterial enzyme in the host cell (e.g cloning
bacterial β-D-glucuronidases in E. coli cells deficient in this enzyme (Gloux et al., 2011));
and sequence-based screening, which comprise the design of DNA probes or primers derived
from already-known genes (Handelsman, 2004; Daniel, 2005; Ferrer et al., 2009; Simon and
Daniel, 2011).
Assessment of taxonomic diversity studies are based on conserved marker genes, such
as 16S rRNA genes and data-bases of reference sequences can provide rRNA gene-based
classification information to assess the microbiota diversity. The taxonomic diversity studies
can be carried out in large scale due to the introduction of NGS platforms, such as the
Genome Analyzer of Illumina (Bentley, 2006). In addition, the novel technologies allowed a
greater depth on the analysis, for example, shotgun sequencing (direct sequencing of
metagenomic DNA) and pyrosequencing of 16S rRNA gene amplicons compared to other
assays such as DGGE, T-RFLP, or Sanger sequening (Simon and Daniel, 2011). Moreover,
following the sequencing data, the microorganisms are clustered in phylogenetic groups
(binning step), based on their taxonomic origins (ranging from the kingdom to the genus
level). Sequence homology are then assessed by similarity-based approaches to classify DNA
fragments by means of search on reference database and use of tools such as Basic Local
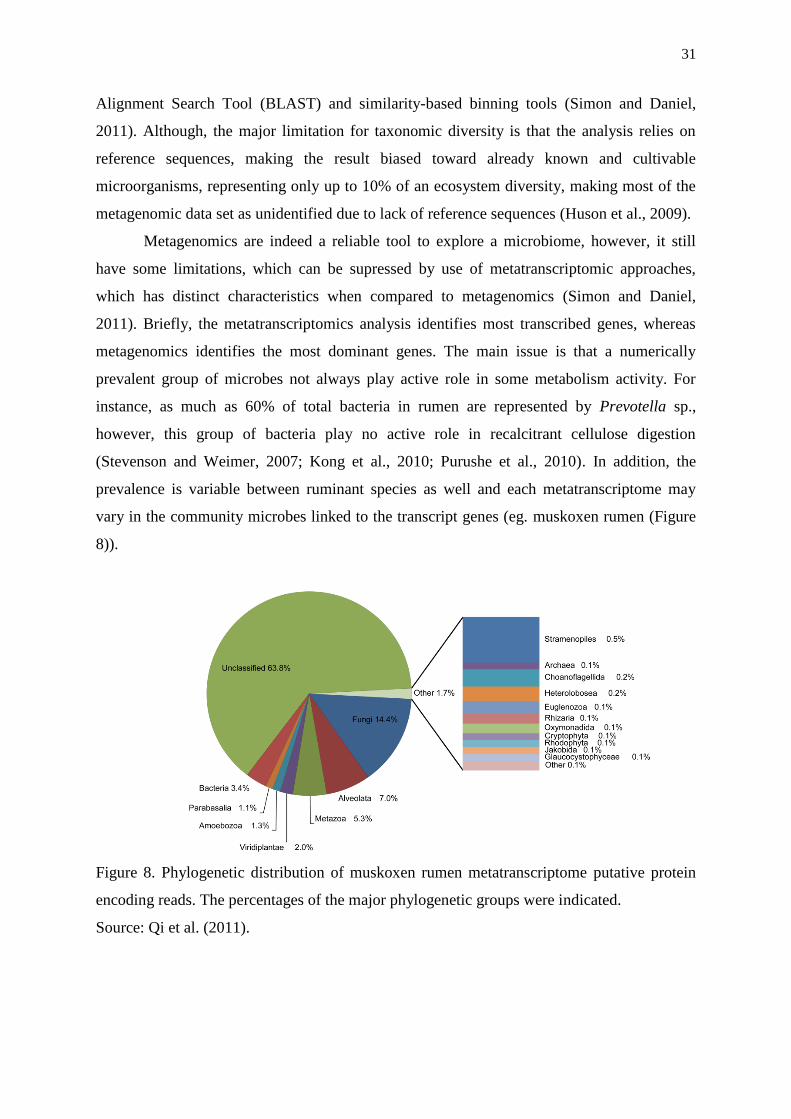
31
Alignment Search Tool (BLAST) and similarity-based binning tools (Simon and Daniel,
2011). Although, the major limitation for taxonomic diversity is that the analysis relies on
reference sequences, making the result biased toward already known and cultivable
microorganisms, representing only up to 10% of an ecosystem diversity, making most of the
metagenomic data set as unidentified due to lack of reference sequences (Huson et al., 2009).
Metagenomics are indeed a reliable tool to explore a microbiome, however, it still
have some limitations, which can be supressed by use of metatranscriptomic approaches,
which has distinct characteristics when compared to metagenomics (Simon and Daniel,
2011). Briefly, the metatranscriptomics analysis identifies most transcribed genes, whereas
metagenomics identifies the most dominant genes. The main issue is that a numerically
prevalent group of microbes not always play active role in some metabolism activity. For
instance, as much as 60% of total bacteria in rumen are represented by Prevotella sp.,
however, this group of bacteria play no active role in recalcitrant cellulose digestion
(Stevenson and Weimer, 2007; Kong et al., 2010; Purushe et al., 2010). In addition, the
prevalence is variable between ruminant species as well and each metatranscriptome may
vary in the community microbes linked to the transcript genes (eg. muskoxen rumen (Figure
8)).
Figure 8. Phylogenetic distribution of muskoxen rumen metatranscriptome putative protein
encoding reads. The percentages of the major phylogenetic groups were indicated.
Source: Qi et al. (2011).
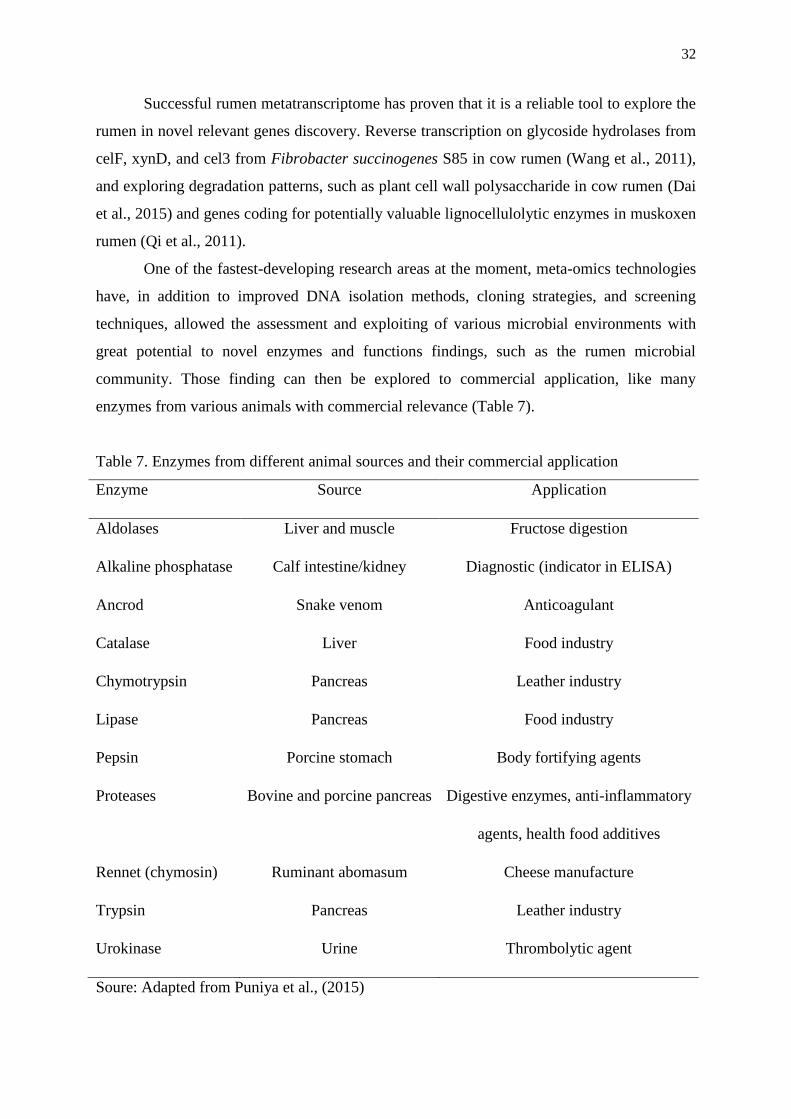
32
Successful rumen metatranscriptome has proven that it is a reliable tool to explore the
rumen in novel relevant genes discovery. Reverse transcription on glycoside hydrolases from
celF, xynD, and cel3 from Fibrobacter succinogenes S85 in cow rumen (Wang et al., 2011),
and exploring degradation patterns, such as plant cell wall polysaccharide in cow rumen (Dai
et al., 2015) and genes coding for potentially valuable lignocellulolytic enzymes in muskoxen
rumen (Qi et al., 2011).
One of the fastest-developing research areas at the moment, meta-omics technologies
have, in addition to improved DNA isolation methods, cloning strategies, and screening
techniques, allowed the assessment and exploiting of various microbial environments with
great potential to novel enzymes and functions findings, such as the rumen microbial
community. Those finding can then be explored to commercial application, like many
enzymes from various animals with commercial relevance (Table 7).
Table 7. Enzymes from different animal sources and their commercial application
Enzyme Source Application
Aldolases Liver and muscle Fructose digestion
Alkaline phosphatase Calf intestine/kidney Diagnostic (indicator in ELISA)
Ancrod Snake venom Anticoagulant
Catalase Liver Food industry
Chymotrypsin Pancreas Leather industry
Lipase Pancreas Food industry
Pepsin Porcine stomach Body fortifying agents
Proteases Bovine and porcine pancreas Digestive enzymes, anti-inflammatory
agents, health food additives
Rennet (chymosin) Ruminant abomasum Cheese manufacture
Trypsin Pancreas Leather industry
Urokinase Urine Thrombolytic agent
Soure: Adapted from Puniya et al., (2015)

33
I.5.1 Rumen plasmidome
Plasmids are extrachromosomal (Figure 9) circular double-stranded DNA molecules,
linked to enhancement of fitness and changes in microbial population. They are key elements
in the dissemination of a variety of traits by means of their mobilization between different
hosts, providing advantages to adverse environments, being essential to the survival of the
organisms, especially prokaryotic cells. The plasmids are self-replicating, which means that
they can replicate independently of chromosomal DNA (Funnell and Phillips, 2004).
These DNA molecules are present in both Gram-Positive and Gram-Negative
bacteria, and sometimes present in archaea and eukaryotic organism (Kado, 1998). They are
an essential factor in microbial population change, once they can propagate virulence,
antimicrobial agents resistance, enhanced fitness, ability of metabolism of substances, and
others. Plasmid, therefore, can carry genes that provide some survival benefit to the host
organism, and this lateral gene transfer, can strongly drive the evolution of a species in
microbioal environments (Kado, 1998; Funnell and Phillips, 2004; Koonin and Wolf, 2008).
Figure 9. Bacteria genetic material, 1chromosomal DNA and
2plasmid DNA, not to scale.
Source: The author
Briefly, the characteristic of the independent replication of plasmid is duo to a
stretch of DNA that can act as origin of replication. The structure of the origin of replication
(typically assigned names containing "ori") varies between species, but they share some
common properties, as high AT content (adenine and thymine are easier to separate than
guanine and cytosine) (Yakovchuk et al., 2006). The origin of replication binds a complex
(pre-replication), protein complex that recognizes, unwinds, and begins the copy of DNA.
The segment of DNA that is copied starting from each unique replication origin is called a
replicon (Funnell and Phillips, 2004).

34
Not all plasmids have the same characteristic, for instance, a wide range of plasmid
sizes can be found, among those, the ones that are relatively small (300-400bp) usually do not
contain open reading frames (ORFs), not coding for proteins. Although, those might contain a
replication origin for plasmids (Kado, 1998).
I.5.2 Fosmid libraries
Metagenomic fosmid libraries can be used to access plasmid DNA information from
the rumen bacteria, including the uncultivated which are in greater diversity compared to the
cultivated, and thus, prospect new enzymes.
DNA has been isolated from several microbial communities in many different
environments, such as soil and sea water, due to their microbial concentration (5,000-40,000
species/g soil), and diversity in biological activities and products (Daniel, 2005; DeLong,
2005). In addition, studies have been focusing also in the animals’ microbiota as well, with
novel biocatalysts been discovered (Quartieri et al., 2016). Many studies aimed to assess the
animals gut microbiota (Frank and Pace, 2008). The rumen, one of the most complex natural
environments has also been the target of gene prospection studies. Metagenomic datasets can
provide novel, and even unexpected insights into community structure and function. The
animal-associated communities studies, for example, resulted in many genes/molecules been
discovered, such as hydrolases, laccases, and xylanases, antibiotic resistance genes, and
inter/intraspecies communication molecules (Healy et al., 1995; Diaz-Torres et al., 2006;
Guan et al., 2007).
Direct cloning from environmental DNA was first proposed by Pace et al. (1985).
However, the first successful function-driven screening of metagenomic libraries was
conducted only a decade later (Healy et al., 1995). The technique is rapidly been improved
and used in large-scale in order to assess novel biomolecules (Handelsman, 2004; Daniel,
2005; Ferrer et al., 2009; Steele et al., 2009; Simon and Daniel, 2010).
E. coli is the most used species as recombinant host bacteria in metagenomic libraries.
The reasons why include: culture in cheap media and reduction of protease activity.
Moreover, E. coli can accumulate heterologous proteins up to 50% of its dry cell weight.
(Williams, 2007). On the other hand, E. coli function-based screening can be problematic
owing to insufficient expression of foreign genes (Uchiyama and Miyazaki, 2009). However,
only 40% of the enzymatic activities in an bacterial community assessed may be detected by
random cloning using E. coli cells (Gabor et al., 2004). In order to expand the range of
35
detectable activities in the community screening different species can be employed as host
bacteria, such as Streptomyces spp. (Wang et al., 2000a), Thermus thermophiles (Angelov et
al., 2009), Sulfolobus solfataricus (Albers et al., 2006), and various Proteobacteria (Craig et
al., 2010).
According to Simon and Daniel (2011), metagenomic libraries can be constructed
using different cell components, depending on the desired insert size. Can be used as vectors:
bacterial artificial chromosomes (40 kb); fosmids and cosmids (up to 40kb); and plasmids (up
to 15 kb). The choice of the vector is driven by the DNA quality, targeted genes, and
screening strategy. Small-insert libraries are recommended for identification of single gene or
small operon novel biocatalysts, and large-insert libraries are recommended for recover
complex pathways from large gene clusters (Daniel, 2005).
Library construction, screening and sequencing are followed by different approaches,
such as genome hunting and data mining. The first, based on prospecting for ORFs in the
genome and sequences annotated as putative enzymes are then conducted to cloning, over-
expression and activity screening assays. On the other hand, data mining is based on
homology alignment between sequences find in databases. Using bioinformatics tools such as
BLAST, conserved regions are identified for further characterization (Adrio and Demain,
2014; Liu et al., 2015).
Fosmid libraries can be efficient tools to prospect novel enzymes. As showed by
Colombo et al. (2016), applying functional metagenomics to search for novel lignocellulosic
enzymes in a microbial consortium derived from a thermophilic composting phase of
sugarcane bagasse and cow manure. From a fosmid library, 182 clones had the ability to
hydrolyse carbohydrate (9 xylanases, 9 cellulases). Sequencing of 30 fosmids resulted in 12
contigs encoding 34 putative carbohydrate-active enzymes belonging to 17 glycosyl
hydrolase families. One third of the putative proteins belong to the glycosyl hydrolase 3
family, which includes β-glucosidase enzymes known to be important in the cellulose
deconstruction. In addition, metagenomic libraries have resulted in many other novel
biocatalysts identification, such as cellulases (Healy et al., 1995; Duan et al., 2009),
chitinases (Hjort et al., 2009), DNA polymerases (Simon et al., 2009), proteases
(Waschkowitz et al., 2009), antibiotics (Riesenfeld et al., 2004).

36
I.6 References
Adlercreutz, H. (2007) Lignans and human health. Critical reviews in clinical laboratory sciences 44:
483-525.
Adolphe, J.L., Whiting, S.J., Juurlink, B.H., Thorpe, L.U., and Alcorn, J. (2010) Health effects with
consumption of the flax lignan secoisolariciresinol diglucoside. British Journal of Nutrition 103: 929-
938.
Adrio, J.L., and Demain, A.L. (2014) Microbial enzymes: tools for biotechnological processes.
Biomolecules 4: 117-139.
Albers, S.-V., Jonuscheit, M., Dinkelaker, S., Urich, T., Kletzin, A., Tampe, R. et al. (2006)
Production of recombinant and tagged proteins in the hyperthermophilic archaeon Sulfolobus
solfataricus. Applied and environmental microbiology 72: 102-111.
Alexandrova, M., Bochev, P., Markova, V., Bechev, B., Popova, M., Danovska, M., and Simeonova,
V. (2004) Dynamics of free radical processes in acute ischemic stroke: influence on neurological
status and outcome. Journal of Clinical Neuroscience 11: 501-506.
Ames, B.N., Shigenaga, M.K., and Hagen, T.M. (1993) Oxidants, antioxidants, and the degenerative
diseases of aging. Proceedings of the National Academy of Sciences 90: 7915-7922.
Angelov, A., Mientus, M., Liebl, S., and Liebl, W. (2009) A two-host fosmid system for functional
screening of (meta) genomic libraries from extreme thermophiles. Systematic and applied
microbiology 32: 177-185.
Baldwin, R., and Allison, M. (1983) Rumen metabolism. Journal of Animal Science 57: 461-477.
Baraka, T. (2012) Comparative studies of rumen pH, total protozoa count, generic and species
composition of ciliates in camel, buffalo, cattle, sheep and goat in Egypt. J Am Sci 8: 448-462.
Bentley, D.R. (2006) Whole-genome re-sequencing. Current opinion in genetics & development 16:
545-552.
Bernacchia, R., Preti, R., and Vinci, G. (2014) Chemical composition and health benefits of flaxseed.
Austin J Nutri Food Sci 2: 1045.
Brown, G.C., and Neher, J.J. (2010) Inflammatory neurodegeneration and mechanisms of microglial
killing of neurons. Molecular neurobiology 41: 242-247.
Buck, K., Zaineddin, A.K., Vrieling, A., Linseisen, J., and Chang-Claude, J. (2010) Meta-analyses of
lignans and enterolignans in relation to breast cancer risk. The American journal of clinical nutrition:
ajcn. 28573.
Buettner, G.R. (2011) Superoxide dismutase in redox biology: the roles of superoxide and hydrogen
peroxide. Anti-Cancer Agents in Medicinal Chemistry (Formerly Current Medicinal Chemistry-Anti-
Cancer Agents) 11: 341-346.
Cadenas, E. (1997) Basic mechanisms of antioxidant activity. Biofactors 6: 391-397.
Cappellini, M.D., and Fiorelli, G. (2008) Glucose-6-phosphate dehydrogenase deficiency. The lancet
371: 64-74.
Carberry, C.A., Kenny, D.A., Han, S., McCabe, M.S., and Waters, S.M. (2012) Effect of phenotypic
residual feed intake and dietary forage content on the rumen microbial community of beef cattle.
Applied and environmental microbiology 78: 4949-4958.
Carocho, M., and Ferreira, I.C. (2013) A review on antioxidants, prooxidants and related controversy:
natural and synthetic compounds, screening and analysis methodologies and future perspectives. Food
and Chemical Toxicology 51: 15-25.
Carreau, C., Flouriot, G., Bennetau-Pelissero, C., and Potier, M. (2008) Enterodiol and enterolactone,
two major diet-derived polyphenol metabolites have different impact on ERα transcriptional
activation in human breast cancer cells. The Journal of steroid biochemistry and molecular biology
110: 176-185.
Castro-Montoya, J., Makkar, H., and Becker, K. (2011) Chemical composition of rumen microbial
fraction and fermentation parameters as affected by tannins and saponins using an in vitro rumen
fermentation system. Canadian Journal of Animal Science 91: 433-448.
Chen, Z., and Zhong, C. (2014) Oxidative stress in Alzheimer’s disease. Neuroscience bulletin 30:
271-281.
Chistoserdova, L. (2010) Recent progress and new challenges in metagenomics for biotechnology.
Biotechnology letters 32: 1351-1359.
37
Choo, W.-S., Birch, J., and Dufour, J.-P. (2007) Physicochemical and quality characteristics of cold-
pressed flaxseed oils. Journal of Food Composition and Analysis 20: 202-211.
Christen, Y. (2000) Oxidative stress and Alzheimer disease. The American journal of clinical
nutrition 71: 621s-629s.
Cirne, D.G., Delgado, O.D., Marichamy, S., and Mattiasson, B. (2006) Clostridium lundense sp. nov.,
a novel anaerobic lipolytic bacterium isolated from bovine rumen. International journal of systematic
and evolutionary microbiology 56: 625-628.
Clavel, T., Henderson, G., Engst, W., Doré, J., and Blaut, M. (2006) Phylogeny of human intestinal
bacteria that activate the dietary lignan secoisolariciresinol diglucoside. FEMS microbiology ecology
55: 471-478.
Cole, J.R., Chai, B., Farris, R.J., Wang, Q., Kulam, S., McGarrell, D.M. et al. (2005) The Ribosomal
Database Project (RDP-II): sequences and tools for high-throughput rRNA analysis. Nucleic acids
research 33: D294-D296.
Colombo, L.T., de Oliveira, M.N.V., Carneiro, D.G., de Souza, R.A., Alvim, M.C.T., dos Santos, J.C.
et al. (2016) Applying functional metagenomics to search for novel lignocellulosic enzymes in a
microbial consortium derived from a thermophilic composting phase of sugarcane bagasse and cow
manure. Antonie van Leeuwenhoek 109: 1217-1233.
Côrtes, C., Gagnon, N., Benchaar, C., Da Silva, D., Santos, G., and Petit, H. (2008) In vitro
metabolism of flax lignans by ruminal and faecal microbiota of dairy cows. Journal of applied
microbiology 105: 1585-1594.
Côrtes, C., Palin, M.-F., Gagnon, N., Benchaar, C., Lacasse, P., and Petit, H.V. (2012) Mammary
gene expression and activity of antioxidant enzymes and concentration of the mammalian lignan
enterolactone in milk and plasma of dairy cows fed flax lignans and infused with flax oil in the
abomasum. British Journal of Nutrition 108: 1390-1398.
Côrtes, C., da Silva-Kazama, D., Kazama, R., Benchaar, C., dos Santos, G., Zeoula, L.M. et al. (2013)
Effects of abomasal infusion of flaxseed (Linum usitatissimum) oil on microbial β-glucuronidase
activity and concentration of the mammalian lignan enterolactone in ruminal fluid, plasma, urine and
milk of dairy cows. British Journal of Nutrition 109: 433-440.
Craig, J.W., Chang, F.-Y., Kim, J.H., Obiajulu, S.C., and Brady, S.F. (2010) Expanding small-
molecule functional metagenomics through parallel screening of broad-host-range cosmid
environmental DNA libraries in diverse proteobacteria. Applied and environmental microbiology 76:
1633-1641.
Dai, X., Tian, Y., Li, J., Su, X., Wang, X., Zhao, S. et al. (2015) Metatranscriptomic analyses of plant
cell wall polysaccharide degradation by microorganisms in the cow rumen. Applied and
environmental microbiology 81: 1375-1386.
Daniel, R. (2005) The metagenomics of soil. Nature Reviews Microbiology 3: 470-478.
Day, B.J. (2009) Catalase and glutathione peroxidase mimics. Biochemical pharmacology 77: 285-
296.
Dehority, B.A. (2003) Rumen microbiology. Nottingham, UK: University Press.
Deibel, M., Ehmann, W., and Markesbery, W. (1996) Copper, iron, and zinc imbalances in severely
degenerated brain regions in Alzheimer's disease: possible relation to oxidative stress. Journal of the
neurological sciences 143: 137-142.
Deisseroth, A., and Dounce, A.L. (1970) Catalase: Physical and chemical properties, mechanism of
catalysis, and physiological role. Physiological reviews 50: 319-375.
De la Fuente, M. (2002). Effects of antioxidants on immune system ageing. European Journal of
Clinical Nutrition, 56:S5.
Del Pozo, M.V., Fernández-Arrojo, L., Gil-Martínez, J., Montesinos, A., Chernikova, T.N.,
Nechitaylo, T.Y. et al. (2012) Microbial β-glucosidases from cow rumen metagenome enhance the
saccharification of lignocellulose in combination with commercial cellulase cocktail. Biotechnology
for biofuels 5: 73.
Delmont, T.O., Robe, P., Cecillon, S., Clark, I.M., Constancias, F., Simonet, P. et al. (2011)
Accessing the soil metagenome for studies of microbial diversity. Applied and Environmental
Microbiology 77: 1315-1324.
DeLong, E.F. (2005) Microbial community genomics in the ocean. Nature Reviews Microbiology 3:
459-469.

38
Diaz-Torres, M.L., Villedieu, A., Hunt, N., McNab, R., Spratt, D.A., Allan, E. et al. (2006)
Determining the antibiotic resistance potential of the indigenous oral microbiota of humans using a
metagenomic approach. FEMS microbiology letters 258: 257-262.
Donald, V., Donald, V., Voet Judith, G., and Pratt Charlotte, W. (2006) Fundamentals of
Biochemistry Life at the Molecular Level: John Wiley and Sons.
Duan, C.J., Xian, L., Zhao, G.C., Feng, Y., Pang, H., Bai, X.L. et al. (2009) Isolation and partial
characterization of novel genes encoding acidic cellulases from metagenomes of buffalo rumens.
Journal of applied microbiology 107: 245-256.
Edwards, E.A., Rawsthorne, S., and Mullineaux, P.M. (1990) Subcellular distribution of multiple
forms of glutathione reductase in leaves of pea (Pisum sativum L.). Planta 180: 278-284.
Fang, J., Seki, T., and Maeda, H. (2009) Therapeutic strategies by modulating oxygen stress in cancer
and inflammation. Advanced drug delivery reviews 61: 290-302.
Ferrer, M., Beloqui, A., Timmis, K.N., and Golyshin, P.N. (2009) Metagenomics for mining new
genetic resources of microbial communities. Journal of molecular microbiology and biotechnology
16: 109-123.
Ferrer, M., Golyshina, O.V., Chernikova, T.N., Khachane, A.N., Reyes‐Duarte, D., Santos, V.A. et al.
(2005) Novel hydrolase diversity retrieved from a metagenome library of bovine rumen microflora.
Environmental Microbiology 7: 1996-2010.
Flint, H.J., Bayer, E.A., Rincon, M.T., Lamed, R., and White, B.A. (2008) Polysaccharide utilization
by gut bacteria: potential for new insights from genomic analysis. Nature reviews Microbiology 6:
121.
Frank, D.N., and Pace, N.R. (2008) Gastrointestinal microbiology enters the metagenomics era.
Current opinion in gastroenterology 24: 4-10.
Fridovich, I. (1995) Superoxide radical and superoxide dismutases. Annual review of biochemistry 64:
97-112.
Friedman, N., Shriker, E., Gold, B., Durman, T., Zarecki, R., Ruppin, E., and Mizrahi, I. (2017) Diet‐induced changes of redox potential underlie compositional shifts in the rumen archaeal community.
Environmental microbiology 19: 174-184.
Funnell, B.E., and Phillips, G.J. (2004) Plasmid Biology. Washington (DC): ASM Press.
Gabor, E.M., Alkema, W.B., and Janssen, D.B. (2004) Quantifying the accessibility of the
metagenome by random expression cloning techniques. Environmental Microbiology 6: 879-886.
Gagnon, N., Côrtes, C., da Silva, D., Kazama, R., Benchaar, C., dos Santos, G. et al. (2009) Ruminal
metabolism of flaxseed (Linum usitatissimum) lignans to the mammalian lignan enterolactone and its
concentration in ruminal fluid, plasma, urine and milk of dairy cows. British Journal of Nutrition 102:
1015-1023.
Gaya, P., Peirotén, Á., Medina, M., and Landete, J.M. (2017) Bifidobacterium adolescentis INIA
P784: The first probiotic bacterium capable of producing enterodiol from lignan extracts. Journal of
Functional Foods 29: 269-274.
Gella, A., and Durany, N. (2009) Oxidative stress in Alzheimer disease. Cell adhesion & migration 3:
88-93.
Gill, S.S., Anjum, N.A., Hasanuzzaman, M., Gill, R., Trivedi, D.K., Ahmad, I. et al. (2013)
Glutathione and glutathione reductase: a boon in disguise for plant abiotic stress defense operations.
Plant Physiology and Biochemistry 70: 204-212.
Glasner, M.E. (2017) Finding enzymes in the gut metagenome. Science 355: 577-578.
Gloux, K., Berteau, O., Béguet, F., Leclerc, M., and Doré, J. (2011) A metagenomic β-glucuronidase
uncovers a core adaptive function of the human intestinal microbiome. Proceedings of the National
Academy of Sciences 108: 4539-4546.
Gobert, M., Gruffat, D., Habeanu, M., Parafita, E., Bauchart, D., and Durand, D. (2010) Plant extracts
combined with vitamin E in PUFA-rich diets of cull cows protect processed beef against lipid
oxidation. Meat Science 85: 676-683.
Gordon, M.H. (1990) The mechanism of antioxidant action in vitro. In Food antioxidants. Hudson,
B.J. (ed), pp. 1-18.
Góth, L., Rass, P., and Páy, A. (2004) Catalase enzyme mutations and their association with diseases.
Molecular Diagnosis 8: 141-149.

39
Góth, L., Nagy, T., Paragh, G., and Káplár, M. (2016) Blood Catalase Activities, Catalase Gene
Polymorphisms and Acatalasemia Mutations in Hungarian Patients with Diabetes Mellitus. . Global
Journal of Obesity, Diabetes and Metabolic Syndrome 3: 001-005.
Goyal, A., Sharma, V., Upadhyay, N., Gill, S., and Sihag, M. (2014) Flax and flaxseed oil: an ancient
medicine & modern functional food. Journal of food science and technology 51: 1633-1653.
Grada, A., and Weinbrecht, K. (2013) Next-generation sequencing: methodology and application. J
Invest Dermatol 133: e11.
Griffiths, H.R. (2015) Antioxidants: Characterization and Analysis. In Encyclopedia of Food and
Health. Caballero, B., Finglas, P. M., Toldra, F. (ed), pp. 221-227.
Guan, C., Ju, J., Borlee, B.R., Williamson, L.L., Shen, B., Raffa, K.F., and Handelsman, J. (2007)
Signal mimics derived from a metagenomic analysis of the gypsy moth gut microbiota. Applied and
environmental microbiology 73: 3669-3676.
Halliwell, B. (1996) Antioxidants in human health and disease. Annual review of nutrition 16: 33-50.
Halliwell, B. (2007) Biochemistry of oxidative stress. In: Portland Press Limited.
Halliwell, B. (2012) Free radicals and antioxidants: updating a personal view. Nutrition reviews 70:
257-265.
Handelsman, J. (2004) Metagenomics: application of genomics to uncultured microorganisms.
Microbiology and molecular biology reviews 68: 669-685.
Harrison, D., Griendling, K.K., Landmesser, U., Hornig, B., and Drexler, H. (2003) Role of oxidative
stress in atherosclerosis. The American journal of cardiology 91: 7-11.
Hazlewood, G., and Dawson, R.M. (1979) Characteristics of a lipolytic and fatty acid-requiring
Butyrivibrio sp. isolated from the ovine rumen. Microbiology 112: 15-27.
Healy, F., Ray, R., Aldrich, H., Wilkie, A., Ingram, L., and Shanmugam, K. (1995) Direct isolation of
functional genes encoding cellulases from the microbial consortia in a thermophilic, anaerobic
digester maintained on lignocellulose. Applied microbiology and biotechnology 43: 667-674.
Heinonen, S., Nurmi, T., Liukkonen, K., Poutanen, K., Wähälä, K., Deyama, T. et al. (2001) In vitro
metabolism of plant lignans: new precursors of mammalian lignans enterolactone and enterodiol.
Journal of agricultural and food chemistry 49: 3178-3186.
Henderson, G., Cox, F., Ganesh, S., Jonker, A., Young, W., Collaborators, G.R.C., and Janssen, P.H.
(2015) Rumen microbial community composition varies with diet and host, but a core microbiome is
found across a wide geographical range. Scientific reports 5.
Herchi, W., Al Hujaili, A.D., Sakouhi, F., Sebei, K., Trabelsi, H., Kallel, H., and Boukhchina, S.
(2014) Flaxseed hull: chemical composition and antioxidant activity during development. Journal of
oleo science 63: 681-689.
Hess, M., Sczyrba, A., Egan, R., Kim, T.-W., Chokhawala, H., Schroth, G. et al. (2011) Metagenomic
discovery of biomass-degrading genes and genomes from cow rumen. Science 331: 463-467.
Hitchon, C.A., and El-Gabalawy, H.S. (2004) Oxidation in rheumatoid arthritis. Arthritis Res Ther 6:
265.
Hjort, K., Bergström, M., Adesina, M.F., Jansson, J.K., Smalla, K., and Sjöling, S. (2009) Chitinase
genes revealed and compared in bacterial isolates, DNA extracts and a metagenomic library from a
phytopathogen-suppressive soil. FEMS microbiology ecology 71: 197-207.
Hobson, P., and Mann, S. (1961) The isolation of glycerol-fermenting and lipolytic bacteria from the
rumen of the sheep. Microbiology 25: 227-240.
Huson, D.H., Richter, D.C., Mitra, S., Auch, A.F., and Schuster, S.C. (2009) Methods for comparative
metagenomics. BMC bioinformatics 10: S12.
Huws, S.A., Chiariotti, A., Sarubbi, F., Carfì, F., and Pace, V. (2012) Effects of feeding
Mediterranean buffalo sorghum silage versus maize silage on the rumen microbiota and milk fatty
acid content. The Journal of general and applied microbiology 58: 107-112.
Hwang, O. (2013) Role of oxidative stress in Parkinson's disease. Experimental neurobiology 22: 11-
17.
Jacob, R.A. (1995) The integrated antioxidant system. Nutrition research 15: 755-766.
Jami, E., and Mizrahi, I. (2012) Composition and similarity of bovine rumen microbiota across
individual animals. PloS one 7: e33306.
Jami, E., White, B.A., and Mizrahi, I. (2014) Potential role of the bovine rumen microbiome in
modulating milk composition and feed efficiency. PLoS One 9: e85423.

40
Jami, E., Israel, A., Kotser, A., and Mizrahi, I. (2013) Exploring the bovine rumen bacterial
community from birth to adulthood. The ISME journal 7: 1069.
Jarvis, G., Strömpl, C., Moore, E., and Thiele, J. (1999) Isolation and characterization of two
glycerol‐fermenting clostridial strains from a pilot scale anaerobic digester treating high lipid‐content
slaughterhouse waste. Journal of applied microbiology 86: 412-420.
Jenab, M., and Thompson, L.U. (1996) The influence of flaxseed and lignans on colon carcinogenesis
and β-glucuronidase activity.
Jenkins, B.G., Koroshetz, W.J., Beal, M.F., and Rosen, B.R. (1993) Evidence for irnnairment of
energy metabofism in vivo in Huntington's disease using localized 1H NMR spectroscopy. Neurology
43: 2689-2689.
Johnsson, P., Kamal-Eldin, A., Lundgren, L.N., and Åman, P. (2000) HPLC method for analysis of
secoisolariciresinol diglucoside in flaxseeds. Journal of agricultural and food chemistry 48: 5216-
5219.
Kado, C.I. (1998) Origin and evolution of plasmids. Antonie Van Leeuwenhoek 73: 117-126.
Kerr, J.F., Wyllie, A.H., and Currie, A.R. (1972) Apoptosis: a basic biological phenomenon with
wide-ranging implications in tissue kinetics. British journal of cancer 26: 239.
Khlebnikov, A.I., Schepetkin, I.A., Domina, N.G., Kirpotina, L.N., and Quinn, M.T. (2007) Improved
quantitative structure–activity relationship models to predict antioxidant activity of flavonoids in
chemical, enzymatic, and cellular systems. Bioorganic & medicinal chemistry 15: 1749-1770.
Kim, M., Morrison, M., and Yu, Z. (2011) Status of the phylogenetic diversity census of ruminal
microbiomes. FEMS microbiology ecology 76: 49-63.
King, E.E., Smith, R.P., St-Pierre, B., and Wright, A.-D.G. (2011) Differences in the rumen
methanogen populations of lactating Jersey and Holstein dairy cows under the same diet regimen.
Applied and Environmental Microbiology 77: 5682-5687.
Kirkman, H.N., and Gaetani, G.F. (2007) Mammalian catalase: a venerable enzyme with new
mysteries. Trends in biochemical sciences 32: 44-50.
Kitts, D., Yuan, Y., Wijewickreme, A., and Thompson, L. (1999) Antioxidant activity of the flaxseed
lignan secoisolariciresinol diglycoside and its mammalian lignan metabolites enterodiol and
enterolactone. Molecular and cellular biochemistry 202: 91-100.
Knekt, P., Reunanen, A., Jävinen, R., Seppänen, R., Heliövaara, M., and Aromaa, A. (1994)
Antioxidant vitamin intake and coronary mortality in a longitudinal population study. American
journal of epidemiology 139: 1180-1189.
Kobayashi, Y., and Onodera, R. (1999) Application of molecular biology to rumen microbes-Review.
Asian-Australasian Journal of Animal Sciences 12: 77-83.
Kong, Y., Teather, R., and Forster, R. (2010) Composition, spatial distribution, and diversity of the
bacterial communities in the rumen of cows fed different forages. FEMS microbiology ecology 74:
612-622.
Koonin, E.V., and Wolf, Y.I. (2008) Genomics of bacteria and archaea: the emerging dynamic view
of the prokaryotic world. Nucleic acids research 36: 6688-6719.
Kumar, S., Choudhury, P.K., Carro, M.D., Griffith, G.W., Dagar, S.S., Puniya, M. et al. (2014) New
aspects and strategies for methane mitigation from ruminants. Applied Microbiology and
Biotechnology 98: 31-44.
Landis, G.N., and Tower, J. (2005) Superoxide dismutase evolution and life span regulation.
Mechanisms of ageing and development 126: 365-379.
Levine, A., Tenhaken, R., Dixon, R., and Lamb, C. (1994) H 2 O 2 from the oxidative burst
orchestrates the plant hypersensitive disease resistance response. Cell 79: 583-593.
Levine, A., Pennell, R.I., Alvarez, M.E., Palmer, R., and Lamb, C. (1996) Calcium-mediated
apoptosis in a plant hypersensitive disease resistance response. Current Biology 6: 427-437.
Li, M., Zhou, M., Adamowicz, E., and Basarab, J.A. (2012) Characterization of bovine ruminal
epithelial bacterial communities using 16S rRNA sequencing, PCR-DGGE, and qRT-PCR analysis.
Veterinary microbiology 155: 72-80.
Lima, L., Palin, M., Santos, G., Benchaar, C., and Petit, H. (2016) Dietary flax meal and abomasal
infusion of flax oil on microbial β-glucuronidase activity and concentration of enterolactone in
ruminal fluid, plasma, urine and milk of dairy cows. Animal Feed Science and Technology 215: 85-
91.

41
Lindqvist, H., Nadeau, E., Waller, K.P., Jensen, S.K., and Johansson, B. (2011) Effects of RRR-α-
tocopheryl acetate supplementation during the transition period on vitamin status in blood and milk of
organic dairy cows during lactation. Livestock Science 142: 155-163.
Lindsay, D. (2006) Ruminant metabolism in the last 100 years. The Journal of Agricultural Science
144: 205.
Liu, J.h., Zhang, M.l., Zhang, R.y., Zhu, W.y., and Mao, S.y. (2015) Comparative studies of the
composition of bacterial microbiota associated with the ruminal content, ruminal epithelium and in
the faeces of lactating dairy cows. Microbial biotechnology 9: 257-268.
Lowcock, E.C., Cotterchio, M., and Boucher, B.A. (2013) Consumption of flaxseed, a rich source of
lignans, is associated with reduced breast cancer risk. Cancer Causes & Control 24: 813-816.
Luo, Y., Pfister, P., Leisinger, T., and Wasserfallen, A. (2001) The Genome of Archaeal Prophage
ΨM100 Encodes the Lytic Enzyme Responsible for Autolysis ofMethanothermobacter wolfeii.
Journal of Bacteriology 183: 5788-5792.
Luzzatto L, M.A., Vulliamy TJ (2001) Glucose-6-phosphate dehydrogenase deficiency. In The
Metabolic & Molecular Bases of Inherited Disease. Scriver C, B.A., Sly W, Valle D (ed). New York:
McGraw Hill, pp. 4517–4553.
Manczak, M., Anekonda, T.S., Henson, E., Park, B.S., Quinn, J., and Reddy, P.H. (2006)
Mitochondria are a direct site of Aβ accumulation in Alzheimer's disease neurons: implications for
free radical generation and oxidative damage in disease progression. Human molecular genetics 15:
1437-1449.
Margis, R., Dunand, C., Teixeira, F.K., and Margis‐Pinheiro, M. (2008) Glutathione peroxidase
family–an evolutionary overview. The FEBS journal 275: 3959-3970.
Matés, J.M., Pérez-Gómez, C., and De Castro, I.N. (1999) Antioxidant enzymes and human diseases.
Clinical biochemistry 32: 595-603.
Matumoto-Pintro, P.T., Petit, H.V., Giroux, H.J., Côrtes, C., Gagnon, N., and Britten, M. (2011)
Effect of flaxseed lignans added to milk or fed to cows on oxidative degradation of dairy beverages
enriched with polyunsaturated fatty acids. Journal of dairy research 78: 111-117.
McAllister, T., and Cheng, K.-J. (1996) Microbial strategies in the ruminal digestion of cereal grains.
Animal Feed Science and Technology 62: 29-36.
McCord, J.M., and Fridovich, I. (1969) Superoxide dismutase an enzymic function for erythrocuprein
(hemocuprein). Journal of Biological chemistry 244: 6049-6055.
Meagher, L.P., and Beecher, G.R. (2000) Assessment of data on the lignan content of foods. Journal
of food composition and analysis 13: 935-947.
Meagher, L.P., Beecher, G.R., Flanagan, V.P., and Li, B.W. (1999) Isolation and characterization of
the lignans, isolariciresinol and pinoresinol, in flaxseed meal. Journal of agricultural and food
chemistry 47: 3173-3180.
Miguel, V., Otero, J.A., García-Villalba, R., Tomás-Barberán, F., Espín, J.C., Merino, G., and
Álvarez, A.I. (2014) Role of ABCG2 in transport of the mammalian lignan enterolactone and its
secretion into milk in Abcg2 knockout mice. Drug Metabolism and Disposition 42: 943-946.
Mittler, R. (2002) Oxidative stress, antioxidants and stress tolerance. Trends in plant science 7: 405-
410.
Muir, A.D., and Westcott, N.D. (2003) Flax: the genus Linum. Saskatchewan, Canada: CRC Press.
Münzel, T., Gori, T., Bruno, R.M., and Taddei, S. (2010) Is oxidative stress a therapeutic target in
cardiovascular disease? European heart journal 31: 2741-2748.
Nakabeppu, Y., Tsuchimoto, D., Yamaguchi, H., and Sakumi, K. (2007) Oxidative damage in nucleic
acids and Parkinson's disease. Journal of neuroscience research 85: 919-934.
Nikolova, G. (2012) Oxidative stress and Parkinson disease. Trakia J Sci 10: 92-100.
Nishikimi, M., and Yagi, K. (1991) Molecular basis for the deficiency in humans of gulonolactone
oxidase, a key enzyme for ascorbic acid biosynthesis. The American journal of clinical nutrition 54:
1203S-1208S.
Nunomura, A., Castellani, R.J., Zhu, X., Moreira, P.I., Perry, G., and Smith, M.A. (2006)
Involvement of oxidative stress in Alzheimer disease. Journal of Neuropathology & Experimental
Neurology 65: 631-641.
42
Otero, J., Miguel, V., González-Lobato, L., García-Villalba, R., Espín, J., Prieto, J. et al. (2016) Effect
of bovine ABCG2 polymorphism Y581S SNP on secretion into milk of enterolactone, riboflavin and
uric acid. animal 10: 238-247.
Pace, N.R., Stahl, D.A., Lane, D.J., and Olsen, G.J. (1985) Analyzing natural microbial populations
by rRNA sequences. ASM American Society for Microbiology News 51: 4-12.
Peterson, J., Dwyer, J., Adlercreutz, H., Scalbert, A., Jacques, P., and McCullough, M.L. (2010)
Dietary lignans: physiology and potential for cardiovascular disease risk reduction. Nutrition reviews
68: 571-603.
Petit, H., and Gagnon, N. (2009a) Milk concentrations of the mammalian lignans enterolactone and
enterodiol, milk production, and whole tract digestibility of dairy cows fed diets containing different
concentrations of flaxseed meal. Animal feed science and technology 152: 103-111.
Petit, H., and Gagnon, N. (2009b) Concentration of the mammalian lignans enterolactone and
enterodiol in milk of cows fed diets containing different concentrations of whole flaxseed. Animal 3:
1428-1435.
Petit, H.V., Gagnon, N., Mir, P.S., Cao, R., and Cui, S. (2009) Milk concentration of the mammalian
lignan enterolactone, milk production, milk fatty acid profile, and digestibility in dairy cows fed diets
containing whole flaxseed or flaxseed meal. Journal of dairy research 76: 257-264.
Pfister, P., Wasserfallen, A., Stettler, R., and Leisinger, T. (1998) Molecular analysis of
Methanobacterium phage ΨM2. Molecular microbiology 30: 233-244.
Pocernich, C.B., and Butterfield, D.A. (2012) Elevation of glutathione as a therapeutic strategy in
Alzheimer disease. Biochimica et Biophysica Acta (BBA)-Molecular Basis of Disease 1822: 625-630.
Pope, S., Land, J.M., and Heales, S.J. (2008) Oxidative stress and mitochondrial dysfunction in
neurodegeneration; cardiolipin a critical target? Biochimica et Biophysica Acta (BBA)-Bioenergetics
1777: 794-799.
Prasad, K. (2000) Antioxidant activity of secoisolariciresinol diglucoside-derived metabolites,
secoisolariciresinol, enterodiol, and enterolactone. International journal of angiology 9: 220-225.
Prins, R., Lankhorst, A., Van der Meer, P., and Van Nevel, C. (1975) Some characteristics
ofAnaerovibrio lipolytica, a rumen lipolytic organism. Antonie van Leeuwenhoek 41: 1-11.
Puniya, A.K., Singh, R., and Kamra, D.N. (2015) Rumen microbiology: from evolution to revolution:
Springer.
Purushe, J., Fouts, D.E., Morrison, M., White, B.A., Mackie, R.I., Coutinho, P.M. et al. (2010)
Comparative genome analysis of Prevotella ruminicola and Prevotella bryantii: insights into their
environmental niche. Microbial ecology 60: 721-729.
Qi, M., Wang, P., O'Toole, N., Barboza, P.S., Ungerfeld, E., Leigh, M.B. et al. (2011) Snapshot of the
eukaryotic gene expression in muskoxen rumen—a metatranscriptomic approach. PloS one 6: e20521.
Quartieri, A., García‐Villalba, R., Amaretti, A., Raimondi, S., Leonardi, A., Rossi, M., and Tomàs‐Barberàn, F. (2016) Detection of novel metabolites of flaxseed lignans in vitro and in vivo. Molecular
nutrition & food research 60: 1590-1601.
Raffaelli, B., Hoikkala, A., Leppälä, E., and Wähälä, K. (2002) Enterolignans. Journal of
Chromatography B 777: 29-43.
Rafieian-Kopaei, M., Baradaran, A., and Rafieian, M. (2013) Oxidative stress and the paradoxical
effects of antioxidants. Journal of Research in Medical Sciences 18: 628.
Rahman, K. (2007) Studies on free radicals, antioxidants, and co-factors. Clinical interventions in
aging 2: 219.
Rajendran, P., Nandakumar, N., Rengarajan, T., Palaniswami, R., Gnanadhas, E.N.,
Lakshminarasaiah, U. et al. (2014) Antioxidants and human diseases. Clinica chimica acta 436: 332-
347.
Ratnam, D.V., Ankola, D., Bhardwaj, V., Sahana, D.K., and Kumar, M.R. (2006) Role of antioxidants
in prophylaxis and therapy: A pharmaceutical perspective. Journal of controlled release 113: 189-
207.
Repine, J.E., Bast, A., Lankhorst, I., and Group, O.S.S. (1997) Oxidative stress in chronic obstructive
pulmonary disease. American journal of respiratory and critical care medicine 156: 341-357.
Reuter, S., Gupta, S.C., Chaturvedi, M.M., and Aggarwal, B.B. (2010) Oxidative stress,
inflammation, and cancer: how are they linked? Free Radical Biology and Medicine 49: 1603-1616.

43
Rhee, J.-K., Ahn, D.-G., Kim, Y.-G., and Oh, J.-W. (2005) New thermophilic and thermostable
esterase with sequence similarity to the hormone-sensitive lipase family, cloned from a metagenomic
library. Applied and environmental microbiology 71: 817-825.
Riesenfeld, C.S., Goodman, R.M., and Handelsman, J. (2004) Uncultured soil bacteria are a reservoir
of new antibiotic resistance genes. Environmental microbiology 6: 981-989.
Russell, J.B., O'connor, J., Fox, D., Van Soest, P., and Sniffen, C. (1992) A net carbohydrate and
protein system for evaluating cattle diets: I. Ruminal fermentation. Journal of animal science 70:
3551-3561.
Schogor, A.L., Huws, S.A., Santos, G.T., Scollan, N.D., Hauck, B.D., Winters, A.L. et al. (2014)
Ruminal Prevotella spp. may play an important role in the conversion of plant lignans into human
health beneficial antioxidants. PloS one 9: e87949.
Sen, S., Chakraborty, R., Sridhar, C., Reddy, Y., and De, B. (2010) Free radicals, antioxidants,
diseases and phytomedicines: current status and future prospect. International Journal of
Pharmaceutical Sciences Review and Research 3: 91-100.
Shabat, S.K.B., Sasson, G., Doron-Faigenboim, A., Durman, T., Yaacoby, S., Miller, M.E.B. et al.
(2016) Specific microbiome-dependent mechanisms underlie the energy harvest efficiency of
ruminants. The ISME journal 10: 2958.
Shrivastava., B., Jain., K.K., Kumar., R., Prusty., S., Kumar., S., Chakraborty., S. et al. (2015)
‘Omics’ Approaches to Understand and Manipulate Rumen Microbial Function. In Rumen
Microbiology: From Evolution to Revolution. Puniya., A.K., Singh., R., and Kamra., D.N. (eds).
India: Springer.
Sikora, E., Cieślik, E., and Topolska, K. (2008) The sources of natural antioxidants. ACTA
Scientiarum Polonorum Technologia Alimentaria 7: 5-17.
Simon, C., and Daniel, R. (2010) Construction of small-insert and large-insert metagenomic libraries.
Metagenomics: Methods and Protocols: 39-50.
Simon, C., and Daniel, R. (2011) Metagenomic analyses: past and future trends. Applied and
environmental microbiology 77: 1153-1161.
Simon, C., Herath, J., Rockstroh, S., and Daniel, R. (2009) Rapid identification of genes encoding
DNA polymerases by function-based screening of metagenomic libraries derived from glacial ice.
Applied and environmental microbiology 75: 2964-2968.
Sirohi, S.K., Singh, N., Dagar, S.S., and Puniya, A.K. (2012) Molecular tools for deciphering the
microbial community structure and diversity in rumen ecosystem. Applied microbiology and
biotechnology 95: 1135-1154.
Skoumalová, A., and Hort, J. (2012) Blood markers of oxidative stress in Alzheimer's disease.
Journal of cellular and molecular medicine 16: 2291-2300.
Spector, A. (1995) Oxidative stress-induced cataract: mechanism of action. The FASEB Journal 9:
1173-1182.
Stamp, L.K., Khalilova, I., Tarr, J.M., Senthilmohan, R., Turner, R., Haigh, R.C. et al. (2012)
Myeloperoxidase and oxidative stress in rheumatoid arthritis. Rheumatology 51: 1796-1803.
Steele, H.L., Jaeger, K.-E., Daniel, R., and Streit, W.R. (2009) Advances in recovery of novel
biocatalysts from metagenomes. Journal of molecular microbiology and biotechnology 16: 25-37.
Steinshamn, H., Purup, S., Thuen, E., and Hansen-Møller, J. (2008) Effects of clover-grass silages and
concentrate supplementation on the content of phytoestrogens in dairy cow milk. Journal of Dairy
Science 91: 2715-2725.
Stevenson, D.M., and Weimer, P.J. (2007) Dominance of Prevotella and low abundance of classical
ruminal bacterial species in the bovine rumen revealed by relative quantification real-time PCR.
Applied microbiology and biotechnology 75: 165-174.
Stewart, C.S., Flint, H. J., Bryant, M. P. (1997) The rumen bacteria. In The rumen microbial
ecosystem. Hobson, P.N., Stewart, C. S. (ed): Blackie Academic and Professional Publishers, pp. 10-
72.
Stiverson, J., Morrison, M., and Yu, Z. (2011) Populations of select cultured and uncultured bacteria
in the rumen of sheep and the effect of diets and ruminal fractions. International journal of
microbiology 2011.
44
Tiwari, B.S., Belenghi, B., and Levine, A. (2002) Oxidative stress increased respiration and
generation of reactive oxygen species, resulting in ATP depletion, opening of mitochondrial
permeability transition, and programmed cell death. Plant physiology 128: 1271-1281.
Touré, A., and Xueming, X. (2010) Flaxseed lignans: source, biosynthesis, metabolism, antioxidant
activity, bio‐active components, and health benefits. Comprehensive reviews in food science and food
safety 9: 261-269.
Uchiyama, T., and Miyazaki, K. (2009) Functional metagenomics for enzyme discovery: challenges
to efficient screening. Current Opinion in Biotechnology 20: 616-622.
Uchiyama, T., Abe, T., Ikemura, T., and Watanabe, K. (2005) Substrate-induced gene-expression
screening of environmental metagenome libraries for isolation of catabolic genes. Nature
biotechnology 23.
Urakawa, H., Katsuki, A., Sumida, Y., Gabazza, E.C., Murashima, S., Morioka, K. et al. (2003)
Oxidative stress is associated with adiposity and insulin resistance in men. The Journal of Clinical
Endocrinology & Metabolism 88: 4673-4676.
van Herwaarden, A.E., Wagenaar, E., Merino, G., Jonker, J.W., Rosing, H., Beijnen, J.H., and
Schinkel, A.H. (2007) Multidrug transporter ABCG2/breast cancer resistance protein secretes
riboflavin (vitamin B2) into milk. Molecular and cellular biology 27: 1247-1253.
Vasanthi, P., Nalini, G., and Rajasekhar, G. (2009) Status of oxidative stress in rheumatoid arthritis.
International journal of rheumatic diseases 12: 29-33.
Velalopoulou, A., Tyagi, S., Pietrofesa, R.A., Arguiri, E., and Christofidou-Solomidou, M. (2015)
The flaxseed-derived lignan phenolic secoisolariciresinol diglucoside (SDG) protects non-malignant
lung cells from radiation damage. International journal of molecular sciences 17: 7.
Vincent, A.M., Russell, J.W., Low, P., and Feldman, E.L. (2004) Oxidative stress in the pathogenesis
of diabetic neuropathy. Endocrine reviews 25: 612-628.
Wang, G.-Y.-S., Graziani, E., Waters, B., Pan, W., Li, X., McDermott, J. et al. (2000a) Novel natural
products from soil DNA libraries in a streptomycete host. Organic letters 2: 2401-2404.
Wang, L.-Q. (2002) Mammalian phytoestrogens: enterodiol and enterolactone. Journal of
Chromatography B 777: 289-309.
Wang, L.-Q., Meselhy, M.R., Li, Y., QIN, G.-W., and Hattori, M. (2000b) Human intestinal bacteria
capable of transforming secoisolariciresinol diglucoside to mammalian lignans, enterodiol and
enterolactone. Chemical and pharmaceutical bulletin 48: 1606-1610.
Wang, L., Hatem, A., Catalyurek, U.V., Morrison, M., and Yu, Z. (2013) Metagenomic insights into
the carbohydrate-active enzymes carried by the microorganisms adhering to solid digesta in the rumen
of cows. PloS one 8: e78507.
Wang, P., Qi, M., Barboza, P., Leigh, M.B., Ungerfeld, E., Selinger, L.B. et al. (2011) Isolation of
high-quality total RNA from rumen anaerobic bacteria and fungi, and subsequent detection of
glycoside hydrolases. Canadian journal of microbiology 57: 590-598.
Wang, X., Wang, W., Li, L., Perry, G., Lee, H.-g., and Zhu, X. (2014) Oxidative stress and
mitochondrial dysfunction in Alzheimer's disease. Biochimica et Biophysica Acta (BBA)-Molecular
Basis of Disease 1842: 1240-1247.
Waschkowitz, T., Rockstroh, S., and Daniel, R. (2009) Isolation and characterization of
metalloproteases with a novel domain structure by construction and screening of metagenomic
libraries. Applied and environmental microbiology 75: 2506-2516.
Wei, C., Lin, S., Wu, J., Zhao, G., Zhang, T., and Zheng, W. (2016) Supplementing Vitamin E to the
Ration of Beef Cattle Increased the Utilization Efficiency of Dietary Nitrogen. Asian-Australasian
journal of animal sciences 29: 372.
Wendel, A. (1980) Glutathione peroxidase. Enzymatic basis of detoxication 1: 333-353.
Williams, K.L. (2007) Endotoxins: pyrogens, LAL testing and depyrogenation: CRC Press.
Wood-Kaczmar, A., Gandhi, S., and Wood, N. (2006) Understanding the molecular causes of
Parkinson's disease. Trends in molecular medicine 12: 521-528.
Yakovchuk, P., Protozanova, E., and Frank-Kamenetskii, M.D. (2006) Base-stacking and base-pairing
contributions into thermal stability of the DNA double helix. Nucleic acids research 34: 564-574.
Yoshida, A., and Beutler, E. (1986) Glucose-6-phosphate dehydrogenase. New York: Academic
Press.

45
Zachut, M. (2015) Concentrations of the mammalian lignan enterolactone in preovulatory follicles
and the correlation with intrafollicular estradiol in dairy cows fed extruded flaxseed. Journal of dairy
science 98: 8814-8817.
Zhou, M., Hernandez-Sanabria, E., and Guan, L.L. (2010) Characterization of variation in rumen
methanogenic communities under different dietary and host feed efficiency conditions, as determined
by PCR-denaturing gradient gel electrophoresis analysis. Applied and environmental microbiology 76:
3776-3786.
Zhou, W., Wang, G., Han, Z., Yao, W., and Zhu, W. (2009) Metabolism of flaxseed lignans in the
rumen and its impact on ruminal metabolism and flora. Animal feed science and technology 150: 18-
26.
Zhu, H.-Y., Li, M.-X., Yang, D.-H., Tao, Y.-L., Zhang, Y., and Liu, S.-L. (2014) Biotransformation
of the SDG in defatted flaxseed into END co-cultured by three single bacterial colonies. Process
Biochemistry 49: 19-24.
46
II. GENERAL OBJECTIVES
Unculturable rumen species are a bottleneck in rumen prospection for novel genes,
therefore, metagenomic approaches must be used in order to access to genomic information
regarding rumen metabolism.
To prospect genes and enzymes from the rumen microbiota linked to SDG breakdown
a fosmid library was constructed using Escherichia coli as bacterial host and DNA inserts
from the rumen microbiome and SDG lignan metabolism was screened.
Moreover, the transcripts and differentially expressed genes linked to SDG
metabolism were assessed by means of the isolation of RNA from SDG and rumen fluid
incubations.
47
III. Assessing secoisolariciresinol diglucoside metabolism in the rumen by 1
means of a fosmid library 2
(Normas: Environmental Microbiology) 3
4
SUMMARY 5
6
Secoisolariciresinol diglucoside, a lignan found in many plants, predominantly in flaxseed. 7
The plant lignan can play active role enhancing antioxidant capacity, however, it need to be 8
metabolized into enterolignans, process which the gut microbiota is responsible. The rumen is 9
a known efficient environment for lignan metabolism, which comprises the breakdown of 10
SDG into secoisolariciresinol, then to enterodiol and enterolactone. The product 11
enterolactone increases concentration in the rumen as flax is added in the diet of ruminants 12
and the compound can be transferred to milk, benefiting human health by the functional food 13
intake, preventing many oxidative-related disorders such as cardiovascular diseases, 14
atherosclerosis, Alzheimer’s disease, breast-cancer and others. Although the knowledge on 15
lignans metabolism in the rumen, little information is available regarding the microorganisms 16
linked to secoisolariciresinol diglucoside breakdown. The main bottleneck is that just few 17
species of the rumen microbiome can be cultured in laboratory conditions, and thus, 18
metagenomic approaches are needed to access the rumen ecology by-passing the in vitro 19
culture. Therefore, a fosmid library was constructed using rumen microbes DNA inserts from 20
the rumen of cows fed up to 15g/100g (dry matter basis) of flax meal, resulting on an 11,520 21
fosmid clones library, using Escherichia coli strain EPI300 as host bacteria. The library was 22
screened for secoisolariciresinol diglucoside breakdown capacity using high-performance 23
liquid chromatography and positive clones followed to plasmid DNA purification, deep 24
sequencing and bioinformatic data analysis. Two out of 30 library plates showed effective 25
secoisolariciresinol diglucoside breakdown, however, no metabolism products were identified 26
and no putative gene linked to direct secoisolariciresinol diglucoside breakdown was 27
identified from clones genome. To our knowledge this is the first fosmid library constructed 28
to prospect rumen microorganisms with active role in plant lignans metabolism, thus, more 29
studies regarding the subject must be carried out to broaden genes and enzymes involved in 30
the process. 31
Key-words: lignans, metagenomic, ruminants, ruminal microbes 32
RUNNING TITLE: SDG breakdown prospected by a fosmid library 33

48
34
INTRODUCTION 35
Oxidative disorders, such as Alzheimer’s disease, Parkinson’s disease, cardiovascular 36
disease, atherosclerosis and others may be caused by an imbalance between reactive oxygen 37
species (ROS) formation and its control (Gella and Durany, 2009; Münzel et al., 2010; 38
Hwang, 2013; Rajendran et al., 2014). Plant antioxidants are highly recommended to prevent 39
oxidative-related diseases, and between them, the lignans, found in great concentration in 40
plants such as flaxseed (Linum usitatissimum) (Choo et al., 2007; Goyal et al., 2014). The 41
plant phytoestrogenic compounds, such as secoisolariciresinol diglucoside (SDG) and 42
secoisolariciresinol (SECO) can be metabolized into enterolignans, such as enterodiol (ED) 43
and enterolactone (EL) by the consumer gut microbiota implying in the formation of more 44
effective antioxidant compounds (Wang et al., 2000; Clavel et al., 2006). Lignans have been 45
proven as powerful ROS scavenger lowering lipid peroxidation, reducing deoxyribose 46
oxidation, DNA strand breakage and other oxidation damages (Kitts et al., 1999; Matumoto-47
Pintro et al., 2011), due to lignans antiestrogenic, antioxidant, anti-inflammatory, 48
anticarcinogenic, and cardioprotective activities (Adolphe et al., 2010; Imran et al., 2015). 49
Furthermore, with oxidative control capacity up to 5% higher than compounds such as 50
vitamin E (α-tocopherol), known by its exceptional antioxidant ability (Prasad, 2000). In 51
addition, the phytoestrogens can also prevent oestrogen-induced cancers, such as breast 52
cancer (Buck et al., 2010; Lowcock et al., 2013). 53
Lignans can also be found in ruminants products, such as milk, improving the 54
beneficial effects of its consumption and improving the animals health status. Flaxseed 55
supplementation in ruminants have been shown to increase enterolactone concentration in the 56
rumen fluid, plasma, urine and milk (Gagnon et al., 2009; Petit and Gagnon, 2009a; Petit et 57
al., 2009; Matumoto-Pintro et al., 2011; Lima et al., 2016). In addition, as showed by Ghedini 58
et al. (2017), the mammalian lignan EL is absorbed by new-borns fed enterolatone-enriched 59
milk, resulting in high plasma concentration of the enterolignans. Therefore, human-specific 60
studies are challenging due to the limitations of using animals as model for humans, however, 61
based on the pharmacokinetics data of EL, humans should consume EL-enriched milk in 62
combination with other lignan-rich sources to enhance potential health benefits (Ghedini et 63
al., 2017). 64
The rumen microbiome is such a complex community which can provide an 65
enormous range of novel discoveries, such as cellulases (Dai et al., 2015), lipases/esterases 66
(Privé et al., 2015), antimicrobial peptides (Oyama et al., 2017), and others. Rumen 67

49
microorganisms can efficiently convert SDG to SECO, then to enterolignans (ED, and then to 68
EL) (Côrtes et al., 2008; Petit and Gagnon, 2009a, b; Zhou et al., 2009; Schogor et al., 2014; 69
Lima et al., 2016). It is been proven that the rumen environment is efficient in converting 70
plant lignans into enterolignans, however, the microbes responsible for the conversion and 71
the genes/enzymes activated to carry the breakdown are not clear yet. The main bottle neck 72
regarding the rumen community ecology is that it cannot be mimic efficiently on laboratory 73
conditions (in vitro) for most of the species (>90%) (Flint et al., 2008; Kim et al., 2011). 74
Therefore, the meta-omics technologies (metagenomics, metatranscriptomics, metabolomics 75
and metaproteomics), are powerful tools to bypass the need for isolation or cultivation in 76
laboratory conditions (Ferrer et al., 2009; Simon and Daniel, 2011). A reliable tool to assess 77
the rumen community genes involved on the metabolism of plant lignans are metagenomic 78
fosmid libraries. Thus, technology have been used to help scientists to discover and identify 79
novel biocatalysts/genes/enzymes linked to many biological processes. For instance, 80
cellulases (Healy et al., 1995; Duan et al., 2009), chitinases (Hjort et al., 2009), DNA 81
polymerases (Simon et al., 2009), proteases (Waschkowitz et al., 2009), antibiotics 82
(Riesenfeld et al., 2004) and lignocellulosic enzymes (Colombo et al., 2016). 83
This work combines the need for further findings on lignans metabolism and the 84
complex rumen community yet to be deeply explored in the SDG breakdown pathways. 85
Therefore, a metagenomic library using fosmid inserts from the rumen was constructed and 86
screened. 87
88
RESULTS AND DISCUSSION 89
90
SDG incubation 91
92
The rumen microorganisms play active role in flaxseed lignans (Côrtes et al., 2008; 93
Petit and Gagnon, 2009a, b; Zhou et al., 2009; Schogor et al., 2014; Lima et al., 2016). 94
Schogor et al. (2014) showed that after 24h incubation of rumen fluid with SDG, the 95
remaining SDG content was 2.1% and 46.6% of SECO was produced based on initial SDG 96
amount. Therefore, it was decided to produce a fosmid library with random DNA inserts from 97
the rumen microbes in order to identify possible clones with capacity to breakdown SDG. 98
The assessment of SDG breakdown was carried out by serial incubations (quadruplicates) of 99
SDG (0.364 nM), for 24h incubation (total volume 1000 µl). The remaining SDG content was 100
calculated based on HPLC analysis and standard curve (Table 1). 101
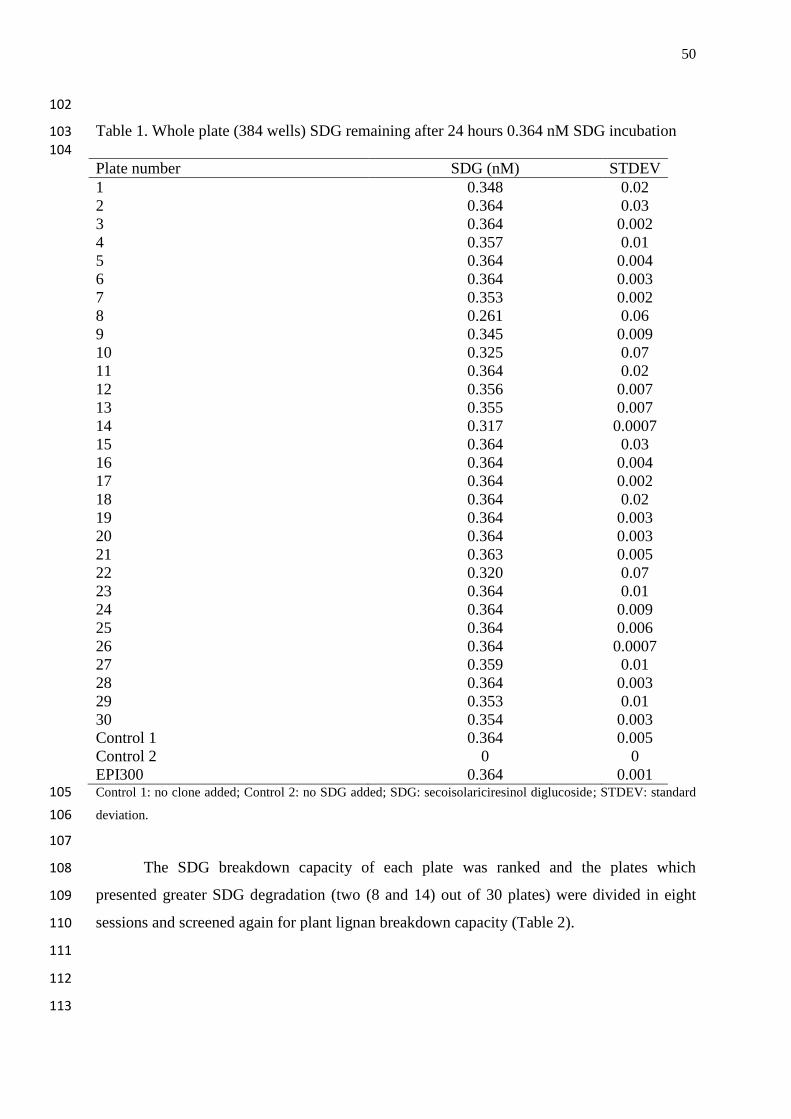
50
102
Table 1. Whole plate (384 wells) SDG remaining after 24 hours 0.364 nM SDG incubation 103
104
Plate number SDG (nM) STDEV
1 0.348 0.02
2 0.364 0.03
3 0.364 0.002
4 0.357 0.01
5 0.364 0.004
6 0.364 0.003
7 0.353 0.002
8 0.261 0.06
9 0.345 0.009
10 0.325 0.07
11 0.364 0.02
12 0.356 0.007
13 0.355 0.007
14 0.317 0.0007
15 0.364 0.03
16 0.364 0.004
17 0.364 0.002
18 0.364 0.02
19 0.364 0.003
20 0.364 0.003
21 0.363 0.005
22 0.320 0.07
23 0.364 0.01
24 0.364 0.009
25 0.364 0.006
26 0.364 0.0007
27 0.359 0.01
28 0.364 0.003
29 0.353 0.01
30 0.354 0.003
Control 1 0.364 0.005
Control 2 0 0
EPI300 0.364 0.001 Control 1: no clone added; Control 2: no SDG added; SDG: secoisolariciresinol diglucoside; STDEV: standard 105
deviation. 106
107
The SDG breakdown capacity of each plate was ranked and the plates which 108
presented greater SDG degradation (two (8 and 14) out of 30 plates) were divided in eight 109
sessions and screened again for plant lignan breakdown capacity (Table 2). 110
111
112
113

51
114
Table 2. Sessions of selected plates (8 and 14) after 24 hours 0.364 nM SDG incubation 115
Plate session SDG (nM) STDEV
8R1 0.351 0.01
8R2 0.356 0.01
8R3 0.356 0.01
8R4 0.243 0.002
8R5 0.341 0.001
8R6 0.342 0.03
8R7 0.353 0.01
8R8 0.364 0
14R1 0.333 0.01
14R2 0.364 0
14R3 0.364 0
14R4 0.364 0
14R5 0.364 0
14R6 0.364 0
14R7 0.364 0
14R8 0.364 0
Control 1 0.364 0
Control 2 0 0 Control 1: no clone added; Control 2: no SDG added. SDG: secoisolariciresinol diglucoside; STDEV: standard 116
deviation. 117
118
High-Performance Liquid Chromatography (HPLC) and Liquid Chromatograpgy-119
Mass spectrometry (LC-MS) 120
121
According to HPLC lignans standard curves (Appendices), the retention time 122
(minutes) of the lignans analyzed was: 9.3; 11.4; 12.9; and 13.2 for SDG, SECO, ED and EL 123
respectively. 124
The rumen is a known efficient environment for flaxseed lignan metabolism (SDG 125
converted into SECO, ED and EL) and the products can be transferred to plasma, meat and 126
milk (Gagnon et al., 2009; Petit and Gagnon, 2009a; Petit et al., 2009; Matumoto-Pintro et 127
al., 2011; Lima et al., 2016). Thus, SDG breakdown products identification was also carried 128
out. The SDG concentration after incubation (Figure 1) was calculated based on SDG pure 129
standard curve. Additional peaks were assessed for the presence of the SDG breakdown 130
products using HPLC and LC-MS (Figure 2). However, despite of a SDG peak (7.26 131
retention time), none of the lignans products (SECO, enterodiol and enterolactone) were 132
identified (Figure 2). The data was similar to Schogor et al. (2014), that showed that even 133

52
with efficient SDG breakdown of Prevotella bryantii (2.1% of remaining SDG after 24 h 134
incubation) degradation products such as ED might not be detected with spectrometry. 135
136
137
Figure 1. HPLC chromatogram after secoisolariciresinol diglucoside (SDG) incubation 138
(fosmid library screening); A: SDG peak 139
140
141
Figure 2. LC-MS chromatogram after secoisolariciresinol diglucoside (SDG) incubation 142
(Fosmid library screening); peak at 7.26 minutes of retention time: SDG peak. 143
144
Sequencing data 145
146
Three sessions of the selected plated were identified as possible positives for SDG 147
degradation activity (8R4, 8R5 and 14R1). The fosmid clones selected by means of SDG 148
breakdown screening were purified in order to sequence high quality plasmid DNA. The 149
purification was carried on using the QIAprep Spin Miniprep Kit (QIAGEN, UK), following 150
the manufacturer instructions. The plasmid DNA was eluted in Buffer EB (10 mM Tris-Cl, 151
pH 8.5) and kept in the freezer at -80ºC until being sent to sequence in a conventional whole-152
genome resequencing to 15× depth Hiseq sequencing system (Illumina®
), as recommended 153
by other studies using fosmid libraries (Colombo et al., 2016; Maruthamuthu et al., 2016; 154
Lewin et al., 2017). 155

53
The library contained clones with inserts of ~43 kb average size and the three sessions 156
were sequenced, yielding approximately 300 Megabits of total cloned genomic DNA. Basic 157
statistics for fosmid DNA quality (Conventional base calls; Ecoding Sanger / Illumina 1.9): 158
8R4: Total sequences: 434168; Sequences flagged as poor quality: 0 (zero); Sequence length 159
(bp): 101; %GC (guanine-cytosine content): 52. 160
161
8R5: Total sequences: 401587; Sequences flagged as poor quality: 0 (zero); Sequence length 162
(bp): 101; %GC (guanine-cytosine content): 53. 163
164
14R1: Total sequences: 787511; Sequences flagged as poor quality: 0 (zero); Sequence length 165
(bp): 101; %GC (guanine-cytosine content): 52. 166
167
Gene Annotation stats: 168
169
8R4: median coverage depth : 2.936585, final graph has 11870 nodes and n50 of 498, max 170
6322, total: 3537395, using: 847496 out of 867642 reads (kmer length: 21). 171
172
8R5: median coverage depth: 1.520000, final graph has 15860 nodes and n50 of 68, max 580, 173
total: 560521, using 284484/802638 reads (max kmer length: 31). 174
175
14R1: median coverage depth: 8.177429, final graph has 3030 nodes and n50 of 6830, max 176
44909, max 44909, total: 4424666, using 1555262 out of 1572732 reads (kmer length: 21). 177
178
MULTIPLE GENOME ALIGNMENTS – MAUVE 179
180
Mauve employs algorithmic techniques that scale well in the lengths of sequences being 181
aligned (Darling et al., 2010). In the fosmid analysis for instance, each pool fosmid sample 182
(8R4, 8R5 and 14R1) was compared with a reference genome from Escherichia coli k-12 183
(Blattner et al., 1997) (high similarity to E.coli EPI 300) using Mauve (Figure 3, 4 and 5). 184
185

54
186
Figure 3. Fosmid library 8R4 clone genome (red bar bellow) aligned with E. coli reference 187 genome (above). 188 189
190
Figure 4. Fosmid library 8R5 clone genome (red bar bellow) aligned with E. coli reference 191
genome (above). 192 193
194
Figure 5. Fosmid library 14R1 clone genome (red bar bellow) aligned with E. coli reference 195
genome (above). 196 197

55
It is possible to observe that most of the genes from the fosmid genome relates with 198
some part of the reference genome. However, a clear gap is shown in the reference genome. 199
Those genes are not found in the fosmids genome and are listed in Table 3. All genes were 200
analysed for their biologic function on a digging for annoteded genes (GenBank database) 201
and enzymes linked to lignans metabolism, such as glucosidases and cellulases (Renouard et 202
al., 2010; Quartieri et al., 2016). However, no genes related to direct plant lignans 203
metabolism were identified. Genes playing active role on SDG breakdown may not be 204
annoteded previously or no gene from the DNA inserts of the rumen microbes is directly 205
linked to the observed degradation. According to some studies, using E. coli function-based, 206
screening can be problematic owing to insufficient expression of foreign genes (Uchiyama 207
and Miyazaki, 2009). In addition, only 40% of the enzymatic activities in a bacterial 208
community assessed may be detected by random cloning using E. coli cells (Gabor et al., 209
2004). Moreover, another possible issue is that the DNA inserts may be recruited from a 210
numerically prevalent group of microbes (Kong et al., 2010), excluding microbes from less 211
prevalent groups that could play active role on lignan metabolism. Therefore, other methods 212
might be developed to enhance the potential of recovery of putative genes from the rumen for 213
SDG metabolism. 214
Furthermore, according to Kanehisa and Goto (2000), many biological functions of 215
the living cells are a result of many interacting molecules and it cannot be attributed to just a 216
single gene or a single molecule. Therefore, the SDG breakdown pathway might be the result 217
of interacting genes as a complex mechanism. 218
219
220
221
222
223
224
225
226
227
228
229
230
231

56
Table 3. Genes from reference genome that do not relate to fosmid clones 232
Gene Locus_tag Product Gene Locus_tag Product
DCHBEMND_00495 Hypothetical protein DCHBEMND_00529 Hypothetical protein
DCHBEMND_00496 Hypothetical protein DCHBEMND_00530 Hypothetical protein
DCHBEMND_00497 Hypothetical protein entD_1 DCHBEMND_00531 Enterobactin synthase component D
DCHBEMND_00498 Hypothetical protein fepA_1 DCHBEMND_00532 Ferrienterobactin receptor
OmpD_1 DCHBEMND_00499 Outer membrane porin protein OmpD
fes_1 DCHBEMND_00533 Enterochelin esterase
DCHBEMND_00500 Hypothetical protein ybdZ_1 DCHBEMND_00534 Enterobactin biosynthesis
protein YbdZ rrrD_1 DCHBEMND_00501 Lysozyme RrrD entF_1 DCHBEMND_00535 Enterobactin synthase
component F
DCHBEMND_00502 Hypothetical protein fepE_1 DCHBEMND_00536 Ferric enterobactin transport protein FepE
DCHBEMND_00503 Hypothetical protein fepC_1 DCHBEMND_00537 Ferric enterobactin transport
ATP-binding protein FepC DCHBEMND_00503 Hypothetical protein fepG_1 DCHBEMND_00538 Ferric enterobactin transport
system permease protein
FepG DCHBEMND_00504 Hypothetical protein fepD_1 DCHBEMND_00539 Ferric enterobactin transport
sytem permease protein
FepD DCHBEMND_00505 Hypothetical protein entS_1 DCHBEMND_00540 Enterobactin exporter EntS
DCHBEMND_00506 Hypothetical protein fepB_1 DCHBEMND_00541 Ferrienterobactin-binding
periplasmic protein tfaE_1 DCHBEMND_00507 Prophage tail fiber assembly
protein TfaE
entC_1 DCHBEMND_00542 Isochorismate synthase
EntC
DCHBEMND_00508 Hypothetical protein entE_1 DCHBEMND_00543 Enterobactin synthase component E
DCHBEMND_00509 Hypothetical protein entB_1 DCHBEMND_00544 Enterobactin synthase
component B appY_1 DCHBEMND_00510 HTH-type transcriptional
regulator AppY
entA_1 DCHBEMND_00545 2,3-dihydro-2,3-
dihydroxybenzoate
dehydrogenase ompT_1 DCHBEMND_00511 Protease 7 entH_1 DCHBEMND_00546 Proofreading thioesterase
EntH
gadX_1 DCHBEMND_00512 HTH-type transcriptional regulator Gadx
cstA_1 DCHBEMND_00547 Carbon starvation protein A
DCHBEMND_00513 Hypothetical protein DCHBEMND_00548 Hypothetical protein
nfrA_1 DCHBEMND_00514 Bacteriophage adsorption protein A
ybdH_1 DCHBEMND_00549 Putative oxireductase YbdH
DCHBEMND_00515 Hypothetical protein ybdL_1 DCHBEMND_00550 Methionine
aminotransferase cusS_1 DCHBEMND_00516 Sensor kinase CusS noc_1 DCHBEMND_00551 Nucleoid occlusion protein
cusR_1 DCHBEMND_00517 Transcriptional regulatory
protein CusR
cysH_1 DCHBEMND_00552 Phosphosulfate reductase
cusC_1 DCHBEMND_00518 Cation efflux system protein
CusC
ybdO_1 DCHBEMND_00553 Putative HTH-type
transcriptional regulator
YbdO cusF_1 DCHBEMND_00519 Cation efflux system protein
CusF
dsbG_1 DCHBEMND_00554 Thiol:disulphide
interchange protein DsbG cusB_1 DCHBEMND_00520 Cation efflux system protein
CusB
ahpC_1 DCHBEMND_00555 Alkyl hydroperoxide
reductase subunit C
cusA_1 DCHBEMND_00521 Cation efflux system protein CusA
ahpF_1 DCHBEMND_00556 Alkyl hydroperoxide reductase subunit F
pheP_1 DCHBEMND_00522 Phenylalanine-specific
permease
uspG_1 DCHBEMND_00557 Universal stress protein
UP12 ybdG_1 DCHBEMND_00523 Miniconductance
mechanosensitive channel
YbdG
DCHBEMND_00558 Putative zinc-binding
alcohol dehydrogenase
nfsB_1 DCHBEMND_00524 Oxygen-insensitive
NAD(P)H nitroreductase
DCHBEMND_00559 Hypothetical protein
DCHBEMND_00525 Hypothetical protein rnk_1 DCHBEMND_00560 Regulator of nucleoside diphosphate kinase
DCHBEMND_00526 Hypothetical protein rna_1 DCHBEMND_00561 Ribonuclease I
ybdK_1 DCHBEMND_00527 Putative glutamate-cysteine ligase 2
citT_1 DCHBEMND_00562 Citrate carrier
DCHBEMND_00528 Hypothetical protein citG_1 DCHBEMND_00563 2-(5”-triphosphoribosyl)-3’-
dephosphocoenzyme-Asynthase
233
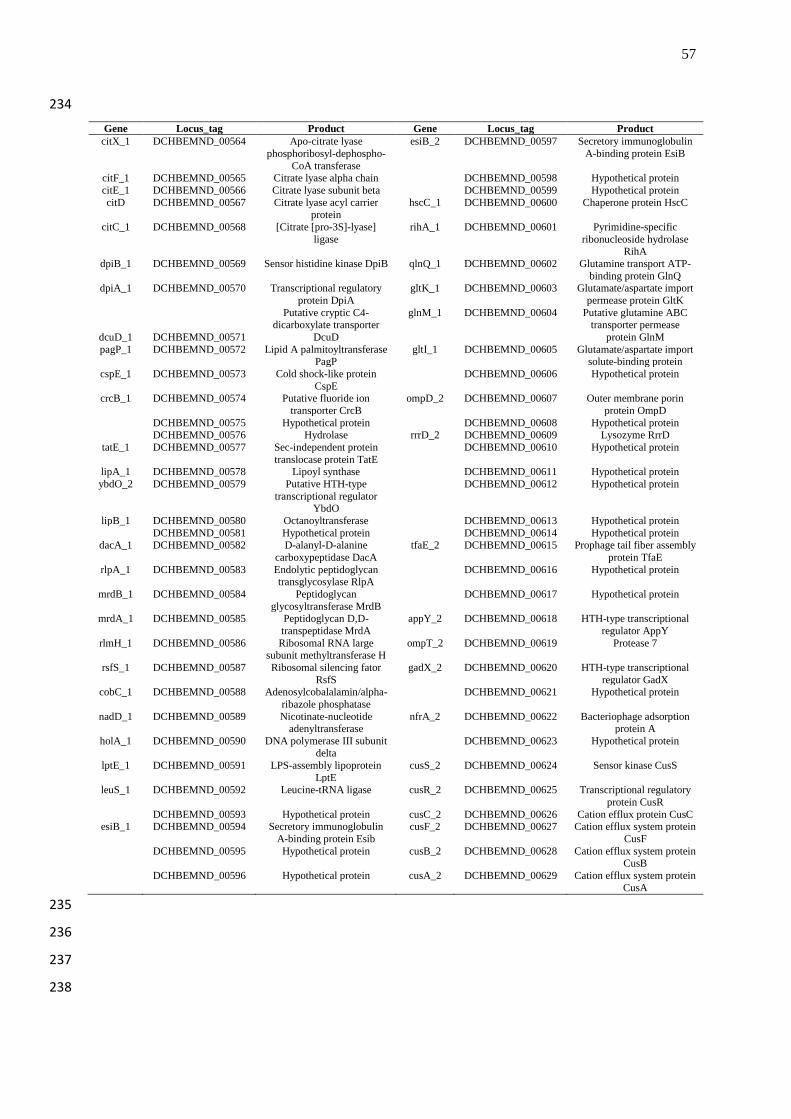
57
234
Gene Locus_tag Product Gene Locus_tag Product
citX_1 DCHBEMND_00564 Apo-citrate lyase
phosphoribosyl-dephospho-
CoA transferase
esiB_2 DCHBEMND_00597 Secretory immunoglobulin
A-binding protein EsiB
citF_1 DCHBEMND_00565 Citrate lyase alpha chain DCHBEMND_00598 Hypothetical protein
citE_1 DCHBEMND_00566 Citrate lyase subunit beta DCHBEMND_00599 Hypothetical protein
citD DCHBEMND_00567 Citrate lyase acyl carrier protein
hscC_1 DCHBEMND_00600 Chaperone protein HscC
citC_1 DCHBEMND_00568 [Citrate [pro-3S]-lyase]
ligase
rihA_1 DCHBEMND_00601 Pyrimidine-specific
ribonucleoside hydrolase RihA
dpiB_1 DCHBEMND_00569 Sensor histidine kinase DpiB qlnQ_1 DCHBEMND_00602 Glutamine transport ATP-
binding protein GlnQ dpiA_1 DCHBEMND_00570 Transcriptional regulatory
protein DpiA
gltK_1 DCHBEMND_00603 Glutamate/aspartate import
permease protein GltK
dcuD_1
DCHBEMND_00571
Putative cryptic C4-dicarboxylate transporter
DcuD
glnM_1 DCHBEMND_00604 Putative glutamine ABC transporter permease
protein GlnM
pagP_1 DCHBEMND_00572 Lipid A palmitoyltransferase PagP
gltI_1 DCHBEMND_00605 Glutamate/aspartate import solute-binding protein
cspE_1 DCHBEMND_00573 Cold shock-like protein
CspE
DCHBEMND_00606 Hypothetical protein
crcB_1 DCHBEMND_00574 Putative fluoride ion
transporter CrcB
ompD_2 DCHBEMND_00607 Outer membrane porin
protein OmpD
DCHBEMND_00575 Hypothetical protein DCHBEMND_00608 Hypothetical protein DCHBEMND_00576 Hydrolase rrrD_2 DCHBEMND_00609 Lysozyme RrrD
tatE_1 DCHBEMND_00577 Sec-independent protein
translocase protein TatE
DCHBEMND_00610 Hypothetical protein
lipA_1 DCHBEMND_00578 Lipoyl synthase DCHBEMND_00611 Hypothetical protein
ybdO_2 DCHBEMND_00579 Putative HTH-type
transcriptional regulator YbdO
DCHBEMND_00612 Hypothetical protein
lipB_1 DCHBEMND_00580 Octanoyltransferase DCHBEMND_00613 Hypothetical protein
DCHBEMND_00581 Hypothetical protein DCHBEMND_00614 Hypothetical protein dacA_1 DCHBEMND_00582 D-alanyl-D-alanine
carboxypeptidase DacA
tfaE_2 DCHBEMND_00615 Prophage tail fiber assembly
protein TfaE
rlpA_1 DCHBEMND_00583 Endolytic peptidoglycan transglycosylase RlpA
DCHBEMND_00616 Hypothetical protein
mrdB_1 DCHBEMND_00584 Peptidoglycan
glycosyltransferase MrdB
DCHBEMND_00617 Hypothetical protein
mrdA_1 DCHBEMND_00585 Peptidoglycan D,D-
transpeptidase MrdA
appY_2 DCHBEMND_00618 HTH-type transcriptional
regulator AppY
rlmH_1 DCHBEMND_00586 Ribosomal RNA large subunit methyltransferase H
ompT_2 DCHBEMND_00619 Protease 7
rsfS_1 DCHBEMND_00587 Ribosomal silencing fator
RsfS
gadX_2 DCHBEMND_00620 HTH-type transcriptional
regulator GadX cobC_1 DCHBEMND_00588 Adenosylcobalalamin/alpha-
ribazole phosphatase
DCHBEMND_00621 Hypothetical protein
nadD_1 DCHBEMND_00589 Nicotinate-nucleotide adenyltransferase
nfrA_2 DCHBEMND_00622 Bacteriophage adsorption protein A
holA_1 DCHBEMND_00590 DNA polymerase III subunit delta
DCHBEMND_00623 Hypothetical protein
lptE_1 DCHBEMND_00591 LPS-assembly lipoprotein
LptE
cusS_2 DCHBEMND_00624 Sensor kinase CusS
leuS_1 DCHBEMND_00592 Leucine-tRNA ligase cusR_2 DCHBEMND_00625 Transcriptional regulatory
protein CusR
DCHBEMND_00593 Hypothetical protein cusC_2 DCHBEMND_00626 Cation efflux protein CusC esiB_1 DCHBEMND_00594 Secretory immunoglobulin
A-binding protein Esib
cusF_2 DCHBEMND_00627 Cation efflux system protein
CusF
DCHBEMND_00595 Hypothetical protein cusB_2 DCHBEMND_00628 Cation efflux system protein CusB
DCHBEMND_00596 Hypothetical protein cusA_2 DCHBEMND_00629 Cation efflux system protein
CusA
235
236
237
238

58
239
Gene Locus_tag Product Gene Locus_tag Product
pheP_2 DCHBEMND_00630 Phenylalanine-specific
permease
ahpC_2
DCHBEMND_00663
Alkyl hydroperoxide
reductase subunit C ybdG_2 DCHBEMND_00631 Miniconductance
mechanosensitive channel
YbdG
ahpF_2 DCHBEMND_00664 Alkyl hydroperoxide
reductase subunit F
nfsB_2 DCHBEMND_00632 Oxygen-insensitive
NAD(P)H nitroreductase
uspG_2 DCHBEMND_00665 Universal stress protein
UP12
DCHBEMND_00633 Hypothetical protein DCHBEMND_00666 Putative zinc-binding alcohol dehydrogenase
DCHBEMND_00634 Hypothetical protein DCHBEMND_00667 Hypothetical protein
ybdK_2 DCHBEMND_00635 Putative glutamate-cysteine ligase 2
rnk_2 DCHBEMND_00668 Regulator of nucleoside diphosphate kinase
DCHBEMND_00636 Hypothetical protein rna_2 DCHBEMND_00669 Ribonuclease I
DCHBEMND_00637 Hypothetical protein citT_2 DCHBEMND_00670 Citrate carrier DCHBEMND_00638 Hypothetical protein citG_2 DCHBEMND_00671 2-(5”-triphosphoribosyl)-3’-
dephosphocoenzyme-
Asynthase entD_2 DCHBEMND_00639 Enterobactin synthase
component D
citX_2 DCHBEMND_00672 Apo-citrate lyase
phosphoribosyl-dephospho-
CoA transferase fepA_2 DCHBEMND_00640 Ferrienterobactin receptor citF_2 DCHBEMND_00673 Citrate lyase alpha chain
fes_2 DCHBEMND_00641 Enterochelin esterase citE_2 DCHBEMND_00674 Citrate lyase subunit beta
ybdZ_2 DCHBEMND_00642 Enterobactin biosynthesis protein YbdZ
citD_2 DCHBEMND_00675 Citrate lyase acyl carrier protein
entF_2 DCHBEMND_00643 Enterobactin synthase
component F
citC_2 DCHBEMND_00676 [Citrate [pro-3S]-lyase]
ligase fepE_2 DCHBEMND_00644 Ferric enterobactin transport
protein FepE
dpiB_2 DCHBEMND_00677 Sensor histidine kinase
DpiB
fepC_2
DCHBEMND_00645
Ferric enterobactin transport
ATP-binding protein FepC
dpiA_2 DCHBEMND_00678 Transcriptional regulatory protein DpiA
fepG_2 DCHBEMND_00646 Ferric enterobactin transport
system permease protein
FepG
dcuD_2 DCHBEMND_00679 Putative cryptic C4-
dicarboxylate transporter
DcuD fepD_2 DCHBEMND_00647 Ferric enterobactin transport
system permease protein
FepD
pagP_2 DCHBEMND_00680 Lipid A
palmitoyltransferase PagP
entS_2 DCHBEMND_00648 Enterobactin exporter EntS cspE_2 DCHBEMND_00681 Cold shock-like protein
CspE
fepB_2 DCHBEMND_00649 Ferrienterobactin_binding periplasmic protein
crcB_2 DCHBEMND_00682 Putative fluoride ion transporter CrcB
entC_2 DCHBEMND_00650 Isochorismate synthase EntC DCHBEMND_00683 Hypothetical protein
entE_2 DCHBEMND_00651 Enterobactin synthase component E
DCHBEMND_00684 Hydrolase
entB_2 DCHBEMND_00652 Enterobactin synthase
component B
tatE_2 DCHBEMND_00685 Sec-independent protein
translocase protein TatE entA_2 DCHBEMND_00653 2,3-dihydro-2,3-
dihydroxybenzoate dehydrogenase
lipA_2 DCHBEMND_00686 Lipoyl synthase
entH_2 DCHBEMND_00654 Proofreading thioesterase
EntH
ybdO_4 DCHBEMND_00687 Putative HTH-type
transcriptional regulator YbdO
cstA_2 DCHBEMND_00655 Carbon starvation protein A lipB_2 DCHBEMND_00688 Octanoyltransferase
DCHBEMND_00656 Hypothetical protein DCHBEMND_00689 Hypothetical protein ybdD_2 DCHBEMND_00657 Putative oxidoreductase
YbdH
dacA_2 DCHBEMND_00690 D-alanyl-D-alanine
carboxypeptidase DacA
ybdL_2 DCHBEMND_00658 Methionine aminotransferase rlpA_2 DCHBEMND_00691 Endolytic peptidoglycan transglycosylase RlpA
noc_2 DCHBEMND_00659 Nucleoid occlusion protein
mrdB_2
DCHBEMND_00692
Peptidoglycan glycosyltransferase MrdB
cysH_2 DCHBEMND_00660 Phosphosulfate reductase mrdA_2 DCHBEMND_00693 Peptidoglycan D,D-
transpeptidase MrdA ybdO_3 DCHBEMND_00661 Putative HTH-type
transcriptional regulator
YbdO
rlmH_2 DCHBEMND_00694 Ribosomal RNA large
subunit methyltransferase H
dsbG_2 DCHBEMND_00662 Thiol:disulphide interchange
protein DsbG
rsfS_2 DCHBEMND_00695 Ribosomal silencing fator
RsfS
240

59
241
Gene Locus_tag Product Gene Locus_tag Product
cobC_2 DCHBEMND_00696 Adenosylcobalalamin/alpha-
ribazole phosphatase
DCHBEMND_00706 Hypothetical protein
nadD_2 DCHBEMND_00697 Nicotinate-nucleotide adenyltransferase
DCHBEMND_00707 Hypothetical protein
holA_2 DCHBEMND_00698 DNA polymerase III subunit
delta
hscC_2 DCHBEMND_00708 Chaperone protein HscC
lptE_2 DCHBEMND_00699 LPS-assembly lipoprotein
LptE
rihA_2 DCHBEMND_00709 Pyrimidine-specific
ribonucleoside hydrolase
RihA leuS_2 DCHBEMND_00700 Leucine-tRNA ligase qlnQ_2 DCHBEMND_00710 Glutamine transport ATP-
binding protein GlnQ
DCHBEMND_00701 Hypothetical protein gltK_2 DCHBEMND_00711 Glutamate/aspartate import permease protein GltK
esiB_3 DCHBEMND_00702 Secretory immunoglobulin
A-binding protein Esib
glnM_2 DCHBEMND_00712 Putative glutamine ABC
transporter permease protein GlnM
DCHBEMND_00703 Hypothetical protein gltI_2 DCHBEMND_00713 Glutamate/aspartate import
solute-binding protein DCHBEMND_00704 Hypothetical protein DCHBEMND_00714 Hypothetical protein
esiB_4 DCHBEMND_00705 Secretory immunoglobulin
A-binding protein EsiB
Int DCHBEMND_00715 Apolipoprotein N-
acyltransferase
242
EXPERIMENTAL PROCEDURES 243
244
Library starting sample 245
246
As a starting sample for the production of the fosmid library, a pool of DNA, 247
extracted from rumen content samples from an early study (Schogor et al., 2014) was used. 248
The rumen fluid was sampled from eight lactating multiparous Holstein cows fitted with 249
rumen cannulas averaging 686 ± 35 kg of body weight and 112 ± 21 days in milk. The 250
animals were assigned to four treatments in a double 4x4 Latin Square design with four 21-d 251
periods (14-d adaptation and 7-d sampling). Cows were fed a total mixed ration with no flax 252
meal (FM) (control), or diets containing, dry matter (DM) basis, 5% FM, 10% FM and 15% 253
FM (Table 4). The starting sample pool was composed by the genetic material from the 254
rumen of the cows fed 10 or 15% DM, which pooled together represented enough genetic 255
material to construct the library. Samples from cows fed with control diet and 5% FM were 256
not included in the pooled DNA starting sample because of possible less prevalence of 257
species linked to FM breakdown. The presence of the pooled nucleic acids was checked by 258
means of a gel electrophoresis run in 1% agarose gel with control DNA (45kb) (CopyControl 259
Fosmid Control DNA – Epicentre) and size marker ladder (Lambda DNA MonoCut Mix - 260
BioLabs®), and checked in UV scan before size-selection (Figure 11). The sample 261
concentration was 220ng/µL (22,000 ng in 100µL). 262
263
264

60
265
Table 4. Ingredients and chemical composition of experimental diets 266
Control1 5FM
1 10FM
1 15FM
1
Ingredients (DM basis)
Corn silage 29.22 29.08 28.98 29.06
Grass silage 31.53 31.57 31.75 31.39
Ground corn 21.13 20.23 19.16 18.90
Soya meal 10.76 7.45 4.14 2.04
Top Suplement2 1.74 1.74 1.79 0.85
Beet pulp 3.43 2.96 2.50 1.61
Calcium carbonate 0.55 0.55 0.54 0.58
Mineral and vitamins3 1.64 1.63 1.63 1.53
Flax meal 0 4.79 9.53 14.06
Chemical analysis4
DM% 37.7±1.60 37.9±1.60 37.6±1.60 38.1±1.60
Crude protein, % of DM 17.0±0.15 17.4±0.15 17.6±0.15 17.9±0.15
Acid detergent, % of DM 18.3±0.34 18.5±0.34 19.2±0.34 19.3±0.34
Neutral detergent fiber 28.4±0.31 28.6±0.31 29.5±0.31 29.6±0.31
Ether extract, % of DM 2.4±0.07 2.4±0.07 2.4±0.07 2.4±0.07
1Control diet with no flax meal (FM) or a diet with 5%, 10% and 15% FM (DM basis). 267
2Contained 20% of canola meal, 30% of corn gluten meal, 20% of soybean meal, and 30% of brewer’s corn. 268
3Contained 9.2% Ca; 4.79% P; 4.78% Mg; 1.52% S; 13.72% Na; 1.37% K; 19.5 mg/kg Se; 23 mg/kg Fe; 1068 269
mg/kg Cu; 1796 mg/kg Mn; 57 mg/kg Co; 265 mg/kg FI; 442000 IU vitamin A; 56670 IU/kg vitamin D; and 270 2630 IU/kg vitamin E. 271 4Values with standard errors of the mean. 272
Source: Schogor et al. (2014). 273 274 Fosmid Library Production 275
276
A fosmid library was produced using CopyControl™ Fosmid Library Production Kit 277
with pCC1FOS™ Vector (EPI300TM
, Epicentre, USA) following the manufacturer 278
instructions (Epicentre, 2012) and Brady (2007) recommendations. Such host strain has been 279
successfully used in cloning assays in many studies (Rhee et al., 2005; Diaz-Torres et al., 280
2006; Kazimierczak et al., 2008). Briefly (Figure 6), the pooled DNA starting sample was 281
size fractionated to 30 to 40kb and inserted into bacteriophages vectors (Figure 7 and 8). 282
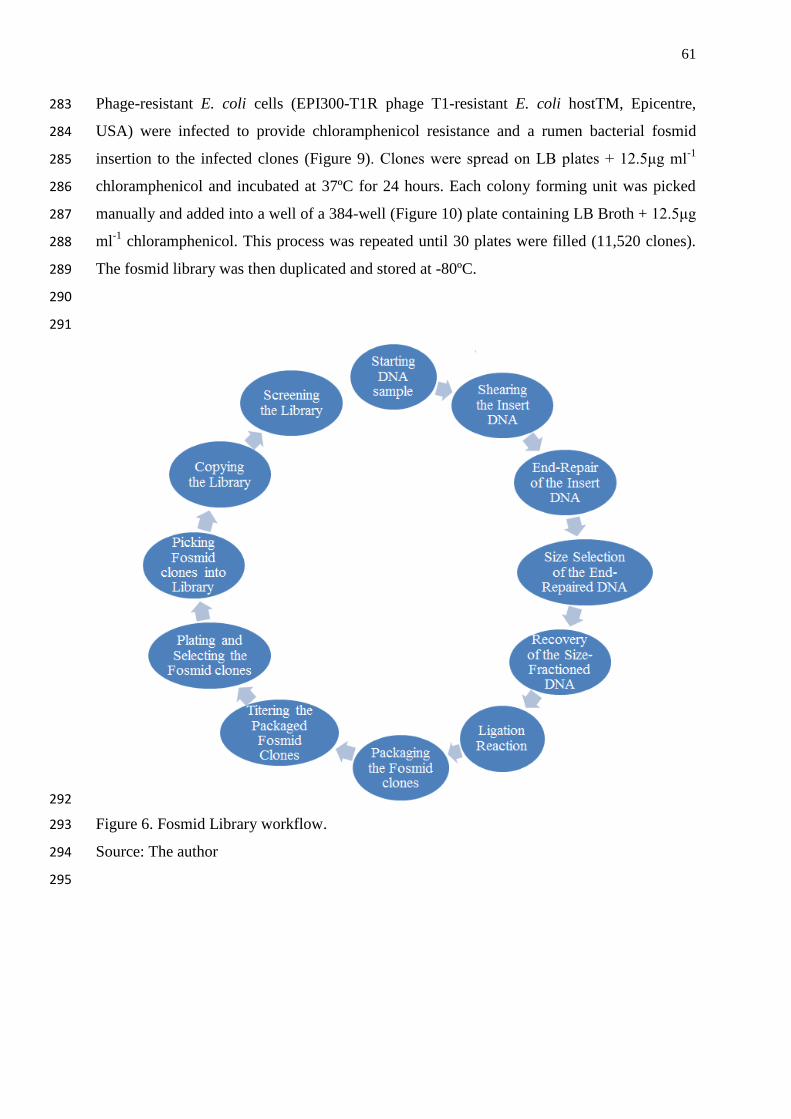
61
Phage-resistant E. coli cells (EPI300-T1R phage T1-resistant E. coli hostTM, Epicentre, 283
USA) were infected to provide chloramphenicol resistance and a rumen bacterial fosmid 284
insertion to the infected clones (Figure 9). Clones were spread on LB plates + 12.5μg ml-1
285
chloramphenicol and incubated at 37ºC for 24 hours. Each colony forming unit was picked 286
manually and added into a well of a 384-well (Figure 10) plate containing LB Broth + 12.5μg 287
ml-1
chloramphenicol. This process was repeated until 30 plates were filled (11,520 clones). 288
The fosmid library was then duplicated and stored at -80ºC. 289
290
291
292
Figure 6. Fosmid Library workflow. 293
Source: The author 294
295
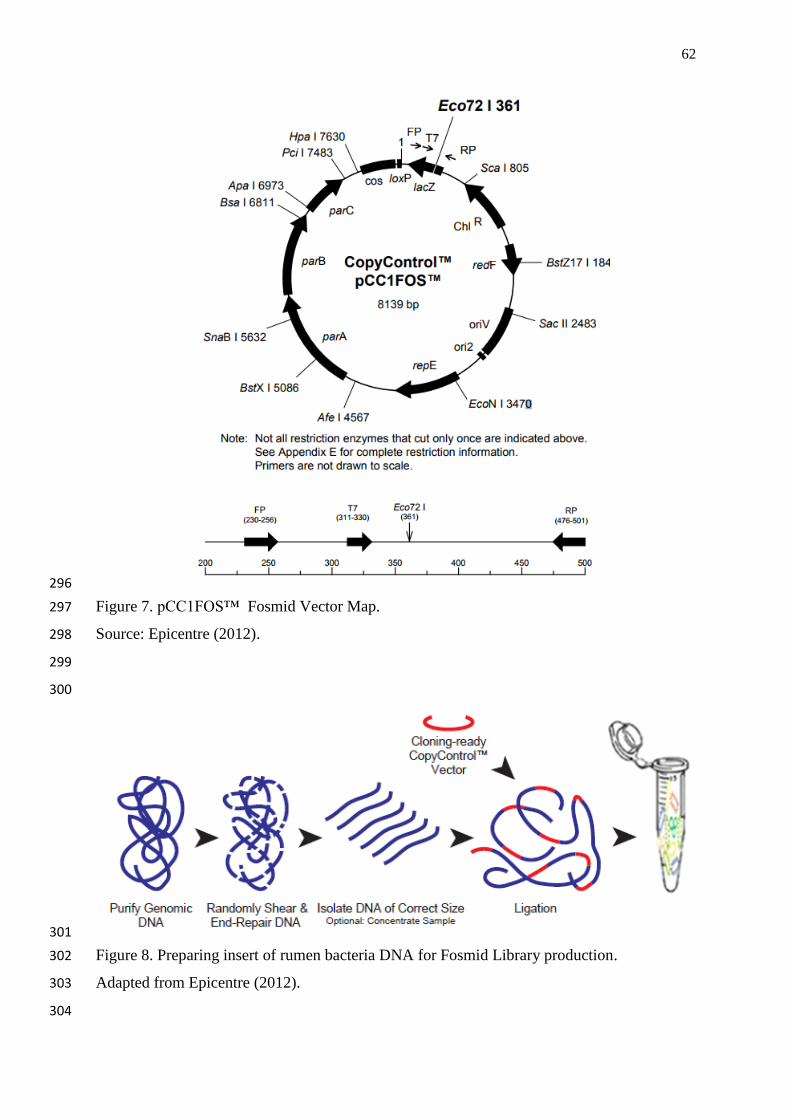
62
296
Figure 7. pCC1FOS™ Fosmid Vector Map. 297
Source: Epicentre (2012). 298
299
300
301
Figure 8. Preparing insert of rumen bacteria DNA for Fosmid Library production. 302
Adapted from Epicentre (2012). 303
304
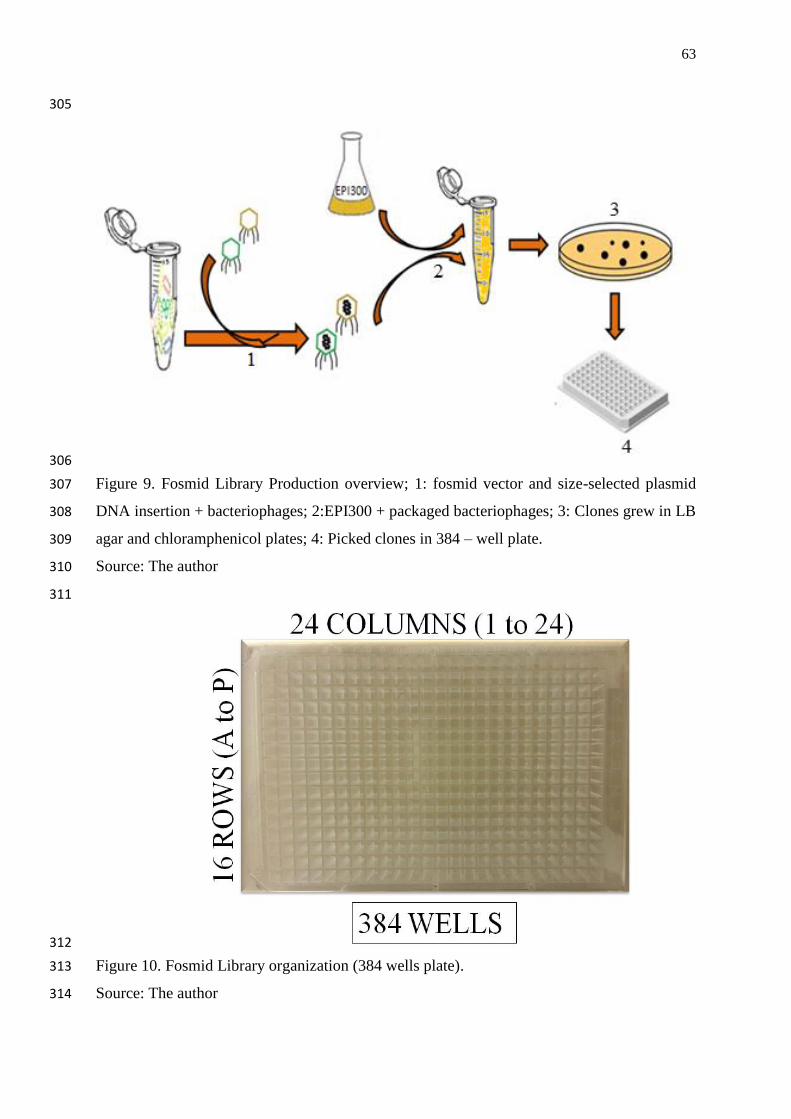
63
305
306
Figure 9. Fosmid Library Production overview; 1: fosmid vector and size-selected plasmid 307
DNA insertion + bacteriophages; 2:EPI300 + packaged bacteriophages; 3: Clones grew in LB 308
agar and chloramphenicol plates; 4: Picked clones in 384 – well plate. 309
Source: The author 310
311
312
Figure 10. Fosmid Library organization (384 wells plate). 313
Source: The author 314

64
Size selection of insert plasmid DNA 315
316
In order to size select the sample (Figure 4), the DNA insert was previously treated 317
with an End-Repair of the Insert DNA procedure, this step (Table 5) generates blunt-ended, 318
5′-phosphorylated DNA. 319
The pooled sample was then run on a 20 cm long 1% LMP agarose gel in TBE buffer 320
(Figure 11) at 30V for 12 hours. A size marker (Lambda DNA Mono Cut Mix – BioLabs) 321
and a Fosmid Control DNA supplied with the Epicentre kit was used. The gel was cut (Figure 322
12) between 30 to 45kb, which is the size able to be inserted into the bacteriophage vector. 323
By means of GELase procedure (β-agarase) the plasmid DNA was recovered for vector 324
packaging use. 325
326
Table 5. End-repair of the insert DNA 327
Product Quantity
10X End-Repair Buffer 10 µl
2.5 mM dNTP Mix 10 µl
10 mM ATP 10 µl
Sheared insert DNA 65 µl (22 µg DNA)
End-repair enzyme mix 5 µl
Total 100µL
328
The DNA concentration was checked right after size-fractioned DNA recovery. It was 329
used read tubes in Qubit® Fluorometer, following the manufacturer instructions. The DNA 330
concentration was 58.5 µg/mL (0.0585µg/µL). The total amount of DNA was 0.2925µg 331
(0.0585µg/µL x 5µL). For a ligation reaction, 0.25µg of DNA is needed, therefore, an 332
additional size-selection DNA recovery protocol was carried out to end up with a safe amount 333
of genetic material before ligation reaction. The second protocol DNA concentration was 334
9.59 µg/mL. All samples were stored at -80ºC until next step. 335

65
336
Figure 11. DNA to be size-selected (Pooled DNA from treatments 10% and 15% of flax 337
meal intake (DM basis). Control DNA = 40 kb. Wells: 1: Size marker ladder; 2: Control 338
DNA; 3: Pooled DNA. 339
340
341
Figure 12. Shearing the insert size of the starting DNA sample. 342
343
344
345
346
1 2 3 1 2

66
Ligation reaction 347
348
The MaxPlax kit was used to ligate insert DNA, following manufacture instruction 349
(Epicentre, USA) (Table 6). 350
351
Table 6. Ligation reaction 352
Product Quantity
Sterile water 1 µl
10X Fast-Link Ligation Buffer 1 µl
10 mM ATP 1 µl
CopyControl pCC1FOS Vector (0.5 µg/µl) 1 µl
Size-fractionated DNA 5 µl
Fast-Link DNA ligase 1 µl
Total 10 µl
353
Packing phage 354
355
Briefly, the size-fractionated DNA was inserted into MaxPlax Lambda bacteriophages 356
(10 µl ligation reaction solution + 25 µl MaxPlax Lambda Packing Extract), kept in phage 357
dilution buffer and stored at -80ºC in several aliquots. 358
359
Plating infected clones 360
361
LB broth + 10 mM MgSO4 + 0.2% Maltose was inoculated with a culture of EPI300 362
(phage resistant E.coli) grown until reaching 1.0 of optical density at wavelength of 600 nm 363
(OD600) as recommended by Brady (2007). The E. coli cells at 1.0 OD600 were infected 364
with the phages vectors at 30ºC for 2 hours and spread on LB plates + 12.5μg/mL 365
chloramphenicol, which was used as selection marker. The plated was carried out in different 366
dilution in order to select a proper assay (10-3
dilution) to get as many colonies forming units 367
(CFU) as possible, although, apart from each other enough to pick them individually (Figure 368
13). 369
370
371

67
Picking infected clones 372
373
Each CFU was added manually into a well in a 384-well plate containing LB broth + 374
chloramphenicol, the process was repeated until 30 were filled, representing 11,520 clones 375
with chloramphenicol resistance and a ruminal insert DNA (Figure 14). 376
377
Figure 13. LB agar + chloramphenicol plate with approximately 5,000 CFU of packed 378
EPI300 fosmid clones. 379
380
Figure 14. Picking procedure for the infected fosmid clones into a 384-well plate. 381

68
Duplicating the Fosmid Library 382
In order to replicate the study in the future or prospect the effect of novel compounds 383
in the fosmid library, the 30 plates were duplicated and stored at -80ºC. The method was 384
based on preparing 30 384-well plates with fresh LB broth + chloramphenicol and using a 385
replicator pin all the wells were duplicated at once into the new plate, the copied library 386
followed to a 24 hours growth at 37ºC and addition of 50:50 glycerol into the wells before 387
storing the plates at 4ºC for four hours, -20ºC for 12 hours and definitive storage at -80ºC. 388
389
Average insert size 390
Seven clones were randomly selected, grown in LB broth, plasmid DNA was purified using 391
QIAprep Spin Miniprep Kit – (QIAGEN GmbH), digested with restriction enzyme (NotI – 392
NEB) and run on a 0.4% agarose gel in 1X TAE buffer at 35V for 15 hours (Figure 15). The 393
average size of inserts was obtained comparing the fosmid clones, control DNA (40 kb) and 394
size ladder (Lambda DNA – MonoCut – NEB). 395
396
397
Figure 15. Fosmid clones average insert size (43,500 base pairs). Well: 1: size ladder; 2: 398
Control DNA (40kb); 3 to 9: plasmid DNA extracted from random clones in the library. 399
1 2 3 4 5 6 7 8 9

69
Screening the Fosmid Library 400
401
The SDG breakdown capacity (Table 1) was assessed by the difference of initial and 402
final SDG concentration in incubations of the flaxseed lignan and the fosmid clones. 403
The content from each plate was printed on a clear plate (Figure 16), pooled in 404
1000µL and incubated (Figure 17) with 0.25 mg of standard SDG (≥97%-HPLC) (SIGMA, 405
UK) at 37ºC for 24h to assess the SDG breakdown. Negative controls with bacteria but 406
without SDG and positive controls with SDG without any bacteria were also analyzed. 407
Subsequently, incubations were centrifuged (1 min, 13,000 x g) and the supernatant was 408
purified on C18 cartridges. Samples were concentrated at 50ºC and re-suspended in 200 μl of 409
methanol. The presence of SDG was detected by reverse-phase HPLC on a Waters system 410
with a 996 Photodiode Array Detector (PDA; Waters Ltd., United Kingdom) and a Waters 411
C18 Nova-Pak radial compression column (4 mm, 8 mm, 6100 mm) equilibrated with 95% 412
solvent A (5% acetic acid) at a flow rate of 2 ml/min. The sample injection volume was 413
typically 50 µl, and compounds were eluted by linear gradient to 70% solvent B (100% 414
methanol) over 15 min and monitored from 240 to 400 nm, and the concentration was 415
quantified using a pure standard curve. In addition, it was also checked the presence of the 416
SDG degradation products (secoisolariciresinol, enterodiol and enterolactone) on HPLC and 417
Liquid Chromatography-Mass Spectrometry. 418
Mass spectrometry was performed on a Thermo Finnigan LC-MS system (Thermo 419
Electron Corp, Waltham, MA, USA) comprising a Finnigan PDA Plus detector, a Finnigan 420
LTQ linear ion trap with ESI source and a Waters C18 Nova-Pak column (3.9 100 mm, 421
particle size 4 µm), with column oven temperature maintained at 30º C. The PDA scan range 422
was set to 240–400 nm, and injection volume was typically 10 µl. The mobile phase 423
consisted of water with 0.1% formic acid (solvent A) and acetonitrile with 0.1% formic acid 424
(solvent B). The column was equilibrated with 95% solvent A at a flow rate of 1 ml/min 425
(20µL typical injection volume), with 10% going to the mass spectrometer, and the 426
percentage of solvent B increased linearly to 65% over 60 min. MS parameters were as 427
follows: sheath gas 30, auxiliary gas 15 and sweep gas zero (arbitrary units), spray voltage -428
4.0 kV in negative and 4.8 kV in positive ionisation mode, capillary temperature 320 ºC, 429
capillary voltage -1.0 V and 45 V, respectively, tube lens voltage -68 (negative mode) and 430
110 V (positive mode), respectively, and normalised collision energy typically 35%. 431
Four screening assays were carried out (2 in October, 2016 and 2 in February, 2017), 432
and the plates were ranked from the best breakdown (0.261 nM final SDG concentration) to 433

70
the worst (0.364 nM final SDG concentration) the SDG content was calculated based on the 434
amount incubated (0.364 nM SDG) and the final concentration based on the predicted 435
concentration, which was obtained on the SDG peak area and by standard curve equation 436
(Y=1E+07X-6874; R2=0.99). The plates considered effective in SDG breakdown were 437
divided in eight sessions (every two rows of the plate) (Figure 18) and reassessed for SDG 438
breakdown. 439
440
Figure 16. 384-well plate content printed on clear petri dish plate. 441
442

71
443
Figure 17. SDG incubation: Fosmid clones pool + SDG + LB broth + Chloramphenicol. 444
445
446
447
Figure 18. Sessions on selected 384-well plate 448
R1: Row A and B; R2: Row C and D; R3: Row E and F; R4: Row G and H; R5: Row I and J; 449
R6: Row K and L; R7: M and N; R8: Row O and P. 450

72
Purifying fosmid clones to sequencing 451
452
The fosmid clones selected by means of SDG breakdown screening (8R4, 8R5 and 453
14R1) were purified in order to sequence high quality plasmid DNA. The purification was 454
carried on using the QIAprep Spin Miniprep Kit (QIAGEN, UK), following the manufacturer 455
instructions. The plasmid DNA was eluted in Buffer EB (10 mM Tris-Cl, pH 8.5) and kept in 456
the freezer at -80ºC until being send to sequence in a Hiseq sequencing system (Illumina®). 457
The final plasmid DNA concentration was 79.65 ng/µL (8R4), 113.55ng/µL (8R5), and 458
158.55 ng/µL (14R1). 459
460
Bioinformatics 461
462
The bioinformatics analysis of the samples fosmid library data was performed at the 463
Aberystwyth University between the 11th
June and 09th
July, 2017. Data analysis of the 464
fosmid library was performed in an UNIX platform, using High-Performance Computing 465
(HPC), which consists of a master node, a login node, 11 compute nodes and two storage 466
nodes. The combined compute capacity of the HPC is: 544 CPU cores, 4.2TB RAM and 467
43TB storage capacity and 11TB of fast access disk. This is backed by a 1/4 PB storage array 468
for storage of sequencing data. 469
470
FASTQC 471
472
NGS can generate tens of millions of sequences in a single run. Before analysing this 473
sequence to draw biological conclusions, some simple quality control checks should be 474
performed to ensure that the raw data looks good and there are no problems or biases in the 475
data. Most sequencers generate a QC report as part of their analysis pipeline, but this is 476
usually only focused on identifying problems which were generated by the sequencer itself. 477
FastQC aims to provide a QC report which can spot problems which originate either in the 478
sequencer or in the starting library material (Schmieder and Edwards, 2011). 479
480
481
482
483
Per base sequence quality 484

73
485
All samples (3 fosmid pool samples) from the fosmid library were similar in quality, 486
therefore, one of the samples (8R4, read 1 (R1 - forward)) was used as example for the 487
quality check. 488
The background of the graph (Figure 19) divides the y axis (quality score) into very 489
good quality calls (green), calls of reasonable quality (orange), and calls of poor quality (red). 490
The x axis represents the position in read (bp).It is possible to observe that all the reads 491
bigger than 5bp were in excellent quality condition (green background). 492
493
494
495
Figure 19. Per base sequence quality of the 8R4, forward read. 496
497
498
499
500
Per sequence quality scores 501

74
502
The per sequence quality score report allows to see if a subset of the sequences have 503
universally low quality values (Schmieder and Edwards, 2011). It is possible to observe 504
(Figure 20) that the major portion of the reads presented high quality scores (above 36, in a 505
scale from 0 to 40). 506
507
508
Figure 20. Per sequence quality score of the 8R4, forward read. 509
510
Per base sequence content 511
512
In a normal library it is expected that there would be little to no difference between 513
the different bases of a sequence run, so the lines in the plot should run parallel with each 514
other. The graph (Figure 21) plots thymine (T) in red; cytosine (C) in blue; adenine (A) in 515
green; and guanine (G) in black. It is possible to observe that the nitrogen bases have a little 516
fluctuation up to 5bp reads; the different bases of the run present no difference within the rest 517
of the run. 518

75
519
Figure 21. Per base sequence content of 8R4, forward read. 520
521
Overrepresented Sequences 522
523
A normal high-throughput library will contain a diverse set of sequences, with no 524
individual sequence making up a tiny fraction of the whole. Finding that a single sequence is 525
very overrepresented in the set either means that it is highly biologically significant, or 526
indicates that the library is contaminated, or not as diverse as you expected. It is possivel to 527
observe (Figure 22) that an Illumina (TruSeq) adapter was found with overrepresentation in 528
the run. The following sequence contaminate the analysis and should be excluded from the 529
reads. This can be done in the next step, trimming the reads. 530
531
532
Figure 22. Overrepresented sequences from 8R4, forward read. 533
534
535
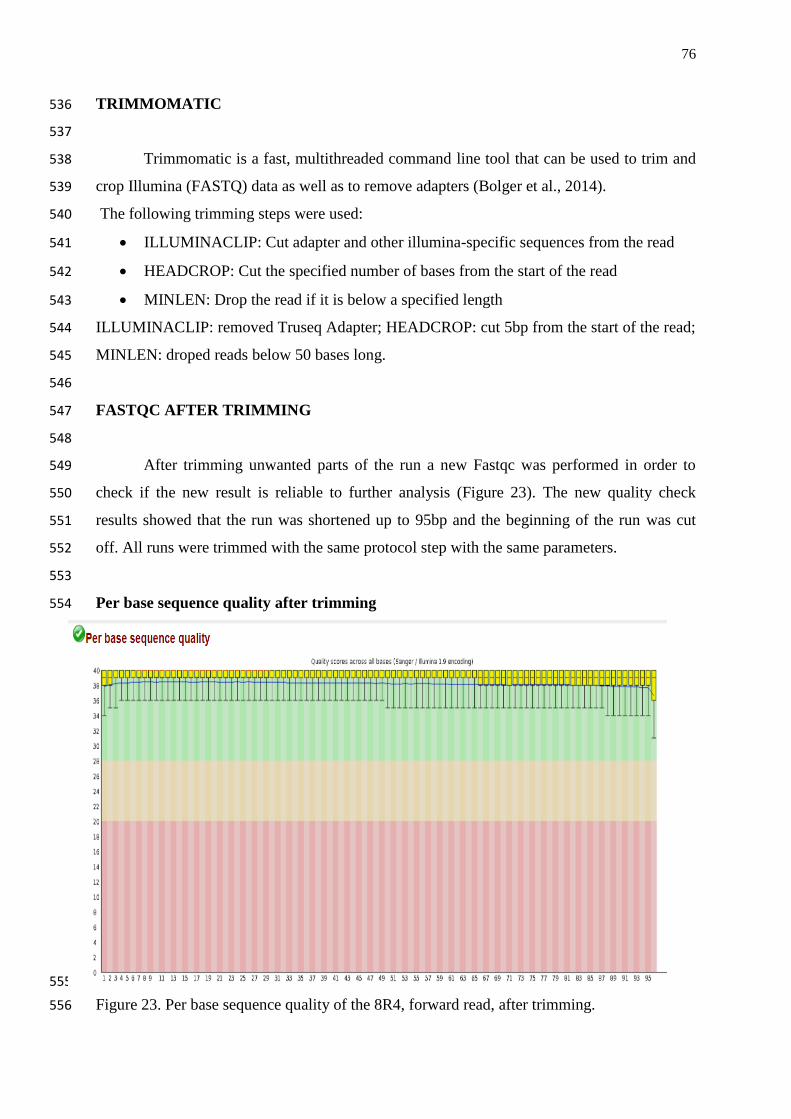
76
TRIMMOMATIC 536
537
Trimmomatic is a fast, multithreaded command line tool that can be used to trim and 538
crop Illumina (FASTQ) data as well as to remove adapters (Bolger et al., 2014). 539
The following trimming steps were used: 540
ILLUMINACLIP: Cut adapter and other illumina-specific sequences from the read 541
HEADCROP: Cut the specified number of bases from the start of the read 542
MINLEN: Drop the read if it is below a specified length 543
ILLUMINACLIP: removed Truseq Adapter; HEADCROP: cut 5bp from the start of the read; 544
MINLEN: droped reads below 50 bases long. 545
546
FASTQC AFTER TRIMMING 547
548
After trimming unwanted parts of the run a new Fastqc was performed in order to 549
check if the new result is reliable to further analysis (Figure 23). The new quality check 550
results showed that the run was shortened up to 95bp and the beginning of the run was cut 551
off. All runs were trimmed with the same protocol step with the same parameters. 552
553
Per base sequence quality after trimming 554
555
Figure 23. Per base sequence quality of the 8R4, forward read, after trimming. 556

77
Overrepresented sequences after trimming 557
558
The Illumina (TruSeq) adapter found with overrepresentation in the run was removed 559
(Figure 24) from the read, leaving the data without overrepreented sequences. 560
561
562
Figure 24. Overrepresented sequences removal from 8R4, forward read 563
564
ALIGNMENT – VELVET ASSEMBLER 565
566
Reads were assembled in a de novo approach using Velvet (Zerbino and Birney, 567
2008). The data followed with de novo genome assembly and short read sequencing 568
alignment. Velvet is an algorithm package that was applied for dealing with the trimmed 569
fastq files. The data was processed through the manipulation of De Bruijn graphs for 570
genomic sequence assembly via the removal of errors and the simplification of repeated 571
regions. This step prepares the data for genome annotation (Compeau et al., 2011). 572
The parameters chosen for this step were: 21k-mer coverage; fastq files type; 573
shortPaired data type (velveth); and automatic settings for expected coverage and cutoff (exp 574
cov to the length of median contig coverage and cov_cutoff to half that value) due to 575
reasonably uniform coverage over the sample. 576
78
GENOMIC ANNOTATION – PROKKA 577
578
The final step was to annotate all relevant genomic features on those contigs. This 579
step was performed using the module Prokka, a command line software tool to fully annotate 580
a draft bacterial. It produces standards-compliant output files for further analysis or viewing 581
in genome browser. (Seemann, 2014). 582
583
MULTIPLE GENOME ALIGNMENTS – MAUVE 584
585
In order to align the reference genome of an E. coli k-12 str. K12 substr. DH10B, 586
GenBank: CP000948.1, available online at the National Center for Biotechnology 587
Information (NCBI, 2014) with the fosmid clones data (8R4, 8R5 and 14R1). The gbk files 588
generated in the genomic annotation step were aligned using Mauve software following 589
operation guidelines (Darling et al., 2010). 590
591
REFERENCES 592
Adolphe, J.L., Whiting, S.J., Juurlink, B.H., Thorpe, L.U., and Alcorn, J. (2010) Health effects with 593 consumption of the flax lignan secoisolariciresinol diglucoside. British Journal of Nutrition 103: 929-594 938. 595 Blattner, F.R., Plunkett, G., Bloch, C.A., Perna, N.T., Burland, V., Riley, M. et al. (1997) The 596 complete genome sequence of Escherichia coli K-12. science 277: 1453-1462. 597 Bolger, A.M., Lohse, M., and Usadel, B. (2014) Trimmomatic: a flexible trimmer for Illumina 598 sequence data. Bioinformatics 30: 2114-2120. 599 Brady, S.F. (2007) Construction of soil environmental DNA cosmid libraries and screening for clones 600 that produce biologically active small molecules. Nature protocols 2: 1297. 601 Buck, K., Zaineddin, A.K., Vrieling, A., Linseisen, J., and Chang-Claude, J. (2010) Meta-analyses of 602 lignans and enterolignans in relation to breast cancer risk. The American journal of clinical nutrition: 603 ajcn. 28573. 604 Choo, W.-S., Birch, J., and Dufour, J.-P. (2007) Physicochemical and quality characteristics of cold-605 pressed flaxseed oils. Journal of Food Composition and Analysis 20: 202-211. 606 Clavel, T., Henderson, G., Engst, W., Doré, J., and Blaut, M. (2006) Phylogeny of human intestinal 607 bacteria that activate the dietary lignan secoisolariciresinol diglucoside. FEMS microbiology ecology 608 55: 471-478. 609 Colombo, L.T., de Oliveira, M.N.V., Carneiro, D.G., de Souza, R.A., Alvim, M.C.T., dos Santos, J.C. 610 et al. (2016) Applying functional metagenomics to search for novel lignocellulosic enzymes in a 611 microbial consortium derived from a thermophilic composting phase of sugarcane bagasse and cow 612 manure. Antonie van Leeuwenhoek 109: 1217-1233. 613 Compeau, P.E., Pevzner, P.A., and Tesler, G. (2011) How to apply de Bruijn graphs to genome 614 assembly. Nature biotechnology 29: 987. 615 Côrtes, C., Gagnon, N., Benchaar, C., Da Silva, D., Santos, G., and Petit, H. (2008) In vitro 616 metabolism of flax lignans by ruminal and faecal microbiota of dairy cows. Journal of applied 617 microbiology 105: 1585-1594. 618 Dai, X., Tian, Y., Li, J., Su, X., Wang, X., Zhao, S. et al. (2015) Metatranscriptomic analyses of plant 619 cell wall polysaccharide degradation by microorganisms in the cow rumen. Applied and 620 environmental microbiology 81: 1375-1386. 621

79
Darling, A.E., Mau, B., and Perna, N.T. (2010) progressiveMauve: multiple genome alignment with 622 gene gain, loss and rearrangement. PloS one 5: e11147. 623 Diaz-Torres, M.L., Villedieu, A., Hunt, N., McNab, R., Spratt, D.A., Allan, E. et al. (2006) 624 Determining the antibiotic resistance potential of the indigenous oral microbiota of humans using a 625 metagenomic approach. FEMS microbiology letters 258: 257-262. 626 Duan, C.J., Xian, L., Zhao, G.C., Feng, Y., Pang, H., Bai, X.L. et al. (2009) Isolation and partial 627 characterization of novel genes encoding acidic cellulases from metagenomes of buffalo rumens. 628 Journal of applied microbiology 107: 245-256. 629 Epicentre (2012). CopyControl™ Fosmid Library Production Kit with pCC1FOS™ Vector. URL 630 http://www.epibio.com/docs/default-source/protocols/copycontrol-fosmid-library-production-kit-631 with-pcc1fos-vector.pdf?sfvrsn=6 632 Ferrer, M., Beloqui, A., Timmis, K.N., and Golyshin, P.N. (2009) Metagenomics for mining new 633 genetic resources of microbial communities. Journal of molecular microbiology and biotechnology 634 16: 109-123. 635 Flint, H.J., Bayer, E.A., Rincon, M.T., Lamed, R., and White, B.A. (2008) Polysaccharide utilization 636 by gut bacteria: potential for new insights from genomic analysis. Nature reviews Microbiology 6: 637 121. 638 Gabor, E.M., Alkema, W.B., and Janssen, D.B. (2004) Quantifying the accessibility of the 639 metagenome by random expression cloning techniques. Environmental Microbiology 6: 879-886. 640 Gagnon, N., Côrtes, C., da Silva, D., Kazama, R., Benchaar, C., dos Santos, G. et al. (2009) Ruminal 641 metabolism of flaxseed (Linum usitatissimum) lignans to the mammalian lignan enterolactone and its 642 concentration in ruminal fluid, plasma, urine and milk of dairy cows. British Journal of Nutrition 102: 643 1015-1023. 644 Gella, A., and Durany, N. (2009) Oxidative stress in Alzheimer disease. Cell adhesion & migration 3: 645 88-93. 646 Ghedini, C., Whitehouse, N., Moura, D., Oliveira, A., and Brito, A. (2017) The mammalian lignan 647 enterolactone is absorbed by newborn dairy calves fed enterolactone-enriched milk. Journal of dairy 648 science 100: 8170-8175. 649 Goyal, A., Sharma, V., Upadhyay, N., Gill, S., and Sihag, M. (2014) Flax and flaxseed oil: an ancient 650 medicine & modern functional food. Journal of food science and technology 51: 1633-1653. 651 Healy, F., Ray, R., Aldrich, H., Wilkie, A., Ingram, L., and Shanmugam, K. (1995) Direct isolation of 652 functional genes encoding cellulases from the microbial consortia in a thermophilic, anaerobic 653 digester maintained on lignocellulose. Applied microbiology and biotechnology 43: 667-674. 654 Hjort, K., Bergström, M., Adesina, M.F., Jansson, J.K., Smalla, K., and Sjöling, S. (2009) Chitinase 655 genes revealed and compared in bacterial isolates, DNA extracts and a metagenomic library from a 656 phytopathogen-suppressive soil. FEMS microbiology ecology 71: 197-207. 657 Hwang, O. (2013) Role of oxidative stress in Parkinson's disease. Experimental neurobiology 22: 11-658 17. 659 Imran, M., Ahmad, N., Anjum, F.M., Khan, M.K., Mushtaq, Z., Nadeem, M., and Hussain, S. (2015) 660 Potential protective properties of flax lignan secoisolariciresinol diglucoside. Nutrition journal 14: 71. 661 Kanehisa, M., Goto, S. (2000). KEGG: kyoto encyclopedia of genes and genomes. Nucleic acids 662 research 28: 27-30. 663 Kazimierczak, K.A., Rincon, M.T., Patterson, A.J., Martin, J.C., Young, P., Flint, H.J., and Scott, 664 K.P. (2008) A new tetracycline efflux gene, tet (40), is located in tandem with tet (O/32/O) in a 665 human gut firmicute bacterium and in metagenomic library clones. Antimicrobial agents and 666 chemotherapy 52: 4001-4009. 667 Kim, M., Morrison, M., and Yu, Z. (2011) Status of the phylogenetic diversity census of ruminal 668 microbiomes. FEMS microbiology ecology 76: 49-63. 669 Kitts, D., Yuan, Y., Wijewickreme, A., and Thompson, L. (1999) Antioxidant activity of the flaxseed 670 lignan secoisolariciresinol diglycoside and its mammalian lignan metabolites enterodiol and 671 enterolactone. Molecular and cellular biochemistry 202: 91-100. 672 Kong, Y., Teather, R., and Forster, R. (2010) Composition, spatial distribution, and diversity of the 673 bacterial communities in the rumen of cows fed different forages. FEMS microbiology ecology 74: 674 612-622. 675

80
Lewin, A., Zhou, J., Pham, V.T.T., Haugen, T., El Zeiny, M., Aarstad, O. et al. (2017) Novel archaeal 676 thermostable cellulases from an oil reservoir metagenome. AMB Express 7: 183. 677 Lima, L., Palin, M., Santos, G., Benchaar, C., and Petit, H. (2016) Dietary flax meal and abomasal 678 infusion of flax oil on microbial β-glucuronidase activity and concentration of enterolactone in 679 ruminal fluid, plasma, urine and milk of dairy cows. Animal Feed Science and Technology 215: 85-680 91. 681 Lowcock, E.C., Cotterchio, M., and Boucher, B.A. (2013) Consumption of flaxseed, a rich source of 682 lignans, is associated with reduced breast cancer risk. Cancer Causes & Control 24: 813-816. 683 Maruthamuthu, M., Jiménez, D.J., Stevens, P., and van Elsas, J.D. (2016) A multi-substrate approach 684 for functional metagenomics-based screening for (hemi) cellulases in two wheat straw-degrading 685 microbial consortia unveils novel thermoalkaliphilic enzymes. BMC genomics 17: 86. 686 Matumoto-Pintro, P.T., Petit, H.V., Giroux, H.J., Côrtes, C., Gagnon, N., and Britten, M. (2011) 687 Effect of flaxseed lignans added to milk or fed to cows on oxidative degradation of dairy beverages 688 enriched with polyunsaturated fatty acids. Journal of dairy research 78: 111-117. 689 Münzel, T., Gori, T., Bruno, R.M., and Taddei, S. (2010) Is oxidative stress a therapeutic target in 690 cardiovascular disease? European heart journal 31: 2741-2748. 691 NCBI (2014) Escherichia coli str. K12 substr. DH10B, complete genome - National Center for 692 Biotechnology Information. In. 693 Oyama, L.B., Girdwood, S.E., Cookson, A.R., Fernandez-Fuentes, N., Privé, F., Vallin, H.E. et al. 694 (2017) The rumen microbiome: an underexplored resource for novel antimicrobial discovery. npj 695 Biofilms and Microbiomes 3: 33. 696 Petit, H., and Gagnon, N. (2009a) Milk concentrations of the mammalian lignans enterolactone and 697 enterodiol, milk production, and whole tract digestibility of dairy cows fed diets containing different 698 concentrations of flaxseed meal. Animal feed science and technology 152: 103-111. 699 Petit, H., and Gagnon, N. (2009b) Concentration of the mammalian lignans enterolactone and 700 enterodiol in milk of cows fed diets containing different concentrations of whole flaxseed. Animal 3: 701 1428-1435. 702 Petit, H.V., Gagnon, N., Mir, P.S., Cao, R., and Cui, S. (2009) Milk concentration of the mammalian 703 lignan enterolactone, milk production, milk fatty acid profile, and digestibility in dairy cows fed diets 704 containing whole flaxseed or flaxseed meal. Journal of dairy research 76: 257-264. 705 Prasad, K. (2000) Antioxidant activity of secoisolariciresinol diglucoside-derived metabolites, 706 secoisolariciresinol, enterodiol, and enterolactone. International journal of angiology 9: 220-225. 707 Privé, F., Newbold, C.J., Kaderbhai, N.N., Girdwood, S.G., Golyshina, O.V., Golyshin, P.N. et al. 708 (2015) Isolation and characterization of novel lipases/esterases from a bovine rumen metagenome. 709 Applied microbiology and biotechnology 99: 5475-5485. 710 Quartieri, A., García‐Villalba, R., Amaretti, A., Raimondi, S., Leonardi, A., Rossi, M., and Tomàs‐711 Barberàn, F. (2016) Detection of novel metabolites of flaxseed lignans in vitro and in vivo. Molecular 712 nutrition & food research 60: 1590-1601. 713 Rajendran, P., Nandakumar, N., Rengarajan, T., Palaniswami, R., Gnanadhas, E.N., 714 Lakshminarasaiah, U. et al. (2014) Antioxidants and human diseases. Clinica chimica acta 436: 332-715 347. 716 Renouard, S., Hano, C., Corbin, C., Fliniaux, O., Lopez, T., Montguillon, J. et al. (2010) Cellulase-717 assisted release of secoisolariciresinol from extracts of flax (Linum usitatissimum) hulls and whole 718 seeds. Food chemistry 122: 679-687. 719 Rhee, J.-K., Ahn, D.-G., Kim, Y.-G., and Oh, J.-W. (2005) New thermophilic and thermostable 720 esterase with sequence similarity to the hormone-sensitive lipase family, cloned from a metagenomic 721 library. Applied and environmental microbiology 71: 817-825. 722 Riesenfeld, C.S., Goodman, R.M., and Handelsman, J. (2004) Uncultured soil bacteria are a reservoir 723 of new antibiotic resistance genes. Environmental microbiology 6: 981-989. 724 Schmieder, R., and Edwards, R. (2011) Quality control and preprocessing of metagenomic datasets. 725 Bioinformatics 27: 863-864. 726 Schogor, A.L., Huws, S.A., Santos, G.T., Scollan, N.D., Hauck, B.D., Winters, A.L. et al. (2014) 727 Ruminal Prevotella spp. may play an important role in the conversion of plant lignans into human 728 health beneficial antioxidants. PloS one 9: e87949. 729 Seemann, T. (2014) Prokka: rapid prokaryotic genome annotation. Bioinformatics 30: 2068-2069. 730
81
Simon, C., and Daniel, R. (2011) Metagenomic analyses: past and future trends. Applied and 731 environmental microbiology 77: 1153-1161. 732 Simon, C., Herath, J., Rockstroh, S., and Daniel, R. (2009) Rapid identification of genes encoding 733 DNA polymerases by function-based screening of metagenomic libraries derived from glacial ice. 734 Applied and environmental microbiology 75: 2964-2968. 735 Uchiyama, T., and Miyazaki, K. (2009) Functional metagenomics for enzyme discovery: challenges 736 to efficient screening. Current Opinion in Biotechnology 20: 616-622. 737 Wang, L.-Q., Meselhy, M.R., Li, Y., QIN, G.-W., and Hattori, M. (2000) Human intestinal bacteria 738 capable of transforming secoisolariciresinol diglucoside to mammalian lignans, enterodiol and 739 enterolactone. Chemical and pharmaceutical bulletin 48: 1606-1610. 740 Waschkowitz, T., Rockstroh, S., and Daniel, R. (2009) Isolation and characterization of 741 metalloproteases with a novel domain structure by construction and screening of metagenomic 742 libraries. Applied and environmental microbiology 75: 2506-2516. 743 Zerbino, D.R., and Birney, E. (2008) Velvet: algorithms for de novo short read assembly using de 744 Bruijn graphs. Genome research 18: 821-829. 745 Zhou, W., Wang, G., Han, Z., Yao, W., and Zhu, W. (2009) Metabolism of flaxseed lignans in the 746 rumen and its impact on ruminal metabolism and flora. Animal feed science and technology 150: 18-747 26. 748
749
750
751
752
753
754
755
756
757
758
759
760
761
762
763
764
765
766
767
768
769

82
IV. Transcripts linked to secoisolariciresinol diglucoside metabolism in 1
the rumen 2
(Normas: Environmental Microbiology) 3
SUMMARY 4
5
The flaxseed (Linum usitatissimum), the richest source of lignans among foods, mainly 6
secoisolariciresinol diglucoside, is metabolized in the rumen into the enterolignans enterodiol 7
and enterolactone, which are been pointed out as powerful antioxidant compounds. In 8
addition, ruminants can transfer lignans produced in the rumen to physiological fluids 9
(plasma) and animal products (milk), providing also increased mammalian lignan plasma 10
concentration to the consumer. However, there is not much information regarding the rumen 11
microbes responsible for secoisolariciresinol diglucoside breakdown and enterolignans 12
production. Approaches that by-pass species isolation and culture are been recently used to 13
study the rumen ecology and metabolic processes. Nonetheless, even metagenomic 14
technologies have limitations. Analysis of RNA transcripts can overcome such obstacles and 15
effective tools to find novel genes with active role in the rumen metabolism. Therefore, a 16
metatranscriptome was carried out using rumen fluid as inoculum and secoisolariciresinol 17
diglucoside in in vitro incubations. The total RNA from incubations was successfully 18
extracted and sent to deep sequencing. RNA sequencing data was generated and 19
overrepresented sequences listed as possible high biological significance, which can be used 20
to find differentially expressed genes in order to find genes and enzymes linked to 21
secoisolariciresinol diglucoside breakdown and lignans products. 22
23
KEY-WORDS: lignan, metatranscriptome, RNA, rumen, SDG 24
RUNNING TITLE: overrepresented sequences in SDG rumen metabolism 25
26
INTRODUCTION 27
28
Oxidative imbalance can lead to excessive free radicals production, caused by insufficient 29
inhibition, delay or removal of those (antioxidant capacity). The substances capable of 30
tackling oxidative damage can do it by direct scavenging reactive oxygen species or indirect 31
acting up-regulating antioxidant defences (Halliwell, 2007; Khlebnikov et al., 2007). Such 32
disorder in oxidative defences is linked to the aging and cellular degenerative process and 33

83
also associated with several metabolic disorders, such as cancer, cardiovascular disease, 34
immune-system decline, brain dysfunction, endocrine functions, cataracts and others (Ames 35
et al., 1993; Christen, 2000; Hitchon and El-Gabalawy, 2004; Vincent et al., 2004; Nunomura 36
et al., 2006; Wood-Kaczmar et al., 2006; Carreau et al., 2008). 37
There are many sources of antioxidants compounds, such as minerals, animal 38
products, plants, and others (Carocho and Ferreira, 2013). Lignans are non-enzymatic 39
antioxidants, found in plants such as flaxseed (Linum usitatissimum), the richest source of 40
lignans among foods, in greater concentration in the seed hull (Choo et al., 2007; Goyal et 41
al., 2014). A wide variety of lignans might be found in the flaxseed: secoisolariciresinol 42
diglucoside (SDG); secoisolariciresinol (SECO); isolariciresinol; pinoresinol; and 43
matairesinol, and all of these compounds except isolariciresinol could be enterediol (ED) and 44
enterolactone (EL) precursors (Heinonen et al., 2001). 45
Flaxseed intake is recommended by the lignans antiestrogenic, antioxidant, anti-46
inflammatory, anticarcinogenic and cardioprotective capacity (Adolphe et al., 2010; Imran et 47
al., 2015) and the benefits can be extended to the consumer of animals products, for instance, 48
lignans fed to dairy cows can be transferred to milk and meat (Gagnon et al., 2009; Petit and 49
Gagnon, 2009a; Petit et al., 2009; Matumoto-Pintro et al., 2011; Lima et al., 2016), and 50
further more can be transferred, for example, to the new-born serum after lignan-rich milk 51
intake (Ghedini et al., 2017). This suggests that lignans-rich sources should be included in 52
animals diet as functional food, with potential for disease prevention and health benefits. 53
The rumen microbial community is a complex environment, which can differ between 54
animals, considering that the microbiome populations can gain or lose dominance in the 55
rumen depending on the composition of the diet (Stiverson et al., 2011; Carberry et al., 2012; 56
Huws et al., 2012; Friedman et al., 2017), age (Jami et al., 2013), host animal breed (King et 57
al., 2011), host animal species (Baraka, 2012) feed efficiency (Jami et al., 2014; Shabat et al., 58
2016), and other factors, such as antibiotic usage, health of the host animal, geographic 59
location, season, photoperiod, stress level, environment, and feeding regimen (intake and 60
frequency) (Puniya et al., 2015). However, a core microbiome can be found across 61
individuals within a wide geographical range (Jami and Mizrahi, 2012; Henderson et al., 62
2015). Such complexity allows many possibilities for exploring novel biocatalysts of the 63
rumen ecology, although, the main issue is the few number of ruminal species that can be 64
successfully cultivated in laboratory conditions (less than ten percent) (Flint et al., 2008; Kim 65
et al., 2011). 66

84
Rumen microorganisms can efficiently convert SDG to SECO, then to enterolignans 67
(ED, and then to EL) (Côrtes et al., 2008; Petit and Gagnon, 2009a, b; Zhou et al., 2009; 68
Lima et al., 2016), and few ruminal species are pointed as efficient on lignans metabolism 69
(Prevotella bryantii, Prevotella albensi, Prevotella ruminicola, Prevotella brevis, 70
Peptostreptococcus anaerobius, Butyrivibrio fibrosolvens, Fibrobacter succinogens, 71
Ruminococcus albus, Eubacterium ruminantium, Butyrivibrio proteoclasticus, Ruminococcus 72
flavefaciens) (Schogor et al., 2014). Due to limitations on ruminal microbes growth in 73
laboratory conditions, the assessment of many microbes species biology depends on methods 74
that bypass the need for isolation or cultivation of microorganisms. Exploring the whole 75
rumen microbiome activity by metagenomic approaches allows enhancing the range of 76
microorganisms being assessed achieving the challenge of exploring complex microbial 77
environments (Handelsman, 2004; Ferrer et al., 2009; Simon and Daniel, 2011). 78
Metagenomics are indeed a reliable tool to explore a microbiome, however, it still 79
have some limitations, this can be supressed by use of metatranscriptomic approaches, which 80
have distinct characteristics when compared to metagenomics (Simon and Daniel, 2011). 81
Briefly, the metatranscriptomics analysis identifies most transcribed genes, whereas 82
metagenomics identifies the most dominant genes. The main issue is that a numerically 83
prevalent group of microbes not always play active role in some metabolism activity. For 84
instance, as much as 60% of total bacteria in rumen are represented by Prevotella sp., 85
however, this group of bacteria play no active role in recalcitrant cellulose digestion 86
(Stevenson and Weimer, 2007; Kong et al., 2010; Purushe et al., 2010). 87
Successful rumen metatranscriptome has proven that it is a reliable tool to explore the 88
rumen in novel relevant genes discovery. Reverse transcription on glycoside hydrolases from 89
celF, xynD, and cel3 from Fibrobacter succinogenes S85 in cow rumen (Wang et al., 2011), 90
and exploring degradation patterns, such as plant cell wall polysaccharide in cow rumen (Dai 91
et al., 2015) and genes coding for potentially valuable lignocellulolytic enzymes in muskoxen 92
rumen (Qi et al., 2011). 93
This work combines the need for further findings on lignans metabolism and the 94
complex rumen community yet to be deeply explored in the SDG breakdown pathways. 95
Therefore, a metatranscriptome using cow rumen inoculum and SDG in vitro incubations was 96
carried out, the extracts were sequenced and data is ready for further analysis using 97
bioinformatics tools for possible transcript genes involved on SDG metabolism. 98
99
100

85
RESULTS AND DISCUSSION 101
102
Sequencing data 103
All samples form metatranscriptome were deep sequenced (Hiseq – Illumina), yielding 104
approximately 11 GB of total complementary DNA (cDNA) (via RNA reverse transcription) 105
data. Basic statistics for cDNA quality (Conventional base calls; Ecoding Sanger / Illumina 106
1.9) are listed in Table 1. 107
108
Table 1. Basic statistics for cDNA quality 109
110
Sample Total
sequences
Sequences flagged as
poor quality
Sequence
length (bp)
%GC (guanine-
cytosine content):
RC1H0 4399318 0 96 52
RC2H0 5342618 0 96 50
RC3H0 4583533 0 96 51
RC1H6 3975126 0 96 51
RC2H6 4089860 0 96 48
RC3H6 2842790 0 96 50
RC1H24 7170743 0 96 52
RC2H24 3924789 0 96 51
RC3H24 5097049 0 96 51
SRC1H6 3391018 0 96 51
SRC2H6 4243010 0 96 47
SRC3H6 4044657 0 96 49
SRC1H24 4982588 0 96 52
SRC2H24 2913291 0 96 51
SRC3H24 5589767 0 96 52 Coding for incubation samples: Rumen fluid (R); Cow (C); Hour (H); SDG (S). 111 Cow: 1, 2 and 3; Time-points: 0h, 6h and 24h. 112 113
Overrepresented Sequences 114
115
A normal high-throughput library will contain a diverse set of sequences, with no 116
individual sequence making up a tiny fraction of the whole. Finding that a single sequence is 117
very overrepresented in the set either means that it is highly biologically significant, or 118
indicates that the library is contaminated (Bolger et al., 2014). Overrepresented sequences 119
were identified using FastQC software, as possible high biological significance in the 120
metatranscriptome data and are listed in Table 2. Sequences will be analysed for putative 121
genes linked to SDG breakdown. 122

86
Sequencing data must be assembled and differentially expressed genes should be 123
assessed in order to find genes and enzymes with active role in SDG breakdown in the 124
rumen. 125
126
Table 2. Rumen metatranscriptome overrepresented sequences 127 Sample Overrepresented Sequence Count Percentage
RC1H0
GAGTACCTTTTATCCTTTGAGCGATGCAGTTTCCATACACTTGCACCGGA 6178 0.140
TTGTAACACGTGTGTAGCCCCGGACGTAAGGGCCGTGCTGATTTGACGTC 4548 0.103
ATCCTGGCTCAGGATGAACGCTAGCTACAGGCTTAACACATGCAAGTCGA 13819 0.314
RC2H0
TCTTTCGTCCTTGATTAATGAAAACATCCTTGGCAAATGCTTTCGCATAC 7633 0.142
ATCTTTCGTCCTTGATTAATGAAAACATCCTTGGCAAATGCTTTCGCATA 7561 0.141
CTTTCGTCCTTGATTAATGAAAACATCCTTGGCAAATGCTTTCGCATACG 6763 0.126
TTTGGTCTACAAGAGATTTCTGTTCTCTTTGAGCTCACCTTTGGACACCT 6644 0.124
CTTCGGCCGCCAACGTTTCCAATTGGCTATTTGCTACTACCACCAAGATC 6433 0.120
TTTCATCTTTCCTTCACAGTACTTGTTCGCTATCGGTCTCCCATCAATAT 5836 0.109
TGATTAATGAAAACATCCTTGGCAAATGCTTTCGCATACGTTAGTCTTTA 5674 0.106
AGTTACGGATCTATTTTGCCGACTTCCCTTATCTACATTATTCTATCGAC 5606 0.104
ACTGTCTCTATTAACCGTAATTTAGAATTAACCAAGATTCTAAATACATT 5519 0.103
CTATCGGTCTCCCATCAATATTTAGCTTTGGAAGATTCATATCTCCCGCT 5419 0.101
ATTTAGGACCGAGTAACCCCTGACCAAATGCTGTTCGCAGGGAACCCTTC 5362 0.100
TTGGTCTACAAGAGATTTCTGTTCTCTTTGAGCTCACCTTTGGACACCTG 5354 0.100
RC3H0
TTGTAACACGTGTGTAGCCCCGGACGTAAGGGCCGTGCTGATTTGACGTC 5543 0.120
GAGTACCTTTTATCCTTTGAGCGATGCAGTTTCCATACACTTGCACCGGA 5155 0.112
ATCCTGGCTCAGGATGAACGCTAGCTACAGGCTTAACACATGCAAGTCGA 10134 0.221
RC1H6 No overrepresented sequences 0 0
RC2H6
TTTGGTCTACAAGAGATTTCTGTTCTCTTTGAGCTCACCTTTGGACACCT 7735 0.189
ATCTTTCGTCCTTGATTAATGAAAACATCCTTGGCAAATGCTTTCGCATA 7639 0.186
AGTTACGGATCTATTTTGCCGACTTCCCTTATCTACATTATTCTATCGAC 7093 0.173
TCTTTCGTCCTTGATTAATGAAAACATCCTTGGCAAATGCTTTCGCATAC 6327 0.154
CTATACCCAAATTTGACGAGTGATTTGCACGTCAACACCGCTTCGAGCCT 6261 0.153
ATTTAGGACCGAGTAACCCCTGACCAAATGCTGTTCGCAGGGAACCCTTC 6169 0.150
ATCCTGAGGGAAACTTCAGAGGGAACCAGCTACTAGATGGTTCGATTAGT 6074 0.148
ATTAGTCTTTCGCCCCTATACCCAAATTTGACGAGTGATTTGCACGTCAA 4106 0.100
AGATCTGCACTAGATGCCGTTCGACCCAGGCTCACGCCAAAGGCTTCTCA 4105 0.100
RC3H6
TTTCATCTTTCCTTCACAGTACTTGTTCGCTATCGGTCTCCCATCAATAT 3143 0.110
CTGCCTTCCGTAGATGTAGTAGCCGTTTCTCAGGCTCCTTCTCCAGAATC 3046 0.107
AGTTACGGATCTATTTTGCCGACTTCCCTTATCTACATTATTCTATCGAC 2969 0.104
CAGGTCCAGACATAGTAAGGATTGACAGATTGATAGCTCTTTCTTGATTC 3346 0.117
RC1H24
GAGTACCTTTTATCCGTTGAGCGATGGCCCTTCCATACAGAACCACCGGA 60095 0.838
CTGCTGCCTCCCGTAGGAGTCTGGGCCGTGTCTCAGTCCCAGTGTGGCTG 45971 0.641
GCTTTCGCACCTGCTTGACTTGTCAGTCTCGCAGTTAAGCACGCTTATGC 42552 0.593
TACATCTTCCGCGCAGGACGACTCGATCAGTGAGCTATTACGCTTTCTTT 35861 0.500
TTACATCTTCCGCGCAGGACGACTCGATCAGTGAGCTATTACGCTTTCTT 32237 0.449
TTCGTTTCCCACTTAGCCAATTTTAGGGACCTTAGCTGGCGGTCTGGGTT 30994 0.432
GGTTCGCCTCAACAGCCTATGTATTCAGCTGTTGATACCCTTGCGGGTGG 29255 0.407
CAATTCCTTTGAGTTTTAACCTTGCGGCCGTACTCCCCAGGCGGTCAACT 28005 0.390
AGTACCTTTTATCCGTTGAGCGATGGCCCTTCCATACAGAACCACCGGAT 27840 0.388
CTGCCGCACTCCAGCCTTGCAGTCACAATGGCAGTTCCCAGGTTGAGCCC 26006 0.362
CTTTCCGTCTTTCCGCGGGGAGATTGCATCATCACAAACATTTCAACTTC 25924 0.361
TGCTGCCTCCCGTAGGAGTCTGGGCCGTGTCTCAGTCCCAGTGTGGCTGA 25593 0.356
TGATGAGTATTTAGCCTTGGAGGATGGTCCCCCCATGTTCAGACAGGGTT 24410 0.340
CACATCGCACTATTGAGCGGTACAGGAATATTGACCTGTTTCCCATCAGT 24279 0.338
TTCACCCCTATCCACAGCTCATCCGCTAATTTTGCAACACTAGTCGGTTC 24091 0.335
GTCAAACTGCCTACCATGCACTGTCCCCGATCCCGATTAGGGACCCAGGT 22667 0.316
ATACATTTTCGGCGCAGCGTCACTCGACCAGTGAGCTATTACGCACTCTT 15826 0.403
GAGTACCTTTTATCCGTTGAGCGATGGCCCTTCCATACAGAACCACCGGA 13323 0.339
CTGCTGCCTCCCGTAGGAGTCTGGGCCGTGTCTCAGTCCCAGTGTGGCTG 13044 0.332
GCTTTCGCATCTGCTCGACTTGTCAGTCTCGCAGTTAAGCACGCTTATGC 12162 0.309
TACATTTTCGGCGCAGCGTCACTCGACCAGTGAGCTATTACGCACTCTTT 11710 0.298
TACATCTTCCGCGCAGGACGACTCGATCAGTGAGCTATTACGCTTTCTTT 10777 0.274
ATCGATTAGTATTCGTCAGCTCCATGTGTCACCACACTTCCACCTCGAAC 10759 0.274
CAATTCCTTTGAGTTTCAACCTTGCGGCCGTACTCCCCAGGCGGTCAACT 10436 0.265
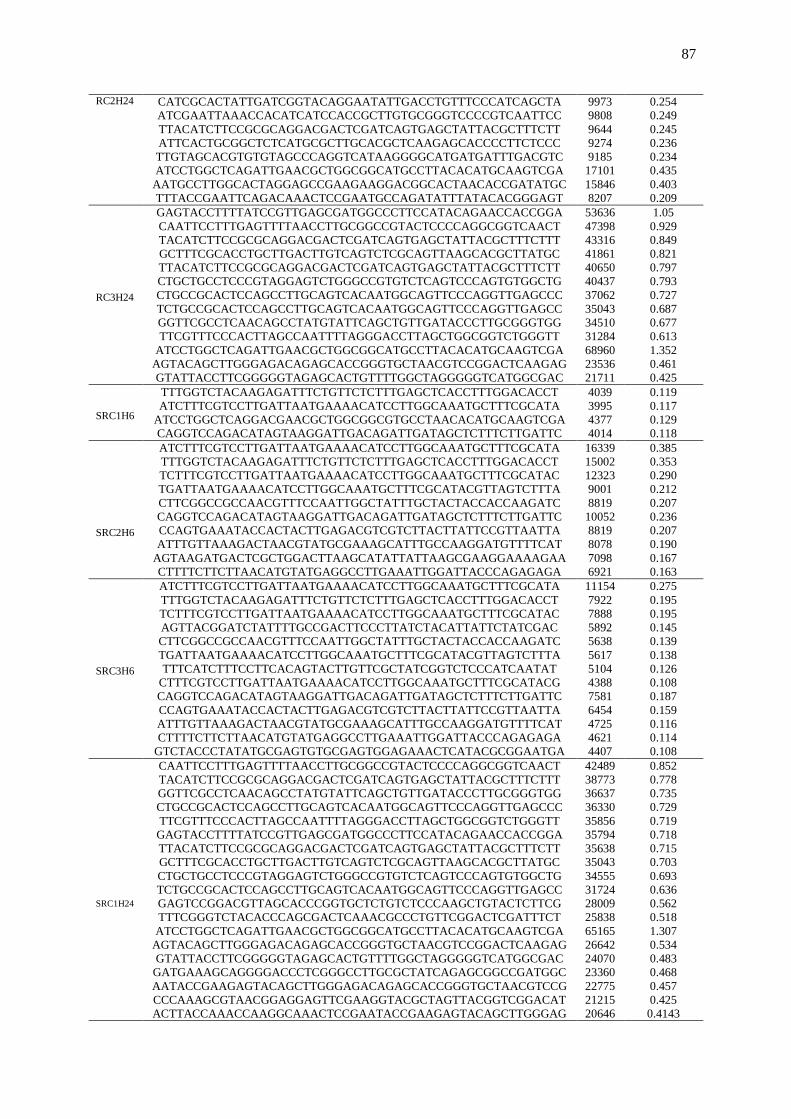
87
RC2H24 CATCGCACTATTGATCGGTACAGGAATATTGACCTGTTTCCCATCAGCTA 9973 0.254
ATCGAATTAAACCACATCATCCACCGCTTGTGCGGGTCCCCGTCAATTCC 9808 0.249
TTACATCTTCCGCGCAGGACGACTCGATCAGTGAGCTATTACGCTTTCTT 9644 0.245
ATTCACTGCGGCTCTCATGCGCTTGCACGCTCAAGAGCACCCCTTCTCCC 9274 0.236
TTGTAGCACGTGTGTAGCCCAGGTCATAAGGGGCATGATGATTTGACGTC 9185 0.234
ATCCTGGCTCAGATTGAACGCTGGCGGCATGCCTTACACATGCAAGTCGA 17101 0.435
AATGCCTTGGCACTAGGAGCCGAAGAAGGACGGCACTAACACCGATATGC 15846 0.403
TTTACCGAATTCAGACAAACTCCGAATGCCAGATATTTATACACGGGAGT 8207 0.209
RC3H24
GAGTACCTTTTATCCGTTGAGCGATGGCCCTTCCATACAGAACCACCGGA 53636 1.05
CAATTCCTTTGAGTTTTAACCTTGCGGCCGTACTCCCCAGGCGGTCAACT 47398 0.929
TACATCTTCCGCGCAGGACGACTCGATCAGTGAGCTATTACGCTTTCTTT 43316 0.849
GCTTTCGCACCTGCTTGACTTGTCAGTCTCGCAGTTAAGCACGCTTATGC 41861 0.821
TTACATCTTCCGCGCAGGACGACTCGATCAGTGAGCTATTACGCTTTCTT 40650 0.797
CTGCTGCCTCCCGTAGGAGTCTGGGCCGTGTCTCAGTCCCAGTGTGGCTG 40437 0.793
CTGCCGCACTCCAGCCTTGCAGTCACAATGGCAGTTCCCAGGTTGAGCCC 37062 0.727
TCTGCCGCACTCCAGCCTTGCAGTCACAATGGCAGTTCCCAGGTTGAGCC 35043 0.687
GGTTCGCCTCAACAGCCTATGTATTCAGCTGTTGATACCCTTGCGGGTGG 34510 0.677
TTCGTTTCCCACTTAGCCAATTTTAGGGACCTTAGCTGGCGGTCTGGGTT 31284 0.613
ATCCTGGCTCAGATTGAACGCTGGCGGCATGCCTTACACATGCAAGTCGA 68960 1.352
AGTACAGCTTGGGAGACAGAGCACCGGGTGCTAACGTCCGGACTCAAGAG 23536 0.461
GTATTACCTTCGGGGGTAGAGCACTGTTTTGGCTAGGGGGTCATGGCGAC 21711 0.425
SRC1H6
TTTGGTCTACAAGAGATTTCTGTTCTCTTTGAGCTCACCTTTGGACACCT 4039 0.119
ATCTTTCGTCCTTGATTAATGAAAACATCCTTGGCAAATGCTTTCGCATA 3995 0.117
ATCCTGGCTCAGGACGAACGCTGGCGGCGTGCCTAACACATGCAAGTCGA 4377 0.129
CAGGTCCAGACATAGTAAGGATTGACAGATTGATAGCTCTTTCTTGATTC 4014 0.118
SRC2H6
ATCTTTCGTCCTTGATTAATGAAAACATCCTTGGCAAATGCTTTCGCATA 16339 0.385
TTTGGTCTACAAGAGATTTCTGTTCTCTTTGAGCTCACCTTTGGACACCT 15002 0.353
TCTTTCGTCCTTGATTAATGAAAACATCCTTGGCAAATGCTTTCGCATAC 12323 0.290
TGATTAATGAAAACATCCTTGGCAAATGCTTTCGCATACGTTAGTCTTTA 9001 0.212
CTTCGGCCGCCAACGTTTCCAATTGGCTATTTGCTACTACCACCAAGATC 8819 0.207
CAGGTCCAGACATAGTAAGGATTGACAGATTGATAGCTCTTTCTTGATTC 10052 0.236
CCAGTGAAATACCACTACTTGAGACGTCGTCTTACTTATTCCGTTAATTA 8819 0.207
ATTTGTTAAAGACTAACGTATGCGAAAGCATTTGCCAAGGATGTTTTCAT 8078 0.190
AGTAAGATGACTCGCTGGACTTAAGCATATTATTAAGCGAAGGAAAAGAA 7098 0.167
CTTTTCTTCTTAACATGTATGAGGCCTTGAAATTGGATTACCCAGAGAGA 6921 0.163
SRC3H6
ATCTTTCGTCCTTGATTAATGAAAACATCCTTGGCAAATGCTTTCGCATA 11154 0.275
TTTGGTCTACAAGAGATTTCTGTTCTCTTTGAGCTCACCTTTGGACACCT 7922 0.195
TCTTTCGTCCTTGATTAATGAAAACATCCTTGGCAAATGCTTTCGCATAC 7888 0.195
AGTTACGGATCTATTTTGCCGACTTCCCTTATCTACATTATTCTATCGAC 5892 0.145
CTTCGGCCGCCAACGTTTCCAATTGGCTATTTGCTACTACCACCAAGATC 5638 0.139
TGATTAATGAAAACATCCTTGGCAAATGCTTTCGCATACGTTAGTCTTTA 5617 0.138
TTTCATCTTTCCTTCACAGTACTTGTTCGCTATCGGTCTCCCATCAATAT 5104 0.126
CTTTCGTCCTTGATTAATGAAAACATCCTTGGCAAATGCTTTCGCATACG 4388 0.108
CAGGTCCAGACATAGTAAGGATTGACAGATTGATAGCTCTTTCTTGATTC 7581 0.187
CCAGTGAAATACCACTACTTGAGACGTCGTCTTACTTATTCCGTTAATTA 6454 0.159
ATTTGTTAAAGACTAACGTATGCGAAAGCATTTGCCAAGGATGTTTTCAT 4725 0.116
CTTTTCTTCTTAACATGTATGAGGCCTTGAAATTGGATTACCCAGAGAGA 4621 0.114
GTCTACCCTATATGCGAGTGTGCGAGTGGAGAAACTCATACGCGGAATGA 4407 0.108
SRC1H24
CAATTCCTTTGAGTTTTAACCTTGCGGCCGTACTCCCCAGGCGGTCAACT 42489 0.852
TACATCTTCCGCGCAGGACGACTCGATCAGTGAGCTATTACGCTTTCTTT 38773 0.778
GGTTCGCCTCAACAGCCTATGTATTCAGCTGTTGATACCCTTGCGGGTGG 36637 0.735
CTGCCGCACTCCAGCCTTGCAGTCACAATGGCAGTTCCCAGGTTGAGCCC 36330 0.729
TTCGTTTCCCACTTAGCCAATTTTAGGGACCTTAGCTGGCGGTCTGGGTT 35856 0.719
GAGTACCTTTTATCCGTTGAGCGATGGCCCTTCCATACAGAACCACCGGA 35794 0.718
TTACATCTTCCGCGCAGGACGACTCGATCAGTGAGCTATTACGCTTTCTT 35638 0.715
GCTTTCGCACCTGCTTGACTTGTCAGTCTCGCAGTTAAGCACGCTTATGC 35043 0.703
CTGCTGCCTCCCGTAGGAGTCTGGGCCGTGTCTCAGTCCCAGTGTGGCTG 34555 0.693
TCTGCCGCACTCCAGCCTTGCAGTCACAATGGCAGTTCCCAGGTTGAGCC 31724 0.636
GAGTCCGGACGTTAGCACCCGGTGCTCTGTCTCCCAAGCTGTACTCTTCG 28009 0.562
TTTCGGGTCTACACCCAGCGACTCAAACGCCCTGTTCGGACTCGATTTCT 25838 0.518
ATCCTGGCTCAGATTGAACGCTGGCGGCATGCCTTACACATGCAAGTCGA 65165 1.307
AGTACAGCTTGGGAGACAGAGCACCGGGTGCTAACGTCCGGACTCAAGAG 26642 0.534
GTATTACCTTCGGGGGTAGAGCACTGTTTTGGCTAGGGGGTCATGGCGAC 24070 0.483
GATGAAAGCAGGGGACCCTCGGGCCTTGCGCTATCAGAGCGGCCGATGGC 23360 0.468
AATACCGAAGAGTACAGCTTGGGAGACAGAGCACCGGGTGCTAACGTCCG 22775 0.457
CCCAAAGCGTAACGGAGGAGTTCGAAGGTACGCTAGTTACGGTCGGACAT 21215 0.425
ACTTACCAAACCAAGGCAAACTCCGAATACCGAAGAGTACAGCTTGGGAG 20646 0.4143

88
ATCGGAATTACTGGGCGTAAAGCGTGCGCAGGCGGTTTTGTAAGACAGTG 17660 0.354
SRC2H24
CAATTCCTTTGAGTTTTAACCTTGCGGCCGTACTCCCCAGGCGGTCAACT 18105 0.621
TACATCTTCCGCGCAGGACGACTCGATCAGTGAGCTATTACGCTTTCTTT 16227 0.556
GAGTACCTTTTATCCGTTGAGCGATGGCCCTTCCATACAGAACCACCGGA 13570 0.465
CTTTCCGTCTTTCCGCGGGGAGATTGCATCATCACAAACATTTCAACTTC 13316 0.457
TTCGTTTCCCACTTAGCCAATTTTAGGGACCTTAGCTGGCGGTCTGGGTT 13121 0.450
GCTTTCGCACCTGCTTGACTTGTCAGTCTCGCAGTTAAGCACGCTTATGC 12317 0.422
CTGCTGCCTCCCGTAGGAGTCTGGGCCGTGTCTCAGTCCCAGTGTGGCTG 11977 0.411
AGTACCTTTTATCCGTTGAGCGATGGCCCTTCCATACAGAACCACCGGAT 11662 0.400
ATCCTGGCTCAGATTGAACGCTGGCGGCATGCCTTACACATGCAAGTCGA 26674 0.915
AGTACAGCTTGGGAGACAGAGCACCGGGTGCTAACGTCCGGACTCAAGAG 10225 0.350
CCCAAAGCGTAACGGAGGAGTTCGAAGGTACGCTAGTTACGGTCGGACAT 7136 0.244
AATACCGAAGAGTACAGCTTGGGAGACAGAGCACCGGGTGCTAACGTCCG 5963 0.204
GTATTACCTTCGGGGGTAGAGCACTGTTTTGGCTAGGGGGTCATGGCGAC 5629 0.193
SRC3H24
TACATCTTCCGCGCAGGACGACTCGATCAGTGAGCTATTACGCTTTCTTT 43861 0.784
CTGCCGCACTCCAGCCTTGCAGTCACAATGGCAGTTCCCAGGTTGAGCCC 43439 0.777
CAATTCCTTTGAGTTTTAACCTTGCGGCCGTACTCCCCAGGCGGTCAACT 42291 0.756
GCTTTCGCACCTGCTTGACTTGTCAGTCTCGCAGTTAAGCACGCTTATGC 37235 0.666
TTCGTTTCCCACTTAGCCAATTTTAGGGACCTTAGCTGGCGGTCTGGGTT 37157 0.664
GAGTACCTTTTATCCGTTGAGCGATGGCCCTTCCATACAGAACCACCGGA 34708 0.620
CTGCTGCCTCCCGTAGGAGTCTGGGCCGTGTCTCAGTCCCAGTGTGGCTG 34288 0.613
GAGTCCGGACGTTAGCACCCGGTGCTCTGTCTCCCAAGCTGTACTCTTCG 0.569 0.569
AGTACCTTTTATCCGTTGAGCGATGGCCCTTCCATACAGAACCACCGGAT 31590 0.565
TGCTGCCTCCCGTAGGAGTCTGGGCCGTGTCTCAGTCCCAGTGTGGCTGA 30636 0.548
TTACATCTTCCGCGCAGGACGACTCGATCAGTGAGCTATTACGCTTTCTT 29558 0.528
GGTTCGCCTCAACAGCCTATGTATTCAGCTGTTGATACCCTTGCGGGTGG 29312 0.524
TCTGCCGCACTCCAGCCTTGCAGTCACAATGGCAGTTCCCAGGTTGAGCC 28676 0.513
ATCCTGGCTCAGATTGAACGCTGGCGGCATGCCTTACACATGCAAGTCGA 78476 1.403
AGTACAGCTTGGGAGACAGAGCACCGGGTGCTAACGTCCGGACTCAAGAG 32352 0.578
CCCAAAGCGTAACGGAGGAGTTCGAAGGTACGCTAGTTACGGTCGGACAT 26139 0.467
GTATTACCTTCGGGGGTAGAGCACTGTTTTGGCTAGGGGGTCATGGCGAC 25908 0.463
GATGAAAGCAGGGGACCCTCGGGCCTTGCGCTATCAGAGCGGCCGATGGC 21926 0.392
AATACCGAAGAGTACAGCTTGGGAGACAGAGCACCGGGTGCTAACGTCCG 21018 0.376
ATCGGAATTACTGGGCGTAAAGCGTGCGCAGGCGGTTTTGTAAGACAGTG 19778 0.353
AGCTTCGGGCTAATACCCTGGAGTCATGACGGTACCGTAAGAATAAGCAC 15265 0.273
GAATAAGCACCGGCTAACTACGTGCCAGCAGCCGCGGTAATACGTAGGGT 14436 0.258
ACTTACCAAACCAAGGCAAACTCCGAATACCGAAGAGTACAGCTTGGGAG 14351 0.256
CTTACCAAACCAAGGCAAACTCCGAATACCGAAGAGTACAGCTTGGGAGA 14346 0.256
CCTTGCGCTATCAGAGCGGCCGATGGCAGATTAGGTAGTTGGTGGGATAA 13971 0.249
GTGGCGAACGGGTGAGTAATACATCGGAACGTGCCTGGTAGTGGGGGATA 13643 0.244
CGATAGTGCAATGGCATAAGCGTGCTTAACTGCGAGACTGACAAGTCAAG 13011 0.232
ATATGGTGGATGCCTTGGCGATGATAGGCGAAGAAAGACGTGATAGCCTG 12850 0.229
AGTTAACAAAACGGTCTGGAAAGGCCGGCCATAGTAGGTGATAGCCCTGT 12607 0.225
AGTGGCGAACGGGTGAGTAATACATCGGAACGTGCCTGGTAGTGGGGGAT 12252 0.219
CCTAAACGATGTCAACTGGTTGTTGGGGATTTATTTTCTCAGTAACGAAG 11765 0.210
128 In conclusion, RNA sequencing data was generated and now transcripts can be 129 assessed in order to identify putative genes linked to SDG breakdown. 130
131
EXPERIMENTAL PROCEDURES 132
133
Mixed species metatranscriptome incubations 134
135
In order to assess the gene expression of the rumen microbiota when in contact to 136
SDG a metatranscriptome was carried out, comparing the gene expression of rumen fluid 137
solution in three different time points with or without SDG into the incubation solution. 138
89
First of all, rumen fluid was collected from three different cows and strained through 139
two layers of cheese cloth. The rumen fluid was kept warm and taken to the laboratory for 140
immediate use. Moreover, SDG and rumen fluid were added into the incubation tube inside 141
an anaerobic workstation: 100µL of rumen fluid + 875µL of anaerobic medium (Table 3 and 142
4) (modified Van Soest medium (Theodorou et al., 1994)) + 25µL of SDG stock solution 143
(0.25mg) (10mg/mL). The incubations were carried out in triplicates with a different cow in 144
each repetition. Negative control incubations were carried out as following: 100µL of 145
prepared pure culture + 900µL of anaerobic medium. The incubation times were: 0h; 6h; and 146
24h. Immediately after preparing the Hungate tubes, the incubations were transferred to an 147
incubator at 39ºC. 148
The tubes were removed from the incubator according to each time point. The content 149
(1 mL) was centrifuged at 13,000 rpm for 2 minutes, the supernatant was discarded and the 150
remaining pellet was stored at -80ºC until RNA extraction procedure. 151
The incubations were carried out as following: Coding for incubation samples: Rumen fluid 152
(R); Cow (C); Hour (H); SDG (S); Cow: 1, 2 and 3; Time-points: 0h, 6h and 24h. For 153
instance, “RC1H0” stands for incubation of rumen fluid of cow 1 at 0 hour time point: 154
155
o RC1H0: SAMPLE 1a Rumen fluid Cow 1 – 0h 156
o RC2H0: SAMPLE 1b Rumen fluid Cow 2 – 0h 157
o RC3H0: SAMPLE 1c Rumen fluid Cow 3 – 0h 158
o RC1H6: SAMPLE 2a Rumen fluid Cow 1 – 6h 159
o RC2H6: SAMPLE 2b Rumen fluid Cow 2 – 6h 160
o RC3H6: SAMPLE 2c Rumen fluid Cow 3 – 6h 161
o RC1H24: SAMPLE 8a Rumen fluid Cow 1 – 24h 162
o RC2H24: SAMPLE 8b Rumen fluid Cow 2 – 24h 163
o RC3H24: SAMPLE 8c Rumen fluid Cow 3 – 24h 164
o SRC1H6: SAMPLE 9a SDG + Rumen fluid Cow 1 – 6h 165
o SRC2H6: SAMPLE 9b SDG + Rumen fluid Cow 2 – 6h 166
o SRC3H6: SAMPLE 9c SDG + Rumen fluid Cow 3 – 6h 167
o SRC1H24: SAMPLE 10a SDG + Rumen fluid Cow 1 – 24h 168
o SRC2H24: SAMPLE 10b SDG + Rumen fluid Cow 2 – 24h 169
o SRC3H24: SAMPLE 10c SDG + Rumen fluid Cow 3 – 24h 170
171
172
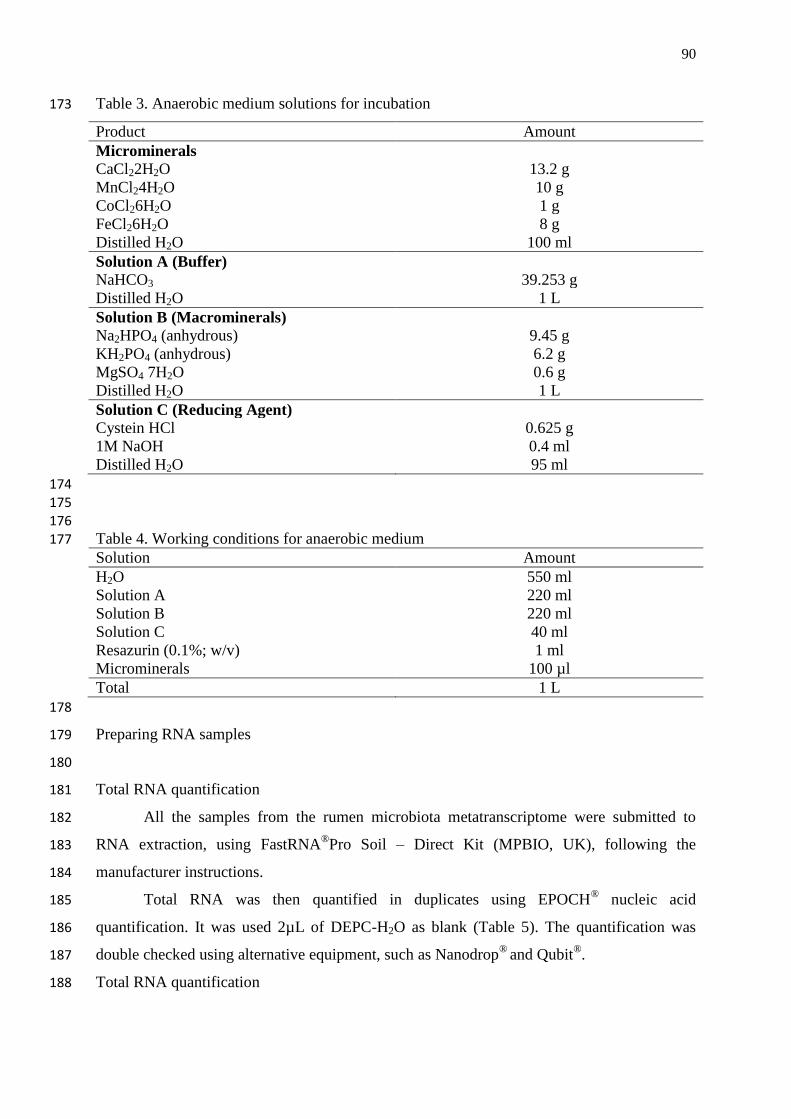
90
Table 3. Anaerobic medium solutions for incubation 173
Product Amount
Microminerals
CaCl22H2O 13.2 g
MnCl24H2O 10 g
CoCl26H2O 1 g
FeCl26H2O 8 g
Distilled H2O 100 ml
Solution A (Buffer)
NaHCO3 39.253 g
Distilled H2O 1 L
Solution B (Macrominerals)
Na2HPO4 (anhydrous) 9.45 g
KH2PO4 (anhydrous) 6.2 g
MgSO4 7H2O 0.6 g
Distilled H2O 1 L
Solution C (Reducing Agent)
Cystein HCl 0.625 g
1M NaOH 0.4 ml
Distilled H2O 95 ml
174
175 176
Table 4. Working conditions for anaerobic medium 177
Solution Amount
H2O 550 ml
Solution A 220 ml
Solution B 220 ml
Solution C 40 ml
Resazurin (0.1%; w/v) 1 ml
Microminerals 100 µl
Total 1 L
178
Preparing RNA samples 179
180
Total RNA quantification 181
All the samples from the rumen microbiota metatranscriptome were submitted to 182
RNA extraction, using FastRNA®Pro Soil – Direct Kit (MPBIO, UK), following the 183
manufacturer instructions. 184
Total RNA was then quantified in duplicates using EPOCH® nucleic acid 185
quantification. It was used 2µL of DEPC-H2O as blank (Table 5). The quantification was 186
double checked using alternative equipment, such as Nanodrop®
and Qubit®. 187
Total RNA quantification 188
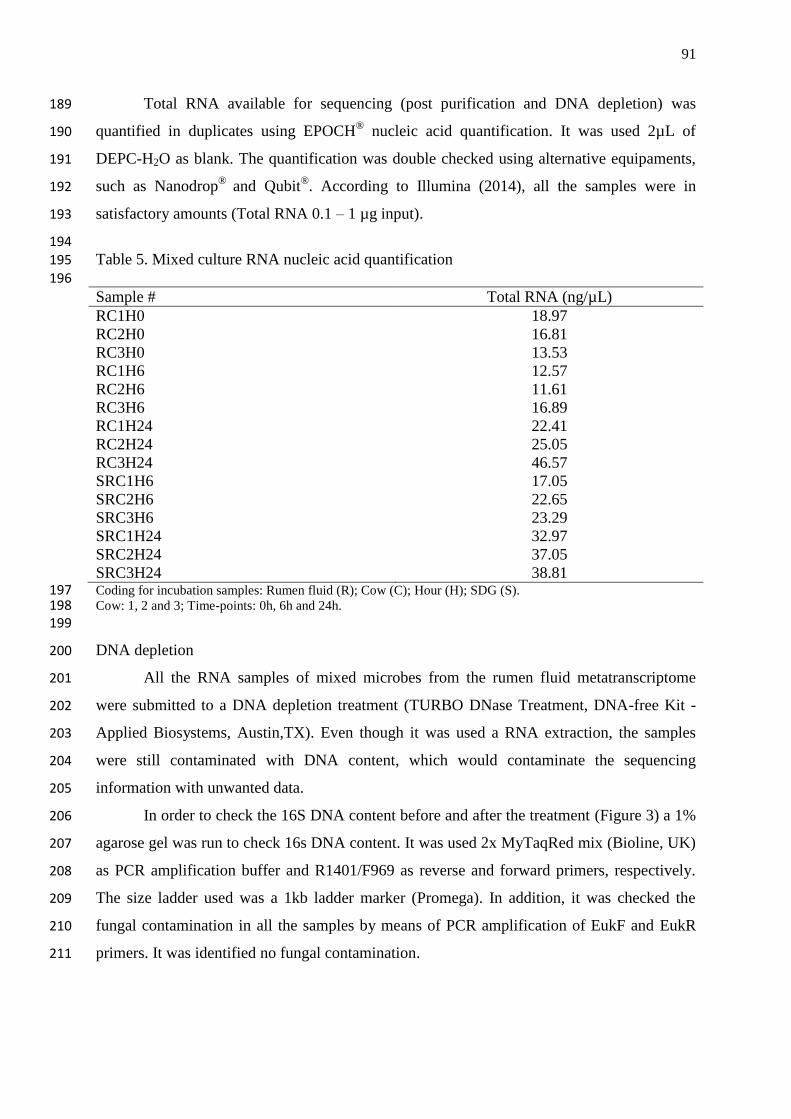
91
Total RNA available for sequencing (post purification and DNA depletion) was 189
quantified in duplicates using EPOCH®
nucleic acid quantification. It was used 2µL of 190
DEPC-H2O as blank. The quantification was double checked using alternative equipaments, 191
such as Nanodrop®
and Qubit®. According to Illumina (2014), all the samples were in 192
satisfactory amounts (Total RNA 0.1 – 1 µg input). 193
194 Table 5. Mixed culture RNA nucleic acid quantification 195 196
Sample # Total RNA (ng/µL)
RC1H0 18.97
RC2H0 16.81
RC3H0 13.53
RC1H6 12.57
RC2H6 11.61
RC3H6 16.89
RC1H24 22.41
RC2H24 25.05
RC3H24 46.57
SRC1H6 17.05
SRC2H6 22.65
SRC3H6 23.29
SRC1H24 32.97
SRC2H24 37.05
SRC3H24 38.81 Coding for incubation samples: Rumen fluid (R); Cow (C); Hour (H); SDG (S). 197 Cow: 1, 2 and 3; Time-points: 0h, 6h and 24h. 198 199
DNA depletion 200
All the RNA samples of mixed microbes from the rumen fluid metatranscriptome 201
were submitted to a DNA depletion treatment (TURBO DNase Treatment, DNA-free Kit - 202
Applied Biosystems, Austin,TX). Even though it was used a RNA extraction, the samples 203
were still contaminated with DNA content, which would contaminate the sequencing 204
information with unwanted data. 205
In order to check the 16S DNA content before and after the treatment (Figure 3) a 1% 206
agarose gel was run to check 16s DNA content. It was used 2x MyTaqRed mix (Bioline, UK) 207
as PCR amplification buffer and R1401/F969 as reverse and forward primers, respectively. 208
The size ladder used was a 1kb ladder marker (Promega). In addition, it was checked the 209
fungal contamination in all the samples by means of PCR amplification of EukF and EukR 210
primers. It was identified no fungal contamination. 211

92
The rumen fluid metatranscriptome samples were stored at -80ºC until be sent to 212
sequence in a Hiseq sequencing system (Illumina®), with 1µg Total RNA input, using a 213
Truseq Adapter. 214
215
216
Figure 1. 16S DNA band detected in the RNA sample before DNase treatment (left) and 16S DNA band not 217 detected in the RNA sample after the DNase treatment (right). Wells: size ladder; 2: RC1H0; 3: RC2H0; 4: 218 RC3H0; 5: RC1H6; 6: RC2H6; 7: RC3H6; 8: RC1H24; 9: RC2H24; 10: RC3H24; 11: SRC1H6; 12: SRC2H6; 219 13: SRC3H6; 14: SRC1H24; 15: SRC2H24; 16: SRC3H24. 220 221
Bioinformatics 222
223
The bioinformatics analysis of the metatranscriptome data was performed in an UNIX 224
platform, using High-Performance Computing (HPC), which consists of a master node, a 225
login node, 11 compute nodes and two storage nodes. The combined compute capacity of the 226
HPC is: 544 CPU cores, 4.2TB RAM and 43TB storage capacity and 11TB of fast access 227
disk. This is backed by a 1/4 PB storage array for storage of sequencing data. 228
229
230
FASTQC 231
232
Before analysing the sequence to draw biological conclusions, some simple quality 233
control checks were performed to ensure that the raw data looks reliable. FastQC was carried 234
out in all data aiming to provide a QC report which can spot data problems (Schmieder and 235
Edwards, 2011). 236
237
238
239
240
1
2 3 4 5 6 7 8 9 10 11 12 13 14 15 16
1 2 3 4 5 6 7 8 9 10 11 12 13 14 15 16
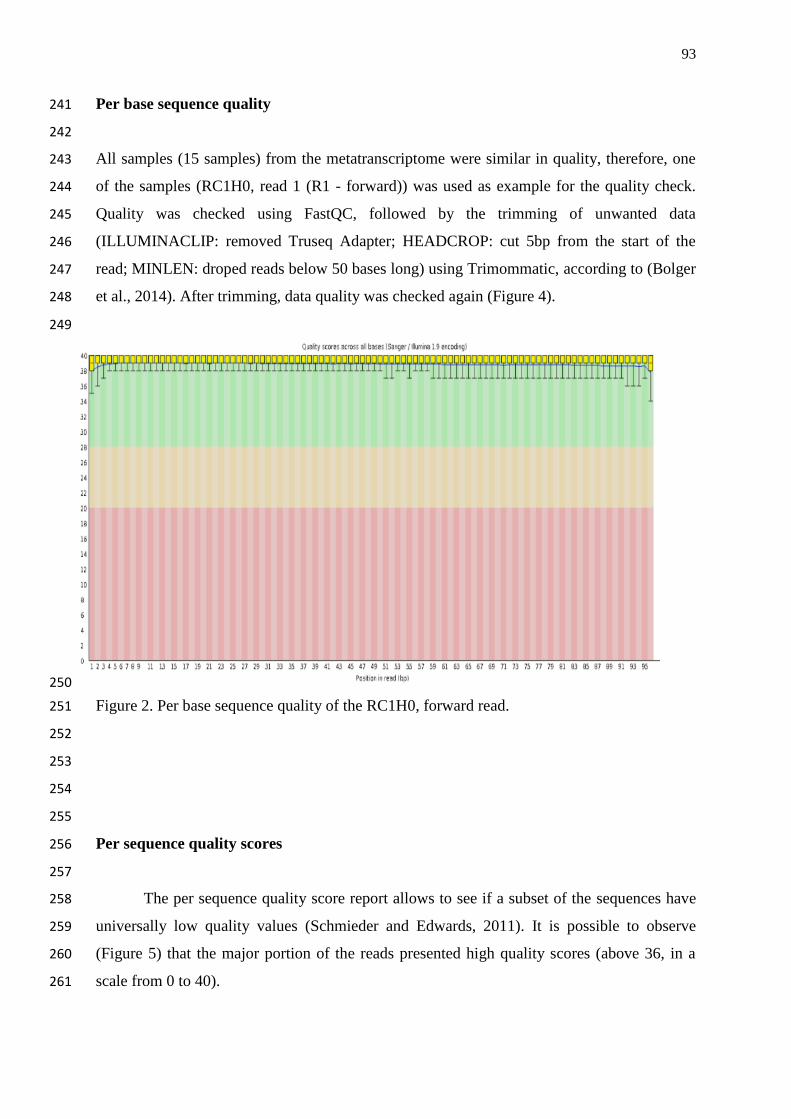
93
Per base sequence quality 241
242
All samples (15 samples) from the metatranscriptome were similar in quality, therefore, one 243
of the samples (RC1H0, read 1 (R1 - forward)) was used as example for the quality check. 244
Quality was checked using FastQC, followed by the trimming of unwanted data 245
(ILLUMINACLIP: removed Truseq Adapter; HEADCROP: cut 5bp from the start of the 246
read; MINLEN: droped reads below 50 bases long) using Trimommatic, according to (Bolger 247
et al., 2014). After trimming, data quality was checked again (Figure 4). 248
249
250
Figure 2. Per base sequence quality of the RC1H0, forward read. 251
252
253
254
255
Per sequence quality scores 256
257
The per sequence quality score report allows to see if a subset of the sequences have 258
universally low quality values (Schmieder and Edwards, 2011). It is possible to observe 259
(Figure 5) that the major portion of the reads presented high quality scores (above 36, in a 260
scale from 0 to 40). 261

94
262
Figure 3. Per sequence quality score of the RC1H0, forward read. 263
264
Per base sequence content 265
266
It is expected to observe little or no difference between the different bases of a 267
sequence run, however, as the nucleic acid were extracted from a mixed culture sample it was 268
observed (Figure 6) a small fluctuation between bases (thymine (T) in red; cytosine (C) in 269
blue; adenine (A) in green; and guanine (G) in black). (Schmieder and Edwards, 2011). 270
271
272
Figure 4. Per base sequence content of RC1H0, forward read. 273
274
275

95
Overrepresented Sequences 276
277
An Illumina (TruSeq) was observed adapter in most of the reads as overrepresentation 278
in the run. The adapter was successfully removed from the read following trimming 279
procedure using Trimmomatic (Bolger et al., 2014). Other overrepresented sequences were 280
listed as possible high biological relevance. 281
282
RNA expression – Rnaseq data analysis 283
284
The metatranscriptome will be followed by genome annotation to map samples, using 285
Tophat (Bowtie software) . TopHat is a program that aligns RNA-Seq reads to a genome in 286
order to identify exon-exon splice junctions. It is built on the ultrafast short read mapping 287
program Bowtie. TopHat is a bioinformatic sequence analysis package tool for fast and high 288
throughput alignment of shotgun cDNA sequencing reads generated by transcriptomics 289
technologies (e.g. RNA-Seq) using Bowtie first and then mapping to a reference genome to 290
discover RNA splice sites de novo (Trapnell et al., 2009). The analysis will be followed by 4 291
steps using the following R software packages: GenomicAligments, Rsamtools, 292
GenomicFeatures, DESeq2. Finally, the genes listed will follow to enrichment analysis to 293
identify biological significance and pathways, it will be carried out using websites such as 294
string-do.org; eggnogdb.de; uniprot.org. 295
296
REFERENCES 297
298 Adolphe, J.L., Whiting, S.J., Juurlink, B.H., Thorpe, L.U., and Alcorn, J. (2010) Health effects with 299 consumption of the flax lignan secoisolariciresinol diglucoside. British Journal of Nutrition 103: 929-300 938. 301 Ames, B.N., Shigenaga, M.K., and Hagen, T.M. (1993) Oxidants, antioxidants, and the degenerative 302 diseases of aging. Proceedings of the National Academy of Sciences 90: 7915-7922. 303 Baraka, T. (2012) Comparative studies of rumen pH, total protozoa count, generic and species 304 composition of ciliates in camel, buffalo, cattle, sheep and goat in Egypt. J Am Sci 8: 448-462. 305 Bolger, A.M., Lohse, M., and Usadel, B. (2014) Trimmomatic: a flexible trimmer for Illumina 306 sequence data. Bioinformatics 30: 2114-2120. 307 Carberry, C.A., Kenny, D.A., Han, S., McCabe, M.S., and Waters, S.M. (2012) Effect of phenotypic 308 residual feed intake and dietary forage content on the rumen microbial community of beef cattle. 309 Applied and environmental microbiology 78: 4949-4958. 310 Carocho, M., and Ferreira, I.C. (2013) A review on antioxidants, prooxidants and related controversy: 311 natural and synthetic compounds, screening and analysis methodologies and future perspectives. Food 312 and Chemical Toxicology 51: 15-25. 313 Carreau, C., Flouriot, G., Bennetau-Pelissero, C., and Potier, M. (2008) Enterodiol and enterolactone, 314 two major diet-derived polyphenol metabolites have different impact on ERα transcriptional 315
96
activation in human breast cancer cells. The Journal of steroid biochemistry and molecular biology 316 110: 176-185. 317 Choo, W.-S., Birch, J., and Dufour, J.-P. (2007) Physicochemical and quality characteristics of cold-318 pressed flaxseed oils. Journal of Food Composition and Analysis 20: 202-211. 319 Christen, Y. (2000) Oxidative stress and Alzheimer disease. The American journal of clinical 320 nutrition 71: 621s-629s. 321 Côrtes, C., Gagnon, N., Benchaar, C., Da Silva, D., Santos, G., and Petit, H. (2008) In vitro 322 metabolism of flax lignans by ruminal and faecal microbiota of dairy cows. Journal of applied 323 microbiology 105: 1585-1594. 324 Dai, X., Tian, Y., Li, J., Su, X., Wang, X., Zhao, S. et al. (2015) Metatranscriptomic analyses of plant 325 cell wall polysaccharide degradation by microorganisms in the cow rumen. Applied and 326 environmental microbiology 81: 1375-1386. 327 Ferrer, M., Beloqui, A., Timmis, K.N., and Golyshin, P.N. (2009) Metagenomics for mining new 328 genetic resources of microbial communities. Journal of molecular microbiology and biotechnology 329 16: 109-123. 330 Flint, H.J., Bayer, E.A., Rincon, M.T., Lamed, R., and White, B.A. (2008) Polysaccharide utilization 331 by gut bacteria: potential for new insights from genomic analysis. Nature reviews Microbiology 6: 332 121. 333 Friedman, N., Shriker, E., Gold, B., Durman, T., Zarecki, R., Ruppin, E., and Mizrahi, I. (2017) Diet‐334 induced changes of redox potential underlie compositional shifts in the rumen archaeal community. 335 Environmental microbiology 19: 174-184. 336 Gagnon, N., Côrtes, C., da Silva, D., Kazama, R., Benchaar, C., dos Santos, G. et al. (2009) Ruminal 337 metabolism of flaxseed (Linum usitatissimum) lignans to the mammalian lignan enterolactone and its 338 concentration in ruminal fluid, plasma, urine and milk of dairy cows. British Journal of Nutrition 102: 339 1015-1023. 340 Ghedini, C., Whitehouse, N., Moura, D., Oliveira, A., and Brito, A. (2017) The mammalian lignan 341 enterolactone is absorbed by newborn dairy calves fed enterolactone-enriched milk. Journal of dairy 342 science 100: 8170-8175. 343 Goyal, A., Sharma, V., Upadhyay, N., Gill, S., and Sihag, M. (2014) Flax and flaxseed oil: an ancient 344 medicine & modern functional food. Journal of food science and technology 51: 1633-1653. 345 Halliwell, B. (2007) Biochemistry of oxidative stress. In: Portland Press Limited. 346 Handelsman, J. (2004) Metagenomics: application of genomics to uncultured microorganisms. 347 Microbiology and molecular biology reviews 68: 669-685. 348 Henderson, G., Cox, F., Ganesh, S., Jonker, A., Young, W., Collaborators, G.R.C., and Janssen, P.H. 349 (2015) Rumen microbial community composition varies with diet and host, but a core microbiome is 350 found across a wide geographical range. Scientific reports 5. 351 Hitchon, C.A., and El-Gabalawy, H.S. (2004) Oxidation in rheumatoid arthritis. Arthritis Res Ther 6: 352 265. 353 Huws, S.A., Chiariotti, A., Sarubbi, F., Carfì, F., and Pace, V. (2012) Effects of feeding 354 Mediterranean buffalo sorghum silage versus maize silage on the rumen microbiota and milk fatty 355 acid content. The Journal of general and applied microbiology 58: 107-112. 356 Illumina (2014). TruSeq® RNA Sample Preparation v2 Guide. URL 357 https://support.illumina.com/content/dam/illumina-358 support/documents/documentation/chemistry_documentation/samplepreps_truseq/truseqrna/truseq-359 rna-sample-prep-v2-guide-15026495-f.pdf 360 Imran, M., Ahmad, N., Anjum, F.M., Khan, M.K., Mushtaq, Z., Nadeem, M., and Hussain, S. (2015) 361 Potential protective properties of flax lignan secoisolariciresinol diglucoside. Nutrition journal 14: 71. 362 Jami, E., and Mizrahi, I. (2012) Composition and similarity of bovine rumen microbiota across 363 individual animals. PloS one 7: e33306. 364 Jami, E., White, B.A., and Mizrahi, I. (2014) Potential role of the bovine rumen microbiome in 365 modulating milk composition and feed efficiency. PLoS One 9: e85423. 366 Jami, E., Israel, A., Kotser, A., and Mizrahi, I. (2013) Exploring the bovine rumen bacterial 367 community from birth to adulthood. The ISME journal 7: 1069. 368

97
Khlebnikov, A.I., Schepetkin, I.A., Domina, N.G., Kirpotina, L.N., and Quinn, M.T. (2007) Improved 369 quantitative structure–activity relationship models to predict antioxidant activity of flavonoids in 370 chemical, enzymatic, and cellular systems. Bioorganic & medicinal chemistry 15: 1749-1770. 371 Kim, M., Morrison, M., and Yu, Z. (2011) Status of the phylogenetic diversity census of ruminal 372 microbiomes. FEMS microbiology ecology 76: 49-63. 373 King, E.E., Smith, R.P., St-Pierre, B., and Wright, A.-D.G. (2011) Differences in the rumen 374 methanogen populations of lactating Jersey and Holstein dairy cows under the same diet regimen. 375 Applied and Environmental Microbiology 77: 5682-5687. 376 Kong, Y., Teather, R., and Forster, R. (2010) Composition, spatial distribution, and diversity of the 377 bacterial communities in the rumen of cows fed different forages. FEMS microbiology ecology 74: 378 612-622. 379 Lima, L., Palin, M., Santos, G., Benchaar, C., and Petit, H. (2016) Dietary flax meal and abomasal 380 infusion of flax oil on microbial β-glucuronidase activity and concentration of enterolactone in 381 ruminal fluid, plasma, urine and milk of dairy cows. Animal Feed Science and Technology 215: 85-382 91. 383 Matumoto-Pintro, P.T., Petit, H.V., Giroux, H.J., Côrtes, C., Gagnon, N., and Britten, M. (2011) 384 Effect of flaxseed lignans added to milk or fed to cows on oxidative degradation of dairy beverages 385 enriched with polyunsaturated fatty acids. Journal of dairy research 78: 111-117. 386 Nunomura, A., Castellani, R.J., Zhu, X., Moreira, P.I., Perry, G., and Smith, M.A. (2006) 387 Involvement of oxidative stress in Alzheimer disease. Journal of Neuropathology & Experimental 388 Neurology 65: 631-641. 389 Petit, H., and Gagnon, N. (2009a) Milk concentrations of the mammalian lignans enterolactone and 390 enterodiol, milk production, and whole tract digestibility of dairy cows fed diets containing different 391 concentrations of flaxseed meal. Animal feed science and technology 152: 103-111. 392 Petit, H., and Gagnon, N. (2009b) Concentration of the mammalian lignans enterolactone and 393 enterodiol in milk of cows fed diets containing different concentrations of whole flaxseed. Animal 3: 394 1428-1435. 395 Petit, H.V., Gagnon, N., Mir, P.S., Cao, R., and Cui, S. (2009) Milk concentration of the mammalian 396 lignan enterolactone, milk production, milk fatty acid profile, and digestibility in dairy cows fed diets 397 containing whole flaxseed or flaxseed meal. Journal of dairy research 76: 257-264. 398 Puniya, A.K., Singh, R., and Kamra, D.N. (2015) Rumen microbiology: from evolution to revolution: 399 Springer. 400 Purushe, J., Fouts, D.E., Morrison, M., White, B.A., Mackie, R.I., Coutinho, P.M. et al. (2010) 401 Comparative genome analysis of Prevotella ruminicola and Prevotella bryantii: insights into their 402 environmental niche. Microbial ecology 60: 721-729. 403 Qi, M., Wang, P., O'Toole, N., Barboza, P.S., Ungerfeld, E., Leigh, M.B. et al. (2011) Snapshot of the 404 eukaryotic gene expression in muskoxen rumen—a metatranscriptomic approach. PloS one 6: e20521. 405 Schmieder, R., and Edwards, R. (2011) Quality control and preprocessing of metagenomic datasets. 406 Bioinformatics 27: 863-864. 407 Schogor, A.L., Huws, S.A., Santos, G.T., Scollan, N.D., Hauck, B.D., Winters, A.L. et al. (2014) 408 Ruminal Prevotella spp. may play an important role in the conversion of plant lignans into human 409 health beneficial antioxidants. PloS one 9: e87949. 410 Shabat, S.K.B., Sasson, G., Doron-Faigenboim, A., Durman, T., Yaacoby, S., Miller, M.E.B. et al. 411 (2016) Specific microbiome-dependent mechanisms underlie the energy harvest efficiency of 412 ruminants. The ISME journal 10: 2958. 413 Simon, C., and Daniel, R. (2011) Metagenomic analyses: past and future trends. Applied and 414 environmental microbiology 77: 1153-1161. 415 Stevenson, D.M., and Weimer, P.J. (2007) Dominance of Prevotella and low abundance of classical 416 ruminal bacterial species in the bovine rumen revealed by relative quantification real-time PCR. 417 Applied microbiology and biotechnology 75: 165-174. 418 Stiverson, J., Morrison, M., and Yu, Z. (2011) Populations of select cultured and uncultured bacteria 419 in the rumen of sheep and the effect of diets and ruminal fractions. International journal of 420 microbiology 2011. 421
98
Theodorou, M.K., Williams, B.A., Dhanoa, M.S., McAllan, A.B., and France, J. (1994) A simple gas 422 production method using a pressure transducer to determine the fermentation kinetics of ruminant 423 feeds. Animal feed science and technology 48: 185-197. 424 Trapnell, C., Pachter, L., and Salzberg, S.L. (2009) TopHat: discovering splice junctions with RNA-425 Seq. Bioinformatics 25: 1105-1111. 426 Vincent, A.M., Russell, J.W., Low, P., and Feldman, E.L. (2004) Oxidative stress in the pathogenesis 427 of diabetic neuropathy. Endocrine reviews 25: 612-628. 428 Wang, P., Qi, M., Barboza, P., Leigh, M.B., Ungerfeld, E., Selinger, L.B. et al. (2011) Isolation of 429 high-quality total RNA from rumen anaerobic bacteria and fungi, and subsequent detection of 430 glycoside hydrolases. Canadian journal of microbiology 57: 590-598. 431 Wood-Kaczmar, A., Gandhi, S., and Wood, N. (2006) Understanding the molecular causes of 432 Parkinson's disease. Trends in molecular medicine 12: 521-528. 433 Zhou, W., Wang, G., Han, Z., Yao, W., and Zhu, W. (2009) Metabolism of flaxseed lignans in the 434 rumen and its impact on ruminal metabolism and flora. Animal feed science and technology 150: 18-435 26. 436
437
438
439
440
441
442
443
444
445
446
447
448
449
450
451
452
453
454
455
456
457
458
459

99
V. CONCLUSIONS
Flaxseed lignans are powerful antioxidants and their metabolism must be fully
comprehended. As the rumen is an efficient environment for SDG conversion into
enterolignans it need to be explored for the prospection of genes and enzymes linked to
lignans metabolism. Nevertheless, as most of the microorganisms in the rumen cannot be
cultured in laboratory conditions, metagenomic approaches must be used to assess genomic
information associated with SDG breakdown.
A fosmid library, using Escherichia coli as bacterial host and DNA inserts from the
rumen microbiome was successfully constructed, duplicated and screened for SDG
breakdown activity. Positive clones for SDG breakdown did not present genes directly linked
to SDG metabolism, showing that a fosmid library may not be an efficient method to recover
those genes from the rumen microbiome.
Metatranscriptomic data obtained from serial incubations of rumen fluid and SDG,
followed by RNA extraction was efficiently generated. Overrepresented sequences were
identified as possible high biological significance and further studies must be carried out to
list the differentially expressed genes and identify genes and enzymes with active role on
SDG breakdown.

100
VI. APPENDICES
Figure VI.1. Secoisolariciresinol diglucoside (SDG) standard spectrum. Sample concentration 1 mg/ml;
Retention time 9.3 minutes; PDA 280.0 nm; Gradient 5-70%MeOH in 15 minutes; Injection Volume 50.00 µL.

101
Figure VI.2 Secoisolariciresinol diglucoside (SDG) standard curve for HPLC detection and quantification.
Curve concentrations and dilutions (mg/ml): 1 (1:10); 0.5 (1:20); 0.25 (1:40); 0.125 (1:80); 0.0625 (1:160);
0.03125 (1:320); 0.015625 (1:640); 0.007813 (1:1280); and 0.003906 (1:2560).
Figure VI.3 Secoisolariciresinol (SECO) standard spectrum. Sample concentration 0.5 mg/ml; Retention time
9.3 minutes; PDA 280.0 nm; Gradient 5-70%MeOH in 15 minutes; Injection Volume 50.00 µL.

102
Figure VI.4 Secoisolariciresinol (SECO) standard curve for HPLC detection and quantification. Curve
concentrations and dilutions (mg/ml): 0.5 (1:20); 0.125 (1:80); 0.03125 (1:320); and 0.007813 (1:1280).
Figure VI.5. Enterodiol (ED) standard spectrum. Sample concentration 0.5 mg/ml; Retention time 12.9 minutes;
PDA 280.0 nm; Gradient 5-70%MeOH in 15 minutes; Injection Volume 50.00 µL.

103
Figure VI.6 Enterodiol (ED) standard curve for HPLC detection and quantification. Curve concentrations and
dilutions (mg/ml): 0.5 (1:20); 0.125 (1:80); 0.03125 (1:320); and 0.007813 (1:1280).
Figure VI.7. Enterolactone (EL) standard spectrum. Sample concentration 0.5 mg/ml; Retention time 13.2
minutes; PDA 280.0 nm; Gradient 5-70%MeOH in 15 minutes; Injection Volume 50.00 µL.

104
Figure VI.8 Enterolactone (EL) standard curve for HPLC detection and quantification. Curve concentrations and
dilutions (mg/ml): 0.5 (1:20); 0.125 (1:80); 0.03125 (1:320); and 0.007813 (1:1280).
Figure VI.9. Sample of fosmid clone spiked with SECO (retention time 11.3), ED (retention time 13.0) and EL
(retention time 13.3). PDA 280.0 nm; Gradient 5-70%MeOH in 15 minutes; Injection Volume 50.00 µL.