Risk perception in the use of personal protective ... · prevention of hearing loss. Personal...
21
Gest. Prod., São Carlos, v. 26, n. 1, e1611, 2019 https://doi.org/10.1590/0104-530X1611-19 ISSN 0104-530X (Print) ISSN 1806-9649 (Online) Original Article 1/21 Resumo: Embora existam muitas abordagens sobre a exposição ocupacional ao ruído, a análise da percepção individual do trabalhador e suas implicações sobre o seu comportamento constituem ainda um tema raramente abordado. Objetivando colaborar em minimizar esta lacuna, fez-se um levantamento do estado da arte das publicações que relacionam às variáveis que estariam associadas à exposição ao risco físico ruído no meio laboral com o uso do equipamento de proteção auditivo. Após, utilizou-se uma amostra de 278 trabalhadores industriais expostos a níveis de pressões sonoras superiores a 80 dB (A) para examinar a relação entre a percepção do ruído ocupacional e o uso do equipamento individual auditivo. A aplicação da técnica de análise fatorial a esses dados permitiu ainda quantificar efeitos diretos e indiretos de um conjunto de fatores sobre o uso do equipamento. Concluiu-se que a percepção da exposição ao risco do ruído pelos trabalhadores é um importante preditor sobre a decisão de uso do equipamento de proteção auditiva. Palavras-chave: Percepção; Ruído; Exposição; Proteção auditiva; Risco; Perdas auditivas. Abstract: Although there are many approaches to occupational noise exposure, the analysis of individual perception of the worker and its implications on behavior is still a topic that is rarely addressed. A state-of-the-art survey of publications that relate the variables associated with exposure to physical risk of noise in the workplace with the use of hearing protection equipment is presented reducing this gap. After that, a sample of 278 industrial workers exposed to sound pressure levels above 80 dB (A) was collected to examine the relationship between the perception of occupational noise and the use of personal hearing equipment. By a statistical analysis of the identified variables, the direct and indirect effects of a set of factors affecting the use of the equipment were analyzed. Thus, the perception of noise exposure risk by workers is an important predictor of the use of hearing protection equipment. Keywords: Perception; Noise; Exposure; Hearing protection; Risk; Hearing loss. How to cite: Tinoco, H. C., Lima, G. B. A., Sant’Anna, A. P., Gomes, C. F. S., Santos, J. A. N. (2019). Risk perception in the use of personal protective equipment against noise-induced hearing loss. Gestão & Produção, 26(1), e1611. https://doi.org/10.1590/0104-530X1611-19 Risk perception in the use of personal protective equipment against noise-induced hearing loss Percepção de risco no uso do equipamento de proteção individual contra a perda auditiva induzida por ruído Helder Cesar Tinoco 1 Gilson Brito Alves Lima 2 Annibal Parracho Sant’Anna 2 Carlos Francisco Simões Gomes 2 João Alberto Neves dos Santos 2 1 Instituto Federal de Educação, Ciência e Tecnologia do Rio de Janeiro – IFRJ, Rua Dr. José Augusto Pereira dos Santos, s/n, Neves, CEP 24425-005, São Gonçalo, RJ, Brasil, e-mail: [email protected] 2 Universidade Federal Fluminense – UFF, Rua Passo da Pátria, 156, Campus da Praia Vermelha, São Domingos, CEP 24210-240, Niterói, RJ, Brasil, e-mail: [email protected]ff.br; [email protected]; [email protected]; [email protected] Received July 23, 2017 - Accepted Apr. 29, 2018 Financial support: None 1 Introduction Hazards in the workplace are related to any type of potentially harmful source, causing injuries, wounds or damage to health, or a combination of these results (Badaró et al., 2011). Rodrigues et al. (2012) observed that, in the industrial segment, a number of risk factors for worker health can be found, such as noise, lighting, temperature, humidity, air purity and velocity, radiation, and physical exertion, among others. Excessive sound pressure levels are considered one of the most common workplace hazards, according
Transcript of Risk perception in the use of personal protective ... · prevention of hearing loss. Personal...

Gest. Prod., São Carlos, v. 26, n. 1, e1611, 2019https://doi.org/10.1590/0104-530X1611-19
ISSN 0104-530X (Print)ISSN 1806-9649 (Online)
Original Article
1/21
Resumo: Embora existam muitas abordagens sobre a exposição ocupacional ao ruído, a análise da percepção individual do trabalhador e suas implicações sobre o seu comportamento constituem ainda um tema raramente abordado. Objetivando colaborar em minimizar esta lacuna, fez-se um levantamento do estado da arte das publicações que relacionam às variáveis que estariam associadas à exposição ao risco físico ruído no meio laboral com o uso do equipamento de proteção auditivo. Após, utilizou-se uma amostra de 278 trabalhadores industriais expostos a níveis de pressões sonoras superiores a 80 dB (A) para examinar a relação entre a percepção do ruído ocupacional e o uso do equipamento individual auditivo. A aplicação da técnica de análise fatorial a esses dados permitiu ainda quantificar efeitos diretos e indiretos de um conjunto de fatores sobre o uso do equipamento. Concluiu-se que a percepção da exposição ao risco do ruído pelos trabalhadores é um importante preditor sobre a decisão de uso do equipamento de proteção auditiva.Palavras-chave: Percepção; Ruído; Exposição; Proteção auditiva; Risco; Perdas auditivas.
Abstract: Although there are many approaches to occupational noise exposure, the analysis of individual perception of the worker and its implications on behavior is still a topic that is rarely addressed. A state-of-the-art survey of publications that relate the variables associated with exposure to physical risk of noise in the workplace with the use of hearing protection equipment is presented reducing this gap. After that, a sample of 278 industrial workers exposed to sound pressure levels above 80 dB (A) was collected to examine the relationship between the perception of occupational noise and the use of personal hearing equipment. By a statistical analysis of the identified variables, the direct and indirect effects of a set of factors affecting the use of the equipment were analyzed. Thus, the perception of noise exposure risk by workers is an important predictor of the use of hearing protection equipment.Keywords: Perception; Noise; Exposure; Hearing protection; Risk; Hearing loss.
How to cite: Tinoco, H. C., Lima, G. B. A., Sant’Anna, A. P., Gomes, C. F. S., Santos, J. A. N. (2019). Risk perception in the use of personal protective equipment against noise-induced hearing loss. Gestão & Produção, 26(1), e1611. https://doi.org/10.1590/0104-530X1611-19
Risk perception in the use of personal protective equipment against noise-induced hearing loss
Percepção de risco no uso do equipamento de proteção individual contra a perda auditiva induzida por ruído
Helder Cesar Tinoco1 Gilson Brito Alves Lima2
Annibal Parracho Sant’Anna2 Carlos Francisco Simões Gomes2 João Alberto Neves dos Santos2
1 Instituto Federal de Educação, Ciência e Tecnologia do Rio de Janeiro – IFRJ, Rua Dr. José Augusto Pereira dos Santos, s/n, Neves, CEP 24425-005, São Gonçalo, RJ, Brasil, e-mail: [email protected]
2 Universidade Federal Fluminense – UFF, Rua Passo da Pátria, 156, Campus da Praia Vermelha, São Domingos, CEP 24210-240, Niterói, RJ, Brasil, e-mail: [email protected]; [email protected]; [email protected]; [email protected]
Received July 23, 2017 - Accepted Apr. 29, 2018Financial support: None
1 IntroductionHazards in the workplace are related to any type of
potentially harmful source, causing injuries, wounds or damage to health, or a combination of these results (Badaró et al., 2011). Rodrigues et al. (2012) observed that, in the industrial segment, a number of
risk factors for worker health can be found, such as noise, lighting, temperature, humidity, air purity and velocity, radiation, and physical exertion, among others. Excessive sound pressure levels are considered one of the most common workplace hazards, according
2/21
Tinoco, H. C. et al. Gest. Prod., São Carlos, v. 26, n. 1, e1611, 2019
to the World Health Organization (WHO, 2002), with approximately 16% of worldwide hearing loss events bring attributable to occupational noise exposure.
NIOSH (2013) highlights that, in the United States alone, approximately 30 million workers are exposed every day to high levels of sound pressure, with the potential for health damage. Penney & Earl (2004) report that hearing loss induced by high sound pressure levels is the second most common cause of occupational disease among American workers, where noise exposure is the second most important cause of sensorineural hearing loss after presbycusis.
According to Arezes (2002), the study of the relationship between work and health implies a correct identification of occupational factors, as well as their positive or negative repercussions on workers. To this end, it is indispensable to conduct practical studies focusing on real work contexts, identifying in them the main conditions of occupational risk. This author also emphasizes that noise is an occupational risk factor that is practically always present in industrial environments, where the use of personal protective equipment is the main protection tool used in the prevention of hearing loss. Personal protective equipment (PPE) can be characterized as any device intended for personal use by workers, aiming solely at the protection of risks that may threaten safety and health at work (Costa & Sepúlvida, 2013). In light of that, more and more studies are seeking to relate motivation with the use of PPE.
Models have been developed relating the use of PPE to motivation. Lusk et al. (2006) describe a model called “Health Promotion Model,” which analyzes modifying factors (behavioral characteristics) and cognitive-perceptual factors (perceived benefits and perceived self-efficacy). The same authors indicate that the models developed allow us to infer that workers should always be aware of the risk of noise-induced hearing loss in the workplace, with the awareness that they can actually do something to prevent the development of this occupational disease.
Although there are publications on occupational exposure to noise, the analysis of workers’ individual perception and the implications on their behavior is still an issue that is rarely addressed. The approaches that relate the understanding of the behavioral phenomenon associated with exposure to the physical risk of noise in the workplace appear to require support from other assessments, particularly quantitative approaches that relate workers’ hearing losses to their habits regarding the use of the hearing protectors (Arezes, 2002).
Risk analysis can be carried out using qualitative or quantitative tools or using mixed methods (Scherer & Ribeiro, 2013). This article aims to analyze the
individual perception of workers and their implications associated with the use of auditory PPE, developing a statistical analysis of the variables identified, quantifying results, and analyzing the effects of the factors involved.
The research carried out for the development of this article is based on the premise of discussing two specific contextual proposals: (i) a state-of-the-art survey in the publications that relate the variables that would be related to exposure to physical risk of noise in the work environment with the use of hearing protection equipment; (ii) a statistical analysis of the variables identified, aiming to quantify factors involved in the use of protective equipment and the development of hearing loss.
This article is divided into five parts: in the first – Introduction – a contextualization of the current situation is made, in order to justify the proposed problem; the second part consists of the Theoretical Contextualization, showing the main studies on the subject; the third part presents the Methodological Approach to the Research; the fourth part presents the results of the analyses; and the fifth and final part presents the final conclusions, verifying the fulfillment of the objectives of the study and the respective research questions in the light of the results obtained and suggestions for the development of future work.
2 Theoretical contextualizationBased on the Health Promotion Model, developed
by Pender (1982), authors such as Jormsri et al. (2009), Salavessa & Uva (2007) and Arezes (2002) developed the research area on the use of personal protective equipment and the incidence of hearing loss. Jormsri et al. (2009) proposed the model presented in Figure 1, which allow an examination of factors that induce the use of personal protective equipment. Their study identified three types of factors that influence the use of hearing protection:
a) Intrapersonal, including prevention of hearing loss, annoyance by noise, personal discomfort, and interference with communication;
b) Interpersonal, including in the model the relationship with co-workers, support staff, and supervisors; and
c) Organizational, including rules of the organization and regulations, provision of hearing protection devices, dissemination of knowledge and information, noise monitoring, and hearing tests.
3/21
Risk perception in the use of personal... Gest. Prod., São Carlos, v. 26, n. 1, e1611, 2019
systemic model presents the main factors considered to be of greater relevance for its use.
This model is based on the assumption that the use of PPE always depends on the worker’s individual decision, emphasizing the importance of the human factor in preventing occupational risks. The worker’s individual peculiarities, beliefs, attitudes, skills, experiences and prior knowledge become key parts in accepting the use of personal protective equipment.
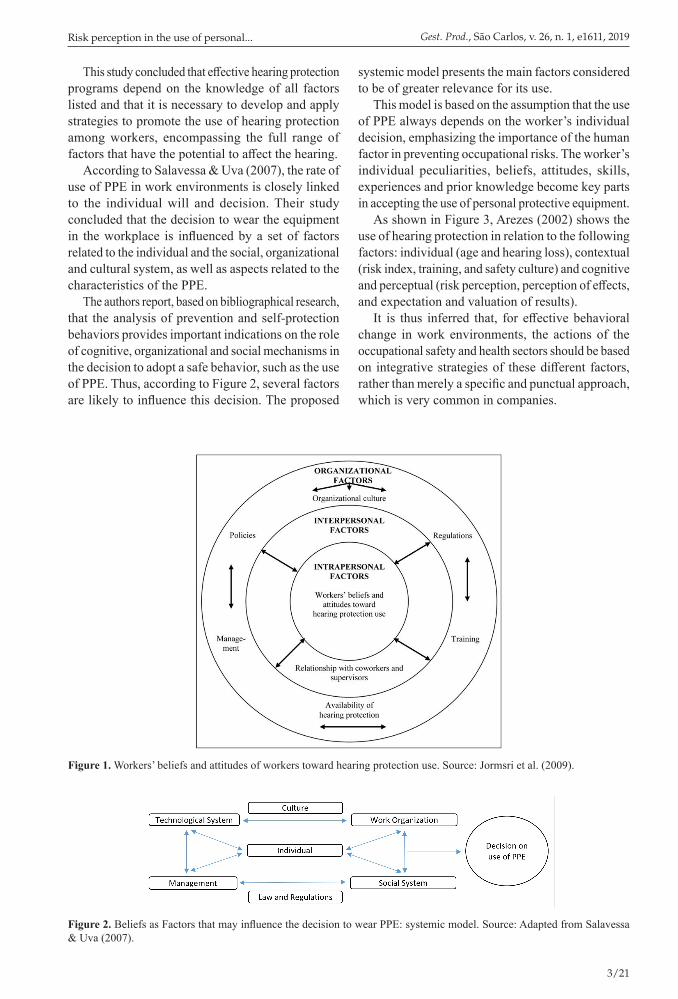
As shown in Figure 3, Arezes (2002) shows the use of hearing protection in relation to the following factors: individual (age and hearing loss), contextual (risk index, training, and safety culture) and cognitive and perceptual (risk perception, perception of effects, and expectation and valuation of results).
It is thus inferred that, for effective behavioral change in work environments, the actions of the occupational safety and health sectors should be based on integrative strategies of these different factors, rather than merely a specific and punctual approach, which is very common in companies.
This study concluded that effective hearing protection programs depend on the knowledge of all factors listed and that it is necessary to develop and apply strategies to promote the use of hearing protection among workers, encompassing the full range of factors that have the potential to affect the hearing.
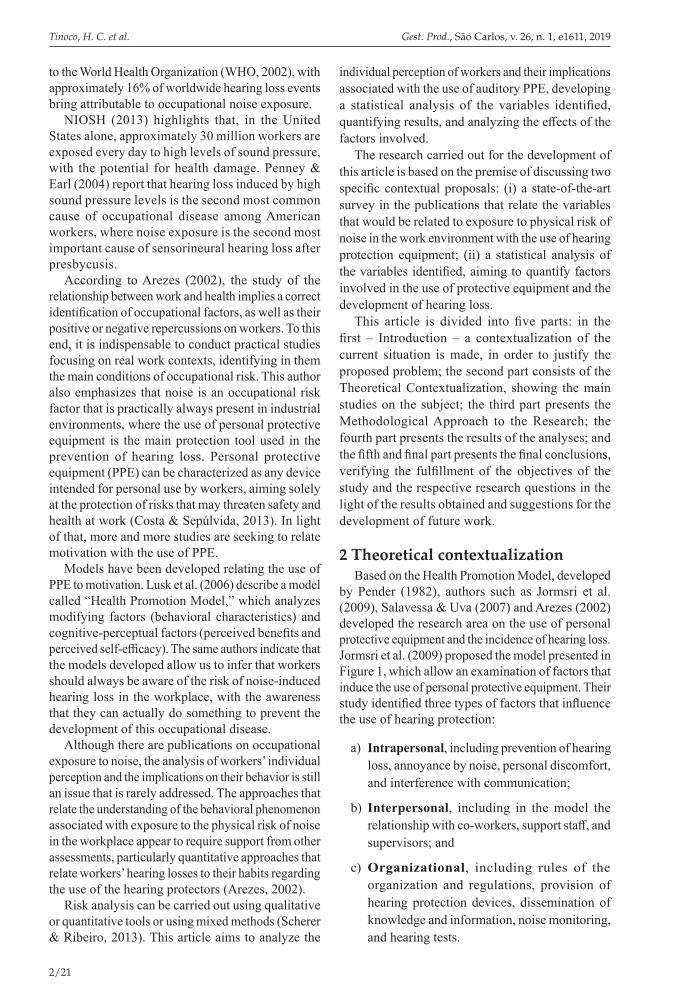
According to Salavessa & Uva (2007), the rate of use of PPE in work environments is closely linked to the individual will and decision. Their study concluded that the decision to wear the equipment in the workplace is influenced by a set of factors related to the individual and the social, organizational and cultural system, as well as aspects related to the characteristics of the PPE.
The authors report, based on bibliographical research, that the analysis of prevention and self-protection behaviors provides important indications on the role of cognitive, organizational and social mechanisms in the decision to adopt a safe behavior, such as the use of PPE. Thus, according to Figure 2, several factors are likely to influence this decision. The proposed
Figure 1. Workers’ beliefs and attitudes of workers toward hearing protection use. Source: Jormsri et al. (2009).
Figure 2. Beliefs as Factors that may influence the decision to wear PPE: systemic model. Source: Adapted from Salavessa & Uva (2007).
4/21
Tinoco, H. C. et al. Gest. Prod., São Carlos, v. 26, n. 1, e1611, 2019
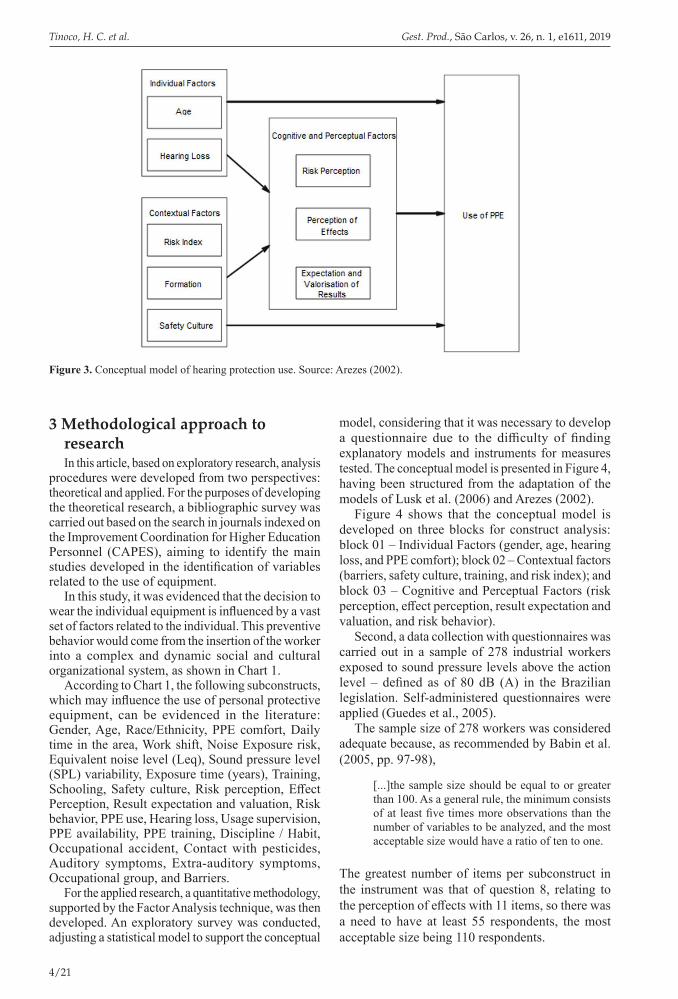
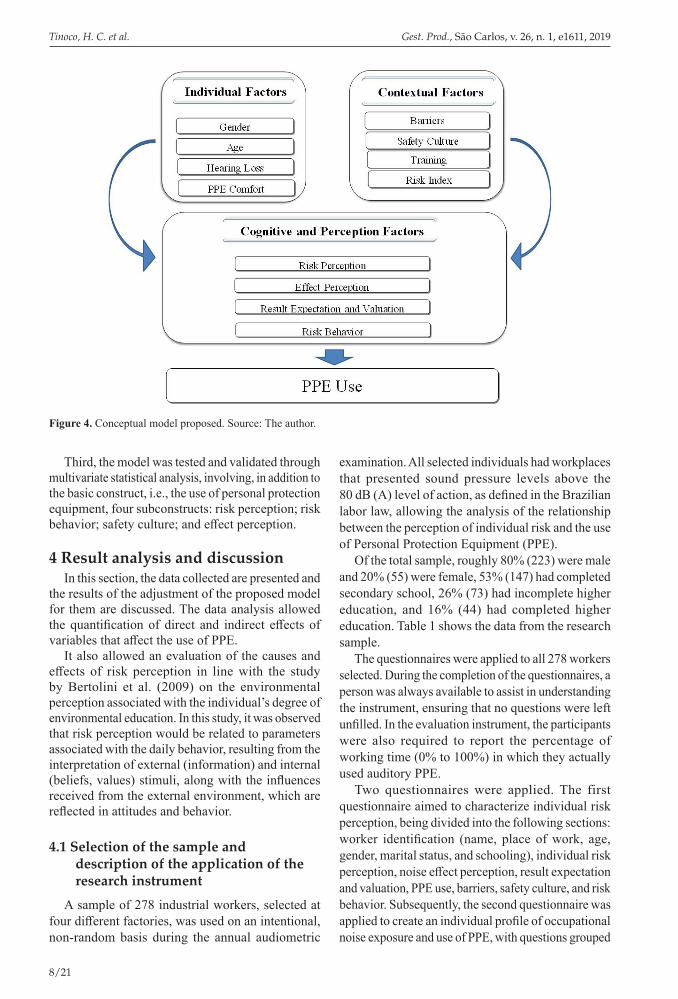
model, considering that it was necessary to develop a questionnaire due to the difficulty of finding explanatory models and instruments for measures tested. The conceptual model is presented in Figure 4, having been structured from the adaptation of the models of Lusk et al. (2006) and Arezes (2002).
Figure 4 shows that the conceptual model is developed on three blocks for construct analysis: block 01 – Individual Factors (gender, age, hearing loss, and PPE comfort); block 02 – Contextual factors (barriers, safety culture, training, and risk index); and block 03 – Cognitive and Perceptual Factors (risk perception, effect perception, result expectation and valuation, and risk behavior).
Second, a data collection with questionnaires was carried out in a sample of 278 industrial workers exposed to sound pressure levels above the action level – defined as of 80 dB (A) in the Brazilian legislation. Self-administered questionnaires were applied (Guedes et al., 2005).
The sample size of 278 workers was considered adequate because, as recommended by Babin et al. (2005, pp. 97-98),
[...]the sample size should be equal to or greater than 100. As a general rule, the minimum consists of at least five times more observations than the number of variables to be analyzed, and the most acceptable size would have a ratio of ten to one.
The greatest number of items per subconstruct in the instrument was that of question 8, relating to the perception of effects with 11 items, so there was a need to have at least 55 respondents, the most acceptable size being 110 respondents.
3 Methodological approach to researchIn this article, based on exploratory research, analysis
procedures were developed from two perspectives: theoretical and applied. For the purposes of developing the theoretical research, a bibliographic survey was carried out based on the search in journals indexed on the Improvement Coordination for Higher Education Personnel (CAPES), aiming to identify the main studies developed in the identification of variables related to the use of equipment.
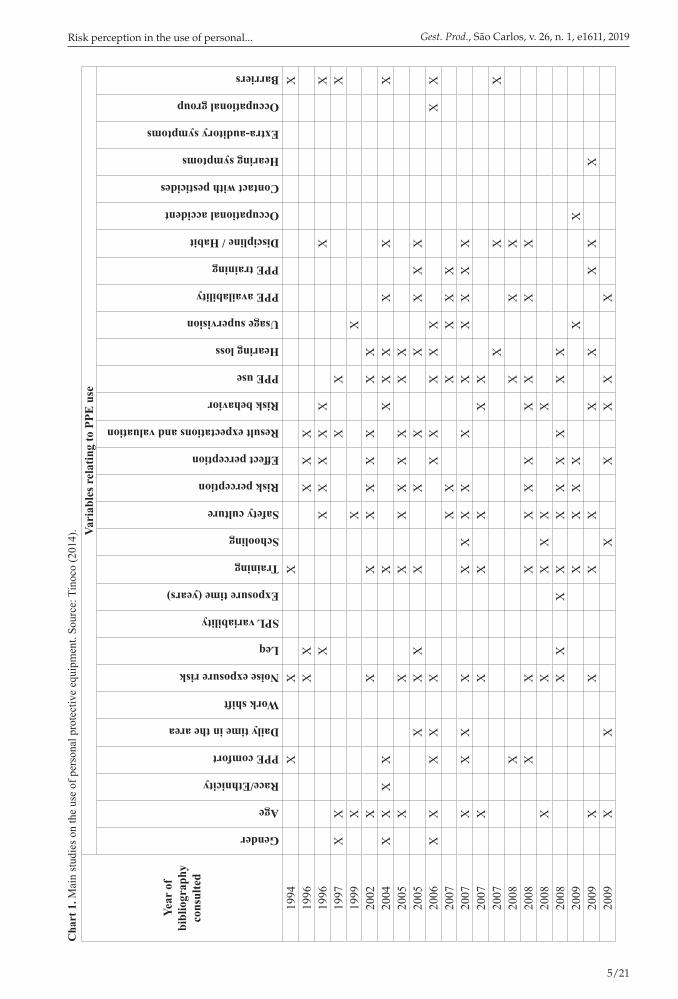
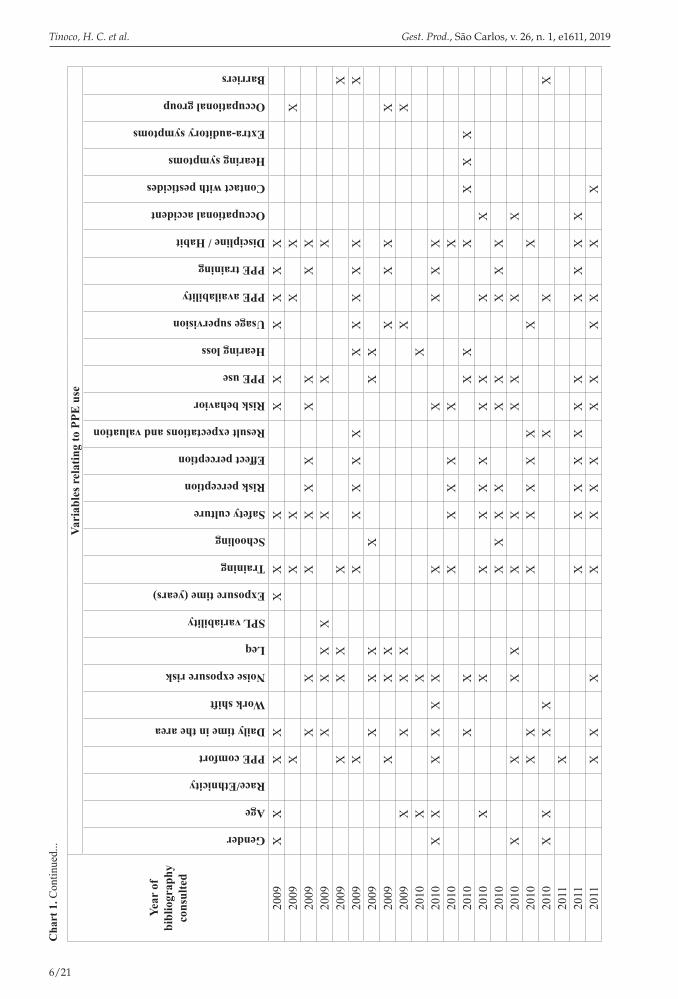
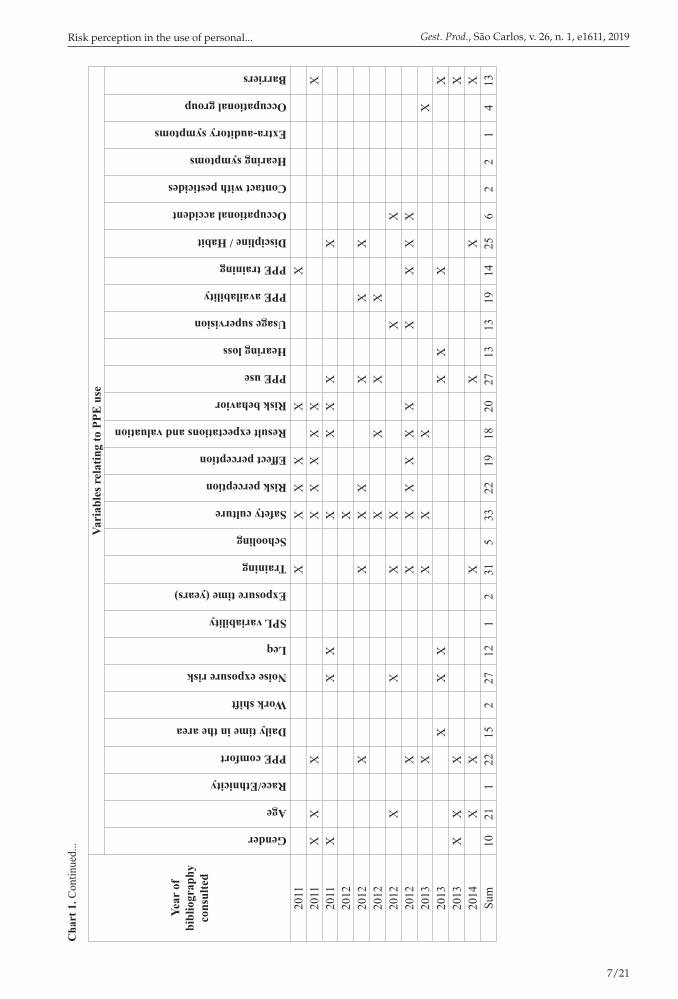
In this study, it was evidenced that the decision to wear the individual equipment is influenced by a vast set of factors related to the individual. This preventive behavior would come from the insertion of the worker into a complex and dynamic social and cultural organizational system, as shown in Chart 1.
According to Chart 1, the following subconstructs, which may influence the use of personal protective equipment, can be evidenced in the literature: Gender, Age, Race/Ethnicity, PPE comfort, Daily time in the area, Work shift, Noise Exposure risk, Equivalent noise level (Leq), Sound pressure level (SPL) variability, Exposure time (years), Training, Schooling, Safety culture, Risk perception, Effect Perception, Result expectation and valuation, Risk behavior, PPE use, Hearing loss, Usage supervision, PPE availability, PPE training, Discipline / Habit, Occupational accident, Contact with pesticides, Auditory symptoms, Extra-auditory symptoms, Occupational group, and Barriers.
For the applied research, a quantitative methodology, supported by the Factor Analysis technique, was then developed. An exploratory survey was conducted, adjusting a statistical model to support the conceptual
Figure 3. Conceptual model of hearing protection use. Source: Arezes (2002).
5/21
Risk perception in the use of personal... Gest. Prod., São Carlos, v. 26, n. 1, e1611, 2019
Cha
rt 1
. Mai
n st
udie
s on
the
use
of p
erso
nal p
rote
ctiv
e eq
uipm
ent.
Sour
ce: T
inoc
o (2
014)
.
Year
of
bibl
iogr
aphy
co
nsul
ted
Vari
able
s rel
atin
g to
PPE
use
Gender
Age
Race/Ethnicity
PPE comfort
Daily time in the area
Work shift
Noise exposure risk
Leq
SPL variability
Exposure time (years)
Training
Schooling
Safety culture
Risk perception
Effect perception
Result expectations and valuation
Risk behavior
PPE use
Hearing loss
Usage supervision
PPE availability
PPE training
Discipline / Habit
Occupational accident
Contact with pesticides
Hearing symptoms
Extra-auditory symptoms
Occupational group
Barriers
1994
X
X
X
X19
96
X
X
XX
X
1996
X
XX
XX
X
X
X19
97X
X
X
X
X
1999
X
X
X
20
02
X
X
X
X
XX
X
XX
2004
XX
XX
X
XX
X
X
X
X20
05
X
X
X
X
XX
X
XX
2005
X
XX
X
X
X
X
XX
X
20
06X
X
XX
X
X
X
XX
X
XX
2007
XX
X
X
XX
20
07
X
XX
X
X
XX
X
X
X
XX
XX
2007
X
X
X
X
XX
20
07
X
X
X
2008
X
X
X
X
20
08
X
X
X
X
XX
X
X
X
X
2008
X
X
XX
X
X
20
08
X
X
XX
X
XX
X
XX
2009
X
XX
X
X
X
20
09
X
X
X
X
X
X
XX
X
2009
X
X
X
X
XX
X
6/21
Tinoco, H. C. et al. Gest. Prod., São Carlos, v. 26, n. 1, e1611, 2019
Year
of
bibl
iogr
aphy
co
nsul
ted
Vari
able
s rel
atin
g to
PPE
use
Gender
Age
Race/Ethnicity
PPE comfort
Daily time in the area
Work shift
Noise exposure risk
Leq
SPL variability
Exposure time (years)
Training
Schooling
Safety culture
Risk perception
Effect perception
Result expectations and valuation
Risk behavior
PPE use
Hearing loss
Usage supervision
PPE availability
PPE training
Discipline / Habit
Occupational accident
Contact with pesticides
Hearing symptoms
Extra-auditory symptoms
Occupational group
Barriers
2009
XX
X
X
X
X
X
XX
X
XX
X
20
09
X
X
X
X
X
X
2009
X
X
X
XX
X
XX
X
X
20
09
X
X
XX
X
X
X
2009
X
XX
X
X20
09
X
X
X
XX
X
X
XX
XX
X
2009
X
XX
X
X
X
20
09
X
X
X
X
XX
X
2009
X
X
XX
X
X
20
10
X
X
X
2010
XX
X
XX
X
X
X
XX
X
20
10
X
X
XX
X
X
2010
X
X
X
X
X
XX
X
20
10
X
X
X
X
XX
X
X
X
X
2010
XX
XX
XX
XX
X
20
10X
X
X
X
X
X
X
X
X
X
2010
X
X
X
XX
XX
X
X
20
10X
X
X
X
X
X
X
2011
X
20
11
X
X
XX
XX
X
X
XX
X
2011
X
X
X
X
XX
X
XX
X
X
X
X
Cha
rt 1
. Con
tinue
d...
7/21
Risk perception in the use of personal... Gest. Prod., São Carlos, v. 26, n. 1, e1611, 2019
Year
of
bibl
iogr
aphy
co
nsul
ted
Vari
able
s rel
atin
g to
PPE
use
Gender
Age
Race/Ethnicity
PPE comfort
Daily time in the area
Work shift
Noise exposure risk
Leq
SPL variability
Exposure time (years)
Training
Schooling
Safety culture
Risk perception
Effect perception
Result expectations and valuation
Risk behavior
PPE use
Hearing loss
Usage supervision
PPE availability
PPE training
Discipline / Habit
Occupational accident
Contact with pesticides
Hearing symptoms
Extra-auditory symptoms
Occupational group
Barriers
2011
X
XX
X
X
X
20
11X
X
X
X
XX
XX
X
2011
X
XX
X
X
XX
X
20
12
X
2012
X
X
XX
X
X
X
20
12
X
X
X
X
2012
X
X
X
X
X
X
20
12
X
X
X
XX
XX
X
XX
X
2013
X
X
X
X
X
20
13
X
X
X
XX
X
X
2013
XX
X
X20
14
X
X
X
X
X
X
Sum
1021
122
152
2712
12
315
3322
1918
2027
1313
1914
256
22
14
13
Cha
rt 1
. Con
tinue
d...
8/21
Tinoco, H. C. et al. Gest. Prod., São Carlos, v. 26, n. 1, e1611, 2019
examination. All selected individuals had workplaces that presented sound pressure levels above the 80 dB (A) level of action, as defined in the Brazilian labor law, allowing the analysis of the relationship between the perception of individual risk and the use of Personal Protection Equipment (PPE).
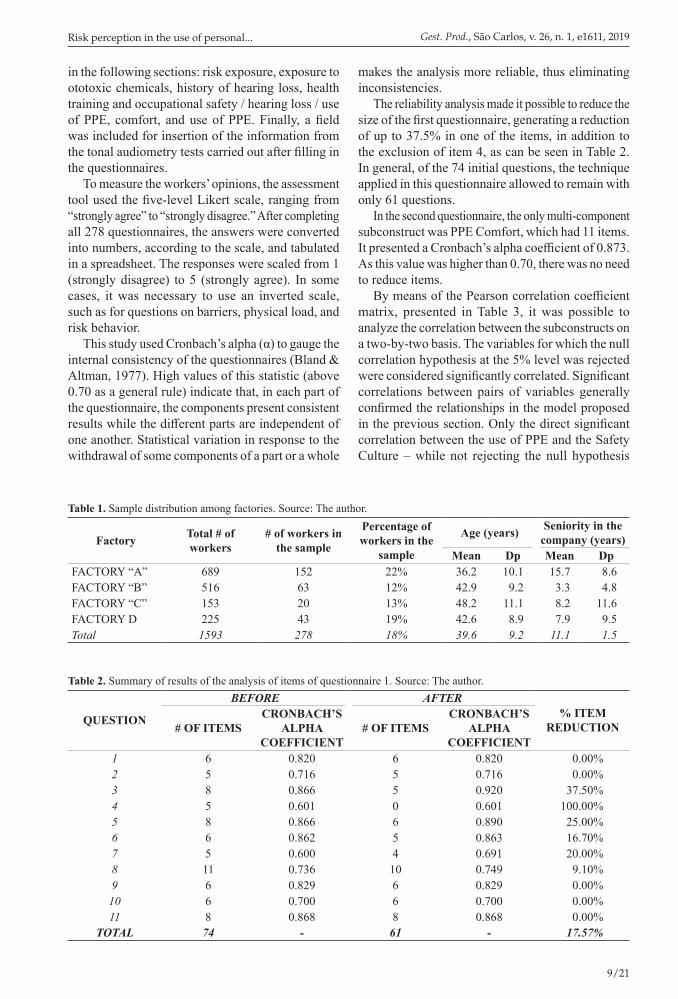
Of the total sample, roughly 80% (223) were male and 20% (55) were female, 53% (147) had completed secondary school, 26% (73) had incomplete higher education, and 16% (44) had completed higher education. Table 1 shows the data from the research sample.
The questionnaires were applied to all 278 workers selected. During the completion of the questionnaires, a person was always available to assist in understanding the instrument, ensuring that no questions were left unfilled. In the evaluation instrument, the participants were also required to report the percentage of working time (0% to 100%) in which they actually used auditory PPE.
Two questionnaires were applied. The first questionnaire aimed to characterize individual risk perception, being divided into the following sections: worker identification (name, place of work, age, gender, marital status, and schooling), individual risk perception, noise effect perception, result expectation and valuation, PPE use, barriers, safety culture, and risk behavior. Subsequently, the second questionnaire was applied to create an individual profile of occupational noise exposure and use of PPE, with questions grouped
Third, the model was tested and validated through multivariate statistical analysis, involving, in addition to the basic construct, i.e., the use of personal protection equipment, four subconstructs: risk perception; risk behavior; safety culture; and effect perception.
4 Result analysis and discussionIn this section, the data collected are presented and
the results of the adjustment of the proposed model for them are discussed. The data analysis allowed the quantification of direct and indirect effects of variables that affect the use of PPE.
It also allowed an evaluation of the causes and effects of risk perception in line with the study by Bertolini et al. (2009) on the environmental perception associated with the individual’s degree of environmental education. In this study, it was observed that risk perception would be related to parameters associated with the daily behavior, resulting from the interpretation of external (information) and internal (beliefs, values) stimuli, along with the influences received from the external environment, which are reflected in attitudes and behavior.
4.1 Selection of the sample and description of the application of the research instrument
A sample of 278 industrial workers, selected at four different factories, was used on an intentional, non-random basis during the annual audiometric
Figure 4. Conceptual model proposed. Source: The author.
9/21
Risk perception in the use of personal... Gest. Prod., São Carlos, v. 26, n. 1, e1611, 2019
makes the analysis more reliable, thus eliminating inconsistencies.
The reliability analysis made it possible to reduce the size of the first questionnaire, generating a reduction of up to 37.5% in one of the items, in addition to the exclusion of item 4, as can be seen in Table 2. In general, of the 74 initial questions, the technique applied in this questionnaire allowed to remain with only 61 questions.
In the second questionnaire, the only multi-component subconstruct was PPE Comfort, which had 11 items. It presented a Cronbach’s alpha coefficient of 0.873. As this value was higher than 0.70, there was no need to reduce items.
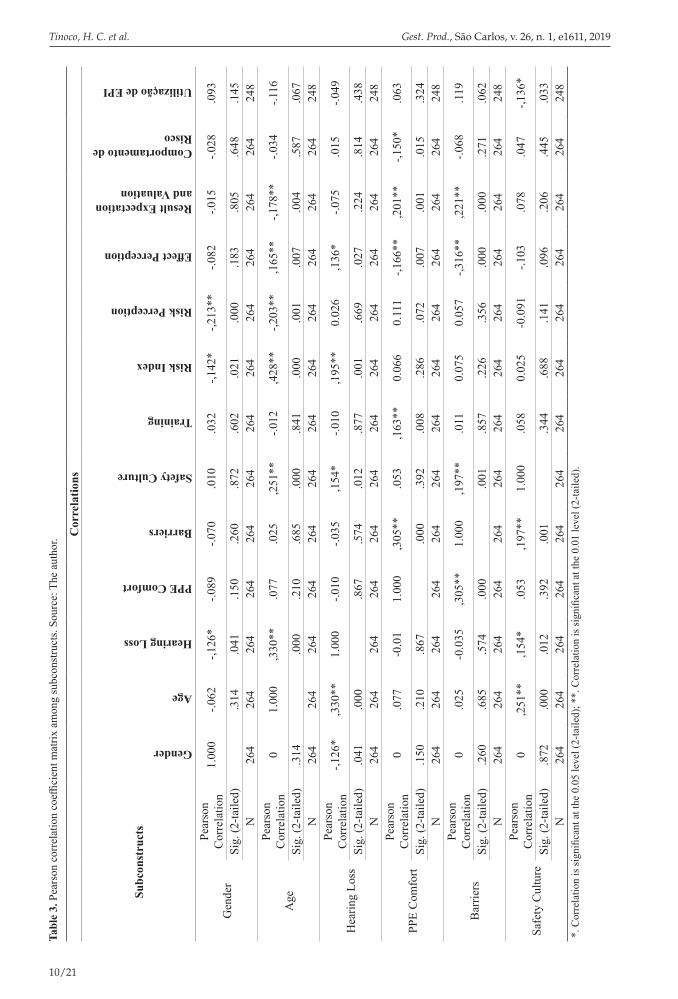
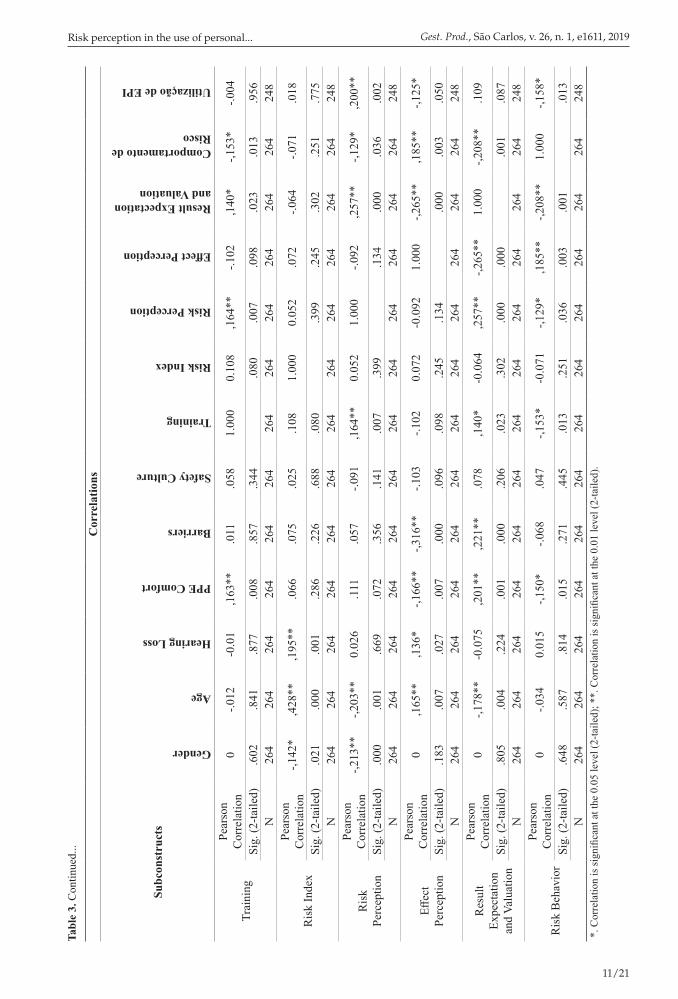
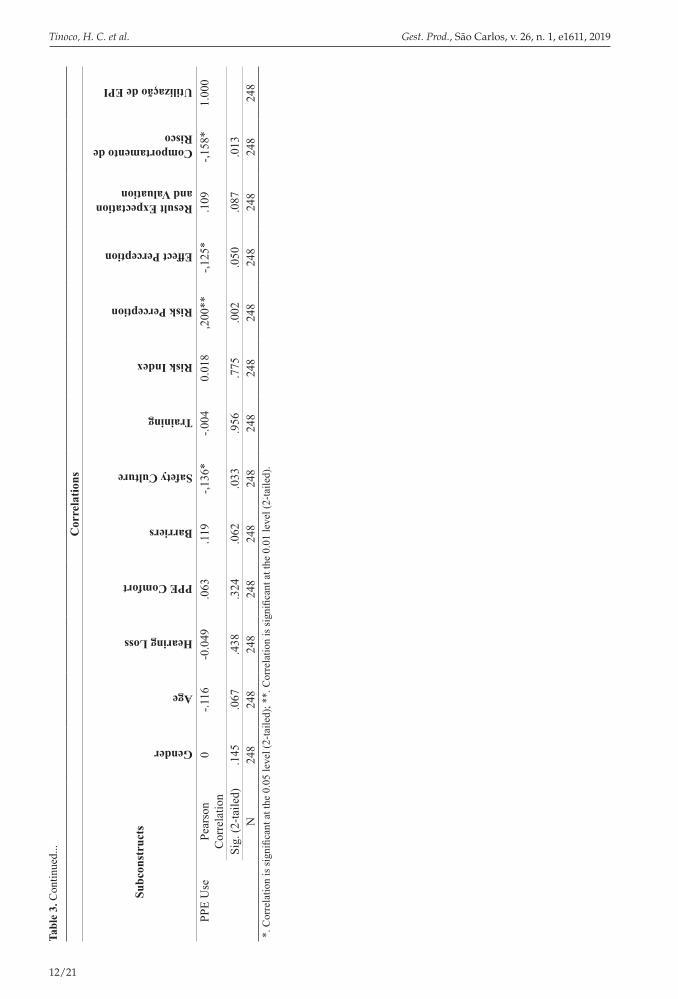
By means of the Pearson correlation coefficient matrix, presented in Table 3, it was possible to analyze the correlation between the subconstructs on a two-by-two basis. The variables for which the null correlation hypothesis at the 5% level was rejected were considered significantly correlated. Significant correlations between pairs of variables generally confirmed the relationships in the model proposed in the previous section. Only the direct significant correlation between the use of PPE and the Safety Culture – while not rejecting the null hypothesis
in the following sections: risk exposure, exposure to ototoxic chemicals, history of hearing loss, health training and occupational safety / hearing loss / use of PPE, comfort, and use of PPE. Finally, a field was included for insertion of the information from the tonal audiometry tests carried out after filling in the questionnaires.
To measure the workers’ opinions, the assessment tool used the five-level Likert scale, ranging from “strongly agree” to “strongly disagree.” After completing all 278 questionnaires, the answers were converted into numbers, according to the scale, and tabulated in a spreadsheet. The responses were scaled from 1 (strongly disagree) to 5 (strongly agree). In some cases, it was necessary to use an inverted scale, such as for questions on barriers, physical load, and risk behavior.
This study used Cronbach’s alpha (α) to gauge the internal consistency of the questionnaires (Bland & Altman, 1977). High values of this statistic (above 0.70 as a general rule) indicate that, in each part of the questionnaire, the components present consistent results while the different parts are independent of one another. Statistical variation in response to the withdrawal of some components of a part or a whole
Table 1. Sample distribution among factories. Source: The author.
Factory Total # of workers
# of workers in the sample
Percentage of workers in the
sample
Age (years) Seniority in the company (years)
Mean Dp Mean DpFACTORY “A” 689 152 22% 36.2 10.1 15.7 8.6FACTORY “B” 516 63 12% 42.9 9.2 3.3 4.8FACTORY “C” 153 20 13% 48.2 11.1 8.2 11.6FACTORY D 225 43 19% 42.6 8.9 7.9 9.5Total 1593 278 18% 39.6 9.2 11.1 1.5
Table 2. Summary of results of the analysis of items of questionnaire 1. Source: The author.
QUESTION
BEFORE AFTER% ITEM
REDUCTION# OF ITEMSCRONBACH’S
ALPHA COEFFICIENT
# OF ITEMSCRONBACH’S
ALPHA COEFFICIENT
1 6 0.820 6 0.820 0.00%2 5 0.716 5 0.716 0.00%3 8 0.866 5 0.920 37.50%4 5 0.601 0 0.601 100.00%5 8 0.866 6 0.890 25.00%6 6 0.862 5 0.863 16.70%7 5 0.600 4 0.691 20.00%8 11 0.736 10 0.749 9.10%9 6 0.829 6 0.829 0.00%10 6 0.700 6 0.700 0.00%11 8 0.868 8 0.868 0.00%
TOTAL 74 - 61 - 17.57%
10/21
Tinoco, H. C. et al. Gest. Prod., São Carlos, v. 26, n. 1, e1611, 2019Ta
ble
3. P
ears
on c
orre
latio
n co
effici
ent m
atrix
am
ong
subc
onst
ruct
s. So
urce
: The
aut
hor.
Cor
rela
tions
Subc
onst
ruct
s
Gender
Age
Hearing Loss
PPE Comfort
Barriers
Safety Culture
Training
Risk Index
Risk Perception
Effect Perception
Result Expectation and Valuation
Comportamento de Risco
Utilização de EPI
Gen
der
Pear
son
Cor
rela
tion
1.00
0-.0
62-,1
26*
-.089
-.070
.010
.032
-,142
*-,2
13**
-.082
-.015
-.028
.093
Sig.
(2-ta
iled)
.314
.041
.150
.260
.872
.602
.021
.000
.183
.805
.648
.145
N26
426
426
426
426
426
426
426
426
426
426
426
424
8
Age
Pear
son
Cor
rela
tion
01.
000
,330
**.0
77.0
25,2
51**
-.012
,428
**-,2
03**
,165
**-,1
78**
-.034
-.116
Sig.
(2-ta
iled)
.314
.000
.210
.685
.000
.841
.000
.001
.007
.004
.587
.067
N26
426
426
426
426
426
426
426
426
426
426
426
424
8
Hea
ring
Loss
Pear
son
Cor
rela
tion
-,126
*,3
30**
1.00
0-.0
10-.0
35,1
54*
-.010
,195
**0.
026
,136
*-.0
75.0
15-.0
49
Sig.
(2-ta
iled)
.041
.000
.867
.574
.012
.877
.001
.669
.027
.224
.814
.438
N26
426
426
426
426
426
426
426
426
426
426
426
424
8
PPE
Com
fort
Pear
son
Cor
rela
tion
0.0
77-0
.01
1.00
0,3
05**
.053
,163
**0.
066
0.11
1-,1
66**
,201
**-,1
50*
.063
Sig.
(2-ta
iled)
.150
.210
.867
.000
.392
.008
.286
.072
.007
.001
.015
.324
N26
426
426
426
426
426
426
426
426
426
426
426
424
8
Bar
riers
Pear
son
Cor
rela
tion
0.0
25-0
.035
,305
**1.
000
,197
**.0
110.
075
0.05
7-,3
16**
,221
**-.0
68.1
19
Sig.
(2-ta
iled)
.260
.685
.574
.000
.001
.857
.226
.356
.000
.000
.271
.062
N26
426
426
426
426
426
426
426
426
426
426
426
424
8
Safe
ty C
ultu
re
Pear
son
Cor
rela
tion
0,2
51**
,154
*.0
53,1
97**
1.00
0.0
580.
025
-0.0
91-.1
03.0
78.0
47-,1
36*
Sig.
(2-ta
iled)
.872
.000
.012
.392
.001
.344
.688
.141
.096
.206
.445
.033
N26
426
426
426
426
426
426
426
426
426
426
426
424
8*.
Cor
rela
tion
is si
gnifi
cant
at t
he 0
.05
leve
l (2-
taile
d); *
*. C
orre
latio
n is
sign
ifica
nt a
t the
0.0
1 le
vel (
2-ta
iled)
.
11/21
Risk perception in the use of personal... Gest. Prod., São Carlos, v. 26, n. 1, e1611, 2019
Tabl
e 3.
Pea
rson
cor
rela
tion
coeffi
cien
t mat
rix a
mon
g su
bcon
stru
cts.
Sour
ce: T
he a
utho
r.
Cor
rela
tions
Subc
onst
ruct
s
Gender
Age
Hearing Loss
PPE Comfort
Barriers
Safety Culture
Training
Risk Index
Risk Perception
Effect Perception
Result Expectation and Valuation
Comportamento de Risco
Utilização de EPI
Gen
der
Pear
son
Cor
rela
tion
1.00
0-.0
62-,1
26*
-.089
-.070
.010
.032
-,142
*-,2
13**
-.082
-.015
-.028
.093
Sig.
(2-ta
iled)
.314
.041
.150
.260
.872
.602
.021
.000
.183
.805
.648
.145
N26
426
426
426
426
426
426
426
426
426
426
426
424
8
Age
Pear
son
Cor
rela
tion
01.
000
,330
**.0
77.0
25,2
51**
-.012
,428
**-,2
03**
,165
**-,1
78**
-.034
-.116
Sig.
(2-ta
iled)
.314
.000
.210
.685
.000
.841
.000
.001
.007
.004
.587
.067
N26
426
426
426
426
426
426
426
426
426
426
426
424
8
Hea
ring
Loss
Pear
son
Cor
rela
tion
-,126
*,3
30**
1.00
0-.0
10-.0
35,1
54*
-.010
,195
**0.
026
,136
*-.0
75.0
15-.0
49
Sig.
(2-ta
iled)
.041
.000
.867
.574
.012
.877
.001
.669
.027
.224
.814
.438
N26
426
426
426
426
426
426
426
426
426
426
426
424
8
PPE
Com
fort
Pear
son
Cor
rela
tion
0.0
77-0
.01
1.00
0,3
05**
.053
,163
**0.
066
0.11
1-,1
66**
,201
**-,1
50*
.063
Sig.
(2-ta
iled)
.150
.210
.867
.000
.392
.008
.286
.072
.007
.001
.015
.324
N26
426
426
426
426
426
426
426
426
426
426
426
424
8
Bar
riers
Pear
son
Cor
rela
tion
0.0
25-0
.035
,305
**1.
000
,197
**.0
110.
075
0.05
7-,3
16**
,221
**-.0
68.1
19
Sig.
(2-ta
iled)
.260
.685
.574
.000
.001
.857
.226
.356
.000
.000
.271
.062
N26
426
426
426
426
426
426
426
426
426
426
426
424
8
Safe
ty C
ultu
re
Pear
son
Cor
rela
tion
0,2
51**
,154
*.0
53,1
97**
1.00
0.0
580.
025
-0.0
91-.1
03.0
78.0
47-,1
36*
Sig.
(2-ta
iled)
.872
.000
.012
.392
.001
.344
.688
.141
.096
.206
.445
.033
N26
426
426
426
426
426
426
426
426
426
426
426
424
8*.
Cor
rela
tion
is si
gnifi
cant
at t
he 0
.05
leve
l (2-
taile
d); *
*. C
orre
latio
n is
sign
ifica
nt a
t the
0.0
1 le
vel (
2-ta
iled)
.
Cor
rela
tions
Subc
onst
ruct
s
Gender
Age
Hearing Loss
PPE Comfort
Barriers
Safety Culture
Training
Risk Index
Risk Perception
Effect Perception
Result Expectation and Valuation
Comportamento de Risco
Utilização de EPI
Trai
ning
Pear
son
Cor
rela
tion
0-.0
12-0
.01
,163
**.0
11.0
581.
000
0.10
8,1
64**
-.102
,140
*-,1
53*
-.004
Sig.
(2-ta
iled)
.602
.841
.877
.008
.857
.344
.080
.007
.098
.023
.013
.956
N26
426
426
426
426
426
426
426
426
426
426
426
424
8
Ris
k In
dex
Pear
son
Cor
rela
tion
-,142
*,4
28**
,195
**.0
66.0
75.0
25.1
081.
000
0.05
2.0
72-.0
64-.0
71.0
18
Sig.
(2-ta
iled)
.021
.000
.001
.286
.226
.688
.080
.399
.245
.302
.251
.775
N26
426
426
426
426
426
426
426
426
426
426
426
424
8
Ris
k Pe
rcep
tion
Pear
son
Cor
rela
tion
-,213
**-,2
03**
0.02
6.1
11.0
57-.0
91,1
64**
0.05
21.
000
-.092
,257
**-,1
29*
,200
**
Sig.
(2-ta
iled)
.000
.001
.669
.072
.356
.141
.007
.399
.134
.000
.036
.002
N26
426
426
426
426
426
426
426
426
426
426
426
424
8
Effec
t Pe
rcep
tion
Pear
son
Cor
rela
tion
0,1
65**
,136
*-,1
66**
-,316
**-.1
03-.1
020.
072
-0.0
921.
000
-,265
**,1
85**
-,125
*
Sig.
(2-ta
iled)
.183
.007
.027
.007
.000
.096
.098
.245
.134
.000
.003
.050
N26
426
426
426
426
426
426
426
426
426
426
426
424
8
Res
ult
Expe
ctat
ion
and
Valu
atio
n
Pear
son
Cor
rela
tion
0-,1
78**
-0.0
75,2
01**
,221
**.0
78,1
40*
-0.0
64,2
57**
-,265
**1.
000
-,208
**.1
09
Sig.
(2-ta
iled)
.805
.004
.224
.001
.000
.206
.023
.302
.000
.000
.001
.087
N26
426
426
426
426
426
426
426
426
426
426
426
424
8
Ris
k B
ehav
ior
Pear
son
Cor
rela
tion
0-.0
340.
015
-,150
*-.0
68.0
47-,1
53*
-0.0
71-,1
29*
,185
**-,2
08**
1.00
0-,1
58*
Sig.
(2-ta
iled)
.648
.587
.814
.015
.271
.445
.013
.251
.036
.003
.001
.013
N26
426
426
426
426
426
426
426
426
426
426
426
424
8*.
Cor
rela
tion
is si
gnifi
cant
at t
he 0
.05
leve
l (2-
taile
d); *
*. C
orre
latio
n is
sign
ifica
nt a
t the
0.0
1 le
vel (
2-ta
iled)
.
Tabl
e 3.
Con
tinue
d...
12/21
Tinoco, H. C. et al. Gest. Prod., São Carlos, v. 26, n. 1, e1611, 2019
Cor
rela
tions
Subc
onst
ruct
s
Gender
Age
Hearing Loss
PPE Comfort
Barriers
Safety Culture
Training
Risk Index
Risk Perception
Effect Perception
Result Expectation and Valuation
Comportamento de Risco
Utilização de EPI
PPE
Use
Pear
son
Cor
rela
tion
0-.1
16-0
.049
.063
.119
-,136
*-.0
040.
018
,200
**-,1
25*
.109
-,158
*1.
000
Sig.
(2-ta
iled)
.145
.067
.438
.324
.062
.033
.956
.775
.002
.050
.087
.013
N24
824
824
824
824
824
824
824
824
824
824
824
824
8*.
Cor
rela
tion
is si
gnifi
cant
at t
he 0
.05
leve
l (2-
taile
d); *
*. C
orre
latio
n is
sign
ifica
nt a
t the
0.0
1 le
vel (
2-ta
iled)
.
Tabl
e 3.
Con
tinue
d...
13/21
Risk perception in the use of personal... Gest. Prod., São Carlos, v. 26, n. 1, e1611, 2019
Cor
rela
tions
Subc
onst
ruct
s
Gender
Age
Hearing Loss
PPE Comfort
Barriers
Safety Culture
Training
Risk Index
Risk Perception
Effect Perception
Result Expectation and Valuation
Comportamento de Risco
Utilização de EPI
PPE
Use
Pear
son
Cor
rela
tion
0-.1
16-0
.049
.063
.119
-,136
*-.0
040.
018
,200
**-,1
25*
.109
-,158
*1.
000
Sig.
(2-ta
iled)
.145
.067
.438
.324
.062
.033
.956
.775
.002
.050
.087
.013
N24
824
824
824
824
824
824
824
824
824
824
824
824
8*.
Cor
rela
tion
is si
gnifi
cant
at t
he 0
.05
leve
l (2-
taile
d); *
*. C
orre
latio
n is
sign
ifica
nt a
t the
0.0
1 le
vel (
2-ta
iled)
.
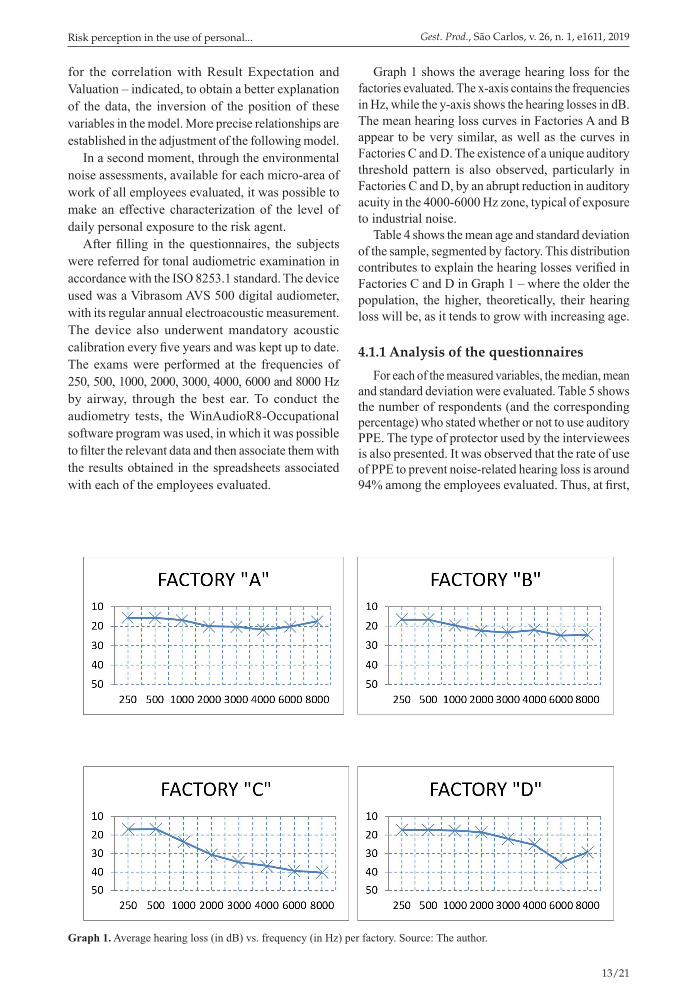
Graph 1 shows the average hearing loss for the factories evaluated. The x-axis contains the frequencies in Hz, while the y-axis shows the hearing losses in dB. The mean hearing loss curves in Factories A and B appear to be very similar, as well as the curves in Factories C and D. The existence of a unique auditory threshold pattern is also observed, particularly in Factories C and D, by an abrupt reduction in auditory acuity in the 4000-6000 Hz zone, typical of exposure to industrial noise.
Table 4 shows the mean age and standard deviation of the sample, segmented by factory. This distribution contributes to explain the hearing losses verified in Factories C and D in Graph 1 – where the older the population, the higher, theoretically, their hearing loss will be, as it tends to grow with increasing age.
4.1.1 Analysis of the questionnairesFor each of the measured variables, the median, mean
and standard deviation were evaluated. Table 5 shows the number of respondents (and the corresponding percentage) who stated whether or not to use auditory PPE. The type of protector used by the interviewees is also presented. It was observed that the rate of use of PPE to prevent noise-related hearing loss is around 94% among the employees evaluated. Thus, at first,
for the correlation with Result Expectation and Valuation – indicated, to obtain a better explanation of the data, the inversion of the position of these variables in the model. More precise relationships are established in the adjustment of the following model.
In a second moment, through the environmental noise assessments, available for each micro-area of work of all employees evaluated, it was possible to make an effective characterization of the level of daily personal exposure to the risk agent.
After filling in the questionnaires, the subjects were referred for tonal audiometric examination in accordance with the ISO 8253.1 standard. The device used was a Vibrasom AVS 500 digital audiometer, with its regular annual electroacoustic measurement. The device also underwent mandatory acoustic calibration every five years and was kept up to date. The exams were performed at the frequencies of 250, 500, 1000, 2000, 3000, 4000, 6000 and 8000 Hz by airway, through the best ear. To conduct the audiometry tests, the WinAudioR8-Occupational software program was used, in which it was possible to filter the relevant data and then associate them with the results obtained in the spreadsheets associated with each of the employees evaluated.
Graph 1. Average hearing loss (in dB) vs. frequency (in Hz) per factory. Source: The author.
14/21
Tinoco, H. C. et al. Gest. Prod., São Carlos, v. 26, n. 1, e1611, 2019
workers declared themselves as having good safety practices, in relation to a safe posture and aimed at preserving their physical integrity, avoiding diseases related to the noise agent.
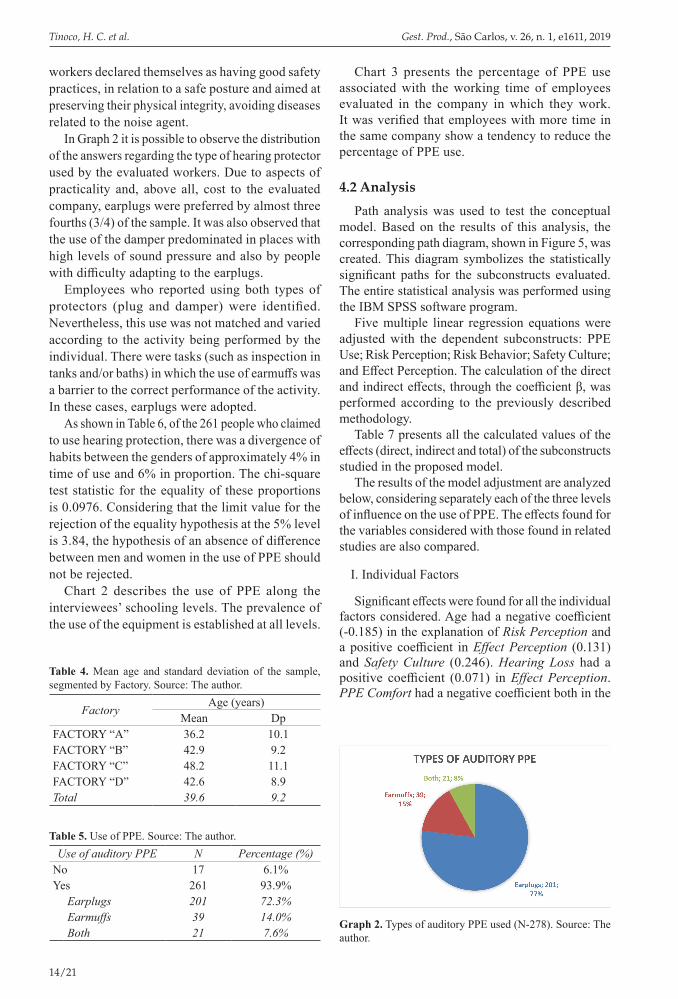
In Graph 2 it is possible to observe the distribution of the answers regarding the type of hearing protector used by the evaluated workers. Due to aspects of practicality and, above all, cost to the evaluated company, earplugs were preferred by almost three fourths (3/4) of the sample. It was also observed that the use of the damper predominated in places with high levels of sound pressure and also by people with difficulty adapting to the earplugs.
Employees who reported using both types of protectors (plug and damper) were identified. Nevertheless, this use was not matched and varied according to the activity being performed by the individual. There were tasks (such as inspection in tanks and/or baths) in which the use of earmuffs was a barrier to the correct performance of the activity. In these cases, earplugs were adopted.
As shown in Table 6, of the 261 people who claimed to use hearing protection, there was a divergence of habits between the genders of approximately 4% in time of use and 6% in proportion. The chi-square test statistic for the equality of these proportions is 0.0976. Considering that the limit value for the rejection of the equality hypothesis at the 5% level is 3.84, the hypothesis of an absence of difference between men and women in the use of PPE should not be rejected.
Chart 2 describes the use of PPE along the interviewees’ schooling levels. The prevalence of the use of the equipment is established at all levels.
Chart 3 presents the percentage of PPE use associated with the working time of employees evaluated in the company in which they work. It was verified that employees with more time in the same company show a tendency to reduce the percentage of PPE use.
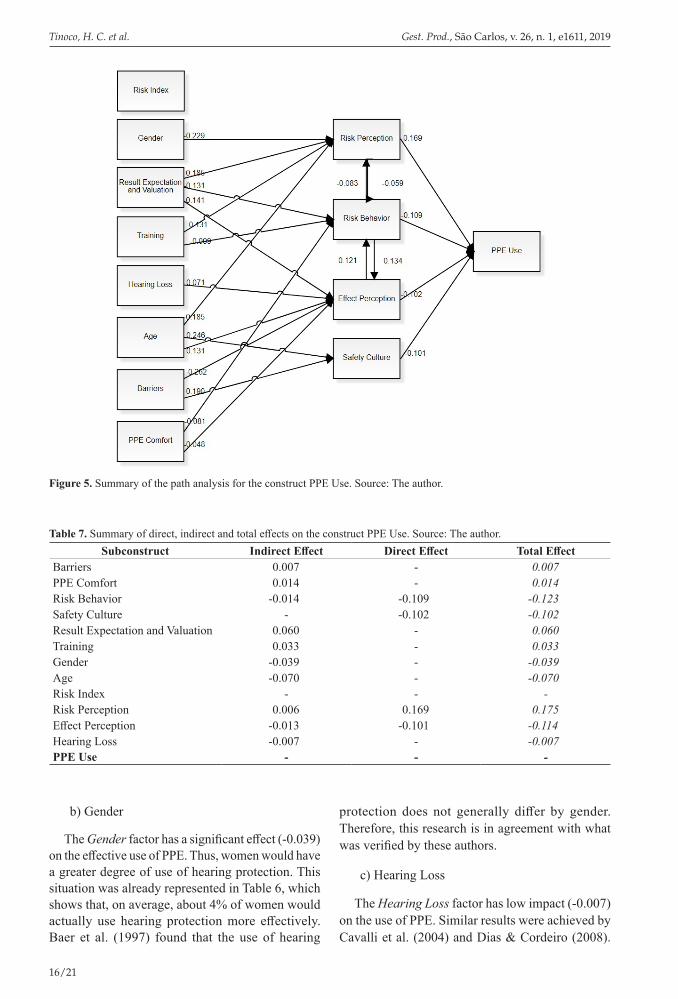
4.2 AnalysisPath analysis was used to test the conceptual
model. Based on the results of this analysis, the corresponding path diagram, shown in Figure 5, was created. This diagram symbolizes the statistically significant paths for the subconstructs evaluated. The entire statistical analysis was performed using the IBM SPSS software program.
Five multiple linear regression equations were adjusted with the dependent subconstructs: PPE Use; Risk Perception; Risk Behavior; Safety Culture; and Effect Perception. The calculation of the direct and indirect effects, through the coefficient β, was performed according to the previously described methodology.
Table 7 presents all the calculated values of the effects (direct, indirect and total) of the subconstructs studied in the proposed model.
The results of the model adjustment are analyzed below, considering separately each of the three levels of influence on the use of PPE. The effects found for the variables considered with those found in related studies are also compared.
I. Individual Factors
Significant effects were found for all the individual factors considered. Age had a negative coefficient (-0.185) in the explanation of Risk Perception and a positive coefficient in Effect Perception (0.131) and Safety Culture (0.246). Hearing Loss had a positive coefficient (0.071) in Effect Perception. PPE Comfort had a negative coefficient both in the
Table 4. Mean age and standard deviation of the sample, segmented by Factory. Source: The author.
FactoryAge (years)
Mean DpFACTORY “A” 36.2 10.1FACTORY “B” 42.9 9.2FACTORY “C” 48.2 11.1FACTORY “D” 42.6 8.9Total 39.6 9.2
Table 5. Use of PPE. Source: The author.Use of auditory PPE N Percentage (%)
No 17 6.1%Yes 261 93.9%
Earplugs 201 72.3%Earmuffs 39 14.0%Both 21 7.6%
Graph 2. Types of auditory PPE used (N-278). Source: The author.
15/21
Risk perception in the use of personal... Gest. Prod., São Carlos, v. 26, n. 1, e1611, 2019
Chart 2. Percentage of PPE use related to educational level. Source: The author.PPE useNo Yes % of time of PPE use
N % o
f the
tota
l
N % o
f the
tota
l
Mea
n
Stan
dard
D
evia
tion
Min
imum
Med
ian
Max
imum
Scho
olin
g
Incomplete primary school 0 0.00% 4 1.44% 70.25 41.49 9 86 100Complete primary school 0 0.00% 2 0.72% 92.50 3.54 90 92.5 95Incomplete secondary school 1 0.36% 7 2.52% 77.49 35.60 0 94 100Complete secondary school 12 4.32% 135 48.56% 79.92 29.56 0 90 100Incomplete higher education 1 0.36% 72 25.90% 84.47 19.07 0 90 100Complete higher education 3 1.08% 41 14.75% 73.98 27.88 0 82 100
Total 17 6.12% 261 93.88% 80.05 27.21 0 90 100
Chart 3. Percentage of PPE use related to working time in the company. Source: The author.PPE use
No Yes % of the time of PPE use
N % o
f the
tota
l
N % o
f the
tota
l
Mea
n
Stan
dard
Dev
iatio
n
Min
imum
Med
ian
Max
imum
Tim
e of
wor
k in
th
e co
mpa
ny
0-10 years 13 4.68% 173 62.23% 80.63 28.38 0 90 100
11-20 years 1 0.36% 48 17.27% 83.73 20.72 0 90 100
21-30 years 2 0.72% 25 8.99% 76.00 25.38 0 82 100
> 30 years 1 0.36% 15 5.40% 68.94 32.13 0 82 100Total 17 6.12% 261 93.88% 309.30 106.61 0 344 400
Table 6. Use of auditory personal protective equipment by gender. Source: The author.Use of auditory PPE by gender
Gender
No Yes
N Percentage (%) in the sample N Percentage (%)
in the sample
Mean percentage (%) for time of use by gender
Female 6 2.2% 49 17.6% 88.1Male 11 4.0% 212 76.3% 84.1
explanation of Risk Perception (-0.081) and in Effect Perception (-0.048). Women tend to have higher Risk Perception (coefficient of -0.229 for Gender in the Risk Perception explanation).
a) Age
Crandell et al. (2004) note that, although there are more than 11 million individuals with noise-induced hearing loss (NIHL) in the United States, there is
still a shortage of empirical evidence on exposure to noise and the use of hearing protection for young adults. This study shows that most young adults in the study demonstrated a high degree of knowledge about the factors associated with excessive noise exposure and the risk of hearing loss, corroborating the results found in this study, in which young people tend to use hearing protection more (-0.070 effect for the age factor).
16/21
Tinoco, H. C. et al. Gest. Prod., São Carlos, v. 26, n. 1, e1611, 2019
b) Gender
The Gender factor has a significant effect (-0.039) on the effective use of PPE. Thus, women would have a greater degree of use of hearing protection. This situation was already represented in Table 6, which shows that, on average, about 4% of women would actually use hearing protection more effectively. Baer et al. (1997) found that the use of hearing
protection does not generally differ by gender. Therefore, this research is in agreement with what was verified by these authors.
c) Hearing Loss
The Hearing Loss factor has low impact (-0.007) on the use of PPE. Similar results were achieved by Cavalli et al. (2004) and Dias & Cordeiro (2008).
Figure 5. Summary of the path analysis for the construct PPE Use. Source: The author.
Table 7. Summary of direct, indirect and total effects on the construct PPE Use. Source: The author.Subconstruct Indirect Effect Direct Effect Total Effect
Barriers 0.007 - 0.007PPE Comfort 0.014 - 0.014Risk Behavior -0.014 -0.109 -0.123Safety Culture - -0.102 -0.102Result Expectation and Valuation 0.060 - 0.060Training 0.033 - 0.033Gender -0.039 - -0.039Age -0.070 - -0.070Risk Index - - -Risk Perception 0.006 0.169 0.175Effect Perception -0.013 -0.101 -0.114Hearing Loss -0.007 - -0.007PPE Use - - -
17/21
Risk perception in the use of personal... Gest. Prod., São Carlos, v. 26, n. 1, e1611, 2019
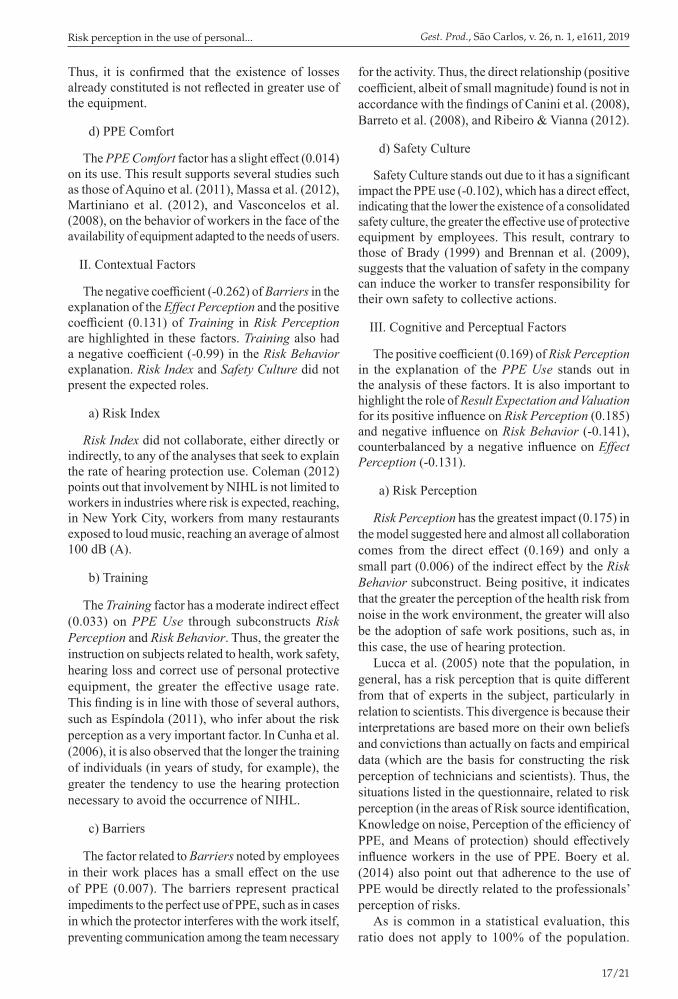
Thus, it is confirmed that the existence of losses already constituted is not reflected in greater use of the equipment.
d) PPE Comfort
The PPE Comfort factor has a slight effect (0.014) on its use. This result supports several studies such as those of Aquino et al. (2011), Massa et al. (2012), Martiniano et al. (2012), and Vasconcelos et al. (2008), on the behavior of workers in the face of the availability of equipment adapted to the needs of users.
II. Contextual Factors
The negative coefficient (-0.262) of Barriers in the explanation of the Effect Perception and the positive coefficient (0.131) of Training in Risk Perception are highlighted in these factors. Training also had a negative coefficient (-0.99) in the Risk Behavior explanation. Risk Index and Safety Culture did not present the expected roles.
a) Risk Index
Risk Index did not collaborate, either directly or indirectly, to any of the analyses that seek to explain the rate of hearing protection use. Coleman (2012) points out that involvement by NIHL is not limited to workers in industries where risk is expected, reaching, in New York City, workers from many restaurants exposed to loud music, reaching an average of almost 100 dB (A).
b) Training
The Training factor has a moderate indirect effect (0.033) on PPE Use through subconstructs Risk Perception and Risk Behavior. Thus, the greater the instruction on subjects related to health, work safety, hearing loss and correct use of personal protective equipment, the greater the effective usage rate. This finding is in line with those of several authors, such as Espíndola (2011), who infer about the risk perception as a very important factor. In Cunha et al. (2006), it is also observed that the longer the training of individuals (in years of study, for example), the greater the tendency to use the hearing protection necessary to avoid the occurrence of NIHL.
c) Barriers
The factor related to Barriers noted by employees in their work places has a small effect on the use of PPE (0.007). The barriers represent practical impediments to the perfect use of PPE, such as in cases in which the protector interferes with the work itself, preventing communication among the team necessary
for the activity. Thus, the direct relationship (positive coefficient, albeit of small magnitude) found is not in accordance with the findings of Canini et al. (2008), Barreto et al. (2008), and Ribeiro & Vianna (2012).
d) Safety Culture
Safety Culture stands out due to it has a significant impact the PPE use (-0.102), which has a direct effect, indicating that the lower the existence of a consolidated safety culture, the greater the effective use of protective equipment by employees. This result, contrary to those of Brady (1999) and Brennan et al. (2009), suggests that the valuation of safety in the company can induce the worker to transfer responsibility for their own safety to collective actions.
III. Cognitive and Perceptual Factors
The positive coefficient (0.169) of Risk Perception in the explanation of the PPE Use stands out in the analysis of these factors. It is also important to highlight the role of Result Expectation and Valuation for its positive influence on Risk Perception (0.185) and negative influence on Risk Behavior (-0.141), counterbalanced by a negative influence on Effect Perception (-0.131).
a) Risk Perception
Risk Perception has the greatest impact (0.175) in the model suggested here and almost all collaboration comes from the direct effect (0.169) and only a small part (0.006) of the indirect effect by the Risk Behavior subconstruct. Being positive, it indicates that the greater the perception of the health risk from noise in the work environment, the greater will also be the adoption of safe work positions, such as, in this case, the use of hearing protection.
Lucca et al. (2005) note that the population, in general, has a risk perception that is quite different from that of experts in the subject, particularly in relation to scientists. This divergence is because their interpretations are based more on their own beliefs and convictions than actually on facts and empirical data (which are the basis for constructing the risk perception of technicians and scientists). Thus, the situations listed in the questionnaire, related to risk perception (in the areas of Risk source identification, Knowledge on noise, Perception of the efficiency of PPE, and Means of protection) should effectively influence workers in the use of PPE. Boery et al. (2014) also point out that adherence to the use of PPE would be directly related to the professionals’ perception of risks.
As is common in a statistical evaluation, this ratio does not apply to 100% of the population.
18/21
Tinoco, H. C. et al. Gest. Prod., São Carlos, v. 26, n. 1, e1611, 2019
(2012), employers may discourage risk behavior by encouraging its perception in light of the occupational noise agent.
5 ConclusionsIn order to identify the variables that may
influence the use of individual hearing protection, we conducted analyses with the dependent variable of PPE use, related to the independent variables of risk perception, risk behavior, safety culture, and effect perception.
It was concluded that the individual perception of the risk of occupational exposure to noise can be understood as a key issue for the development of safe behaviors, particularly for the use of hearing protection devices. Thus, an effective understanding of the employees regarding occupational risk before the physical noise agent appeared to influence the use of auditory PPE. Nevertheless, the individual perception of workers is still deficient, i.e., they misjudge the risk to which they are exposed, which is why their individual proactive attitudes do not translate into a perfect use of hearing protection devices.
This study also concludes that:
- Training, despite general expectations, does not provide workers with a better understanding of the risk of exposure to noise. Although, in this study, a significant correlation between training and risk perception was observed, also influencing workers’ risk behavior, all related to protection against noise exposure, these relationships were not sufficient to increase considerably the rate of use of auditory PPE;
- The worker’s age directly influences the habit of using PPE;
- Several other factors deemed important in other studies (highlighted in Chart 1) had their influence rejected when placed in the presence of risk perception by the worker.
This paper also suggests a set of directions for future dismemberment of this research, such as:
i. Considering that this paper was limited to the study of the continuous or intermittent noises present in the work environments evaluated, it is suggested that complementary studies be performed in workplaces whose employees are submitted to impact noise in order to assess other variables and their influences;
Caldas & Recena (2008) concluded in a study with farmers that these professionals do not always transform their risk perception and personal experiences into safer attitudes and practices in the use of pesticides, such as an adequate use of PPE, as they feel helpless before risk situations, mainly due to uncontrollable environmental factors and economic vulnerability.
b) Effect Perception
The Effect Perception subconstruct has a high direct effect (-0.101), as well as a reduced indirect effect (-0.013) due to the interaction with the Risk Behavior subconstruct. This negative effect was not expected. Morata et al. (2001) obtained opposite results when studying subconstructs associated with the decision to use hearing protection related to the perception of the effects of noise under hearing.
c) Result Expectation and Valuation
Result Expectation and Valuation have a considerable influence (0.060) on the use of hearing protection, and the indirect effect is fully responsive for its coefficient (due to the Risk Perception, Risk Behavior and Effect Perception subconstructs). The results found for the analysis of this subconstruct are in agreement with the studies of Salavessa & Uva (2007). Leme et al. (2014) also highlight that protective equipment is not always effective, for various reasons such as its misuse. Thus, this item contributed to showing that the use of PPE is usually closely related to the employee’s individual decision and willingness, as it is important for the employee to perceive the environmental risks, allowing a reflection on the factors that condition the behavior of individuals in a given work situation.
d) Risk Behavior
The Risk Behavior subconstruct has a high direct effect (-0.109), as well as a reduced indirect effect (-0.014) due to the interaction with the Effect Perception subconstruct. This result converges with the studies of Ribeiro & Vianna (2012), Bohlin & Johansson (2011), and McCullagh (2011). The study conducted by Prince (2002) also showed that, when employees tend to assume the risk of unsafe postures in the workplace, there is a strong tendency not to use the protective equipment offered by employers. In a system of occupational health and safety management, in which requirements are defined in order to allow companies to prevent occupational accidents and damage to health, according to Carpinetti et al.
19/21
Risk perception in the use of personal... Gest. Prod., São Carlos, v. 26, n. 1, e1611, 2019
Boery, E. N., Boery, R. N. S. O., Moreira, R. M., Mota, T. N., Sales, Z. N., Santos, N. A., Santos, R. A., & Teixeira, J. R. B. (2014). Use of personal protective equipment for motorcycle taxi drivers: perception of risks and associated factors. Cadernos de Saude Publica, 30(4), 885-890. PMid:24896065.
Bohlin, W. S. M., & Johansson, I. (2011). Gender perspectives in psychometrics related to leisure time noise exposure and use of hearing protection. Noise & Health, 13(55), 407-414.
Brady, J. (1999). Training to promote worker’s use of hearing protection: The influence of work climate factors on training effectiveness (PhD Thesis). Michigan State University, Michigan. Recuperado em 19 abril 2015, de http://www.hsevi.ir/RI_Thesis/View/526.
Brennan, M. J., Lombardi, D. A., Perry, M. J., & Verma, S. K. (2009). Factors influencing worker use of personal protective eyewear. Accident; Analysis and Prevention, 41(4), 755-762. http://dx.doi.org/10.1016/j.aap.2009.03.017. PMid:19540964.
Caldas, E. D., & Recena, M. C. P. (2008). Percepção de risco, atitudes e práticas no uso de agrotóxicos entre agricultores de Culturama, MS. Revista da Saúde Pública, São Paulo, 42(2), 294-301. http://dx.doi.org/10.1590/S0034-89102008000200015.
Canini, S. R. M. S., Gir, E., Hayashida, M., & Malaguti, S. E. (2008). Enfermeiros com cargos de chefia e medidas preventivas à exposição ocupacional: facilidades e barreiras. Revista da Escola de Enfermagem da U S P., 42(3), 496-503. http://dx.doi.org/10.1590/S0080-62342008000300012. PMid:18856117.
Carpinetti, L. C. R., Gerolamo, M. C., Lima, C. H. B., Sordan, J. E., & Vitoreli, G. A. (2012). Estruturação de um programa de qualificação em gestão da qualidade, segurança e saúde ocupacional: apresentação dos resultados de uma aplicação piloto realizada no aglomerado metal-mecânico de Sertãozinho - São Paulo. Gestão & Produção, 19(4), 689-704. http://dx.doi.org/10.1590/S0104-530X2012000400003.
Cavalli, R. C. M., Morata, T. C., & Marques, J. M. (2004). Auditoria dos programas de prevenção de perdas auditivas em Curitiba (PPPA). Revista Brasileira de Otorrinolaringologia, 70(3), 368-377. http://dx.doi.org/10.1590/S0034-72992004000300013.
Coleman, M. (2012). Restaurants serve up an extra helping of hearing loss. The Hearing Journal, 65(9). http://dx.doi.org/10.1097/01.HJ.0000419021.69639.9a.
Costa, E. C. L., & Sepúlvida, G. S. (2013). Equipamentos de proteção individual: percepção da equipe de enfermagem quanto ao uso. Revista de Enfermagem da UFPI. 2(4), 72-77.
Crandell, C., Mills, T. L., & Gauthier, R. (2004). Knowledge, behaviors, and attitudes about hearing
ii. This same type of study could be replicated in other types of occupational environments, whose possible regional behavioral characteristics of the population, as well as environmental exposure characteristics, presented different specificities from the contexts developed here.
AcknowledgementThe authors would like to thank the reviewers of
Revista Gestão & Produção for the criticisms and suggestions made to the original version of the text.
ReferencesAquino, H. S. S. M., Benevides, S. D., & Silva, T. P. S.
(2011). Identificação da Disfunção Temporomandibular (DTM) em usuários de Dispositivo de Proteção Auditiva Individual (DPAI). Revista CEFAC, 13(5), 801-812. http://dx.doi.org/10.1590/S1516-18462011005000056.
Arezes, P. M. (2002). Percepção do risco de exposição ocupacional ao ruído (Tese de doutorado). Universidade do Minho, Guimarães. Recebido em 18 de abril de 2015, de https://repositorium.sdum.uminho.pt/bitstream/1822/387/1/Tese%20PhD%20Arezes2002.pdf.
Babin, B., Hair, J. F., Money, A. H., & Samouel, P. (2005). Análise fatorial. In J. F. Hair, B. Babin, A. H. Money & P. Samouel, Análise multivariada de dados (5a ed., Cap. 3, pp. 89-112). Porto Alegre: Bookman.
Badaró, M. L. S., Faria, V. A., Hodja, R., Mendes, M. E., Rodrigues, E., & Sumita, N. M. (2011). Perigos e riscos na medicina laboratorial: identificação e avaliação. Jornal Brasileiro de Patologia e Medicina Laboratorial, 47(3), 241-247. http://dx.doi.org/10.1590/S1676-24442011000300007.
Baer, L. M., Lusk, S. L., & Ronis, D. L. (1997). Gender differences in blue collar workers use of hearing protection. Women & Health, 25(4), 69-89. http://dx.doi.org/10.1300/J013v25n04_04. PMid:9302730.
Barreto, R. A. S., Neves, H. C. C., Santos, S. L. V., Silva, C. F., Silva e Souza, A. C., & Tiplle, A. F. V. (2008). Conhecimento dos graduandos de enfermagem sobre equipamentos de proteção individual: A contribuição das instituições formadoras. Revista Eletrônica de Enfermagem, 10(2), 428-437.
Bertolini, G. R. F., Brandalise, L. T., Lezana, Á. G. R., Possamai, O., & Rojo, C. A. (2009). A percepção e o comportamento ambiental dos universitários em relação ao grau de educação ambiental. Gestão & Produção, São Carlos, 16(2), 273-285. http://dx.doi.org/10.1590/S0104-530X2009000200010.
Bland, J. M., & Altman, D. G. (1997). Cronbach’s alpha. British Medical Journal, 314, 570-572.
20/21
Tinoco, H. C. et al. Gest. Prod., São Carlos, v. 26, n. 1, e1611, 2019
B. A. (2012). Riscos Ocupacionais: Percepção de Profissionais de Enfermagem da Estratégia Saúde da Família em João Pessoa – PB. Revista Brasileira de Ciências da Saúde. 16(3), 325-332.
Massa, C. G. P., Matas, C. G., Moreira, R. R., Rabelo, C. M., Samell, A. G., & Schochat, E. (2012). P300 em trabalhadores expostos a ruído ocupacional. Revista Brasileira de Otorrinolaringologia, 78(6), 107-112. http://dx.doi.org/10.5935/1808-8694.20120042.
Mccullagh, M. C. (2011). Effects of a low intensity intervention to increase hearing protector use among noise-exposed workers. American Journal of Industrial Medicine, 54(3), 210-215. http://dx.doi.org/10.1002/ajim.20884. PMid:20721900.
Morata, T., Fiorini, A., Fischer, F., Krieg, E., Gozzoli, L., & Colacioppo, S. (2001). Factors affecting the use of hearing protectors in a population of printing workers. Noise and Health, 4, 25-32.
NIOSH – National Institute for Occupational Safety and Health (2013). Noise and hearing loss prevection. Washington: NIOSH. Recuperado em 19 abril de 2015, de http://www.cdc.gov/niosh/topics/noise/.
Pender, N. J. (1982). Health Promotion in Nursing Practice (3a ed.). Norwalk: Appleton-Crofts.
Penney, P. J., & Earl, C. E. (2004). Occupational noise and effects on blood pressure: exploring the relationship of hypertension and noise exposure in workers. American Association of Occupational Health Nurses Journal, 52(11), 476-480. http://dx.doi.org/10.1177/216507990405201107.
Prince, M. M. (2002). Distribution of risk factors for hearing loss: Implications for evaluating risk of occupational noise-induced hearing loss. Journal of the Acoustical Society of America, 112(2), 557-567.
Ribeiro, R. P., & Vianna, L. A. C. (2012). Uso dos equipamentos de proteção individual entre trabalhadores das centrais de material e esterilização. Ciência, Cuidado e Saúde, 11(Supl.):199-203. http://dx.doi.org/10.4025/cienccuidsaude.v11i5.17076.
Rodrigues, M., Rodrigues, L., & Santana, N. (2012). Identificação dos riscos ocupacionais em uma unidade de produção de derivados de carne. Journal of Health Science, 14(2), 115-119.
Salavessa, M., & Uva, A. S. (2007). Saúde e Segurança do Trabalho: da percepção do risco ao uso de EPI’s. Revista Saúde & Trabalho, 6, 69-93.
Scherer, J. O., & Ribeiro, J. L. D. (2013). Proposição de um modelo para análise dos fatores de risco em projetos de implantação da metodologia lean. Gestão & Produção, 20(3), 537-553. http://dx.doi.org/10.1590/S0104-530X2013000300004.
loss and hearing protection among racial/ethnically diverse young adults. Journal of the National Medical Association, 9(2), 176-186.
Cunha, H. C. C., Santos, S. L. V., Silva, C. F., Souza, A. C. S., & Tipple, A. F. V. (2006). O uso de equipamentos de proteção individual entre graduandos dos cursos da área da saúde e a contribuição das instituições formadoras. In Anais eletrônicos do XIV Seminário de Iniciação Científica. Goiânia: UFG. Recuperado em 19 abril 2015, de <https://projetos.extras.ufg.br/conpeex/2006/porta_arquivos/pibic/0730216-Cec%C3%ADliaFerreiradaSilva.pdf.
Dias, A., & Cordeiro, R. (2008). Interação entre grau de perda auditiva e o incômodo com zumbidos em trabalhadores com história de exposição ao ruído. Revista Brasileira de Otorrinolaringologia, 74(6), 876-883. http://dx.doi.org/10.1590/S0034-72992008000600010. PMid:19582344.
Espíndola, É. A. (2011). Análise da percepção de risco do uso de agrotóxicos em áreas rurais: um estudo junto aos agricultores no município de Bom Repouso - MG (Tese de doutorado). Universidade de São Paulo, São Carlos. Recuperado em 19 abril 2015 de http://www.teses.usp.br/teses/disponiveis/18/18139/tde-09062011-152841/
Guedes, D. P., Guedes, J. E. R. P., & Lopes, C. C. (2005). Reprodutibilidade e validade do Questionário Internacional de Atividade Física em adolescentes. Revista Brasileira de Medicina do Esporte, 11(2), 151-158. http://dx.doi.org/10.1590/S1517-86922005000200011.
Jormsri, P., Kaewthummanukul, T., Salazar, M. K., Srisuphan, W., Suthakorn, W., & Tantranont, K. (2009). Factors affecting Thai workers’ use of hearing protection. American Association of Occupational Health Nurses Journal, 57(11), 455-463. http://dx.doi.org/10.1177/216507990905701104. PMid:19873942.
Leme, T. S., Luchini, L. C., Papini, S., & Vieira, E. (2014). Evaluation of personal protective equipment used by malathion sprayers in dengue control in São Paulo, Brazil. Cadernos de Saude Publica, 30(3), 567-576. http://dx.doi.org/10.1590/0102-311X00144912. PMid:24714946.
Lucca, S. R., Peres, F., & Rozemberg, B. (2005). Percepção de riscos no trabalho rural em uma região agrícola do Estado do Rio de Janeiro, Brasil: agrotóxicos, saúde e ambiente. Cadernos de Saúde Pública, 21(6), 1836-1844.
Lusk, S. L., Hong, O., & Ronis, D. L. (2006). Comparison of the original and revised structures of the health promotion model in predicting construction workers’ use of hearing protection. Research in Nursing & Health, 29(1), 3-17. http://dx.doi.org/10.1002/nur.20111. PMid:16404731.
Martiniano, C. S., Martins, M. O., Rodrigues, L. M. C., Silva, C. C. S., Silva, A. C. O. E., & Silva, V. K.
21/21
Risk perception in the use of personal... Gest. Prod., São Carlos, v. 26, n. 1, e1611, 2019
Tinoco, H. C. (2014). Análise multivariada dos fatores de risco aplicada ao estudo da perda auditiva pelo ruído na indústria (Tese de doutorado). Universidade Federal Fluminese, Niterói.
Vasconcelos, B. M., Reis, A., & Vieira, M. S. (2008). Uso de equipamentos de proteção individual pela equipe de
enfermagem de um hospital do município de Coronel Fabriciano. Revista Enfermagem Integrada, 1(1), 99-111.
WHO – World Health Organization (2002). Reducing risks, promoting healthy life (pp. 76-77). Genevra: WHO. Recuperado em 19 abril 2015, de http://whqlibdoc.who.int/publications/2002/9241562072.pdf