nbr 15523 - abnt - projeto revisão - central de gas liquefeito de petroleo

UNIVERSIDADE DE LISBOA
FACULDADE DE CIÊNCIAS
DEPARTAMENTO DE BIOLOGIA ANIMAL
ACTIVITY, DISTRIBUTION AND MICROHABITAT
USE BY THE IMPERILLED MIRA CHUB
SQUALIUS TORGALENSIS
Joana Maria Sofio Martelo Callapez Martins
DOUTORAMENTO EM BIOLOGIA
(Especialidade Ecologia)
2014


UNIVERSIDADE DE LISBOA
FACULDADE DE CIÊNCIAS
DEPARTAMENTO DE BIOLOGIA ANIMAL
ACTIVITY, DISTRIBUTION AND MICROHABITAT
USE BY THE IMPERILLED MIRA CHUB
SQUALIUS TORGALENSIS
Joana Maria Sofio Martelo Callapez Martins
Tese orientada pela Professora Maria Filomena Magalhães e pelo Professor Gary
Grossman, especialmente elaborada para a obtenção do grau de doutor em Biologia,
especialidade Ecologia
2014


This dissertation should be cited as follows:
Martelo, J. (2014) Activity, distribution and microhabitat use by the imperilled Mira chub
Squalius torgalensis. PhD Thesis, Universidade de Lisboa, Portugal.


Preliminary notes
According with the Article 41 no 1 of the Post-Graduate Studies Regulation of the University of
Lisbon (Diário da República II série nº 209 de 30 de Outubro de 2006), the current dissertation
includes papers published or in preparation in co-authorship. As doctoral candidate presenting
this dissertation, I was responsible for the study designs, data collection, statistical analyses
and writing. The advisors of the thesis were deeply involved in the research conceptual
framework and in all stages of the studies, being co-authors of the papers.
This thesis was supported by the Portuguese Science and Technology Foundation (SFRH / BD /
35942 / 2007).


Ao António e à estrelinha


Index
Acknowledgments/Agradecimentos .............................................................................................. i
Resumo ......................................................................................................................................... iii
Abstract ........................................................................................................................................ vii
Chapter 1. General introduction .............................................................................................. 2
1.1. Setting the scene ................................................................................................................ 3 1.2. Spatial distribution and microhabitat use of stream fishes................................................. 4 1.3. Mechanistic approaches to microhabitat use of stream fishes .......................................... 5 1.4. Activity patterns of stream fishes ....................................................................................... 7 1.5. Fishes microhabitat use and activity in the context of Mediterranean streams ................ 9 1.6. Study objectives and approach ......................................................................................... 11 1.7. Thesis organization ........................................................................................................... 13 1.8. References ........................................................................................................................ 15
Chapter 2. Extrinsic and intrinsic factors influence daily activity of a Mediterranean cyprinid
..................................................................................................................................................... 25
2.1. Abstract ............................................................................................................................ 27 2.2. Introduction ...................................................................................................................... 28 2.3. Methods ............................................................................................................................ 30 Study site .................................................................................................................................. 30 Environmental data and daily activity patterns ............................................................................ 31 Statistical analyses ..................................................................................................................... 33 2.4. Results .............................................................................................................................. 37 Daily activity patterns................................................................................................................. 37 Extrinsic and intrinsic influences on behaviour ............................................................................. 38 2.5. Discussion ......................................................................................................................... 42 2.6. References ........................................................................................................................ 46 2.7. Corrigendum .................................................................................................................... 52
Chapter 3. Habitat patchiness affects distribution and microhabitat use of endangered Mira
chub Squalius torgalensis ............................................................................................................... 53
3.1. Abstract ............................................................................................................................ 55 3.2. Introduction ...................................................................................................................... 56 3.4. Methods ............................................................................................................................ 58 Study species ............................................................................................................................. 58 Study reaches ............................................................................................................................ 58 Sampling regime ........................................................................................................................ 60 Fish and habitat sampling .......................................................................................................... 60 3.5. Data analysis ..................................................................................................................... 62 Variation in habitat characteristics .............................................................................................. 63 Spatial patterns in chub abundance ............................................................................................ 64 Microhabitat use by chub ........................................................................................................... 65 3.6. Results .............................................................................................................................. 67 Variation in habitat characteristics .............................................................................................. 67 Spatial patterns in chub abundance ............................................................................................ 69

Microhabitat use by chub ........................................................................................................... 75 3.7. Discussion ......................................................................................................................... 80 3.8. References ........................................................................................................................ 85 3.9. Supplementary material .................................................................................................... 90
Chapter 4. Linking microhabitat use with models of foraging success in the endangered Mira
chub Squalius torgalensis ............................................................................................................... 94
4.1. Abstract ............................................................................................................................ 95 4.2. Introduction ...................................................................................................................... 96 4.3. Methods ............................................................................................................................ 98 Study reaches and species .......................................................................................................... 98 Microhabitat availability and use .............................................................................................. 100 Foraging success experiments ................................................................................................... 101 4.4. Data analyses .................................................................................................................. 104 4.4.1. Microhabitat availability and use .................................................................................. 104 4.4.2. Foraging success .......................................................................................................... 105 Proportion of fish capturing prey ............................................................................................... 105 Capture success and reactive distance ...................................................................................... 106 4.4.3. Model selection and averaging..................................................................................... 107 4.5. Results ............................................................................................................................ 109 4.5.1. Microhabitat use .......................................................................................................... 109 4.5.2. Foraging success .......................................................................................................... 111 Proportion of fish capturing prey ............................................................................................... 111 Capture success and reactive distance ...................................................................................... 112 4.6. Discussion ....................................................................................................................... 114 4.7. References ...................................................................................................................... 118
Chapter 5. General discussion ............................................................................................. 125
5.1. Overall patterns ............................................................................................................. 125 5.2. Aggregation by chub – resource patchiness or social attraction? ................................. 126 5.3. Chub behavioural flexibility ............................................................................................ 127 5.4. Chub microhabitat use ................................................................................................... 130 When velocity is unimportant ................................................................................................... 130 Size-related differences ............................................................................................................ 131 Complementarity in scales of microhabitat use .......................................................................... 132 5.5. Final remarks and future prospects ............................................................................... 134 5.6. References ...................................................................................................................... 138
Appendix .................................................................................................................................... A-1

i
Acknowledgments/Agradecimentos
Este trabalho não poderia ter sido realizado sem o apoio dos meus orientadores, familiares,
amigos, colegas e instituições. A todos o meu agradecimento.
Em primeiro lugar, quero agradecer aos meus orientadores a força anímica que me
transmitiram e com a qual pude levar a bom termo este trabalho, árduo, por vezes solitário, e
sobretudo carregado de dúvidas que só se ultrapassaram e resolveram com “braços fortes”
poderosos, firmes e amigos.
À minha orientadora, a professora Filomena Magalhães, agradeço a sua disponibilidade,
dedicação e rigor em todas as etapas deste trabalho, contribuição com a sua experiência e
conhecimento científico para encontrar as melhores soluções para os problemas que surgiram,
e por fim, por me ajudar a ultrapassar alguns momentos de desânimo.
I am grateful to my co-advisor, professor Gary D. Grossman, for providing me the opportunity
to apply new research methodologies and with adequate space, both physical and intellectual,
to pursue the research questions which tempted me most.
À professora Maria João Collares-Pereira, por ter acreditado desde o início neste projeto e pelo
apoio prestado no decorrer do mesmo.
To Robert Ratajczak, Peter Hazelton and Duncan Elkins for field and laboratory training and
logistical support while my staying in the University of Georgia.
Ao professor Pedro Beja, pela assistência estatística fundamental em várias fases do trabalho.
Ao professor António Amorim, pelas breves lições de física, que permitiram pôr o meu tanque
a funcionar.
À professora Ana Pires, pelo apoio na amostragem de macroinvertebrados.
À Amy, à Cristina, à Rita, ao Tiago e ao João pela preciosa ajuda na amostragem de campo e os
belos tempos passados dentro do Torgal.
Ao Miguel Porto, pela ajuda prestada na área da estatística. Foi imprescindível para o
enriquecimento científico do trabalho.
À Elsa, ao Sefa e ao Simon pela ajuda na identificação dos macroinvertebrados.
A Branca do Nascimento pela assistência no laboratório.

ii
A todos os meus colegas e amigos da FCUL, “obrigada” pela boa disposição que
proporcionaram no espaço (sala dos terminais) de trabalho da faculdade, nos descontraídos
almoços onde partilhávamos as nossas apreensões e angústias de forma leve e divertida.
Ao Daniel, ao Filipe, ao Duarte e à Margarida, pelos ensinamentos no trabalho de campo e
boas estadias no Torgal.
A todos os meus amigos, que de uma forma ou de outra me apoiaram ao longo destes anos de
trabalho. Nunca esquecerei a Nanda e a Shan que sempre me confortaram e divertiram, com a
sua boa disposição e alegria, nos períodos de tempo passados fora do meu espaço de conforto.
Aos meus familiares, especialmente à minha mãe e ao meu pai, pelo encorajamento e apoio
ao longo destes anos de trabalho, colaboração no trabalho de campo e por “aturarem” as
minhas crises existenciais, banindo do dicionário as expressões e palavras “estou farta”,
“desisto” e outras.
Ao António, por todo o amor e leveza de espírito que me conseguiu dar ao longo desta fase
das nossas vidas.
À estrelinha, que me ajuda a abrir a janela todos os dias.
À Fundação para a Ciência e Tecnologia pela atribuição de bolsa individual de doutoramento
(SFRH/BD/35942/2007).
Ao Departamento de Biologia Animal da Faculdade de Ciências da Universidade de Lisboa, ao
Centro de Biologia Ambiental, e à Warnell School of Forestry and Natural Resources, University
of Georgia por terem aceitado serem instituições de acolhimento deste doutoramento.

iii
Resumo
1. Os fatores e mecanismos que determinam a distribuição e abundância de peixes
dulçaquícolas são temas centrais em Ecologia Aquática. A pequenas escalas, os
padrões de distribuição e uso do habitat por peixes encontram-se relativamente bem
documentados, evidenciando a importância quer da variabilidade espacial e temporal
das características físicas do habitat, quer de fatores biológicos. A compreensão dos
mecanismos subjacentes à complexidade e dinamismo destes padrões, requer o
desenvolvimento de novos modelos de índole mecanística que permitam quantificar a
seleção e qualidade do microhabitat em termos de fitness individual. No obstante,
desconhece-se ainda em que medida estes modelos podem ser aplicados a ciprinídeos
em geral, e a espécies Mediterrânicas em particular. Os estudos disponíveis até ao
momento incluem apenas análises comparativas do microhabitat disponível e
utilizado, quantificados através de métodos indiretos e sem informação sobre
comportamento dos indivíduos, pelo que os padrões de atividade e mecanismos
subjacentes à distribuição e uso do habitat das espécies Mediterrânicas permanecem
largamente desconhecidos.
2. A presente dissertação incide sobre a atividade, distribuição e uso do microhabitat por
ciprinídeos em rios Mediterrânicos, usando como caso de estudo, o Escalo do Mira
Squalius torgalensis, uma espécie criticamente ameaçada, endémica do sudoeste de
Portugal. Esta espécie foi selecionada para o estudo por ser abundante na região e
apresentar características de história de vida representativas e típicas das espécies
nativas em rios Mediterrânicos. Especificamente, o estudo foi estruturado para
clarificar a importância relativa de diferentes características físicas do habitat e
identificar os mecanismos subjacentes ao uso do habitat. Nesse sentido foram
desenvolvidas três atividades de investigação distintas, visando: 1) descrever os
padrões de atividade com base na análise do tempo despendido em diferentes
atividades durante o dia, e quantificar a influência de fatores extrínsecos e intrínsecos
nestes comportamentos, 2) quantificar a distribuição espacial relativamente à
distribuição das características físicas do habitat, e analisar a forma como estas se
associam ao uso do microhabitat, e 3) examinar os mecanismos subjacentes ao uso do
microhabitat, com base na relação entre o sucesso alimentar e o uso individual da
velocidade, frequentemente considerada determinante no uso do habitat por peixes

iv
dulçaquícolas. Estes estudos envolveram uma componente de quantificação do uso de
habitat no rio Torgal (SW Portugal) realizada em 2009 e 2010, sob condições reais de
caudal reduzido, e uma componente laboratorial de quantificação do sucesso
alimentar sob condições controladas de velocidade, realizada na Faculdade de
Ciências, Universidade de Lisboa.
3. A análise dos padrões de atividade envolveu a quantificação do tempo despendido em
orientação, natação, alimentação e exploração durante o dia, através da observação
debaixo de água do comportamento de 231 indivíduos. A variação na atividade,
quantificada com base numa Análise de Componentes Principais, foi posteriormente
relacionada com fatores extrínsecos (i.e., temperatura e ano) e intrínsecos (i.e.,
comprimento do corpo e tamanho do grupo), utilizando Modelos Lineares
Generalizados. A atividade apresentou variações acentuadas entre indivíduos,
associadas a fatores extrínsecos e intrínsecos. O modo de alimentação variou
anualmente entre a captura de organismos na coluna de água e a captura de
organismos bentónicos, possivelmente em resposta à variação na disponibilidade de
presas. Ocasionalmente verificou-se também variação no modo de alimentação com o
tamanho do grupo. Além disso, o tempo despendido em natação versus exploração foi
afetado pela temperatura e tamanho do corpo, refletindo provavelmente variações
nos requerimentos energéticos dos indivíduos.
4. A distribuição espacial e o uso do microhabitat foram avaliados em 606 e 236
quadrados de 1m2 dispostos sobre dois setores de estudo, e os padrões comparados
entre anos, setores e classes dimensionais. A distribuição foi quantificada com base na
variação espacial da abundância, e o uso do microhabitat com base nas relações entre
a presença e abundância de peixe e as características do habitat, usando modelos
Hurdle. Em ambos os sectores e anos de estudo, o padrão de distribuição foi agregado,
provavelmente em resposta à variação espacial e autocorrelação de características do
habitat, tais como, detritos lenhosos, raízes e vegetação aquática. No entanto, é
possível que relações bióticas, nomeadamente de atração social, possam também ter
estado envolvidas, particularmente entre indivíduos pequenos. Quer em termos de
presença quer em termos de abundância, verificaram-se associações marcadas com a
composição do substrato, detritos lenhosos, raízes, vegetação aquática e
profundidade. A importância destas características variou entre setores,
presumivelmente devido a alterações na disponibilidade de microhabitat, não se

v
detetando variações marcadas entre anos. A variação ontogenética no uso do
microhabitat foi reduzida, possivelmente devido às baixas velocidades presentes nos
setores de estudo ou à reduzida competição entre indivíduos.
5. A investigação do mecanismo subjacente ao uso do microhabitat envolveu a análise do
uso do microhabitat a nível focal de 187 indivíduos em dois sectores, e a elaboração de
modelos experimentais de sucesso alimentar primariamente baseados na velocidade.
Para a elaboração destes modelos seguiram-se duas etapas. Primeiro, quantificou-se a
variação na proporção de indivíduos que capturaram presas em relação à velocidade, e
ainda à densidade de peixe e composição do grupo (i.e., grupos compostos por
indivíduos pequenos, por indivíduos grandes ou por indivíduos pequenos e grandes).
Segundo, examinou-se em que medida esta variação poderia refletir diferenças
individuais na captura de presas e na distância de reação, em relação à velocidade, e
também à densidade, comprimento do peixe e composição do grupo (i.e., grupos
compostos por indivíduos pertencentes à mesma classe dimensional ou por indivíduos
pertencentes a diferentes classes dimensionais). A análise de uso do microhabitat
focal, em geral, indicou uso aleatório do habitat, nomeadamente em relação à
velocidade, e independente do comprimento dos indivíduos. No laboratório, a
proporção de indivíduos que capturaram presas diminuiu com a velocidade e, ainda,
com a densidade e em grupos formados por indivíduos grandes. A velocidade afetou
também negativamente o sucesso de captura, o qual tal como a distância de reação
tendeu ainda a diminuir com a densidade. Estes resultados sugerem que o uso focal do
microhabitat foi pouco influenciado pela velocidade provavelmente porque o sucesso
de captura de presas tende a ser elevado sob as baixas velocidades prevalecentes em
condições de reduzido caudal.
6. Globalmente, os resultados obtidos evidenciam uma elevada flexibilidade quer a nível
comportamental quer a nível de seleção do microhabitat, que pode ser importante
para a persistência de ciprinídeos em rios Mediterrânicos, onde as condições físicas do
habitat são extremamente variáveis. O estudo realizado revela ainda que substratos
heterogéneos, raízes, vegetação aquática e profundidade intermédia possivelmente
favorecem a persistência de ciprinídeos em rios Mediterrânicos. Por último, é
evidenciada a relevância do uso de abordagens mecanísticas, baseadas na observação
direta e em critérios relacionados com a fitness dos indivíduos (e.g., sucesso

vi
alimentar), para melhorar o conhecimento dos processos de seleção do habitat por
ciprinídeos Mediterrânicos.
7. A abordagem aplicada neste estudo, utilizada tradicionalmente em rios temperados da
América do Norte, pode ainda ser melhorada e mais profundamente explorada de
forma a permitir uma melhor compreensão dos processos subjacentes à distribuição e
seleção do microhabitat por espécies de ciprinídeos, e respetiva dinâmica em rios
Mediterrânicos. Em particular, seria importante: 1) determinar a energia obtida em
função da velocidade, não só a partir do sucesso de captura de presas, mas também
do valor energético das presas disponíveis no campo, 2) incluir o custo energético de
natação e captura de presas no modelo através do cálculo de taxas de respiração a
diferentes velocidades, 3) incluir parâmetros relativos à competição intra e
interespecífica, e 4) analisar a validade deste tipo de modelos para diferentes espécies
e sob as diferentes condições de velocidade prevalecentes num conjunto alargado de
rios Mediterrânicos, sob diferentes contextos hidrológicos, nomeadamente em anos
húmidos.
Palavras-chave: seleção de habitat, comportamento, recursos físicos de habitat, abordagens
mecanísticas, ciprinídeos, rios Mediterrânicos.

vii
Abstract
Understanding habitat selection and use by stream fishes increasingly requires the analysis of
the relationships between fish and their environments in terms of individual fitness. However,
such mechanistic approaches are still uncommon for cyprinids, and remain to be evaluated
and tested for Mediterranean species. This thesis addressed activity, distribution and
microhabitat use by Mira chub Squalius torgalensis, an imperilled cyprinid native to
Mediterranean streams in SW Portugal. This was analysed using a mechanistic approach,
including direct observations of fish and habitat in two reaches of the Torgal stream, in spring
2009 and 2010, and laboratory experiments on foraging success under variable velocities. Daily
activity patterns were variable at the individual level and shaped by extrinsic and intrinsic
factors. Foraging changed from drift to benthic on an annual-basis and with shoal size, and
time spent cruising vs. searching was influenced by temperature and body size. Chub displayed
an aggregated distribution apparently in association with patchily distributed and
autocorrelated physical resources, such as debris, roots and aquatic vegetation. Microhabitat
use was influenced by substrata, cover and depth, but random at the focal level, and little
variable throughout ontogeny. Contrary to expectations, microhabitat use was generally
unrelated to velocity, probably because prey capture success was high at the low velocities
prevailing in study reaches. Nevertheless, the proportion of fish capturing prey and capture
success decreased at high velocities. Results indicate that chub may display high flexibility in
activity and habitat use, which may be important to cope with the high variability of physical
conditions in Mediterranean streams, with maintenance of patches with variable substrata,
cover and depth likely favouring local persistence. Moreover, this thesis shows that
mechanistic fitness-based criteria may be crucial for understanding habitat selection by
Mediterranean cyprinids.
Keywords: habitat selection, behaviour, physical habitat resources, mechanistic approaches,
cyprinids, Mediterranean streams.


Chapter I
General introduction


I. General introduction
3
1. General introduction
1.1. Setting the scene
Understanding drivers and mechanisms that generate the spatial distributions and abundance
of organisms over a range of scales is a central theme in ecology (e.g., Kearney & Porter 2004;
Karlson et al. 2011; Dormann et al. 2012; Trainor et al. 2013; Boucher-Lalonde et al. 2014). This
is a challenging task that requires addressing multiple potentially influential factors including
habitat characteristics (Mendo et al. 2014), food availability (Folmer et al. 2012), conspecifics
(Gibson & Koenig 2012), competition (Razgour et al. 2011), predation risk (Thaker et al. 2010)
and phylogenetic constraints (Strauß et al. 2013). Because these multiple factors can be scale
dependent (Van Beest et al. 2010; Chave 2013; Wisz et al. 2013), ecologists examining spatial
distributions should explicitly consider the link between the spatial and temporal scales at
which research is conducted and at which the processes to be quantified actually operate
(Huston 1999; Chave 2013).
At small scales, legions of studies have attempted to understand the factors
influencing the distribution and abundance of organisms (Cassini 2013). However, the question
of why organisms prefer certain habitats and avoid others is still intriguing ecologists
(Railsback et al. 2003; DeCesare et al. 2014; Piccolo et al. 2014; Potts et al. 2014). Studies of
habitat selection traditionally are correlative and compare habitat characteristics at organisms
locations with characteristics at unused or at random locations (Johnson 1980; Manly et al.
2002; Strickland & McDonald 2006). However, this traditional approach provides little or no
information on the processes and mechanisms that generate habitat use (Kearney & Porter
2009; Bogosian III et al. 2012). This can be circumvented by mechanistic models that allow to
unravel the causal basis of habitat selection through an understanding of how environmental

I. General introduction
4
characteristics interact with the organism itself (i.e., its behavioural, morphological and
physiological traits) to affect key fitness elements such as growth, survival and reproductive
success (Morris & Davidson 2000; Petty & Grossman 2010; Chapperon & Seuront 2011; Latif et
al. 2011; Osbourn et al. 2014). Obtaining a more biological realistic understanding of habitat
use patterns as well as of the factors determining them, is particularly important given that
habitat loss is generally a crucial factor in declines in biodiversity (Dudgeon et al. 2006;
Shochat et al. 2006; Vorosmarty et al. 2010).
1.2. Spatial distribution and microhabitat use of stream fishes
Streams exhibit pronounced heterogeneity in physical conditions and biological communities
at multiple spatial and temporal scales (Pringle et al. 1988; Hildrew & Giller 1994). Currently,
streams are defined as hierarchically nested systems incorporating, on successively lower
levels, basin, segment, reach, riffles, pools and runs, and microhabitat units defined as patches
of relatively homogeneous substratum, water velocity and depth (Frissel et al. 1986; Kotliar &
Wiens 1990). This hierarchical organization is such that ecological processes at large scales,
create, maintain and destroy habitats, thereby setting the context for physical and biological
processes operating at smaller scales (Frissel et al. 1986; Schlosser & Angermeier 1995).
Moreover, at any spatial scale, streams can be perceived as a discontinum of discrete parts
with unique attributes that are temporally dynamic (Poole 2002).
Several studies have demonstrated the usefulness of work at the microhabitat scale in
understanding the distribution and habitat use of stream fishes (e.g., Thompson et al. 2001;
Einum et al. 2008; Petty & Grossman 2010; Donaldson et al. 2013). These studies generally
allow ecologists to study fish-microhabitat relationships as a consequence of direct

I. General introduction
5
interactions both between individuals and between individuals and physical microhabitats
(Rosenfeld 2003; Lee & Suen 2012). However, the distribution and microhabitat use of fishes
may be strongly affected by both spatial and temporal variability in physical and biological
characteristics. For instance, individuals are seldom distributed randomly over suitable
microhabitats, often showing aggregated distributions (Freeman & Grossman 1993; Torgersen
& Close 2004; Argentina et al. 2010). Non-random distributions may arise because the physical
and biological resources needed for survival and reproduction are themselves patchily
distributed over space or as a result of biological interactions (Freeman & Grossman 1993;
Einum et al. 2008; Argentina et al. 2010). Similarly, temporal patchiness in resource availability
due to variations in flow also may produce seasonal and annual shifts in the distribution and
microhabitat use by fishes (Grossman & Ratajczak 1998; Thompson et al. 2001). Moreover,
fishes have complex life histories and the importance and effects of spatial and temporal
resource variability may change during ontogeny, which is presumably related to differences
among size classes in resource utilization capabilities, energetic demands and predation risk
(Rosenberger & Angermeier 2003; Ayllón et al. 2010; Henderson & Johnston 2010). Addressing
such complex and dynamic patterns may thus require powerful and sophisticated approaches
that provide a deep understanding of the mechanistic links between fishes and their
environments.
1.3. Mechanistic approaches to microhabitat use of stream fishes
Traditionally, physical habitat is considered one of the most important factors influencing
microhabitat use by stream fishes (Grossman 2014). Nevertheless, numerous studies have
found that although fishes seldom occur in habitats with inadequate physical characteristics,
the occurrence of fishes in areas with apparently suitable physiognomy varies significantly

I. General introduction
6
(Grossman & Ratajczak 1998). For example, mottled sculpin Cottus bairdii Girard frequently
select patches with high velocities, great amounts of erosional substrata, and high substratum
stability (Grossman & Ratajczak 1998; Petty & Grossman 2007), but there are seasons in which
sculpin randomly use habitat (Grossman & Freeman 1987; Petty & Grossman 1996; Grossman
& Ratajczak 1998). This lack of microhabitat specialization represents a paradox in habitat use
by stream fishes, and suggests that 1) descriptive approaches based on correlational analyses
may be of limited use in determining the mechanisms of microhabitat use, and 2)
experimental, mechanistically based studies may be necessary to unravel the causes
underlying microhabitat use (Hill & Grossman 1993; Thompson et al. 2001; Grossman 2014).
During the last two decades, ecologists have developed new mechanistic models
quantifying microhabitat quality and use in terms of individual fitness (Hughes & Dill 1990; Hill
& Grossman 1993; Nislow et al. 1999; Grossman et al. 2002). These models are based on
optimal foraging theory and are anchored on the ideal that natural selection will favour
individuals that choose microhabitats that maximize their fitness. However, because fitness
has proved difficult to measure in fishes due to their high individual fecundities (Wootton
1990) and difficulties in marking young fish individually (Olsen & Vøllestad 2001), fitness
surrogates such as net energy intake have often been used (Hill & Grossman 1993; Piccolo et
al. 2008). It can then be examined whether individuals are behaving in concordance with the
predictions of optimal foraging theory by exploring whether they occupy microhabitats that
yield high net energy intake.
Mechanistic models based on net energy intake have demonstrated that focal point
velocity (i.e., velocity at the position of the fish; Grossman & Freeman 1987) is a critical
component of optimal habitat selection for several drift-feeding fishes, mainly salmonids
(Hughes & Dill 1990; Hill & Grossman 1993; Nislow et al. 1999; Hughes et al. 2003; Grossman
2014). Water velocity determines prey encounter rate, the probability that a fish will capture a

I. General introduction
7
prey and the swimming costs for a fish at a given position (Fausch 1984; Hill & Grossman 1993;
Hughes et al. 2003). To date, results indicate that drift foraging models are more sensitive to
changes in benefits (i.e., capture success) than they are to changes in costs (i.e., swimming
costs; Hughes & Dill 1990; Hill & Grossman 1993, but see Hughes et al. 2003 for a discussion of
prey capture costs). Consequently, most studies have focused on measuring capture success to
quantify the effect of water velocity on microhabitat use (Grossman 2014).
Emphasis on mechanistic, fitness-based, microhabitat use models represents a
significant advance over classical approaches, which focus solely on quantifying physical
habitat characteristics and comparing microhabitat availability to use (Grossman 2014).
Nevertheless, to date, fitness-based models of habitat use are still limited in geographic
context and taxonomic application and correlative habitat use models remain the dominant
approach for studying fishes distribution and abundance.
1.4. Activity patterns of stream fishes
Accounting for the behaviour of organisms may contribute for developing a better mechanistic
understanding of habitat use (Roever et al. 2014; Wirsing & Heithaus 2014). Variation in
habitat can strongly influence activity patterns of stream fishes (e.g. time spent foraging,
resting and swimming), with individuals in different microhabitats displaying variable
behaviours as they cope with distinct constraints (Baras & Nindaba 1999; David & Closs 2003;
Clavero et al. 2005; Schrandt et al. 2012). Interactions between activity and habitat are
illustrated by observations that fishes use different focal velocities and depths for feeding and
hiding (Hill & Grossman 1993; Heggenes et al. 1999; Meyer & Gregory 2000). Although activity
and habitat use may be intimately related, habitat use is often investigated without a

I. General introduction
8
behaviour context, which may limit our ability to generate more realistic process-based
microhabitat use models.
Stream fish activity has been shown to vary with intrinsic factors such as energetic
requirements, body size, condition and group size (Alanärä et al. 2001; Metcalfe & Steele 2001;
White & Warner 2007; Busch & Mehner 2012) and with extrinsic factors such as, temperature,
light intensity and food availability (Fraser & Metcalfe 1997; Metcalfe et al. 1999; Bremset
2000; Linløkken et al. 2010). Behavioural responses may, however, be extremely labile as
individual activity may be shaped differently by the specific conditions each fish experiences
(Reebs 2002; David & Closs 2003; Breau et al. 2007). However, the extent to which this
variability may be associated with habitat use by stream fishes remains uncertain.
The majority of studies on activity patterns concerns salmonids, with information on
cyprinids behaviour restricting to a few studies on the effects of season and temperature
(Lucas & Batley 1996; Greenwood & Metcalfe 1998). Cyprinids differ significantly from
salmonids in evolutionary history, ecological requirements and population dynamics (Rochet et
al. 2000). Hence, it is difficult to infer general patterns of behaviour solely from information on
salmonids, and thus studies including cyprinids are needed for a more comprehensive
understanding of the relationship between habitat use and activity in stream fishes.
Moreover, there is conflicting evidence regarding the influence of extrinsic and
intrinsic factors on salmonids activity. For example, the effect of temperature on activity may
vary, with some species allocating more time to foraging or showing faster swimming and
attach rates when temperatures increase (Weetman et al. 1998; Marchand et al. 2002;
Linløkken et al. 2010), whereas the activity of other species are not affected by temperature
(Gries et al. 1997; David & Closs 2003; Baktoft et al. 2012). Similarly, although the general
pattern is that small fish spend more time foraging than larger individuals (e.g., Metcalfe et al.
1998; Bradford & Higgins 2001), there are species in which the opposite occurs (Gries & Juanes

I. General introduction
9
1998). Factors that shape individual variability in activity patterns by fishes thus need to be
further explored, especially given the increasingly recognized importance of behavioural
information for animal conservation planning (Buchholz 2007; Bennett et al. 2013).
1.5. Fishes microhabitat use and activity in the context of
Mediterranean streams
Because of their inherent variability, Mediterranean streams are ideal systems for examining
the relationship between variation in physical habitat characteristics and distribution,
microhabitat use and activity patterns of fishes. As a result of the Mediterranean climate,
streams experience sequential, seasonally predictable events of flooding (late autumn–winter)
and drying (late summer–early autumn) that vary substantially in intensity over the years
(Gasith & Resh, 1999). In these circumstances, fishes are frequently subjected to spatial and
temporal variation in physical habitat characteristics during their lifetime, and consequently,
their distribution, microhabitat use and activity patterns may vary substantially. Moreover,
Mediterranean streams harbour many endemic fish species that are largely threatened (Smith
& Darwall 2006), and which conservation may require scientifically-based knowledge on
essential habitat and patterns of behaviour (Hermoso & Clavero 2011; Hermoso et al. 2011).
At present, there is still a dearth of data about fish responses to spatial and temporal
variation in physical microhabitat characteristics in Mediterranean streams. Several studies
analyse microhabitat use of different size/age classes in distinct seasons, but often pool data
from different rivers and/or years (Santos et al. 2004; Santos & Ferreira 2008; Martínez-Capel
et al. 2009; Santos et al. 2010), and report average patterns, largely ignoring how microhabitat
use may vary both spatially and annually (but see Grossman & de Sostoa 1994a, b).

I. General introduction
10
Moreover, microhabitat use is typically assessed using indirect methods, such as
comparisons between habitat availability and use (Santos et al. 2004; Santos & Ferreira 2008;
Martínez-Capel et al. 2009; Santos et al. 2010), with no attempt to quantify the causes
underlying microhabitat use, though mechanisms such as predation risk, competitive
interactions and prey availability are often implied (e.g., Grossman & de Sostoa 1994a, b;
Santos et al. 2004; Santos & Ferreira 2008; Boavida et al. 2011). In particular, there is a lack of
studies based on direct observations that allow data on habitat associations to be easily
collected together with data on individual or group behaviour, and mechanisms determining
microhabitat use to be quantified (Almeida & Grossman 2012).
There is considerable evidence that light intensity may influence activity patterns in
some Mediterranean stream fishes (Santos et al. 2002; Clavero et al. 2005; Santos et al. 2005;
Maia 2006; Santos et al. 2008), however, effects of other extrinsic factors such as temperature,
and intrinsic factors such as body length and shoal size are largely unknown. Typically, fishes in
temperate streams exhibit substantial flexibility in the amount of time devoted to feeding,
resting and exploring, involving rapid and reversible adaptive responses to extrinsic and
intrinsic factors (Reebs 2002; David & Closs 2003; Breau et al. 2007), that may result in
contrasting activity patterns among species and populations (Fraser et al. 1995; Valdimarsson
et al. 2000), age cohorts in the same population (Gries et al. 1997), and in the same individuals
at different conditions (Fraser et al. 1993). It may therefore be expected that species found in
Mediterranean streams, also show great flexibility in behaviour, as physical and biological
conditions can change markedly, for example, among years and across space.

I. General introduction
11
1.6. Study objectives and approach
The primary objective of this dissertation is to advance knowledge on the activity, distribution
and microhabitat use by the imperilled Mira chub Squalius torgalensis Coelho, Bogutskaya,
Rodrigues & Collares-Pereira, a species endemic to Mediterranean streams in SW Portugal.
Specifically, the study was primarily designed to clarify links between fish and physical habitat
characteristics and mechanisms underlying habitat use. In order to meet this goal three lines of
research were pursued, aiming at:
1. Describing activity patterns by quantifying the time chub spend orienting, cruising,
foraging and searching and the effects of extrinsic and intrinsic factors on these
behaviours;
2. Exploring chub spatial distribution and its relation to patchiness in physical habitat
characteristics and how these associate with microhabitat use;
3. Examining the mechanics underlying microhabitat use, by focusing on the role of
foraging success in determining individual velocity use.
In practice, the overall approach developed for this thesis involved a fieldwork
component addressing chub activity, distribution and microhabitat use in the wild and a
laboratory component aiming at exploring the functional mechanisms driving patterns of
microhabitat use. This is an innovative approach that has seldom been applied to cyprinids,
which combines visual observations of behaviour and microhabitat use with experimentally
derived foraging success-based models to provide a more realistic and accurate quantification
of microhabitat selection by chub.
Fieldwork was conducted in the Torgal stream, a tributary of the river Mira, located in
the Natural Park of the Sudoeste Alentejano e Costa Vicentina, Southwest Portugal. The Torgal

I. General introduction
12
was selected for study because is a typically Mediterranean stream, relatively undisturbed by
anthropogenic activities, maintains nearly pristine habitats (Magalhães et al. 2007), and
consequently presents an ideal setting for studying fish-habitat relationships. In addition, fish
and habitat are being surveyed in the Torgal since 1991 (Magalhães 2002; Magalhães et al.
2002a; Magalhães et al. 2002b; Magalhães et al. 2003; Magalhães et al. 2007; Pires 2012), thus
providing important ecological information that was used as basis for this research. A detailed
description of the study area and its fish assemblages is presented in Chapters 2 to 4.
Fieldwork was conducted in May 2009 and May-June 2010. Rainfall data for the region
indicated that the first year of study was extremely dry whereas the second year was normal,
and hence the Torgal was characterized by low flow conditions.
The laboratorial component was conducted at the Faculty of Sciences, University of
Lisbon, in October 2008, March-May 2009 and October-June 2010. Experiments were made in
a 2.0 x 1.0 x 0.6 m (length x width x height) fiberglass tank equipped with a 25 Kg thrust
electric trolling motor that generated flow (Zamor & Grossman 2007; Hazelton & Grossman
2009). A detailed description of the tank is presented in Chapter 4. Experiments conformed to
the Portuguese legislation regarding animal capture (ICNB), manipulation and experimentation
for scientific purposes, and IAUCUC guidelines of the University of Georgia.
Even though the approach was illustrated using a specific fish species, it may be widely
applied to other stream fishes, especially cyprinids inhabiting Mediterranean streams. The
study focused on the Mira chub (henceforth chub), which is the most abundant species in the
Torgal stream (Magalhães et al. 2007; Pires 2012), and currently listed as critically endangered
in the Portuguese Red Data Book due to habitat loss and degradation (Rogado et al. 2005). In
addition, chub exhibit life-history attributes representative of many Mediterranean cyprinids,
including small body size (maximum 16 cm, total length), early maturation (age 2 – 3 years),
and short-life span (age of 5 – 6 years) (Doadrio 2001; Magalhães et al. 2003; Vila-Gispert et al.
I. General introduction
13
2005). Moreover, they are relatively easy to distinguish from other fishes underwater
(personal observation), prey upon drifting and benthic invertebrates during the day (Chapter
2), and occupy a range of habitats throughout the life cycle, (Magalhães et al. 2002b; Pires
2012), which make them particularly suited for studies on activity and habitat use.
To date, several ecological studies on chub have focused on the role played by
environmental and spatial factors on their distribution, abundance and movements at the
reach scale (Magalhães et al. 2002a; Magalhães et al. 2002b; Magalhães et al. 2003;
Magalhães et al. 2007; Pires 2012; Pires et al. 2014). However, small scale studies addressing
the effect of habitat characteristics and their spatial heterogeneity on chub activity,
distribution and habitat use are inexistent. In addition, there is no information regarding the
functional mechanism determining chub microhabitat use, though this may be considered
crucial for developing scientific-based conservation and management actions for this
imperilled species.
1.7. Thesis organization
This thesis is organized in 5 chapters. Chapter 1 includes a general introduction that sets the
background, context and significance of the topics to be addressed, followed by a description
of the aims and approach, and organization of the thesis. Chapters 2 to 4 correspond to
scientific papers already published (2-3) or in the preparation stage (4). Chapter 5 summarizes
and discusses main results, their implications for the understanding of the habitat selection by
Mediterranean cyprinids, and highlights suggestions for further studies.
In Chapter 2 variation in daily activity patterns is analysed. The time chub spend
orienting, cruising, benthic and drift foraging and searching during the day is quantified using
instantaneous sampling of focal individuals, and variation in activity is related to extrinsic (i.e.,

I. General introduction
14
temperature and year) and intrinsic factors (body size and shoal size).The general aim is to
identify factors that influence the amount of time individuals devote to each specific activity.
Information about activity was used in planning laboratory (Chapter 4) and habitat studies
(Chapter 3 and 4), and hence, improving our ability to produce more realistic habitat use
models.
Chapter 3 examines the spatial distribution and microhabitat use of chub in two
stream reaches. Spatial variation in chub abundance is characterized and microhabitat use is
quantified based on the relationship between fish presence and abundance and physical
habitat characteristics. The general aim is to understand the effect of patchiness and
availability of physical resources on the distribution and microhabitat use and determine
essential habitat for small and large chub.
Chapter 4 combines field data on focal microhabitat use with laboratorial data on
individual foraging success, and quantifies the influence of water velocity, fish density and
length and group composition on foraging success. Overall, the aim is to elucidate the
mechanism determining microhabitat selection by chub.
Chapter 5 summarizes and integrates main results, interprets and discusses them in
the context of the complexity and dynamism of distribution and microhabitat use of
Mediterranean stream fishes, and addresses their general implications for the understanding
of the process of habitat selection by these fishes. It also highlights future studies that may be
important to advance distribution and habitat selection ecology of fishes in Mediterranean
streams and elsewhere.
In Appendix abundance of benthic and drift macroinvertebrates in study reaches, in
spring 2009 and 2010, is presented.

I. General introduction
15
1.8. References
Alanärä, A., Burns, M.D. & Metcalfe, N.B. 2001. Intraspecific resource partitioning in brown trout: the temporal distribution of foraging is determined by social rank. Journal of Animal Ecology 70: 980-986.
Almeida, D. & Grossman, G.D. 2012. Utility of direct observational methods for assessing competitive interactions between non-native and native freshwater fishes. Fisheries Management and Ecology 19: 157-166.
Argentina, J.E., Freeman, M.C. & Freeman, B.J. 2010. The response of stream fish to local and reach-scale variation in the occurrence of a benthic aquatic macrophyte. Freshwater Biology 55: 643-653.
Ayllón, D., Almodóvar, A., Nicola, G.G. & Elvira, B. 2010. Ontogenetic and spatial variations in brown trout habitat selection. Ecology of Freshwater Fish 19: 420-432.
Baktoft, H., Aarestrup, K., Berg, S., Boel, M., Jacobsen, L., Jepsen, N., Koed, A., Svendsen, J.C. & Skov, C. 2012. Seasonal and diel effects on the activity of northern pike studied by high-resolution positional telemetry. Ecology of Freshwater Fish 21: 386–394.
Baras, E. & Nindaba, J. 1999. Seasonal and diel utilisation of inshore microhabitats by larvae and juveniles of Leuciscus cephalus and Leuciscus leuciscus. Environmental Biology of Fishes 56: 183–197.
Bennett, V.A., Doerr, V.A.J., Doerr, E.D., Manning, A.D., Lindenmayer, D.B. & Yoon, H.J. 2013. Habitat selection and behaviour of a reintroduced passerine: linking experimental restoration, behaviour and habitat ecology. PLoS ONE 8: e54539.
Boavida, I., Santos, J., Cortes, R., Pinheiro, A. & Ferreira, M. 2011. Assessment of instream structures for habitat improvement for two critically endangered fish species. Aquatic Ecology 45: 113-124.
Bogosian III, V., Hellgren, E.C., Sears, M.W. & Moody, R.W. 2012. High-resolution niche models via a correlative approach: comparing and combining correlative and process-based information. Ecological Modelling 237–238: 63-73.
Boucher-Lalonde, V., Morin, A. & Currie, D.J. 2014. A consistent occupancy–climate relationship across birds and mammals of the Americas. Oikos: no-no.
Bradford, M.J. & Higgins, P.S. 2001. Habitat-, season-, and size-specific variation in diel activity patterns of juvenile chinook salmon (Oncorhynchus tshawytscha) and steelhead trout (Oncorhynchus mykiss). Canadian Journal of Fisheries and Aquatic Sciences 58: 365-374.
Breau, C., Weir, L.K. & Grant, J.W.A. 2007. Individual variability in activity patterns of juvenile Atlantic salmon (Salmo salar) in Catamaran Brook, New Brunswick. Canadian Journal of Fisheries & Aquatic Sciences 64: 486-494.
Bremset, G. 2000. Seasonal and diel changes in behaviour, microhabitat use and preferences by young pool-dwelling Atlantic Salmon, Salmo salar, and Brown Trout, Salmo trutta. Environmental Biology of Fishes 59: 163-179.

I. General introduction
16
Buchholz, R. 2007. Behavioural biology: an effective and relevant conservation tool. Trends in Ecology & Evolution 22: 401-407.
Busch, S. & Mehner, T. 2012. Size-dependent patterns of diel vertical migration: smaller fish may benefit from faster ascent. Behavioral Ecology 23: 210-217.
Cassini, M.H. 2013. Distribution ecology: from individual habitat use to species biogeographical range. New York: Springer Science + Business Media
Chapperon, C. & Seuront, L. 2011. Behavioral thermoregulation in a tropical gastropod: links to climate change scenarios. Global Change Biology 17: 1740-1749.
Chave, J. 2013. The problem of pattern and scale in ecology: what have we learned in 20 years? Ecology Letters 16: 4-16.
Clavero, M., Blanco-Garrido, F., Zamora, L. & Prenda, J. 2005. Size-related and diel variations in microhabitat use of three endangered small fishes in a Mediterranean coastal stream. Journal of Fish Biology 67: 72-85.
David, B.O. & Closs, G.P. 2003. Seasonal variation in diel activity and microhabitat use of an endemic New Zealand stream-dwelling galaxiid fish. Freshwater Biology 48: 1765-1781.
DeCesare, N.J., Hebblewhite, M., Bradley, M., Hervieux, D., Neufeld, L. & Musiani, M. 2014. Linking habitat selection and predation risk to spatial variation in survival. Journal of Animal Ecology 83: 343-352.
Doadrio, I. 2001. Atlas y libro rojo de los peces continentales de España. Madrid: Ministério del Medio Ambiente.
Donaldson, J.A., Ebner, B.C. & Fulton, C.J. 2013. Flow velocity underpins microhabitat selection by gobies of the Australian wet tropics. Freshwater Biology 58: 1038-1051.
Dormann, C.F., Schymanski, S.J., Cabral, J., Chuine, I., Graham, C., Hartig, F., Kearney, M., Morin, X., Römermann, C., Schröder, B. & Singer, A. 2012. Correlation and process in species distribution models: bridging a dichotomy. Journal of Biogeography 39: 2119-2131.
Dudgeon, D., Arthington, A.H., Gessner, M.O., Kawabata, Z.I., Knowler, D.J., Lévêque, C., Naiman, R.J., Prieur-Richard, A.H., Soto, D., Stiassny, M.L.J. & Sullivan, C.A. 2006. Freshwater biodiversity: importance, threats, status and conservation challenges. Biological Reviews 81: 163-182.
Einum, S., Nislow, K.H., McKelvey, S. & Armstrong, J.D. 2008. Nest distribution shaping within-stream variation in Atlantic salmon juvenile abundance and competition over small spatial scales. Journal of Animal Ecology 77: 167-172.
Fausch, K.D. 1984. Profitable stream positions for salmonids: relating specific growth rate to net energy gain. Canadian Journal of Zoology 62: 441-451.
Folmer, E.O., Olff, H. & Piersma, T. 2012. The spatial distribution of flocking foragers: disentangling the effects of food availability, interference and conspecific attraction by means of spatial autoregressive modeling. Oikos 121: 551-561.

I. General introduction
17
Fraser, N.H.C. & Metcalfe, N.B. 1997. The costs of becoming nocturnal: feeding efficiency in relation to light intensity in juvenile Atlantic Salmon. Functional Ecology 11: 385-391.
Fraser, N.H.C., Metcalfe, N.B., Heggenes, J. & Thorpe, J.E. 1995. Low summer temperatures cause juvenile Atlantic salmon to become nocturnal. Canadian Journal of Zoology 73: 446-451.
Fraser, N.H.C., Metcalfe, N.B. & Thorpe, J.E. 1993. Temperature-dependent switch between diurnal and nocturnal foraging in salmon. Proceedings of the Royal Society of London. Series B: Biological Sciences 252: 135-139.
Freeman, M.C. & Grossman, G.D. 1993. Effects of habitat availability on dispersion of a stream cyprinid. Environmental biology of fishes. 37: 121-130.
Frissel, C.A., Liss, W.J., Warren, C.E. & Hurley, M.D. 1986. A hierarchical framework for stream habitat classification: viewing streams in a watershed context. Environmental Management: 199-214.
Gibson, L. & Koenig, A. 2012. Neighboring groups and habitat edges modulate range use in Phayre’s leaf monkeys (Trachypithecus phayrei crepusculus). Behavioral Ecology and Sociobiology 66: 633-643.
Greenwood, M.F.D. & Metcalfe, N.B. 1998. Minnows become nocturnal at low temperatures. Journal of Fish Biology 53: 25-32.
Gries, G. & Juanes, F. 1998. Microhabitat use by juvenile Atlantic salmon (Salmo salar) sheltering during the day in summer. Canadian Journal of Zoology 76: 1441-1449.
Gries, G., Whalen, K.G., Juanes, F. & Parrish, D.L. 1997. Nocturnal activity of juvenile Atlantic salmon (Salmo salar) in late summer: evidence of diel activity partitioning. Canadian Journal of Fisheries and Aquatic Sciences 54: 1408-1413.
Grossman, G.D. 2014. Not all drift feeders are trout: a short review of fitness-based habitat selection models for fishes. Environmental Biology of Fishes 97: 465-473.
Grossman, G.D. & de Sostoa, A. 1994a. Microhabitat use by fish in the lower Rio Matarraña, Spain, 1984–1987. Ecology of Freshwater Fish 3: 123-136.
Grossman, G.D. & de Sostoa, A. 1994b. Microhabitat use by fish in the upper Rio Matarraña, Spain, 1984–1987. Ecology of Freshwater Fish 3: 141-152.
Grossman, G.D. & Freeman, M.C. 1987. Microhabitat use in a stream fish assemblage. Journal of Zoology (London): 151–176.
Grossman, G.D. & Ratajczak, R.E. 1998. Long-term patterns of microhabitat use by fish in a southern Appalachian stream from 1983 to 1992: effects of hydrologic period, season and fish length. Ecology of Freshwater Fish 7: 108-131.
Grossman, G.D., Rincon, P.A., Farr, M.D. & Ratajczak, R.E. 2002. A new optimal foraging model predicts habitat use by drift-feeding stream minnows. Ecology of Freshwater Fish 11: 2-10.
Hazelton, P.D. & Grossman, G.D. 2009. The effects of turbidity and an invasive species on foraging success of rosyside dace (Clinostomus funduloides). Freshwater Biology 54: 1977-1989.

I. General introduction
18
Heggenes, J., Baglinière, J.L. & Cunjak, R.A. 1999. Spatial niche variability for young Atlantic salmon (Salmo salar) and brown trout (S. trutta) in heterogeneous streams. Ecology of Freshwater Fish 8: 1-21.
Henderson, A.R. & Johnston, C.E. 2010. Ontogenetic habitat shifts and habitat use in an endangered minnow, Notropis mekistocholas. Ecology of Freshwater Fish 19: 87-95.
Hermoso, V. & Clavero, M. 2011. Threatening processes and conservation management of endemic freshwater fish in the Mediterranean basin: a review. Marine and Freshwater Research 62: 244-254.
Hermoso, V., Clavero, M., Blanco-Garrido, F. & Prenda, J. 2011. Invasive species and habitat degradation in Iberian streams: an analysis of their role in freshwater fish diversity loss. Ecological Applications 21: 175-188.
Hildrew, A.G. & Giller, P.S. 1994. Patchiness and species interactions and disturbance in the stream benthos. In: Giller, P.S., Hildrew, A.G. & Raffaelli, D.G., eds. Aquatic Ecology: Scale, Pattern, Process (34th Symposium of the British Ecological Society). London: Blackwell Publications, pp. 21-62.
Hill, J. & Grossman, G.D. 1993. An energetic model of microhabitat use for rainbow trout and rosyside dace. Ecology 74: 685-698.
Hughes, N.F. & Dill, L.M. 1990. Position choice by drift-feeding salmonids: model and test for Arctic grayling (Thymallus arcticus) in subarctic mountain streams, interior Alaska. Canadian Journal of Fisheries and Aquatic Sciences 47: 2039–2048.
Hughes, N.F., Hayes, J.W., Shearer, K.A. & Young, R.G. 2003. Testing a model of drift-feeding using three-dimensional videography of wild brown trout, Salmo trutta, in a New Zealand river. Canadian Journal of Fisheries & Aquatic Sciences 60: 1462-1476.
Huston, M.A. 1999. Local processes and regional patterns: appropriate scales for understanding variation in the diversity of plants and animals. Oikos 86: 393-401.
Johnson, D.H. 1980. The comparison of usage and availability measurements for evaluating resource preference. Ecology 61: 65-71.
Karlson, R.H., Connolly, S.R. & Hughes, T.P. 2011. Spatial variance in abundance and occupancy of corals across broad geographic scales. Ecology 92: 1282-1291.
Kearney, M. & Porter, W. 2009. Mechanistic niche modelling: combining physiological and spatial data to predict species’ ranges. Ecology Letters 12: 334-350.
Kearney, M. & Porter, W.P. 2004. Mapping the fundamental niche: physiology, climate, and the distribution of a nocturnal lizard. Ecology 85: 3119-3131.
Latif, Q.S., Heath, S.K. & Rotenberry, J.T. 2011. An ‘ecological trap’ for yellow warbler nest microhabitat selection. Oikos 120: 1139-1150.
Lee, P.Y. & Suen, J.P. 2012. Niche partitioning of fish assemblages in a mountain stream with frequent natural disturbances – an examination of microhabitat in riffle areas. Ecology of Freshwater Fish 21: 255-265.

I. General introduction
19
Linløkken, A.N., Bergman, E. & Greenberg, L. 2010. Effect of temperature and roach Rutilus rutilus group size on swimming speed and prey capture rate of perch Perca fluviatilis and R. rutilus. Journal of Fish Biology 76: 900-912.
Lucas, M.C. & Batley, E. 1996. Seasonal movements and behaviour of adult barbel Barbus barbus, a riverine cyprinid fish: implications for river management. Journal of Applied Ecology 33: 1345-1358.
Magalhães, M.F. 2002. Gradientes regionais, variabilidade ambiental e estrutura de comunidades piscícolas em rios de tipo mediterrânico. Phd. Lisbon: University of Lisbon.
Magalhães, M.F., Batalha, D.C. & Collares-Pereira, M.J. 2002a. Gradients in stream fish assemblages across a Mediterranean landscape: contributions of environmental factors and spatial structure. Freshwater Biology: 1015–1031.
Magalhães, M.F., Beja, P., Canas, C. & Collares-Pereira, M.J. 2002b. Functional heterogeneity of dry-season fish refugia across a Mediterranean catchment: the role of habitat and predation. Freshwater Biology 47: 1919-1934.
Magalhães, M.F., Beja, P., Schlosser, I.J. & Collares-Pereira, M.J. 2007. Effects of multi-year droughts on fish assemblages of seasonally drying Mediterranean streams. Freshwater Biology 52: 1494-1510.
Magalhães, M.F., Schlosser, I.J. & Collares-Pereira, M.J. 2003. The role of life history in the relationship between population dynamics and environmental variability in two Mediterranean stream fishes. Journal of Fish Biology 63: 300-317.
Maia, H.M.d.S. 2006. Efeito da temperatura e do período do dia no comportamento de Chondrostoma oligolepis (Pisces, Cyprinidae) em cativeiro. Master Thesis. Porto: Faculdade de Ciências da Universidade do Porto.
Manly, B.F.J., McDonald, L.L., Thomas, D.L., McDonald, D.L. & Erickson, W.P. 2002. Resource selection by animals: statistical design and analysis for field studies. Boston.
Marchand, F., Magnan, P. & Boisclair, D. 2002. Water temperature, light intensity and zooplankton density and the feeding activity of juvenile brook charr (Salvelinus fontinalis). Freshwater Biology 47: 2153-2162.
Martínez-Capel, F., García de Jalón, D., Werenitzky, D., Baeza, D. & Rodilla-Alamá, M. 2009. Microhabitat use by three endemic Iberian cyprinids in Mediterranean rivers (Tagus river basin, Spain). Fisheries Management and Ecology 16: 52-60.
Mendo, T., Lyle, J.M., Moltschaniwskyj, N.A., Tracey, S.R. & Semmens, J.M. 2014. Habitat characteristics predicting distribution and abundance patterns of scallops in D’Entrecasteaux Channel, Tasmania. PLoS ONE 9: e85895.DOI:10.1371/journal.pone.0085895.
Metcalfe, N.B., Fraser, N.H.C. & Burns, M.D. 1998. State-dependent shifts between nocturnal and diurnal activity in salmon. Proceedings of The Royal Society London. Series B: Biological Sciences 265: 1503-1507.
Metcalfe, N.B., Fraser, N.H.C. & Burns, M.D. 1999. Food availability and the nocturnal vs. diurnal foraging trade-off in juvenile salmon. Journal of Animal Ecology 68: 371-381.

I. General introduction
20
Metcalfe, N.B. & Steele, G.I. 2001. Changing nutritional status causes a shift in the balance of nocturnal to diurnal activity in European Minnows. Functional Ecology 15: 304-309.
Meyer, K.A. & Gregory, J.S. 2000. Evidence of concealment behavior by adult rainbow trout and brook trout in winter. Ecology of Freshwater Fish 9: 138-144.
Morris, D.W. & Davidson, D.L. 2000. Optimally foraging mice match patch use with habitat differences in fitness. Ecology 81: 2061-2066.
Nislow, K.H., Folt, C.L. & Parrish, D.L. 1999. Favorable foraging locations for young Atlantic salmon: application to habitat and population restoration. Ecological Applications 9: 1085-1099.
Olsen, E.M. & Vøllestad, L.A. 2001. An evaluation of visible implant elastomer for marking age-0 Brown Trout. North American Journal of Fisheries Management 21: 967-970.
Osbourn, M.S., Connette, G.M. & Semlitsch, R.D. 2014. Effects of fine-scale forest habitat quality on movement and settling decisions in juvenile pond-breeding salamanders. Ecological Applications.
Petty, J.T. & Grossman, G.D. 2007. Size-dependent territoriality of mottled sculpin in a southern Appalachian Stream. Transactions of the American Fisheries Society: 1750–1761.
Petty, J.T. & Grossman, G.D. 2010. Giving-up densities and ideal pre-emptive patch use in a predatory benthic stream fish. Freshwater Biology: 780-793.
Petty, T. & Grossman, G. 1996. Patch selection by mottled sculpin (Pisces: Cottidae) in a southern Appalachian stream. Freshwater Biology 35: 261-276.
Piccolo, J.J., Frank, B.M. & Hayes, J.W. 2014. Food and space revisited: the role of drift-feeding theory in predicting the distribution, growth, and abundance of stream salmonids. Environmental Biology of Fishes 97: 475-488.
Piccolo, J.J., Hughes, N.F. & Bryant, M.D. 2008. Development of net energy intake models for drift-feeding juvenile coho salmon and steelhead. Environmental Biology of Fishes 83: 259-267.
Pires, D.F. 2012. Fish distribution and abundance in Mediterranean streams: the role of habitat quality, spatial context, and movement patterns.Ph.D. Thesis. Lisbon: University of Lisbon.
Pires, D.F., Beja, P. & Magalhães, F.M. 2014. Out of pools: movement patterns of Mediterranean stream fish in relation to dry season refugia. River Research and Applications. DOI:10.1002/rra.2776.
Poole, G.C. 2002. Fluvial landscape ecology: addressing uniqueness within the river discontinuum. Freshwater Biology 47: 641-660.
Potts, J.R., Bastille-Rousseau, G., Murray, D.L., Schaefer, J.A. & Lewis, M.A. 2014. Predicting local and non-local effects of resources on animal space use using a mechanistic step selection model. Methods in Ecology and Evolution 5: 253-262.
Pringle, C.M., Naiman, R.J., Bretschko, G., Karr, J.R., Oswood, M.W., Jackson, R.W., Welcomme, R.L. & Winterbourn, M.J. 1988. Patch dynamics in lotic systems: the stream as a mosaic. Journal of the North American Benthological Society 7: 503-524.
I. General introduction
21
Railsback, S.F., Stauffer, H.B. & Harvey, B.C. 2003. What can habitat preference models tell us? Tests using a virtual trout population. Ecological Applications 13: 1580-1594.
Razgour, O., Korine, C. & Saltz, D. 2011. Does interspecific competition drive patterns of habitat use in desert bat communities? Oecologia 167: 493-502.
Reebs, S.G. 2002. Plasticity of diel and circadian activity rhythms in fishes. Reviews in Fish Biology and Fisheries 12: 349-371.
Rochet, M.J., André, C.P., Robert, S. & Dominique, P. 2000. Comparative analysis of phylogenetic and fishing effects in life history patterns of teleost fishes. Oikos 91: 255.
Roever, C.L., Beyer, H.L., Chase, M.J. & van Aarde, R.J. 2014. The pitfalls of ignoring behaviour when quantifying habitat selection. Diversity and Distributions 20: 322-333.
Rogado, L., Alexandrino, P.J., Almeida, P.R., Alves, M.J., Bochechas, J., Cortes, R.V., Domingos, M.I., Filipe, A.F., Madeira, J. & Magalhães, M.F. 2005. Peixes dulciaquicolas e migradores. In: Cabral, M.J., Almeida, J., Almeida, P.R., Dellinger, T., Ferrand de Almeida, N., Oliveira, M.E., Palmeirim, J.M., Queiroz, A.I., Rogado, L. & Santos-Reis, M., eds. Livro Vermelho dos Vertebrados de Portugal. Lisboa: Instituto da Conservação da Natureza.
Rosenberger, A. & Angermeier, P.L. 2003. Ontogenetic shifts in habitat use by the endangered Roanoke logperch (Percina rex). Freshwater Biology 48: 1563.
Rosenfeld, J. 2003. Assessing the habitat requirements of stream fishes: an overview and evaluation of fifferent approaches. Transactions of the American Fisheries Society 132: 953-968.
Santos, J.M. & Ferreira, M.T. 2008. Microhabitat use by endangered Iberian cyprinids nase Iberochondrostoma almacai and chub Squalius aradensis. Aquatic Sciences 70: 272-281.
Santos, J.M., Ferreira, M.T., Godinho, F.N. & Bochechas, J. 2002. Performance of fish lift recently built at the Touvedo Dam on the Lima River, Portugal. Journal of Applied Ichthyology 18: 118-123.
Santos, J.M., Ferreira, M.T., Godinho, F.N. & Bochechas, J. 2005. Efficacy of a nature-like bypass channel in a Portuguese lowland river. Journal of Applied Ichthyology 21: 381-388.
Santos, J.M., Godinho, F.N. & Ferreira, M.T. 2004. Microhabitat use by Iberian nase Chondrostoma polylepis and Iberian chub Squalius carolitertii in three small streams, north-west Portugal. Ecology of Freshwater Fish 13: 223-230.
Santos, J.M., Pinheiro, P.J., Ferreira, M.T. & Bochechas, J. 2008. Monitoring fish passes using infrared beaming: a case study in an Iberian river. Journal of Applied Ichthyology 24: 26-30.
Santos, J.M., Reino, L., Porto, M., Oliveira, J., Pinheiro, P., Almeida, P.R., Cortes, R. & Ferreira, T.M. 2010. Complex size-dependent habitat associations in potamodromous fish species. Aquatic Sciences 73: 233-245.
Schlosser, I.J. & Angermeier, P.L. 1995. Spatial variation in demographic processes of lotic fishes: conceptual models, empirical evidence, and implications for conservation. American Fisheries Society Symposium: 392-401.

I. General introduction
22
Schrandt, M.N., Hardy, K.M., Johnson, K.M. & Lema, S.C. 2012. Physical habitat and social conditions across a coral reef shape spatial patterns of intraspecific behavioral variation in a demersal fish. Marine Ecology 33: 149-164.
Shochat, E., Warren, P.S., Faeth, S.H., McIntyre, N.E. & Hope, D. 2006. From patterns to emerging processes in mechanistic urban ecology. Trends in Ecology & Evolution 21: 186-191.
Smith, K.G. & Darwall, W.R.T. 2006. The Status and distribution of freshwater fish endemic to the Mediterranean basin. Gland: IUCN – The World Conservation Union.
Strauß, A., Randrianiaina, R., Vences, M. & Glos, J. 2013. Species distribution and assembly patterns of frog larvae in rainforest streams of Madagascar. Hydrobiologia 702: 27-43.
Strickland, M.D. & McDonald, L.L. 2006. Introduction to the special section on resource selection. Journal of Wildlife Management 70: 321-323.
Thaker, M., Vanak, A.T., Owen, C.R., Ogden, M.B., Niemann, S.M. & Slotow, R. 2010. Minimizing predation risk in a landscape of multiple predators: effects on the spatial distribution of African ungulates. Ecology 92: 398-407.
Thompson, A.R., Petty, J.T. & Grossman, G.D. 2001. Multi-scale effects of resource patchiness on foraging behaviour and habitat use by longnose dace, Rhinichthys cataractae. Freshwater Biology 46: 145-160.
Torgersen, C.E. & Close, D.A. 2004. Influence of habitat heterogeneity on the distribution of larval Pacific lamprey (Lampetra tridentata) at two spatial scales. Freshwater Biology 49: 614-630.
Trainor, A.M., Schmitz, O.J., Ivan, J.S. & Shenk, T.M. 2013. Enhancing species distribution modeling by characterizing predator–prey interactions. Ecological Applications 24: 204-216.
Valdimarsson, S.K., Metcalfe, N.B. & Skúlason, S. 2000. Experimental demonstration of differences in sheltering behaviour between Icelandic populations of Atlantic salmon (Salmo salar) and Arctic char (Salvelinus alpinus). Canadian Journal of Fisheries and Aquatic Sciences 57: 719-724.
Van Beest, F.M., Mysterud, A., Loe, L.E. & Milner, J.M. 2010. Forage quantity, quality and depletion as scale-dependent mechanisms driving habitat selection of a large browsing herbivore. Journal of Animal Ecology 79: 910-922.
Vila-Gispert, A., Alcaraz, C. & García-Berthou, E. 2005. Life-history traits of invasive fish in small Mediterranean streams. Biological Invasions 7: 107-116.
Vorosmarty, C.J., McIntyre, P.B., Gessner, M.O., Dudgeon, D., Prusevich, A., Green, P., Glidden, S., Bunn, S.E., Sullivan, C.A., Liermann, C.R. & Davies, P.M. 2010. Global threats to human water security and river biodiversity. Nature 467: 555-561.
Weetman, D., Atkinson, D. & Chubb, J.C. 1998. Effects of temperature on anti-predator behaviour in the guppy, Poecilia reticulata. Animal Behaviour 55: 1361-1372.
White, J. & Warner, R. 2007. Behavioral and energetic costs of group membership in a coral reef fish. Oecologia 154: 423-433.

I. General introduction
23
Wirsing, A.J. & Heithaus, M.R. 2014. Accounting for individual behavioural variation in studies of habitat selection. Journal of Animal Ecology 83: 319-321.
Wisz, M.S., Pottier, J., Kissling, W.D., Pellissier, L., Lenoir, J., Damgaard, C.F., Dormann, C.F., Forchhammer, M.C., Grytnes, J.-A., Guisan, A., Heikkinen, R.K., Høye, T.T., Kühn, I., Luoto, M., Maiorano, L., Nilsson, M.-C., Normand, S., Öckinger, E., Schmidt, N.M., Termansen, M., Timmermann, A., Wardle, D.A., Aastrup, P. & Svenning, J.C. 2013. The role of biotic interactions in shaping distributions and realised assemblages of species: implications for species distribution modelling. Biological Reviews 88: 15-30.
Wootton, R.J. 1990. Reproduction. In: Wootton, R.J., ed. Ecology of teleost fishes. Dordrecht: Kluwer Academic Publishers.
Zamor, R.M. & Grossman, G.D. 2007. Turbidity affects foraging success of drift-feeding rosyside dace. Transactions of the American Fisheries Society 136: 167-176.


Chapter 2
Extrinsic and intrinsic factors influence daily
activity of a Mediterranean cyprinid
Martelo, J., Grossman, G.D. & Magalhães, M.F. 2013. Extrinsic and intrinsic factors influence
daily activity of a Mediterranean cyprinid. Ecology of Freshwater Fish, 22: 307-316.
2. Daily activity of a Mediterranean cyprinid
27
2. Extrinsic and intrinsic factors influence daily activity of a
Mediterranean cyprinid
2.1. Abstract
Factors shaping individual behavior remain poorly understood for European cyprinids. We
examined the effects of extrinsic (temperature and year) and intrinsic factors (body size and
shoal size) on the daily activity of chub Squalius torgalensis, a critically endangered cyprinid
found in the Torgal stream, Portugal. We quantified chub behaviors while snorkeling, using
instantaneous sampling of focal individuals, in spring 2009 and 2010. We used Principal
Component Analysis to describe individual behavior and assessed competing models relating
individual behavior to explanatory variables using Akaike’s Information Criterion. Year had a
strong influence on chub behavior, with individuals spending more time drift foraging and
orienting in 2009, whereas in 2010 they spent more time benthic foraging and cruising. Shoal
size did not influence behaviors in 2009, but in 2010 individuals in small shoals foraged
benthically and searched with greater frequency than those in large shoals. Individuals
increased cruising and decreased searching as they grew in length, but the opposite trend was
observed as temperature increased. Our results indicate that both extrinsic and intrinsic
factors influence daily activity of chub, with individual behaviors varying between years, and
depending upon shoal size, body size and temperature. This suggests that chub display high
levels of individual behavioral flexibility, which may be important for fish inhabiting harsh and
highly variable Mediterranean streams. Conservation efforts for this species will benefit by
integrating behavioral information into management strategies.

2. Daily activity of a Mediterranean cyprinid
28
2.2. Introduction
The amount of time an animal devotes to different daily activities (e.g. feeding, resting,
exploring, and courtship) may be influenced by extrinsic factors such as temperature, light
intensity, food availability and predators (Metcalfe et al. 1999; Belovsky et al. 2011; Nowicki et
al. 2012), and by intrinsic factors such as body size, sex, physical condition and group size
(Sharpe & Rosell 2003; Pelletier & Festa-Bianchet 2004; White & Warner 2007). Extrinsic and
intrinsic factors may operate independently or in concert to influence individual behavior
(Belovsky & Slade 1986; Alanärä et al. 2001; David & Closs 2003), though the nature and
strength of these influences remains poorly understood. Clarifying the factors that influence
behavior may be particularly important for endangered species for it may provide information
required for proper and effective conservation (Buchholz 2007).
Despite recent advances in the study of fish activity patterns, very little is known about
individual behaviors of non-game species, especially cyprinids. This is unfortunate because
cyprinids represent one of the most diverse taxa of freshwater fishes worldwide (Nelson 2006).
Most studies of activity patterns have focused on sport or commercially important species
such as salmonids (e.g. Fraser et al. 1993; Bradford & Higgins 2001; Breau et al. 2007; Baktoft
et al. 2012), which differ substantially from most cyprinids in life history attributes, ecological
requirements and population dynamics (Rochet et al. 2000). Consequently, it is difficult to
infer general patterns of behavior solely from information on these species. Moreover, there is
a lack of information on the factors that influence the amount of time individuals spent on any
specific activity, even for commercial fishes. Hence, there is a great need for studies that help
advance our understanding of freshwater fish behavior.
Because fishes are ectotherms, they generally become more active when
temperatures increase, either spending more time foraging or exhibiting faster swimming and

2. Daily activity of a Mediterranean cyprinid
29
attack rates (Weetman et al. 1998; Marchand et al. 2002; Linløkken et al. 2010). However, the
effects of temperature on activity may vary, with some species shifting from nocturnal to
diurnal foraging as temperatures rise (Fraser et al. 1993; Greenwood & Metcalfe 1998; Breau
et al. 2007), although many species retain fairly constant activity patterns regardless of
temperature (Gries et al. 1997; David & Closs 2003; Baktoft et al. 2012). Besides temperature,
other extrinsic factors may influence fish activity. Many streams experience strong and
unpredictable fluctuations in physical and biological conditions. Variation may occur in the
form of both seasonal and annual changes in flow as well as the frequency and intensity of
extreme events such as floods and droughts (Moyle & Vondracek 1985; Grossman & Ratajczak
1998; Lake 2000). This may cause fish activity to vary both seasonally and annually (Thompson
et al. 2001), although most studies have focused only on analyzing seasonal variation in
behaviors within a single year (e.g. Lucas & Batley 1996; Bremset 2000; David & Closs 2003;
Reeves et al. 2010).
Intrinsic factors such as body and shoal size also are important factors to include in
analyses of activity patterns of fishes. Because metabolic rates and the scope for growth
decline with increasing body size (Brett & Groves 1979), smaller individuals may spend more
time foraging than larger individuals (Bradford & Higgins 2001; Imre & Boisclair 2004; Busch &
Mehner 2012). Shoal size may influence an individual’s perception of potential competitors
(Pitcher & Parrish 1993; Grand & Dill 1999), with fish in large shoals experiencing a reduction in
food intake and typically allocating more time to foraging and searching than fish in smaller
shoals (Pitcher et al. 1982; Pitcher & Parrish 1993; White & Warner 2007; Ward 2012).
Concomitantly, because of risk dilution and collective threat detection, per capita predation
risk frequently is lower for fish in large than small shoals, and may result in less time spent in
threat-sensitive activities (Pitcher & Parrish 1993; Grand & Dill 1999; Stenberg & Persson 2005;

2. Daily activity of a Mediterranean cyprinid
30
Magnhagen & Bunnefeld 2009). Nevertheless, the manner in which body size and shoal size
interact among themselves and with other factors remains poorly understood.
Here, we examine the effects of extrinsic and intrinsic factors on the daily activity
patterns of the Mira chub Squalius torgalensis (henceforth chub) in a Mediterranean stream in
SW Portugal, in spring 2009 and 2010. The chub is a critically endangered species (Rogado et
al. 2005), and behavioral information should aid in the development of conservation strategies
for this species (Buchholz 2007). We also chose chub because it is the most abundant fish in
the study site and exhibits life-history attributes representative of many Mediterranean fishes,
i.e., small body size, fast growth, early maturation, and spring spawning (Doadrio 2001;
Magalhães et al. 2003; Vila-Gispert et al. 2005). The specific aims of our study were to: (1)
quantify daily activity patterns of individual chub, (2) determine whether these patterns varied
between years, and (3) quantify the effects of extrinsic (i.e., water temperature, year) and
intrinsic factors (i.e., body size and shoal size) on activity patterns.
2.3. Methods
Study site
Our study site was an 80 m long section in the downstream portion of the Torgal stream (SW
Portugal, 37°38’N, 8°39’W), a small, undisturbed Mediterranean stream that has been
previously described in detail in Magalhães et al. 2007). Briefly, the Torgal stream is strongly
influenced by the Mediterranean climate type characterized by cool, wet winters and hot, dry
summers (Gasith & Resh 1999). Mean monthly air temperature ranges from 11°C (December)
to 24°C (August). About 80% of annual rainfall occurs in October-March, and virtually none in

2. Daily activity of a Mediterranean cyprinid
31
the hot summer months (July-August). Although the seasonal timing of rainfall is predictable,
the total amount of rain varies considerably among years (205-1121 mm). By contrast, annual
variation in mean air temperature is relatively low (15-18°C). The flow regime is greatly
dependent on annual rainfall; headwaters are ephemeral and downstream reaches typically
dry to isolated pools and runs in summer. In dry years, there are no significant floods and
surface water persists in the deepest pools only. Conversely, in wet years there are major
floods, and flows may persist in downstream reaches through summer. The underlying
bedrock is siliceous igneous rock and the vegetation is dominated by cork oak Quercus suber
woodlands and eucalyptus Eucaliptus globulus plantations interspersed with pasture and dry
grain fields. Riparian vegetation is dominated by well developed galleries of alder Alnus
glutinosa and ash Fraxinus angustifolia, with an understory of Mediterranean scrub.
The study site encompassed a relatively shallow run (<80 cm deep), dominated by a
bedrock outcrop with a mixture of boulder, cobble and fine substrata. We choose this site
because it typically retained water over summer, which reduced potential confounding effects
of emigration/extinction and colonization processes on fish activity patterns. Chub dominated
the fish assemblage, but co-occurred with native Southwestern arched-mouth nase
Iberochondrostoma almacai (Coelho et al. 2005), Western three-spine stickleback Gasterosteus
gymnurus, Southern Iberian spined-loach Cobitis paludica and the invasive pumpkinseed
Lepomis gibbosus (Fox et al. 2007).
Environmental data and daily activity patterns
We analyzed the daily activity of individual fish in May 2009 and May-early June 2010.
October 2008 to September 2009 was the driest 12 month period on record in the Torgal

2. Daily activity of a Mediterranean cyprinid
32
stream since 1931 (205 mm), and rainfall in the following year, October 2009 to September
2010, also was substantially lower than the long-term annual median (446 versus 643 mm).
Mean air temperature in 2009 (16.7 °C ± 1.4, mean ± SE) and 2010 (17.4 °C ± 1.6) were similar
to the long term mean (1972 - present, 16.9 °C ± 0.2). Air temperature in May 2009 was 19.0
°C, identical to the long-term monthly 75% quartile (18.7 °C), and in May-early June 2010
increased to 19.5 °C, slightly below the long-term 75% quartile for those months (21.0 °C). We
obtained air temperature and rainfall data from two gauging stations located near the study
site (37°30'N, 8°24'W and 37°42'N, 8°32'W respectively).
We conducted behavioral observations using the methods of Grossman & Freeman
1987) and Grossman & Ratajczak 1998). We entered the site at its lower-most border,
snorkeling from downstream to upstream, in a zigzag fashion to minimize disturbance. Both
the substratum and the water column were scanned to locate fish, and undisturbed individuals
identified for observation. Disturbed fish were recognized by their characteristic escape
responses (i.e. fleeing and sustained darting movements). We identified each subject to
species and visually estimated their standard length (SL). Fish less than 5 cm (SL) were not
observed because they were not reliably identifiable to species. We also visually estimated the
number of individuals in each shoal and identified them to species. A shoal was defined as
individuals that were within approximately four body lengths of each other (Pitcher & Parrish
1993). We divided the study site in three equal sections and observed one section per day, for
1.5h, at dawn (07:02h ± 00:00 to 08:34h ± 00:01, mean ± SE), mid-day (12:16h ± 00:01 to
13:56h ± 00:01) and dusk (18:35h ± 00:00 to 20:02h ± 00:01). We selected these observation
times to cover a broad range of water temperatures, but restricted observations to day light
hours because chub appeared quiescent at night (Martelo et al., personal observations).
Efforts were made to not resample the same individuals by observing less than 50% of the

2. Daily activity of a Mediterranean cyprinid
33
total during a sampling period. Hence, although it is possible that some chub were observed
more than once during a sampling period, the majority of observations are likely independent.
We measured temperature at the water surface every 20 min during observations, using a HI
198129 probe (Hanna Instruments, Woonsocket, RI, USA).
We used instantaneous sampling (Altmann 1974) to record the behavior of individual
fish, every 30 sec for 3 min. Observational times were recorded by an assistant. We made
observations until we lost sight of a fish and only analyzed data that included at least three
minutes of continuous observations (84 % of all observations). During observations we
recorded the following specific behaviors: (1) orienting (holding in the current or towards a
shelter, e.g. tree roots, branches), (2) cruising (swimming movements not oriented towards an
object or food), (3) benthic foraging (feeding on tree roots, branches, boulders, cobbles or
submerged macrophytes), (4) drift foraging (feeding on organisms carried by the current), (5)
searching (approaching and orienting towards an object in search for food), and (6) other,
which included non-oriented holding (generally holding position but not oriented towards the
current or shelter) and agitated (short abrupt movements typical of fright, caused by the
observer, other fishes or the invasive red swamp crayfish Procambarus clarkii).
Statistical analyses
Our statistical approach focused on explaining variation in daily activity patterns for individual
chub by creating a suite of explanatory models that included both extrinsic (water
temperature and year) and intrinsic (fish size and shoal size) explanatory variables. Year was
coded as a dummy independent variable. Although shoal size may be influenced by extrinsic
factors, we classified it as intrinsic for it also may integrate intrinsic factors, such as social

2. Daily activity of a Mediterranean cyprinid
34
interactions or behavioral motivations that may depend on individual properties (Flierl et al.
1999). Shoal size included solitary individuals, and when mixed-species shoals were observed
(74% of shoals), it was determined by the number of chub in the shoals. Mixed-species shoals
were always composed of more than 50% of chub, with one exception, in which chub
comprised 30% of the individuals in the shoal. We used the total number of times that each
individual performed a given behavior during a 3 minute observation period to derive our
response variables.
Prior to analyses, both explanatory variables and counts of behavioral acts were log
transformed for normality and to reduce kurtosis (Legendre & Legendre 1998). We calculated
pairwise correlation coefficients between explanatory variables to identify multicollinearity.
Analyses were conducted in the R 2.14.1 software using MuMIn (Barton 2011) and STATISTICA
10.0 with significance at P < 0.05. We found no evidence of strong correlations between
explanatory variables (Pearson’s r ≤ |0.30|), thus all were retained in analyses. We tested for
significant differences in explanatory variables between years using Mann-Whitney and
Fisher’s F tests on the mean and variance of each variable, respectively (Zar 1996). To quantify
variation in chub activity patterns we conducted a Principal Components Analysis (PCA) on the
counts of behavioral acts, pooling 2009 and 2010 data. We used PCA because several
behaviors were significantly correlated and PCA is designed to handle intercorrelated data
(Grossman et al. 1991; Legendre & Legendre 1998). To avoid unstable ordination results and
spurious patterns, we excluded behaviors representing less than 5 % of the total from
analyses, and the only category that this represented was other behaviors (Legendre &
Legendre 1998). Following Grossman & de Sostoa 1994a, b) we tested the null hypothesis that
activity patterns did not differ between 2009 and 2010 by calculating mean component scores
and 95% confidence ellipses for these years. A lack of overlap of the 95% confidence ellipses

2. Daily activity of a Mediterranean cyprinid
35
demonstrated significance at the 0.05 level (Grossman & de Sostoa 1994a, b). We tested for
significant differences in activity patterns between years to decide whether year should be
included as an explanatory variable in our modeling exercise.
We then developed 13 a priori, mechanistic regression models including extrinsic and
intrinsic explanatory variables (Table 1) to explain variation in activity patterns based on PCA
scores, using generalized linear models with a normal error distribution (Crawley 2007). All
explanatory variables were treated as fixed effects. Even though year may be considered a
random effect conceptually, pragmatically we must treat it as a fixed effect because we only
had two treatment levels (2009 and 2010), which would lead to imprecise estimates of
variance (Douglas Bates, personal communication). The set of candidate models included four
models evaluating the individual effects of temperature, year, fish size and shoal size. The set
also included additive models to describe the combined effects of pairs of the extrinsic and
intrinsic variables. In addition, two-way interaction terms were included in some models to
account for possible differences in responses based on fish size and shoal size due to
temperature and year effects (e.g. shoal size x temperature or shoal size x year). Finally, a
global model with all main effects and interactions, and a null model including the intercept
only were evaluated.
We used an information-theoretic approach as a model selection procedure, whereby
the plausibility of each candidate model was assessed using Akaike Information Criteria
adjusted for small sample sizes (AICc; Burnham & Anderson 2002). We assessed the relative
performance of candidate models using ΔAICcs and Akaike weights (wi). Akaike weights
quantify the amount of information lost in the original data through use of a given model
(Burnham & Anderson 2002). We only interpreted models with Akaike weights >10% of the
model with the best fit (Burnham & Anderson 2002; Grossman et al. 2006). To quantify model

2. Daily activity of a Mediterranean cyprinid
36
selection uncertainty, we calculated model-averaged coefficient estimates and evaluated the
precision of these estimates using 85 % confidence intervals (Arnold 2010). Estimates whose
confidence intervals included zero were viewed as having lower explanatory power. Finally,
we estimated the relative importance of explanatory variables by summing their Akaike
weights over all interpretable models where the variable was included (Burnham & Anderson
2002).
Table 1 - A priori mechanistic explanatory models relating daily activity patterns of chub to extrinsic and
intrinsic factors.
Hypothesis Model
Activity pattern is explained by changes in temperature y=temperature
Activity pattern is explained by year y=year
Activity pattern is explained by changes in fish size y=fish size
Activity pattern is explained by changes in shoal size y=shoal size
Activity pattern is explained by changes in extrinsic variables y=temperature+year
Activity pattern is explained by changes in intrinsic variables y=fish size+shoal size
Activity pattern is explained by changes in extrinsic and intrinsic variables y= temperature+year+
fish size+shoal size
Activity pattern is explained by temperature and changes with fish size y=temperature+fish size+
temperaturexfish size
Activity pattern is explained by temperature and changes with shoal size y=temperature+shoal size+
temperaturexshoal size
Activity pattern is explained by year and changes with fish size y=year+fish size+yearx
fish size
Activity pattern is explained by year and changes with shoal size y=year+shoal size+yearx
shoal size
Activity pattern is explained by to all main factors and interactions
Activity pattern is independent of extrinsic and intrinsic variables

2. Daily activity of a Mediterranean cyprinid
37
2.4. Results
Daily activity patterns
We obtained activity data for 231 chub, 120 in 2009 and 111 in 2010, with an average of 40
(SD = 5) and 37 (SD = 5) individuals per observation period in 2009 and 2010, respectively.
During the day chub allocated their time to a variety of behaviors, although foraging behaviors
were most common. Individuals spent half of the time foraging, either on benthic (27%) or
drifting (23%) organisms, but also often oriented towards the current or shelter (21%). Cruising
(16%) and searching for food (11%) were less frequent, whereas other behaviors were rare
(2%).
Both explanatory variables and activity patterns differed significantly between 2009
and 2010. Temperature was lower, and both fish size and shoal size were larger and more
variable in 2009 than in 2010 (Table 2). The PCA identified three behavioral patterns with
eigenvalues >1, however, we only interpreted the first (PC1) and second (PC2) components
because they explained most of the variation in the data, 39 and 26% respectively, whereas
the third component (PC3) explained 20% and added little new information. Principal
component 1 contrasted drift foraging and orienting from benthic foraging and searching, and
PC2 discriminated cruising from searching (Fig. 1a). PC1 scores indicated that chub drift
foraged and oriented more and benthic foraged and searched less in 2009 than in 2010,
whereas PC2 scores underlined that in 2009 chub tended to display more searching and less
cruising than in 2010 (Fig. 1a).

2. Daily activity of a Mediterranean cyprinid
38
Table 2 – Variation in temperature, fish size and shoal size in 2009 and 2010; values are the mean ± SD
and the range (minimum–maximum). Statistical significance calculated via Mann-Whitney (U) and
Fisher’s F tests (F).
2009
2010
Mean Range Mean Range U F1,229
Temperature 14.9 ± 1.0 13.4-15.7
16.6 ± 0.8 15.5 - 17.5 1634.00 **** 1.73 **
Fish size 6.3 ± 1.2 5.0-9.0
5.6 ± 0.8 5.0-8.0 4533.00 **** 1.81 **
Shoal size 18.8 ± 12.8 1.0-45.0 4.9 ± 3.1 1.0-13.0 1996.50 **** 1.58 *
*P< 0.05; **P< 0.01; ***P< 0.001;****P< 0.0001
Extrinsic and intrinsic influences on behaviour
Variation in activity patterns for chub was affected by both extrinsic and intrinsic factors. The
analysis revealed two interpretable models for PC1; the model with the greatest explanatory
power included year, shoal size, and the year x shoal size interaction (AICC = 624.69, wi = 0.78),
whereas the second included temperature, shoal size and their interaction (AICC = 627.49,
ΔAICC = 2.80, wi = 0.19) and was 4.1 times less likely to be true given the data, than the best
model. There were variations in the relative importance of extrinsic and intrinsic variables in
explaining activity patterns data for chub (Table 3). There was strong support (wi = 0.80) for
chub to spend more time benthic foraging and searching than drift foraging and orienting in
2010. In addition, there was strong support (wi = 1.00) for individuals in small shoals to spend
more time benthic foraging and searching and less time drift foraging and orienting than those
in large shoals (Table 3). However, shoal size had a model-averaged coefficient estimate that
overlapped zero, and consequently this result should be interpreted with caution. The effect
of shoal size varied strongly with year (year x shoal size, wi = 0.80), and less time was allocated

2. Daily activity of a Mediterranean cyprinid
39
to benthic foraging and searching as shoal size increased in 2010, however this pattern was not
present in 2009 (Fig. 1b). Finally, there was weak support for the effects of temperature (wi =
0.20) and the temperature x shoal size interaction (wi = 0.20), indicating a tendency for benthic
foraging and searching to increase slightly with temperature, but only when shoals were small
(Fig. 1c). This effect was evident only when temperature was above 14 °C, and was strongest
at 18 °C (Fig. 1c).
Table 3 - Model averaged parameter estimates, 85% confidence intervals, and Akaike weights for
parameters in interpretable models explaining variation in daily activity patterns of chub in 2009 and
2010. Year was coded as 1 in 2009 and 0 in 2010. See figure 1a for results of behavioral PCA.
PC1
PC2
85% CI
85% CI
Parameter Estimate Lower Upper wi Estimate Lower Upper wi
Year -1.31 -1.8 -0.81 0.8
-0.86 -1.18 -0.54 1
Temperature 6.05 3.29 8.81 0.2
-3.58 -5.13 -2.04 1
Shoal size 0.62† -3.12 4.37 1
0.07† -0.05 0.19 0.8
Fish size
0.96 0.39 1.54 0.8
Temperature x shoal size -2 -3.3 -0.7 0.2
Year x shoal size 0.51 0.27 0.74 0.8
† A lower confidence parameter (85% confidence intervals, CI, include zero).

2. Daily activity of a Mediterranean cyprinid
40
Results for PC2 scores were similar to those for PC1, with two interpretable models
also differing about 4.0 times in explanatory evidence given the data. The best model included
the additive effects of temperature, year, fish size and shoal size (AICC = 643.45, wi = 0.77),
whereas the second best model included temperature and year (AICC = 646.23, ΔAICC = 2.78, wi
= 0.19). All variables had strongly supported associations with PC2 scores (wi > 0.80, Table 3).
In 2010, and as fish size increased and temperature decreased, chub cruised more and
searched less. Individuals in larger shoals also cruised more and searched less than those in
small shoals, though the model-averaged coefficient estimate for shoal size overlapped zero
and needs to be interpreted with careful.

2. Daily activity of a Mediterranean cyprinid
41
Fig. 1. Ordination diagram of
Principal Component Analysis (PCA) of
behavioral data for chub, in 2009 and
2010 (a), and generalized linear
model fits of relationships between
PC1 scores and shoal size, for 2009
and 2010 (b), and for water
temperatures (°C) observed during
the study (c). The ordination diagram
(a) presents 95% confidence ellipses.
Behaviors with loadings ≥0.40 are
indicated for each axis.

42
2.5. Discussion
Our results demonstrate that daily activity patterns of chub in the Torgal stream varied on
both an individual and annual basis and that both extrinsic and intrinsic factors and their
interactions affected the behavior of this species. In 2009, chub allocated more time to drift
foraging and orienting towards the current and shelter whereas in 2010 chub spent more time
benthic foraging and cruising. Behavioral differences also were related to shoal size in 2010,
with smaller shoals allocating more time to benthic foraging and searching. In addition, we
observed that chub spent more time cruising and less time searching when temperatures were
lower and chub length was greater. Overall, our results suggest that activity patterns of chub
are flexible at an individual level, which may be of particular adaptive value in highly
heterogeneous Mediterranean streams.
Cyprinidae is the most diverse family of fishes, having an almost worldwide
distribution, with many ecologically important species(Nelson 2006). Despite these facts, very
few studies have examined the daily activity patterns of cyprinids. To our knowledge, this
study is one of the first to quantify the effects of extrinsic and intrinsic factors on activity
patterns of European cyprinids in natural habitats, and provides important ecological
information that may be useful to develop conservation plans for highly endangered
Mediterranean species. Our findings add to a body of evidence that activity patterns of fishes
are likely to be influenced by complex interactions of both extrinsic and intrinsic factors that
act at an individual level (Greenwood & Metcalfe 1998; Metcalfe et al. 1999; Ovidio et al. 2002;
David & Closs 2003).
Although our study provides valuable empirical evidence on activity patterns for a
cyprinid in the wild, our results were potentially affected by several factors. For example, data
collection occurred in a single site and season (spring) although we did observe chub in two

2. Daily activity of a Mediterranean cyprinid
43
years. Observations in other seasons were not possible due to high flows and turbidities
(Martelo et al. personal observations). In addition, during the two years of observations
conditions were dry, and thus our results may not be completely relevant to wet or perhaps
average water years (Magalhães et al. 2007). Even though inter-annual variability in activity
patterns was evident, it might have been greater if behavioral data also had been collected in
wet years, because variation in flow may affect fish movement and foraging behavior (Petty &
Grossman 2004; Kemp et al. 2006). Furthermore, we excluded fish less than 5 cm (SL) from
analysis, which may have weakened the association between fish size and activity patterns.
However, this was unavoidable because we could not identify small fish to species underwater.
Finally, we never observed reproductive behaviors, probably because sampling occurred at the
end of the spawning season (see Magalhães et al. 2003); consequently, it is unlikely that our
results were influenced by reproduction processes.
Chub displayed variable behaviors between years, which may have been affected by
differences in food availability. Chub allocated more time to drift foraging in 2009 and largely
shifted to benthic foraging in 2010. The abundance of drifting macroinvertebrates declined in
2010 in the study site, whereas the abundance of benthic organisms remained very similar
between years (Martelo et al., unpublished data). Variations in prey availability produce
changes in foraging modes for several species (e.g. Nakano et al. 1999; Katano 2011), and also
affect the diet of many Mediterranean cyprinids (e.g. Magalhães 1993; Gomes-Ferreira et al.
2005). Nonetheless, it also is possible that random processes played a role in the differences
observed between 2009 and 2010.
Chub spent more time feeding on and searching for benthic organisms when in small
groups than in large groups in 2010. This suggests that intraspecific interactions may affect
activity patterns of this species (Pitcher & Parrish 1993; Grand & Dill 1999). It is curious,
however, that shoal size did not affect activity patterns in 2009, when shoals showed greater

2. Daily activity of a Mediterranean cyprinid
44
variation in size. Reduced in shoal size in 2010 was apparently related to the decrease in
abundance of small adults (Martelo et al., unpublished data), which probably reflected the
influence of the severe drought in 2009 (Magalhães et al 2007).
Temperature also influenced the activity patterns of chub, probably through its effect
on metabolism. It is likely that increased temperatures resulted in an increase in the metabolic
rate of chub and hence they spent more time searching for prey and less time cruising. These
results are concordant with previous studies of fish activity patterns that demonstrate a
relationship between diel activities and water temperature (Fraser et al. 1993; Greenwood &
Metcalfe 1998; Bremset 2000), however, few of these studies examined foraging behaviors in
the field. In laboratory studies, search, capture rate and swimming characteristics (i.e., speed
and angle of turn) may be positively related to temperature (Persson 1986; Marchand et al.
2002; Linløkken et al. 2010). Despite the strongly supported effect of temperature on
searching behavior, its effect on foraging was weak, which may have been related to the low
range of temperature values observed during the study.
Smaller individuals spent more time searching for prey and less time cruising than
larger individuals. It is possible that this occurred because individuals with smaller body sizes
have higher energetic demands than larger members of the same species (Brett & Groves
1979). Another potential explanation for these differences is that intraspecific competition
between small and large adults limited small adult access to high-quality prey, forcing them to
spend more time searching for food. The influence of intraspecific competition on daily activity
and habitat use has been documented in studies of salmonids (Hughes & Dill 1990; Nakano
1995; Alanärä et al. 2001) cyprinids (Hazelton & Grossman 2009b) and cottids (Petty &
Grossman 2007), and on foraging success in cyprinids (Hazelton & Grossman 2009a).
Nonetheless, small and large chub occurred in the same shoal without intraspecific aggression.

2. Daily activity of a Mediterranean cyprinid
45
In addition, small and large chub occupy similar habitat patches and changes in abundance did
not affect habitat use in this system (Martelo et al., unpublished data).
Little is known about the behavior of European cyprinids, especially members of the
widespread genus Squalius. Extant studies focus on patterns of movement, habitat use and
feeding, and, in accordance with our findings, have shown that individual behavior can be
highly variable and affected by multiple factors, including temperature and fish size. Changes
in habitat use in relation to temperature may include increasing use of shallow or low-velocity
habitats in periods of high temperatures (Santos et al. 2004; Santos & Ferreira 2008), and use
of vegetation as shelters as temperatures drop (Baras & Nindaba 1999). Size-related
differences in habitat use may be small (Martelo et al. unpublished data), or, substantial, with
larger individuals generally associating with deep, high velocity habitats with little cover
(Grossman & de Sostoa 1994a, b; Santos et al. 2004; Santos & Ferreira 2008). Movements may
increase with both temperature (Santos et al. 2002, 2005) and fish size (Pires 2012). Finally,
size-related shifts in feeding behavior also have been reported, with larger fish preying on a
higher percentage of hard-shelled prey than smaller fish with a concomitant decrease in
dietary breadth (Magalhães 1993). Although temperature and fish size seem to influence the
behavior of Squalius spp., the effects of annual environmental variation and shoal size
variation require further study.
Daily activity patterns of chub were affected by both extrinsic and intrinsic factors,
individual behaviors varied between years, and were dependent on shoal size, body size and
temperature. Similar to other fish species (e.g. Reebs 2002; David & Closs 2003; Breau et al.
2007), activity was variable at an individual level indicating that the behavior of chub display
substantial behavioral flexibility. This likely is of adaptive value given that Mediterranean
streams are highly variable and heterogeneous. Despite this flexibility, given their rarity it is
possible that chub will be vulnerable to the long and intense droughts (Magalhães et al. 2007),

2. Daily activity of a Mediterranean cyprinid
46
predicted for the Mediterranean region by climate change models (Santos & Miranda 2006). In
conclusion, our results suggest that conservation and management efforts for chub should
include the maintenance of natural temperature and flow regimes and continued evaluation of
environmental change on shoal and fish size distributions. Moreover, given that behavioral
studies are increasingly recognized as important in species conservation (Buchholz 2007), a
better understanding of the factors influencing the behavior of chub is needed. We believe
that our results provide one of the first efforts to remedy this shortcoming.
2.6. References
Alanärä, A., Burns, M.D. & Metcalfe, N.B. 2001. Intraspecific resource partitioning in brown trout: the temporal distribution of foraging is determined by social rank. Journal of Animal Ecology 70: 980-986.
Altmann, J. 1974. Observational study of behavior: sampling methods. Behaviour: 227–267.
Arnold, T.W. 2010. Uninformative parameters and model selection using Akaike's Information Criterion. The Journal of Wildlife Management 74: 1175-1178.
Baktoft, H., Aarestrup, K., Berg, S., Boel, M., Jacobsen, L., Jepsen, N., Koed, A., Svendsen, J.C. & Skov, C. 2012. Seasonal and diel effects on the activity of northern pike studied by high-resolution positional telemetry. Ecology of Freshwater Fish 21: 386–394.
Baras, E. & Nindaba, J. 1999. Seasonal and diel utilisation of inshore microhabitats by larvae and juveniles of Leuciscus cephalus and Leuciscus leuciscus. Environmental Biology of Fishes 56: 183–197.
Barton, K. 2011. MuMIn: Multi-model inference. R package version 1.6.5. http://cran.r-project.org/web/packages/MuMIn/index.html.
Belovsky, G.E., Laws, A.N. & Slade, J.B. 2011. Prey change behaviour with predation threat, but demographic effects vary with prey density: experiments with grasshoppers and birds. Ecology Letters 14: 335-340.
Belovsky, G.E. & Slade, J.B. 1986. Time budgets of grassland herbivores: body size similarities. Oecologia 70: 53-62.
Bradford, M.J. & Higgins, P.S. 2001. Habitat-, season-, and size-specific variation in diel activity patterns of juvenile chinook salmon (Oncorhynchus tshawytscha) and steelhead trout (Oncorhynchus mykiss). Canadian Journal of Fisheries and Aquatic Sciences 58: 365-374.
2. Daily activity of a Mediterranean cyprinid
47
Breau, C., Weir, L.K. & Grant, J.W.A. 2007. Individual variability in activity patterns of juvenile Atlantic salmon (Salmo salar) in Catamaran Brook, New Brunswick. Canadian Journal of Fisheries & Aquatic Sciences 64: 486-494.
Bremset, G. 2000. Seasonal and diel changes in behaviour, microhabitat use and preferences by young pool-dwelling Atlantic Salmon, Salmo salar, and Brown Trout, Salmo trutta. Environmental Biology of Fishes 59: 163-179.
Brett, J.R. & Groves, T.D.D. 1979. Physiological energenetics. In: Hoar, W.S., Randall, D.J. & Brett, J.R., eds. Fish physiology. London: Academic Press, pp. 279–352.
Buchholz, R. 2007. Behavioural biology: an effective and relevant conservation tool. Trends in Ecology & Evolution 22: 401-407.
Burnham, K.P. & Anderson, D.R. 2002. Model selection and multimodel inference: a practical information-theoretic approach. New York: Springer Scientific.
Busch, S. & Mehner, T. 2012. Size-dependent patterns of diel vertical migration: smaller fish may benefit from faster ascent. Behavioral Ecology 23: 210-217.
Coelho, M.M., Mesquita, N. & Collares-Pereira, M.J. 2005. Chondrostoma almacai, a new cyprinid species from the southwest of Portugal, Iberian Peninsula. Folia Zoologica 54: 201-212.
Crawley , M.J. 2007. The R Book. New York: John Wiley.
David, B.O. & Closs, G.P. 2003. Seasonal variation in diel activity and microhabitat use of an endemic New Zealand stream-dwelling galaxiid fish. Freshwater Biology 48: 1765-1781.
Doadrio, I. 2001. Atlas y libro rojo de los peces continentales de España. Madrid: Ministério del Medio Ambiente.
Flierl, G., Grünbaum, D., Levins, S. & Olson, D. 1999. From Individuals to Aggregations: the Interplay between Behavior and Physics. Journal of Theoretical Biology 196: 397-454.
Fox, M.G., Vila-Gispert, A. & Copp, G.H. 2007. Life-history traits of introduced Iberian pumpkinseed Lepomis gibbosus relative to native populations. Can differences explain colonization success? Journal of Fish Biology 71: 56-69.
Fraser, N.H.C., Metcalfe, N.B. & Thorpe, J.E. 1993. Temperature-dependent switch between diurnal and nocturnal foraging in salmon. Proceedings of the Royal Society of London. Series B: Biological Sciences 252: 135-139.
Gasith, A. & Resh, V.H. 1999. Streams in Mediterranean climate regions: abiotic influences and biotic responses to predictable seasonal events. Annual Review of Ecology and Systematics: 51-81.
Gomes-Ferreira, A., Ribeiro, F., Moreira da Costa, L., Cowx, I.G. & Collares-Pereira, M.J. 2005. Variability in diet and foraging behaviour between sexes and ploidy forms of the hybridogenetic Squalius alburnoides complex (Cyprinidae) in the Guadiana River basin, Portugal. Journal of Fish Biology 66: 454-467.
Grand, T.C. & Dill, L.M. 1999. The effect of group size on the foraging behaviour of juvenile coho salmon: reduction of predation risk or increased competition? Animal Behaviour 58: 443-451.

2. Daily activity of a Mediterranean cyprinid
48
Greenwood, M.F.D. & Metcalfe, N.B. 1998. Minnows become nocturnal at low temperatures. Journal of Fish Biology 53: 25-32.
Gries, G., Whalen, K.G., Juanes, F. & Parrish, D.L. 1997. Nocturnal activity of juvenile Atlantic salmon (Salmo salar) in late summer: evidence of diel activity partitioning. Canadian Journal of Fisheries and Aquatic Sciences 54: 1408-1413.
Grossman, G.D. & de Sostoa, A. 1994a. Microhabitat use by fish in the lower Rio Matarraña, Spain, 1984–1987. Ecology of Freshwater Fish 3: 123-136.
Grossman, G.D. & de Sostoa, A. 1994b. Microhabitat use by fish in the upper Rio Matarraña, Spain, 1984–1987. Ecology of Freshwater Fish 3: 141-152.
Grossman, G.D. & Freeman, M.C. 1987. Microhabitat use in a stream fish assemblage. Journal of Zoology (London): 151–176.
Grossman, G.D., Nickerson, D.M. & Freeman, M.C. 1991. Principal component analyses of assemblage structure data: utility of tests based on eigenvalues. Ecology 72: 341-347.
Grossman, G.D., Ratajczak Jr, R.E., Petty, J.T., Hunter, M.D., Peterson, J.T. & Grenouillet, G. 2006. Population dynamics of mottled sculpin (pisces) in variable environment: information theoretic approaches. Ecological Monographs 76: 217-234.
Grossman, G.D. & Ratajczak, R.E. 1998. Long-term patterns of microhabitat use by fish in a southern Appalachian stream from 1983 to 1992: effects of hydrologic period, season and fish length. Ecology of Freshwater Fish 7: 108-131.
Hazelton, P.D. & Grossman, G.D. 2009a. The effects of turbidity and an invasive species on foraging success of rosyside dace (Clinostomus funduloides). Freshwater Biology 54: 1977-1989.
Hazelton, P.D. & Grossman, G.D. 2009b. Turbidity, velocity and interspecific interactions affect foraging behaviour of rosyside dace (Clinostomus funduloides) and yellowfin shiners (Notropis lutippinis). Ecology of Freshwater Fish 18: 427-436.
Hughes, N.F. & Dill, L.M. 1990. Position choice by drift-feeding salmonids: model and test for Arctic grayling (Thymallus arcticus) in subarctic mountain streams, interior Alaska. Canadian Journal of Fisheries and Aquatic Sciences 47: 2039–2048.
Imre, I. & Boisclair, D. 2004. Age effects on diel activity patterns of juvenile Atlantic salmon: parr are more nocturnal than young-of-the-year. Journal of Fish Biology 64: 1731-1736.
Katano, O. 2011. Effects of individual differences in foraging of pale chub on algal biomass through trophic cascades. Environmental Biology of Fishes 92: 101-112.
Kemp, P.S., Gilvear, D.J. & Armstrong, J.D. 2006. Variation in performance reveals discharge-related energy costs for foraging Atlantic salmon (Salmo salar) parr. Ecology of Freshwater Fish 15: 565-571.
Lake, P.S. 2000. Disturbance, patchiness, and diversity in streams. Journal of the North American Benthological Society 19: 573-592.
Legendre, P. & Legendre, L. 1998. Numerical Ecology. Amsterdam: Elsevier.

2. Daily activity of a Mediterranean cyprinid
49
Linløkken, A.N., Bergman, E. & Greenberg, L. 2010. Effect of temperature and roach Rutilus rutilus group size on swimming speed and prey capture rate of perch Perca fluviatilis and R. rutilus. Journal of Fish Biology 76: 900-912.
Lucas, M.C. & Batley, E. 1996. Seasonal movements and behaviour of adult barbel Barbus barbus, a riverine cyprinid fish: implications for river management. Journal of Applied Ecology 33: 1345-1358.
Magalhães, M.F. 1993. Effects of season and body-size on the distribution and diet of the Iberian chub Leuciscus pyrenaicus in a lowland catchment. Journal of Fish Biology 42: 875-888.
Magalhães, M.F., Beja, P., Schlosser, I.J. & Collares-Pereira, M.J. 2007. Effects of multi-year droughts on fish assemblages of seasonally drying Mediterranean streams. Freshwater Biology 52: 1494-1510.
Magalhães, M.F., Schlosser, I.J. & Collares-Pereira, M.J. 2003. The role of life history in the relationship between population dynamics and environmental variability in two Mediterranean stream fishes. Journal of Fish Biology 63: 300-317.
Magnhagen, C. & Bunnefeld, N. 2009. Express your personality or go along with the group: what determines the behaviour of shoaling perch? Proceedings of the Royal Society. Series B: Biological Sciences 276: 3369-3375.
Marchand, F., Magnan, P. & Boisclair, D. 2002. Water temperature, light intensity and zooplankton density and the feeding activity of juvenile brook charr (Salvelinus fontinalis). Freshwater Biology 47: 2153-2162.
Metcalfe, N.B., Fraser, N.H.C. & Burns, M.D. 1999. Food availability and the nocturnal vs. diurnal foraging trade-off in juvenile salmon. Journal of Animal Ecology 68: 371-381.
Moyle, P.B. & Vondracek, B. 1985. Persistence and structure of the fish assemblage in a small California stream. Ecology 66: 1-13.
Nakano, S. 1995. Individual differences in resource use, growth and emigration under the influence of a dominance hierarchy in fluvial Red-Spotted Masu salmon in a natural habitat. Journal of Animal Ecology 64: 75-84.
Nakano, S., Fausch, K.D. & Kitano, S. 1999. Flexible niche partitioning via a foraging mode shift: a proposed mechanism for coexistence in stream-dwelling charrs. Journal of Animal Ecology 68: 1079-1092.
Nelson, J.S. 2006. Fishes of the World. New Jersey: John Wiley & Sons, Inc.
Nowicki, J.P., Miller, G.M. & Munday, P.L. 2012. Interactive effects of elevated temperature and CO2 on foraging behavior of juvenile coral reef fish. Journal of Experimental Marine Biology and Ecology 412: 46-51.
Ovidio, M., Baras, E., Goffaux, D., Giroux, F. & Philippart, J.C. 2002. Seasonal variations of activity pattern of brown trout (Salmo trutta) in a small stream, as determined by radio-telemetry. Hydrobiologia 470: 195-202.
Pelletier, F. & Festa-Bianchet, M. 2004. Effects of body mass, age, dominance and parasite load on foraging time of Bighorn rams, Ovis canadensis. Behavioral Ecology and Sociobiology 56: 546-551.

2. Daily activity of a Mediterranean cyprinid
50
Persson, L. 1986. Temperature-induced shift in foraging ability in two fish species, roach (Rutilus rutilus) and perch (Perca fluviatilis): implications for coexistence between poikilotherms. Journal of Animal Ecology 55: 829-839.
Petty, J.T. & Grossman, G.D. 2004. Restricted movement by mottled sculpin (pisces: cottidae) in a southern Appalachian stream. Freshwater Biology 49: 631-645.
Petty, J.T. & Grossman, G.D. 2007. Size-dependent territoriality of mottled sculpin in a southern Appalachian Stream. Transactions of the American Fisheries Society: 1750–1761.
Pires, D.F. 2012. Fish distribution and abundance in Mediterranean streams: the role of habitat quality, spatial context, and movement patterns.Ph.D. Thesis. Lisbon: University of Lisbon.
Pitcher, T.J., Magurran, A.E. & Winfield, I.J. 1982. Fish in larger shoals find food faster. Behavioral Ecology and Sociobiology 10: 149-151.
Pitcher, T.J. & Parrish, J.K. 1993. Functions of shoaling behaviour in teleosts. In: Pitcher, T.J., ed. Behaviour of Teleost Fishes. London: Chapman & Hall, pp. 363–439.
Reebs, S.G. 2002. Plasticity of diel and circadian activity rhythms in fishes. Reviews in Fish Biology and Fisheries 12: 349-371.
Reeves, G., Grunbaum, J. & Lang, D. 2010. Seasonal variation in diel behaviour and habitat use by age 1+ Steelhead (Oncorhynchus mykiss) in Coast and Cascade Range streams in Oregon, U.S.A. Environmental Biology of Fishes 87: 101-111.
Rochet, M.J., André, C.P., Robert, S. & Dominique, P. 2000. Comparative analysis of phylogenetic and fishing effects in life history patterns of teleost fishes. Oikos 91: 255.
Rogado, L., Alexandrino, P.J., Almeida, P.R., Alves, M.J., Bochechas, J., Cortes, R.V., Domingos, M.I., Filipe, A.F., Madeira, J. & Magalhães, M.F. 2005. Peixes dulciaquicolas e migradores. In: Cabral, M.J., Almeida, J., Almeida, P.R., Dellinger, T., Ferrand de Almeida, N., Oliveira, M.E., Palmeirim, J.M., Queiroz, A.I., Rogado, L. & Santos-Reis, M., eds. Livro Vermelho dos Vertebrados de Portugal. Lisboa: Instituto da Conservação da Natureza.
Santos, F.D. & Miranda, P. 2006. Alterações climáticas em Portugal: cenários, impactos e medidas de adaptação. Lisboa, Portugal: Gradiva.
Santos, J.M. & Ferreira, M.T. 2008. Microhabitat use by endangered Iberian cyprinids nase Iberochondrostoma almacai and chub Squalius aradensis. Aquatic Sciences 70: 272-281.
Santos, J.M., Ferreira, M.T., Godinho, F.N. & Bochechas, J. 2002. Performance of fish lift recently built at the Touvedo Dam on the Lima River, Portugal. Journal of Applied Ichthyology 18: 118-123.
Santos, J.M., Ferreira, M.T., Godinho, F.N. & Bochechas, J. 2005. Efficacy of a nature-like bypass channel in a Portuguese lowland river. Journal of Applied Ichthyology 21: 381-388.
Santos, J.M., Godinho, F.N. & Ferreira, M.T. 2004. Microhabitat use by Iberian nase Chondrostoma polylepis and Iberian chub Squalius carolitertii in three small streams, north-west Portugal. Ecology of Freshwater Fish 13: 223-230.

2. Daily activity of a Mediterranean cyprinid
51
Sharpe, F. & Rosell, F. 2003. Time budgets and sex differences in the Eurasian beaver. Animal Behaviour 66: 1059-1067.
Stenberg, M. & Persson, A. 2005. The effects of spatial food distribution and group size on foraging behaviour in a benthic fish. Behavioural Processes 70: 41-50.
Thompson, A.R., Petty, J.T. & Grossman, G.D. 2001. Multi-scale effects of resource patchiness on foraging behaviour and habitat use by longnose dace, Rhinichthys cataractae. Freshwater Biology 46: 145-160.
Vila-Gispert, A., Alcaraz, C. & García-Berthou, E. 2005. Life-history traits of invasive fish in small Mediterranean streams. Biological Invasions 7: 107-116.
Ward, A. 2012. Social facilitation of exploration in mosquitofish (Gambusia holbrooki). Behavioral Ecology and Sociobiology 66: 223-230.
Weetman, D., Atkinson, D. & Chubb, J.C. 1998. Effects of temperature on anti-predator behaviour in the guppy, Poecilia reticulata. Animal Behaviour 55: 1361-1372.
White, J. & Warner, R. 2007. Behavioral and energetic costs of group membership in a coral reef fish. Oecologia 154: 423-433.
Zar, J.H. 1996. Biostatistical analysis. New Jersey: Prentice-Hall, Englewood Cliffs.

2. Daily activity of a Mediterranean cyprinid
52
2.7. Corrigendum
Martelo, J., Grossman, G.D., & Magalhães, M.F. 2013. Extrinsic and intrinsic factors influence
daily activity of a Mediterranean cyprinid. Ecology of Freshwater Fish 2013: 22: 307–316.
Our article “Extrinsic and intrinsic factors influence daily activity of a Mediterranean cyprinid”
used rainfall measurements to classify years by flow with data from the website of Sistema
Nacional de Informação de Recursos Hídricos (SNIRH) (http://snirh.pt). Unfortunately, this
agency has just revised the rainfall estimates for one of our study years, and this has resulted
in some minor changes in the wording of our paper as follows:
1. The fifth sentence below the subtitle ‘Study site’ on p. 308 should read: Although the
seasonal timing of rainfall is predictable, the total amount of rain varies considerably among
years (129–1121 mm).
2. The second sentence below the subtitle ‘Environmental data and daily activity patterns’ on
p. 309 should read: October 2008 to September 2009 was the driest 12-month period on
record in the Torgal stream since 1931 (129 mm), and rainfall data in the following year,
October 2009 to September 2010, also were close to the long-term annual median (690 vs. 658
mm).
3. The fourth sentence of the third paragraph on p. 312 should read: In addition, during the
two years of observations, conditions were dry to normal, and thus, our results may not be
completely relevant to high flow years.

Chapter 3.
Habitat patchiness affects distribution and
microhabitat use of endangered Mira
chub Squalius torgalensis
Martelo, J., Porto, M., Grossman, G.D. & Magalhães, M.F. 2014. Habitat patchiness affects
distribution and microhabitat use of endangered Mira chub Squalius torgalensis.
Hydrobiologia, 732: 93-109.


3. Distribution and microhabitat use
55
3. Habitat patchiness affects distribution and microhabitat use of
endangered Mira chub Squalius torgalensis
3.1. Abstract
We hypothesized that distribution and microhabitat use by imperilled chub Squalius
torgalensis in the Torgal stream, Portugal, during low flows, were related to spatial patchiness
in physical resources and shifts in ontogenetic preferences. We mapped fish abundance and
sampled microhabitat use and availability via snorkelling. We used the coefficient of dispersion
in abundance and spatial autocorrelation analyses to characterize chub distribution, and
Hurdle models to relate chub presence and abundance to habitat characteristics. We showed
that chub displayed an aggregated distribution, apparently in association with patchily
distributed and autocorrelated physical resources, such as debris, roots and aquatic
vegetation. Microhabitat use generally was unrelated to velocity, and ontogenetic differences
in microhabitat use were not substantial. Nevertheless, sometimes small chub preferred low
velocity patches with coarse substrata, debris and roots whereas large chub preferred deeper
patches with roots and aquatic vegetation. Results suggest that, in low flow conditions, chub
respond to resource patchiness by congregating in favourable microhabitats, and that
maintenance of mosaics of patches with variable substrata, cover and depth may be important
for the persistence of fish in Mediterranean streams.
3. Distribution and microhabitat use
56
3.2. Introduction
Resource patchiness both within and among habitats affects a variety of ecological processes,
such as the spatial distribution and microhabitat use of individuals (Palmer & Poff 1997; Einum
et al. 2008; Winemiller et al. 2010). For example, the spatial distribution of oviposition sites
(i.e., rocks) by aquatic insects constrains their dispersal, and hence their spatial distribution
(Lancaster et al. 2003). Similarly, patchiness in prey distributions strongly affects microhabitat
use by stream fishes (Thompson et al. 2001; Petty & Grossman 2010; Grossman 2013). The
identification of patchiness in physical and biological resources and quantification of their
effects on the distribution and resource use of organisms will greatly aid our understanding of
the dynamics of natural systems.
Patchiness in biological and physical resources is particularly common in streams
(Hildrew & Giller 1994), which may exhibit substantial spatial and temporal variability at
multiple scales due to seasonal and annual variations in flow (Pringle et al. 1988; Grossman et
al. 1995; Thompson et al. 2001). Small-scale spatial patchiness in physical resources may
influence the distribution and abundance of stream fishes, often promoting aggregation
around preferred resources (Freeman & Grossman 1993; Torgersen & Close 2004; Argentina et
al. 2010). Similarly, temporal patchiness in resources may produce seasonal and annual shifts
in the distribution and abundance of fishes (Grossman & Ratajczak 1998; Lake 2000; Thompson
et al. 2001). Moreover, fishes have complex life histories and the importance and effects of
spatial and temporal resource variability may change through ontogeny (Wootton 1990).
Despite increasing recognition that resource use by fishes is influenced by resource patchiness,
and that resource use varies over ontogeny, many studies ignore both the distribution of
resource points in space and time and their effects on different size/age classes of fishes. This

3. Distribution and microhabitat use
57
likely limits our ability to identify the factors influencing the distribution and resource use
patterns of stream fishes (Keitt et al. 2002; Lancaster 2006).
At present, there is little information on the distribution and abundance of fishes in
habitats with high habitat and hydrologic variability, such as Mediterranean streams (but see
Santos et al. 2004; Santos & Ferreira 2008; Martínez-Capel et al. 2009). A knowledge of these
patterns and the factors influencing them is particularly important given the high degree of
imperilled fishes in local assemblages (Smith & Darwall 2006) and the expected increase in
intensity and frequency of droughts in the Mediterranean region due to climate change (Millán
et al. 2005; IPCC 2008). This information likely will contribute for management actions focused
on conserving Mediterranean stream fishes.
We examined the influence of patchiness in physical resources on the spatial
distribution and microhabitat use of the critically endangered Mira chub Squalius torgalensis
Coelho, Bogutskaya, Rodrigues & Collares-Pereira in a Mediterranean stream using spatially
explicit methods. During the study, the stream was characterized by low flows, thus providing
important information for the conservation of the species under altered future environments.
Specific objectives were to: 1) quantify the spatial distribution of chub, 2) determine the
physical characteristics related to chub microhabitat use, 3) explore relationships between
chub distribution and microhabitat use patterns and patchiness in physical characteristics, and
4) compare these patterns between size classes, reaches and years. Results were then used to
explore conservation implications for chub, and possibly, other Mediterranean stream fish.

3. Distribution and microhabitat use
58
3.4. Methods
Study species
Mira chub S. torgalensis (henceforth chub) are endemic to Mediterranean streams in the SW
of Portugal. Although this species may be locally abundant, it is thought to have declined due
to habitat loss and degradation, and is currently listed as Critically Endangered in the
Portuguese Red Data Book (Rogado et al. 2005). Chub are small (less than 16 cm total length)
invertivores (Magalhães et al. 2003) that occur in runs and pools (Magalhães et al. 2002), and
occupy mid-water column microhabitats from which they prey upon drifting and benthic
invertebrates during the day (Martelo et al. 2013). Chub typically live up to 5 years, mature in
1-2 years and spwan between March and May (Magalhães et al. 2003). This species generally
shows recruitment failures in dry years (Magalhães et al. 2003), thereby being highly
vulnerable to dry spells lasting for 6 years or more (Magalhães et al. 2007).
Study reaches
We conducted our study in two reaches of the Torgal stream (SW Portugal, 37°38’N, 8°39’W),
a small (28 km) relatively undisturbed Mediterranean stream that has been described in detail
in Magalhães et al. (2007). In brief, the Torgal primarily drains a landscape of siliceous igneous
geology, dominated by native open cork oak Quercus suber L. woodlands and introduced
eucalyptus Eucaliptus globules Labill plantations. Riparian galleries are generally well
preserved, and there are few human impacts. The climate is Mediterranean, with rainfall
varying markedly from year-to-year (205-1121 mm), but following a predictable seasonal
pattern. About 80% of annual rain occurs in October-March, but rainfall is almost completely

3. Distribution and microhabitat use
59
lacking during summer months (July-August). Mean monthly temperatures ranges from 11°C
(December) to 24°C (August). The flow regime of the Torgal is highly dependent on rainfall
patterns. Headwaters flow only after heavy rains, while the mainstream and the largest
tributaries typically dry in variable extents each summer. In dry years, there are no significant
floods, the drought is intense and last for longer periods, with water persisting in a few
isolated pools and aquifer-fed runs. Conversely, in wet years large floods are common and
flows may persist through the summer in downstream reaches.
Our study reaches were approximately 2 km apart, in the downstream segment of the
Torgal. They consisted of persistent but relatively shallow runs (< 80 cm deep in spring), with
clear water and intact riparian vegetation. We selected persistent reaches to reduce potential
confounding effects of emigration/extinction and colonization processes, which may result in
weak fish-habitat relationships in streams (Angermeier & Schlosser 1989). Reach boundaries
were determined by discrete channel units with little suitable habitat for underwater
observations. The upstream reach (Reach 1) was 80 m in length, and bounded downstream by
a deep pool and upstream by a shallow rapid with boulders. The lower reach (Reach 2) was 40
m in length, and bounded downstream by a deep pool and upstream by a gravel bar. Because
neither pools nor riffles are barriers to chub movement (Pires 2012), chub were probably able
to move in and out of the reaches. However, this potential bias was constant across reaches,
and consequently unlikely to have substantially influenced our results.
Fish assemblages in the study reaches were dominated by chub (72-87%), although the
endemic Southwestern arched-mouth nase Iberochondrostoma almacai Coelho, Mesquita &
Collares-Pereira (4-12%) also occurred in both reaches and years. Native Western three-spine
stickleback Gasterosteus gymnurus L. (7%), European eel Anguilla anguilla L. (0.3%) and
Southern Iberian spined-loach Cobitis paludica De Buen (0.3%) occurred only in Reach 1 in
2009, and Southern Iberian barbel Luciobarbus sclateri Ghünter (23%) occurred only in Reach 2

3. Distribution and microhabitat use
60
in 2010. The exotic pumpkinseed Lepomis gibbosus L. occurred throughout the study, but in
low numbers (0.3-1%).
Sampling regime
We sampled Reach 1 in spring 2009 (13-15 May) and spring 2010 (31 May-2 June) and Reach 2
only in spring 2010 (22-23 June). We restricted sampling to spring because increased flow or
water turbidity prevented underwater observation of fish and habitat assessment in other
seasons. In addition, our sampling was conducted after the peak spawning period of chub, to
avoid biases produced by reproductive behaviour. Rainfall data from a nearby gauging station
(37°42'N, 8°32'W), indicated that October 2008 to September 2009 was the driest 12 month
period on record since 1931 (129 mm), and October 2009 to September 2010, also was close
to the long-term annual median (690 versus 658 mm). During our study, flow persisted in both
reaches, though the wetted channel in Reach 1 was narrower in 2009 than in 2010 (3-9 m
versus 6-10 m) and Reach 2 also was narrower (4-7 m) than Reach 1. Water temperatures
varied between 15 to 17° C during sampling.
Fish and habitat sampling
We quantified fish distribution and microhabitat use, and microhabitat availability via
snorkelling during daylight hours because this was when fish actively foraged, whereas they
were quiescent at night (Martelo et al. 2013). We sampled each reach in 2-3 days, and both
reaches were sampled within 3 weeks of each other. Preliminary investigation showed that

3. Distribution and microhabitat use
61
snorkelling on consecutive days yielded similar fish counts (< 7% difference) within reaches,
suggesting that sampling on any given day yielded comparable results.
We mapped the number of chub in 1 m2 quadrats using the methods of Freeman &
Grossman (1993). Specifically, we established a 1 x 1 m grid over the wetted channel of the
study reach using transect ropes and numbered spikes. Spikes were driven into the banks at
the ends of transect lines, and marked at 1 m intervals with coloured tape. We also mapped
the wetted channel for each reach in each sampling period. We quantified microhabitat use of
chub using the methods of Grossman & de Sostoa (1994a, b). We first entered the reach from
the downstream boundary and snorkelled slowly upstream in a zigzag manner to maximize
spatial coverage and minimize fish disturbance. We scanned both the substratum and the
water column to locate fish, and only recorded undisturbed individuals. Disturbed fish were
recognized by their characteristic escape responses (i.e., fleeing and sustained darting
movements). No reproductive behaviours were observed during sampling. We identified fishes
to species, and visually estimated standard length (SL, cm) and abundance in each quadrat.
Fish less than 5 cm were excluded because they were not reliably identifiable to species
underwater. To minimize observer and detection bias, a single observer (J. Martelo) conducted
sampling throughout the study.
We quantified physical habitat in all quadrats occupied by chub, and in approximately
10% of the remaining, non-occupied quadrats. This resulted in relatively similar numbers of
occupied and unoccupied quadrats, as recommended for minimization of modelling bias
(Hosmer & Lemeshow 1989). We stratified non-occupied quadrats by location, and randomly
selected 80% of quadrats in the mid channel and 10% along each margin of the reach.
Stratified random sampling was used to obtain a statistically reliable sample of microhabitat
availability (Grossman & Skyfield 2009). Overall, we sampled 27 occupied and 47 unoccupied

3. Distribution and microhabitat use
62
quadrats in Reach 1 in 2009, 51 occupied and 55 unoccupied quadrats in Reach 1 in 2010, and
26 occupied and 18 unoccupied quadrats in Reach 2 in 2010.
We measured seven physical variables commonly used in fish microhabitat use studies
(e.g., Grossman & de Sostoa 1994a, b; Carter et al. 2004; Santos et al. 2004; Martínez-Capel et
al. 2009). Water depth (meter stick) and average velocity (Global Water FP101 electronic
velocity meter) were measured in the centre of each quadrat. We quantified average velocity
at 60% depth in quadrats ≤ 75 cm deep, and at 20% and 80% depth in quadrats > 75 cm deep.
We visually estimated the percentages of organic plant debris (i.e., leaves, limbs and sticks)
and the percentage of inorganic substrata. Inorganic substrata were scored for maximum
diameter as 1: ≤ 0.2 cm, 2: 0.3 - 2.5 cm, 3: 2.6 - 15 cm, 4: 16 - 30 cm, and 5: > 30 cm, and
coarseness was then calculated as the weighted average of all inorganic substratum categories
(Joy & Death 2002). We also estimated visually the percentages of roots, aquatic vegetation
and overhanging vegetation (< 50 cm above water surface).
3.5. Data analysis
Analyses were carried out separately for data collected in Reach 1 in 2009 and 2010 and Reach
2 in 2010 to compare chub distribution and habitat relationships across the two years and
reaches of study. In addition, because size-related variation in microhabitat use is common in
stream fishes (e.g., Grossman & de Sostoa 1994a, b; Santos & Ferreira 2008), we conducted
separate analyses for small (5.0 – 5.9 cm, SL) and large (≥ 6.0 cm, SL) chub, with the former
generally being immature individuals (Magalhães et al. 2003). Large fish in Reach 1 averaged
6.9 cm (± 1.3) in 2009 and 6.5 cm (± 1.0) in 2010 and those in Reach 2 averaged 7.1 cm (± 1.5)
in 2010. Prior to statistical analyses, we inspected histograms of fish abundance and habitat

3. Distribution and microhabitat use
63
data for skewness. Skewed habitat variables were transformed using the angular
transformation for proportional data and the logarithmic transformation (log10) for continuous
variables. We then standardized habitat variables to a mean of 0 and a standard deviation of 1
to facilitate interpretation of relative parameter effect sizes (Crawley 2007; Hazelton &
Grossman 2009). We tested for multicollinearity among habitat variables using correlation
analysis (Pearson’s r), and found no strong correlations (|r| < 0.50) thereby retaining all
variables in analyses. Simple regressions between habitat variables and chub abundance only
yielded linear relationships, and consequently we used linear models for data analyses. Except
where indicated, analyses were conducted using the R 2.15.2 environment and the STATISTICA
vs.10.0 software, and the significance of statistical testing was assessed at P < 0.05.
Variation in habitat characteristics
We used two approaches to quantify variability in habitat characteristics. First, we quantified
habitat patchiness by calculating the coefficient of variation (CV) for each habitat variable
among quadrats, in each reach and year (Palmer et al. 1997; Thompson et al. 2001). We
classified habitat conditions based on the variability criteria of Grossman et al. (1990) : CV <
40% = low variability, 40% ≤ CV ≤ 70% = moderate variability and CV > 70% = high variability.
Second, we used Principal Component Analysis (PCA) on habitat variables to summarize
temporal and spatial changes in microhabitat availability, pooling all data. We tested the null
hypotheses that (1) habitat variables did not differ between 2009 and 2010 in Reach 1, and (2)
habitat variables did not differ between Reach 1 and Reach 2 in 2010, by calculating mean
component scores and 95% confidence ellipses for each year and reach. A lack of overlap of
the 95% confidence ellipses demonstrated significance at the 0.05 level (Anglin & Grossman
2013).

3. Distribution and microhabitat use
64
We examined whether habitat variables were spatially autocorrelated, using Moran’s I
(Legendre & Legendre 1998) under the null hypothesis of random spatial distribution of
habitat characteristics among quadrats. Moran’s I usually takes values in the interval -1.0 and
1.0, with significant values of I indicating that habitat characteristics in quadrats at a given
distance are more similar (positive autocorrelation) or less similar (negative autocorrelation)
than expected for randomly associated pairs of quadrats. We calculated Moran’s I using 1 m
classes for pair wise distances because our quadrats were 1 m2 and this class width provided a
good compromise between the resolution of the correlogram and the power of the test of
significance. We evaluated the significance of I with Monte Carlo permutation tests (1000
permutations), using the progressive Bonferroni method to correct for multiple testing
(Legendre & Legendre 1998).
Spatial patterns in chub abundance
Spatial patterns in chub abundance were analysed using the coefficient of dispersion (CD,
Krebs 1989; Lancaster et al. 2003) and Moran’s I coefficients. We first compared the
distribution of chub abundance per quadrat to a Poisson distribution using a two-tailed χ2 test
on CD data, thus testing the null hypothesis that chub were randomly distributed among
quadrats. Values for the CD: 1) approach one when spatial distributions are essentially
random, 2) are greater than one if chub are aggregated, and 3) are less than one if their
distribution is uniform. Because our sample sizes were large we used a normal approximation
for χ2 value (Krebs 1989). Given that the CD is not spatially explicit, we then assessed
autocorrelation in chub abundance per quadrat using Moran’s I coefficients under the null
hypothesis of random spatial distribution of chub among quadrats. Finally, to illustrate spatial
patterns, we mapped chub abundance per quadrat.
3. Distribution and microhabitat use
65
Microhabitat use by chub
Because our data sets were zero inflated, we used hurdle models to assess relationships
between chub abundance and habitat characteristics (Cunningham & Lindenmayer 2005; Potts
& Elith 2006), which have proven successful in previous studies of fish habitat use (Wenger &
Freeman 2008). The hurdle model typically consists of two components, the first of which is a
binary (presence/absence) model and the second is an abundance model without zeroes. For
independent abundance data, the two components of the hurdle model are orthogonal, and
can be fitted and interpreted separately (Cunningham & Lindenmayer 2005; Wenger &
Freeman 2008). We built hurdle models using binomial distributions and logit links for the
binary presence/absence component (henceforth presence component), and Poisson
distributions and log link functions for the positive count component (henceforth abundance
component).
We constructed 20 candidate microhabitat models using as explanatory variables,
velocity, depth, and two sets of variables that characterized substrata and cover (Table 1).
Specifically, substrata included substratum coarseness and percentage of debris, while cover
included percentage of roots, aquatic vegetation and overhanging vegetation. To avoid the
production of trivial models, overhanging vegetation in Reach 1 in 2009 and 2010, and aquatic
vegetation in Reach 2 in 2010 were excluded from analysis because they included a large
number of zeroes (> 90%). For simplicity, interaction terms were not incorporated in
candidate models.
We used an information-theoretic approach based on the Akaike’s Information
Criterion corrected for small sample sizes (AICc) to evaluate the plausibility of each candidate
model, given the data (Burnham & Anderson 2002). We evaluated the relative performance of
each candidate model by calculating the ΔAICc, and scaling them according to their Akaike

3. Distribution and microhabitat use
66
weight (wi). We only interpreted models with Akaike weights >10% of the model with the best
fit (Burnham & Anderson 2002). To quantify model selection uncertainty, we calculated model-
averaged parameter estimates (β) and evaluated the precision of these estimates using 85%
confidence intervals; estimates whose confidence limits included zero were not interpreted
(Burnham & Anderson 2002). The relative importance of each explanatory variable (w+) was
estimated by summing Akaike weights of all interpretable models in which the variable
occurred (Burnham & Anderson 2002).
Because AIC may be sensitive to the presence of spatial autocorrelation, generating
unstable and over fitted minimum adequate models (Diniz-Filho et al. 2008) we assessed
whether the residuals of the average models were spatially autocorrelated, using Moran’s I
(Legendre & Legendre 1998) under the null hypothesis of random spatial distribution of the
residuals.
Table 1 – Candidate models used to evaluate relationships between chub presence and abundance and
habitat variables in the study reaches of the Torgal in spring 2009 and 2010. Vegetation (Ve) includes
aquatic vegetation (Av) in Reach 1 in 2009 and 2010, and overhanging vegetation (Ov) in Reach 2 in
2010.
Model description Model notation
Velocity V Depth D Substratum coarseness Sc Debris De Roots R Vegetation Ve Substrata (substratum coarseness & debris) Sc+De Cover (roots & vegetation) R+Ve Velocity & depth V+D Velocity & substrata V+Sc+De Velocity & cover V+R+Ve Depth & substrata D+Sc+De Depth & cover D+R+Ve Substrata & cover Sc+De+R+Ve Velocity, depth & substrata V+D+Sc+De Velocity, depth & cover V+D+R+Ve Velocity, substrata &cover V+Sc+De+R+Ve Depth, substrata & cover D+Sc+De+R+Ve Velocity, depth, substrata & cover V+D+Sc+De+R+Ve Intercept Intercept

3. Distribution and microhabitat use
67
3.6. Results
Variation in habitat characteristics
Microhabitat availability displayed substantial variability among quadrats within reaches. All
variables showed high coefficients of variation (94% ≤ CV ≤ 600%) in both reaches and years,
except substratum coarseness and depth (Table 2). Substratum coarseness displayed low
variability in Reach 1 in 2009 (CV = 18%) and in 2010 (CV = 28%), but in Reach 2 it exhibited
high variability (CV = 100%). Depth also exhibited low variability in both reaches and years
(30% ≤ CV ≤ 38%).
Table 2 – Habitat characteristics (HC) of the study reaches of the Torgal in spring 2009 and 2010. Values
are the mean, standard deviation (SD), range (minimum-maximum), and coefficient of variation (CV); n
is the sample size. Other abbreviations are as per Table 1.
Reach 1 Reach 2
2009 (n = 74) 2010 (n = 106) 2010 (n = 44)
HC Mean ± SD Range CV Mean ± SD Range CV Mean ± SD Range CV
V 1.1 ± 3.6 0-16.0 327
7.2 ± 6.8 0-29.0 94
3.6 ± 5.3 0-19 147
D 37.5 ± 14.2 10.0-76.0 38
48.3 ± 16.1 10.0-81.0 33
44.4 ± 13.4 9.0-66.0 30
Sc 3.8 ± 0.7 1.6-4.9 18
3.2 ± 0.9 1.0-4.6 28
2.3 ± 0.4 1.2-3.1 100
Db 8.9 ± 18.3 0-100.0 206
10.7 ± 21.7 0-100.0 203
28.2 ± 20.4 5.0-90.0 100
R 9.3 ± 20.4 0-85.0 219
10.4 ± 20.2 0-100.0 194
3.4 ± 9.7 0-40.0 285
Av 11.4 ± 16.3 0-65.0 143
9.8 ± 15.8 0-80.0 100 Ov 1.9 ± 11.4 0-95.0 600 3.9 ± 12.4 0-70.0 318 5.9 ± 17.8 0-95.0 302
The PCA did not detect significant inter-annual (2009-2010) differences in habitat
within Reach 1, however, habitat differed significantly between Reaches 1 and 2 in 2010 (Fig.
1). The first PC axis accounted for 25% of the variation in the data, and represented a gradient
involving debris, substratum coarseness and velocity. The second PC axis (18%) identified a

3. Distribution and microhabitat use
68
gradient of aquatic vegetation and roots. The PCA demonstrated that in 2010, Reach 1 had
higher water velocity, coarser substrata, and more aquatic vegetation and roots than Reach 2.
Fig. 1 – Ordination diagram of Principal Component Analysis (PCA) of habitat in the study reaches of the
Torgal in spring 2009 and 2010. Variables with loadings > 0.40 and 95% confidence ellipses of scores are
presented. Dark grey ellipse represents Reach 1 in 2009, light grey ellipse represents Reach 1 in 2010,
and blank ellipse represents Reach 2 in 2010.
Spatial autocorrelation in habitat variables varied among reaches and years. In Reach 1
in 2009 only debris, roots and aquatic vegetation showed positive autocorrelations whereas
all habitat variables were spatially correlated in 2010; in Reach 2, spatial correlations were
found only for depth, substratum coarseness and overhanging vegetation (Fig. 2). In all cases,
the highest positive spatial autocorrelations (0.001 ≤ P ≤ 0.039) generally occurred in the first

3. Distribution and microhabitat use
69
distance class (1 m), decreasing at subsequent distances (2-5 m), and fluctuating up and down
thereafter (Fig. 1-3 in the Supplementary Material).
Fig. 2 – Summary Moran’s I correlograms for habitat characteristics using 1 m classes for pair wise
distances along the study reaches of the Torgal in spring 2009 and 2010. Dark symbols represent
Moran’s I statistics that are significant after progressive Bonferroni correction (P < 0.05). Positive
significant values indicate positive autocorrelations, and thus that nearer quadrats are more similar in
habitat characteristics than quadrats farther apart. Significant negative values have the opposite
meaning. Abbreviations are as follows: V = velocity; D = depth; Sc = substratum coarseness; De = debris;
R = roots; Av = aquatic vegetation; and Ov = overhanging vegetation.
Spatial patterns in chub abundance
There was considerable variation in the distribution and abundance of chub between years but
not between reaches. The percentage of quadrats occupied by chub always was low (5-11%),
but the numbers of individuals per quadrat varied considerably in Reach 1 between 2009 and
2010. In 2009, there were a maximum of 34 individuals per quadrat, and 91% of chub were in
quadrats with more than 5 individuals (Fig. 3a). By contrast, in 2010 the maximum number of
individuals per quadrat was 12, only 47% of chub were in quadrats having more than 5
individuals, and 9% were solitary (Fig. 4a). These differences were produced by changes in the

3. Distribution and microhabitat use
70
abundance of small chub, whose mean number per quadrat decreased from 10 to 3 between
2009 and 2010, while large chub abundance remained relatively constant (3) between years
(Table 3, Fig. 3b and 4b). Moreover, the distribution of size classes was highly variable in 2009,
because 88% of small chub were in quadrats with more than 5 individuals and 1% were solitary
whereas only 56% of large chub were in quadrats with more than 5 individuals and 12% were
solitary (Fig. 3b, c). Conversely, in 2010 most small (59%) and large chub (60%) were in
quadrats with 2-5 individuals and 15% of small and 40% of large chub were solitary (Fig. 4b, c).

3. Distribution and microhabitat use
71
Fig. 3 – Representation of Reach 1 in 2009 showing the spatial distribution of (a) pooled, (b) small and (c)
large chub abundance in 1 m2
quadrats. Blank quadrats did not contain chub.
Fig. 4 - Representation of Reach 1 in 2010 showing the spatial distribution of (a) pooled, (b) small and (c)
large chub abundance in 1 m2
quadrats. Blank quadrats did not contain chub.

3. Distribution and microhabitat use
72
Table 3 - Spatial distribution of chub abundance in the study reaches of the Torgal in spring 2009 and
2010.
Reach 1 Reach 2
2009
2010
2010
No of quadrats 535 606 236
Pooled Total fish 300
174
73
No of quadrats occupied (%) 27 (5)
51 (8)
26 (11)
No of fish per occupied quadrat (mean ± SD) 11±9
3±3
3±2
Small Total fish 229
124
35
No of quadrats with fish (%) 24 (4)
46 (8)
19 (8)
No of fish per occupied quadrat (mean ± SD) 10±7
3±2
2±1
Large Total fish 71
50
38
No of quadrats with fish (%) 20 (4)
29 (5)
18 (8)
No of fish per occupied quadrat (mean ± SD) 4±3 2±1 2±1
This pattern was similar to Reach 2 where there was a maximum of 8 individuals per quadrat
(Fig. 5a), most small (77%) and large chub (63%) were in quadrats with 2-5 individuals and 23%
of small and 21% of large chub were solitary (Fig. 5b, c).
Fig. 5 - Representation of
Reach 2 in 2010 showing the
spatial distribution of (a)
pooled, (b) small and (c) large
chub abundance in 1 m2
quadrats. Blank quadrats did
not contain chub.

3. Distribution and microhabitat use
73
Although chub generally displayed non-random distributions in both years and
reaches, spatial aggregation tended to be stronger in Reach 1 in 2009 and stronger for small
than large individuals. The coefficient of dispersion for all chub was higher in Reach 1 in 2009
(CD = 17.6) than in 2010 (CD = 5.3), though both indicated aggregated distributions (P <
0.0001). Again, this variation was driven mostly by small chub, which displayed much higher
CDs than large chub in 2009 (small chub: CD = 14.7, P < 0.0001; large chub: CD = 5.8, P <
0.0001) but not in 2010 (small chub: CD = 4.4, P < 0.0001; large chub: CD = 2.5, P < 0.0001). In
Reach 2, the dispersion of all chub was slightly lower than in Reach 1 in 2010 (CD = 3.6, P <
0.0001), and similar between size classes (small chub: CD = 2.2, P < 0.0001; large chub: CD =
2.8, P < 0.0001).
Abundance of chub per quadrat always was spatially correlated for large but not for
small chub. For both reaches and years, high positive spatial autocorrelations (0.001 ≤ P ≤ 0.04)
for large and all chub generally occurred in the first distance class (1 m), decreasing at
subsequent distances (2-4 m), and fluctuating up and down thereafter (Fig. 6a, c). By contrast,
abundance of small chub only was spatially autocorrelated in Reach 1 in 2010, with the highest
positive autocorrelation (P = 0.001) also occurring in the 1m distance class (Fig. 6b). This
suggests that adjacent quadrats always hold more similar numbers of large chub than more
distant quadrats, and that similar patterns are only occasionally observed for small chub.

3. Distribution and microhabitat use
74
Fig. 6 - Moran’s I correlograms for abundance of (a) pooled, (b) small and (c) large chub using pair wise
quadrat distances along the study reaches of the Torgal in spring 2009 and 2010. Dark symbols
represent Moran’s I statistics that are significant after progressive Bonferroni correction (P < 0.05).
Positive significant values indicate positive autocorrelations, and thus that nearer quadrats hold more
similar abundances than quadrats farther apart. Significant negative values have the opposite meaning.

3. Distribution and microhabitat use
75
Microhabitat use by chub
The presence and abundance of chub were affected by multiple habitat characteristics that
varied substantially between reaches but were similar between years (Tables 4 and 5). The
average models for Reach 1 indicated that chub presence and abundance always increased
with substratum coarseness and roots, but in 2009 they also increased with debris whereas in
2010 they increased with aquatic vegetation and abundance decreased with velocity (Table 5).
Conversely, the average model for chub in Reach 2 in 2010 indicated a positive association
between chub occurrence and abundance and depth (Table 5).

3. Distribution and microhabitat use
76
Table 4 – Summary results of model selection for the relationships between chub presence and
abundance and habitat variables in the study reaches of the Torgal in spring 2009 and 2010. Values are
the Akaike’s Information Criterion (AICc), the change in AICc between subsequent models (ΔAICc) and
the Akaike weights (wi) for each interpretable model (models with Akaike weights >10% of the model
with the best fit). Other abbreviations are as per Table 1.
Interpretable model AICc ΔAICc wi
Reach 1, 2009 Pooled Sc + De + Ve + R 324.99 0.00 0.64
D + Sc + De + Ve + R 326.60 1.62 0.29
Small Sc + De + Ve + R 275.58 0.00 0.61
V + Sc + De + Ve + R 276.74 1.17 0.34
Large D + Ve + R 143.25 0.00 0.84
Reach 1, 2010 Pooled Sc + De + Ve + R 374.09 0.00 0.38
V + Sc + De + Ve + R 374.12 0.03 0.38
D + Sc + De + Ve + R 377.32 3.22 0.08
V + D + Sc + De + Ve + R 378.56 4.46 0.04
Small V + Ve + R 317.63 0.00 0.47
V + Sc + De + Ve + R 318.63 1.00 0.28
V + D + Ve + R 320.74 3.11 0.10
Large D + Ve + R 191.62 0.00 0.37
Sc + De + Ve + R 192.92 1.30 0.19
R 193.68 2.06 0.13
D + Sc + De + Ve + R 194.84 3.22 0.07
Ve + R 195.08 3.46 0.07
D 195.40 3.78 0.06
V + D + Ve + R 195.61 3.98 0.05

3. Distribution and microhabitat use
77
Table 4 continued
Interpretable model AICc ΔAICc wi
Reach 2, 2010 Pooled D 149.59 0.00 0.80
V + D 153.26 3.75 0.13
Small D 108.77 0.00 0.43
Sc 110.97 2.20 0.14
Intercept 111.18 2.42 0.13
D + Sc + De 112.00 3.23 0.09
Ve 112.36 3.59 0.07
Large D 112.09 0.00 0.44
D + Ve + R 114.09 2.00 0.16
R 114.36 2.27 0.14
V + D 115.49 3.40 0.08

3. Distribution and microhabitat use
78
Table 5 – Summary results of information theoretic multimodel inference for the relationships between
chub presence and abundance and habitat variables in the study reaches of the Torgal in spring 2009
and 2010. Values are Akaike weights (w+), model-averaged coefficient estimates (β) and 85% confidence
intervals (CI) for each parameter in interpretable models. Parameters with regression coefficients
including zero in both the presence and abundance components are not shown. † Regression
coefficients with 85% confidence intervals including zero.
Presence
Abundance
85% CI
85% CI
Parameter w+ β Lower Upper β Lower Upper
Reach 1, 2009 Pooled D 0.31 0.14 -0.36 0.64†
0.15 0.04 0.27
Sc 1.00 1.46 0.66 2.26
0.60 0.45 0.74
De 1.00 1.21 0.57 1.86
0.42 0.33 0.51
R 1.00 1.48 0.81 2.15
0.28 0.19 0.36
Av 1.00 0.65 0.17 1.13
-0.05 -0.15 0.06†
Small V 0.36 -0.13 -0.74 0.49†
-0.43 -0.78 -0.09
Sc 1.00 1.89 1.02 2.76
0.51 0.35 0.68
De 1.00 1.34 0.69 1.99
0.39 0.29 0.49
R 1.00 1.48 0.81 2.15
0.07 -0.03 0.18†
Large D 1.00 0.65 0.13 1.17
0.69 0.43 0.95
R 1.00 1.40 0.81 1.99
0.43 0.24 0.62
Av 1.00 0.52 0.02 1.01
0.10 -0.11 0.32†
Reach 1, 2010 Pooled V 0.48 -0.32 -0.71 0.06†
-0.20 -0.36 -0.03
Sc 1.00 0.71 0.31 1.10
0.18 0.00 0.36
De 1.00 0.16 -0.24 0.56†
0.16 0.04 0.27
R 1.00 0.72 0.35 1.10
0.20 0.07 0.33
Av 1.00 0.40 0.06 0.74
0.22 0.10 0.34
Small V 1.00 -0.28 -0.65 0.09†
-0.37 -0.57 -0.16
Sc 0.33 0.61 0.22 0.99
0.20 -0.02 0.42†
R 1.00 0.61 0.25 0.97
0.00 -0.18 0.17†
Av 1.00 0.45 0.12 0.77
0.18 0.03 0.33
Large D 0.58 0.51 0.13 0.90
0.51 0.07 0.94
Sc 0.28 0.76 0.26 1.26
0.60 -0.01 1.20†
R 0.94 0.67 0.31 1.03
0.40 0.01 0.79
Av 0.80 0.37 0.02 0.72 -0.08 -0.42 0.26†

3. Distribution and microhabitat use
79
Table 5 continued
Presence
Abundance
85% CI
85% CI
Parameter w+ β Lower Upper β Lower Upper
Reach 2, 2010 Pooled D 1.00 0.97 0.40 1.55
0.38 0.11 0.65
Small D 0.60 0.97 0.37 1.57
-0.14 -0.61 0.32†
Sc 0.27 -0.28 -0.78 0.22†
-0.38 -0.62 -0.13
Large D 0.83 1.15 0.48 1.82
0.30 -0.15 0.75†
R 0.37 1.12 0.23 2.01 -0.22 -0.52 0.08†
Size-related variation in microhabitat use was strong in Reach 1 in 2009, where the
presence and abundance of small and large chub were influenced by different habitat
characteristics, but low in both Reach 1 and 2 in 2010 (Tables 4 and 5). The average models for
Reach 1 in 2009 demonstrated that presence and abundance of small chub increased with
substratum coarseness, debris and roots, whereas those of large chub increased with depth,
aquatic vegetation and roots. In addition, there was a negative association between
abundance of small chub and velocity, which was not present for large chub (Table 5).
Conversely, average models for Reach 1 in 2010 identified positive associations between
presence of both small and large chub and substratum coarseness, roots and aquatic
vegetation. The abundance of small chub was positively associated with aquatic vegetation
and negatively associated with velocity whereas that of large chub associated positively with
depth and roots (Table 5). Similarly, average models for Reach 2 indicated that presence of
both small and large chub was positively associated with depth and roots (large chub only)
whereas abundance of small chub decreased with substrate coarseness (Table 5).

3. Distribution and microhabitat use
80
Residuals of the average models were not spatially autocorrelated (0.096 ≤ P ≤ 0.468,
Fig. 4 in the Supplementary Material), indicating that spatial autocorrelation in chub
abundance was removed after incorporating the habitat variables into our models.
3.7. Discussion
During our study, chub microhabitat use primarily was affected by substratum coarseness,
amount of debris, roots and aquatic vegetation and depth although these effects varied by
reach and size class. In addition, chub showed an aggregated spatial distribution apparently
associated with patchily distributed and spatially autocorrelated habitat resources. Overall,
there was a stronger tendency for small chub to aggregate, although the abundance of small
individuals was not always spatially autocorrelated. Chub microhabitat use generally was
unrelated to water velocity, despite the fact that water velocity often has pervasive effects on
microhabitat use by stream organisms (e.g., Dahl & Greenberg 1996; Hart & Finelli 1999;
Donaldson et al. 2013). Nonetheless, during study years high velocities were uncommon in the
reaches. Consequently, it is possible that velocity plays a more important role in chub
distribution and microhabitat use in high flow years. However, if global climate change results
in increased frequency of drought and decreased precipitation (IPCC 2008), our results may
better depict microhabitat use and spatial relationships of chub than those measured in high
flow years.
To our knowledge, this study is one of the first to examine both the spatial distribution
and microhabitat use of a European riverine fish, incorporate habitat patchiness, and account
for ontogenetic variation in microhabitat use. Incorporating habitat patchiness at small scales
is difficult because: 1) organisms differ in their abilities to perceive patches, which renders the

3. Distribution and microhabitat use
81
identification of patches by investigators somewhat subjective (Kotliar & Wiens 1990;
Thompson et al. 2001), and 2) patches frequently occur on several hierarchical levels (i.e.,
larger patches contain several smaller patches) (Kotliar & Wiens 1990). Consequently, although
many ecologists agree that explicit recognition of patchiness in resource availability is
important to understanding the mechanisms controlling fish distribution and habitat use
regardless of the spatial scale (Thompson et al. 2001 and references therein), there are still
few small scale studies that include habitat patchiness. Here, by using a spatially explicit
method, we were able to include the spatial arrangement of individuals and habitat variables
in our analyses, which allowed us to better understand and interpret chub distribution.
Nonetheless, our study was conducted in a single season (spring), and hence the transferability
of our results to other seasons may be limited.
Chub displayed an aggregated spatial distribution, which may have been primarily
influenced by the patchy distribution of physical habitat characteristics, such as debris, roots
and aquatic vegetation. The effect of resource patchiness (e.g., physical microhabitat, food,
breeding nests) on the spatial distribution of stream fishes has been documented for multiple
species (Freeman & Grossman 1992; Thompson et al. 2001; Einum et al. 2008), which, together
with our results, reinforce the importance of quantifying spatial variability in resources
availability in habitat and distributional studies of stream fishes (Palmer et al. 1997).
Factors other than resource patchiness also may affect the spatial distribution of chub
in reaches, for example, fish abundance. Indeed, aggregation was strongest when chub
abundance was highest, with small chub in particular being more clumped and forming larger
groups when they were more numerous. This result agrees with other studies showing that the
density of conspecifics may be positively related to aggregation behaviour of fishes (Brown et
al. 1992; Hensor et al. 2005), although it is unknown whether this is social attraction or the
attraction of individuals to highly favourable microhabitats.

3. Distribution and microhabitat use
82
Although small chub generally were aggregated, their abundance was not always
spatially autocorrelated among quadrats. Without using spatially explicit methods this
variability would be impossible to detect, leading to erroneous inferences about the
abundance patterns of small chub (e.g., similar abundance in nearby quadrats). Similarly, the
use of a spatially explicit approach highlighted that spatial autocorrelation in abundance of
large fish was likely due to habitat similarity among neighbor quadrats, because
autocorrelation was not detected when fish abundance was related to autocorrelated habitat
variables in our models. Distribution and microhabitat studies should include spatially explicit
elements, for these will greatly improve our ability to detect and interpret associations
between fish and patchily distributed and spatially correlated physical resources.
Factors influencing the presence and abundance of chub varied substantially between
reaches, suggesting that this species may display flexible microhabitat use. Although our
reaches were located within 2 km of each other, they had distinct physical characteristics,
which may have contributed to promote differential microhabitat use by chub. For instance,
suitable microhabitats may be inherently more limited in Reach 2 than Reach 1 due to its
smaller size, resulting in microhabitats being used according to availability. Flexible
microhabitat use strategies are common among fishes inhabiting Mediterranean streams (e.g.,
Grossman & de Sostoa 1994a, b; Santos et al. 2004; Santos & Ferreira 2008) and other systems
with harsh environmental conditions (e.g., Sinnatamby et al. 2012), and might reflect long-
term adaptations to the highly variable hydrological regimes (Moyle 1995).
We found that chub presence and abundance were largely unrelated to velocity. The
sole exception was small chub in Reach 1 in 2009 and 2010, for which abundance was
negatively associated with velocity. It is possible that small chub were affected by velocity
because of their lack of ability to withstand the negative effects of high velocity compared to
larger individuals (Hill & Grossman 1993; Flore & Keckeis 1998). Velocity is an important

3. Distribution and microhabitat use
83
habitat use component for many drift or epibenthic feeding fishes, because it affects the cost
of holding position, the supply of drifting prey and prey capture success (Facey & Grossman
1990; Hill & Grossman 1993; Piccolo et al. 2008; Hazelton & Grossman 2009). In dry and
normal years, however, other factors may drive microhabitat use and velocity may have little
effect on both fishes and invertebrates as suggested by Grossman & de Sostoa (1994a). Similar
to our findings, Grossman & de Sostoa (1994a) found that substratum composition and depth
were the most important variables for cyprinids microhabitat use in the River Matarrana in dry
years.
Although size-related differences in microhabitat use were not substantial, there was
some variation in microhabitat associations. This was especially evident in Reach 1 in 2009,
when small chub preferred low velocity patches with coarse substrata, debris and roots
whereas large chub preferred deeper patches with aquatic vegetation and roots. Several
investigators have found that large fishes use deeper habitats often as a response to predation
(e.g., Power 1984; Byström et al. 2003). Nevertheless, this is unlikely to be the case here given
piscivorous fish were virtually absent in the study reaches, and otter Lutra lutra L., which is
the main fish predator in the Torgal, largely preys on crayfish and eels from April to October,
with cyprinids being a staple prey in winter only (Beja 1996). Although chub may display some
variation in diet throughout ontogeny (Magalhães 1993), the extent to which this may
contribute to size-related differences in microhabitat use remains uncertain.
Our study assessed the influence of patchiness in physical habitat characteristics on
chub distribution and microhabitat use, however, other factors also may have played a role in
the use of spatial resources by chub in the Torgal and deserve further study. Ontogenetic
changes in foraging behaviour in association with prey availability should be further examined
to help clarify the mechanisms behind size-related differences in chub microhabitat use. In
addition, interactions between chub and other fish species should be examined given

3. Distribution and microhabitat use
84
competition may affect microhabitat use in stream fishes (e.g., Hazelton & Grossman 2009;
Crow et al. 2010). Finally, chub distribution and microhabitat use patterns also should be
assessed in wet years to more rigorously assess the effect of low flows on these patterns.
Nevertheless, our findings may have important implications not only for chub
conservation and management, but also for other fishes in Mediterranean streams, under alter
future climates. Management models based on fish-habitat relationships often consider water
velocity the driving physical factor (e.g., Maddock 1999), and frequently use pooled data from
different reaches or streams (e.g., Gibbins & Acornley 2000; Vismara et al. 2001). We suggest
that in dry and normal years, velocity may be a poor predictor of fish microhabitat use, and
that variation among reaches should not be ignored in favour of the average patterns of
pooled data sets. In addition, we argue that the maintenance of mosaics of patches with
different physical characteristics, specifically, coarse substrata, cover and intermediate depths
may greatly contribute to the persistence of vulnerable fish species in Mediterranean streams
in the face of low flow conditions.

3. Distribution and microhabitat use
85
3.8. References
Angermeier, P.L. & Schlosser, I.J. 1989. Species-area relationship for stream fishes. Ecology 70: 1450-1462.
Anglin, Z.W. & Grossman, G.D. 2013. Microhabitat use by southern brook trout (Salvelinus fontinalis) in a headwater North Carolina stream. Ecology of Freshwater Fish 22: 567-577.
Argentina, J.E., Freeman, M.C. & Freeman, B.J. 2010. The response of stream fish to local and reach-scale variation in the occurrence of a benthic aquatic macrophyte. Freshwater Biology 55: 643-653.
Beja, P.R. 1996. An analysis of otter Lutra lutra predation on introduced American crayfish Procambarus clarkii in Iberian Streams. Journal of Applied Ecology 33: 1156-1170.
Brown, G.E., Brown, J.A. & Srivastava, R.K. 1992. The effect of stocking density on the behaviour of Arctic charr (Salvelinus alpinus L.). Journal of Fish Biology 41: 955-963.
Burnham, K.P. & Anderson, D.R. 2002. Model selection and multimodel inference: a practical information-theoretic approach. New York: Springer Scientific.
Byström, P., Persson, L., Wahlström, E. & Westman, E. 2003. Size- and density-dependent habitat use in predators: consequences for habitat shifts in young fish. Journal of Animal Ecology 72: 156-168.
Carter, M.G., Copp, G.H. & Szomlai, V. 2004. Seasonal abundance and microhabitat use of bullhead Cottus gobio and accompanying fish species in the river Avon (Hampshire), and implications for conservation. Aquatic Conservation: Marine and Freshwater Ecosystems 14: 395-412.
Crawley , M.J. 2007. The R Book. New York: John Wiley.
Crow, S.K., Closs, G.P., Waters, J.M., Booker, D.J. & Wallis, G.P. 2010. Niche partitioning and the effect of interspecific competition on microhabitat use by two sympatric galaxiid stream fishes. Freshwater Biology 55: 967-982.
Cunningham, R.B. & Lindenmayer, D.B. 2005. Modelling count data of rare species: some statistical issues. Ecology 86: 1135-1142.
Dahl, J. & Greenberg, L. 1996. Effects of habitat structure on habitat use by Gammarus pulex in artificial streams. Freshwater Biology 36: 487-495.
Diniz-Filho, J.A.F., Rangel, T.F.L.V.B. & Bini, L.M. 2008. Model selection and information theory in geographical ecology. Global Ecology and Biogeography 17: 479-488.
Donaldson, J.A., Ebner, B.C. & Fulton, C.J. 2013. Flow velocity underpins microhabitat selection by gobies of the Australian wet tropics. Freshwater Biology 58: 1038-1051.
Einum, S., Nislow, K.H., McKelvey, S. & Armstrong, J.D. 2008. Nest distribution shaping within-stream variation in Atlantic salmon juvenile abundance and competition over small spatial scales. Journal of Animal Ecology 77: 167-172.

3. Distribution and microhabitat use
86
Facey, D.E. & Grossman, G.D. 1990. The metabolic cost of maintaining position for four North American stream fishes: effects of season and velocity. Physiological Zoology 63: 757-776.
Flore, L. & Keckeis, H. 1998. The effect of water current on foraging behaviour of the rheophilic cyprinid Chondrostoma nasus (L.) during ontogeny: evidence of a trade-off between energetic gain and swimming costs. Regulated Rivers: Research & Management 14: 141-154.
Freeman, M.C. & Grossman, G.D. 1992. Group foraging by a stream minnow: shoals or aggregations? Animal Behaviour 44: 393-403.
Freeman, M.C. & Grossman, G.D. 1993. Effects of habitat availability on dispersion of a stream cyprinid. Environmental biology of fishes. 37: 121-130.
Gibbins, C.N. & Acornley, R.M. 2000. Salmonid habitat modelling studies and their contribution to the development of an ecologically acceptable release policy for Kielder Reservoir, North-east England. Regulated Rivers: Research & Management 16: 203-224.
Grossman, G.D. 2013. Not all drift feeders are trout: a short review of fitness-based habitat selection models for fishes. Environmental biology of fishes.: DOI 10.1007/s10641-013-0198-3.
Grossman, G.D. & de Sostoa, A. 1994a. Microhabitat use by fish in the lower Rio Matarraña, Spain, 1984–1987. Ecology of Freshwater Fish 3: 123-136.
Grossman, G.D. & de Sostoa, A. 1994b. Microhabitat use by fish in the upper Rio Matarraña, Spain, 1984–1987. Ecology of Freshwater Fish 3: 141-152.
Grossman, G.D., Dowd, J. & Crawford, M. 1990. Assemblage stability in stream fishes: a review. Environmental Management 14: 661-671.
Grossman, G.D., Hill, J. & Petty, J.T. 1995. Observations on habitat structure, population regulation, and habitat use with respect to evolutionarily significant units: a landscape perspective for lotic systems. American Fisheries Society Symposium 17: 381-391.
Grossman, G.D. & Ratajczak, R.E. 1998. Long-term patterns of microhabitat use by fish in a southern Appalachian stream from 1983 to 1992: effects of hydrologic period, season and fish length. Ecology of Freshwater Fish 7: 108-131.
Grossman, G.D. & Skyfield, J. 2009. Quantifying microhabitat availability: stratified random versus constrained focal-fish methods. Hydrobiologia 624: 235-240.
Hart, D.D. & Finelli, C.M. 1999. Physical-biological coupling in streams: the pervasive effects of flow on benthic organisms. Annual Review of Ecology and Systematics 30: 363.
Hazelton, P.D. & Grossman, G.D. 2009. The effects of turbidity and an invasive species on foraging success of rosyside dace (Clinostomus funduloides). Freshwater Biology 54: 1977-1989.
Hensor, E., Couzin, I.D., James, R. & Krause, J. 2005. Modelling density-dependent fish shoal distributions in the laboratory and field. Oikos 110: 344-352.
Hildrew, A.G. & Giller, P.S. 1994. Patchiness and species interactions and disturbance in the stream benthos. In: Giller, P.S., Hildrew, A.G. & Raffaelli, D.G., eds. Aquatic Ecology: Scale, Pattern, Process (34th Symposium of the British Ecological Society). London: Blackwell Publications, pp. 21-62.

3. Distribution and microhabitat use
87
Hill, J. & Grossman, G.D. 1993. An energetic model of microhabitat use for rainbow trout and rosyside dace. Ecology 74: 685-698.
Hosmer, D.W.J. & Lemeshow, S. 1989. Applied logistic regression. New York: Wiley.
IPCC. 2008. Climate change and water. In: Bates, B.C., Kundzewicz, Z.W., Wu, S. & Palutikof, J.P., eds. Technical paper of the intergovernmental panel on climate change technical paper IV. Geneva: IPCC Secretariat.
Joy, M.K. & Death, R.G. 2002. Predictive modelling of freshwater fish as a biomonitoring tool in New Zealand. Freshwater Biology 47: 2261-2275.
Keitt, T.H., Bjornstad, O.N., Dixon, P.M. & Citron-Pousty, S. 2002. Accounting for spatial pattern when modeling organism-environment interactions. Ecography 25: 616-625.
Kotliar, N.B. & Wiens, J.A. 1990. Multiple scales of patchiness and patch structure: a hierarchical framework for the study of heterogeneity. Oikos 59: 253-260.
Krebs, C.J. 1989. Ecological Methodology. New York: Harper & Row.
Lake, P.S. 2000. Disturbance, patchiness, and diversity in streams. Journal of the North American Benthological Society 19: 573-592.
Lancaster, J. 2006. Using neutral landscapes to identify patterns of aggregation across resource points. Ecography 29: 385-395.
Lancaster, J., Downes, B. & Reich, P. 2003. Linking landscape patterns of resource distribution with models of aggregation in ovipositing stream insects. Journal of Animal Ecology 72: 969-978.
Lancaster, J., Downes, B.J. & Glaister, A. 2009. Interacting environmental gradients, trade-offs and reversals in the abundance–environment relationships of stream insects: when flow is unimportant. Marine and Freshwater Research 60: 259-270.
Legendre, P. & Legendre, L. 1998. Numerical Ecology. Amsterdam: Elsevier.
Maddock, I. 1999. The importance of physical habitat assessment for evaluating river health. Freshwater Biology 41: 373-391.
Magalhães, M.F. 1993. Feeding of an Iberian stream cyprinid assemblage: seasonality of resource use in a highly variable environment. Oecologia 96: 253-260.
Magalhães, M.F., Beja, P., Canas, C. & Collares-Pereira, M.J. 2002. Functional heterogeneity of dry-season fish refugia across a Mediterranean catchment: the role of habitat and predation. Freshwater Biology 47: 1919-1934.
Magalhães, M.F., Beja, P., Schlosser, I.J. & Collares-Pereira, M.J. 2007. Effects of multi-year droughts on fish assemblages of seasonally drying Mediterranean streams. Freshwater Biology 52: 1494-1510.
Magalhães, M.F., Schlosser, I.J. & Collares-Pereira, M.J. 2003. The role of life history in the relationship between population dynamics and environmental variability in two Mediterranean stream fishes. Journal of Fish Biology 63: 300-317.

3. Distribution and microhabitat use
88
Martelo, J., Grossman, G.D. & Magalhães, M.F. 2013. Extrinsic and intrinsic factors influence daily activity of a Mediterranean cyprinid. Ecology of Freshwater Fish 22: 307-316.
Martínez-Capel, F., García de Jalón, D., Werenitzky, D., Baeza, D. & Rodilla-Alamá, M. 2009. Microhabitat use by three endemic Iberian cyprinids in Mediterranean rivers (Tagus river basin, Spain). Fisheries Management and Ecology 16: 52-60.
Millán, M.M., Estrela, M.J. & Miró, J. 2005. Rainfall components: variability and spatial distribution in a Mediterranean area (Valencia region). Journal of Climate 18: 2682-2705.
Moyle, P.B. 1995. Conservation of native freshwater fishes in the Mediterranean-type climate of California, USA: A review. Biological Conservation 72: 271-279.
Palmer, M.A., Hakenkamp, C.C. & Nelson-Baker, K. 1997. Ecological heterogeneity in streams: why variance matters. Journal of the North American Benthological Society 16: 189-202.
Palmer, M.A. & Poff, N.L. 1997. The influence of environmental heterogeneity on patterns and processes in streams. Journal of the North American Benthological Society 16: 169-173.
Petty, J.T. & Grossman, G.D. 2010. Giving-up densities and ideal pre-emptive patch use in a predatory benthic stream fish. Freshwater Biology: 780-793.
Piccolo, J.J., Hughes, N.F. & Bryant, M.D. 2008. Water velocity influences prey detection and capture by drift-feeding juvenile coho salmon (Oncorhynchus kisutch) and steelhead (Oncorhynchus mykiss irideus). Canadian Journal of Fisheries & Aquatic Sciences 65: 266-275.
Pires, D.F. 2012. Fish distribution and abundance in Mediterranean streams: the role of habitat quality, spatial context, and movement patterns.Ph.D. Thesis. Lisbon: University of Lisbon.
Potts, J.M. & Elith, J. 2006. Comparing species abundance models. Ecological Modelling 199: 153-163.
Power, M.E. 1984. Depth distributions of armored catfish: predator-induced resource avoidance? Ecology 65: 523-528.
Pringle, C.M., Naiman, R.J., Bretschko, G., Karr, J.R., Oswood, M.W., Jackson, R.W., Welcomme, R.L. & Winterbourn, M.J. 1988. Patch dynamics in lotic systems: the stream as a mosaic. Journal of the North American Benthological Society 7: 503-524.
Rogado, L., Alexandrino, P.J., Almeida, P.R., Alves, M.J., Bochechas, J., Cortes, R.V., Domingos, M.I., Filipe, A.F., Madeira, J. & Magalhães, M.F. 2005. Peixes dulciaquicolas e migradores. In: Cabral, M.J., Almeida, J., Almeida, P.R., Dellinger, T., Ferrand de Almeida, N., Oliveira, M.E., Palmeirim, J.M., Queiroz, A.I., Rogado, L. & Santos-Reis, M., eds. Livro Vermelho dos Vertebrados de Portugal. Lisboa: Instituto da Conservação da Natureza.
Santos, J.M. & Ferreira, M.T. 2008. Microhabitat use by endangered Iberian cyprinids nase Iberochondrostoma almacai and chub Squalius aradensis. Aquatic Sciences 70: 272-281.
Santos, J.M., Godinho, F.N. & Ferreira, M.T. 2004. Microhabitat use by Iberian nase Chondrostoma polylepis and Iberian chub Squalius carolitertii in three small streams, north-west Portugal. Ecology of Freshwater Fish 13: 223-230.

3. Distribution and microhabitat use
89
Sinnatamby, R.N., John, A.B., Geoff, P., James, D.R. & Michael, P. 2012. Summer habitat use and feeding of juvenile Arctic charr, Salvelinus alpinus, in the Canadian High Arctic. Ecology of Freshwater Fish 21: 309-322.
Smith, K.G. & Darwall, W.R.T. 2006. The Status and distribution of freshwater fish endemic to the Mediterranean basin. Gland: IUCN – The World Conservation Union.
Thompson, A.R., Petty, J.T. & Grossman, G.D. 2001. Multi-scale effects of resource patchiness on foraging behaviour and habitat use by longnose dace, Rhinichthys cataractae. Freshwater Biology 46: 145-160.
Torgersen, C.E. & Close, D.A. 2004. Influence of habitat heterogeneity on the distribution of larval Pacific lamprey (Lampetra tridentata) at two spatial scales. Freshwater Biology 49: 614-630.
Vismara, R., Azzellino, A., Bosi, R., Crosa, G. & Gentili, G. 2001. Habitat suitability curves for brown trout (Salmo trutta fario L.) in the river Adda, Northern Italy: comparing univariate and multivariate approaches. Regulated Rivers: Research & Management 17: 37-50.
Wenger, S.J. & Freeman, M.C. 2008. Estimating species occurrence, abundance, and detection probability using zero-inflated distributions. Ecology 89: 2953-2959.
Winemiller, K.O., Flecker, A.S. & Hoeinghaus, D.J. 2010. Patch dynamics and environmental heterogeneity in lotic ecosystems. Journal of the North American Benthological Society 29: 84-99.
Wootton, R.J. 1990. Life-history strategies. In: Wootton, R.J., ed. Ecology of teleost fishes. Dordrecht: Kluwer Academic Publishers.
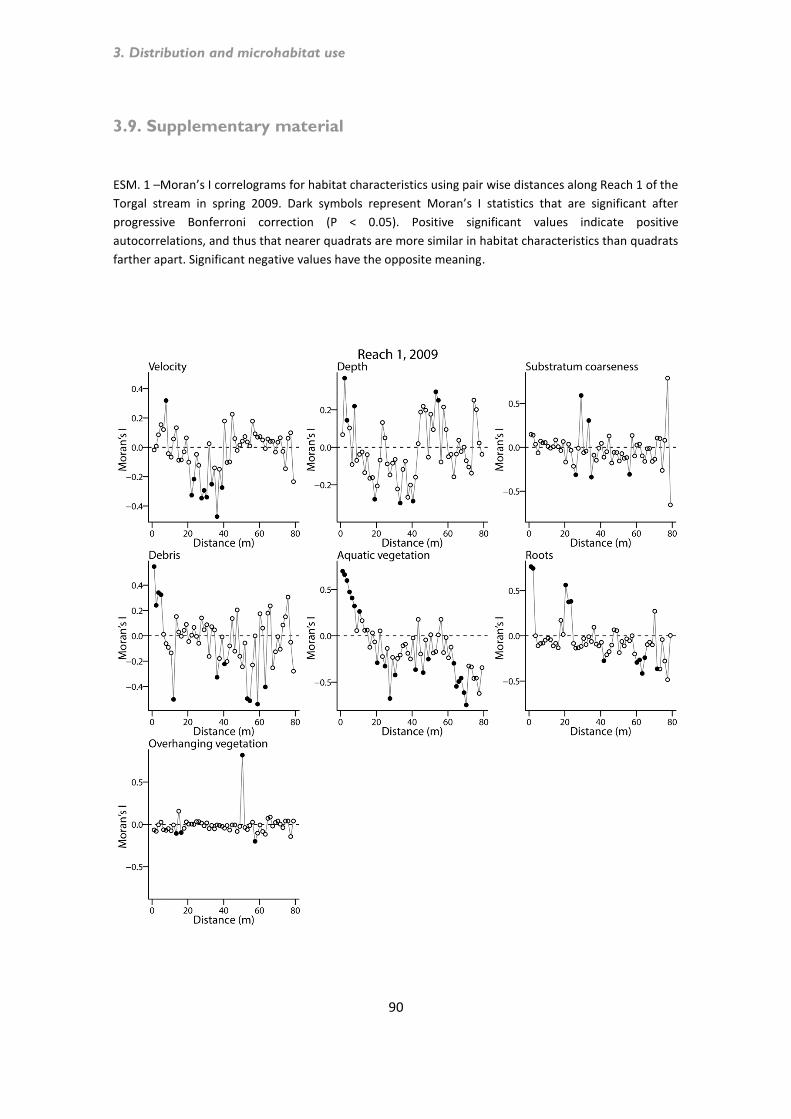
3. Distribution and microhabitat use
90
3.9. Supplementary material
ESM. 1 –Moran’s I correlograms for habitat characteristics using pair wise distances along Reach 1 of the
Torgal stream in spring 2009. Dark symbols represent Moran’s I statistics that are significant after
progressive Bonferroni correction (P < 0.05). Positive significant values indicate positive
autocorrelations, and thus that nearer quadrats are more similar in habitat characteristics than quadrats
farther apart. Significant negative values have the opposite meaning.

3. Distribution and microhabitat use
91
ESM. 2 –Moran’s I correlograms for habitat characteristics using pair wise distances along Reach 1 of the
Torgal stream in spring 2010. Dark symbols represent Moran’s I statistics that are significant after
progressive Bonferroni correction (P < 0.05). Positive significant values indicate positive
autocorrelations, and thus that nearer quadrats are more similar in habitat characteristics than quadrats
farther apart. Significant negative values have the opposite meaning.

3. Distribution and microhabitat use
92
ESM. 3 –Moran’s I correlograms for habitat characteristics using pair wise distances along Reach 2 of the Torgal
stream in spring 2010. Dark symbols represent Moran’s I statistics that are significant after progressive Bonferroni
correction (P < 0.05). Positive significant values indicate positive autocorrelations, and thus that nearer quadrats are
more similar in habitat characteristics than quadrats farther apart. Significant negative values have the opposite
meaning.
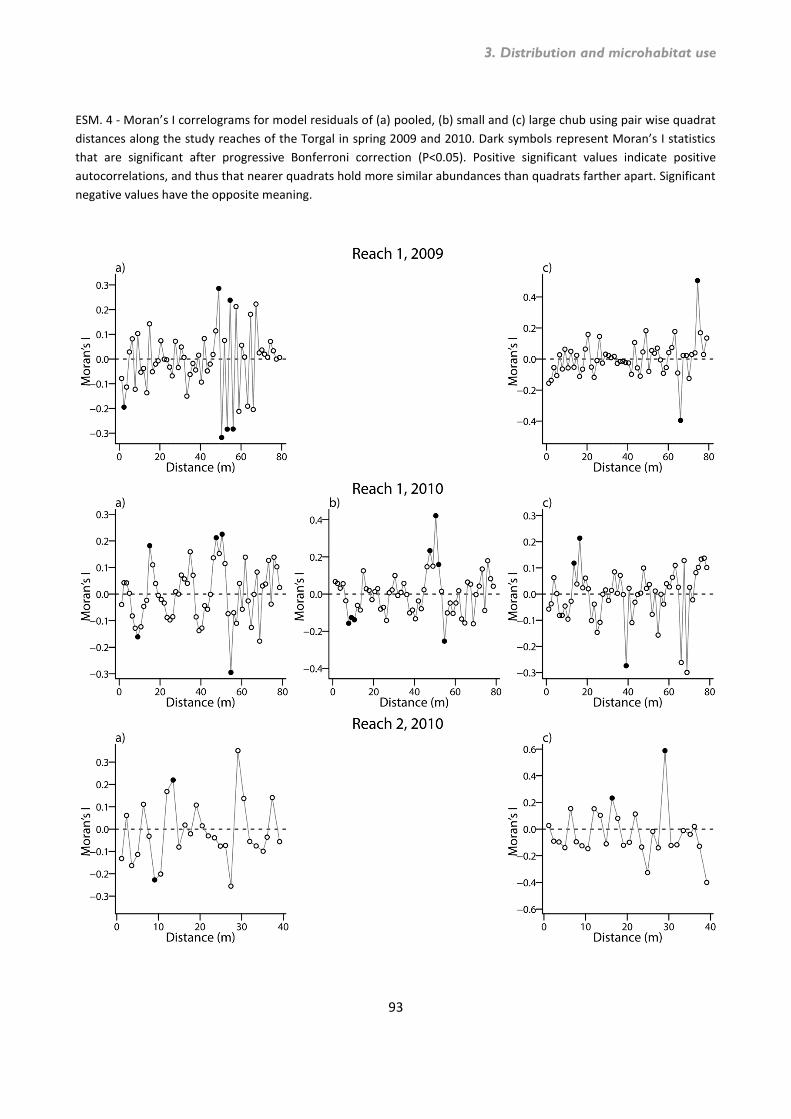
3. Distribution and microhabitat use
93
ESM. 4 - Moran’s I correlograms for model residuals of (a) pooled, (b) small and (c) large chub using pair wise quadrat
distances along the study reaches of the Torgal in spring 2009 and 2010. Dark symbols represent Moran’s I statistics
that are significant after progressive Bonferroni correction (P<0.05). Positive significant values indicate positive
autocorrelations, and thus that nearer quadrats hold more similar abundances than quadrats farther apart. Significant
negative values have the opposite meaning.


Chapter 4.
Linking microhabitat use with models of
foraging success in the endangered Mira chub
Squalius torgalensis
Manuscript


4. Focal microhabitat use and foraging success
95
4. Linking microhabitat use with models of foraging success in
the endangered Mira chub Squalius torgalensis
4.1. Abstract
Identification of essential habitats and the mechanisms affecting habitat selection is critical for
Mediterranean cyprinids. Here, we explored the link between focal velocity use and foraging
success of the imperilled chub Squalius torgalensis in two reaches of the Torgal stream under
low flows. Specifically, during spring 2009 and 2010, we quantified habitat selection in relation
to velocity, substrata and vegetation conditions prevailing in the field, and tested for variation
between reaches, years and length classes. In the laboratory, we quantified variation in the
proportion of fish capturing prey in relation to a range of velocity, fish density, group
composition and individual length, and then examined whether this variation could reflect
differences in individual capture success and reactive distance. Generally, chub displayed
random microhabitat use irrespective of size. There was no selection for the low velocities
prevailing in the field, though chub occasionally selected areas with boulders, roots and
aquatic vegetation. The proportion of fish capturing prey decreased with velocity, and also
with density and in groups including large individuals. Similarly, velocity negatively affected
capture success and both capture success and reactive distance decreased with density.
Results suggest that, under a range of low values, velocity may have little or no effect on
microhabitat use by chub because capture success was high, but that increases in velocity may
result in less prey captures, even though chub may still have the potential to capture prey at
high flows. Our findings provide direct observation data on habitat and foraging success that
are crucial for understanding the process of habitat selection by chub, and clearly point to the

4. Focal microhabitat use and foraging success
96
importance of quantifying habitat choice in Mediterranean cyprinids using mechanistic,
fitness-based criteria.
4.2. Introduction
Streams are highly heterogeneous in their physical characteristics, in both space and time, and
over a broad range of scales (Palmer et al. 1997; Ward et al. 2002; Winemiller et al. 2010). This
variability may manifest itself in habitat selection by stream fishes, which often prefer certain
habitats and avoid others (e.g., Santos & Ferreira 2008; Martínez-Capel et al. 2009; Kanno et
al. 2012; Anglin & Grossman 2013). However, there is still a limited biologically realistic
understanding of the factors determining habitat selection in stream fishes, although it has
been considered essential for both basic scientific and management/conservation perspectives
(Grossman 2014).
Microhabitat habitat selection by stream fishes typically is quantified by comparing
habitat availability to habitat use, either using fish-habitat relationships (Santos et al. 2010;
Compton & Taylor 2013; Martelo et al. 2014; McEwan & Joy 2014) or via direct observation of
individual fishes (Martínez-Capel et al. 2009; Kanno et al. 2012; Anglin & Grossman 2013).
Water velocity frequently has a strong effect on microhabitat selection (e.g., Hill & Grossman
1993; Santos & Ferreira 2008; Donaldson et al. 2013), though it may be most influential for
drift-feeding fishes because it controls both the energy expended to maintain position and
access to prey (Facey & Grossman 1990; Hughes & Dill 1990; Hill & Grossman 1993). However,
relatively few studies have attempted to identify the mechanisms underlying selection for
microhabitats with particular velocities. For example, it is still unclear whether individual fishes

4. Focal microhabitat use and foraging success
97
select these microhabitats because they have higher net energy gain, greater protection from
predators, or greater swimming efficiency.
Mechanistic habitat selection models generally are based on optimal foraging theory,
and assume that individuals will occupy microhabitats that yield the highest rates of net
energy intake, and consequently increase their fitness (see Grossman 2014 and references
therein). The majority of foraging models have been developed for salmonids (Hughes & Dill
1990; Nislow et al. 1999; Piccolo et al. 2014) and far fewer are available for cyprinids (but see
Hill & Grossman 1993; Grossman et al. 2002; Hazelton & Grossman 2009), despite the fact that
they are among the most diverse and imperilled fishes worldwide (Jelks et al. 2008). In general,
foraging models demonstrate that prey encounter rates and energy expenditures increase
with velocity whereas capture success decreases, with maximum energy intake typically
occurring at intermediate velocities. The accuracy of predictions of foraging models frequently
are more sensitive to changes in benefits than they are to changes in costs (Hughes & Dill
1990; Hill & Grossman 1993, but see Hughes et al. 2003), and models based solely on prey
capture success have successfully predicted focal point velocities occupied by cyprinids
(Grossman et al. 2002).
Studies on habitat use by Mediterranean cyprinids have increased significantly in
recent years (Santos et al. 2004; Santos & Ferreira 2008; Martínez-Capel et al. 2009; Martelo et
al. 2014), but there is still a dearth of information regarding the mechanisms underlying
habitat choice. In addition, there is considerable controversy about the factors influencing
habitat use, with substratum coarseness, roots, aquatic vegetation and depth emerging as
prevalent for some species (Grossman & de Sostoa 1994a, b; Martelo et al. 2014) whereas
velocity appears the most influential factor for others (Santos et al. 2004; Santos & Ferreira
2008; Martínez-Capel et al. 2009; Santos et al. 2010).
4. Focal microhabitat use and foraging success
98
Clarifying microhabitat use, especially velocity selection, and understanding how it may be
related to foraging success, is therefore important for Mediterranean cyprinids, which face
increasing alteration and loss of aquatic habitats (Smith & Darwall 2006).
In this study, we combined field observations on microhabitat selection with
laboratory experiments on foraging success, in an attempt to identify the functional
mechanism that may determine microhabitat selection by Mira chub Squalius torgalensis in
the Torgal stream. Specifically, laboratory studies on foraging success were conducted over a
range of velocities typically occurring during low and high flows, and the former was compared
with field observations of focal velocity use during low flows. Our objectives were to: 1)
quantify microhabitat use by chub and analyse differences among reaches, years and length
classes, 2) quantify the effects of velocity, fish density, group composition, and individual
length on foraging success, and 3) compare patterns of foraging success at a given focal point
velocity to focal points occupied by chub in the Torgal stream.
4.3. Methods
Study reaches and species
The study was conducted in two reaches of the Torgal, a small (28 km) Mediterranean stream
situated in the SW Portugal (37°38’N, 8°39’W). In brief, the Torgal basin drains siliceous
igneous rocks, slates and greywackes. The landscape comprises cork oak Quercus suber
woodlands and eucalyptus Eucaliptus globulus plantations interspersed with pasture and dry
grain fields. Riparian vegetation is dominated by well developed galleries of alder Alnus
glutinosa and ash Fraxinus angustifolia, with an understory of Mediterranean scrub. Human
settlement is sparse and there are no major anthropogenic impacts such as urban pollution,

4. Focal microhabitat use and foraging success
99
impoundments, angling or other recreational activities. Because of the Mediterranean climate,
the stream experiences wet and dry periods that are seasonally predictable but show variable
intensity from year-to-year. Headwaters are ephemeral and downstream reaches typically
consist of dry to isolated pools and runs in summer. In dry years, large floods are lacking, the
drying period is extended, and surface water is restricted to the deepest pools. Conversely, in
wet years there are major floods, and flows may persist through summer in downstream
reaches.
The study reaches were located in the downstream portion of the Torgal stream and
consisted of relatively shallow runs (< 80 cm deep in spring), with clear water, intact riparian
vegetation and persistent flows through summer. The upstream reach (Reach 1) was 80 m in
length, and bounded by deep pools and shallow rapids with boulders whereas the lower reach
(Reach 2) was 40 m in length and bounded by deep pools and gravel bars. The fish
assemblages of study reaches included six native species although chub dominated
assemblages in abundance (72 - 87%) and biomass (Martelo et al. 2014). Southwestern arched-
mouth nase Iberochondrostoma almacai (4 - 12%) was the next most abundant species
occurring in both reaches and years. Western three-spine stickleback Gasterosteus gymnurus
(7%), European eel Anguilla Anguilla (0.3%) and Southern Iberian spined-loach Cobitis paludica
(0.3%) also were present but only in Reach 1 in 2009 whereas, Southern Iberian barbel
Luciobarbus sclateri (23%) was present only in Reach 2 in 2010. The exotic pumpkinseed
Lepomis gibbosus occurred throughout the study, but always in low numbers (0.3-1%).
Chub are endemic to SW Portugal, and currently listed as critically endangered
according to the Portuguese Red Data Book (Rogado et al. 2005). Chub are small (maximum 16
cm, total length), short-lived (maximum age 5+ years), early maturing (all individuals are
sexually mature at age 2+ years) (Magalhães et al. 2003), and occupy mid-water column
microhabitats (Martelo et al. 2013). Individuals show some flexibility in foraging behaviour,

4. Focal microhabitat use and foraging success
100
shifting between drifting and benthic feeding depending on prey availability (Martelo et al.
2013). Generally, chub spawn in spring, between March and June, and have low reproductive
allocation (Magalhães et al. 2003). Annual recruitment tends to be severely reduced during dry
years (Magalhães et al. 2003; Magalhães et al. 2007). Mobility may vary both among
individuals and over time, tending to be greater among chubs leaving dry season pools (Pires
et al. 2014).
Microhabitat availability and use
Microhabitat availability and use were quantified in Reach 1 in late spring 2009 and 2010 and
in Reach 2 in late spring 2010. We sampled in late spring to avoid biases produced by
reproductive behaviour and we observed no reproductive behaviour during sampling. Rainfall
records from a gauging station located near the study sites (37°42′N, 8°32′W), indicate that
October 2008 to September 2009 was the driest 12 month period on record in the Torgal
stream since 1931 (129 mm). In addition, rainfall in the following year (October 2009 to
September 2010), also was close to the long-term annual median (690 versus 658 mm).
We quantified microhabitat availability and use following the methods described in
Grossman & de Sostoa (1994a, b) and Inoue & Nunokawa (2002). In brief, we established a 1 x
1 m grid over the wetted channel of the study reach using transect ropes and numbered
spikes. Spikes were driven into the banks at the ends of transect lines, and marked with
coloured tape. Microhabitat availability was quantified using a stratified random sampling
design, selecting 80% of quadrats in the mid channel and 10% along each margin. Depth
(meter stick, ± 1 cm) and average current velocity (Global Water FP101 electronic velocity
meter, ± 3 cm.s-1) were measured at the centre of each quadrat. Average current velocity was

4. Focal microhabitat use and foraging success
101
measured at 60% depth in quadrats ≤ 75 cm deep, and at 20% and 80% depth in quadrats > 75
cm deep. In addition, we visually estimated the proportions of nine habitat variables in a 20 x
20 cm quadrat in the centre of the 1 x 1m quadrats. We categorized substrata based on
maximum linear dimension, as: mud (≤ 0.2 cm), gravel (0.3 – 2.5 cm), small cobble (2.6 - 15
cm), large cobble (16 – 30 cm), and boulders (> 30 cm). The remaining habitat variables were
the proportions of roots, debris, aquatic vegetation, and overhanging vegetation (< 50 cm
above water surface).
We quantified microhabitat use via snorkelling by entering the reach from
downstream and slowly moving upstream to minimize disturbance. Upon sighting an
undisturbed fish, its exact position was marked using a numbered weight, its species identified
and its standard length (SL, cm, ± 1 cm) visually estimated. Fish less than 5 cm, SL, were
excluded because they were not reliably identifiable to species underwater. Habitat variables
were then measured at each fish location as described above.
Foraging success experiments
Although our primary objective was to quantify the effects of water velocity on foraging
success of chub, experiments also included fish length, fish density and group composition as
treatments, because these factors also may affect foraging success (Hazelton & Grossman
2009; Kaspersson et al. 2010).
Following the methods of Zamor & Grossman (2007) and Hazelton & Grossman (2009),
an 2.0 x 1.0 x 0.6 m (length x width x height) fiberglass tank was used, in which a 25 Kg thrust
electric trolling motor generated flow. The experimental chamber (1.0 x 0.6 x 0.5 m), was
enclosed at each end with mesh screens that acted as collimators to produce semilaminar
flow, and had a 2 cm layer of small cobble. We marked the experimental chamber at 1 cm

4. Focal microhabitat use and foraging success
102
intervals on the bottom and sides of the front wall, and placed 1 cm2 plastic quadrats across its
bottom, at 10 cm intervals, to facilitate location of individuals. Temperature was maintained at
15 - 17 0C, pH near 7, and 12h:12h photoperiod, which represent spring average conditions at
the Torgal stream in the study years.
We collected 432 chub, 216 small chub measuring 6.0 - 7.0 cm fork length (FL ± SD =
6.4 ± 0.3 cm; mass ± SD = 3.4 ± 0.6 g) and 216 large chub measuring 8.0 - 9.0 cm (FL ± SD = 8.3
± 0.4, mass ± SD = 7.6 ± 1.2 g), in March and April 2009 and between November 2009 and July
2010 in the Torgal stream, using minnow traps. None of these fish showed evidence of
physiological stress or injuries. For acclimation to the laboratory, fish were held in a 900 L
fiberglass recirculating tank with water conditions similar to those in the experimental tank for
three days. This period allowed fish to recover from collection stress and exhibit normal
feeding. Fish were fed red chironomid larva ad libitum once daily. We used red chironomid
larva because they are comparable to natural chironomid in chubs’ diet (Magalhães 1993a, b),
and were readily visible and consumed by chub. After acclimation, individuals were
anaesthetised with clove oil, measured (± 1 mm, FL), and tagged with coloured plastic discs
posterior to the dorsal fin (Hazelton & Grossman 2009). To prevent infections from tagging,
fish were treated with antibiotic (MyOxin). After tagging, we kept fish for three additional days
in the holding tank, to assure they recovered and regained balance and swimming. Prior to
experiments, fish were moved into a separated chamber of the holding tank for a 48 hour non-
feeding period, to ensure all individuals were motivated to feed. Because of the imperilled
status of chub, after experiments chub in good condition (i.e., feeding normally and with no
external parasites) were returned to the Torgal stream. Laboratory procedures conformed to
the Portuguese legislation regarding animal capture (ICNB), manipulation and experimentation
for scientific purposes, and IAUCUC guidelines of the University of Georgia.

4. Focal microhabitat use and foraging success
103
To test for the effects of fish density, fish length, and group composition, trials were
conducted with groups of two, four and six individuals belonging to either one or two length
classes (i.e., small and large chub). These trials included: 1) trials with varying densities of a
single length group (either small or large), and 2) trials with varying length groups and varying
densities (one large and small chub, two large and small chub, and finally, three large and small
chub). Each combination was tested at four average velocities, two (0.2 and 8 cm.s-1)
encompassing the range of velocities occupied by chub during the study, and two (12 and 26
cm.s-1) representing velocities prevailing in the Torgal stream during moderate to high flows
(Pires 2012). These resulted in 36 treatment combinations, which were replicated three times,
thus totalizing 108 independent trials. Each fish was used in only one trial.
Before trials began, fish were allowed three hours to acclimate to the experimental
tank and return to active feeding. During acclimation, velocity was increased gradually to the
treatment level. Velocities were measured using an electronic velocity meter (Global Water
FP101 ± 3 cm.s-1) at 60% depth, and also mapped in 10 × 10 cm grids at three cross-sections of
the tank (length x width x height). Velocity across the tank varied less than 2 cm.s-1 in all
treatments except 26 cm.s-1, for which variation was between 4 and 6 cm.s-1.
During each trial fish behaviour was observed and videotaped from behind a black
plastic blind. A trial consisted of the 20 releases of individual prey, at approximately two
minute intervals, through one of three randomly selected (random number generator) silicone
tubes at the front of the experimental chamber. Fish were classified as reacting to prey if they
oriented directly towards the prey. A capture represented a fish grasping a prey independently
of whether or not the prey was consumed. If a fish did not react after presentation of five
consecutive prey, we removed it from the tank and did not include the data in analyses.
Reactive distance was measured by recording the locations of both fish and prey at the time
the fish oriented to the prey (Hazelton & Grossman 2009).

4. Focal microhabitat use and foraging success
104
4.4. Data analyses
4.4.1. Microhabitat availability and use
Prior to statistical analyses, we transformed skewed habitat variables to approach normality
and reduce the influence of peak values, using the angular transformation for proportional
data and the log10 transform for continuous variables.
Because some habitat variables were strongly intercorrelated (Pearson’s r, | r | ≥
0.50), we used Principal Components Analysis (PCA) to describe the main gradients of variation
in microhabitat use and availability (Legendre & Legendre 1998). To avoid bias in the
ordination, overhanging vegetation was excluded from analysis because it included a large
number of zeros (95%). We tested the null hypothesis of randomness in microhabitat use using
non-parametric Mann-Whitney U-tests (Zar 1996), with significance set at 0.05, and adjusted
for multiple testing using the Bonferroni sequential method (Legendre & Legendre 1998).
Additionally, for clarity of presentation we plotted the 95% confidence ellipses of mean scores
for microhabitat availability and use in the ordination diagram (Anglin & Grossman 2013). For
consistency between field and laboratory data, fish SL was converted into FL (fork length) using
linear regression (FL = 0.1387 + 1.1023SL, R2 = 0.99, F = 8361.8, P < 0.0001, n = 93). We
compared scores for small (6.0 - 7.0 cm, FL) and large (8.0 - 9.0 cm, FL) chub using Mann-
Whitney U-tests (Zar 1996), because previous studies have demonstrated that length-related
variations in microhabitat use by stream fishes are common (Grossman & de Sostoa 1994a, b;
Santos & Ferreira 2008). Analyses were conducted with the STATISTICA vs.10.0 software
(StatSoft 2011).

4. Focal microhabitat use and foraging success
105
4.4.2. Foraging success
Analysis of foraging success involved a two-stage procedure based on information theoretic
and model averaging approaches (Burnham & Anderson 2002). We started by quantifying
variation in the proportion of fish capturing prey among trials and identifying which variables
could explain it, and then examined whether this variation could reflect individual differences
in capture success and reactive distance. Because fish density in experiments varied from 2 to
6, but the number of prey released was constant among trials, the probability that an
individual will capture a prey will inevitably decrease with density. To account for this trivial
density effect, we included the number of prey per fish per trial in all candidate models as a
fixed effect explanatory variable.
Proportion of fish capturing prey
We quantified relationships between the proportion of fish capturing prey among trials and
explanatory variables with generalized linear models using the binomial distribution with logit
link (Crawley 2007). Explanatory variables included velocity, fish density, and group
composition. Group composition was defined using two binary variables describing the
presence of small and large fish in the group (i.e., groups containing small individuals were
coded as 1/0, groups containing large individuals were coded 0/1, and groups containing both
small and large individuals were coded as 1/1). Explanatory variables were standardized to a
mean of 0 and a standard deviation of 1 to facilitate interpretation of relative effect sizes
(Crawley 2007; Hazelton & Grossman 2009). Except small and large, which were used together
for analyses, there were no significant correlations between explanatory variables (Pearson’s r,
| r | < 0.001).

4. Focal microhabitat use and foraging success
106
Capture success and reactive distance
To identify factors affecting individual capture success and reactive distance, we used
generalized linear mixed models (GLMM, Zuur et al. 2009). Capture success in each fish’s
response to individual prey was a binary variable (0 = no capture, 1 = capture), and thus we
used the binomial distribution with logit link for capture success models (Crawley 2007).
Reactive distance was only determined for individuals that reacted to prey; it corresponded to
the distance between the coordinates of the fish’s snout (i.e., x1, y1, z1) and the prey (i.e., x2, y2,
z2), at the moment fish oriented towards the prey, calculated using the Pythagorean theorem
as follows: distance = √(x2 – x1)2 + (y2 – y1)
2 + (z2 – z1)2 (Zamor & Grossman 2007). The normal
distribution with identity link was used for reactive distance models (Crawley 2007).
Explanatory fixed variables included velocity, fish density, fish length (FL), and group
composition as a binary variable (0 = homogeneous length classes, 1 = heterogeneous length
classes). These variables also were standardized to a mean of 0 and a standard deviation of 1
(Crawley 2007; Hazelton & Grossman 2009), and all variables were used in analyses because
they were not correlated (Pearson’s r, | r | ≤ 0.05).We investigated two random effects
structures because observations likely were not independent both within and among
individuals (Zuur et al. 2009). The first included a random effect of fish identity to account for
correlation in capture success and reactive distance within individuals. The second allowed the
relationship between capture success and reactive distance and fish length to vary among
individuals. We selected the best random effects structure using Akaike’s Information Criterion
(AIC, Burnham & Anderson 2002), from models including the same fixed effects structure and
all explanatory variables.

4. Focal microhabitat use and foraging success
107
4.4.3. Model selection and averaging
We constructed two sets of mechanistic, a priori candidate models of increasing complexity
(Table 1), nine for the proportion of fish capturing prey per trial and 16 for individual capture
success and reactive distance. The simplest models considered only the intercept, whereas the
most complex models included all explanatory variables (i.e., global models). Global models
were fitted and checked for normally distributed errors by examining residual plots (Crawley
2007). Reactive distance was then log transformed to ensure normality of errors.
Table 1 – Candidate models used to evaluate relationships between the proportion of chub capturing
prey per trial, and the individual capture success and reactive distance and explanatory variables. All
models included prey.fish-1
to correct for the eventual trivial effects of density.
No. Model description
Proportion of fish capturing prey
1 Velocity 2 Density 3 Small + large 4 Velocity + density 5 Velocity + small + large 6 Density + small + large 7 Velocity + density + velocity x density 8 Global 9 Intercept
Capture success and reactive distance
1 Velocity 2 Density 3 Group composition 4 Length 5 Velocity + density 6 Velocity + group composition 7 Velocity + length 8 Velocity + density + group composition 9 Density + group composition 10 Velocity + density + velocity x density 11 Velocity + group composition + velocity x group composition 12 Velocity + length + velocity x length 13 Density + group composition + density x group composition
14 Velocity + density + group composition + velocity x density x group composition
15 Global 16 Intercept

4. Focal microhabitat use and foraging success
108
The relative support for each of the candidate models was assessed via ΔAIC with
models for which ΔAIC < 2 having substantial support (Burnham & Anderson 2002). Akaike
weights (wi) of the models were then calculated and only models with Akaike weights > 10% of
the model with the best fit were interpreted (Burnham & Anderson 2002; Hazelton &
Grossman 2009). For the proportion of fish capturing prey, we quantified model selection
uncertainty by calculating model-averaged coefficient estimates (β) and evaluating the
precision of these estimates using 85% confidence intervals (Arnold 2010). Estimates whose
confidence intervals included zero were not interpreted. Additionally, we estimated the
relative importance of explanatory variables (w+) by summing their Akaike weights over all
interpretable models where the variable was included (Burnham & Anderson 2002). For
capture success and reactive distance, coefficient estimates and 85% confidence intervals were
not model-averaged as this is inappropriate for models containing both random and fixed
effects (Kenneth Burnham, personal communication).
Finally, we calculated goodness of fit for the interpretable models (R2). For capture
success and reactive distance models we produced two statistics for each interpretable model
– R 2 marginal (R2m) that indicates the variability explained by fixed effects, and R 2 conditional
(R2c) that indicates the variability explained by random and fixed effects (Nakagawa &
Schielzeth 2013). Analyses were conducted using R 2.15.2 (package MuMIn, Barton 2011 and
package lme4, Bates et al. 2012) and the STATISTICA vs.10.0 software (StatSoft 2011).

4. Focal microhabitat use and foraging success
109
4.5. Results
4.5.1. Microhabitat use
Habitat characteristics were identical in 2009 and 2010 in Reach 1, except for velocity and
depth, which increased in 2010. Reach 2 differed from Reach 1, being characterized by
substantially less boulder and large cobble (Table 2).
Table 2 – Mean ± standard error of habitat characteristics available and used by small and large chub in
each Reach and year. Abbreviations are as follows: V –velocity, D – depth, B – boulder, LC – large cobble,
SC – small cobble, G – gravel, M – mud, De – debris, R – roots, AV – aquatic vegetation, and OV –
overhanging vegetation.
Reach 1, 2009 Reach 1, 2010 Reach 2, 2010
Available Small Large Available Small Large Available Small Large
HC n = 50 n = 49 n = 18 n = 57 n = 73 n = 11 n = 22 n = 20 n = 16
V, cm.s
-1
1.4 ± 0.6 0.1 ± 0.1
0.8 ± 0.4
7.7 ± 0.9 6.6 ± 0.8
8.3 ± 2.4
4.1 ± 1.3 2.6 ± 0.8
4.6 ± 1.4
D, cm 35.7 ± 2.2 46.7 ±
1.2 51.7 ±
2.3 46.1 ± 2.3
52.3 ± 1.6
61.1 ± 2.3
39.5 ± 2.9 48.0 ±
2.2 55.3 ±
2.2
B, % 42 ± 6 63 ± 5 68 ± 7 27 ± 5 26 ± 4 24 ± 9 1 ± 1 4 ± 3
LC, % 13 ± 3 5 ± 2 4 ± 2 13 ± 3 28 ± 4 30 ± 11 1 ± 1 5 ± 4 2 ± 1
SC, % 16 ± 3 12 ± 2 9 ± 3 8 ± 2 9 ± 2 17 ± 6 45 ± 8 45 ± 8 63 ± 8
G, % 20 ± 4 9 ± 2 9 ± 5 34 ± 5 18 ± 3 10 ± 5 32 ± 6 30 ± 7 24 ± 7
M, % 9 ± 4 11 ± 3 10 ± 4 18 ± 4 19 ± 3 19 ± 10 20 ± 5 17 ± 5 12 ± 3
De, % 4 ± 2 11 ± 3 5 ± 2 11 ± 3 9 ± 3 3 ± 1 18 ± 5 12 ± 3 27 ± 9
R, % 3 ± 2 21 ± 4 23 ± 6 4 ± 2 15 ± 4 12 ± 5
4 ± 4 1 ± 1
AV, % 1 ± 0 8 ± 2 10 ± 4 4 ± 2 12 ± 3 5 ± 4
OV, % 2 ± 1 1 ± 1 2 ± 1 6 ± 4 1 ± 1
We observed a total of 142 small and 45 large chub throughout the study (Table 2).
Chub displayed random microhabitat use except in Reach 1 (Fig. 1). The first two components
of the PCA explained 41% of the variation in the habitat data (Fig. 1). The first component
identified a gradient of boulder, roots and aquatic vegetation, and the second component

4. Focal microhabitat use and foraging success
110
contrasted areas with high depth and velocity, with areas with large quantities of mud and
debris. Microhabitat use differed significantly from random on PC1 in Reach 1 in 2009 for both
small (Mann-Whitney U-test, U = 637, p < 0.0001) and large chub (U = 160, p < 0.0001), which
tended to be over-represented in microhabitats with boulders and large quantities of roots
and aquatic vegetation.
Ontogenetic variation was low, being observed only in Reach 2 in 2010 (U = 84, p <
0.016), with small chub using areas with less gravel and small cobble than large chub.
Figure 1 – Ordination diagram of Principal Component Analysis (PCA) of microhabitat use for small (SmC)
and large chub (LaC) and microhabitat availability (H) in the in the Torgal stream. Ellipses represent the
95% confidence limits of mean scores for Reach 1 in 2009 (dark grey), Reach 1 in 2010 (light grey), and
Reach 2 in 2010 (blank).

4. Focal microhabitat use and foraging success
111
4.5.2. Foraging success
Proportion of fish capturing prey
A total of 319 in 432 fish (74%) captured prey, with the proportion of fish capturing prey per
trial varying between 0.17 and 1.00. We identified three interpretable models for the
proportion of fish capturing prey that explained between 0.41 and 0.46 of the variation in the
data (Table 3). The average model indicated that the proportion of fish capturing prey
decreased with velocity and in groups containing large individuals, and also with density (Table
4).
Table 3 – Summary results for model selection analyses for the relationships between the proportion of
chub capturing prey, and capture success and reactive distance and explanatory variables. Values are
the Akaike’s Information Criterion (AIC), the change in AIC between subsequent models (ΔAIC) and the
Akaike weights (wi) for each interpretable model (models with Akaike weights > 10% of the model with
the best fit).
Models AIC ΔAIC wi
Proportion of fish capturing prey
Velocity + small + large 209.47 0.00 0.53
Global 210.38 0.91 0.33
Velocity + density 213.69 4.22 0.06
Capture success
Velocity + density 7345.77 0.00 0.39
Velocity + density + group composition 7347.75 1.98 0.15
Velocity + density + velocity x density 7347.75 1.99 0.14
Velocity 7347.87 2.11 0.14
Velocity + length 7349.29 3.52 0.07
Velocity + group composition 7349.86 4.09 0.05
Reactive distance
Density 2824.70 0.00 0.90

4. Focal microhabitat use and foraging success
112
Table 4 – Model-averaged coefficient estimates (β), 85% confidence intervals (CI) and Akaike weights
(w+) for each parameter in interpretable models (models with Akaike weights > 10% of the model with
the best fit) of the proportion of chub capturing prey. † Regression coefficients with 85% confidence
intervals including zero.
85% CI
Parameter β Lower Upper w+
Velocity -0.43 -0.63 -0.24 1.00
Density -0.74 -1.41 -0.07 0.38
Large -0.31 -0.52 -0.10 0.92
Small 0.09 -0.11 0.28† 0.92
Velocity x density -0.08 -0.31 0.15† 0.30
Capture success and reactive distance
A total of 1771 prey captures was recorded, with mean proportion of captures per individual
being 0.2 (SD = 0.2, range = 0.0-0.9). Reactions to prey by chub summed 2520, with mean
reactive distance being 28.4 cm (SD = 11.7, range = 2.8-93.4 cm).
Calculation of AIC for the two random effects models indicated no differences in their
relative support (ΔAIC ≤ 4), and consequently the simplest random effect structure including
fish identity only was used in further analyses.
Both capture success and reactive distance were affected by fish density, but only the
former was influenced by velocity (Tables 3 and 5). Six interpretable models were identified for
capture success (R2c = 0.43, R2
m = 0.09, Table 3). These models elucidated negative
relationships between capture success and both density and velocity, although the latter had a
weaker effect (Table 5 and Figure 2). Group composition, velocity x density and fish length also
were included in interpretable models (Table 3), however, the confidence intervals of these
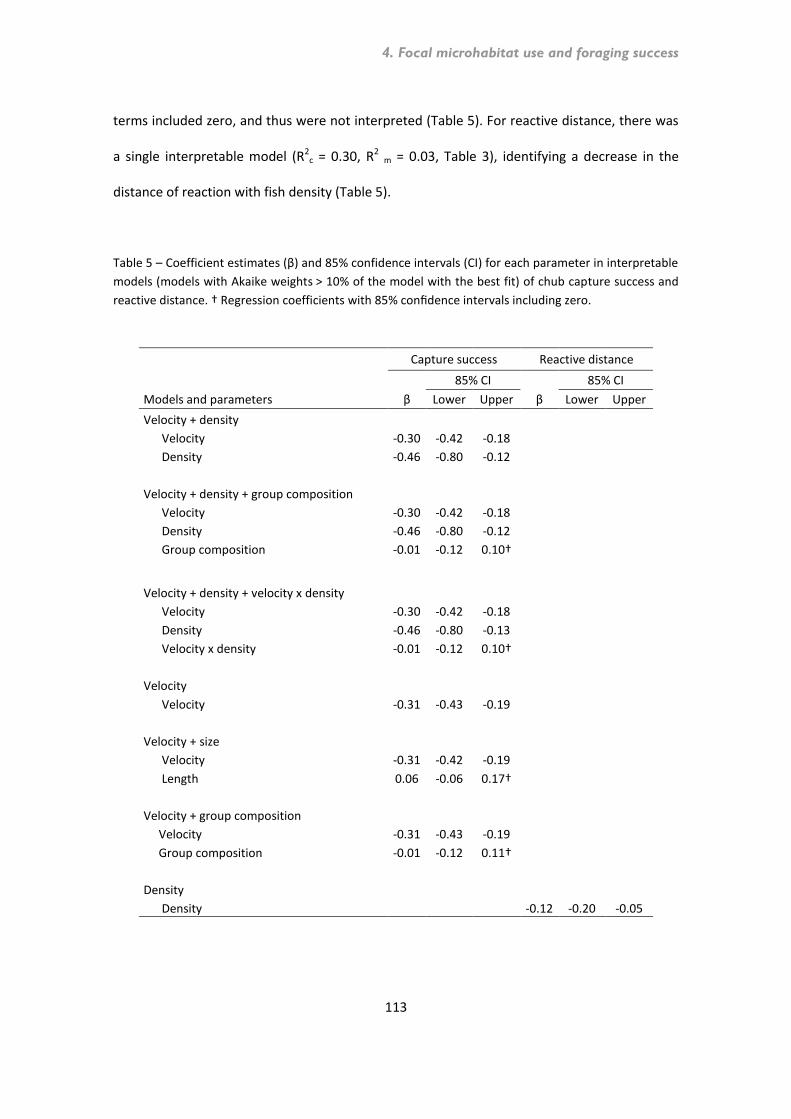
4. Focal microhabitat use and foraging success
113
terms included zero, and thus were not interpreted (Table 5). For reactive distance, there was
a single interpretable model (R2c = 0.30, R2 m = 0.03, Table 3), identifying a decrease in the
distance of reaction with fish density (Table 5).
Table 5 – Coefficient estimates (β) and 85% confidence intervals (CI) for each parameter in interpretable
models (models with Akaike weights > 10% of the model with the best fit) of chub capture success and
reactive distance. † Regression coefficients with 85% confidence intervals including zero.
Capture success Reactive distance
85% CI
85% CI
Models and parameters β Lower Upper β Lower Upper
Velocity + density Velocity -0.30 -0.42 -0.18
Density -0.46 -0.80 -0.12
Velocity + density + group composition Velocity -0.30 -0.42 -0.18
Density -0.46 -0.80 -0.12 Group composition -0.01 -0.12 0.10†
Velocity + density + velocity x density Velocity -0.30 -0.42 -0.18
Density -0.46 -0.80 -0.13 Velocity x density -0.01 -0.12 0.10†
Velocity Velocity -0.31 -0.43 -0.19
Velocity + size Velocity -0.31 -0.42 -0.19
Length 0.06 -0.06 0.17†
Velocity + group composition Velocity -0.31 -0.43 -0.19
Group composition -0.01 -0.12 0.11†
Density Density -0.12 -0.20 -0.05

4. Focal microhabitat use and foraging success
114
Figure 2 – Predicted variation in capture probability by chub with fish density at velocities of 0.2, 8, 12
and 26 (cm.s-1
)
4.6. Discussion
Chub generally showed random microhabitat use during low flows, only occasionally, favouring
areas with boulders, roots and aquatic vegetation. In addition, length-related differences in
microhabitat use were low, albeit sometimes small chub used areas with less gravel and small
cobble than large chub. Although velocity was not an important microhabitat characteristic for
chub in study reaches, foraging success experiments indicated that the proportion of fish
capturing prey and individual capture success may decrease with velocity. Results suggest that
velocity may have little or no effect on microhabitat use by chub under low flows, because
capture success was still high at the range of low velocities prevailing during the study.

4. Focal microhabitat use and foraging success
115
However, increases in velocity will likely result in less prey captures, although chub may still
have the potential to capture prey at high flow conditions.
Our research may be one of the first attempts to apply formal foraging theory to tests
of habitat selection in Mediterranean fishes. It also is one of few European studies to
document focal microhabitat use using underwater observations, which facilitate precise in
situ habitat observations of individual fish (Heggenes et al. 1990; Almeida & Grossman
2012).Specifically, our findings provide direct habitat and foraging success data that should
help in understanding the process of habitat selection and in quantifying optimal habitat for
chub, suggesting that this approach also may be adequate for other Mediterranean cyprinids.
Nevertheless, our study has several limitations that should be addressed in future studies.
First, microhabitat use was quantified over a short time period in two years with similar low
flows, which does not cover the full range of velocity that may be experienced by chub.
Additionally, the variance explained by our models was relatively moderate indicating that
other unmeasured factors may play a role in foraging success. Finally, our experiments were
based exclusively on drift foraging, and thus the relation between benthic foraging success and
chub microhabitat use remains unknown.
In general, chub showed random microhabitat use in relation to velocity, depth, mud
and debris, only occasionally, selecting areas with boulders and large amounts of roots and
aquatic vegetation. This pattern suggests that, during low flows, chub probably tolerate well a
broad range of microhabitat conditions, which apparently are used accordingly to their
availability. Nevertheless, chub may sometimes be selective and show ontogenetic variation in
habitat use as has already been noted for other chub species (e.g., S. aradensis and S.
carolitertii) in Mediterranean streams (Grossman & de Sostoa 1994a, b; Santos et al. 2004;
Santos & Ferreira 2008; Martínez-Capel et al. 2009). Overall, it seems that chub may be
extremely flexible in their microhabitat use patterns, a strategy that typically is favoured in

4. Focal microhabitat use and foraging success
116
environmentally unstable lotic ecosystems (Poff & Allan 1995), such as Mediterranean streams
(Magalhães et al. 2002).
The proportion of fish capturing prey varied with velocity probably reflecting
individual variation in capture success and reactive distance of individual fish. Moreover, the
proportion of fish capturing prey decreased in groups with large individuals, suggesting that
these individuals may be particularly sensitive to changes in prey supply compared to small
conspecifics. Nevertheless, neither group composition nor fish length affected individual
capture success or reactive distance, making it difficult to infer which mechanism may be at
play here.
The proportion of fish capturing prey and both capture success and reactive distance
decreased with fish density, but this result should be interpreted with careful. Although we
tried to account for the negative effect of density on chub foraging success associated to our
experimental design, this may not have been completely eliminated. Nonetheless, the
importance of density to foraging success of chub was noted by Martelo et al. (2013), who
found that chub in small shoals foraged and searched for prey with greater frequency than fish
in large shoals. Consequently, we considered that density likely influences the behaviour of
chub, but its effect on foraging success and microhabitat selection needs further clarification.
Capture success and reactive distance were independent of fish length and group
composition which is consistent with the generally high overlap between small and large chub
in microhabitat use. Similarly, Martelo et al. (2013) found that time spent foraging by chub was
not influenced by fish length in the same years and reaches. These findings suggest that
individual processes such as energy requirements and the ability to find and capture food may
not be strongly related to chub length. Nevertheless, exclusion of young chub from our study
due to sampling constraints may have weakened ontogenetic variation in habitat use, typically

4. Focal microhabitat use and foraging success
117
found for other Mediterranean fish species (Grossman & de Sostoa 1994a, b; Santos & Ferreira
2008; Santos et al. 2010). Further studies should thus attempt to include smaller individuals.
Capture success by chub decreased with velocity, but individuals seemed to have the
potential to capture prey at much higher velocities than they occurred in the Torgal stream
during our study. Negative effects of velocity on capture success have been reported for other
cyprinids (Grossman et al. 2002; Hazelton & Grossman 2009) and salmonids (Hill & Grossman
1993; Piccolo et al. 2008), with high velocities probably resulting in an increase in energy
expended per prey, and consequently reduced individual fitness (Facey & Grossman 1990). In
the case of chub, however, capture success was high at the low velocities (0.2-8 m.s-1)
prevailing in the Torgal stream (mean = 4, SD = 6, range = 0-29 m.s-1), which may have
contributed to the random use of this variable. Future field studies encompassing periods of
higher velocities in wet years in the Torgal stream are thus needed to fully uncover
mechanisms behind microhabitat use by chub.
Our study provides direct habitat and foraging success data that help in understanding
the process of habitat selection and in quantifying optimal habitat for chub. Although further
testing is required before general conclusions regarding the mechanics of chub microhabitat
use can be drawn, our results suggest this may at least be partially related to some aspect of
fish fitness, as foraging success likely determined the relationship between chub and velocity. .
Moreover, our study highlights that for both basic scientific and management/conservation
perspectives, it is important to quantify habitat choice in Mediterranean cyprinids using
mechanistic, fitness-based criteria.

4. Focal microhabitat use and foraging success
118
4.7. References
Almeida, D. & Grossman, G.D. 2012. Utility of direct observational methods for assessing competitive interactions between non-native and native freshwater fishes. Fisheries Management and Ecology 19: 157-166.
Anglin, Z.W. & Grossman, G.D. 2013. Microhabitat use by southern brook trout (Salvelinus fontinalis) in a headwater North Carolina stream. Ecology of Freshwater Fish 22: 567-577.
Arnold, T.W. 2010. Uninformative parameters and model selection using Akaike's Information Criterion. The Journal of Wildlife Management 74: 1175-1178.
Barton, K. 2011. MuMIn: Multi-model inference. R package version 1.6.5. http://cran.r-project.org/web/packages/MuMIn/index.html.
Bates, D., Maechler, M. & Bolker, B. 2012. lme4: Linear mixed-effects models using S4 classes.
Burnham, K.P. & Anderson, D.R. 2002. Model selection and multimodel inference: a practical information-theoretic approach. New York: Springer Scientific.
Compton, M. & Taylor, C. 2013. Spatial scale effects on habitat associations of the ashy darter, Etheostoma cinereum, an imperiled fish in the southeast United States. Ecology of Freshwater Fish 22: 178-191.
Crawley , M.J. 2007. The R Book. New York: John Wiley.
Donaldson, J.A., Ebner, B.C. & Fulton, C.J. 2013. Flow velocity underpins microhabitat selection by gobies of the Australian wet tropics. Freshwater Biology 58: 1038-1051.
Facey, D.E. & Grossman, G.D. 1990. The metabolic cost of maintaining position for four North American stream fishes: effects of season and velocity. Physiological Zoology 63: 757-776.
Grossman, G.D. 2014. Not all drift feeders are trout: a short review of fitness-based habitat selection models for fishes. Environmental Biology of Fishes 97: 465-473.
Grossman, G.D. & de Sostoa, A. 1994a. Microhabitat use by fish in the lower Rio Matarraña, Spain, 1984–1987. Ecology of Freshwater Fish 3: 123-136.
Grossman, G.D. & de Sostoa, A. 1994b. Microhabitat use by fish in the upper Rio Matarraña, Spain, 1984–1987. Ecology of Freshwater Fish 3: 141-152.
Grossman, G.D., Rincon, P.A., Farr, M.D. & Ratajczak, R.E. 2002. A new optimal foraging model predicts habitat use by drift-feeding stream minnows. Ecology of Freshwater Fish 11: 2-10.
Hazelton, P.D. & Grossman, G.D. 2009. The effects of turbidity and an invasive species on foraging success of rosyside dace (Clinostomus funduloides). Freshwater Biology 54: 1977-1989.
Heggenes, J., Brabrand, A. & Salveit, S. 1990. Comparison of three methods for studies of stream habitat use by young brown trout and Atlantic salmon. Transactions of the American Fisheries Society 119: 101-111.

4. Focal microhabitat use and foraging success
119
Hill, J. & Grossman, G.D. 1993. An energetic model of microhabitat use for rainbow trout and rosyside dace. Ecology 74: 685-698.
Hughes, N.F. & Dill, L.M. 1990. Position choice by drift-feeding salmonids: model and test for Arctic grayling (Thymallus arcticus) in subarctic mountain streams, interior Alaska. Canadian Journal of Fisheries and Aquatic Sciences 47: 2039–2048.
Hughes, N.F., Hayes, J.W., Shearer, K.A. & Young, R.G. 2003. Testing a model of drift-feeding using three-dimensional videography of wild brown trout, Salmo trutta, in a New Zealand river. Canadian Journal of Fisheries & Aquatic Sciences 60: 1462-1476.
Inoue, M. & Nunokawa, M. 2002. Effects of longitudinal variations in stream habitat structure on fish abundance: an analysis based on subunit-scale habitat classification. Freshwater Biology 47: 1594-1607.
Jelks, H.L., Walsh, S.J., Burkhead, N.M., Contreras-Balderas, S., Diaz-Pardo, E., Hendrickson, D.A., Lyons, J., Mandrak, N.E., McCormick, F., Nelson, J.S., Platania, S.P., Porter, B.A., Renaud, C.B., Schmitter-Soto, J.J., Taylor, E.B. & Warren, M.L. 2008. Conservation status of imperiled North American freshwater and diadromous fishes. Fisheries 33: 372-407.
Kanno, Y., Schmidt, C.U., Cook, S.B. & Mattingly, H.T. 2012. Variation in microhabitat use of the threatened spotfin chub (Erimonax monachus) among stream sites and seasons. Ecology of Freshwater Fish 21: 363-374.
Kaspersson, R., Höjesjö, J. & Pedersen, S. 2010. Effects of density on foraging success and aggression in age-structured groups of brown trout. Animal Behaviour 79: 709-715.
Legendre, P. & Legendre, L. 1998. Numerical Ecology. Amsterdam: Elsevier.
Magalhães, M.F. 1993a. Effects of season and body-size on the distribution and diet of the Iberian chub Leuciscus pyrenaicus in a lowland catchment. Journal of Fish Biology 42: 875-888.
Magalhães, M.F. 1993b. Feeding of an Iberian stream cyprinid assemblage: seasonality of resource use in a highly variable environment. Oecologia 96: 253-260.
Magalhães, M.F., Beja, P., Canas, C. & Collares-Pereira, M.J. 2002. Functional heterogeneity of dry-season fish refugia across a Mediterranean catchment: the role of habitat and predation. Freshwater Biology 47: 1919-1934.
Magalhães, M.F., Beja, P., Schlosser, I.J. & Collares-Pereira, M.J. 2007. Effects of multi-year droughts on fish assemblages of seasonally drying Mediterranean streams. Freshwater Biology 52: 1494-1510.
Magalhães, M.F., Schlosser, I.J. & Collares-Pereira, M.J. 2003. The role of life history in the relationship between population dynamics and environmental variability in two Mediterranean stream fishes. Journal of Fish Biology 63: 300-317.
Martelo, J., Grossman, G.D. & Magalhães, M.F. 2013. Extrinsic and intrinsic factors influence daily activity of a Mediterranean cyprinid. Ecology of Freshwater Fish 22: 307-316.
Martelo, J., Grossman, G.D., Porto, M. & Magalhães, M.F. 2014. Habitat patchiness affects distribution and microhabitat use of endangered Mira chub Squalius torgalensis (Actinopterygii, Cypriniformes). Hydrobiologia 732: 93-109.

4. Focal microhabitat use and foraging success
120
Martínez-Capel, F., García de Jalón, D., Werenitzky, D., Baeza, D. & Rodilla-Alamá, M. 2009. Microhabitat use by three endemic Iberian cyprinids in Mediterranean rivers (Tagus river basin, Spain). Fisheries Management and Ecology 16: 52-60.
McEwan, A. & Joy, M. 2014. Habitat use of redfin bullies (Gobiomorphus huttoni) in a small upland stream in Manawatu, New Zealand. Environmental Biology of Fishes 97: 121-132.
Nakagawa, S. & Schielzeth, H. 2013. A general and simple method for obtaining R2 from generalized linear mixed-effects models. Methods in Ecology and Evolution 4: 133-142.
Nislow, K.H., Folt, C.L. & Parrish, D.L. 1999. Favorable foraging locations for young Atlantic salmon: application to habitat and population restoration. Ecological Applications 9: 1085-1099.
Palmer, M.A., Hakenkamp, C.C. & Nelson-Baker, K. 1997. Ecological heterogeneity in streams: why variance matters. Journal of the North American Benthological Society 16: 189-202.
Piccolo, J.J., Frank, B.M. & Hayes, J.W. 2014. Food and space revisited: the role of drift-feeding theory in predicting the distribution, growth, and abundance of stream salmonids. Environmental Biology of Fishes 97: 475-488.
Piccolo, J.J., Hughes, N.F. & Bryant, M.D. 2008. Water velocity influences prey detection and capture by drift-feeding juvenile coho salmon (Oncorhynchus kisutch) and steelhead (Oncorhynchus mykiss irideus). Canadian Journal of Fisheries & Aquatic Sciences 65: 266-275.
Pires, D.F. 2012. Fish distribution and abundance in Mediterranean streams: the role of habitat quality, spatial context, and movement patterns.Ph.D. Thesis. Lisbon: University of Lisbon.
Pires, D.F., Beja, P. & Magalhães, F.M. 2014. Out of pools: movement patterns of Mediterranean stream fish in relation to dry season refugia. River Research and Applications. DOI:10.1002/rra.2776.
Poff, N.L. & Allan, J.D. 1995. Functional organization of stream fish assemblages in relation to hydrological variability. Ecology 76: 606-627.
Rogado, L., Alexandrino, P.J., Almeida, P.R., Alves, M.J., Bochechas, J., Cortes, R.V., Domingos, M.I., Filipe, A.F., Madeira, J. & Magalhães, M.F. 2005. Peixes dulciaquicolas e migradores. In: Cabral, M.J., Almeida, J., Almeida, P.R., Dellinger, T., Ferrand de Almeida, N., Oliveira, M.E., Palmeirim, J.M., Queiroz, A.I., Rogado, L. & Santos-Reis, M., eds. Livro Vermelho dos Vertebrados de Portugal. Lisboa: Instituto da Conservação da Natureza.
Santos, J.M. & Ferreira, M.T. 2008. Microhabitat use by endangered Iberian cyprinids nase Iberochondrostoma almacai and chub Squalius aradensis. Aquatic Sciences 70: 272-281.
Santos, J.M., Godinho, F.N. & Ferreira, M.T. 2004. Microhabitat use by Iberian nase Chondrostoma polylepis and Iberian chub Squalius carolitertii in three small streams, north-west Portugal. Ecology of Freshwater Fish 13: 223-230.
Santos, J.M., Reino, L., Porto, M., Oliveira, J., Pinheiro, P., Almeida, P.R., Cortes, R. & Ferreira, T.M. 2010. Complex size-dependent habitat associations in potamodromous fish species. Aquatic Sciences 73: 233-245.
Smith, K.G. & Darwall, W.R.T. 2006. The Status and distribution of freshwater fish endemic to the Mediterranean basin. Gland: IUCN – The World Conservation Union.

4. Focal microhabitat use and foraging success
121
StatSoft, I. 2011. STATISTICA version 10 data analysis software system. www.statsoft.com.
Ward, J.V., Tockner, K., Arscott, D.B. & Claret, C. 2002. Riverine landscape diversity. Freshwater Biology 47: 517-539.
Winemiller, K.O., Flecker, A.S. & Hoeinghaus, D.J. 2010. Patch dynamics and environmental heterogeneity in lotic ecosystems. Journal of the North American Benthological Society 29: 84-99.
Zamor, R.M. & Grossman, G.D. 2007. Turbidity affects foraging success of drift-feeding rosyside dace. Transactions of the American Fisheries Society 136: 167-176.
Zar, J.H. 1996. Biostatistical analysis. New Jersey: Prentice-Hall, Englewood Cliffs.
Zuur, A.F., Ieno, E.N., Walker, N.J., Saveliev, A.A. & Smith, G.M. 2009. Mixed effects models and extensions in ecology with R. New York: Springer Science + Business Media.


Chapter 5.
General discussion

5. General discussion
125
5. General discussion
5.1. Overall patterns
The main objectives of this thesis were to identify the physical factors influencing activity,
distribution and microhabitat use of fish in Mediterranean streams, and explore the
mechanisms that may underlie these patterns, using as a case study the Mira chub Squalius
torgalensis, an imperilled cyprinid endemic to SW Portugal. Given the complexity and
dynamism of distribution and microhabitat use by stream fishes, addressing these issues
required innovative mechanistic models that link physical characteristics to individual fitness,
and account for behaviour traits.
Chub activity during the day was highly variable among individuals, with foraging
changing from drift to benthic on an annual-basis and with shoal size whereas time spent
cruising vs. searching was influenced by temperature and body size. Spatial distribution was
aggregated, probably as a result of spatial patchiness and autocorrelation in physical habitat
resources, though social attraction also may have been influential for small individuals.
Microhabitat use was generally unrelated to velocity, and little variable throughout ontogeny.
Substratum coarseness, amount of debris, roots and aquatic vegetation and depth were
generally influential, though varied in importance across reaches. Focal microhabitat use
generally was random, irrespective of fish size. Experiments indicated that the proportion of
fish capturing prey decreased with velocity, and also with density and in groups including large
individuals. Capture success was negatively influenced by velocity, and density affected both
capture success and reactive distance.
Taken together, results indicate that the activity of chub, and possibly that of other
Mediterranean cyprinids, may be highly variable at the individual level and affected by

5. General discussion
126
multiple interacting extrinsic and intrinsic factors. Aggregated distributions apparently are a
result of patchiness and autocorrelation in physical resources, and social interactions. Random
use of velocity may be associated with capture success, tending to be high at the low velocities
prevailing during low flows. Moreover, individuals tend to capture less prey at high velocity,
but may still be effective at capturing prey during high flows. Overall, this high flexibility both
in behaviour and microhabitat use may be important to cope with highly variable physical
conditions in Mediterranean streams, with maintenance of habitat patches with variable
substrata, cover and depth likely favouring local persistence. This thesis highlights the
importance of using mechanistic, fitness-based models for understanding the process of
microhabitat selection.
5.2. Aggregation by chub – resource patchiness or social attraction?
The majority of fishes form aggregations at one stage or another during their life history
(Pitcher & Parrish 1993). Aggregations may reflect the way individuals respond to resource
patchiness, with individuals assorting uniformly relative to resource availability and quality
(Freeman & Grossman 1993; Breau et al. 2007; Einum et al. 2008; Argentina et al. 2010).
Ecological examples are abundant and include fishes responses to prey patchiness (Thompson
et al. 2001), macrophytes (Argentina et al. 2010) and breeding nests (Einum et al. 2008), or
rocks used as oviposition sites by aquatic insects (Lancaster et al. 2003). This view also applies
to chub distribution which mainly associated with physical resources that were patchily
distributed and spatially autocorrelated (e.g., debris, roots and aquatic vegetation, Chapter 3).
In addition, abundance of large chub was spatially autocorrelated, further corroborating this

5. General discussion
127
view. The abundance of chub, particularly of large individuals, may therefore be closely
coupled with the presence of essential physical habitat characteristics, and hence, their
distribution may be contingent on the distribution of habitat resources.
Nonetheless, aggregation may not only be a simple pattern but also have a functional
purpose (Freeman & Grossman 1992; Parrish & Edelstein-Keshet 1999). Many fish species
aggregate as a result of social attraction among a number of individuals moving within a given
area, with individuals joining the group increasing in survivorship or reproductive success due,
for example, to enhanced foraging success and lower predation risk (Ryer & Olla 1992;
Bednekoff & Lima 1998; Allouche & Gaudin 2001; White & Warner 2007). In the case of chub,
social attraction may have influenced the distribution of small individuals because they were
not always spatially autocorrelated and the strength of aggregation increased when their
abundance was highest (Chapter 3). Nevertheless, foraging success did not increase within the
range of group sizes used in experiments (Chapter 4), and predation risk probably is low in the
Torgal stream (Beja 1996; Magalhães et al. 2002). Consequently, the functional role of social
attraction in driving small chub aggregation is still unclear.
In conclusion, the mechanisms underlying aggregation may integrate the distribution
of habitat resources, as well as social interactions among individuals. The importance of both
processes, however, presumably vary between size classes, with non-social aggregation being
superimposed on social aggregation for large fish, but the later increasing in importance for
small fish.
5.3. Chub behavioural flexibility
Fishes inhabiting unpredictable and unstable streams often show great flexibility in behaviour
(Grossman & de Sostoa 1994a, b; Grossman & Ratajczak 1998; Ayllón et al. 2010; Kanno et al.

5. General discussion
128
2012), and this also appeared to be the case of chub. Indeed, chub showed 1) variable activity
patterns, 2) use of a broad range of microhabitats, and 3) effective foraging over a wide range
of velocities. Behavioural flexibility may be important for fishes to cope with strong spatial and
temporal environmental variability in Mediterranean streams, and hence, to enhance their
local persistence.
Activity patterns varied substantially on an individual and annual basis, being affected
by multiple factors including temperature (Chapter 2). Chub spent more time searching for
prey and less time cruising when temperature increased, an effect already documented in
previous studies and often related to the positive effect of temperature on metabolic rates
(Fraser et al. 1993; Greenwood & Metcalfe 1998; Linløkken et al. 2010). Moreover, chub
foraging mode shifted from drift to benthic foraging, likely as a result of annual differences in
prey availability (Chapter 2, Appendix). Variations in prey availability have been reported to
produce changes in foraging mode for several fish species (e.g., Nakano et al. 1999; Katano
2011), and also to influence the diet of many Mediterranean cyprinids (Magalhães 1993;
Gomes-Ferreira et al. 2005).
Chub favoured different habitat characteristics between reaches, namely related to
substratum composition, cover and depth (Chapter 3). Although a number of factors may
contribute to spatial variation in microhabitat use (e.g., foraging tactics, competitive
interactions), here, this was apparently associated with variation in microhabitat availability.
The influence of microhabitat availability on variation in microhabitat use patterns was
previously noted for fishes in Mediterranean streams (Grossman & de Sostoa 1994a, b; Santos
et al. 2004; Santos & Ferreira 2008) and elsewhere (Grossman & Ratajczak 1998; Henry &
Grossman 2007; Kanno et al. 2012). Focal analyses of microhabitat use (Chapter 4), a novel
approach in Mediterranean streams, revealed that individuals may exhibit random

5. General discussion
129
microhabitat use, providing additional evidence for behavioural flexibility. Flexible
microhabitat use may be an important strategy for chub to cope with changes in microhabitat
availability across reaches and over seasons and years, that typically involve variation in water
velocity and depth, substratum composition and amount of debris and aquatic vegetation
(Grossman & de Sostoa 1994a, b; Santos et al. 2004; Santos & Ferreira 2008).
Finally, foraging success experiments suggest that chub may have the potential to
capture prey over a large range of velocities, though capture success may decrease with
velocity (Chapter 4). This may be especially important for chub to cope with high flows
prevailing in winter and early spring. Other cyprinids (e.g., rosyside dace Clinostomus
funduloides Girard) inhabiting different environments, also seemed to be effective in capturing
prey at high velocities (Grossman et al. 2002).
As suggested by these findings, chub may be flexible to changes in temperature and
prey availability, and able to tolerate a broad range of microhabitat conditions. Such flexibility
may be an important behavioural attribute of chub to persist in Mediterranean streams, where
these factors may change substantially over time and space (Gasith & Resh 1999). It is
expected that species inhabiting harsh and highly variable systems, such as Mediterranean
streams, would be adapted to their variability because selective, filtering pressures on species
attributes appropriate for local persistence might have been at work for long periods of time
(Poff 1997; Magalhães et al. 2007). Behavioural flexibility may be such an attribute, which may
have “passed” through environmental “filters” occurring at multiple scales, contributing to the
success of chub in coping with prevailing harsh environmental conditions.

5. General discussion
130
5.4. Chub microhabitat use
When velocity is unimportant
Water velocity is typically one of the most important microhabitat use components for drift
and epibenthic feeding fishes (Santos et al. 2004; Santos & Ferreira 2008; Martínez-Capel et al.
2009; Donaldson et al. 2013), because it affects the cost of holding position, the supply of
drifting prey and prey capture success (Hughes & Dill 1990; Piccolo et al. 2008; Hazelton &
Grossman 2009). However, in the case of chub no strong association between velocity and
microhabitat use was found (Chapters 3 and 4). Instead, chub were strongly associated with
coarse substrata, roots, aquatic vegetation and depth (Chapter 3) or used microhabitat
randomly (Chapter 4). A similar result was obtained by Grossman & de Sostoa (1994a, b), who
found that substratum composition and depth were the most important microhabitat
characteristics for cyprinids in the River Matarrana. Nevertheless, all these studies were
conducted under low flows, and consequently, it is possible that velocity plays a more
important role in microhabitat use by cyprinids in Mediterranean streams during high flows.
Microhabitat selection by chub likely is linked with foraging success, which is
increasingly recognized as an important mechanism underlying habitat selection by stream
fishes given their direct association with fitness (Grossman 2014). First, capture success was
high at the range of low velocities prevailing during the study (Chapter 4), which likely explains
why chub used this physical characteristic randomly. Second, chub were observed foraging on
coarse substrata (e.g., boulder and cobbles) and roots, two of the most consistently used
physical resources (Chapter 3 and 4). Third, chub spent most of the day foraging or searching
for prey (Chapter 2), and hence microhabitat use likely also was related to these activities

5. General discussion
131
rather than to physical habitat characteristics alone. Overall, this agrees with previous studies
pointing the importance of foraging success and prey availability, as drivers of microhabitat
selection by stream fishes in systems in which predation is not substantial (review in Grossman
2014).
Taken together results indicate that microhabitat selection by chub may be linked to
physical habitat characteristics that affect individual foraging success, though the effect of
other factors, such as fish density, needs clarification. Clearly, a deeper understanding of the
mechanics of chub microhabitat selection will require field observation under high flows, and
testing of the link between physical characteristics actually used by chub during low flows (e.g.
coarse substrata, roots) and foraging success. Nonetheless, this thesis highlights the
importance of quantifying microhabitat selection by Mediterranean cyprinids using
mechanistic, fitness-based criteria.
Size-related differences
Ontogenetic differences in habitat use typically have been related to differences among size
classes in the ability to avoid predators, use resources, and energetic demands (Harvey &
Stewart 1991; Rosenberger & Angermeier 2003; Ayllón et al. 2010; Henderson & Johnston
2010). Unlike many stream fishes chub did not show substantial differences in microhabitat
use between size classes (Chapter 3 and 4). The low ontogenetic variation in microhabitat use
were accompanied by no effect of either fish length or group composition on foraging success
(Chapter 4), suggesting that energy requirements and the ability to find and capture prey may
not be strongly related to individual length under the range of velocities prevailing in study
reaches and used in experiments. Nonetheless, body size has been directly related to the
ability of fishes to maintain position under high velocities, with larger individuals having

5. General discussion
132
greater swimming abilities than small individuals (Hill & Grossman 1993; Rosenberger &
Angermeier 2003). This phenomenon, thus suggests, that higher velocities may be needed to
produce size-related differences in both microhabitat use and foraging success by chub.
Although size-related differences in microhabitat use are common among
Mediterranean stream fishes, these have typically been documented under normal to high
flow conditions, in which velocity likely is more variable and reach higher values than in this
study (Santos et al. 2004; Santos & Ferreira 2008; Martínez-Capel et al. 2009; Santos et al.
2010). Competition with conspecifics also is usually an explanation for microhabitat use shifts
over ontogeny, but unlikely to have been important for chub because 1) in spring , food supply
is generally high in Mediterranean streams (Gasith & Resh 1999), 2) there were no yearly shifts
in microhabitat use despite fish abundance variation (Chapter 3), 3) behavioural aggression
was never observed between small and large chub, and 4) chub spent more time foraging and
searching for prey in small than in large shoals (Chapter 2). Improve the understanding of size-
related differences in microhabitat use by chub will thus involve addressing ontogenetic
variation over a wider range of physical and biological conditions.
Complementarity in scales of microhabitat use
Studies conducted at only one spatial scale may be limited because different factors can
influence habitat use at different scales (Wiens 1989; Mayor et al. 2009), hence, a more useful
approach may be to investigate habitat use at multiple spatial scales (Kotliar & Wiens 1990;
Altmoos & Henle 2010). Here, microhabitat use was quantified using two methodologies
differing in the scale of observation, which produced different results. In Chapter 3 habitat
5. General discussion
133
characteristics and fish were sampled in 1x1m quadrats and chub showed strong associations
with microhabitat characteristics, whereas in Chapter 4 they were sampled at the focal level
(0.20x0.20m quadrats) and chub generally showed random microhabitat use. These
differences in results suggest that a multi-scale hierarchical approach should be adopted in
microhabitat analysis, to provide a complementary view of patterns and processes. The
influence of observation scale have previously been reported in other studies, albeit these
typically use more disparate spatial scales (Torgersen & Close 2004; Santos et al. 2010;
Compton & Taylor 2013; McEwan & Joy 2013).
Two hypotheses may be advanced to explain differences in microhabitat use with
observation scale. First, physical habitat characteristics frequently are patchily distributed on
several hierarchical levels (Pringle et al. 1988; Winemiller et al. 2010), and patchiness of this
type has been documented to affect the abundance and distribution of stream fishes (Freeman
& Grossman 1993; Thompson et al. 2001; Argentina et al. 2010). Therefore, although habitat
characteristics were patchily distributed at 1m distances (Chapter 3), it is possible that there
was less or no variation at smaller scales, thus leading to random focal microhabitat use.
Second, fishes may not be able to differentiate among habitat characteristics at all spatial
scales (Kotliar & Wiens 1990; Thompson et al. 2001), consequently, individual chub may be
unable to perceive patchiness in habitat characteristics at the focal level. For example,
Thompson et al. (2001) found that longnose dace Rhinichthys cataractae Valenciennes
responded to patchiness of macroinvertebrate prey at the secondary (foraging patches < 5 m
in diameter) and tertiary levels (stream reaches) but not at the primary level (individual
cobbles separated by < 1 m). Testing patchiness in physical characteristics at the focal level is
thus needed, as well as assessing the ability of chub to differentiate patches at various spatial
scales.
5. General discussion
134
The approach adopted in this thesis acknowledges the influence of scale on chub
habitat use and recognises the importance of using multiple scale analyses in assessing
distribution and habitat selection. There have been few underwater observational studies
using such an approach to quantify microhabitat use by fishes. However, this appears highly
advantageous because it provides complementary perspectives about microhabitat use and
allows the integration of both field and laboratorial results, through the comparison of focal
observations of microhabitat use with individual fitness criteria (i.e., prey capture success).
5.5. Final remarks and future prospects
The recent acceleration in research on Mediterranean stream fishes is promising (Magalhães
et al. 2007; Filipe et al. 2010; Pires et al. 2010; Ribeiro et al. 2013), and represents an
opportunity for rapid advances in the development of effective conservation and management
plans. Nevertheless, there is still a shortage of information regarding various small scale
ecological aspects, as well as, a lack of adequate and biological realistic quantitative
approaches to study them. The majority of studies analysing microhabitat use by fishes are not
based on direct observations, which facilitate precise in situ habitat use observations of
individual fish (Heggenes et al. 1990; Almeida & Grossman 2012). In addition, studies are
mostly descriptive with no attempts to determine the causations of diagnosed patterns or to
include spatial information (Santos et al. 2004; Santos & Ferreira 2008; Martínez-Capel et al.
2009) that often has substantial influence on distribution patterns and species-habitat
relationships (Keitt et al. 2002; Lancaster et al. 2003). Further, studies often ignore the type of
behaviour fishes performed while using a certain microhabitat, which may limit the ability to

5. General discussion
135
understand relationships between activity and habitat use (David & Closs 2003; Clavero et al.
2005). In the view of the high number of endemic and imperilled fish species in Mediterranean
streams (Smith & Darwall 2006), this lack of ecological information is concerning.
Our study, despite its limitations, tried to overcome the shortcomings mentioned
above: 1) it is based on underwater and video observations that enable the exact location of
individuals and the collection of behavioural information without disturbing the fish (Heggenes
et al. 1990), 2) it incorporates resource patchiness and spatial explicit information into
analyses of chub distribution and models of microhabitat use, 3) it follows a mechanistic
approach in an attempt to determine whether foraging success underlies chub microhabitat
use (i.e., focal-point velocity), and 4) it analyses activity patterns, which may be intimately
related to habitat use.
By taking an innovative approach to address fundamental ecological questions, this
study has therefore contributed to increase the understanding of behaviour, spatial
distribution and habitat use by stream fishes, and shed light on the mechanisms underlying
them. Analysis of activity patterns provided evidence of how cyprinids allocated their time to
specific activities during the day, and of their high individual behavioural flexibility, important
for persistence in highly variable and unstable streams. Examination of distribution improved
the understanding of how spatial variation in physical resources and social attraction may
shape fish aggregation, and showed the importance of using spatial explicit information.
Investigation of microhabitat use produced unexpected results regarding the influence of
velocity on fish occurrence and abundance, but allowed the identification of physical resources
that should be maintained for local persistence under low flows. Finally, the combination of
focal microhabitat use with experimental essays on prey capture provided the first evidence
that foraging success may be implicated in microhabitat selection by Mediterranean cyprinids,
and corroborates other studies arguing that models of habitat selection must be based on

5. General discussion
136
criteria directly linked with some aspect of individual fitness. This information is important for
purposes ranging from the elaboration of ecological theory to the conservation and
management of Mediterranean cyprinids.
Nevertheless, future studies can be conducted to clarify and strengthen the results of this
thesis. Examples of possible improvements are as follows:
Extend the taxonomic, spatial and temporal scope of the habitat analyses by
conducting multiple fish and physical microhabitat observations in different habitat
contexts, and over low to high flows. This information will clarify how microhabitat use
may be influenced by a wider range of physical habitat characteristics, especially,
water velocity and the extent to which this may be contingent on species and
geographic context;
Testing for effects of inter and intraspecific competition (Almeida & Grossman 2012) in
habitat use. This can be achieved by conducting field removal experiences consisting
in quantifying and comparing microhabitat use before and after fish removal. This has
successfully been done with other cyprinids (Petty & Grossman 2010), but has never
been tested in Mediterranean fishes, for which there is a dearth of empirical data
regarding biotic interactions;
Use neutral landscape models for understanding the relationship between aggregation
and resource patchiness. Point pattern analysis quantifies the distribution of resource
patches and combined with neutral landscape models allows to test whether the
spatial pattern of used resources is independent of the background distribution of
available resources (Lancaster et al. 2003). This could be applied not only with physical
habitat but also with prey resources;

5. General discussion
137
Address the interaction between activity and microhabitat use by explicitly examining
how activity is related to microhabitat (Schrandt et al. 2012). This may allow the
identification of feeding, spawning or resting microhabitats, important for
understanding population dynamics and planning more effective restoration of stream
habitat (Rosenfeld 2003; Pander & Geist 2010);
Improve foraging success-based models by approaching energy gain not only using
prey capture success but also the energetic value of prey items, and estimate
energetic costs of occupying a certain velocity using respiration rates at varying
velocities (Hill & Grossman, 1993). Finally, estimate intra and interspecific competition
parameters (Hazelton & Grossman, 2009) and validate the model in wet years.
As a general conclusion of this thesis, it arises that traditional correlative approaches may
be insufficient to understand the distribution and microhabitat use of Mediterranean stream
fishes, and that approaches based on a mechanistic understanding of the processes involved
using criteria directly linked with some aspect of individual fitness, such as reproductive
output, growth, or survivorship are needed. Future studies should thus attempt to scale up
mechanistic habitat use models spatially and temporally (Dormann et al. 2012) to better
represent the hierarchical nature and the temporal dynamism of habitat selection and use by
Mediterranean stream fish.

5. General discussion
138
5.6. References
Allouche, S. & Gaudin, P. 2001. Effects of avian predation threat, water flow and cover on growth and habitat use by chub, Leuciscus cephalus, in an experimental stream. Oikos 94: 481-492.
Almeida, D. & Grossman, G.D. 2012. Utility of direct observational methods for assessing competitive interactions between non-native and native freshwater fishes. Fisheries Management and Ecology 19: 157-166.
Altmoos, M. & Henle, K. 2010. Relevance of multiple spatial scales in habitat models: a case study with amphibians and grasshoppers. Acta Oecologica 36: 548-560.
Argentina, J.E., Freeman, M.C. & Freeman, B.J. 2010. The response of stream fish to local and reach-scale variation in the occurrence of a benthic aquatic macrophyte. Freshwater Biology 55: 643-653.
Ayllón, D., Almodóvar, A., Nicola, G.G. & Elvira, B. 2010. Ontogenetic and spatial variations in brown trout habitat selection. Ecology of Freshwater Fish 19: 420-432.
Bednekoff, P.A. & Lima, S.L. 1998. Randomness, chaos and confusion in the study of antipredator vigilance. Trends in Ecology & Evolution 13: 284-287.
Beja, P.R. 1996. An analysis of otter Lutra lutra predation on introduced American crayfish Procambarus clarkii in Iberian Streams. Journal of Applied Ecology 33: 1156-1170.
Breau, C., Cunjak, R.A. & Bremset, G. 2007. Age-specific aggregation of wild juvenile Atlantic salmon Salmo salar at cool water sources during high temperature events. Journal of Fish Biology 71: 1179-1191.
Clavero, M., Blanco-Garrido, F., Zamora, L. & Prenda, J. 2005. Size-related and diel variations in microhabitat use of three endangered small fishes in a Mediterranean coastal stream. Journal of Fish Biology 67: 72-85.
Compton, M. & Taylor, C. 2013. Spatial scale effects on habitat associations of the ashy darter, Etheostoma cinereum, an imperiled fish in the southeast United States. Ecology of Freshwater Fish 22: 178-191.
David, B.O. & Closs, G.P. 2003. Seasonal variation in diel activity and microhabitat use of an endemic New Zealand stream-dwelling galaxiid fish. Freshwater Biology 48: 1765-1781.
Donaldson, J.A., Ebner, B.C. & Fulton, C.J. 2013. Flow velocity underpins microhabitat selection by gobies of the Australian wet tropics. Freshwater Biology 58: 1038-1051.
Dormann, C.F., Schymanski, S.J., Cabral, J., Chuine, I., Graham, C., Hartig, F., Kearney, M., Morin, X., Römermann, C., Schröder, B. & Singer, A. 2012. Correlation and process in species distribution models: bridging a dichotomy. Journal of Biogeography 39: 2119-2131.

5. General discussion
139
Einum, S., Nislow, K.H., McKelvey, S. & Armstrong, J.D. 2008. Nest distribution shaping within-stream variation in Atlantic salmon juvenile abundance and competition over small spatial scales. Journal of Animal Ecology 77: 167-172.
Filipe, A.F., Magalhães, F.M. & Collares-Pereira, M.J. 2010. Native and introduced fish species richness in Mediterranean streams: the role of multiple landscape influences. Diversity and Distributions 16: 773-785.
Fraser, N.H.C., Metcalfe, N.B. & Thorpe, J.E. 1993. Temperature-dependent switch between diurnal and nocturnal foraging in salmon. Proceedings of the Royal Society of London. Series B: Biological Sciences 252: 135-139.
Freeman, M.C. & Grossman, G.D. 1992. Group foraging by a stream minnow: shoals or aggregations? Animal Behaviour 44: 393-403.
Freeman, M.C. & Grossman, G.D. 1993. Effects of habitat availability on dispersion of a stream cyprinid. Environmental biology of fishes. 37: 121-130.
Gasith, A. & Resh, V.H. 1999. Streams in Mediterranean climate regions: abiotic influences and biotic responses to predictable seasonal events. Annual Review of Ecology and Systematics: 51-81.
Gomes-Ferreira, A., Ribeiro, F., Moreira da Costa, L., Cowx, I.G. & Collares-Pereira, M.J. 2005. Variability in diet and foraging behaviour between sexes and ploidy forms of the hybridogenetic Squalius alburnoides complex (Cyprinidae) in the Guadiana River basin, Portugal. Journal of Fish Biology 66: 454-467.
Greenwood, M.F.D. & Metcalfe, N.B. 1998. Minnows become nocturnal at low temperatures. Journal of Fish Biology 53: 25-32.
Grossman, G.D. 2014. Not all drift feeders are trout: a short review of fitness-based habitat selection models for fishes. Environmental Biology of Fishes 97: 465-473.
Grossman, G.D. & de Sostoa, A. 1994a. Microhabitat use by fish in the lower Rio Matarraña, Spain, 1984–1987. Ecology of Freshwater Fish 3: 123-136.
Grossman, G.D. & de Sostoa, A. 1994b. Microhabitat use by fish in the upper Rio Matarraña, Spain, 1984–1987. Ecology of Freshwater Fish 3: 141-152.
Grossman, G.D. & Ratajczak, R.E. 1998. Long-term patterns of microhabitat use by fish in a southern Appalachian stream from 1983 to 1992: effects of hydrologic period, season and fish length. Ecology of Freshwater Fish 7: 108-131.
Grossman, G.D., Rincon, P.A., Farr, M.D. & Ratajczak, R.E. 2002. A new optimal foraging model predicts habitat use by drift-feeding stream minnows. Ecology of Freshwater Fish 11: 2-10.
Harvey, B.C. & Stewart, A.J. 1991. Fish size and habitat depth relationships in headwater streams. Oecologia 87: 336-342.
Hazelton, P.D. & Grossman, G.D. 2009. The effects of turbidity and an invasive species on foraging success of rosyside dace (Clinostomus funduloides). Freshwater Biology 54: 1977-1989.

5. General discussion
140
Heggenes, J., Brabrand, A. & Salveit, S. 1990. Comparison of three methods for studies of stream habitat use by young brown trout and Atlantic salmon. Transactions of the American Fisheries Society 119: 101-111.
Henderson, A.R. & Johnston, C.E. 2010. Ontogenetic habitat shifts and habitat use in an endangered minnow, Notropis mekistocholas. Ecology of Freshwater Fish 19: 87-95.
Henry, B. & Grossman, G.D. 2007. Microhabitat use by blackbanded (Percina nigrofasciata), turquoise (Etheostoma inscriptum), and tessellated (E. olmstedi) darters during drought in a Georgia piedmont stream. Environmental Biology of Fishes 83: 171-182.
Hill, J. & Grossman, G.D. 1993. An energetic model of microhabitat use for rainbow trout and rosyside dace. Ecology 74: 685-698.
Hughes, N.F. & Dill, L.M. 1990. Position choice by drift-feeding salmonids: model and test for Arctic grayling (Thymallus arcticus) in subarctic mountain streams, interior Alaska. Canadian Journal of Fisheries and Aquatic Sciences 47: 2039–2048.
Kanno, Y., Schmidt, C.U., Cook, S.B. & Mattingly, H.T. 2012. Variation in microhabitat use of the threatened spotfin chub (Erimonax monachus) among stream sites and seasons. Ecology of Freshwater Fish 21: 363-374.
Katano, O. 2011. Effects of individual differences in foraging of pale chub on algal biomass through trophic cascades. Environmental Biology of Fishes 92: 101-112.
Keitt, T.H., Bjornstad, O.N., Dixon, P.M. & Citron-Pousty, S. 2002. Accounting for spatial pattern when modeling organism-environment interactions. Ecography 25: 616-625.
Kotliar, N.B. & Wiens, J.A. 1990. Multiple scales of patchiness and patch structure: a hierarchical framework for the study of heterogeneity. Oikos 59: 253-260.
Lancaster, J., Downes, B. & Reich, P. 2003. Linking landscape patterns of resource distribution with models of aggregation in ovipositing stream insects. Journal of Animal Ecology 72: 969-978.
Linløkken, A.N., Bergman, E. & Greenberg, L. 2010. Effect of temperature and roach Rutilus rutilus group size on swimming speed and prey capture rate of perch Perca fluviatilis and R. rutilus. Journal of Fish Biology 76: 900-912.
Magalhães, M.F. 1993. Effects of season and body-size on the distribution and diet of the Iberian chub Leuciscus pyrenaicus in a lowland catchment. Journal of Fish Biology 42: 875-888.
Magalhães, M.F., Beja, P., Canas, C. & Collares-Pereira, M.J. 2002. Functional heterogeneity of dry-season fish refugia across a Mediterranean catchment: the role of habitat and predation. Freshwater Biology 47: 1919-1934.
Magalhães, M.F., Beja, P., Schlosser, I.J. & Collares-Pereira, M.J. 2007. Effects of multi-year droughts on fish assemblages of seasonally drying Mediterranean streams. Freshwater Biology 52: 1494-1510.

5. General discussion
141
Martínez-Capel, F., García de Jalón, D., Werenitzky, D., Baeza, D. & Rodilla-Alamá, M. 2009. Microhabitat use by three endemic Iberian cyprinids in Mediterranean rivers (Tagus river basin, Spain). Fisheries Management and Ecology 16: 52-60.
Mayor, S.J., Schneider, D.C., Schaefer, J.A. & Mahoney, S.P. 2009. Habitat selection at multiple scales. Ecoscience 16: 238-247.
McEwan, A. & Joy, M. 2013. Diel habitat use of two sympatric galaxiid fishes (Galaxias brevipinnis and G. postvectis) at two spatial scales in a small upland stream in Manawatu, New Zealand. Environmental Biology of Fishes: 1-11.
Nakano, S., Fausch, K.D. & Kitano, S. 1999. Flexible niche partitioning via a foraging mode shift: a proposed mechanism for coexistence in stream-dwelling charrs. Journal of Animal Ecology 68: 1079-1092.
Pander, J. & Geist, J. 2010. Seasonal and spatial bank habitat use by fish in highly altered rivers – a comparison of four different restoration measures. Ecology of Freshwater Fish 19: 127-138.
Parrish, J.K. & Edelstein-Keshet, L. 1999. Complexity, pattern, and evolutionary trade-offs in animal aggregation. Science 284: 99-101.
Petty, J.T. & Grossman, G.D. 2010. Giving-up densities and ideal pre-emptive patch use in a predatory benthic stream fish. Freshwater Biology: 780-793.
Piccolo, J.J., Hughes, N.F. & Bryant, M.D. 2008. Water velocity influences prey detection and capture by drift-feeding juvenile coho salmon (Oncorhynchus kisutch) and steelhead (Oncorhynchus mykiss irideus). Canadian Journal of Fisheries & Aquatic Sciences 65: 266-275.
Pires, D.F., Pires, A.M., Collares-Pereira, M.J. & Magalhães, M.F. 2010. Variation in fish assemblages across dry-season pools in a Mediterranean stream: effects of pool morphology, physicochemical factors and spatial context. Ecology of Freshwater Fish 19: 74-86.
Pitcher, T.J. & Parrish, J.K. 1993. Functions of shoaling behaviour in teleosts. In: Pitcher, T.J., ed. Behaviour of Teleost Fishes. London: Chapman & Hall, pp. 363–439.
Poff, N.L. 1997. Landscape filters and species traits: towards mechanistic understanding and prediction in stream ecology. Journal of the North American Benthological Society 16: 391-409.
Pringle, C.M., Naiman, R.J., Bretschko, G., Karr, J.R., Oswood, M.W., Jackson, R.W., Welcomme, R.L. & Winterbourn, M.J. 1988. Patch dynamics in lotic systems: the stream as a mosaic. Journal of the North American Benthological Society 7: 503-524.
Ribeiro, F., Magalhães, M.F. & Collares-Pereira, M.J. 2013. Spatial and temporal variation in assemblage structure of fish larvae in mediterranean–type streams: contrasts between native and non-native species. Environmental Biology of Fishes 96: 467-480.
Rosenberger, A. & Angermeier, P.L. 2003. Ontogenetic shifts in habitat use by the endangered Roanoke logperch (Percina rex). Freshwater Biology 48: 1563.
Rosenfeld, J. 2003. Assessing the habitat requirements of stream fishes: an overview and evaluation of fifferent approaches. Transactions of the American Fisheries Society 132: 953-968.

5. General discussion
142
Ryer, C.H. & Olla, B.L. 1992. Social mechanisms facilitating exploitation of spatially variable ephemeral food patches in a pelagic marine fish. Animal Behaviour 44: 69-74.
Santos, J.M. & Ferreira, M.T. 2008. Microhabitat use by endangered Iberian cyprinids nase Iberochondrostoma almacai and chub Squalius aradensis. Aquatic Sciences 70: 272-281.
Santos, J.M., Godinho, F.N. & Ferreira, M.T. 2004. Microhabitat use by Iberian nase Chondrostoma polylepis and Iberian chub Squalius carolitertii in three small streams, north-west Portugal. Ecology of Freshwater Fish 13: 223-230.
Santos, J.M., Reino, L., Porto, M., Oliveira, J., Pinheiro, P., Almeida, P.R., Cortes, R. & Ferreira, T.M. 2010. Complex size-dependent habitat associations in potamodromous fish species. Aquatic Sciences 73: 233-245.
Schrandt, M.N., Hardy, K.M., Johnson, K.M. & Lema, S.C. 2012. Physical habitat and social conditions across a coral reef shape spatial patterns of intraspecific behavioral variation in a demersal fish. Marine Ecology 33: 149-164.
Smith, K.G. & Darwall, W.R.T. 2006. The Status and distribution of freshwater fish endemic to the Mediterranean basin. Gland: IUCN – The World Conservation Union.
Thompson, A.R., Petty, J.T. & Grossman, G.D. 2001. Multi-scale effects of resource patchiness on foraging behaviour and habitat use by longnose dace, Rhinichthys cataractae. Freshwater Biology 46: 145-160.
Torgersen, C.E. & Close, D.A. 2004. Influence of habitat heterogeneity on the distribution of larval Pacific lamprey (Lampetra tridentata) at two spatial scales. Freshwater Biology 49: 614-630.
White, J. & Warner, R. 2007. Behavioral and energetic costs of group membership in a coral reef fish. Oecologia 154: 423-433.
Wiens, J.A. 1989. Spatial scaling in ecology. Functional Ecology 3: 385-397.
Winemiller, K.O., Flecker, A.S. & Hoeinghaus, D.J. 2010. Patch dynamics and environmental heterogeneity in lotic ecosystems. Journal of the North American Benthological Society 29: 84-99.

Appendix
Abundance of benthic and drift
macroinvertebrates


A-1
Appendix
Table A1 – Abundance of benthic macroinvertebrates in the study reaches of the Torgal
stream, in spring 2009 and 2010. Values are the mean number (N), standard deviation (SD) and
percentage (%) of each taxa in 23 and 24 samples collected in Reach 1 in 2009 and 2010,
respectively, and 23 samples collected in Reach 2. Macroinvertebrates were sampled from
small cobbles, gravel and silt using a Hess sampler, and scraped from boulders, large cobbles,
tree trunks and roots, collected in a 40x40cm quadrat. Taxa are listed by order of abundance in
Reach 1 in 2009, and those contributing to more than 10% of total numbers in each reach and
year are highlighted in grey.
Taxa
Reach 1 Reach 2
2009
2010
2010
N SD % N SD % N SD %
Gastropoda 65.4 122.7 47.6
20.3 33.1 27
0.2 0.6 0.6
Chironomidae (pupae included) 35.0 49.6 25.5
32.8 66.7 43.6
18.2 31.1 52.5
Coleoptera 12.7 33.5 9.2
9.0 23.4 11.9
1.0 2.9 2.8
Crustacea 11.0 41.6 8.1
6.4 23.6 18.6
Tricoptera (pupae included) 6.3 5.0 4.6
3.8 4.4 5.1
2.2 3.4 6.3
Ephemeroptera 3.0 4.3 2.2
3.5 5.5 4.7
2.2 3.9 6.4
Ortophera 0.6 1.1 0.4 Turbellaria 0.6 1.0 0.4
1.8 3.7 2.4 Megaloptera 0.6 1.1 0.4
1.1 3.1 1.4
0.3 1.1 0.8
Plecoptera 0.6 1.4 0.4
1.1 1.8 1.5
3.5 10.5 10.1
Arachnidae 0.4 0.9 0.3 Bivalvia 0.4 1.4 0.3 Odonata 0.2 0.7 0.2
0.7 1.0 0.9
0.1 0.3 0.3
Coleoptera (adults) 0.1 0.3 0.1
0.1 0.6 0.2
0.0 0.2 0.1
Clitellata 0.1 0.3 0.1
0.2 0.7 0.3
0.1 0.5 0.4
Diptera (adults) 0.1 0.3 0.1 Hymenoptera
0.2
Diptera (non Chironomidae) 0.8 1.1 1 0.4 0.9 1.3

A-2
Table A2 – Abundance of drift macroinvertebrates in the study reaches of the Torgal stream, in
spring 2009 and 2010. Values are the mean number (N), standard deviation (SD) and
percentage (%) of each taxa in 4 and 11 samples collected in Reach 1 in 2009 and 2010,
respectively, and 4 samples collected in Reach 2. Samples were collected using a drift net
placed approximately 15cm from the bottom, during 30min. Velocity was measured both at
the beginning and end of this period, at the mouth of the net and a mean was calculated. Taxa
are listed by order of abundance in Reach 1 in 2009, and those contributing to more than 10%
of total numbers in each reach and year are highlighted in grey.
Taxa
Reach 1 Reach 2
2009
2010
2010
N SD % N SD % N SD %
Gastropoda 19.0 9.0
65.5
0.5 1.2 29.4
0.0 0.0 Chironomidae (pupae included) 6.8 1.7
23.3
0.3 0.5 17.6
0.5 1.0 33.3
Odonata 2.3 3.9
7.8
0.0 0.0
0.0 0.0 Tricoptera (pupae included) 0.8 1.0
2.6
0.1 0.3 5.9
0.3 0.5 16.7
Diptera (adults) 0.3 0.5
0.9 Coleoptera (adults)
0.2 0.6 11.8
Arachnidae
0.2 0.6 11.8 Hymenoptera
0.2 0.6 11.8
Ephemeroptera
0.1 0.3 5.9 Plecoptera
0.1 0.3 5.9
Crustacea
0.3 0.5 16.7
Diptera (non Chironomidae)
0.5 1.0 33.3