
Tese de Mestrado Mestrado em Genética...
89
Tese de Mestrado Mestrado em Genética Molecular Trabalho efetuado sob a orientação da Doutora Clara Sá Miranda E co-orientação da Professora Doutora Maria João Marques Ferreira Sousa Moreira
Transcript of Tese de Mestrado Mestrado em Genética...

Tese de Mestrado Mestrado em Genética Molecular
Trabalho efetuado sob a orientação daDoutora Clara Sá MirandaE co-orientação daProfessora Doutora Maria João Marques Ferreira Sousa Moreira


iii
Apoio Financeiro
Este trabalho está inserido no projeto “Fabry Screen – Screening for Fabry disease
based on automatic classification of chromatographic images”, com a referência
PTDC/SAL‐BEB/100875/2008, financiado pela Fundação para a Ciência e a Tecnologia.

iv
Agradecimentos
Gostaria de começar por agradecer à Universidade do Minho pelos conhecimentos
transmitidos durante este ciclo de estudos e ao Instituto de Biologia Molecular e Celular, por
me acolher para realizar o projeto de mestrado. Um especial obrigado à Doutora Maria Clara
Sá Miranda e à Doutora Maria João Marques Ferreira Sousa Moreira pela orientação dos
trabalhos que constam nesta dissertação.
Pelo projeto em que estou inserida, e que em muito contribuiu para esta dissertação,
fico grata à Unidade do Lisossoma e do Peroxissoma, liderada pela Doutora Maria Clara Sá
Miranda, e ao “Bioimaging group”, liderado pela Doutora Ana Mendonça.
Ao Daniel devo os ensinamentos sobre TLC e a energia com que sempre se prontificou
a ajudar-me na resolução de problemas e na interpretação das minhas placas.
Pela paciência e pelos conhecimentos transmitidos, agradeço ao Rui, à Lorena, à
Andrea, ao Paulo e à Fátima.
Ainda ao Paulo e ao Rui, bem como à Cátia, à Cláudia, à Marta, à Tânia e à Ana,
agradeço o ombro amigo, os conselhos, e os momentos da mais pura diversão que permitiam
superar qualquer frustração.
Um enorme obrigado aos meus pais, pelo incentivo, força e amor.

v
HPTLC Detection of Gb3 in Urine Samples: improvement of the method
and sampling
Abstract
Fabry disease (FD) is a lysosomal storage disorder caused by deficient or null
production of the enzyme α-galactosidase A (α-Gal A) as a result of mutations in α-
galactosidase A gene (GLA), located on the X chromosome. The systemic accumulation of α-
Gal A substrates, which are excreted in urine, leads to progressive damage of several organs
and tissues and ultimately results in death due to heart failure, renal failure and
cerebrovascular accidents.
Many studies are focused in diagnosing FD through measurement of α-Gal A activity in
blood and of accumulated substrates, mainly globotriaosylceramide, in plasma or urine. Mass
spectrometry techniques are extensively used for screening of FD and other lysosomal storage
disorders. However, mass spectrometry is an expensive method, requires a specialized
operator and involves complex equipment. Thin-layer chromatography, on the other hand, is a
robust and well explored method suitable for analysis of a large number of samples.
The collection of urine samples is easy and non-invasive, which facilitates the
cooperation of the subjects, but urine samples are difficult to transport without degradation.
In this study, the problematic of urine samples transport was overcome by using filter
paper as a supporting material that allows shipping through general mail without deterioration.
The high-performance thin-layer chromatography method conventionally used to analyse Gb3
in urine samples was successfully optimised to analyse urine in filter paper. Using this method
60% of the previously diagnosed FD patients revealed increased Gb3 levels and one patient on
enzyme replacement therapy showed significant Gb3 reduction after three months of therapy.
The developed screening method offers an easy and simple method for urine sample
shipping without degradation and suitable for a mass screening and ERT follow up program.

vi
HPTLC Detection of Gb3 in Urine Samples: improvement of the method
and sampling
Resumo
A doença de Fabry (FD) é uma doença lisossomal de sobrecarga causada pela
atividade deficiente da enzima α-galactosidase A (α-Gal A) do, como resultado de mutações no
gene desta enzima (gene GLA), localizado no cromossoma X. A acumulação sistémica dos
substratos da α-Gal A, que são excretados na urina, leva à lesão progressiva de vários órgãos e
tecidos, conduzindo por fim à morte devido a falência cardíaca, falência renal e acidentes
vasculares cerebrais.
Vários estudos estão debruçados no diagnóstico da doença de Fabry através da
medição da atividade da α-Gal A em sangue e de substratos acumulados, principalmente o
globotriaosilceramida, em urina e plasma. As técnicas de espectrometria de massa são
extensivamente no rastreio da doença de Fabry e outras doenças lisossomais de sobrecarga.
Contudo, a espectrometria de massa é um método dispendioso, requer um operador
especializado e envolve equipamentos complexos. A cromatografia em camada fina, por sua
vez, é um método robusto e bem explorado adequado à análise de grandes grupos de
amostras.
A colheita de amostras de urina é fácil e não é invasiva, o que facilita a cooperação
por parte dos dadores, mas as amostras de urina são difíceis de transportar sem que haja
deterioração.
Neste estudo, a problemática do transporte de amostras de urina foi ultrapassada
utilizando o papel de filtro como material de suporte, permitindo que as amostras sejam
enviadas por correio normal sem degradação. O método de cromatografia em camada fina de
alta performance convencionalmente utilizado na análise de Gb3, em amostras de urina, foi
otimizado com sucesso para analisar amostras de urina em papel de filtro. Recorrendo a esta
metodologia, verificou-se que os níveis de Gb3 estavam aumentados em 60% dos doentes de
Fabry previamente diagnosticados, e que um paciente em terapia enzimática de substituição
mostrou uma redução significativa de Gb3 após três meses de terapia.
O método de rastreio desenvolvido oferece um modo simples e fácil de envio das
amostras de urina sem que haja degradação, sendo por isso, adequado para o rastreio em
massa e seguimento dos pacientes em terapia.

vii
INDEX
ABBREVIATION LIST IX
ILLUSTRATION LIST XI
TABLE LIST XII
1. INTRODUCTION 1
1.1. An Overview 2
1.2. Molecular Genetics 3
1.3. Metabolic Background of Fabry Disease 5
1.4. Glycosphingolipid Storage in a Cellular and Subcellular Perspective 9
1.5. Clinical Profile and Pathophysiology 11
1.5.1. Heterozygotes 14
1.6. Treatment 16
1.7. Laboratory Diagnosis of Fabry Disease 17
2. STUDY AIMS 20
3. SAMPLES AND METHODOLOGY 22
3.1. Sampling 23
3.1.1. Biological samples 23
3.1.2. Sample Collection 24
3.2. Reagents and Standards 25
3.3. Methods 26
3.3.1. High-Performance Thin-Layer Chromatography for Conventional Urine Samples 26
4. RESULTS 28

viii
4.1. High-Performance Thin-Layer Chromatography Optimization for Filter Paper Urine Samples 29
4.1.1. Validation of Filter Paper for HPTLC Analysis 29
4.1.2. Extraction Method 31
4.1.3. Lipid Fractionation Process 35
4.1.4. Development of the HPTLC Plate 36
4.1.5. Spraying Solution 37
4.1.6. Gb3 Detection Limit 39
4.1.7. Lipid loss in the HPTLC technique 40
4.1.8. Optimised Protocol 41
4.2. Lipidic Profile of FD Patients and Control subjects 43
4.3. Effect of ERT in FD Patients 46
5. DISCUSSION 48
6. CONCLUSIONS AND FUTURE PERSPECTIVES 53
7. REFERENCES 55
8. APPENDIX I 71
9. APPENDIX II 75

ix
Abbreviation list
3-KSR 3-ketosphinganine reductase
α-Gal A (GLA) α-galactosidase A
β-Hex A (B) β-Hexosaminidase A (B)
AC acid ceramidase
ASA arylsulfatase A
aSMase acid sphingomyelinase
C/M chloroform/methanol
Cer 4 asialoganglioside GM1
CerS ceramide synthase
CERT ceramide transfer protein
CGT ceramide UDP-galactosyltransferase
CST galactose-3-osulfotransferase
CTH ceramide trihexoside
DBS dried blood spot
DHCer dihydroceramide
DHCerS dihydroceramide desaturase
ELISA enzyme-linked immunosorbent assay
ER endoplasmic reticulum
ERT enzyme replacement therapy
FAPP2 four-phosphate adaptor protein 2
FD Fabry disease
FOS Fabry outcome survey
GALC GalCer-β-galactosidase
GalCer galactosylceramide
Gb3 globotriaosylceramide
Gb3 synthase α-1,4-galactosyltransferase
Gb4 globotetraosylceramide; globoside
GCase β-glucocerebrosidase
GCS glucosylceramide synthase

x
GLA α-galactosidase A gene
GLC gas-liquid chromatography
GlcCer glucosylceramide
GM1-GLB GM1-β-galactosidase
GM3 synthase lactosylceramide α-2,3-sialyltransferase
GSL glycosphingolipids
GT3 synthase α-N-acetylneuraminide α-2,8-
sialyltransferase
HPLC high-performance liquid chromatography
HPTLC high-performance thin-layer
chromatography
LacCer lactosylceramide
LacCer synthase LacCer synthase
LVH left ventricular hypertrophy
Lyso-Gb3 globotriaosylsphingosine
Lyso-GSLs lyso-glycosphingolipids
MS mass spectrometry
nSMase neutral sphingomyelinase
PE phosphatidylethanolamine
RSD relative standard deviation
S1P sphingosine 1-phosphate
S1-P Pase sphingosine 1-phosphate phosphatase
(Sa) N-ACT sphinganine N-acyltransferase
Sa1P sphinganine 1-phosphate
Sap A (B, C, D) saposin A (B, C, D)
SD standard deviation
Sk sphingosine kinase
SMS sphingomyelin synthase
SM sphingomyelin
SPT serine palmitoyl transferase
SRT substrate reduction therapy
TLC thin-layer chromatography

xi
Illustration list
FIGURE 1: THE GSL METABOLIC PATHWAYS ........................................................................................................... 6
FIGURE 2: STRUCTURES OF GLOBOTRIAOSYLCERAMIDE AND LYSO-GLOBOTRIAOSYLCERAMIDE ............................................ 7
FIGURE 3: SCHEMATIC REPRESENTATION AND LOCALIZATION OF GSL METABOLISM IN THE CELL ....................................... 8
FIGURE 4: LIPID AGGREGATES IN FABRY DISEASE ..................................................................................................... 9
FIGURE 5: SOME CELL TYPES KNOWN TO EXPRESS HIGH DEGREE OF STORAGE IN FABRY DISEASE ....................................... 10
FIGURE 6: SCHEMATIC MODEL FABRY DISEASE PROGRESSION .................................................................................... 11
FIGURE 7: REPORTED SIGNS AND SYMPTOMS OF FABRY DISEASE AMONG 366 FD PATIENTS ............................................. 15
FIGURE 8: CONVENTIONAL COLLECTION URINE FLASK .............................................................................................. 25
FIGURE 9: FILTER PAPER KIT ............................................................................................................................... 25
FIGURE 10: FILTER PAPER KIT INSTRUCTION SHEET FOR COLLECTION OF URINE SAMPLES ................................................ 73
FIGURE 11: ANALYSIS OF 1 AND 2 FILTER PAPERS FROM A CONTROL SAMPLE................................................................ 30
FIGURE 12: FD PATIENTS’ ANALYSIS OF CONVENTIONAL 20 ML URINE SAMPLES AND URINE SAMPLES
APPLIED TO FILTER PAPERS ............................................................................................................... 31
FIGURE 13:EVALUATION OF DIFFERENT EXTRACTION CONDITIONS ............................................................................... 32
FIGURE 14:ANALYSIS OF DIFFERENT EXTRACTION AGITATION METHODS AND ORGANIC SOLVENT SOLUTIONS ......................... 34
FIGURE 15:ELUTION OF NEUTRAL LIPIDS FRACTION ................................................................................................. 35
FIGURE 16:DEVELOPMENT OF THE HPTLC PLATE FOR 7 CM ..................................................................................... 37
FIGURE 17:VISIBLE WHITE BANDS IN PATIENTS AND CONTROL URINES ......................................................................... 37
FIGURE 18: ORCINOL STAINING OF NEUTRAL LIPIDS ................................................................................................. 38
FIGURE 19: ESTIMATION OF THE GB3 DETECTION LIMIT ........................................................................................... 39
FIGURE 20:GB3 LOSS DURING THE HPTLC TECHNIQUE AND FRACTIONATION OF THE OPTIMISED AND
CONVENTIONAL METHOD .................................................................................................................. 40
FIGURE 21: REPRODUCIBILITY EVALUATION OF THE OPTIMISED METHOD....................................................................... 42
FIGURE 22: ANALYSIS OF SAMPLES FROM CONTROL SUBJECTS AND FD PATIENTS BY THE OPTIMISED
HPTLC METHOD ............................................................................................................................ 44
FIGURE 23:ANALYSIS OF SAMPLES FROM FD PATIENTS COLLECTED BEFORE AND DURING ERT ......................................... 47

xii
Table list
TABLE I: EARLY SIGNS AND SYMPTOMS OF FABRY DISEASE ........................................................................................ 12
TABLE II: COHORT CHARACTERISTICS ................................................................................................................... 23
TABLE III: CHARACTERISTICS OF CONTROL SUBJECTS ............................................................................................... 72
TABLE IV: CHARACTERISTICS OF FD PATIENTS ........................................................................................................ 24
TABLE V: CONSTITUTION OF A STANDARD MIXTURE FOR HPTLC ................................................................................. 27
TABLE VI: DENSITOMETRY OF GB3 AND SM+GB4 BANDS FROM THE FILTER PAPER SAMPLES ........................................... 30
TABLE VII: DENSITOMETRY OF GB3 AND SM+GB4 BANDS FROM URINE SAMPLES EXTRACTED UNDER
DIFFERENT CONDITIONS ........................................................................................................................ 32
TABLE VIII: DENSITOMETRY OF GB3 BANDS FROM EMPTY FILTER PAPERS SUBJECTED TO DIFFERENT
EXTRACTION AGITATION PROCEDURES ...................................................................................................... 76
TABLE IX: DENSITOMETRY OF GB3 ELUTED WITH 8 ML OR 16 ML OF ORGANIC SOLVENT SOLUTION DURING
FRACTIONATION................................................................................................................................... 36
TABLE X: DENSITOMETRY FOR CALCULATION OF GB3 LOSS DURING THE HPTLC TECHNIQUE AND
FRACTIONATION WITH THE OPTIMISED AND CONVENTIONAL METHODS ............................................................. 41
TABLE XI: ASSESSMENT OF VARIABILITY OF THE OPTIMISED METHOD BY DENSITOMETRY................................................... 43
TABLE XII: DENSITOMETRY OF CONTROL AND FD PATIENTS WITH TRACEABLE AMOUNTS OF GB3 ....................................... 45
TABLE XIII: DENSITOMETRY OF GB3 AND SM BANDS OF FD PATIENTS AND CONTROL SUBJECTS ....................................... 76

CHAPTER I
1. INTRODUCTION

HPTLC Detection of Gb3 in Urine Samples: improvement of the method and sampling
Chapter I - Introduction
[2]
1.1. An Overview
Fabry disease (OMIM #301500) is an X-linked inherited lysosomal storage disorder
caused by α-galactosidase A (EC 3.2.1.22) deficiency. α-Gal A is responsible for cleaving out
neutral glycosphingolipids with α-galactosyl residues and is codified by the GLA gene (OMIM
#300644), located on Xq22.1 (Desnick et al, 2001). The impairment of its activity results in
progressive visceral accumulation of its substrates, mainly globotriaosylceramide (Gb3 or
CTH), digalactosylceramide, and to a lesser extent, globotriaosylsphingosine (lyso-Gb3), blood
group B, B1 and P1 related glycolipids (Hrebícek & Ledvinová, 2010). This accumulation in
lysosomes leads to dysfunction of basic metabolic processes in the cell, leading to its death,
which contributes to the development of secondary (inflammatory) processes culminating with
vital organ dysfunction (Eng et al, 2007). Gb3 is the most abundant accumulated substance
making it an appropriate molecular marker of FD. Increased values of Gb3 were reported in
both hemizygous males and heterozygous females (Bodamer, 2007). Even though FD follows
an X-linked pattern of inheritance, having males more severe symptoms, heterozygous females
that in the past were considered as carriers, can be as affected as their male counterparts.
About 69,4% of the 1077 females in the Fabry Registry (an ongoing observational database
that tracks natural history and outcomes of FD patients) had symptoms and signs of the
disease, showing that females have a considerable risk for major organ involvement and
decreased quality of life (Germain et al, 2010).
FD is estimated to have a prevalence ranging from 1:40000 males to 1:117000 births
(Germain, 2010; Levy & Feingold, 2000; Meikle et al, 1999). Due to its rarity, accurate values
about its prevalence are harder to obtain. FD was for a long time predominantly described in
males developing a “classic” phenotype (compatible with null α-Gal A activity and multi-organ
involvement). However the remarkable heterogeneity in clinical manifestations among the
patients, even within the same pedigree, led to the creation of sub-classifications, such as, the
“cardiac variant” and the “renal variant”, for those patients showing predominant or exclusive
cardiac or renal complications (Germain, 2010; Hrebícek & Ledvinová, 2010).
Despite the fact that the first signs of the disease emerge during childhood,
glycosphingolipid accumulation processes might start in the fetal stage. The clinical features
observed in FD patients worsen in adulthood and the mortality causes are generally related to

HPTLC Detection of Gb3 in Urine Samples: improvement of the method and sampling
Chapter I - Introduction
[3]
heart failure, renal failure or cerebrovascular accidents (Liu et al). Furthermore, FD signs and
symptoms are not pathognomonic, which can delay the clinical diagnosis often until irreversible
organ damage is already present. This becomes more evident in the absence of family history
and in the case of affected females, since the range of enzyme activity in these patients is
broader than in males (Germain, 2010). While FD can be diagnosed in males by demonstrating
significantly reduced enzymatic activity of α-Gal A in plasma, leukocytes, fibroblasts or dried
blood spots (DBSs; Gaspar et al, 2010), heterozygous females can only be unequivocally
identified by mutational analysis. Classic hemizygotes and over 90% of the heterozygous
females show elevated urinary Gb3 levels (Winchester & Young, 2006). For male patients with
residual α-Gal A activity or with an atypical clinical presentation, measurement of urinary Gb3
and sequencing of the whole GLA gene must be carried out (Winchester & Young, 2006).
Although there is still no cure for FD, enzyme replacement therapy (ERT) is available in
Europe since 2001. Two different products are approved, Agalsidase alfa (Replagal®, Shire
Human Genetic Therapies) and Agalsidase beta (Fabrazyme®, Genzyme Corporation; Lidove et
al, 2010).
1.2. Molecular Genetics
The GLA gene is localized at the X chromosome in the region Xq22.1 and is
constituted by 12 kilobases distributed through 7 exons (Bishop et al, 1986; Kornreich et al,
1990).
Above 400 point mutations and 150 small rearrangements have been identified
scattered throughout the GLA gene (Gal, 2010; Masson et al, 2004). Most of the identified
patients have different mutations. The great majority of the GLA mutations are private/unique
of the family (Gal et al, 2006; Schäfer et al, 2005).
The point mutations include missense, nonsense and splice site mutations, and the
rearrangements include deletions and intragenic insertions (Desnick et al, 2001; Gal, 2010).
The missense and nonsense mutations correspond to approximately 70% of the described
mutations known to cause FD (Schäfer et al, 2005). The high proportion of novel mutations,
the large phenotypic heterogeneity associated with the same mutation and the fact that
patients with FD may develop disease-related complications observed in the general

HPTLC Detection of Gb3 in Urine Samples: improvement of the method and sampling
Chapter I - Introduction
[4]
population, difficult the genotype-phenotype correlations (Ries & Gal, 2006). However, some
phenotypes associated to Fabry disease may be attributed to specific mutations of the GLA
gene (Brown et al, 1997; Eng et al, 1993; Germain et al, 2002; Saito et al, 2011; Spada et al,
2006). Alleles with nonsense and splice-site mutations in the GLA gene or out-of-frame short
rearrangements usually lead to a premature termination codon. Consequently, these alleles do
not produce the enzyme. The missense mutations can affect the enzyme activity in a quite
variable way. Clearly, the substitution of one residue in the pocket of the enzyme, or
substitution of a residue essential for proper three-dimensional folding of the protein, generally
results in a completely inactive enzyme. In contrast, the missense mutations associated with a
less severe phenotype are generally located away from the active site of the enzyme, resulting
in small structural changes. However, the enzyme product of missense mutations may still be
subject to post-translational inactivation and degradation (Gal, 2010; Matsuzawa et al, 2005).
In Fabry disease, heterozygous females where initially referred to as carriers
concerning their genotype. Even so, the affected females can present a phenotype that ranges
from asymptomatic to the classical form of the disease seen in the majority of the male
patients (MacDermot et al, 2001b; Wang et al, 2007; Whybra et al, 2001; Wilcox et al, 2008).
Among females presenting the classic form of FD (null α-Gal A activity), missense and
nonsense mutations are present. On the other hand, in patients with less severe or
asymptomatic forms of the disease, only missense mutations are present, which leads to
residual activity of α-Gal A (Desnick et al, 2001). Nevertheless, it is harder to predict the
hetezygotes phenotype due to the X-inactivation process, which occurs early in the female
embryonic phase and leads to a random and almost complete inactivation of one of the X
chromosomes per cell. Therefore, depending on which α-Gal A gene is inactivated (the normal
or the mutated gene) and according to the skewing rate that occurred at the precedent cell,
different organs from the same patient may have distinct pathology degrees (Elstein et al,
2012).
Since FD is linked to the X chromosome, males descending from hemizygous males do
not carry the mutated gene, while females acquire the mutated gene. Therefore, prenatal
diagnosis is of major importance. FD can be determined by assessing α-Gal A activity in
amniotic fluid at weeks 12 to 14 (Desnick et al, 2001).

HPTLC Detection of Gb3 in Urine Samples: improvement of the method and sampling
Chapter I - Introduction
[5]
1.3. Metabolic Background of Fabry Disease
The deficient α-Gal A catalytic activity of Gb3 and other substrates, leads to subcellular
functional alterations responsible for the massive lysosomal storage of these components.
Ultimately, the storage culminates in irreversible cell damage and death (Elleder, 2010).
α-Gal A substrates are sphingolipids characterized by an α-galactosyl moiety, of which
Gb3, a glycolipid of the globo-series metabolism, is the major accumulated substrate. The
massive storage of this GSL is pointed out as the major responsible for FD development. As
seen in Figure 1, Gb3 can be synthesized from lactosylceramide (LacCer) by Gb3 synthase or it
can be a product of globotetraosylceramide (Gb4) degradation by β-Hexosaminidase A (B) (Xu
et al, 2010).
Besides Gb3, also di-galactosylceramide possesses an α-galactosyl moiety, making it
suitable for degradation by α-Gal A. This glycolipid and other glycolipids from the blood group
B, like the B1 and P1 related lipids, with α-galactosyl extremities have been shown to
accumulate in Fabry patients, although in much lesser extent. Patients with this biochemical
profile do not seem to be in higher risk for developing severe disease manifestations. Therefore
scientific attention is mostly turned to the study of the glycosphingolipids that are thought to be
related to the disease progression and severity (Elleder, 2010).
Lyso-Gb3, a deacylated derivate of Gb3 is also accumulated in FD (Aerts et al, 2008).
Lyso-Gb3 has a similar structure to that of Gb3 but instead of ceramide it has a sphingosine
backbone (Figure 2).

HPTLC Detection of Gb3 in Urine Samples: improvement of the method and sampling Chapter I - Introduction
[6]
Figure 1: The GSL metabolic pathways. The synthesis and degradation of GSLs are sequential processes. The synthesis is catalyzed by membranous glycosyltransferases in the endoplasmic reticulum (ER). GSL synthesis
begins with condensation of serine and palmitoyl-CoA, leading to de novo biosynthesis of ceramide. Ceramide can also be formed from sphingosine by addition a fatty acid chain of specific length, or hydrolysis of sphingomyelin
(SM). Once formed, ceramide can originate galactosylceramide (GalCer) or glucosylceramide (GlcCer) by addition of galactose or glucose residues, respectively. GalCer can form sulfatide and di-galactosylceramide (one of the
GSLs accumulated in Fabry patients). The addition of one β-gal residue to GlcCer originates LacCer, which is a precursor of Gb3. Gb3 is created when a α-gal is added to LacCer and Gb4 is formed when α-gal is added to Gb3.
1=GM2/GD2/GA2/GT2-synthase. The degradation reactions occur in the lysosome by action of several hydrolases. (Adapted from Xu et al, 2010).
Synthesis
Degradation

HPTLC Detection of Gb3 in Urine Samples: improvement of the method and sampling
Chapter II – Study Aims
[7]
Figure 2: Structures of globotriaosylceramide and lyso-globotriaosylceramide. A. Gb3 is organized in 3 sugar
residues, α-gal, β-gal and β-glc, and a ceramide tail composed of a fatty acid acyl chain, that varies in length and saturation,
and a sphingosine backbone. B. In lyso-Gb3, a deacylated derivate of Gb3, the fatty acid chain is missing (Adapted from
Hřebíček & Ledvinová, 2010 and Cole et al, 2007).
The deposition of other lyso-glycosphingolipids (lyso-GSLs) was shown to be a
characteristic aspect of LSDs, such as Krabbe (deposition of galactosylsphingosine) and
Gaucher disease (deposition of glucosylsphingosine; Nilsson & Svennerholm, 1982; Orvisky et
al, 2002; Svennerholm et al, 1980). These lyso-GSLs are described for their toxic effects and
as potential pathologic agents in these diseases (Igisu & Suzuki, 1984; Orvisky et al, 2002).
Therefore, lyso-Gb3 could be implicated in FD pathological events as well. In 2008, Aerts and
colleagues described high levels of lyso-Gb3 in plasma of Fabry patients and mice. They
advanced that this compound competes with Gb3 for the α-Gal A activity and promotes smooth
muscle cell proliferation, which can be related to an increase in thickness of the intima-media
of the heart (Aerts et al, 2008).
The understanding and knowledge of the pathways related to the incorporation and
degradation of these GSLs may lead to relevant discoveries in the mechanisms associated to
disease progression and tissue/cell specific reaction processes. The so far described synthesis
and degradation pathways can be seen in Figure 3. The pathways that lead to α-Gal A

HPTLC Detection of Gb3 in Urine Samples: improvement of the method and sampling
Chapter I - Introduction
[8]
substrate delivery into the lysosome for degradation are still poorly understood but it is known
that the substrates can be localized at the cell membrane or at the extracellular matrix and
then be transported by endocytosis by plasma lipoproteins (Elleder, 2010; Huwiler et al,
2000). Thereafter, the endocytic vesicles are fused with the lysosome where α-Gal A plays its
role, generating LacCer as a product of GSL degradation. The internalization of α-Gal A
substrates into the cell is also possible through phagocytosis of old or damaged red blood cells
(Elleder, 2010). Therefore, understanding and exploring the possible mechanisms of GSL
trafficking may be important to predict the reaction of tissues and cells in their current
environment and in response to several conditions.
Figure 3: Schematic representation and localization of GSL metabolism in the cell. GSL biosynthesis starts in the ER. Ceramide
can be synthesized de novo from L-serine condensation with palmitoylCoA on the cytoplasmic face of ER or it can be formed from the GSLs
recycled in the lysosome, specifically sphingosine. After this processes, ceramide can follow three possible pathways: a) it can form GalCer in
the ER which on the other hand will generate sulfatide in the Golgi complex; b) it can be transported to the golgi complex in vesicles where it
originates GlcCer on its cytoplasmic face; or c) ceramide can be transported to the mid-Golgi by CERT (ceramide transfer protein) to SM
synthesis in the Golgi lumen. The FAPP2 (four-phosphate adaptor protein 2) enables the transport of GlcCer between ER and Golgi complex.
GlcCer also reaches the cell membrane but the inherent mechanisms from which this happens are still unknown. FAPP2 is capable of
transferring GlcCer from the cis face to the trans face of the Golgi complex as well, allowing the formation of a large variety of GSLs.
Synthesized GSLs are then exocytosed from the cell to the extracellular matrix. Membrane GSLs recycling process starts by endocytosis and
fusion with a lysosome for their degradation to sphingosine and free fatty acids. Membrane and cytosolic hydrolysis of SM can generate
sphingosine as well which is further degraded. (Adapted from Xu et al, 2010).

HPTLC Detection of Gb3 in Urine Samples: improvement of the method and sampling
Chapter I - Introduction
[9]
1.4. Glycosphingolipid Storage in a Cellular and Subcellular
Perspective
α-Gal A deficiency is correlated with appearance of lipid deposits inside the cells, more
specifically within lysosomes. When GSLs start to accumulate, lysosomes acquire a
conformation characterized by stacks of membranous structures with concentric or parallel
disposition (zebra bodies; Figure 4). The circular deposits and fused lysosomes can be
observed by convergence of two or more distinct laminar aggregate sets (Figure 4). Although
the lipid aggregates entirely occupy the lysosome lumen and force lysosome expansion, no
alterations are currently described for the biology of the lysosome. In 2008 Valbuena and
coworkers hypothesized that the rupture of the storage lysosomes into the cytoplasm may be
sufficient to cause cell death (Valbuena et al, 2008).
Figure 4: Lipid aggregates in Fabry disease. Photomicrograph of a kidney biopsy representing GSL deposits: in cells of
distal tubules (T) and in a capillary (C). Fused lysosomes (FL). (Germain, 2010).
The cell types affected by GSL storage in Fabry disease include endothelial cells,
smooth muscle cells, cardiomyocytes, peripheral neurons and perineural cells, fibroblasts,
pericapillary cells (i.e. pericytes and podocytes), ciliary epithelial cells, renal tubular epithelial
cells, some secretory cells, macrophages and adipocytes (Figure 4 and 5, Chimenti et al,
FL
FL
FL

HPTLC Detection of Gb3 in Urine Samples: improvement of the method and sampling
Chapter I - Introduction
[10]
2008; Elleder, 2003; Elleder, 2010; Hůlková & Elleder, 2010). Leukocytes are also affected in
FD showing Gb3 deposits and physiologic alterations (Macedo et al, 2012; Rozenfeld et al,
2009a)
Figure 5: Some cell types known to express high degree of storage in Fabry disease. (a) complex capillary
endothelium-pericyte; (b) glomerular podocyte; (c) smooth muscle cell; (d) subcutaneous adipocytes (asterisks); (e) peripheral
neuron in the bronchial wall; perineurial cells in large (f) and terminal (g) nerve fibres (magn. a, b, c, g 4,000×, f 3,000×).
SC – collapsed storing capillary. (Adapted from Elleder, 2010 and Hůlková & Elleder, 2010).
d

HPTLC Detection of Gb3 in Urine Samples: improvement of the method and sampling
Chapter I - Introduction
[11]
The extension of cell damage and the number of affected cells within an organ will
determine the burden of the disease. These factors worsen as the disease progresses resulting
in dysfunction of several organs (Figure 6; Eng et al, 2007).
Figure 6: Schematic model of Fabry disease progression. (Eng et al, 2007).
1.5. Clinical Profile and Pathophysiology
The pathological processes and the majority of the clinical manifestations become
more severe with aging, however some of the pathological events have an early onset and can
be detected at a pediatric age (see Table I). FD has a wide spectrum of clinical manifestations
and systemic organ commitment is observed in patients with the classic phenotype (patients
with null α-Gal A activity). The clinical profile of these patients involves left ventricle hypertrophy
(LVH), acute and chronic neuropathic pain, renal insufficiency, skin lesions, ocular alterations
and gastrointestinal symptoms (Germain, 2010).
The renal insufficiency develops as a consequence of cellular lesions caused by Gb3
storage, mainly in the glomerulus and podocytes, but damage also occurs in glomerular
endothelial, mesangial and parietal epithelial cells (Alroy et al, 2002). This background evolves
to mesangial widening and, in later stages, to glomerulosclerosis. Alterations in distal tubular
epithelial cells and, in less extent, in proximal tubular epithelial cells, in addition to vascular
lesions, will progressively cause tubular atrophy and interstitial fibrosis (Alroy et al, 2002).

HPTLC Detection of Gb3 in Urine Samples: improvement of the method and sampling
Chapter I - Introduction
[12]
Proteinuria results as a sign of renal function impairment and in adulthood renal insufficiency
occurs due to chronic kidney disease, leading the patient to hemodyalisis (Desnick et al,
2003).
Table I: Early signs and symptoms of Fabry disease. (adapted from Eng et al, 2007).
A renal variant of FD was detected in a Japanese study, where hemodialysis patients
with glomerulonephritis presented absent or low α-Gal A activity. One novel and two previously
described mutations in the GLA gene were identified (Nakao et al, 2003). In this variant, some
FD patients present disease manifestations confined to the kidney, but they may also develop
vascular disease of the heart or brain later in life (Germain, 2010).
FD also promotes the development of cardiomyopathies, like LVH, arrhythmias,
conduction and valvular abnormalities, and coronary heart disease (Germain, 2010). The
Organ system Sign/Symptom
Nervous system Acroparesthesias
Nerve deafness
Heat intolerance
Hearing loss, tinnitus
Gastrointestinal tract
Nausea, vomiting, diarrhea
Postprandial bloating and pain, early satiety
Difficulty in gaining weight
Skin Angiokeratomas
Hypohidrosis
Eyes Corneal and lenticular opacities
Vascolopathy (retina, conjuntiva)
Kidneys Microalbuminuria, proteinuria
Impaired concentration ability
Hyperfiltration
Increased urinary Gb3 excretion
Heart Impaired heart rate variability
Arrhythmias
Electrocardiogram abnormalities
Mild valvular insufficiency

HPTLC Detection of Gb3 in Urine Samples: improvement of the method and sampling
Chapter I - Introduction
[13]
cellular processes leading to these alterations develop throughout patient’s life, with
accumulation of GSLs, particularly Gb3, on coronary arteries, myocardium, endocardium, and
intravascular and intracardiac nerves (Askari et al, 2007).
Myocardial fibrosis is another pathological process described in FD patients (Hasegawa
et al, 2006; Moon et al, 2006). In advanced cases, transmural replacement fibrosis evolves to
a congestive heart failure (Germain, 2010).
The heart is predisposed to the GSL storage and in some cases it can be the only
affected organ. This particular phenotype of FD is described as the cardiac variant of the
disease and it is the most frequent atypical variant. Manifestations include cardiomegaly,
electrocardiographic abnormalities consistent with cardiomyopathy, non-obstructive
hypertrophic cardiomyopathy and myocardial infarctions (Germain, 2010).
Vascular lesions caused by GSL excessive storage origin angiokeratomas, which are
characterized by single or clustered small reddish purple, raised superficial skin lesions.
Generally this manifestation can be localized on the buttocks, groin, umbilicus and upper
thighs (Germain, 2010). Skin sweat glands are affected by FD as well, leading to anhydrosis or
hypohydrosis, which can cause heat and exercise intolerance (Eng et al, 2006; Kang et al,
1987; Orteu et al, 2007; Shelley et al, 1995).
Cornea opacities, commonly called cornea verticillata, and a corneal haze, are present
in many FD patients but do not affect the vision capacity (Orssaud et al, 2003). Conjunctival
and retinal vascular tortuosity can be observed in some patients as well as anterior and
posterior subcapsular cataracts (Nguyen et al, 2005; Orssaud et al, 2003; Sodi et al, 2007).
The posterior subcapsular cataract is considered the only pathognomonic clinical event of FD,
therefore described as “Fabry cataract” (Germain, 2010). Optic neuropathy was also detected
in FD patients in a pilot study (Pitz et al, 2009).
Cerebrovascular complications strongly contribute to morbidity and mortality of FD
patients and are related to lesions in the large and small vessels, and alterations in other
elements of the Virchow’s triad (which include factors that are thought to contribute to
thrombosis, being the endothelial injury of brain vessels one of them; Fellgiebel et al, 2006;
Moore et al, 2007). The most preoccupying manifestations observed in FD patients are
transient ischemic attacks and strokes, that include ischemic and hemorrhagic stroke, and
both have onset around the forth decade of life (Schiffmann et al, 2009). Symptoms like

HPTLC Detection of Gb3 in Urine Samples: improvement of the method and sampling
Chapter I - Introduction
[14]
headache, vertigo/dizziness and vascular dementia have also been reported (Mendez et al,
1997; Mitsias & Levine, 1996). Besides the clinical manifestations FD patients also develop
periventricular white-matter lesions, microbleeds, cortical grey-matter infarcts and deep lacunar
infarcts in both grey and white matter (Buechner et al, 2008; Jardim et al, 2004; Sims et al,
2009).
Gastrointestinal symptoms are common between FD patients and include post-prandial
abdominal pain, diarrhea, nausea and vomiting (MacDermot et al, 2001a; Mehta et al, 2004;
Rowe et al, 1974; Stryker & Kreps, 2001). Achalasia (esophageal motility disorder that can
result in gastric reflux) and jejunal diverticulosis (able to cause small bowel perforation) can
also occur (Banikazemi et al, 2005). These clinical manifestations are thought to be related to
neuropathy of the autonomic nervous system and deposition of GSLs in ganglia and small
mesenteric vessels (Hoffmann et al, 2004).
Neuropathic pain is present very early in FD patients and is generally the first clinical
manifestation of the disease. However, the peripheral somatic and autonomic nerve systems
are already affected in childhood and 41-59% of the FD children from both genders feel pain
(Cable et al, 1982; Dutsch et al, 2002). In adolescence, the neuropathic pain experience
increases to 65-81% among FD patients (Hopkin et al, 2008). Pain can be characterized by
episodic crises of acute burning pain at the extremities or chronic paraesthesias, triggered by
physical or emotional stress (Hoffmann et al, 2007). The physical limitations resulting from this
symptom significantly reduce the patient’s quality of life (Germain, 2010).
1.5.1. Heterozygotes
For many years the FD females were seen as carriers of the disease, showing few or
none of the clinical symptoms. However, the number of case reports including females
showing signs and symptoms of FD, continued to increase, and large surveys among patients
with FD revealed that there was a high prevalence of affected females (Figure 7; Desnick et al,
2001; Mehta et al, 2004; Bodamer, 2007). Since α-Gal A activity in FD females is often within
the normal limits even in cases of severe clinical phenotype, it is difficult to elaborate the
diagnosis, and therefore a combination of screening techniques including enzyme activity
assays, measurement of urinary substrate excretion and molecular analysis, has to be carried
out (Bodamer, 2007).

HPTLC Detection of Gb3 in Urine Samples: improvement of the method and sampling
Chapter I - Introduction
[15]
The most common complications experienced by FD heterozygous females are
acroparesthesia, present in more than 80% of these patients since childhood (MacDermot et al,
2001b; Whybra et al, 2001), angiokeratoma, found in more than 55% of FD females (Whybra
et al, 2001), renal impairment, affecting up to 50% of the female patients (MacDermot et al,
2001b; Wang et al, 2007) and cerebrovascular accidents, in 5-21% of the females (Fellgiebel et
al, 2006; MacDermot et al, 2001b; Mehta et al, 2004; Rolfs et al, 2005). Heart manifestations
were also found in some affected females, like hypertrophy, cardiomyopathy, cardiac valve
disease, and arrhythmias (Chimenti et al, 2004; Elleder, 2010; Kampmann et al, 2002; Mehta
et al, 2004; Shah et al, 2005).
Figure 7: Reported signs and symptoms of Fabry disease among 366 FD patients. For this study it was considered
the age of the FD patients at the time of entry into the European Fabry Outcome Survey (FOS) in hemizygous males (black bars)
and heterozygous females (white bars). (Mehta et al, 2004).

HPTLC Detection of Gb3 in Urine Samples: improvement of the method and sampling
Chapter I - Introduction
[16]
The lifespan of FD females is therefore reduced upon these complications and efforts
must be made concerning their diagnosis, since many of the heterozygous females are still
misdiagnosed.
1.6. Treatment
ERT is available for FD patients since 2001 in Europe in the form of two different
drugs, Agalsidase alfa (Replagal®, Shire Human Genetic Therapies), and Agalsidase beta
(Fabrazyme®, Genzyme Corporation; Lidove et al, 2010).
Both Agalsidase alfa and beta are designed to boost α-Gal A activity. The amino acid
composition of Agalsidase alfa and Agalsidase beta is the same and both are capable of
successfully correct the substrate storage in FD patients cultured fibroblasts (Blom et al,
2003). On the other hand, differences in glycosylation and the number of mannose-6-
phosphate residues have been described (Lee et al, 2003; Sakuraba et al, 2006). Agalsidase
beta possesses more mannose-6-phosphate residues than Agalsidase alfa and the number of
mannose-6-phosphate will influence the target compartment of these enzymes within the cell,
which has to be the lysosome in order to fulfill its role. (Lee et al, 2003; Sakuraba et al, 2006).
Since the glycosylation process might be important for enzyme input in human cells, and once
glycosylation in Agalsidase beta is from non-human cells, it is possible that IgG antibodies are
produced against this drug (Eng et al, 2001; Schiffmann et al, 2001). Nevertheless, the
production of antibodies can be stimulated by both enzymes, with higher probability in patients
with lower α-Gal A activity (Eng et al, 2001; Schiffmann et al, 2006). These antibodies
neutralize the enzyme activity (Ohashi et al, 2007). Studies made on male patients being
treated by ERT show that Agalsidase alfa is less antigenic than Agalsidase beta and therefore
less antibodies are produced against this enzyme (Vedder et al, 2007a).
The approved dose of enzyme is 0.2 mg/Kg for Agalsidase alfa and 1.0 mg/Kg for
Agalsidase beta every 15 days. Both treatments have variable results in FD patients, but
preservation and stabilization of the renal function has been described, as well as reduction of
cardiac hypertrophy, infarct and diarrhea episodes, fatigue and pain (Connock et al, 2006).
Hearing loss, ‘psychological status’, frequency of physical exercise, ability to sweat and quality

HPTLC Detection of Gb3 in Urine Samples: improvement of the method and sampling
Chapter I - Introduction
[17]
of life were improved in treated patients (Connock et al, 2006; Wilcox et al, 2004). However
ERT cannot stop FD from evolving if it is already in an advanced stage, especially when renal
insufficiency is already present (Vedder et al, 2007a). For this reason, it is extremely important
to start the therapy as soon as possible, in order to significantly improve lifespan of FD
patients. An alternative to the ERT is Substrate Reduction Therapy (SRT), which inhibits the
GSL biosynthesis in order to reduce accumulation of the α-Gal A substrates (Platt et al, 1994).
This therapy was only tested in the animal model of FD and lymphoblasts of FD patients (Abe
et al, 2000a; Abe et al, 2000b; Heare et al, 2007).
Although SRT and ERT can both reduce the storage substances, a recent study
combining both therapies in FD mice revealed that SRT works as an adjuvant for ERT,
improving the beneficial effects in many tissues, where higher storage clearance results were
obtained (Marshall et al, 2010).
1.7. Laboratory Diagnosis of Fabry Disease
The Fabry outcome survey, a survey of a large cohort of Fabry patients, revealed that
the average age for the FD diagnosis was 25.7 ± 15.3 years and 31.3 ± 17.4 years for male
and female patients, respectively, with an average delay between onset of symptoms and
diagnosis of approximately 12 years for both genders (Beck, 2006). Although the clinical
history raises the suspect of FD, the definitive diagnosis in male patients is done when
diminished α-Gal A activity is detected in a blood sample (Caudron et al, 2007; Desnick et al,
2001; Winchester & Young, 2006). The blood sample can either be leukocytes, plasma/serum
(Winchester & Young, 2006) or DBSs (Chamoles et al, 2001; Gaspar et al, 2010). α-Gal A
activity can also be determined in cultured fibroblasts, urine and other tissues (Winchester &
Young, 2010). To confirm the diagnosis, mutational analysis of the GLA gene can be
performed. In heterozygous females, the measurement of the α-Gal A activity is not sufficient to
give a reliable diagnosis since the α-Gal A activity may be within the normal range, due to
random inactivation of the X-chromosome (Germain, 2010). Hence, female samples must be
submitted to mutation analysis as well.

HPTLC Detection of Gb3 in Urine Samples: improvement of the method and sampling
Chapter I - Introduction
[18]
The accumulation of α-Gal A substrates, namely Gb3 and lyso-Gb3, in plasma and
urine can be measured and used to support the diagnosis and for treatment monitoring (Aerts
et al, 2008; Eng et al, 2001; Togawa et al, 2010).
The described methods for direct Gb3 identification and measurement are thin-layer
chromatography (TLC; Berná et al, 1999; Philippart et al, 1969), enzyme-linked
immunosorbent assay (ELISA; Zeidner et al, 1999) and mass spectrometry (MS; Domon &
Costello, 1988; Hsu & Turk, 2001; Mills et al, 2002). Other methods include
immunohistochemistry (Selvarajah et al, 2011), indirect Gb3 identification by release of the
oligosaccharide moiety by gas-liquid chromatography (GLC; Vance & Sweeley, 1967) or high-
performance liquid chromatography (HPLC; McCluer et al, 1989; Ullman & McCluer, 1977).
The ultimate efforts made to improve the screening methodologies concern the mass
or high-risk screening, based on measurement not only of α-Gal A activity and/or protein in
DBSs, but also of the storage products in urine collected on filter paper. Some screening
programs for FD based on MS measurement of Gb3 levels in urine and plasma, produced
satisfactory and relevant results for comprehension of disease severity (Auray-Blais et al, 2007;
Auray-Blais et al, 2006; Boscaro et al, 2002; Chien et al, 2011; Kitagawa et al, 2005). On the
other hand, MS is a time-consuming method that is economically and technically very
demanding, requiring specialized data interpretation.
TLC is a classic method for lipid identification used over thirty years in GSL analysis.
The TLC resolving power, robustness and easy handling makes it a very reliable method for
identification and separation of neutral GSLs and gangliosides (Kundu, 1981; Müthing, 1996;
Müthing, 1998; Schnaar & Needham, 1994; Skipski, 1975; Yu & Ariga, 2000). Thus, it is a
method suitable for a mass screening program.
The diagnosis of FD must be done as early as possible to achieve a better prognosis.
However, the newborn screening of late onset X-linked disorders such as FD isn't generally
accepted. For this reason, the screening of high-risk populations, which are composed of
individuals with family history of FD or have symptoms compatible with FD, is the most
adequate approach.
In fetus, the diagnosis can be achieved through the assessment of α-Gal A activity in
the fetal tissues, since it reflects the genotype of the fetus. Hemizygous males are diagnosed
due to deficient α-Gal A activity and heterozygous show variable amounts of activity. In male

HPTLC Detection of Gb3 in Urine Samples: improvement of the method and sampling
Chapter I - Introduction
[19]
fetus, the diagnosis can be made directly by measuring α-Gal A activity and/or mutation
analysis (if the family mutation is known) directly in the chorionic villi and in cultured chorionic
villi and amniotic cells (Winchester & Young, 2010). The female fetus can only be reliably
diagnosed by mutational analysis, however it is not possible to predict what exactly will be the
course and severity of FD in the heterozygous females for a certain mutation (Beck, 2006).

CHAPTER II
2. STUDY AIMS
HPTLC Detection of Gb3 in Urine Samples: improvement of the method and sampling
Chapter II – Study Aims
[20]
FD is a lysosomal storage disorder originated by a deficient activity of α-Gal A caused
by mutations in the GLA gene. The substrates hydrolyzed by α-Gal A, such as Gb3 and other
related GSLs, accumulate in different tissues and organs causing its dysfunction and are
usually excreted in urine.
FD is an X-linked disease, however it is known that not only the males but also most of
the females heterozygous for GLA mutations, present symptoms, although FD female patients
have a late onset and show a slower progression of the disease. The severity and rate of
progression of the disease is dependent on the degree of residual enzyme activity. The males
with a classic form of FD are easy to diagnose since they present no residual activity, on
contrast to females (heterozygous) and the males with a non classic form of FD, as they
present some residual activity, and the diagnosis implicates combined biochemical and genetic
analyses.
ERT is available for FD patients in the form of Agalsidase alfa and Agalsidase beta,
both showing multi-organ beneficial effects. However, it must be noticed that the earlier the
treatment starts, the higher are the chances of increasing the lifespan and quality of life of
these patients.
Many studies focus on the diagnosis of FD by measuring the α-Gal A activity in blood
and accumulation of its substrates, mainly Gb3, in urine and plasma of high risk populations.
Mass spectrometry is widely applied for the screening of FD, as well as of other LSDs.
However, mass spectrometry is a very expensive method, requires much skill from the
operator and involves complex equipment. TLC is a robust and well explored method, suitable
to analyse a large number of samples.
Urine samples are easy to collect, facilitating the cooperation of individuals, but on the
other hand, the transportation is difficult without compromising the samples' integrity.
Thus, this study aims to use urine samples of FD patients to define a reliable diagnosis
method, applicable to an automatic screening program of FD, and to follow the patients that
are on ERT.
Therefore, this study has the following specific aims:
1. Simplification of the shipping method of urine samples using the filter paper as
support material.

HPTLC Detection of Gb3 in Urine Samples: improvement of the method and sampling
Chapter II – Study Aims
[21]
2. Optimization of the analysis method of Gb3 used in the laboratory for analysis
of filter paper urine samples.
3. Obtain a screening system able of discriminating FD patients (males and
females) from healthy individuals, and useful to follow FD patients under
treatment.
4. Determination of the GSL profile in urine of FD patients, with known mutations
of the GLA gene, before and after the beginning of the ERT.

CHAPTER III
3. SAMPLES AND METHODOLOGY

HPTLC Detection of Gb3 in Urine Samples: improvement of the method and sampling
Chapter III – Samples and Methodology
[23]
3.1. Sampling
3.1.1. Biological samples
For this study eleven FD patients and thirty control subjects were analysed. The
samples from control subjects were obtained from internal volunteers with representation of
both genders and with ages between 20 and 69 years (Table II and Appendix I – Table III). Of
the thirty control subjects 23 samples were collected with the filter paper kit. As for the FD
patients, samples were obtained through a protocol established with the physicians and
hospitals directly linked to the patients1. Samples from FD patients are from both genders and
their ages are between 2 and 67 years (Table IV). Due to the established protocols, all patient
samples were conventionally collected. The GLA gene mutations were previously identified and
the mutations C94S, F113L, M290I and R118C in the studied patients. Only two of the
patients presented samples at least in two time points during ERT.
Table II: Cohort characteristics. Description of patient (n=11) and control subjects (n=30) regarding their age, collection
method (filter paper kit or conventional liquid collection) and gender. Age is presented as mean. The age range is displayed in
parenthesis.
Samples Age Collection Method Gender
Filter Paper Conventional Males Females
Patients (n=11)
31.4 (2-67)
0 11 8 3
Controls (n=30)
37.9 (20-69)
23 7 15 15
1 Protocols established between Dr. Olga Azevedo – Centro Hospitalar do Alto Ave, Dr. Elisa Leão – Hospital S. João, Dr. Célia Barbosa – Hospital Pedro Hispano and Dr. Miguel Rodrigues – Centro Hospitalar de Setúbal.

HPTLC Detection of Gb3 in Urine Samples: improvement of the method and sampling
Chapter III – Samples and Methodology
[24]
Table IV: Characteristics of FD patients. Discrimination in terms of gender, age, GLA gene mutation and treatment
duration at the time of sample collection. M – male; F – female. Asterisk (*) represents family related patients.
Patient Gender Age GLA Mutation Treatment time at sample collection
(months)
1 M 9 C94S 0
2 M 40 F113L 0, 3, 8
3 M 49 F113L 0
4 M 24 F113L 0
5 M 2 M290I 0
6 F 44 M290I 0
7* F 35 F113L 0
8 M 11 F113L 0
9* M 18 F113L 0
10 M 47 R118C 0
11* F 67 F113L 5, 17
3.1.2. Sample Collection
Liquid urine samples were collected in the flask seen in Figure 8, aliquoted and frozen
at -20 ºC until the analysis. Filter paper urine samples were collected using the kit in Figure 9.
The recipient carried two filter paper squares, each one of 5 x 5 cm and was accompanied by
an envelope containing a forceps. The donor was instructed of how to collect the sample and
handle the filter papers through an instructions sheet (Appendix I – Figure 10). The collection
indications were as follows: 1) dispose the excess of urine after absorption by the filter papers;
2) dry the filter papers at room temperature; 3) use the forceps to handle the dried filter
papers and send them by mail using the provided envelope. At the arrival, the samples were
catalogued and stored at -20 ºC in a sealed bag.

HPTLC Detection of Gb3 in Urine Samples: improvement of the method and sampling
Chapter III – Samples and Methodology
[25]
Figure 8: Conventional collection urine flask. Urine collection flask with capacity to 100 mL.
Figure 9: Filter paper kit. A. Urine collection container of 200 mL with two 5 x 5 cm filter papers (Whatman® #903). B.
Filter paper kit for urine collection composed by one urine container with filter papers, one envelope and one sealed forceps.
All our patient samples were 20 mL conventionally collected urine samples stored at -
20 ºC. For this matter, these samples had to be defrosted and applied to filter papers, 2 mL
per filter paper.
3.2. Reagents and Standards
Organic solvents such as chloroform (CHCl3) and methanol (MeOH; Fisher Scientific®
HPLC grade) were used to make organic solvent solutions or for single use.
The derivatization solution was produced with p-anisaldehyde (Sigma Aldrich®) and 96%
PA sulphuric acid (H2SO4; Panreac®).

HPTLC Detection of Gb3 in Urine Samples: improvement of the method and sampling
Chapter III – Samples and Methodology
[26]
Several glycosphingolipid standards were used to prepare standards for the HPTLC
plates, to spike and overload samples. The standards were SM, Gb4q, Gb3, LacCer, GlcCer
and phosphatidylethanolamine (PE) from Matreya®.
3.3. Methods
In order to carry out the proposed aims, blood and urine samples collected on filter
paper were analyzed. High-Performance Thin-Layer Chromatography (HPTLC), was used to
identify traceable amounts of GSLs excreted in urine, namely Gb3. This technique was
optimised to improve its sensitivity and to decrease its time duration for a better discrimination
of FD patients and control subjects. This part was developed within the screening project for
FD from Instituto de Biologia Molecular e Celular – Instituto de Engenharia Biomédica (IBMC-
INEB), in Portugal, fellowship PTDC/SAL-BEB/100875/2008. The obtained results were also
integrated in the IBMC-INEB project. The INEB team is currently developing an automatic
screening software.
3.3.1. High-Performance Thin-Layer Chromatography for
Conventional Urine Samples
Liquid urine samples are dialyzed in 12-14 kDa dialysis membrane against 0.01%
sodium azide and dried by lyophilization.
Lipids are then extracted in two cycles with centrifugation: one cycle of 1min vortexing
with 20:1.5 (v/v) MeOH/H2O and CHCl3 and one cycle of 1 min vortexing with 1:2 (v/v)
CHCl3/MeOH, followed by concentration under N2 stream, at 40 ºC.
The total lipid extract is then fractionated in C18 chromatography columns
(Chromabond® C18 octadecyl-modified silica columns). Neutral lipids are recovered by a 1:2
(v/v) CHCl3/MeOH solution. The existing contaminants are removed and the acidic lipids are
discarded. In order to remove phosphoglycerides, neutral lipids are subjected to alkaline
hydrolysis with sodium hydroxide. After hydrolysis, dried fractions are reconstituted in 1:2 (v/v)
CHCl3/MeOH and applied to an HPTLC silica gel plate (Merck® HPTLC silica gel 60 plates)
using a spray-on sample application device (Camag® Linomat IV). To allow the identification

HPTLC Detection of Gb3 in Urine Samples: improvement of the method and sampling
Chapter III – Samples and Methodology
[27]
and semi-quantification of the lipids on each sample, a mixture of standard lipids incorporating
known amounts of SM, Gb4, Gb3, LacCer, GlcCer and PE is applied (Table V). Plates are
developed with 70:30:5 (v/v) CHCl3/MeOH/H2O in a TLC chamber (Camag®) and dried under
a flow of hot air. The resulting separated lipids are visualized as purple bands by pulverizing
the plate with an p-anisaldehyde/ H2SO4 solution (1% p-anisaldehyde in 80% H2SO4) followed by
heating the plate in the oven at 120ºC until the appearance of bands. Plates are digitalized and
bands are quantified by the UN-SCAN-IT gel automated digitizing system software version 5.1
(Silk Scientific corporation).
Table V: Constitution of a standard mixture for HPTLC. 30 μL 0.2 μg/μL disposable mixture aliquots.
GSL Quantity per 10
μL
GlcCer 2 µg
PE 2 µg
LacCer 2 µg
Gb3 2 µg
SM 2 µg
Gb4 4 µg
This procedure will allow the classification and semi quantification of the lipids present
in each sample, allowing a rapid screening of significant alterations in the lipid profile as
compared to control samples.

CHAPTER IV
4. RESULTS

HPTLC Detection of Gb3 in Urine Samples: improvement of the method and sampling
Chapter IV – Results
[29]
4.1. High-Performance Thin-Layer Chromatography Optimization
for Filter Paper Urine Samples
4.1.1. Validation of Filter Paper for HPTLC Analysis
Liquid urine samples are difficult to send to the laboratory and only are viable for
several hours before the storage at -20 ºC. On the other hand, filter papers can be sent by mail
and are viable for several weeks even at room temperature (Auray-Blais et al, 2007). However,
the HPTLC method was not adapted to filter paper collected samples. The main problem was
the significantly lower urine quantity held by the filter paper when compared to the
conventionally collected urine samples. In order to do the screening for FD, 20 mL of urine are
needed, but the filter paper squares (5 x 5 cm) only absorb a maximum of 2 mL.
To evaluate if the use of 1filter paper is a suitable approach, the same urine sample
was added to one filter paper and two filter papers (approximately 4 mL; Figure 11). The Gb3
of each sample was normalized to SM values. SM is an adequate physiological representative
of Gb3 excretion, as like Gb3, it can be localized at the cellular membrane (Barr et al, 2009).
Because the SM and Gb4 bands usually overlap they are identified as a group.
It is visible that in the urine samples applied to two filter papers the GSL bands are
stronger, when compared to samples applied to one filter paper (confirmed in Table VI). The
ratio of Gb3 to SM+Gb4 of the one filter paper sample overloaded with Gb3 proved to be higher
than the one from the two filter papers, not because of Gb3 bands intensity but because there
was less SM quantified, in similarity to the non-overloaded samples.
Analyzing the Gb3 band in overloaded samples it is also clear that the use of two filter
papers does not interfere with Gb3 identification and band density. Therefore, in order to
increase the amount of GSLs in urine samples, the minimum sample quantity was defined as
two filter papers.

HPTLC Detection of Gb3 in Urine Samples: improvement of the method and sampling
Chapter IV – Results
[30]
Figure 11: Analysis of 1 and 2 filter papers from a control sample. An urine sample from a control subject was
applied to filter papers and analysed by the conventional HPTLC method. The same sample was divided into: 1) 2 filter papers,
2) 1 filter paper, 3) 1 filter paper overloaded with 2 µg of Gb3, and 4) 2 filter papers overloaded with 2 µg of Gb3. F.P. – filter
paper. Std. – standards (2 µg). The applied standard mixture contained 2 µg of SM, Gb3, LacCer, PE and GlcCer and 4 µg of
Gb4.
Table VI: Densitometry of Gb3 and SM+Gb4 bands from the filter paper samples. The SM/Gb4 and the Gb3 bands
from the samples of the control subject previously analysed by HPTLC were quantified by densitometry. SM/Gb4 group was
analysed separately of Gb3. The ratio of Gb3 to SM+Gb4 was calculated to normalize the samples. The represented pixels are
the result of the background pixels subtracted to the total band determined pixels. 2 F.P. – two filter papers of the urine
sample; 1 F.P. – one filter paper of the urine sample; 1 F.P. + Gb3 – one filter paper of the urine sample overloaded with Gb3;
2 F.P. + Gb3 – two filter papers of the urine sample overloaded with Gb3. Gb3 overload – 2 µg; n.d. – non-detected.
Lane Gb3
(pixels) SM+Gb4 (pixels)
Gb3/SM+Gb4
(pixels)
2 F.P. 77.1 497.9 0.15
1 F.P. n.d. 349.3 n.d.
1 F.P. + Gb3 82.0 355.7 0.23
2 F.P. + Gb3 92.4 514.6 0.18
This change was tested in several naïve patient samples (not on ERT; Figure 12).
Although the filter paper Gb3 bands were markedly weaker compared to the ones obtained

HPTLC Detection of Gb3 in Urine Samples: improvement of the method and sampling
Chapter IV – Results
[31]
from liquid samples, the FD patients detected in liquid samples were also detected by filter
paper analysis. Moreover, the software that is currently being developed must be sensitive
enough to discriminate FD patients from controls.
Figure 12: FD patients’ analysis of conventional 20 mL urine samples and urine samples applied to filter
papers. 20 mL urine samples from previously diagnosed FD patients (P1-P4) were analysed by the conventional HPTLC
method prior to this study. The same samples were added to two filter paper squares and analysed by the optimised HPTLC
method that is later described in this work2. Std. – standards (2 µg). The applied standard mixture contained 2 µg of SM, Gb3,
LacCer, PE and GlcCer and 4 µg of Gb4.
4.1.2. Extraction Method
The extraction method limits the lipid quantity available for the following HPTLC steps.
The mechanical procedures (centrifugation, sonication and agitation) and the organic solvent
solutions were the tested conditions.
The centrifugation steps are crucial for protein precipitation. However, the filter paper
was described as a good support for proteins since they do not enter in solution during the
extraction process (Müthing & Distler, 2009). It has also been suggested that the desquamated
urinary tract cells may still be intact in the urine extract and that sonication improves the
amount of detected lipid by disrupting the existing cellular and lysosomal membranes (Auray-
Blais et al, 2006). Hence, three different extraction processes were tested using a filter paper
control sample overloaded with both SM and Gb3 (Figure 13).
2 As there are few urine samples from FD patients, the filter paper analyses of all the patients
simultaneously were only performed when the method was optimised.

HPTLC Detection of Gb3 in Urine Samples: improvement of the method and sampling
Chapter IV – Results
[32]
Figure 13: Evaluation of different extraction conditions. A control urine sample collected by the filter paper kit was subjected to three
extraction conditions, using for each one, two filter papers: centrifugation (“Cent.”) at 3000 rpm for 10 minutes (twice) after the agitation with
organic solvents; no centrifugation and no sonication steps (“no Cent./Son.”); and sonication in water bath for 5 minutes (“Son.”) of the final
extract (after the second extraction cycle). Before the extraction, each two filter paper squares were overload with 4 µg of Gb3 and 10 µg of SM.
Std. – standards (2 µg). The applied standard mixture contained 2 µg of Cer 4 (asialoganglioside GM1), 2 µg of SM, 2 µg of Gb4, 2 µg of Gb3,
4 µg of LacCer, 2 µg of PE and 2 µg of GlcCer.
The first extraction process encompasses two centrifugation steps, the second
extraction process had no centrifugation or sonication steps and the third was defined by a
sonication step. By densitometry of Gb3 bands it becomes clear that centrifugation decreases
the Gb3 quantity at the end of the extraction process. This is probably due to the extract
volume retained in the filter paper as a consequence of filter paper compression during
centrifugation (Table VII).
Table VII: Densitometry of Gb3 and SM+Gb4 bands from urine samples extracted under different conditions. The represented
pixels were determined as a result of background subtraction to the total pixels per band. Gb3 pixels and SM+Gb4 pixels were measured by
densitometry of the Gb3 and SM+Gb4 areas. Cent. – 2x 10 minutes centrifugation at 3000 rpm; no Cent./Son. – no centrifugation or
sonication steps; Son. – sonication for 5 minutes in a water bath.
Lane Gb3 pixels SM and Gb4
pixels
Cent. 1252.1 1181.5
no Cent./Son.
1817.3 1544.7
Son. 2047.9 1714.4

HPTLC Detection of Gb3 in Urine Samples: improvement of the method and sampling
Chapter IV – Results
[33]
On the other hand, adding a sonication step increased the Gb3 band density which
indicates that more lipid was present in the extract. Although 4 μg of Gb3 were added to the
control sample, there is always some GSL content from the sample itself, producing an
increment in density relatively to the sample that was not sonicated. The densitometry of the
SM and Gb4 bands confirmed this theory.
Together, these modifications increased the efficiency of the extraction method, which
led to an improvement of the detection limit.
The type and duration of agitation during the extraction procedure is also a determining
factor for an efficient lipid extraction. In order to evaluate this factor, an empty filter paper was
overloaded with Gb3 and subjected to different agitation conditions (Figure 14A).
The standard extraction, with two cycles of organic solvents and 1min vortexing (or 5
minutes in a multi-vortex), was compared to: 1) three cycles of organic solvents, 2 h each in a
roller agitator, and 2) one cycle of 1min vortexing with organic solvents and one cycle of 24 h
agitation in a roller agitator with organic solvents. Better results were obtained with a roller
agitator when the agitation time was increased to 24 h. This observation was confirmed by
densitometry (Table VIII of Appendix II).
Another issue involves the concentration of organic solvents. The ratio between the
organic solvents is very important for an adequate extraction of the the lipids of interest. Some
authors use a 2:1 (v/v) CHCl3/MeOH ratio for GSL extraction (Krüger et al, 2010; Roy et al,
2004; Rozenfeld et al, 2009b). With the aim of exploring this variant, a filter paper control
sample was extracted with 2:1 (v/v) CHCl3/MeOH ratio and the conventional 1:2 (v/v)
CHCl3/MeOH ratio (Figure 14B). Because the control sample did not have elevated GSL
content, filter papers were overloaded with different quantities of Gb3 (2 μg and 4 μg). With the
Gb3 overload of control samples it was clear that the utilization of the 2:1 (v/v) CHCl3/MeOH
in substitution of the standard 1:2 (v/v) CHCl3/MeOH ratio led to less GSL content on the
HPTLC plate.

HPTLC Detection of Gb3 in Urine Samples: improvement of the method and sampling
Chapter IV – Results
[34]
Figure 14: Test of different extraction agitation methods and organic solvent solutions. In A, six pairs of empty
filter papers were overloaded with 10 µg of Gb3 and extracted with: 1) one cycle of 5 minutes vortexing at room temperature
and one cycle of 24 h at 4 ºC in a roller agitator (“24 h” lanes); 2) three cycles of 2 h at 4 ºC in a roller agitator (“3 x 2h”
lanes); and 3) two cycles of 5 minutes multi-vortexing at room temperature (“5 min” lanes). In B, the same control sample
collected in filter papers was extracted with 1:2 (v/v) of chloroform/methanol (lanes 1, 3 and 5) and 2:1 (v/v) of
chloroform/methanol (lanes 2, 4 and 6), without Gb3 overload (lane 1 and 2), with 2 µg of Gb3 (lanes 3 and 4) and with 4 µg
of Gb3 (lanes 5 and 6). Analysis of two filter paper squares per lane. C/M (1:2) – 1:2 (v/v) chloroform/methanol; C/M (2:1) –
2:1 (v/v) chloroform methanol; Gb3 overload: no Gb3 overload “-“, 2 µg of Gb3 “+” and 4 µg of Gb3 “++”; Std. – standards (2
µg). The applied standard mixture contained 2 µg of SM, Gb3, LacCer, PE and GlcCer and 4 µg of Gb4.

HPTLC Detection of Gb3 in Urine Samples: improvement of the method and sampling
Chapter IV – Results
[35]
4.1.3. Lipid Fractionation Process
C18 reverse phase silica columns are specific for neutral substances. However, their
efficiency is not 100%. As the polypropylene material used for fractionation is a source of
contaminants, all the pieces preventing the sample from a direct contact with the C18 column
were removed.
To address the most adequate solvent volume to elute neutral lipids and increase the
amount of lipid eluted from the C18 column, a known quantity of Gb3 was added to a C18
column and the efficiency of the organic solvent volume used in the protocol [8 mL of 1:2 (v/v)
CHCl3/MeOH] was compared to the double volume of the same organic solvent solution
(Figure 15). Still, no improvement was seen. In fact, there was less lipid content in the lanes of
more eluted samples. The loss of lipid content was even higher in the Gb3 eluted with 16 mL
of organic solvent solution when compared to pure Gb3 lanes (Table IX).
Figure 15: Elution of neutral lipids fraction. 4 µg of Gb3 were applied to eight C18 reverse phase columns and
fractionated by the conventional method for lipid fraction collection. The only modification was the removal of the plastic
material. The neutral lipids’ fraction was eluted with 8 mL of 1:2 (v/v) CHCl3/MeOH (“8 mL C/M (1:2)” lanes), and with 16 mL
of 1:2 (v/v) CHCl3/MeOH (“16 mL C/M (1:2)” lanes). To compare the Gb3 obtained from the fractionation process to the
initially added Gb3, two lanes with 4 µg of pure Gb3 were added to the HPTLC plate (“Pure Gb3” lanes). C/M (1:2) – 1:2 (v/v)
CHCl3/MeOH; Std. – standards (2 µg). The applied standard mixture contained 2 µg of SM, Gb3, LacCer, PE and GlcCer and 4
µg of Gb4.
HPTLC Detection of Gb3 in Urine Samples: improvement of the method and sampling
Chapter IV – Results
[36]
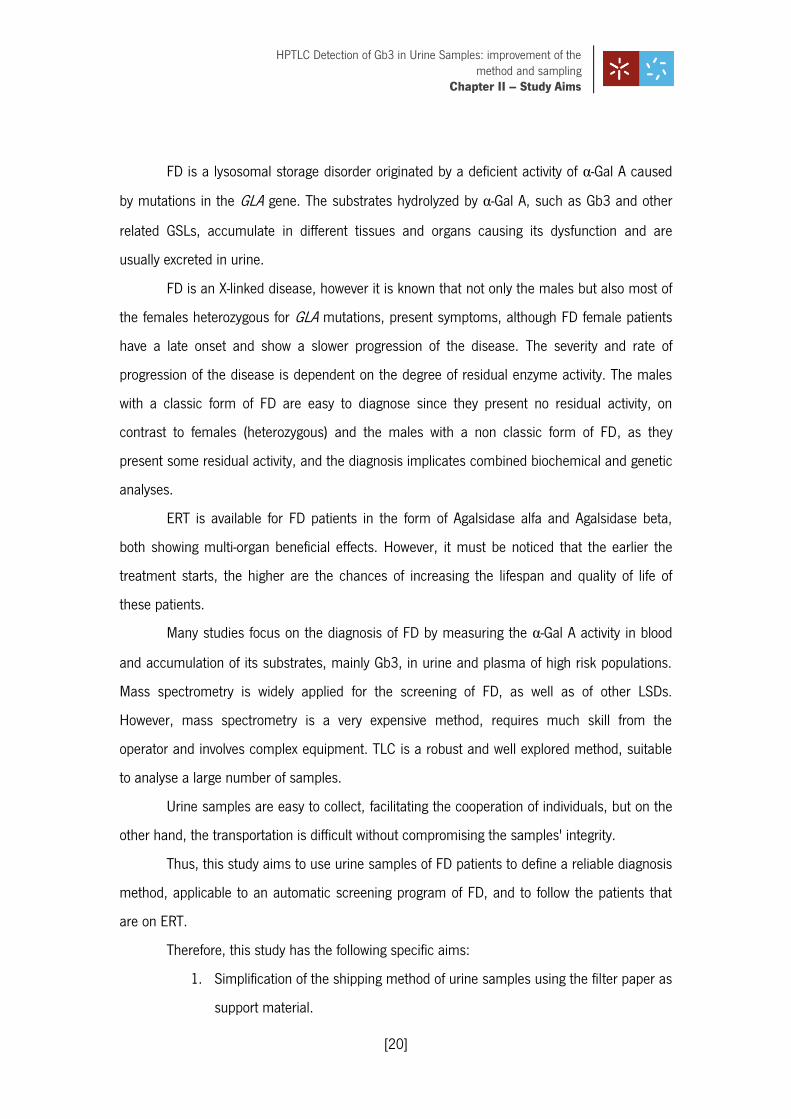
Table IX: Densitometry of Gb3 eluted with 8 mL or 16 mL of organic solvent solution during fractionation. The
presented pixels for the Gb3 substance are discriminated from the background pixels. The following values were calculated for
pixels from the same elution condition: mean, maximum, % RSD and percentage of lost pixels relatively to pure Gb3 (“% Loss”).
C/M (1:2) – 1:2 (v/v) CHCl3/MeOH.
Lane Gb3
Mean ± SD (pixels)
Max. lane Gb3
(pixels) % RSD % Loss
8 mL of C/M (1:2)
1226.1± 157.2 1337.2 12.8 25.0
16 mL of C/M (1:2)
952.9 ± 315.7 1261.9 33.1 41.7
Pure Gb3 1635.6 ± 7.9 1641.2 0.5 0.0
The variability seen in the 16 mL eluted Gb3 may be due to insufficient reconstitution
of N2 dried GSLs during alkaline hydrolysis. As this is a high volume, GSLs will contact and
remain in areas of the material where the reconstitution solution cannot reach, preventing an
uncertain GSL quantity to be available for alkaline hydrolysis and application.
4.1.4. Development of the HPTLC Plate
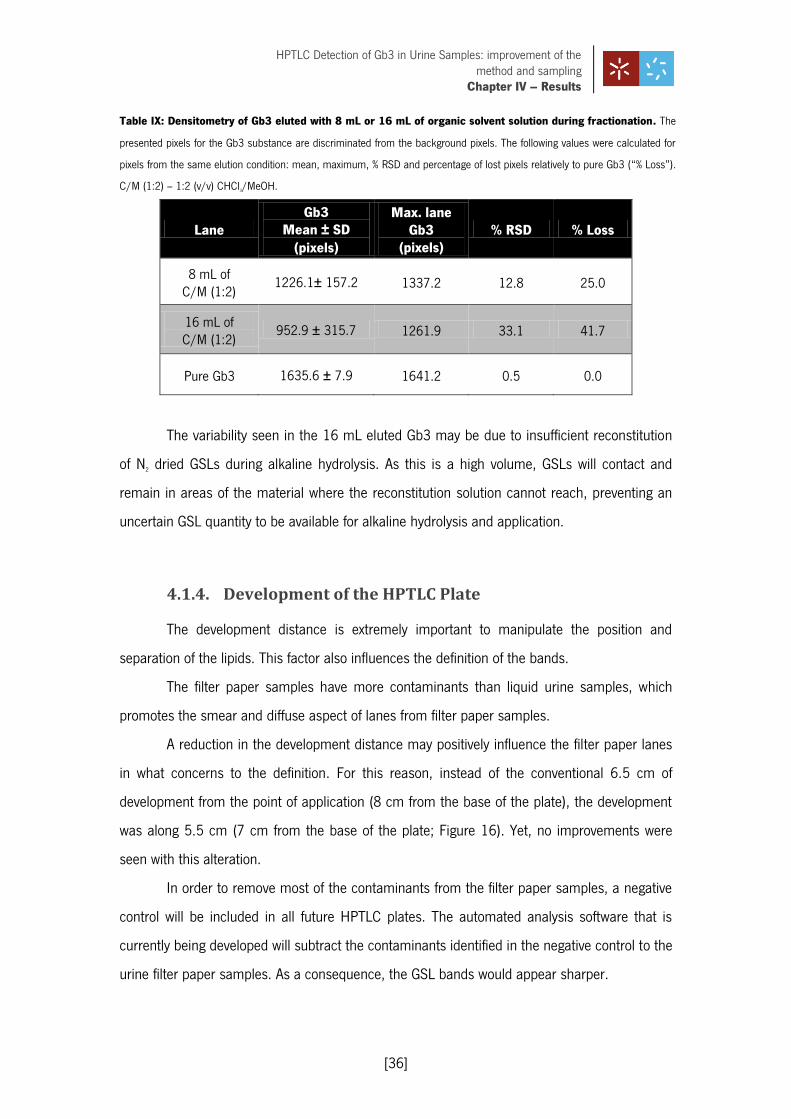
The development distance is extremely important to manipulate the position and
separation of the lipids. This factor also influences the definition of the bands.
The filter paper samples have more contaminants than liquid urine samples, which
promotes the smear and diffuse aspect of lanes from filter paper samples.
A reduction in the development distance may positively influence the filter paper lanes
in what concerns to the definition. For this reason, instead of the conventional 6.5 cm of
development from the point of application (8 cm from the base of the plate), the development
was along 5.5 cm (7 cm from the base of the plate; Figure 16). Yet, no improvements were
seen with this alteration.
In order to remove most of the contaminants from the filter paper samples, a negative
control will be included in all future HPTLC plates. The automated analysis software that is
currently being developed will subtract the contaminants identified in the negative control to the
urine filter paper samples. As a consequence, the GSL bands would appear sharper.
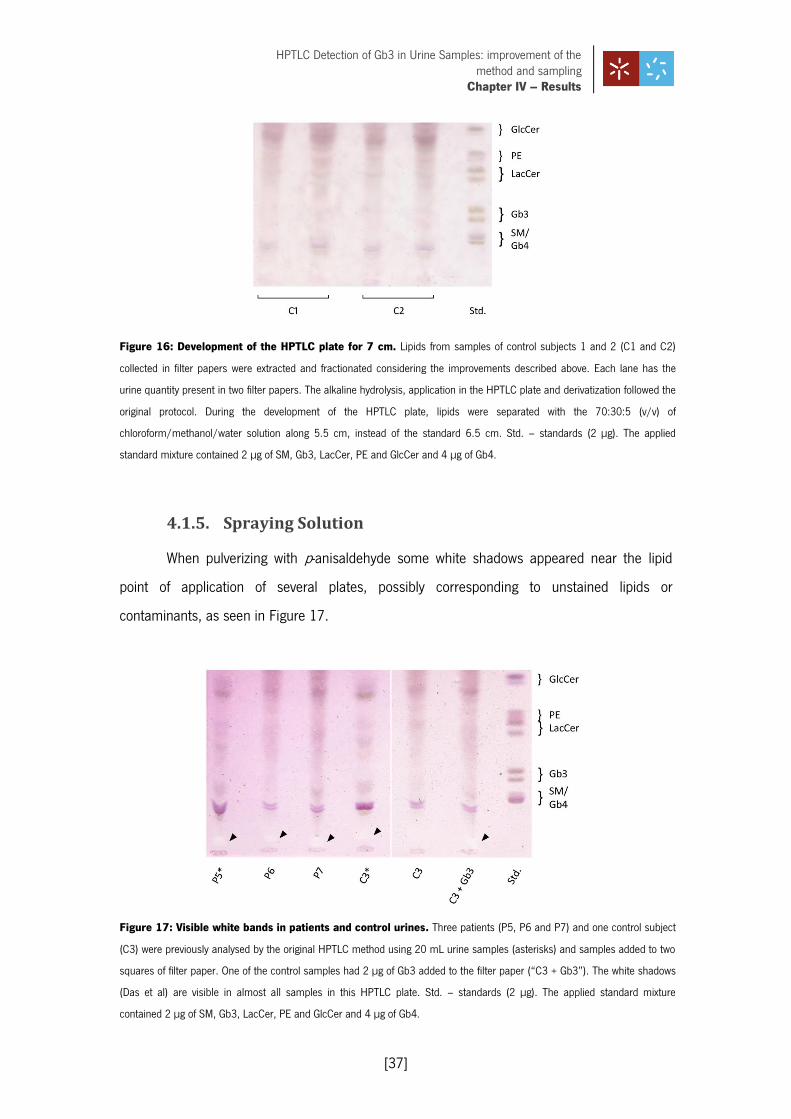
HPTLC Detection of Gb3 in Urine Samples: improvement of the method and sampling
Chapter IV – Results
[37]
Figure 16: Development of the HPTLC plate for 7 cm. Lipids from samples of control subjects 1 and 2 (C1 and C2)
collected in filter papers were extracted and fractionated considering the improvements described above. Each lane has the
urine quantity present in two filter papers. The alkaline hydrolysis, application in the HPTLC plate and derivatization followed the
original protocol. During the development of the HPTLC plate, lipids were separated with the 70:30:5 (v/v) of
chloroform/methanol/water solution along 5.5 cm, instead of the standard 6.5 cm. Std. – standards (2 µg). The applied
standard mixture contained 2 µg of SM, Gb3, LacCer, PE and GlcCer and 4 µg of Gb4.
4.1.5. Spraying Solution
When pulverizing with p-anisaldehyde some white shadows appeared near the lipid
point of application of several plates, possibly corresponding to unstained lipids or
contaminants, as seen in Figure 17.
Figure 17: Visible white bands in patients and control urines. Three patients (P5, P6 and P7) and one control subject
(C3) were previously analysed by the original HPTLC method using 20 mL urine samples (asterisks) and samples added to two
squares of filter paper. One of the control samples had 2 µg of Gb3 added to the filter paper (“C3 + Gb3”). The white shadows
(Das et al) are visible in almost all samples in this HPTLC plate. Std. – standards (2 µg). The applied standard mixture
contained 2 µg of SM, Gb3, LacCer, PE and GlcCer and 4 µg of Gb4.

HPTLC Detection of Gb3 in Urine Samples: improvement of the method and sampling
Chapter IV – Results
[38]
This chemical compound only stains neutral lipids and for this matter, orcinol, which
stains glycolipids, was tested as a substitute for p-anisaldehyde (Figure 18).
Figure 18: Orcinol staining of neutral lipids. In A, several control samples (C1, C2, C4-C6) where analysed by
the HPTLC considering the advances in extraction and fractionation of this study. The alkaline hydrolysis, the application of
lipids in the silica plate and the separation of the lipids were executed as in the conventional method. Orcinol was the
derivatization agent. The C1, C2 and C6 were spiked with 2 µg of Gb3, the C4 and C5 were spiked with 2 µg of SM and 4 µg
of Gb4 and the C4* and C5* samples were not spiked with any GSL. In B, pure Gb4 (4 µg) and SM (2 µg) were directly applied
to the HPTLC plate. The left HPTLC plate was derivatized with orcinol and the right plate was derivatized with p-anisaldehyde.
The SM position is indicated in both derivatization methods (Das et al). Std. – standards (2 µg). The applied standard mixtures
of A. and B. contained 2 µg of SM, Gb3, LacCer, PE and GlcCer and 4 µg of Gb4.

HPTLC Detection of Gb3 in Urine Samples: improvement of the method and sampling
Chapter IV – Results
[39]
The orcinol staining was performed in control filter paper samples and lipid standards
to better understand how orcinol affects the samples and pure lipids.
As a result of this alteration the SM band disappeared and only the Gb4 band
remained, allowing the identification of Gb4 in control subjects without interference of the SM
band. Although the Gb3 is detected, the orcinol derivatization did not highlight any lipid bellow
the Gb4 band and it is less sensitive than p-anisaldehyde, when comparing the orcinol stained
samples of Figure 18 to the p-anisaldehyde stained samples of Figure 17. Furthermore, the
SM/Gb4 conjugation was pointed as necessary to adjust the parameters of the automatic
screening software. For these reasons the orcinol staining could not be adopted.
4.1.6. Gb3 Detection Limit
In order to evaluate the detection limit of Gb3 in the HPTLC plate, an overload study
was made (Figure 19). Several pairs of empty filter papers were overloaded with increasing
concentrations of Gb3 (0.5 µg to 4.0 µg). As a result, the existence of Gb3 can only be
guaranteed if the amount of this lipid in the HPTLC plate is higher than 2 µg.
Moreover, a high quantity of Gb3 is still being lost during the HPTLC as the 4 µg
overloaded filter paper bands cannot surpass the Gb3 density of the standard mixture (with 2
µg of Gb3).
Figure 19: Estimation of the Gb3 detection limit. Empty filter papers were grouped in pairs, to assure that the same quantity of
impurities observed in the urine samples was present, and subsequently overloaded with Gb3 (0.5 µg to 4.0 µg). Filter paper Gb3 was analysed
by HPTLC regarding all the modifications established so far. Std. – standards (2 µg). The applied standard mixture contained 2 µg of SM, Gb3,
LacCer, PE and GlcCer and 4 µg of Gb4.
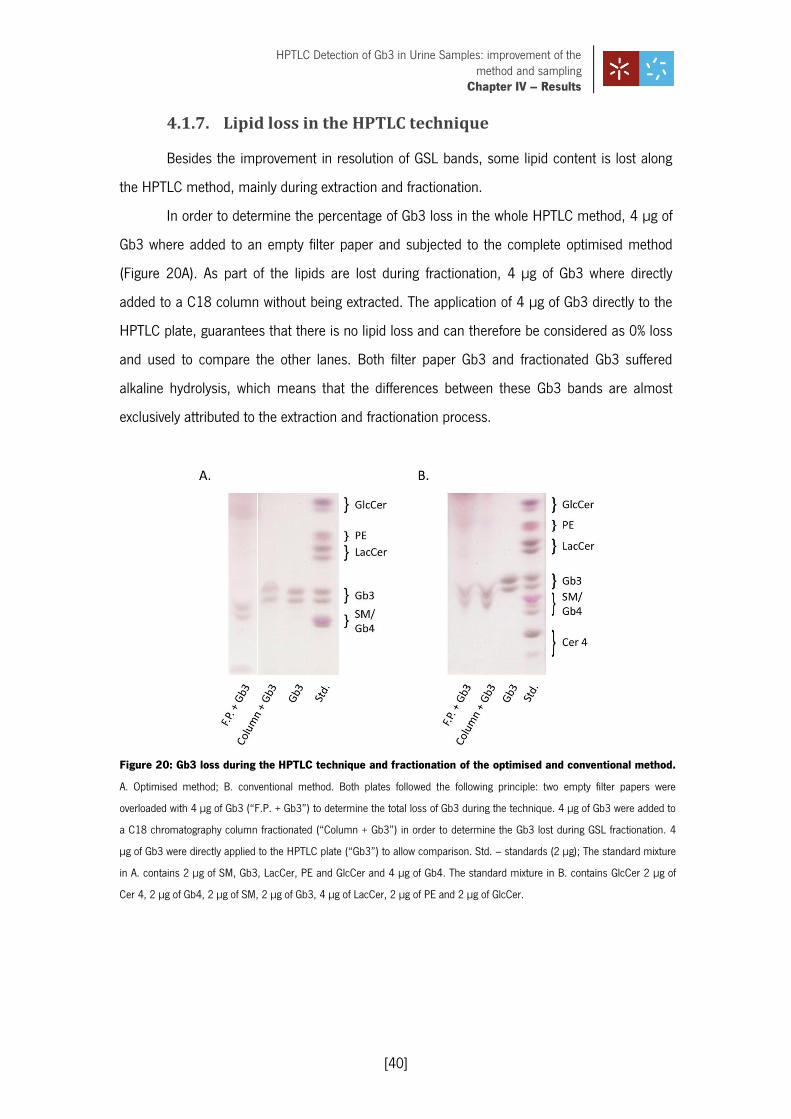
HPTLC Detection of Gb3 in Urine Samples: improvement of the method and sampling
Chapter IV – Results
[40]
4.1.7. Lipid loss in the HPTLC technique
Besides the improvement in resolution of GSL bands, some lipid content is lost along
the HPTLC method, mainly during extraction and fractionation.
In order to determine the percentage of Gb3 loss in the whole HPTLC method, 4 µg of
Gb3 where added to an empty filter paper and subjected to the complete optimised method
(Figure 20A). As part of the lipids are lost during fractionation, 4 µg of Gb3 where directly
added to a C18 column without being extracted. The application of 4 µg of Gb3 directly to the
HPTLC plate, guarantees that there is no lipid loss and can therefore be considered as 0% loss
and used to compare the other lanes. Both filter paper Gb3 and fractionated Gb3 suffered
alkaline hydrolysis, which means that the differences between these Gb3 bands are almost
exclusively attributed to the extraction and fractionation process.
Figure 20: Gb3 loss during the HPTLC technique and fractionation of the optimised and conventional method.
A. Optimised method; B. conventional method. Both plates followed the following principle: two empty filter papers were
overloaded with 4 µg of Gb3 (“F.P. + Gb3”) to determine the total loss of Gb3 during the technique. 4 µg of Gb3 were added to
a C18 chromatography column fractionated (“Column + Gb3”) in order to determine the Gb3 lost during GSL fractionation. 4
µg of Gb3 were directly applied to the HPTLC plate (“Gb3”) to allow comparison. Std. – standards (2 µg); The standard mixture
in A. contains 2 µg of SM, Gb3, LacCer, PE and GlcCer and 4 µg of Gb4. The standard mixture in B. contains GlcCer 2 µg of
Cer 4, 2 µg of Gb4, 2 µg of SM, 2 µg of Gb3, 4 µg of LacCer, 2 µg of PE and 2 µg of GlcCer.

HPTLC Detection of Gb3 in Urine Samples: improvement of the method and sampling
Chapter IV – Results
[41]
By densitometry it was possible to quantify the decrease of both filter paper Gb3 and
fractionated Gb3 relatively to the directly applied Gb3, which was of 37.5% and 25%,
respectively (Table X). This means that approximately 12.5% of Gb3 is lost during extraction.
The same experiment was performed using the conventional HPTLC protocol (Figure
20B). With the conventional method, the filter paper Gb3 also demonstrates less dense bands
and some Gb3 is lost in fractionation. The quantification of this loss was done by densitometry
and shows that 51.1% of Gb3 is lost with this HPTLC method and 29.7% of Gb3 is lost in
fractionation. Hence, approximately 21.4% of Gb3 is lost in the extraction process.
Table X: Densitometry for calculation of Gb3 loss during the HPTLC technique and fractionation with the
optimised and conventional methods. The Gb3 pixels were calculated as subtraction of background pixels to the total
pixels at the Gb3 area. The percentage of Gb3 loss was calculated through the Gb3 pixels relatively to the directly applied Gb3
(considered 0% loss). The added and applied Gb3 quantity was 4 µg.
Comparing both methods, it is clear that most Gb3 is lost during the fractionation
process and that the HPTLC sensitivity has been improved by 13.6% comparatively to the
conventional HPTLC method. Therefore, the optimization of the standard HPTLC protocol for
urinary lipids resulted in the filter paper enhanced method described below.
4.1.8. Optimised Protocol
Lipids are extracted in two cycles: one cycle of 1 minute vortexing with 20:1.5 (v/v)
MeOH/H2O and CHCl3 and one cycle of 24 hour agitation with 1:2 (v/v) CHCl3/MeOH, followed
by 5 minutes sonication and concentration under N2 stream, at 40 ºC.
Optimised Method Conventional Method
Lane Gb3
(Pixels) % Gb3 Loss
Gb3 (Pixels)
% Gb3 Loss
F.P. + Gb3
592.4 37.5 845.2 51.1
Column + Gb3
711.1 25.0 1215.7 29.7
Gb3 948.0 0.0 1729.6 0.0

HPTLC Detection of Gb3 in Urine Samples: improvement of the method and sampling
Chapter IV – Results
[42]
The total lipid extract is then fractionated in C18 chromatography columns without the
fractionation plastic materials (Chromabond® C18 octadecyl-modified silica columns). Neutral
lipids are recovered by a 1:2 (v/v) CHCl3/MeOH solution. The existing contaminants are
removed and the acidic lipids are discarded. In order to remove phosphoglycerides, neutral
lipids are subjected to alkaline hydrolysis with sodium hydroxide. After hydrolysis, dried
fractions are reconstituted in 1:2 (v/v) CHCl3/MeOH and applied to an HPTLC silica gel plate
(Merck® HPTLC silica gel 60 plates) using a spray-on sample application device (Camag®
Linomat IV). To allow the identification and semi-quantification of the lipids on each sample, a
mixture of standard lipids incorporating known amounts of SM, Gb4, Gb3, LacCer, GlcCer and
PE is applied (Table IV). Plates are developed with 70:30:5 (v/v) CHCl3/MeOH/H2O in a TLC
chamber (Camag®) along 8 cm (from the base of the plate) and dried under a flow of hot air.
The resulting separated lipids are visualized as purple bands by pulverizing the plate with an p-
anisaldehyde/ H2SO4 solution (1% p-anisaldehyde in 80% H2SO4) followed by heating the plate in
the oven at 120 ºC until the appearance of bands. Plates are digitalized and bands are
quantified by the appropriate software.
The reproducibility of this method was tested by subjecting the same sample to the
optimised method in different days (Figure 21).
Figure 21: Reproducibility evaluation of the optimised method. Several filter papers of the same control sample
(obtained through the filter paper collection kit) were grouped in pairs and analysed by the optimised HPTLC method in three
different days. Std. – standards (2 µg). The standard mixture is composed by GlcCer (2 µg), PE (2 µg), LacCer (4 µg), Gb3 (2
µg), SM (2 µg), Gb4 (2 µg) and Cer 4 (2 µg).

HPTLC Detection of Gb3 in Urine Samples: improvement of the method and sampling
Chapter IV – Results
[43]
Table XI: Assessment of variability of the optimised method by densitometry. The SM/Gb4 pixels were calculated as
a group by subtracting of background pixels to the total pixels of the SM/Gb4 area. SM/Gb4 values are expressed as mean ±
SD. The variability of the analysis was calculated as %RSD.
Lane SM/Gb4
Mean ± SD (pixels)
% RSD
Day 1 91.3 ± 7.6 8.3
Day 2 176.5 ± 17.6 10.0
Day 3 116.3 ± 13.0 11.2
Total 123.9 ± 34.6 28.0
In the HPTLC plate only slight differences are seen in the SM and Gb4 bands, however,
the calculated RSD of 28.0% shows that some variability is inherent (Table XI). In the intra-day
variability results, lower %RSD values were achieved. Repeating this reproducibility test by a
different operator and assessing the intra-day precision should help to clarify if this degree of
variability is acceptable. Once the method variability is established, this method should be
considered reproducible.
4.2. Lipidic Profile of FD Patients and Control subjects
Obtaining and comparing the lipid profile of FD patients and control subjects is crucial
for future distinction of these two groups by HPTLC.
For this purpose, both patients and control subjects were analysed by the optimised
HPTLC method. As it is visible in Figure 22A and 22B both control subjects and FD patients
are heterogeneous. There is presence/absence of Gb3 band in the control and patient groups
and high variability is seen in Gb3 and SM+Gb4 density (78.2% RSD in control subjects and
125.0% RSD for FD patients; Table XII and Appendix II – Table XIII). However, a healthy
individual typically shows a weak band of Gb3. On the other hand, a classic FD patient
presents a strong Gb3 band.

HPTLC Detection of Gb3 in Urine Samples: improvement of the method and sampling
Chapter IV – Results
[44]
Figure 22: Analysis of samples from control subjects and FD patients by the optimised HPTLC method. A.
Samples from control subjects (C8-C29), males and females, were collected using the filter paper kit (two filter papers each)
and then analysed by the HPTLC optimised method. B. Samples from FD patients (P1-P10), males (right plate) and females
(left plate), were added to a pair of filter papers each and then analysed by the optimised HPTLC method. FD patients carried
the following mutations: M290I (P5 and P6), F113L (P2, P3, P4, P7, P8 and P9), C94S (P1) and R118L (P10). B. Std. –
standards (2 µg). The applied standard mixture contained 2 µg of SM, Gb3, LacCer, PE and GlcCer and 4 µg of Gb4.
The densitometry analysis of Gb3 and SM+Gb4 bands from control subjects indicated
that almost all subjects had no traceable Gb3 levels in filter paper urine samples, in contrast to
urinary Gb3 levels of FD patients, where 6/10 patients presented visible Gb3 bands.
Concerning the genotype of these FD patients the following missense mutations are
represented: M290I, F113L, C94S and R118L. The F113L mutation is associated with the
cardiac variant of FD (Eng et al, 1997). From the six patients with the F113L mutation

HPTLC Detection of Gb3 in Urine Samples: improvement of the method and sampling
Chapter IV – Results
[45]
(patients 7, 3, 4, 2, 8 and 9), only patient 8 did not show a Gb3 band. The densitometry of the
SM+Gb4 bands of this patient revealed very low SM+Gb4 levels, which may also be related to
the lack of Gb3 since SM is an indicator of the GSL quantity excreted in urine. Patients 7 and 9
are from the same family and presented tenuous Gb3 bands that would make it difficult to
discriminate these patients among a series of control subjects just by looking at the HPTLC
plate. By densitometry it is clear that although patient 7 is borderline, patient 9 would be
detected by the software analysis. The other three patients with F113L mutation (patients 2, 3
and 4) were unequivocally identified.
Table XII: Densitometry of control and FD patients with traceable amounts of Gb3. The GSL pixels were calculated
by subtraction of background pixels to the total pixels of the area with GSL bands. The ratio of Gb3 to SM+Gb4 was calculated
to normalize the samples. The mean is expressed with the SD. The variability within the control and patient samples was
assessed by % RSD. Gb3 was normalized to SM+Gb4 bands.
Sample SM+Gb4 (pixels)
Gb3 (pixels)
Gb3/SM+Gb4 (pixels)
C21 401.4 176.4 0.4
C28 246.2 88.6 0.4
Mean ± SD 323.8 ± 109.7 132.5 ± 62.0 0.4 ± 0.1
% RSD 33.9 46.8 14.0
P7 446.0 154.7 0.3
P3 75.4 403.5 5.4
P4 42.8 822.4 19.2
P2 84.7 372.9 4.4
P1 43.4 512.3 11.8
P9 31.5 124.5 4.0
Mean ± SD 120.6 ± 160.7 398.4 ± 256.1 7.5 ±6.8
% RSD 133.3 64.3 91.0
The M290I mutation was present in patient 6 (female, 44 years) and patient 5 (male,
2 years), both showing absence of Gb3, despite that M290I is described as a causal mutation
of the classic form of FD (Shabbeer et al, 2006). One possible explanation is that the random
X-inactivation that patient 6 suffered allowed the expression of the wild type α-Gal A in enough

HPTLC Detection of Gb3 in Urine Samples: improvement of the method and sampling
Chapter IV – Results
[46]
quantity to guarantee the normal Gb3 clearance. As for patient 5, due to its young age it was
expected that Gb3 was not excreted in traceable amounts.
The Gb3 bands were absent in patient 10, which was further confirmed by
densitometry. This patient presents a R118C mutation described for its association with a late
onset form of FD (Gaspar et al, 2010; Spada et al, 2006).
The only patient with a C94S mutation (patient 1) showed a strong Gb3 band and
increased LacCer/PE bands. By densitometry analysis, this patient was identified as the
patient with higher urinary Gb3 levels, considerably above the control subjects with Gb3
excretion. The increased excretion of LacCer is described in some FD patients, including
heterozygous patients (Fuller, 2005). In the literature, the C94S mutation is associated with a
severe FD form (Blaydon et al, 2001).
In order to study the excretion levels, the population of FD patients must continue
being studied. This will allow the establishment of a range for the Gb3/SM+Gb4 ratio in urine
filter paper samples of FD patients.
4.3. Effect of ERT in FD Patients
In order to evaluate the effect of ERT in FD patients it is necessary to establish a
connection between the patient status before and after the treatment takes place.
Patient 2 had a urine sample collected before ERT, one sample after three months of
therapy and one sample after eight months of therapy (Figure 23). Patient 1 only had urine
samples collected after five months and seventeen months of therapy.
Although no differences are seen in samples from patient 11, in patient 2 it is visible
that all Gb3 is cleared from the urine after three months of therapy. This status is maintained
until he reaches eight months of therapy.
A 20 mL sample of patient 11 collected before treatment had almost no Gb3 and that
reason it was expected that ERT would clear the urine Gb3 before five months of therapy.
These results also show that the optimised HPTLC method is reliable to follow up
patients under ERT.

HPTLC Detection of Gb3 in Urine Samples: improvement of the method and sampling
Chapter IV – Results
[47]
Figure 23: Analysis of samples from FD patients collected before and during ERT. The therapy duration at the time
of sample collection (T) was defined in months. TO represents samples collected before the beginning of ERT. Urine samples
from patient 11 (P11) and patient 2 (P2) were collected in several time-points of therapy (T5 and T17 in P11 and T0, T3 and
T8 in P2) and applied to a pair of filter papers each. The sample analysis was performed by the optimised HPTLC method. Std.
– standards (2µg). The standard mixture is composed by GlcCer (2 µg), PE (2 µg), LacCer (4 µg), Gb3 (2 µg), SM (2 µg), Gb4
(2 µg) and Cer 4 (2 µg).

CHAPTER V
5. DISCUSSION
HPTLC Detection of Gb3 in Urine Samples: improvement of the method and sampling
Chapter V – Discussion
[49]
Over the years, TLC has been used as a reliable method for the identification of lipid
biomarkers, weakly polar and non-polar substances, and for the screening the various diseases
(Auray-Blais et al, 2007; Desnick et al, 1970; Philippart et al, 1969; Togawa et al, 2010;
Wherrett, 1967). The TLC technique can easily be adapted to the study of any biological
sample or specific lipid.
Mass spectrometry has been used in several screening programs for Fabry disease as
a sensitive method for Gb3 and lyso-Gb3 quantification, but on the other hand, it is expensive
and labour-intensive. Like TLC, mass spectrometry requires human interpretation and data
treatment. An error in the results’ treatment process may then create untrue results. This
disadvantage can be overcome in TLC by an automatic classification method for FD
biomarkers, namely Gb3. Moreover, a large number of samples can be classified
simultaneously.
In this laboratory, the HPTLC method was explored as a complementary method for
diagnosis and research of Fabry and Gaucher diseases using urine and plasma samples.
Plasma and urine samples are the most frequently used samples to study Gb3 accumulation in
FD populations and both produce enlightening results (Boscaro et al, 2002). As the urine
collection method is simpler, it will be easier to collect urine samples from a large group of
individuals. Moreover, biomarkers of LSDs are often more elevated in urine than in blood
(Meikle et al, 2004; Mills et al, 2005).
Urine samples are collected in high quantities but the transportation process can easily
alter the lipid content due to deterioration. For this purpose, the use of filter papers to support
and carry dried urine samples, is a more viable approach for sample collection (Auray-Blais et
al, 2007). In addition, filter paper samples can be sent by mail, facilitate the storage and do
not require pre-HPTLC preparation. To analyse filter paper urine samples by HPTLC it is
necessary to increase the method sensitivity. Te results obtained with the optimised HPTLC
method were similar to those of the original method in identification of FD patients that excrete
Gb3. This identification was possible by analysing urine samples contained in two filter papers,
which is a great progress, as filter paper samples are usually analysed by mass spectrometry
(Auray-Blais et al, 2006; Auray-Blais et al, 2008; Chien et al, 2011).

HPTLC Detection of Gb3 in Urine Samples: improvement of the method and sampling
Chapter V – Discussion
[50]
An efficient extraction procedure would extract all the lipid content from the filter paper
samples. Several factors are implicated in extraction efficiency, namely centrifugation,
sonication, type and duration of agitation and type of organic solvents. However, for filter paper
samples, centrifugation is not the best approach as it retains part of the extract resulting in a
decrease of the GSL band density.
The stored GSLs can be extracted with non-polar solvents, however, the membrane
bound GSLs are more polar, requiring polar solvents capable of breaking the hydrogen bonds
and electrostatic forces.
Diethyl ether and chloroform are both moderately polar solvents used for lipid
extraction, but diethyl ether is not a very good alternative since it forms peroxides on storage,
causing the risk of explosions.
The alcohols ethanol and methanol are the most polar solvents used for lipid
extraction. Methanol is extremely toxic to the operator, but unlike ethanol it is not contaminated
with aldehydes in storage and when combined with chloroform forms a general lipid extraction
solution.
GSLs may be attached to the cell membrane in amounts ranging from less than 5% (in
erythrocytes) to more than 20% of membrane lipids (in myelin of neurons) (Schnaar et al,
2009). Hence, the release of GSLs from the cell membrane requires a larger quantity of
methanol. The use of the conventional 1:2 (v/v) CHCl3/MeOH ratio seem to be the best
approach to extract neutral GSLs from filter paper urine samples, which together with
sonication and increase in agitation time, improved the extraction method, and as a
consequence, the efficiency of HPTLC.
As lipid extraction is a common procedure in lipid analysis techniques, this extraction
method can also be applied to mass spectrometry analysis of filter paper urine samples.
The used material can contaminate the lipid extracts with mineral oils, greases,
plasticizers from plastics, and detergents. Specifically plastics must be avoided because they
can cause the appearance of unknown spots in TLC plates. On the other hand, biological
samples also have to be purified from their own impurities, such as pigments, lipophilic amino
acids, polypeptides and hydrophobic proteins.

HPTLC Detection of Gb3 in Urine Samples: improvement of the method and sampling
Chapter V – Discussion
[51]
These substances can be removed with a NaCl/MeOH (v/v) solution in the
fractionation process and the exclusion of the polypropylene material from fractionation was
proved to further prevent the interference of contaminants in the HPTLC plate.
The compression of the silica particles in the C18 column and their ability to interact
with GSLs are also of most importance. The solutions used for GSL partition and vacuum
velocity, can influence the capacity of the C18 column to retain GSLs. The partition of GSLs
retained by the column is provided by a polar solution comprising MeOH/H2O (v/v), which
elutes gangliosides, and a less polar solution composed of chloroform/methanol (v/v), to elute
the neutral GSLs. The elution should be performed with the volume of solvent that allows the
best recovery of the lipids retained by the C18 column, which proved to be the volume
described in the original method.
The development distance is an important factor for GSL separation as it directly
influences the position of the bands. HPTLC has been described for the reduction in
development distance from the 10-15 cm necessary in TLC to 3-5 cm (Patel et al, 2011).
Although the development distance of 7 cm described in the original HPTLC method is over the
distance described in literature, the reduction of the development distance did not produce
satisfactory results. Further reduction of the development distance would be impracticable as it
would be more difficult to separate some substances, which may even merge due to similar
polarities.
GSL detection can be achieved with destructive reagents, such as spray of sulfuric acid
basis (p-anisaldehyde and orcinol), or nondestructive reagents, such as primuline spray.
Anisaldehyde is the derivatization agent with greater sensitivity for detection of GSLs on HPTLC.
The primuline spray was not explored since it requires UV light for lipid detection and its effect
is not permanent.
For the currently under development software, the establishment of the detection limit
is crucial, allowing the separation of GSL bands from the background without leading to false
positives. The optimised method has a Gb3 detection limit of 2.0 µg and guarantees that
samples with Gb3 bands stronger than that of 2.0 µg must be detected by the software.
The optimised HPTLC method revealed to be 13.6% more effective for Gb3 detection
than the conventional method, although some GSLs are lost in the procedure. However, the
efficiency of the method must tested by changing other conditions, such as the technician,

HPTLC Detection of Gb3 in Urine Samples: improvement of the method and sampling
Chapter V – Discussion
[52]
extraction temperature, fractionation velocity, TLC chamber humidity and temperature,
sonication temperature and humidity and temperature upon drying the filter paper.
The classification of an unknown sample as a potential FD patient (hemizygous and
heterozygous) or a non-FD patient, is the most important issue of a screening test. The
optimised HPTLC method identified Gb3 excretion in 60% of FD patients, of which, one patient
had borderline Gb3 levels between the FD and control groups.
It has been described that the genotype of FD hemizygous patients has some degree of
association with urinary Gb3 excretion levels (Auray-Blais et al, 2008; Vedder et al, 2007b).
The F113L was the most frequent mutation in this study, found among six patients.
Four of these patients presented Gb3 levels that would allow their identification in a blind
screening test. In relation to the other α-Gal A mutations represented in this study, the
available patients were not in sufficient number to allow the establishment of mutation-related
Gb3 excretion profiles. On the other hand, R118C and C94S patients present urinary profiles
according to literature.
All of the studied mutations are missense mutations and for that reason, no correlation
can be made between the urinary Gb3 and the type of mutation.
Analysing the differences between the GSL profile of samples collected before and
during the ERT, the improved HPTLC method proved to be suitable to follow up FD patients
under treatment. The new screening method identified high levels of Gb3 before the ERT that
decreased dramatically after three months.
The effect of ERT on Gb3 excretion in urine is important as ERT can reverse part of the
symptoms and decrease Gb3 excretion. On the other hand, the production of antibodies
against the enzyme may decrease the enzyme activity and as a consequence cause the
increase of Gb3 accumulation and excretion (Ohashi et al, 2007).

CHAPTER VI
6. CONCLUSIONS AND FUTURE PERSPECTIVES

HPTLC Detection of Gb3 in Urine Samples: improvement of the method and sampling
Chapter VI – Conclusions and Future Perspectives
[54]
Several screening programs have been conducted in different high-risk or mass
screening populations. Most of these screening programs use mass spectrometry or mutational
analysis supported by determination of α-Gal A activity. However, these methods are very
expensive and time-consuming, requiring qualified technicians or complex and expensive
equipment.
The developed screening method offers an easy sample shipping method without
degradation of its constituents. Furthermore, it is suitable for a mass screening and ERT follow
up program as it can discriminate the affected individuals with high-risk of organ damage
caused by α-Gal A substrate accumulation and indirectly evaluate the therapy effect.
This method is easier to perform, its interpretation is clear and economically suitable to
use in a large population.
Future studies must contemplate the analysis of filter paper urine samples from a large
population of apparently healthy individuals and FD patients in order to refine the automatic
screening software. Filter paper urine samples of FD patients must be collected after the
establishment of protocols with their physicians and hospitals.

HPTLC Detection of Gb3 in Urine Samples: improvement of the method and sampling
References
7. REFERENCES

HPTLC Detection of Gb3 in Urine Samples: improvement of the method and sampling
References
[56]
Abe A, Arend LJ, Lee L, Lingwood C, Brady RO, Shayman JA (2000a) Glycosphingolipid depletion in fabry disease lymphoblasts with potent inhibitors of glucosylceramide synthase. Kidney Int 57: 446-454
Abe A, Gregory S, Lee L, Killen PD, Brady RO, Kulkarni A, Shayman JA (2000b) Reduction of globotriaosylceramide in Fabry disease mice by substrate deprivation. J Clin Invest 105: 1563-1571
Aerts JM, Groener JE, Kuiper S, Donker-Koopman WE, Strijland A, Ottenhoff R, van Roomen C, Mirzaian M, Wijburg FA, Linthorst GE, Vedder AC, Rombach SM, Cox-Brinkman J, Somerharju P, Boot RG, Hollak CE, Brady RO, Poorthuis BJ (2008) Elevated globotriaosylsphingosine is a hallmark of Fabry disease. Proceedings of the National Academy of Sciences 105: 2812-2817
Alroy J, Sabnis S, Kopp JB (2002) Renal pathology in Fabry disease. J Am Soc Nephrol 13 Suppl 2: S134-138
Askari H, Kaneski CR, Semino-Mora C, Desai P, Ang A, Kleiner DE, Perlee LT, Quezado M, Spollen LE, Wustman BA, Schiffmann R (2007) Cellular and tissue localization of globotriaosylceramide in Fabry disease. Virchows Arch 451: 823-834
Auray-Blais C, Cyr D, Drouin R (2007) Quebec neonatal mass urinary screening programme: From micromolecules to macromolecules. Journal of Inherited Metabolic Disease 30: 515-521
Auray-Blais C, Cyr D, Mills K, Giguère R, Drouin R (2006) Development of a filter paper method potentially applicable to mass and high-risk urinary screenings for Fabry disease. Journal of Inherited Metabolic Disease 30: 106-106
Auray-Blais C, Cyr D, Ntwari A, West M, Coxbrinkman J, Bichet D, Germain D, Laframboise R, Melancon S, Stockley T (2008) Urinary globotriaosylceramide excretion correlates with the genotype in children and adults with Fabry disease. Molecular Genetics and Metabolism 93: 331-340
Banikazemi M, Ullman T, Desnick RJ (2005) Gastrointestinal manifestations of Fabry disease: clinical response to enzyme replacement therapy. Mol Genet Metab 85: 255-259

HPTLC Detection of Gb3 in Urine Samples: improvement of the method and sampling
References
[57]
Barr C, Clarke JT, Ntwari A, Drouin R, Auray-Blais C (2009) Fabry disease urinary globotriaosylceramide/creatinine biomarker evaluation by liquid chromatography-tandem mass spectrometry in healthy infants from birth to 6 months. Mol Genet Metab 97: 278-283
Beck M. (2006) Demographics of FOS - the Fabry Outcome Survey. In Mehta A, Beck M, Sunder-Plassmann G (eds.), Fabry Disease: Perspectives from 5 Years of FOS. Oxford PharmaGenesis.
Berná L, Asfaw B, Conzelmann E, Cerny B, Ledvinova J (1999) Determination of urinary sulfatides and other lipids by combination of reversed-phase and thin-layer chromatographies. Anal Biochem 269: 304-311
Bishop DF, Calhoun DH, Bernstein HS, Hantzopoulos P, Quinn M, Desnick RJ (1986) Human alpha-galactosidase A: nucleotide sequence of a cDNA clone encoding the mature enzyme. Proc Natl Acad Sci U S A 83: 4859-4863
Blaydon D, Hill J, Winchester B (2001) Fabry disease: 20 novel GLA mutations in 35 families. Hum Mutat 18: 459
Blom D, Speijer D, Linthorst GE, Donker-Koopman WG, Strijland A, Aerts JM (2003) Recombinant enzyme therapy for Fabry disease: absence of editing of human alpha-galactosidase A mRNA. Am J Hum Genet 72: 23-31
Bodamer OA (2007) Anderson-Fabry Disease in Heterozygous Females. Current Medical Literature 7: 39-42
Boscaro F, Pieraccini G, la Marca G, Bartolucci G, Luceri C, Luceri F, Moneti G (2002) Rapid quantitation of globotriaosylceramide in human plasma and urine: a potential application for monitoring enzyme replacement therapy in Anderson-Fabry disease. Rapid Commun Mass Spectrom 16: 1507-1514
Brown LK, Miller A, Bhuptani A, Sloane MF, Zimmerman MI, Schilero G, Eng CM, Desnick RJ (1997) Pulmonary involvement in Fabry disease. Am J Respir Crit Care Med 155: 1004-1010
Buechner S, Moretti M, Burlina AP, Cei G, Manara R, Ricci R, Mignani R, Parini R, Di Vito R, Giordano GP, Simonelli P, Siciliano G, Borsini W (2008) Central nervous system involvement in

HPTLC Detection of Gb3 in Urine Samples: improvement of the method and sampling
References
[58]
Anderson-Fabry disease: a clinical and MRI retrospective study. J Neurol Neurosurg Psychiatry 79: 1249-1254
Cable WJ, Kolodny EH, Adams RD (1982) Fabry disease: impaired autonomic function. Neurology 32: 498-502
Caudron E, Sandrine R, Germain DP, Chaminade P, Prognon P (2007) [Laboratory diagnosis of Fabry disease: historical perspectives and recent breakthroughs]. Presse Med 36 Spec No 1: 1S76-81
Chamoles NA, Blanco M, Gaggioli D (2001) Fabry disease: enzymatic diagnosis in dried blood spots on filter paper. Clin Chim Acta 308: 195-196
Chien Y-H, Olivova P, Zhang XK, Chiang S-C, Lee N-C, Keutzer J, Hwu W-L (2011) Elevation of urinary globotriaosylceramide (GL3) in infants with Fabry disease. Molecular Genetics and Metabolism 102: 57-60
Chimenti C, Hamdani N, Boontje NM, DeCobelli F, Esposito A, Bronzwaer JG, Stienen GJ, Russo MA, Paulus WJ, Frustaci A, van der Velden J (2008) Myofilament degradation and dysfunction of human cardiomyocytes in Fabry disease. Am J Pathol 172: 1482-1490
Chimenti C, Pieroni M, Morgante E, Antuzzi D, Russo A, Russo MA, Maseri A, Frustaci A (2004) Prevalence of Fabry disease in female patients with late-onset hypertrophic cardiomyopathy. Circulation 110: 1047-1053
Cole AL, Lee PJ, Hughes DA, Deegan PB, Waldek S, Lachmann RH (2007) Depression in adults with Fabry disease: a common and under-diagnosed problem. J Inherit Metab Dis 30: 943-951
Connock M, Juarez-Garcia A, Frew E, Mans A, Dretzke J, Fry-Smith A, Moore D (2006) A systematic review of the clinical effectiveness and cost-effectiveness of enzyme replacement therapies for Fabry's disease and mucopolysaccharidosis type 1. Health Technol Assess 10: iii-iv, ix-113

HPTLC Detection of Gb3 in Urine Samples: improvement of the method and sampling
References
[59]
Das K, Xiao R, Wahlberg E, Hsu F, Arrowsmith CH, Montelione GT, Arnold E (2001) X-ray crystal structure of MTH938 from Methanobacterium thermoautotrophicum at 2.2 A resolution reveals a novel tertiary protein fold. Proteins 45: 486-488
Desnick RJ, Brady R, Barranger J, Collins AJ, Germain DP, Goldman M, Grabowski G, Packman S, Wilcox WR (2003) Fabry disease, an under-recognized multisystemic disorder: expert recommendations for diagnosis, management, and enzyme replacement therapy. Ann Intern Med 138: 338-346
Desnick RJ, Ioannou YA, Eng CM (2001) -Galatosidase A Deficiency: Fabry Disease. In The Metabolic and Molecular Basis of Inherited Disease, Scriver CR, Beaudet AL, Sly WS, Valle D (eds), Vol. III, pp 3733-3774.: Mc Graw Hill
Desnick RJ, Sweeley CC, Krivit W (1970) A method for the quantitative determination of neutral glycosphingolipids in urine sediment. J Lipid Res 11: 31-37
Domon B, Costello CE (1988) Structure elucidation of glycosphingolipids and gangliosides using high-performance tandem mass spectrometry. Biochemistry 27: 1534-1543
Dutsch M, Marthol H, Stemper B, Brys M, Haendl T, Hilz MJ (2002) Small fiber dysfunction predominates in Fabry neuropathy. J Clin Neurophysiol 19: 575-586
Elleder M (2003) Sequelae of storage in Fabry disease--pathology and comparison with other lysosomal storage diseases. Acta Paediatr Suppl 92: 46-53; discussion 45
Elleder M (2010) Subcellular, cellular and organ pathology of Fabry disease. In Fabry Disease, Elstein D, Altarescu G, Beck M (eds), 1st edn, 3rd, pp 39-79. Springer
Elstein D, Schachamorov E, Beeri R, Altarescu G (2012) X-inactivation in Fabry disease. Gene 505: 266-268
Eng CM, Ashley GA, Burgert TS, Enriquez AL, D'Souza M, Desnick RJ (1997) Fabry disease: thirty-five mutations in the alpha-galactosidase A gene in patients with classic and variant phenotypes. Mol Med 3: 174-182

HPTLC Detection of Gb3 in Urine Samples: improvement of the method and sampling
References
[60]
Eng CM, Fletcher J, Wilcox WR, Waldek S, Scott CR, Sillence DO, Breunig F, Charrow J, Germain DP, Nicholls K, Banikazemi M (2007) Fabry disease: Baseline medical characteristics of a cohort of 1765 males and females in the Fabry Registry. Journal of Inherited Metabolic Disease 30: 184-192
Eng CM, Germain DP, Banikazemi M, Warnock DG, Wanner C, Hopkin RJ, Bultas J, Lee P, Sims K, Brodie SE, Pastores GM, Strotmann JM, Wilcox WR (2006) Fabry disease: guidelines for the evaluation and management of multi-organ system involvement. Genet Med 8: 539-548
Eng CM, Guffon N, Wilcox WR, Germain DP, Lee P, Waldek S, Caplan L, Linthorst GE, Desnick RJ (2001) Safety and Efficacy of Recombinant Human α-Galactosidase A Replacement
Therapy in Fabry's Disease. New England Journal of Medicine 345: 9-16
Eng CM, Resnick-Silverman LA, Niehaus DJ, Astrin KH, Desnick RJ (1993) Nature and frequency of mutations in the alpha-galactosidase A gene that cause Fabry disease. Am J Hum Genet 53: 1186-1197
Fellgiebel A, Müller MJ, Ginsberg L (2006) CNS manifestations of Fabry's disease. The Lancet Neurology 5: 791-795
Fuller M (2005) Urinary Lipid Profiling for the Identification of Fabry Hemizygotes and Heterozygotes. Clinical Chemistry 51: 688-694
Gal A (2010) Molecular Genetics of Fabry Disease and Genotype–Phenotype Correlation. In Fabry Disease, Elstein D, Altarescu G, Beck M (eds), 1st edn, 1, pp 3-19. Springer
Gal A, Schafer E, Rohard I. (2006) The genetic basis of Fabry disease. In Mehta Atul, Michael Beck, Sunder-Plassmann G (eds.), Fabry Disease: Perspectives from 5 Years of FOS. Oxford PharmaGenesis.
Gaspar P, Herrera J, Rodrigues D, Cerezo S, Delgado R, Andrade CF, Forascepi R, Macias J, del Pino MD, Prados MD, de Alegria PR, Torres G, Vidau P, Sa-Miranda MC (2010) Frequency of Fabry disease in male and female haemodialysis patients in Spain. BMC Med Genet 11: 19
Germain DP (2010) Fabry disease. Orphanet Journal of Rare Diseases 5: 30

HPTLC Detection of Gb3 in Urine Samples: improvement of the method and sampling
References
[61]
Germain DP, Benistan K, Angelova L (2010) X-linked inheritance and its implication in the diagnosis and management of female patients in Fabry disease. Rev Med Interne 31 Suppl 2: S209-213
Germain DP, Shabbeer J, Cotigny S, Desnick RJ (2002) Fabry disease: twenty novel alpha-galactosidase A mutations and genotype-phenotype correlations in classical and variant phenotypes. Mol Med 8: 306-312
Hasegawa H, Takano H, Shindo S, Takeda S, Funabashi N, Nakagawa K, Toyozaki T, Kuwabara Y, Komuro I (2006) Images in cardiovascular medicine. Transition from left ventricular hypertrophy to massive fibrosis in the cardiac variant of Fabry disease. Circulation 113: e720-721
Heare T, Alp NJ, Priestman DA, Kulkarni AB, Qasba P, Butters TD, Dwek RA, Clarke K, Channon KM, Platt FM (2007) Severe endothelial dysfunction in the aorta of a mouse model of Fabry disease; partial prevention by N-butyldeoxynojirimycin treatment. J Inherit Metab Dis 30: 79-87
Hoffmann B, Beck M, Sunder-Plassmann G, Borsini W, Ricci R, Mehta A (2007) Nature and prevalence of pain in Fabry disease and its response to enzyme replacement therapy--a retrospective analysis from the Fabry Outcome Survey. Clin J Pain 23: 535-542
Hoffmann B, Reinhardt D, Koletzko B (2004) Effect of enzyme-replacement therapy on gastrointestinal symptoms in Fabry disease. Eur J Gastroenterol Hepatol 16: 1067-1069
Hopkin RJ, Bissler J, Banikazemi M, Clarke L, Eng CM, Germain DP, Lemay R, Tylki-Szymanska A, Wilcox WR (2008) Characterization of Fabry disease in 352 pediatric patients in the Fabry Registry. Pediatr Res 64: 550-555
Hrebícek M, Ledvinová J (2010) Biochemistry of Fabry disease. In Fabry Disease, Elstein D, Altarescu G, Beck M (eds), 1st edn, 4th, pp 81-104. Springer
Hsu FF, Turk J (2001) Structural determination of glycosphingolipids as lithiated adducts by electrospray ionization mass spectrometry using low-energy collisional-activated dissociation on a triple stage quadrupole instrument. J Am Soc Mass Spectrom 12: 61-79

HPTLC Detection of Gb3 in Urine Samples: improvement of the method and sampling
References
[62]
Hůlková H, Elleder M (2010) Adipocytes participate in storage in alpha-galactosidase deficiency
(Fabry disease). J Inherit Metab Dis
Huwiler A, Kolter T, Pfeilschifter J, Sandhoff K (2000) Physiology and pathophysiology of sphingolipid metabolism and signaling. Biochim Biophys Acta 1485: 63-99
Igisu H, Suzuki K (1984) Progressive accumulation of toxic metabolite in a genetic leukodystrophy. Science 224: 753-755
Jardim L, Vedolin L, Schwartz IV, Burin MG, Cecchin C, Kalakun L, Matte U, Aesse F, Pitta-Pinheiro C, Marconato J, Giugliani R (2004) CNS involvement in Fabry disease: clinical and imaging studies before and after 12 months of enzyme replacement therapy. J Inherit Metab Dis 27: 229-240
Kampmann C, Baehner F, Whybra C, Martin C, Wiethoff CM, Ries M, Gal A, Beck M (2002) Cardiac manifestations of Anderson-Fabry disease in heterozygous females. J Am Coll Cardiol 40: 1668-1674
Kang WH, Chun SI, Lee S (1987) Generalized anhidrosis associated with Fabry's disease. J Am Acad Dermatol 17: 883-887
Kitagawa T, Ishige N, Suzuki K, Owada M, Ohashi T, Kobayashi M, Eto Y, Tanaka A, Mills K, Winchester B, Keutzer J (2005) Non-invasive screening method for Fabry disease by measuring globotriaosylceramide in whole urine samples using tandem mass spectrometry. Mol Genet Metab 85: 196-202
Kornreich R, Bishop DF, Desnick RJ (1990) Alpha-galactosidase A gene rearrangements causing Fabry disease. Identification of short direct repeats at breakpoints in an Alu-rich gene. J Biol Chem 265: 9319-9326
Krüger R, Bruns K, Grünhage S, Rossmann H, Reinke J, Beck M, Lackner KJ (2010) Determination of globotriaosylceramide in plasma and urine by mass spectrometry. Clinical Chemistry and Laboratory Medicine 48: 189-198

HPTLC Detection of Gb3 in Urine Samples: improvement of the method and sampling
References
[63]
Kundu SK (1981) Thin-layer chromatography of neutral glycosphingolipids and gangliosides. Methods Enzymol 72: 185-204
Lee K, Jin X, Zhang K, Copertino L, Andrews L, Baker-Malcolm J, Geagan L, Qiu H, Seiger K, Barngrover D, McPherson JM, Edmunds T (2003) A biochemical and pharmacological comparison of enzyme replacement therapies for the glycolipid storage disorder Fabry disease. Glycobiology 13: 305-313
Levy M, Feingold J (2000) Estimating prevalence in single-gene kidney diseases progressing to renal failure. Kidney Int 58: 925-943
Lidove O, West ML, Pintos-Morell G, Reisin R, Nicholls K, Figuera LE, Parini R, Carvalho LR, Kampmann C, Pastores GM, Mehta A (2010) Effects of enzyme replacement therapy in Fabry disease—A comprehensive review of the medical literature. Genetics in Medicine: 1
Liu X, Zhang ZR, Fuller MD, Billingsley J, McCarty NA, Dawson DC (2004) CFTR: a cysteine at position 338 in TM6 senses a positive electrostatic potential in the pore. Biophys J 87: 3826-3841
MacDermot KD, Holmes A, Miners AH (2001a) Anderson-Fabry disease: clinical manifestations and impact of disease in a cohort of 98 hemizygous males. J Med Genet 38: 750-760
MacDermot KD, Holmes A, Miners AH (2001b) Natural history of Fabry disease in affected males and obligate carrier females. J Inherit Metab Dis 24 Suppl 2: 13-14; discussion 11-12
Macedo MF, Quinta R, Pereira CS, Sa Miranda MC (2012) Enzyme replacement therapy partially prevents invariant Natural Killer T cell deficiency in the Fabry disease mouse model. Mol Genet Metab 106: 83-91
Marshall J, Ashe KM, Bangari D, McEachern K, Chuang WL, Pacheco J, Copeland DP, Desnick RJ, Shayman JA, Scheule RK, Cheng SH (2010) Substrate reduction augments the efficacy of enzyme therapy in a mouse model of Fabry disease. PLoS One 5: e15033
Masson C, Cisse I, Simon V, Insalaco P, Audran M (2004) Fabry disease: a review. Joint Bone Spine 71: 381-383

HPTLC Detection of Gb3 in Urine Samples: improvement of the method and sampling
References
[64]
Matsuzawa F, Aikawa S, Doi H, Okumiya T, Sakuraba H (2005) Fabry disease: correlation between structural changes in alpha-galactosidase, and clinical and biochemical phenotypes. Hum Genet 117: 317-328
McCluer RH, Ullman MD, Jungalwala FB (1989) High-performance liquid chromatography of membrane lipids: glycosphingolipids and phospholipids. Methods Enzymol 172: 538-575
Mehta A, Ricci R, Widmer U, Dehout F, Garcia de Lorenzo A, Kampmann C, Linhart A, Sunder-Plassmann G, Ries M, Beck M (2004) Fabry disease defined: baseline clinical manifestations of 366 patients in the Fabry Outcome Survey. Eur J Clin Invest 34: 236-242
Meikle PJ, Hopwood JJ, Clague AE, Carey WF (1999) Prevalence of lysosomal storage disorders. JAMA 281: 249-254
Meikle PJ, Ranieri E, Simonsen H, Rozaklis T, Ramsay SL, Whitfield PD, Fuller M, Christensen E, Skovby F, Hopwood JJ (2004) Newborn screening for lysosomal storage disorders: clinical evaluation of a two-tier strategy. Pediatrics 114: 909-916
Mendez MF, Stanley TM, Medel NM, Li Z, Tedesco DT (1997) The vascular dementia of Fabry's disease. Dement Geriatr Cogn Disord 8: 252-257
Mills K, Johnson A, Winchester B (2002) Synthesis of novel internal standards for the quantitative determination of plasma ceramide trihexoside in Fabry disease by tandem mass spectrometry. FEBS Lett 515: 171-176
Mills K, Morris P, Lee P, Vellodi A, Waldek S, Young E, Winchester B (2005) Measurement of urinary CDH and CTH by tandem mass spectrometry in patients hemizygous and heterozygous for Fabry disease. J Inherit Metab Dis 28: 35-48
Mitsias P, Levine SR (1996) Cerebrovascular complications of Fabry's disease. Ann Neurol 40: 8-17
Moon JC, Sheppard M, Reed E, Lee P, Elliott PM, Pennell DJ (2006) The histological basis of late gadolinium enhancement cardiovascular magnetic resonance in a patient with Anderson-Fabry disease. J Cardiovasc Magn Reson 8: 479-482

HPTLC Detection of Gb3 in Urine Samples: improvement of the method and sampling
References
[65]
Moore DF, Kaneski CR, Askari H, Schiffmann R (2007) The cerebral vasculopathy of Fabry disease. J Neurol Sci 257: 258-263
Müthing J (1996) High-resolution thin-layer chromatography of gangliosides. J Chromatogr A 720: 3-25
Müthing J (1998) TLC in structure and recognition studies of glycosphingolipids. Methods Mol Biol 76: 183-195
Müthing J, Distler U (2009) Advances on the compositional analysis of glycosphingolipids combining thin-layer chromatography with mass spectrometry. Mass Spectrometry Reviews: n/a-n/a
Nakao S, Kodama C, Takenaka T, Tanaka A, Yasumoto Y, Yoshida A, Kanzaki T, Enriquez AL, Eng CM, Tanaka H, Tei C, Desnick RJ (2003) Fabry disease: detection of undiagnosed hemodialysis patients and identification of a "renal variant" phenotype. Kidney Int 64: 801-807
Nguyen TT, Gin T, Nicholls K, Low M, Galanos J, Crawford A (2005) Ophthalmological manifestations of Fabry disease: a survey of patients at the Royal Melbourne Fabry Disease Treatment Centre. Clin Experiment Ophthalmol 33: 164-168
Nilsson O, Svennerholm L (1982) Accumulation of glucosylceramide and glucosylsphingosine (psychosine) in cerebrum and cerebellum in infantile and juvenile Gaucher disease. J Neurochem 39: 709-718
Ohashi T, Sakuma M, Kitagawa T, Suzuki K, Ishige N, Eto Y (2007) Influence of antibody formation on reduction of globotriaosylceramide (GL-3) in urine from Fabry patients during agalsidase beta therapy. Mol Genet Metab 92: 271-273
Orssaud C, Dufier J, Germain D (2003) Ocular manifestations in Fabry disease: a survey of 32 hemizygous male patients. Ophthalmic Genet 24: 129-139
Orteu CH, Jansen T, Lidove O, Jaussaud R, Hughes DA, Pintos-Morell G, Ramaswami U, Parini R, Sunder-Plassman G, Beck M, Mehta AB (2007) Fabry disease and the skin: data from FOS, the Fabry outcome survey. Br J Dermatol 157: 331-337

HPTLC Detection of Gb3 in Urine Samples: improvement of the method and sampling
References
[66]
Orvisky E, Park JK, LaMarca ME, Ginns EI, Martin BM, Tayebi N, Sidransky E (2002) Glucosylsphingosine accumulation in tissues from patients with Gaucher disease: correlation with phenotype and genotype. Mol Genet Metab 76: 262-270
Patel RB, Patel MR, Batel BG (2011) Experimental Aspects and Implementation of HPTLC. In High-Performance Thin-Layer Chromatography (HPTLC), Srivastava M (ed), 1st edn, 3. Springer Berlin Heidelberg
Philippart M, Sarlieve L, Manacorda A (1969) Urinary glycolipids in Fabry's disease. Their examination in the detection of atypical variants and the pre-symptomatic state. Pediatrics 43: 201-206
Pitz S, Grube-Einwald K, Renieri G, Reinke J (2009) Subclinical optic neuropathy in Fabry disease. Ophthalmic Genet 30: 165-171
Platt FM, Neises GR, Dwek RA, Butters TD (1994) N-butyldeoxynojirimycin is a novel inhibitor of glycolipid biosynthesis. J Biol Chem 269: 8362-8365
Ries M, Gal A. (2006) Genotype-phenotype correlation in Fabry disease. In Mehta A, Beck M, Sunder-Plassmann G (eds.), Fabry Disease: Perspectives from 5 Years of FOS. Oxford PharmaGenesis.
Rolfs A, Bottcher T, Zschiesche M, Morris P, Winchester B, Bauer P, Walter U, Mix E, Lohr M, Harzer K, Strauss U, Pahnke J, Grossmann A, Benecke R (2005) Prevalence of Fabry disease in patients with cryptogenic stroke: a prospective study. Lancet 366: 1794-1796
Rowe JW, Gilliam JI, Warthin TA (1974) Intestinal manifestations of Fabry's disease. Ann Intern Med 81: 628-631
Roy S, Gaudin K, Germain D, Baillet A, Prognon P, Chaminade P (2004) Optimisation of the separation of four major neutral glycosphingolipids: application to a rapid and simple detection of urinary globotriaosylceramide in Fabry disease. Journal of Chromatography B 805: 331-337

HPTLC Detection of Gb3 in Urine Samples: improvement of the method and sampling
References
[67]
Rozenfeld P, Agriello E, De Francesco N, Martinez P, Fossati C (2009a) Leukocyte perturbation associated with Fabry disease. J Inherit Metab Dis
Rozenfeld PA, De Francesco NP, Borrajo GJ, Ceci R, Fossati CA (2009b) An easy and sensitive method for determination of globotriaosylceramide (Gb3) from urinary sediment: utility for Fabry disease diagnosis and treatment monitoring. Clin Chim Acta 403: 194-197
Saito S, Ohno K, Sakuraba H (2011) Fabry-database.org: database of the clinical phenotypes, genotypes and mutant [alpha]-galactosidase A structures in Fabry disease. J Hum Genet 56: 467-468
Sakuraba H, Murata-Ohsawa M, Kawashima I, Tajima Y, Kotani M, Ohshima T, Chiba Y, Takashiba M, Jigami Y, Fukushige T, Kanzaki T, Itoh K (2006) Comparison of the effects of agalsidase alfa and agalsidase beta on cultured human Fabry fibroblasts and Fabry mice. J Hum Genet 51: 180-188
Schäfer E, Baron K, Widmer U, Deegan P, P.H. Neumann H, Sunder-Plassmann G, Johansson J-O, Whybra C, Ries M, M. Pastores G, Mehta A, Beck M, Gal A (2005) Thirty-four novel mutations of the GLA gene in 121 patients with Fabry disease. Human Mutation 25: 412-412
Schiffmann R, Kopp JB, Austin HA, Sabnis S, Moore DF, Weibel T, Balow JE, Brady RO (2001) Enzyme Replacement Therapy in Fabry Disease. JAMA: The Journal of the American Medical Association 285: 2743-2749
Schiffmann R, Ries M, Timmons M, Flaherty JT, Brady RO (2006) Long-term therapy with agalsidase alfa for Fabry disease: safety and effects on renal function in a home infusion setting. Nephrol Dial Transplant 21: 345-354
Schiffmann R, Warnock DG, Banikazemi M, Bultas J, Linthorst GE, Packman S, Sorensen SA, Wilcox WR, Desnick RJ (2009) Fabry disease: progression of nephropathy, and prevalence of cardiac and cerebrovascular events before enzyme replacement therapy. Nephrol Dial Transplant 24: 2102-2111
Schnaar RL, Needham LK (1994) Thin-layer chromatography of glycosphingolipids. Methods Enzymol 230: 371-389

HPTLC Detection of Gb3 in Urine Samples: improvement of the method and sampling
References
[68]
Schnaar RL, Suzuki A, Stanley P. (2009) Glycosphingolipids. In Varki A, Cummings RD, Esko JD, Freeze HH, Stanley P, Bertozzi CR, Hart GW, Etzler ME (eds.), Essentials of Glycobiology. Cold Spring Harbor (NY): Cold Spring Harbor Laboratory Press.
Selvarajah M, Nicholls K, Hewitson TD, Becker GJ (2011) Targeted urine microscopy in Anderson-Fabry Disease: a cheap, sensitive and specific diagnostic technique. Nephrology Dialysis Transplantation
Shabbeer J, Yasuda M, Benson SD, Desnick RJ (2006) Fabry disease: identification of 50 novel alpha-galactosidase A mutations causing the classic phenotype and three-dimensional structural analysis of 29 missense mutations. Hum Genomics 2: 297-309
Shah JS, Hughes DA, Sachdev B, Tome M, Ward D, Lee P, Mehta AB, Elliott PM (2005) Prevalence and Clinical Significance of Cardiac Arrhythmia in Anderson-Fabry Disease. The American journal of cardiology 96: 842-846
Shelley ED, Shelley WB, Kurczynski TW (1995) Painful fingers, heat intolerance, and telangiectases of the ear: easily ignored childhood signs of Fabry disease. Pediatr Dermatol 12: 215-219
Sims K, Politei J, Banikazemi M, Lee P (2009) Stroke in Fabry disease frequently occurs before diagnosis and in the absence of other clinical events: natural history data from the Fabry Registry. Stroke 40: 788-794
Skipski VP (1975) Thin-layer chromatography of neutral glycosphingolipids. Methods Enzymol 35: 396-425
Sodi A, Ioannidis AS, Mehta A, Davey C, Beck M, Pitz S (2007) Ocular manifestations of Fabry's disease: data from the Fabry Outcome Survey. Br J Ophthalmol 91: 210-214
Spada M, Pagliardini S, Yasuda M, Tukel T, Thiagarajan G, Sakuraba H, Ponzone A, Desnick RJ (2006) High incidence of later-onset fabry disease revealed by newborn screening. Am J Hum Genet 79: 31-40
Stryker VL, Kreps C (2001) Fabry disease. Am J Nurs 101: 39-44

HPTLC Detection of Gb3 in Urine Samples: improvement of the method and sampling
References
[69]
Svennerholm L, Vanier MT, Månsson JE (1980) Krabbe disease: a galactosylsphingosine (psychosine) lipidosis. Journal of Lipid Research 21: 53-64
Togawa T, Kawashima I, Kodama T, Tsukimura T, Suzuki T, Fukushige T, Kanekura T, Sakuraba H (2010) Tissue and plasma globotriaosylsphingosine could be a biomarker for assessing enzyme replacement therapy for Fabry disease. Biochem Biophys Res Commun 399: 716-720
Ullman MD, McCluer RH (1977) Quantitative analysis of plasma neutral glycosphingolipids by high performance liquid chromatography of their perbenzoyl derivatives. J Lipid Res 18: 371-378
Valbuena C, Carvalho E, Bustorff M, Ganhao M, Relvas S, Nogueira R, Carneiro F, Oliveira JP (2008) Kidney biopsy findings in heterozygous Fabry disease females with early nephropathy. Virchows Arch 453: 329-338
Vance DE, Sweeley CC (1967) Quantitative determination of the neutral glycosyl ceramides in human blood. J Lipid Res 8: 621-630
Vedder AC, Linthorst GE, Houge G, Groener JE, Ormel EE, Bouma BJ, Aerts JM, Hirth A, Hollak CE (2007a) Treatment of Fabry disease: outcome of a comparative trial with agalsidase alfa or beta at a dose of 0.2 mg/kg. PLoS ONE 2: e598
Vedder AC, Linthorst GE, van Breemen MJ, Groener JE, Bemelman FJ, Strijland A, Mannens MM, Aerts JM, Hollak CE (2007b) The Dutch Fabry cohort: diversity of clinical manifestations and Gb3 levels. J Inherit Metab Dis 30: 68-78
Wang RY, Lelis A, Mirocha J, Wilcox WR (2007) Heterozygous Fabry women are not just carriers, but have a significant burden of disease and impaired quality of life. Genetics in Medicine 9: 34-45
Wherrett JR (1967) Analysis of polar lipids in the urine sediment. Clin Chim Acta 16: 135-145
Whybra C, Kampmann C, Willers I, Davies J, Winchester B, Kriegsmann J, Bruhl K, Gal A, Bunge S, Beck M (2001) Anderson-Fabry disease: clinical manifestations of disease in female heterozygotes. J Inherit Metab Dis 24: 715-724

HPTLC Detection of Gb3 in Urine Samples: improvement of the method and sampling
References
[70]
Wilcox WR, Banikazemi M, Guffon N, Waldek S, Lee P, Linthorst GE, Desnick RJ, Germain DP (2004) Long-term safety and efficacy of enzyme replacement therapy for Fabry disease. Am J Hum Genet 75: 65-74
Wilcox WR, Oliveira JP, Hopkin RJ, Ortiz A, Banikazemi M, Feldt-Rasmussen U, Sims K, Waldek S, Pastores GM, Lee P, Eng CM, Marodi L, Stanford KE, Breunig F, Wanner C, Warnock DG, Lemay RM, Germain DP (2008) Females with Fabry disease frequently have major organ involvement: lessons from the Fabry Registry. Mol Genet Metab 93: 112-128
Winchester B, Young E (2006) Biochemical and genetic diagnosis of Fabry disease. In Fabry disease: Perspectives from 5 Years of FOS, Mehta A, Beck M, Sunder-Plassmann G (eds), 1st edn, pp 169-182. Oxford Pharma Genesis
Winchester B, Young E (2010) Laboratory Diagnosis of Fabry Disease. In Fabry Disease, Elstein D, Altarescu G, Beck M (eds), 1st edn, 6, pp 111-132. Springer
Xu YH, Barnes S, Sun Y, Grabowski GA (2010) Multi-system disorders of glycosphingolipid and ganglioside metabolism. J Lipid Res 51: 1643-1675
Yu RK, Ariga T (2000) Ganglioside analysis by high-performance thin-layer chromatography. Methods Enzymol 312: 115-134
Zeidner KM, Desnick RJ, Ioannou YA (1999) Quantitative determination of globotriaosylceramide by immunodetection of glycolipid-bound recombinant verotoxin B subunit. Anal Biochem 267: 104-113

8. APPENDIX I

HPTLC Detection of Gb3 in Urine Samples: improvement of the method and sampling
Appendix I
[72]
Table III: Characteristics of control subjects. In the conventional method a 20 mL liquid urine sample is used. The filter
paper collection method refers to a 2 filter paper urine sample, with approximatelly 2 mL of urine per filter paper. M- Meles; F –
Females.
Control sample Collection Method Gender Age
1 Conventional F 26
2 Conventional M 20
3 Conventional M 62
4 Conventional F 23
5 Conventional M 33
6 Conventional M 49
7 Conventional M 28
8 Filter Paper M 51
9 Filter Paper M 32
10 Filter Paper F 28
11 Filter Paper F 57
12 Filter Paper M 30
13 Filter Paper M 64
14 Filter Paper F 39
15 Filter Paper M 20
16 Filter Paper F 23
17 Filter Paper F 51
18 Filter Paper M 55
19 Filter Paper M 63
20 Filter Paper F 69
21 Filter Paper F 50
22 Filter Paper M 26
23 Filter Paper M 29
24 Filter Paper F 28
25 Filter Paper M 29
26 Filter Paper F 30
27 Filter Paper F 48
28 Filter Paper F 26
29 Filter Paper F 25
30 Filter Paper F 25

HPTLC Detection of Gb3 in Urine Samples: improvement of the method and sampling
Appendix I
[73]

HPTLC Detection of Gb3 in Urine Samples: improvement of the method and sampling
Appendix I
[74]
Figure 10: Filter paper kit instruction sheet for urine samples.

9. APPENDIX II

HPTLC Detection of Gb3 in Urine Samples: improvement of the method and sampling
Appendix II
[76]
Table VIII: Densitometry of Gb3 bands from empty filter papers subjected to different extraction agitation
procedures. The Gb3 pixels were calculated by subtracting of background pixels to the total pixels of the Gb3 area. Gb3
values are expressed as mean ± standard deviation (SD). The variability of the analysis was calculated as relative SD (%RSD).
Lane Gb3
Mean ± SD (pixels)
%RSD
24 h 1610.1 ± 109.1 6.8
3x 2 h 1198.7 ± 505.5 42.2
5 min 1347.0 ± 2.5 0.2
Table XIII: Densitometry of Gb3 and SM bands of FD patients and control subjects. The Gb3 and SM pixels were
measured separately and the presented values are obtained by subtracting the background pixels to the total pixels of the Gb3
and SM area, respectively. Values are expressed as mean ± SD. The variability of the analysis was calculated as %RSD. n.d. –
non-detected.
Control Subjects
SM (pixels)
Gb3 (pixels)
Patients SM
(pixels) Gb3
(pixels)
C8 176.2 n.d. P6 400.1 n.d.
C9 53.4 n.d. P7 446.0 154.7
C10 121.9 n.d. P3 75.4 403.5
C11 41.7 n.d. P4 42.8 822.4
C12 33.4 n.d. P5 58.4 n.d.
C13 125.4 n.d. P2 84.7 372.9
C14 360.2 n.d. P8 19.9 n.d.
C15 134.6 n.d. P1 43.4 512.3
C16 250.9 n.d. P9 31.5 124.5
C17 469.4 n.d. P10 61.3 n.d.
C18 83.3 n.d. Mean ± SD 126.4 ± 157.9 398.4 ± 256.1
C19 71.6 n.d. % RSD 125.0 64.3
C20 26.4 n.d.
C21 401.4 176.4
C22 194.6 n.d.
C23 245.5 n.d.
C24 48.4 n.d.
C25 155.4 n.d.
C26 138.6 n.d.
C27 35.6 n.d.
C28 246.2 88.6
C29 n.d. n.d.
Mean ± SD 162.6 ± 127.1 132.5 ± 62.0
% RSD 78.2 46.8