Um século em quatro atos: como a sua empresa pode se preparar para o futuro?
61
FDC CENÁRIOS 2017-2100: UM SÉCULO EM QUATRO ATOS Prof. Paulo Vicente | 2017
-
Upload
fundacao-dom-cabral-fdc -
Category
Education
-
view
215 -
download
2
Transcript of Um século em quatro atos: como a sua empresa pode se preparar para o futuro?

FDC
CENAacuteRIOS 2017-2100 UM SEacuteCULO EM QUATRO ATOSProf Paulo Vicente | 2017
AMBIENTE
Poliacutetico
Econocircmico
Social
Tecnoloacutegico
Ambiental
Legal
Habsburgos Holanda Reino Unido EUA
1ordm 2ordm 3ordm 4ordm 5ordm
Ciclos hegemocircnicos
Ciclos de Kondratieff
UM SEacuteCULO EM QUATRO ATOS
Ciclo Periacuteodo Subfase Hegemonia
5o Ciclo 2005-2018 Esgotamento EUA
5o Ciclo 2018-2030 Crise EUA
6o Ciclo 2030-2042 Recuperaccedilatildeo EUA
6o Ciclo 2042-2055 Expansatildeo EUA
6o Ciclo 2055-2067 Esgotamento EUA
6o Ciclo 2067-2080 Crise Transiccedilatildeo
7o Ciclo 2080-2092 Recuperaccedilatildeo Transiccedilatildeo
7o Ciclo 2092-2104 Expansatildeo Nova hegemonia
CICLOS DE HEGEMONIA
Periacuteodo Nome Anos
Hegemonia GecircnovaHabsburgos 1492-1618
Guerra de Transiccedilatildeo Guerra dos 30 Anos 1618-1648
Hegemonia Holanda 1648-1785
Guerra de Transiccedilatildeo Guerras Napoleocircnicas 1785-1815
Hegemonia Reino Unido 1815-1914
Guerra de Transiccedilatildeo Guerras Mundiais 1914-1945
Hegemonia EUA 1945-2065
Guerra de Transiccedilatildeo 2065-2095
Conexotildeesnoacute
Tamanho da rede
Sistemas isolados
Sistema riacutegido
Sistemaflexiacutevel
GUERRAS DE TRANSICcedilAtildeO
OBJETIVOS CONFLITANTES
Natildeo controlar a populaccedilatildeo
Preservaro ambiente
Erradicar a pobreza
Competiccedilatildeo por recursos naturais
NOVA POTEcircNCIA HEGEMOcircNICA
KONDRATIEFFS
Ciclo Tecnologias Datas
1ordm Mecanizaccedilatildeo inicial 1770-1820
2ordm Vapor e ferrovias 1820-1870
3ordm Eletricidade e engenharia pesada 1870-1930
4ordm Produccedilatildeo em massa e Fordismo 1930-1980
5ordm Telemaacutetica 1980 -2030
6ordm 2030-2080
5degCICLO DE KONDRATIEFF
Recuperaccedilatildeo 1980-1992
Expansatildeo 1992-2005
Esgotamento 2005-2018
Crise 2018-2030
bull Anos 60 e 70
bull Guerra fria EUA- Ruacutessia
bull Corrida espacial
bull Guerra no Oriente Meacutedio
bull Volatilidade do preccedilo do petroacuteleo
bull Aumento do terrorismo
bull Guerra no SE Aacutesia
bull Anos 10 e 20
bull Guerra fria EUA- Ruacutessia
bull Corrida espacial
bull Guerra no Oriente Meacutedio
bull Volatilidade do preccedilo do petroacuteleo
bull Aumento do terrorismo
bull Refugiados na Europa
ANALOGIA COM OS ANOS 60 E 70
TENDEcircNCIAS SOCIAIS
bull Novo ciclo de vida
bull Triacuteplice alfabetizaccedilatildeo
bull Trabalholazer em rede
bull Trabalho em movimento
bull Conceito de casa expandida
bull Trecircs faixas de fuso horaacuterio
CRISES POTENCIAIS
Lista inicial de 17 crises
potenciais
Filtro de Probabilidade
Impacto e temporalidade
Mudanccedila da Matriz
energeacutetica
Estados ineficiente e
ineficazes
Terrorismo e conflito cultural
Degelo das Geleiras
Sistema de aposentadoria
Inflaccedilatildeo
Necessidade de investimentos
Aumento de impostos
Perda de Privacidade
Crise Institucional
20 ANOS NO FUTURO
2015-2018 2019-2022 2023-2026 2027-2030
Esgotamento Crise
20156
2020-22
Crise das aposentadorias()Crises econocircmicas()
Rupturas
tecnoloacutegicas ()
2031-2034
Recuperaccedilatildeo
2035-2038
20223
Auge
da Crise
RUPTURAS TECNOLOacuteGICAS (DoD)
bull Nanotecnologia
bull Biotecnologia
bull Medicina avanccedilada
bull Neuroergonomia
bull Guerra de informaccedilatildeo
bull Inteligecircncia artificial
bull Geraccedilatildeo de energia
bull Materiais e manufatura
bull Energia dirigida
bull Tecnologia espacial
bull Roboacutetica
bull Sensores
FY 2017 ndash US$ 718 bilhotildees de PampD (DoD)
+US$ 802 bilhotildees de PampD (natildeo DoD)
REINDUSTRIALIZACcedilAtildeO DOS EUA
Robotizaccedilatildeo
Gaacutes de Xisto (Shale Gas)
PESQUISA E DESENVOLVIMENTO NO MUNDO (FORECAST 2016)
Fonte RampD magazine 2016
RampD as of GDP
Scie
nti
sts
and
engi
nee
rsp
er M
illio
np
eop
le
Construccedilatildeo Civil
Veiacuteculos sem motorista
Mercedes Future Truck 2025 Audi piloted driving
Google driverless car Uber Ford Fusion
ECONOMIA DE BAIXO CARBONO
Fonte European climate foundation 2010
GAacuteS DE XISTO (SHALE GAS)
Table 6 Top 10 countries with technically recoverable shale gas resources
Rank CountryShale gas
(trillion cubic feet)
1 China 1115
2 Argentina 802
3 Algeria 707
4 US1 665 (1161)
5 Canada 573
6 Mexico 545
7 Australia 437
8 South Africa 390
9 Russia 285
10 Brazil 245
World Total 7299 (7795)1 EIA estimates used for ranking order ARI estimates in parentheses
Fonte US Energy information Administration (EIA) 2013
GAacuteS DE XISTO (SHALE GAS)
Fonte US Energy information Administration (EIA) 2013
ELEVADOR ESPACIAL
ELEVADOR ESPACIAL
Obayashi Corp
JPLNASA
Space Lasso 2020ndashNASA
HET (HUMAN ENHANCEMENT TECHNOLOGIES)
Terapia de telocircmeros
asymp+24 de longevidade
HET (HUMAN ENHANCEMENT TECHNOLOGIES)
DBS (Deep Brain Stimulation)
Nanomedicina Bioimpressatildeo
Exoesqueletos biocircnicos
HET (HUMAN ENHANCEMENT TECHNOLOGIES)
OBRIGADO
Pauloalvesfdcorgbr
wwwamazoncom Alta Books Alta Books
CAMPUS ALOYSIO FARIAAv Princesa Diana 760Alphaville Lagoa dos Ingleses34018-006 ndash Nova Lima (MG)
CAMPUS BELO HORIZONTERua Bernardo Guimaratildees 3071Santo Agostinho30140-083 ndash Belo Horizonte (MG)
CAMPUS SAtildeO PAULOAv Dr Cardoso de Melo 1184 Vila Oliacutempia ndash 15ordm andar04548-004 ndash Satildeo Paulo (SP)
CAMPUS RIO DE JANEIROPraia de Botafogo 300 ndash 3ordm andarBotafogo22250-040 ndash Rio de Janeiro (RJ)
ASSOCIADOS REGIONAISA FDC trabalha em parceria com associados regionais em todo o Brasil Consulte o associado mais proacuteximo agrave sua regiatildeo
EXTRAS
ROBOacuteTICA INDUSTRIAL
Robotizaccedilatildeo
Amazon e o KIVA
Baxter da rethink RoboticsChef Robocirc da Moley robotics
Novo Ciclo de Vida
Extensatildeo da Vida para 120 anos
Aposentadoria aos 100 anos
Adolescecircncia ateacute os 40 anos
Maternidade aos 50 anos
Controle da natalidade
Choque de geraccedilotildees
Reforma das aposentadorias
Reforma da educaccedilatildeo
Choque cultural e poliacutetico
Reforma do sistema de RH
Robotizaccedilatildeo da forccedila de trabalho
Robotizaccedilatildeo da forccedila de trabalho
Muitos empregos desaparecem
Tarefas simples
Tarefas perigosas
Tarefas repetitivas
Alguns empregos que sobrevivem
Lidar com gente
Resolver problemas
Ter criatividade
Reforma na educaccedilatildeo
Empregos do Futuro
bull Lidar com Gentendash Marketing
ndash Vendas
ndash Gestatildeo Geral
ndash Gestatildeo de Projetos
ndash Poliacutetica
bull Resolver problemasndash Estrateacutegia
ndash Empreendedorismo
ndash Pesquisa e desenvolvimento
ndash Gestatildeo financeira
bull Ter Criatividadendash Arte
ndash Marketing
ndash Comunicaccedilatildeo
Educaccedilatildeo do Futuro
Fonte Paulo Vicente Alves
Estuacutedio
Virtual
Sala de aula Virtual
Distribuiccedilatildeo da
Informaccedilatildeo
Gamificaccedilatildeo
Sala de Aula Digital
Professor Virtual
Objetos interativos
Sala de Aula2010 2020 2030 2050
Neuro-ergonomia
Interface neural
Uploading
Inteligecircncia hiacutebrida
2040
Gestatildeo por competecircncias
LidarCom gente
Resolver problemas
Ter criatividade
Robotizaccedilatildeo
Auto didatismo
Novo ciclo de Vida
Controle emocional
Determinaccedilatildeo
Empresa dispersa
Lidar com culturas diversas
Trabalho em equipe
Loacutegica argumentativa
Gestatildeo e Direccedilatildeo
Analisar na Complexidade
Decidir no Risco e na incerteza
Implementar na escassez
bull Riscos Brasil
Impeachment e processo no TSE ndash risco poliacutetico
Reformas e ajuste fiscalndash Risco financeiro
Risco Petrobraacutes ndash Risco financeiro
Risco de crise imobiliaacuteria ndash Risco financeiro
Risco de Downgrade ndash Risco Financeiro
Risco de Epidemia de Zika ndash Risco de Sauacutede
DOIS ANOS NO FUTURO
bull Riscos Externos
Reduccedilatildeo do crescimento Chinecircs
Conflito na Siacuteria
Aumento dos juros nos EUA
Crise dos projetos de Xisto nos EUA
Consequumlecircncias do Brexit
Guerras comerciais
DOIS ANOS NO FUTURO
TOP 46 ECONOMIES (90 of World GDP)
Ran
kNation
GDP (bil
US$) Sum
1 China 2127000 1781 1781
2 United States 1856000 1554 3336
3 India 872100 730 4066
4 Japan 493200 413 4479
5 Germany 397900 333 4813
6 Russia 374500 314 5126
7 Brazil 313500 263 5389
8 Indonesia 302800 254 5642
9 United Kingdom 278800 234 5876
10 France 273700 229 6105
11 Mexico 230700 193 6298
12 Italy 222100 186 6484
13 South Korea 192900 162 6646
14 Saudi Arabia 173100 145 6791
15 Spain 169000 142 6932
16 Canada 167400 140 7073
17 Turkey 167000 140 7212
18 Iran 145900 122 7335
19 Australia 118900 100 7434
20 Thailand 116100 097 7531
21 Taiwan 112500 094 7626
22 Egypt 110500 093 7718
23 Nigeria 108900 091 7809
Fonte CIA Jan 2017
Ran
kNation
GDP (bil
US$) Sum
24 Poland 105200 088 7898
25 Pakistan 98820 083 7980
26 Argentina 87940 074 8054
27 Netherlands 86590 073 8127
28 Malaysia 86380 072 8199
29 Philippines 80190 067 8266
30 South Africa 73630 062 8328
31 Colombia 69040 058 8386
32 UAE 66720 056 8441
33 Bangladesh 62840 053 8494
34 Algeria 60940 051 8545
35 Iraq 59670 050 8595
36 Vietnam 59490 050 8645
37 Belgium 50860 043 8687
38 Sweden 49810 042 8729
39 Switzerland 49430 041 8771
40 Singapore 48690 041 8811
41 Venezuela 46860 039 8851
42 Kazakhstan 46070 039 8889
43 Romania 44100 037 8926
44 Chile 43610 037 8963
45 Hong Kong 42740 036 8998
46 Austria 41590 035 9033
Source FDC (2017) with data from CIA (jan 2017)
Top 16 economies (70 of world GDP)
Source FDC (2017) with data from CIA (jan 2017)
Top 26 economies (80 of world GDP)
Classes 2005 2009 2011 2014
A1 1 07 05 05
A2 4 39 4 36
B1 7 9 91 96
B2 12 193 193 208
C1 31 23 256 263
C2 228 232 232
D 33 195 171 152
E 12 18 11 08
Ascensatildeo da Classe Meacutedia
Percentagem das classes sociais
Fonte IBOPE
Sources IBOPE ABEP IBGE and CIA 2015
SOCIAL CLASSES
PopulationAverage gross
annual household income
Equivalent nationGDP per capita
Millions R$ (ABEP 2014) PPP (US$) CIA
A1 05 1 29724000 8123634 MonacoLuxemburg
A2 36 73 15913200 4349112 CanadaNetherlands
B1 96 195 13332000 3643665 JapanIsrael
B2 208 422 5202000 1421718 RumaniaBulgaria
C1 263 534 2785200 761201 El SalvadorAlgeria
C2 232 471 1764000 482105 SyriaHonduras
D 152 309 1284000 350920 MoldovaGhana
E 08 16 878400 240069 YemenCameroon
Professor Paulo Vicente DSc
Sources IBOPE ABEP IBGE and CIA 2015
SOCIAL CLASSES
Class GDP per capita Nation
10210000 Qatar
8550000 Monaco
A1 8123634
7790000 Luxemburg
5480000 Switzerland
5280000 USA
A2 4349112
4330000 Netherlands
3710000 Japan
B1 3643665
3620000 Israel
1440000 Rumania
B2 1421718
1310000 World
Class GDP per capita Nation
1210000 Brazil
980000 China
C1 761201
740000 Ukraine
510000 Syria
C2 482105
480000 Honduras
400000 India
D 350920
350000 Ghana
E 240069
240000 Cameroon
180000 North Korea
40000 Congo
SOCIAL CLASSES
Average gross annual household
income2013
Average gross annual household
income2014
R$ (ABEP 2012) PPP (US$) R$ (ABEP 2014) PPP (US$)
A1 15511200 7269054 29724000 8123634
A2 10101600 4733939 15913200 4349112
B1 5301600 2484503 13332000 3643665
B2 3078000 1442451 5202000 1421718
C1 1849200 866595 2785200 761201
C2 1228800 575856 1764000 482105
D 856800 401524 1284000 350920
E 572400 268245 878400 240069
Conversion=213 Conversion =365
Sources IBOPE ABEP IBGE and CIA 2015
bull Protecionismo
bull Tax and legal System
bull Infra-estrutura de Transporte
bull Energia
bull Educaccedilatildeo
bull RampD
bull Defesa e Seguranccedila
Barreiras ao crescimento
ANAacuteLISES TERRITORIAIS COMPARATIVAS
bull Heartland
bull Land of Opportunity
bull Preserve
bull Frontier
bull Middlelands
bull Challenge
Comparaccedilatildeo do desenvolvimento territorial
Faroeste
Agronegoacutecio
Agroinduacutestria
Meio-Oeste EUA
1860-1880
1880-1910
1910-1940
Centro-OesteBR
Cerrado BR+Aacutefrica SSA
1960-1980
1980-2010
2010-2040
2010-2030
2030-2060
2060-2090
Still lots of space to settle
Source IBGE 2013
Integration With South America
Source IIRSA 2015
2012-2040
2040-2070
Economic expansion
Space elevator
Fonte Heritage Foundation 2016
Fonte Heritage foundation 2016

GAacuteS DE XISTO (SHALE GAS)
Fonte US Energy information Administration (EIA) 2013
ELEVADOR ESPACIAL
ELEVADOR ESPACIAL
Obayashi Corp
JPLNASA
Space Lasso 2020ndashNASA
HET (HUMAN ENHANCEMENT TECHNOLOGIES)
Terapia de telocircmeros
asymp+24 de longevidade
HET (HUMAN ENHANCEMENT TECHNOLOGIES)
DBS (Deep Brain Stimulation)
Nanomedicina Bioimpressatildeo
Exoesqueletos biocircnicos
HET (HUMAN ENHANCEMENT TECHNOLOGIES)
OBRIGADO
Pauloalvesfdcorgbr
wwwamazoncom Alta Books Alta Books
CAMPUS ALOYSIO FARIAAv Princesa Diana 760Alphaville Lagoa dos Ingleses34018-006 ndash Nova Lima (MG)
CAMPUS BELO HORIZONTERua Bernardo Guimaratildees 3071Santo Agostinho30140-083 ndash Belo Horizonte (MG)
CAMPUS SAtildeO PAULOAv Dr Cardoso de Melo 1184 Vila Oliacutempia ndash 15ordm andar04548-004 ndash Satildeo Paulo (SP)
CAMPUS RIO DE JANEIROPraia de Botafogo 300 ndash 3ordm andarBotafogo22250-040 ndash Rio de Janeiro (RJ)
ASSOCIADOS REGIONAISA FDC trabalha em parceria com associados regionais em todo o Brasil Consulte o associado mais proacuteximo agrave sua regiatildeo
EXTRAS
ROBOacuteTICA INDUSTRIAL
Robotizaccedilatildeo
Amazon e o KIVA
Baxter da rethink RoboticsChef Robocirc da Moley robotics
Novo Ciclo de Vida
Extensatildeo da Vida para 120 anos
Aposentadoria aos 100 anos
Adolescecircncia ateacute os 40 anos
Maternidade aos 50 anos
Controle da natalidade
Choque de geraccedilotildees
Reforma das aposentadorias
Reforma da educaccedilatildeo
Choque cultural e poliacutetico
Reforma do sistema de RH
Robotizaccedilatildeo da forccedila de trabalho
Robotizaccedilatildeo da forccedila de trabalho
Muitos empregos desaparecem
Tarefas simples
Tarefas perigosas
Tarefas repetitivas
Alguns empregos que sobrevivem
Lidar com gente
Resolver problemas
Ter criatividade
Reforma na educaccedilatildeo
Empregos do Futuro
bull Lidar com Gentendash Marketing
ndash Vendas
ndash Gestatildeo Geral
ndash Gestatildeo de Projetos
ndash Poliacutetica
bull Resolver problemasndash Estrateacutegia
ndash Empreendedorismo
ndash Pesquisa e desenvolvimento
ndash Gestatildeo financeira
bull Ter Criatividadendash Arte
ndash Marketing
ndash Comunicaccedilatildeo
Educaccedilatildeo do Futuro
Fonte Paulo Vicente Alves
Estuacutedio
Virtual
Sala de aula Virtual
Distribuiccedilatildeo da
Informaccedilatildeo
Gamificaccedilatildeo
Sala de Aula Digital
Professor Virtual
Objetos interativos
Sala de Aula2010 2020 2030 2050
Neuro-ergonomia
Interface neural
Uploading
Inteligecircncia hiacutebrida
2040
Gestatildeo por competecircncias
LidarCom gente
Resolver problemas
Ter criatividade
Robotizaccedilatildeo
Auto didatismo
Novo ciclo de Vida
Controle emocional
Determinaccedilatildeo
Empresa dispersa
Lidar com culturas diversas
Trabalho em equipe
Loacutegica argumentativa
Gestatildeo e Direccedilatildeo
Analisar na Complexidade
Decidir no Risco e na incerteza
Implementar na escassez
bull Riscos Brasil
Impeachment e processo no TSE ndash risco poliacutetico
Reformas e ajuste fiscalndash Risco financeiro
Risco Petrobraacutes ndash Risco financeiro
Risco de crise imobiliaacuteria ndash Risco financeiro
Risco de Downgrade ndash Risco Financeiro
Risco de Epidemia de Zika ndash Risco de Sauacutede
DOIS ANOS NO FUTURO
bull Riscos Externos
Reduccedilatildeo do crescimento Chinecircs
Conflito na Siacuteria
Aumento dos juros nos EUA
Crise dos projetos de Xisto nos EUA
Consequumlecircncias do Brexit
Guerras comerciais
DOIS ANOS NO FUTURO
TOP 46 ECONOMIES (90 of World GDP)
Ran
kNation
GDP (bil
US$) Sum
1 China 2127000 1781 1781
2 United States 1856000 1554 3336
3 India 872100 730 4066
4 Japan 493200 413 4479
5 Germany 397900 333 4813
6 Russia 374500 314 5126
7 Brazil 313500 263 5389
8 Indonesia 302800 254 5642
9 United Kingdom 278800 234 5876
10 France 273700 229 6105
11 Mexico 230700 193 6298
12 Italy 222100 186 6484
13 South Korea 192900 162 6646
14 Saudi Arabia 173100 145 6791
15 Spain 169000 142 6932
16 Canada 167400 140 7073
17 Turkey 167000 140 7212
18 Iran 145900 122 7335
19 Australia 118900 100 7434
20 Thailand 116100 097 7531
21 Taiwan 112500 094 7626
22 Egypt 110500 093 7718
23 Nigeria 108900 091 7809
Fonte CIA Jan 2017
Ran
kNation
GDP (bil
US$) Sum
24 Poland 105200 088 7898
25 Pakistan 98820 083 7980
26 Argentina 87940 074 8054
27 Netherlands 86590 073 8127
28 Malaysia 86380 072 8199
29 Philippines 80190 067 8266
30 South Africa 73630 062 8328
31 Colombia 69040 058 8386
32 UAE 66720 056 8441
33 Bangladesh 62840 053 8494
34 Algeria 60940 051 8545
35 Iraq 59670 050 8595
36 Vietnam 59490 050 8645
37 Belgium 50860 043 8687
38 Sweden 49810 042 8729
39 Switzerland 49430 041 8771
40 Singapore 48690 041 8811
41 Venezuela 46860 039 8851
42 Kazakhstan 46070 039 8889
43 Romania 44100 037 8926
44 Chile 43610 037 8963
45 Hong Kong 42740 036 8998
46 Austria 41590 035 9033
Source FDC (2017) with data from CIA (jan 2017)
Top 16 economies (70 of world GDP)
Source FDC (2017) with data from CIA (jan 2017)
Top 26 economies (80 of world GDP)
Classes 2005 2009 2011 2014
A1 1 07 05 05
A2 4 39 4 36
B1 7 9 91 96
B2 12 193 193 208
C1 31 23 256 263
C2 228 232 232
D 33 195 171 152
E 12 18 11 08
Ascensatildeo da Classe Meacutedia
Percentagem das classes sociais
Fonte IBOPE
Sources IBOPE ABEP IBGE and CIA 2015
SOCIAL CLASSES
PopulationAverage gross
annual household income
Equivalent nationGDP per capita
Millions R$ (ABEP 2014) PPP (US$) CIA
A1 05 1 29724000 8123634 MonacoLuxemburg
A2 36 73 15913200 4349112 CanadaNetherlands
B1 96 195 13332000 3643665 JapanIsrael
B2 208 422 5202000 1421718 RumaniaBulgaria
C1 263 534 2785200 761201 El SalvadorAlgeria
C2 232 471 1764000 482105 SyriaHonduras
D 152 309 1284000 350920 MoldovaGhana
E 08 16 878400 240069 YemenCameroon
Professor Paulo Vicente DSc
Sources IBOPE ABEP IBGE and CIA 2015
SOCIAL CLASSES
Class GDP per capita Nation
10210000 Qatar
8550000 Monaco
A1 8123634
7790000 Luxemburg
5480000 Switzerland
5280000 USA
A2 4349112
4330000 Netherlands
3710000 Japan
B1 3643665
3620000 Israel
1440000 Rumania
B2 1421718
1310000 World
Class GDP per capita Nation
1210000 Brazil
980000 China
C1 761201
740000 Ukraine
510000 Syria
C2 482105
480000 Honduras
400000 India
D 350920
350000 Ghana
E 240069
240000 Cameroon
180000 North Korea
40000 Congo
SOCIAL CLASSES
Average gross annual household
income2013
Average gross annual household
income2014
R$ (ABEP 2012) PPP (US$) R$ (ABEP 2014) PPP (US$)
A1 15511200 7269054 29724000 8123634
A2 10101600 4733939 15913200 4349112
B1 5301600 2484503 13332000 3643665
B2 3078000 1442451 5202000 1421718
C1 1849200 866595 2785200 761201
C2 1228800 575856 1764000 482105
D 856800 401524 1284000 350920
E 572400 268245 878400 240069
Conversion=213 Conversion =365
Sources IBOPE ABEP IBGE and CIA 2015
bull Protecionismo
bull Tax and legal System
bull Infra-estrutura de Transporte
bull Energia
bull Educaccedilatildeo
bull RampD
bull Defesa e Seguranccedila
Barreiras ao crescimento
ANAacuteLISES TERRITORIAIS COMPARATIVAS
bull Heartland
bull Land of Opportunity
bull Preserve
bull Frontier
bull Middlelands
bull Challenge
Comparaccedilatildeo do desenvolvimento territorial
Faroeste
Agronegoacutecio
Agroinduacutestria
Meio-Oeste EUA
1860-1880
1880-1910
1910-1940
Centro-OesteBR
Cerrado BR+Aacutefrica SSA
1960-1980
1980-2010
2010-2040
2010-2030
2030-2060
2060-2090
Still lots of space to settle
Source IBGE 2013
Integration With South America
Source IIRSA 2015
2012-2040
2040-2070
Economic expansion
Space elevator
Fonte Heritage Foundation 2016
Fonte Heritage foundation 2016

ELEVADOR ESPACIAL
ELEVADOR ESPACIAL
Obayashi Corp
JPLNASA
Space Lasso 2020ndashNASA
HET (HUMAN ENHANCEMENT TECHNOLOGIES)
Terapia de telocircmeros
asymp+24 de longevidade
HET (HUMAN ENHANCEMENT TECHNOLOGIES)
DBS (Deep Brain Stimulation)
Nanomedicina Bioimpressatildeo
Exoesqueletos biocircnicos
HET (HUMAN ENHANCEMENT TECHNOLOGIES)
OBRIGADO
Pauloalvesfdcorgbr
wwwamazoncom Alta Books Alta Books
CAMPUS ALOYSIO FARIAAv Princesa Diana 760Alphaville Lagoa dos Ingleses34018-006 ndash Nova Lima (MG)
CAMPUS BELO HORIZONTERua Bernardo Guimaratildees 3071Santo Agostinho30140-083 ndash Belo Horizonte (MG)
CAMPUS SAtildeO PAULOAv Dr Cardoso de Melo 1184 Vila Oliacutempia ndash 15ordm andar04548-004 ndash Satildeo Paulo (SP)
CAMPUS RIO DE JANEIROPraia de Botafogo 300 ndash 3ordm andarBotafogo22250-040 ndash Rio de Janeiro (RJ)
ASSOCIADOS REGIONAISA FDC trabalha em parceria com associados regionais em todo o Brasil Consulte o associado mais proacuteximo agrave sua regiatildeo
EXTRAS
ROBOacuteTICA INDUSTRIAL
Robotizaccedilatildeo
Amazon e o KIVA
Baxter da rethink RoboticsChef Robocirc da Moley robotics
Novo Ciclo de Vida
Extensatildeo da Vida para 120 anos
Aposentadoria aos 100 anos
Adolescecircncia ateacute os 40 anos
Maternidade aos 50 anos
Controle da natalidade
Choque de geraccedilotildees
Reforma das aposentadorias
Reforma da educaccedilatildeo
Choque cultural e poliacutetico
Reforma do sistema de RH
Robotizaccedilatildeo da forccedila de trabalho
Robotizaccedilatildeo da forccedila de trabalho
Muitos empregos desaparecem
Tarefas simples
Tarefas perigosas
Tarefas repetitivas
Alguns empregos que sobrevivem
Lidar com gente
Resolver problemas
Ter criatividade
Reforma na educaccedilatildeo
Empregos do Futuro
bull Lidar com Gentendash Marketing
ndash Vendas
ndash Gestatildeo Geral
ndash Gestatildeo de Projetos
ndash Poliacutetica
bull Resolver problemasndash Estrateacutegia
ndash Empreendedorismo
ndash Pesquisa e desenvolvimento
ndash Gestatildeo financeira
bull Ter Criatividadendash Arte
ndash Marketing
ndash Comunicaccedilatildeo
Educaccedilatildeo do Futuro
Fonte Paulo Vicente Alves
Estuacutedio
Virtual
Sala de aula Virtual
Distribuiccedilatildeo da
Informaccedilatildeo
Gamificaccedilatildeo
Sala de Aula Digital
Professor Virtual
Objetos interativos
Sala de Aula2010 2020 2030 2050
Neuro-ergonomia
Interface neural
Uploading
Inteligecircncia hiacutebrida
2040
Gestatildeo por competecircncias
LidarCom gente
Resolver problemas
Ter criatividade
Robotizaccedilatildeo
Auto didatismo
Novo ciclo de Vida
Controle emocional
Determinaccedilatildeo
Empresa dispersa
Lidar com culturas diversas
Trabalho em equipe
Loacutegica argumentativa
Gestatildeo e Direccedilatildeo
Analisar na Complexidade
Decidir no Risco e na incerteza
Implementar na escassez
bull Riscos Brasil
Impeachment e processo no TSE ndash risco poliacutetico
Reformas e ajuste fiscalndash Risco financeiro
Risco Petrobraacutes ndash Risco financeiro
Risco de crise imobiliaacuteria ndash Risco financeiro
Risco de Downgrade ndash Risco Financeiro
Risco de Epidemia de Zika ndash Risco de Sauacutede
DOIS ANOS NO FUTURO
bull Riscos Externos
Reduccedilatildeo do crescimento Chinecircs
Conflito na Siacuteria
Aumento dos juros nos EUA
Crise dos projetos de Xisto nos EUA
Consequumlecircncias do Brexit
Guerras comerciais
DOIS ANOS NO FUTURO
TOP 46 ECONOMIES (90 of World GDP)
Ran
kNation
GDP (bil
US$) Sum
1 China 2127000 1781 1781
2 United States 1856000 1554 3336
3 India 872100 730 4066
4 Japan 493200 413 4479
5 Germany 397900 333 4813
6 Russia 374500 314 5126
7 Brazil 313500 263 5389
8 Indonesia 302800 254 5642
9 United Kingdom 278800 234 5876
10 France 273700 229 6105
11 Mexico 230700 193 6298
12 Italy 222100 186 6484
13 South Korea 192900 162 6646
14 Saudi Arabia 173100 145 6791
15 Spain 169000 142 6932
16 Canada 167400 140 7073
17 Turkey 167000 140 7212
18 Iran 145900 122 7335
19 Australia 118900 100 7434
20 Thailand 116100 097 7531
21 Taiwan 112500 094 7626
22 Egypt 110500 093 7718
23 Nigeria 108900 091 7809
Fonte CIA Jan 2017
Ran
kNation
GDP (bil
US$) Sum
24 Poland 105200 088 7898
25 Pakistan 98820 083 7980
26 Argentina 87940 074 8054
27 Netherlands 86590 073 8127
28 Malaysia 86380 072 8199
29 Philippines 80190 067 8266
30 South Africa 73630 062 8328
31 Colombia 69040 058 8386
32 UAE 66720 056 8441
33 Bangladesh 62840 053 8494
34 Algeria 60940 051 8545
35 Iraq 59670 050 8595
36 Vietnam 59490 050 8645
37 Belgium 50860 043 8687
38 Sweden 49810 042 8729
39 Switzerland 49430 041 8771
40 Singapore 48690 041 8811
41 Venezuela 46860 039 8851
42 Kazakhstan 46070 039 8889
43 Romania 44100 037 8926
44 Chile 43610 037 8963
45 Hong Kong 42740 036 8998
46 Austria 41590 035 9033
Source FDC (2017) with data from CIA (jan 2017)
Top 16 economies (70 of world GDP)
Source FDC (2017) with data from CIA (jan 2017)
Top 26 economies (80 of world GDP)
Classes 2005 2009 2011 2014
A1 1 07 05 05
A2 4 39 4 36
B1 7 9 91 96
B2 12 193 193 208
C1 31 23 256 263
C2 228 232 232
D 33 195 171 152
E 12 18 11 08
Ascensatildeo da Classe Meacutedia
Percentagem das classes sociais
Fonte IBOPE
Sources IBOPE ABEP IBGE and CIA 2015
SOCIAL CLASSES
PopulationAverage gross
annual household income
Equivalent nationGDP per capita
Millions R$ (ABEP 2014) PPP (US$) CIA
A1 05 1 29724000 8123634 MonacoLuxemburg
A2 36 73 15913200 4349112 CanadaNetherlands
B1 96 195 13332000 3643665 JapanIsrael
B2 208 422 5202000 1421718 RumaniaBulgaria
C1 263 534 2785200 761201 El SalvadorAlgeria
C2 232 471 1764000 482105 SyriaHonduras
D 152 309 1284000 350920 MoldovaGhana
E 08 16 878400 240069 YemenCameroon
Professor Paulo Vicente DSc
Sources IBOPE ABEP IBGE and CIA 2015
SOCIAL CLASSES
Class GDP per capita Nation
10210000 Qatar
8550000 Monaco
A1 8123634
7790000 Luxemburg
5480000 Switzerland
5280000 USA
A2 4349112
4330000 Netherlands
3710000 Japan
B1 3643665
3620000 Israel
1440000 Rumania
B2 1421718
1310000 World
Class GDP per capita Nation
1210000 Brazil
980000 China
C1 761201
740000 Ukraine
510000 Syria
C2 482105
480000 Honduras
400000 India
D 350920
350000 Ghana
E 240069
240000 Cameroon
180000 North Korea
40000 Congo
SOCIAL CLASSES
Average gross annual household
income2013
Average gross annual household
income2014
R$ (ABEP 2012) PPP (US$) R$ (ABEP 2014) PPP (US$)
A1 15511200 7269054 29724000 8123634
A2 10101600 4733939 15913200 4349112
B1 5301600 2484503 13332000 3643665
B2 3078000 1442451 5202000 1421718
C1 1849200 866595 2785200 761201
C2 1228800 575856 1764000 482105
D 856800 401524 1284000 350920
E 572400 268245 878400 240069
Conversion=213 Conversion =365
Sources IBOPE ABEP IBGE and CIA 2015
bull Protecionismo
bull Tax and legal System
bull Infra-estrutura de Transporte
bull Energia
bull Educaccedilatildeo
bull RampD
bull Defesa e Seguranccedila
Barreiras ao crescimento
ANAacuteLISES TERRITORIAIS COMPARATIVAS
bull Heartland
bull Land of Opportunity
bull Preserve
bull Frontier
bull Middlelands
bull Challenge
Comparaccedilatildeo do desenvolvimento territorial
Faroeste
Agronegoacutecio
Agroinduacutestria
Meio-Oeste EUA
1860-1880
1880-1910
1910-1940
Centro-OesteBR
Cerrado BR+Aacutefrica SSA
1960-1980
1980-2010
2010-2040
2010-2030
2030-2060
2060-2090
Still lots of space to settle
Source IBGE 2013
Integration With South America
Source IIRSA 2015
2012-2040
2040-2070
Economic expansion
Space elevator
Fonte Heritage Foundation 2016
Fonte Heritage foundation 2016

ELEVADOR ESPACIAL
Obayashi Corp
JPLNASA
Space Lasso 2020ndashNASA
HET (HUMAN ENHANCEMENT TECHNOLOGIES)
Terapia de telocircmeros
asymp+24 de longevidade
HET (HUMAN ENHANCEMENT TECHNOLOGIES)
DBS (Deep Brain Stimulation)
Nanomedicina Bioimpressatildeo
Exoesqueletos biocircnicos
HET (HUMAN ENHANCEMENT TECHNOLOGIES)
OBRIGADO
Pauloalvesfdcorgbr
wwwamazoncom Alta Books Alta Books
CAMPUS ALOYSIO FARIAAv Princesa Diana 760Alphaville Lagoa dos Ingleses34018-006 ndash Nova Lima (MG)
CAMPUS BELO HORIZONTERua Bernardo Guimaratildees 3071Santo Agostinho30140-083 ndash Belo Horizonte (MG)
CAMPUS SAtildeO PAULOAv Dr Cardoso de Melo 1184 Vila Oliacutempia ndash 15ordm andar04548-004 ndash Satildeo Paulo (SP)
CAMPUS RIO DE JANEIROPraia de Botafogo 300 ndash 3ordm andarBotafogo22250-040 ndash Rio de Janeiro (RJ)
ASSOCIADOS REGIONAISA FDC trabalha em parceria com associados regionais em todo o Brasil Consulte o associado mais proacuteximo agrave sua regiatildeo
EXTRAS
ROBOacuteTICA INDUSTRIAL
Robotizaccedilatildeo
Amazon e o KIVA
Baxter da rethink RoboticsChef Robocirc da Moley robotics
Novo Ciclo de Vida
Extensatildeo da Vida para 120 anos
Aposentadoria aos 100 anos
Adolescecircncia ateacute os 40 anos
Maternidade aos 50 anos
Controle da natalidade
Choque de geraccedilotildees
Reforma das aposentadorias
Reforma da educaccedilatildeo
Choque cultural e poliacutetico
Reforma do sistema de RH
Robotizaccedilatildeo da forccedila de trabalho
Robotizaccedilatildeo da forccedila de trabalho
Muitos empregos desaparecem
Tarefas simples
Tarefas perigosas
Tarefas repetitivas
Alguns empregos que sobrevivem
Lidar com gente
Resolver problemas
Ter criatividade
Reforma na educaccedilatildeo
Empregos do Futuro
bull Lidar com Gentendash Marketing
ndash Vendas
ndash Gestatildeo Geral
ndash Gestatildeo de Projetos
ndash Poliacutetica
bull Resolver problemasndash Estrateacutegia
ndash Empreendedorismo
ndash Pesquisa e desenvolvimento
ndash Gestatildeo financeira
bull Ter Criatividadendash Arte
ndash Marketing
ndash Comunicaccedilatildeo
Educaccedilatildeo do Futuro
Fonte Paulo Vicente Alves
Estuacutedio
Virtual
Sala de aula Virtual
Distribuiccedilatildeo da
Informaccedilatildeo
Gamificaccedilatildeo
Sala de Aula Digital
Professor Virtual
Objetos interativos
Sala de Aula2010 2020 2030 2050
Neuro-ergonomia
Interface neural
Uploading
Inteligecircncia hiacutebrida
2040
Gestatildeo por competecircncias
LidarCom gente
Resolver problemas
Ter criatividade
Robotizaccedilatildeo
Auto didatismo
Novo ciclo de Vida
Controle emocional
Determinaccedilatildeo
Empresa dispersa
Lidar com culturas diversas
Trabalho em equipe
Loacutegica argumentativa
Gestatildeo e Direccedilatildeo
Analisar na Complexidade
Decidir no Risco e na incerteza
Implementar na escassez
bull Riscos Brasil
Impeachment e processo no TSE ndash risco poliacutetico
Reformas e ajuste fiscalndash Risco financeiro
Risco Petrobraacutes ndash Risco financeiro
Risco de crise imobiliaacuteria ndash Risco financeiro
Risco de Downgrade ndash Risco Financeiro
Risco de Epidemia de Zika ndash Risco de Sauacutede
DOIS ANOS NO FUTURO
bull Riscos Externos
Reduccedilatildeo do crescimento Chinecircs
Conflito na Siacuteria
Aumento dos juros nos EUA
Crise dos projetos de Xisto nos EUA
Consequumlecircncias do Brexit
Guerras comerciais
DOIS ANOS NO FUTURO
TOP 46 ECONOMIES (90 of World GDP)
Ran
kNation
GDP (bil
US$) Sum
1 China 2127000 1781 1781
2 United States 1856000 1554 3336
3 India 872100 730 4066
4 Japan 493200 413 4479
5 Germany 397900 333 4813
6 Russia 374500 314 5126
7 Brazil 313500 263 5389
8 Indonesia 302800 254 5642
9 United Kingdom 278800 234 5876
10 France 273700 229 6105
11 Mexico 230700 193 6298
12 Italy 222100 186 6484
13 South Korea 192900 162 6646
14 Saudi Arabia 173100 145 6791
15 Spain 169000 142 6932
16 Canada 167400 140 7073
17 Turkey 167000 140 7212
18 Iran 145900 122 7335
19 Australia 118900 100 7434
20 Thailand 116100 097 7531
21 Taiwan 112500 094 7626
22 Egypt 110500 093 7718
23 Nigeria 108900 091 7809
Fonte CIA Jan 2017
Ran
kNation
GDP (bil
US$) Sum
24 Poland 105200 088 7898
25 Pakistan 98820 083 7980
26 Argentina 87940 074 8054
27 Netherlands 86590 073 8127
28 Malaysia 86380 072 8199
29 Philippines 80190 067 8266
30 South Africa 73630 062 8328
31 Colombia 69040 058 8386
32 UAE 66720 056 8441
33 Bangladesh 62840 053 8494
34 Algeria 60940 051 8545
35 Iraq 59670 050 8595
36 Vietnam 59490 050 8645
37 Belgium 50860 043 8687
38 Sweden 49810 042 8729
39 Switzerland 49430 041 8771
40 Singapore 48690 041 8811
41 Venezuela 46860 039 8851
42 Kazakhstan 46070 039 8889
43 Romania 44100 037 8926
44 Chile 43610 037 8963
45 Hong Kong 42740 036 8998
46 Austria 41590 035 9033
Source FDC (2017) with data from CIA (jan 2017)
Top 16 economies (70 of world GDP)
Source FDC (2017) with data from CIA (jan 2017)
Top 26 economies (80 of world GDP)
Classes 2005 2009 2011 2014
A1 1 07 05 05
A2 4 39 4 36
B1 7 9 91 96
B2 12 193 193 208
C1 31 23 256 263
C2 228 232 232
D 33 195 171 152
E 12 18 11 08
Ascensatildeo da Classe Meacutedia
Percentagem das classes sociais
Fonte IBOPE
Sources IBOPE ABEP IBGE and CIA 2015
SOCIAL CLASSES
PopulationAverage gross
annual household income
Equivalent nationGDP per capita
Millions R$ (ABEP 2014) PPP (US$) CIA
A1 05 1 29724000 8123634 MonacoLuxemburg
A2 36 73 15913200 4349112 CanadaNetherlands
B1 96 195 13332000 3643665 JapanIsrael
B2 208 422 5202000 1421718 RumaniaBulgaria
C1 263 534 2785200 761201 El SalvadorAlgeria
C2 232 471 1764000 482105 SyriaHonduras
D 152 309 1284000 350920 MoldovaGhana
E 08 16 878400 240069 YemenCameroon
Professor Paulo Vicente DSc
Sources IBOPE ABEP IBGE and CIA 2015
SOCIAL CLASSES
Class GDP per capita Nation
10210000 Qatar
8550000 Monaco
A1 8123634
7790000 Luxemburg
5480000 Switzerland
5280000 USA
A2 4349112
4330000 Netherlands
3710000 Japan
B1 3643665
3620000 Israel
1440000 Rumania
B2 1421718
1310000 World
Class GDP per capita Nation
1210000 Brazil
980000 China
C1 761201
740000 Ukraine
510000 Syria
C2 482105
480000 Honduras
400000 India
D 350920
350000 Ghana
E 240069
240000 Cameroon
180000 North Korea
40000 Congo
SOCIAL CLASSES
Average gross annual household
income2013
Average gross annual household
income2014
R$ (ABEP 2012) PPP (US$) R$ (ABEP 2014) PPP (US$)
A1 15511200 7269054 29724000 8123634
A2 10101600 4733939 15913200 4349112
B1 5301600 2484503 13332000 3643665
B2 3078000 1442451 5202000 1421718
C1 1849200 866595 2785200 761201
C2 1228800 575856 1764000 482105
D 856800 401524 1284000 350920
E 572400 268245 878400 240069
Conversion=213 Conversion =365
Sources IBOPE ABEP IBGE and CIA 2015
bull Protecionismo
bull Tax and legal System
bull Infra-estrutura de Transporte
bull Energia
bull Educaccedilatildeo
bull RampD
bull Defesa e Seguranccedila
Barreiras ao crescimento
ANAacuteLISES TERRITORIAIS COMPARATIVAS
bull Heartland
bull Land of Opportunity
bull Preserve
bull Frontier
bull Middlelands
bull Challenge
Comparaccedilatildeo do desenvolvimento territorial
Faroeste
Agronegoacutecio
Agroinduacutestria
Meio-Oeste EUA
1860-1880
1880-1910
1910-1940
Centro-OesteBR
Cerrado BR+Aacutefrica SSA
1960-1980
1980-2010
2010-2040
2010-2030
2030-2060
2060-2090
Still lots of space to settle
Source IBGE 2013
Integration With South America
Source IIRSA 2015
2012-2040
2040-2070
Economic expansion
Space elevator
Fonte Heritage Foundation 2016
Fonte Heritage foundation 2016

HET (HUMAN ENHANCEMENT TECHNOLOGIES)
OBRIGADO
Pauloalvesfdcorgbr
wwwamazoncom Alta Books Alta Books
CAMPUS ALOYSIO FARIAAv Princesa Diana 760Alphaville Lagoa dos Ingleses34018-006 ndash Nova Lima (MG)
CAMPUS BELO HORIZONTERua Bernardo Guimaratildees 3071Santo Agostinho30140-083 ndash Belo Horizonte (MG)
CAMPUS SAtildeO PAULOAv Dr Cardoso de Melo 1184 Vila Oliacutempia ndash 15ordm andar04548-004 ndash Satildeo Paulo (SP)
CAMPUS RIO DE JANEIROPraia de Botafogo 300 ndash 3ordm andarBotafogo22250-040 ndash Rio de Janeiro (RJ)
ASSOCIADOS REGIONAISA FDC trabalha em parceria com associados regionais em todo o Brasil Consulte o associado mais proacuteximo agrave sua regiatildeo
EXTRAS
ROBOacuteTICA INDUSTRIAL
Robotizaccedilatildeo
Amazon e o KIVA
Baxter da rethink RoboticsChef Robocirc da Moley robotics
Novo Ciclo de Vida
Extensatildeo da Vida para 120 anos
Aposentadoria aos 100 anos
Adolescecircncia ateacute os 40 anos
Maternidade aos 50 anos
Controle da natalidade
Choque de geraccedilotildees
Reforma das aposentadorias
Reforma da educaccedilatildeo
Choque cultural e poliacutetico
Reforma do sistema de RH
Robotizaccedilatildeo da forccedila de trabalho
Robotizaccedilatildeo da forccedila de trabalho
Muitos empregos desaparecem
Tarefas simples
Tarefas perigosas
Tarefas repetitivas
Alguns empregos que sobrevivem
Lidar com gente
Resolver problemas
Ter criatividade
Reforma na educaccedilatildeo
Empregos do Futuro
bull Lidar com Gentendash Marketing
ndash Vendas
ndash Gestatildeo Geral
ndash Gestatildeo de Projetos
ndash Poliacutetica
bull Resolver problemasndash Estrateacutegia
ndash Empreendedorismo
ndash Pesquisa e desenvolvimento
ndash Gestatildeo financeira
bull Ter Criatividadendash Arte
ndash Marketing
ndash Comunicaccedilatildeo
Educaccedilatildeo do Futuro
Fonte Paulo Vicente Alves
Estuacutedio
Virtual
Sala de aula Virtual
Distribuiccedilatildeo da
Informaccedilatildeo
Gamificaccedilatildeo
Sala de Aula Digital
Professor Virtual
Objetos interativos
Sala de Aula2010 2020 2030 2050
Neuro-ergonomia
Interface neural
Uploading
Inteligecircncia hiacutebrida
2040
Gestatildeo por competecircncias
LidarCom gente
Resolver problemas
Ter criatividade
Robotizaccedilatildeo
Auto didatismo
Novo ciclo de Vida
Controle emocional
Determinaccedilatildeo
Empresa dispersa
Lidar com culturas diversas
Trabalho em equipe
Loacutegica argumentativa
Gestatildeo e Direccedilatildeo
Analisar na Complexidade
Decidir no Risco e na incerteza
Implementar na escassez
bull Riscos Brasil
Impeachment e processo no TSE ndash risco poliacutetico
Reformas e ajuste fiscalndash Risco financeiro
Risco Petrobraacutes ndash Risco financeiro
Risco de crise imobiliaacuteria ndash Risco financeiro
Risco de Downgrade ndash Risco Financeiro
Risco de Epidemia de Zika ndash Risco de Sauacutede
DOIS ANOS NO FUTURO
bull Riscos Externos
Reduccedilatildeo do crescimento Chinecircs
Conflito na Siacuteria
Aumento dos juros nos EUA
Crise dos projetos de Xisto nos EUA
Consequumlecircncias do Brexit
Guerras comerciais
DOIS ANOS NO FUTURO
TOP 46 ECONOMIES (90 of World GDP)
Ran
kNation
GDP (bil
US$) Sum
1 China 2127000 1781 1781
2 United States 1856000 1554 3336
3 India 872100 730 4066
4 Japan 493200 413 4479
5 Germany 397900 333 4813
6 Russia 374500 314 5126
7 Brazil 313500 263 5389
8 Indonesia 302800 254 5642
9 United Kingdom 278800 234 5876
10 France 273700 229 6105
11 Mexico 230700 193 6298
12 Italy 222100 186 6484
13 South Korea 192900 162 6646
14 Saudi Arabia 173100 145 6791
15 Spain 169000 142 6932
16 Canada 167400 140 7073
17 Turkey 167000 140 7212
18 Iran 145900 122 7335
19 Australia 118900 100 7434
20 Thailand 116100 097 7531
21 Taiwan 112500 094 7626
22 Egypt 110500 093 7718
23 Nigeria 108900 091 7809
Fonte CIA Jan 2017
Ran
kNation
GDP (bil
US$) Sum
24 Poland 105200 088 7898
25 Pakistan 98820 083 7980
26 Argentina 87940 074 8054
27 Netherlands 86590 073 8127
28 Malaysia 86380 072 8199
29 Philippines 80190 067 8266
30 South Africa 73630 062 8328
31 Colombia 69040 058 8386
32 UAE 66720 056 8441
33 Bangladesh 62840 053 8494
34 Algeria 60940 051 8545
35 Iraq 59670 050 8595
36 Vietnam 59490 050 8645
37 Belgium 50860 043 8687
38 Sweden 49810 042 8729
39 Switzerland 49430 041 8771
40 Singapore 48690 041 8811
41 Venezuela 46860 039 8851
42 Kazakhstan 46070 039 8889
43 Romania 44100 037 8926
44 Chile 43610 037 8963
45 Hong Kong 42740 036 8998
46 Austria 41590 035 9033
Source FDC (2017) with data from CIA (jan 2017)
Top 16 economies (70 of world GDP)
Source FDC (2017) with data from CIA (jan 2017)
Top 26 economies (80 of world GDP)
Classes 2005 2009 2011 2014
A1 1 07 05 05
A2 4 39 4 36
B1 7 9 91 96
B2 12 193 193 208
C1 31 23 256 263
C2 228 232 232
D 33 195 171 152
E 12 18 11 08
Ascensatildeo da Classe Meacutedia
Percentagem das classes sociais
Fonte IBOPE
Sources IBOPE ABEP IBGE and CIA 2015
SOCIAL CLASSES
PopulationAverage gross
annual household income
Equivalent nationGDP per capita
Millions R$ (ABEP 2014) PPP (US$) CIA
A1 05 1 29724000 8123634 MonacoLuxemburg
A2 36 73 15913200 4349112 CanadaNetherlands
B1 96 195 13332000 3643665 JapanIsrael
B2 208 422 5202000 1421718 RumaniaBulgaria
C1 263 534 2785200 761201 El SalvadorAlgeria
C2 232 471 1764000 482105 SyriaHonduras
D 152 309 1284000 350920 MoldovaGhana
E 08 16 878400 240069 YemenCameroon
Professor Paulo Vicente DSc
Sources IBOPE ABEP IBGE and CIA 2015
SOCIAL CLASSES
Class GDP per capita Nation
10210000 Qatar
8550000 Monaco
A1 8123634
7790000 Luxemburg
5480000 Switzerland
5280000 USA
A2 4349112
4330000 Netherlands
3710000 Japan
B1 3643665
3620000 Israel
1440000 Rumania
B2 1421718
1310000 World
Class GDP per capita Nation
1210000 Brazil
980000 China
C1 761201
740000 Ukraine
510000 Syria
C2 482105
480000 Honduras
400000 India
D 350920
350000 Ghana
E 240069
240000 Cameroon
180000 North Korea
40000 Congo
SOCIAL CLASSES
Average gross annual household
income2013
Average gross annual household
income2014
R$ (ABEP 2012) PPP (US$) R$ (ABEP 2014) PPP (US$)
A1 15511200 7269054 29724000 8123634
A2 10101600 4733939 15913200 4349112
B1 5301600 2484503 13332000 3643665
B2 3078000 1442451 5202000 1421718
C1 1849200 866595 2785200 761201
C2 1228800 575856 1764000 482105
D 856800 401524 1284000 350920
E 572400 268245 878400 240069
Conversion=213 Conversion =365
Sources IBOPE ABEP IBGE and CIA 2015
bull Protecionismo
bull Tax and legal System
bull Infra-estrutura de Transporte
bull Energia
bull Educaccedilatildeo
bull RampD
bull Defesa e Seguranccedila
Barreiras ao crescimento
ANAacuteLISES TERRITORIAIS COMPARATIVAS
bull Heartland
bull Land of Opportunity
bull Preserve
bull Frontier
bull Middlelands
bull Challenge
Comparaccedilatildeo do desenvolvimento territorial
Faroeste
Agronegoacutecio
Agroinduacutestria
Meio-Oeste EUA
1860-1880
1880-1910
1910-1940
Centro-OesteBR
Cerrado BR+Aacutefrica SSA
1960-1980
1980-2010
2010-2040
2010-2030
2030-2060
2060-2090
Still lots of space to settle
Source IBGE 2013
Integration With South America
Source IIRSA 2015
2012-2040
2040-2070
Economic expansion
Space elevator
Fonte Heritage Foundation 2016
Fonte Heritage foundation 2016

Robotizaccedilatildeo
Amazon e o KIVA
Baxter da rethink RoboticsChef Robocirc da Moley robotics
Novo Ciclo de Vida
Extensatildeo da Vida para 120 anos
Aposentadoria aos 100 anos
Adolescecircncia ateacute os 40 anos
Maternidade aos 50 anos
Controle da natalidade
Choque de geraccedilotildees
Reforma das aposentadorias
Reforma da educaccedilatildeo
Choque cultural e poliacutetico
Reforma do sistema de RH
Robotizaccedilatildeo da forccedila de trabalho
Robotizaccedilatildeo da forccedila de trabalho
Muitos empregos desaparecem
Tarefas simples
Tarefas perigosas
Tarefas repetitivas
Alguns empregos que sobrevivem
Lidar com gente
Resolver problemas
Ter criatividade
Reforma na educaccedilatildeo
Empregos do Futuro
bull Lidar com Gentendash Marketing
ndash Vendas
ndash Gestatildeo Geral
ndash Gestatildeo de Projetos
ndash Poliacutetica
bull Resolver problemasndash Estrateacutegia
ndash Empreendedorismo
ndash Pesquisa e desenvolvimento
ndash Gestatildeo financeira
bull Ter Criatividadendash Arte
ndash Marketing
ndash Comunicaccedilatildeo
Educaccedilatildeo do Futuro
Fonte Paulo Vicente Alves
Estuacutedio
Virtual
Sala de aula Virtual
Distribuiccedilatildeo da
Informaccedilatildeo
Gamificaccedilatildeo
Sala de Aula Digital
Professor Virtual
Objetos interativos
Sala de Aula2010 2020 2030 2050
Neuro-ergonomia
Interface neural
Uploading
Inteligecircncia hiacutebrida
2040
Gestatildeo por competecircncias
LidarCom gente
Resolver problemas
Ter criatividade
Robotizaccedilatildeo
Auto didatismo
Novo ciclo de Vida
Controle emocional
Determinaccedilatildeo
Empresa dispersa
Lidar com culturas diversas
Trabalho em equipe
Loacutegica argumentativa
Gestatildeo e Direccedilatildeo
Analisar na Complexidade
Decidir no Risco e na incerteza
Implementar na escassez
bull Riscos Brasil
Impeachment e processo no TSE ndash risco poliacutetico
Reformas e ajuste fiscalndash Risco financeiro
Risco Petrobraacutes ndash Risco financeiro
Risco de crise imobiliaacuteria ndash Risco financeiro
Risco de Downgrade ndash Risco Financeiro
Risco de Epidemia de Zika ndash Risco de Sauacutede
DOIS ANOS NO FUTURO
bull Riscos Externos
Reduccedilatildeo do crescimento Chinecircs
Conflito na Siacuteria
Aumento dos juros nos EUA
Crise dos projetos de Xisto nos EUA
Consequumlecircncias do Brexit
Guerras comerciais
DOIS ANOS NO FUTURO
TOP 46 ECONOMIES (90 of World GDP)
Ran
kNation
GDP (bil
US$) Sum
1 China 2127000 1781 1781
2 United States 1856000 1554 3336
3 India 872100 730 4066
4 Japan 493200 413 4479
5 Germany 397900 333 4813
6 Russia 374500 314 5126
7 Brazil 313500 263 5389
8 Indonesia 302800 254 5642
9 United Kingdom 278800 234 5876
10 France 273700 229 6105
11 Mexico 230700 193 6298
12 Italy 222100 186 6484
13 South Korea 192900 162 6646
14 Saudi Arabia 173100 145 6791
15 Spain 169000 142 6932
16 Canada 167400 140 7073
17 Turkey 167000 140 7212
18 Iran 145900 122 7335
19 Australia 118900 100 7434
20 Thailand 116100 097 7531
21 Taiwan 112500 094 7626
22 Egypt 110500 093 7718
23 Nigeria 108900 091 7809
Fonte CIA Jan 2017
Ran
kNation
GDP (bil
US$) Sum
24 Poland 105200 088 7898
25 Pakistan 98820 083 7980
26 Argentina 87940 074 8054
27 Netherlands 86590 073 8127
28 Malaysia 86380 072 8199
29 Philippines 80190 067 8266
30 South Africa 73630 062 8328
31 Colombia 69040 058 8386
32 UAE 66720 056 8441
33 Bangladesh 62840 053 8494
34 Algeria 60940 051 8545
35 Iraq 59670 050 8595
36 Vietnam 59490 050 8645
37 Belgium 50860 043 8687
38 Sweden 49810 042 8729
39 Switzerland 49430 041 8771
40 Singapore 48690 041 8811
41 Venezuela 46860 039 8851
42 Kazakhstan 46070 039 8889
43 Romania 44100 037 8926
44 Chile 43610 037 8963
45 Hong Kong 42740 036 8998
46 Austria 41590 035 9033
Source FDC (2017) with data from CIA (jan 2017)
Top 16 economies (70 of world GDP)
Source FDC (2017) with data from CIA (jan 2017)
Top 26 economies (80 of world GDP)
Classes 2005 2009 2011 2014
A1 1 07 05 05
A2 4 39 4 36
B1 7 9 91 96
B2 12 193 193 208
C1 31 23 256 263
C2 228 232 232
D 33 195 171 152
E 12 18 11 08
Ascensatildeo da Classe Meacutedia
Percentagem das classes sociais
Fonte IBOPE
Sources IBOPE ABEP IBGE and CIA 2015
SOCIAL CLASSES
PopulationAverage gross
annual household income
Equivalent nationGDP per capita
Millions R$ (ABEP 2014) PPP (US$) CIA
A1 05 1 29724000 8123634 MonacoLuxemburg
A2 36 73 15913200 4349112 CanadaNetherlands
B1 96 195 13332000 3643665 JapanIsrael
B2 208 422 5202000 1421718 RumaniaBulgaria
C1 263 534 2785200 761201 El SalvadorAlgeria
C2 232 471 1764000 482105 SyriaHonduras
D 152 309 1284000 350920 MoldovaGhana
E 08 16 878400 240069 YemenCameroon
Professor Paulo Vicente DSc
Sources IBOPE ABEP IBGE and CIA 2015
SOCIAL CLASSES
Class GDP per capita Nation
10210000 Qatar
8550000 Monaco
A1 8123634
7790000 Luxemburg
5480000 Switzerland
5280000 USA
A2 4349112
4330000 Netherlands
3710000 Japan
B1 3643665
3620000 Israel
1440000 Rumania
B2 1421718
1310000 World
Class GDP per capita Nation
1210000 Brazil
980000 China
C1 761201
740000 Ukraine
510000 Syria
C2 482105
480000 Honduras
400000 India
D 350920
350000 Ghana
E 240069
240000 Cameroon
180000 North Korea
40000 Congo
SOCIAL CLASSES
Average gross annual household
income2013
Average gross annual household
income2014
R$ (ABEP 2012) PPP (US$) R$ (ABEP 2014) PPP (US$)
A1 15511200 7269054 29724000 8123634
A2 10101600 4733939 15913200 4349112
B1 5301600 2484503 13332000 3643665
B2 3078000 1442451 5202000 1421718
C1 1849200 866595 2785200 761201
C2 1228800 575856 1764000 482105
D 856800 401524 1284000 350920
E 572400 268245 878400 240069
Conversion=213 Conversion =365
Sources IBOPE ABEP IBGE and CIA 2015
bull Protecionismo
bull Tax and legal System
bull Infra-estrutura de Transporte
bull Energia
bull Educaccedilatildeo
bull RampD
bull Defesa e Seguranccedila
Barreiras ao crescimento
ANAacuteLISES TERRITORIAIS COMPARATIVAS
bull Heartland
bull Land of Opportunity
bull Preserve
bull Frontier
bull Middlelands
bull Challenge
Comparaccedilatildeo do desenvolvimento territorial
Faroeste
Agronegoacutecio
Agroinduacutestria
Meio-Oeste EUA
1860-1880
1880-1910
1910-1940
Centro-OesteBR
Cerrado BR+Aacutefrica SSA
1960-1980
1980-2010
2010-2040
2010-2030
2030-2060
2060-2090
Still lots of space to settle
Source IBGE 2013
Integration With South America
Source IIRSA 2015
2012-2040
2040-2070
Economic expansion
Space elevator
Fonte Heritage Foundation 2016
Fonte Heritage foundation 2016

Robotizaccedilatildeo da forccedila de trabalho
Robotizaccedilatildeo da forccedila de trabalho
Muitos empregos desaparecem
Tarefas simples
Tarefas perigosas
Tarefas repetitivas
Alguns empregos que sobrevivem
Lidar com gente
Resolver problemas
Ter criatividade
Reforma na educaccedilatildeo
Empregos do Futuro
bull Lidar com Gentendash Marketing
ndash Vendas
ndash Gestatildeo Geral
ndash Gestatildeo de Projetos
ndash Poliacutetica
bull Resolver problemasndash Estrateacutegia
ndash Empreendedorismo
ndash Pesquisa e desenvolvimento
ndash Gestatildeo financeira
bull Ter Criatividadendash Arte
ndash Marketing
ndash Comunicaccedilatildeo
Educaccedilatildeo do Futuro
Fonte Paulo Vicente Alves
Estuacutedio
Virtual
Sala de aula Virtual
Distribuiccedilatildeo da
Informaccedilatildeo
Gamificaccedilatildeo
Sala de Aula Digital
Professor Virtual
Objetos interativos
Sala de Aula2010 2020 2030 2050
Neuro-ergonomia
Interface neural
Uploading
Inteligecircncia hiacutebrida
2040
Gestatildeo por competecircncias
LidarCom gente
Resolver problemas
Ter criatividade
Robotizaccedilatildeo
Auto didatismo
Novo ciclo de Vida
Controle emocional
Determinaccedilatildeo
Empresa dispersa
Lidar com culturas diversas
Trabalho em equipe
Loacutegica argumentativa
Gestatildeo e Direccedilatildeo
Analisar na Complexidade
Decidir no Risco e na incerteza
Implementar na escassez
bull Riscos Brasil
Impeachment e processo no TSE ndash risco poliacutetico
Reformas e ajuste fiscalndash Risco financeiro
Risco Petrobraacutes ndash Risco financeiro
Risco de crise imobiliaacuteria ndash Risco financeiro
Risco de Downgrade ndash Risco Financeiro
Risco de Epidemia de Zika ndash Risco de Sauacutede
DOIS ANOS NO FUTURO
bull Riscos Externos
Reduccedilatildeo do crescimento Chinecircs
Conflito na Siacuteria
Aumento dos juros nos EUA
Crise dos projetos de Xisto nos EUA
Consequumlecircncias do Brexit
Guerras comerciais
DOIS ANOS NO FUTURO
TOP 46 ECONOMIES (90 of World GDP)
Ran
kNation
GDP (bil
US$) Sum
1 China 2127000 1781 1781
2 United States 1856000 1554 3336
3 India 872100 730 4066
4 Japan 493200 413 4479
5 Germany 397900 333 4813
6 Russia 374500 314 5126
7 Brazil 313500 263 5389
8 Indonesia 302800 254 5642
9 United Kingdom 278800 234 5876
10 France 273700 229 6105
11 Mexico 230700 193 6298
12 Italy 222100 186 6484
13 South Korea 192900 162 6646
14 Saudi Arabia 173100 145 6791
15 Spain 169000 142 6932
16 Canada 167400 140 7073
17 Turkey 167000 140 7212
18 Iran 145900 122 7335
19 Australia 118900 100 7434
20 Thailand 116100 097 7531
21 Taiwan 112500 094 7626
22 Egypt 110500 093 7718
23 Nigeria 108900 091 7809
Fonte CIA Jan 2017
Ran
kNation
GDP (bil
US$) Sum
24 Poland 105200 088 7898
25 Pakistan 98820 083 7980
26 Argentina 87940 074 8054
27 Netherlands 86590 073 8127
28 Malaysia 86380 072 8199
29 Philippines 80190 067 8266
30 South Africa 73630 062 8328
31 Colombia 69040 058 8386
32 UAE 66720 056 8441
33 Bangladesh 62840 053 8494
34 Algeria 60940 051 8545
35 Iraq 59670 050 8595
36 Vietnam 59490 050 8645
37 Belgium 50860 043 8687
38 Sweden 49810 042 8729
39 Switzerland 49430 041 8771
40 Singapore 48690 041 8811
41 Venezuela 46860 039 8851
42 Kazakhstan 46070 039 8889
43 Romania 44100 037 8926
44 Chile 43610 037 8963
45 Hong Kong 42740 036 8998
46 Austria 41590 035 9033
Source FDC (2017) with data from CIA (jan 2017)
Top 16 economies (70 of world GDP)
Source FDC (2017) with data from CIA (jan 2017)
Top 26 economies (80 of world GDP)
Classes 2005 2009 2011 2014
A1 1 07 05 05
A2 4 39 4 36
B1 7 9 91 96
B2 12 193 193 208
C1 31 23 256 263
C2 228 232 232
D 33 195 171 152
E 12 18 11 08
Ascensatildeo da Classe Meacutedia
Percentagem das classes sociais
Fonte IBOPE
Sources IBOPE ABEP IBGE and CIA 2015
SOCIAL CLASSES
PopulationAverage gross
annual household income
Equivalent nationGDP per capita
Millions R$ (ABEP 2014) PPP (US$) CIA
A1 05 1 29724000 8123634 MonacoLuxemburg
A2 36 73 15913200 4349112 CanadaNetherlands
B1 96 195 13332000 3643665 JapanIsrael
B2 208 422 5202000 1421718 RumaniaBulgaria
C1 263 534 2785200 761201 El SalvadorAlgeria
C2 232 471 1764000 482105 SyriaHonduras
D 152 309 1284000 350920 MoldovaGhana
E 08 16 878400 240069 YemenCameroon
Professor Paulo Vicente DSc
Sources IBOPE ABEP IBGE and CIA 2015
SOCIAL CLASSES
Class GDP per capita Nation
10210000 Qatar
8550000 Monaco
A1 8123634
7790000 Luxemburg
5480000 Switzerland
5280000 USA
A2 4349112
4330000 Netherlands
3710000 Japan
B1 3643665
3620000 Israel
1440000 Rumania
B2 1421718
1310000 World
Class GDP per capita Nation
1210000 Brazil
980000 China
C1 761201
740000 Ukraine
510000 Syria
C2 482105
480000 Honduras
400000 India
D 350920
350000 Ghana
E 240069
240000 Cameroon
180000 North Korea
40000 Congo
SOCIAL CLASSES
Average gross annual household
income2013
Average gross annual household
income2014
R$ (ABEP 2012) PPP (US$) R$ (ABEP 2014) PPP (US$)
A1 15511200 7269054 29724000 8123634
A2 10101600 4733939 15913200 4349112
B1 5301600 2484503 13332000 3643665
B2 3078000 1442451 5202000 1421718
C1 1849200 866595 2785200 761201
C2 1228800 575856 1764000 482105
D 856800 401524 1284000 350920
E 572400 268245 878400 240069
Conversion=213 Conversion =365
Sources IBOPE ABEP IBGE and CIA 2015
bull Protecionismo
bull Tax and legal System
bull Infra-estrutura de Transporte
bull Energia
bull Educaccedilatildeo
bull RampD
bull Defesa e Seguranccedila
Barreiras ao crescimento
ANAacuteLISES TERRITORIAIS COMPARATIVAS
bull Heartland
bull Land of Opportunity
bull Preserve
bull Frontier
bull Middlelands
bull Challenge
Comparaccedilatildeo do desenvolvimento territorial
Faroeste
Agronegoacutecio
Agroinduacutestria
Meio-Oeste EUA
1860-1880
1880-1910
1910-1940
Centro-OesteBR
Cerrado BR+Aacutefrica SSA
1960-1980
1980-2010
2010-2040
2010-2030
2030-2060
2060-2090
Still lots of space to settle
Source IBGE 2013
Integration With South America
Source IIRSA 2015
2012-2040
2040-2070
Economic expansion
Space elevator
Fonte Heritage Foundation 2016
Fonte Heritage foundation 2016
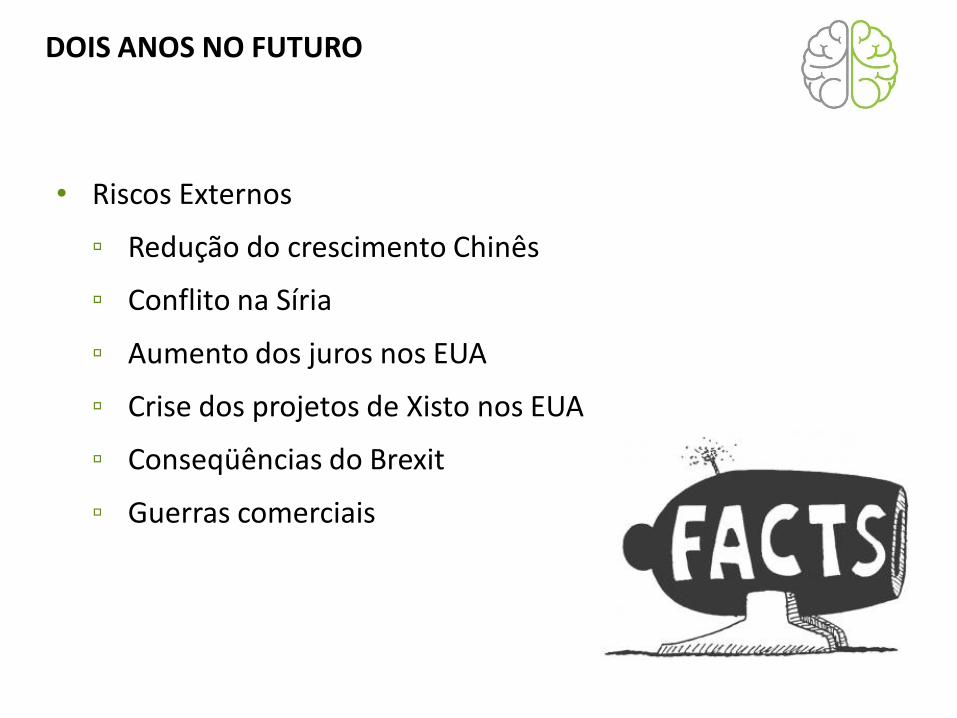

Source FDC (2017) with data from CIA (jan 2017)
Top 26 economies (80 of world GDP)
Classes 2005 2009 2011 2014
A1 1 07 05 05
A2 4 39 4 36
B1 7 9 91 96
B2 12 193 193 208
C1 31 23 256 263
C2 228 232 232
D 33 195 171 152
E 12 18 11 08
Ascensatildeo da Classe Meacutedia
Percentagem das classes sociais
Fonte IBOPE
Sources IBOPE ABEP IBGE and CIA 2015
SOCIAL CLASSES
PopulationAverage gross
annual household income
Equivalent nationGDP per capita
Millions R$ (ABEP 2014) PPP (US$) CIA
A1 05 1 29724000 8123634 MonacoLuxemburg
A2 36 73 15913200 4349112 CanadaNetherlands
B1 96 195 13332000 3643665 JapanIsrael
B2 208 422 5202000 1421718 RumaniaBulgaria
C1 263 534 2785200 761201 El SalvadorAlgeria
C2 232 471 1764000 482105 SyriaHonduras
D 152 309 1284000 350920 MoldovaGhana
E 08 16 878400 240069 YemenCameroon
Professor Paulo Vicente DSc
Sources IBOPE ABEP IBGE and CIA 2015
SOCIAL CLASSES
Class GDP per capita Nation
10210000 Qatar
8550000 Monaco
A1 8123634
7790000 Luxemburg
5480000 Switzerland
5280000 USA
A2 4349112
4330000 Netherlands
3710000 Japan
B1 3643665
3620000 Israel
1440000 Rumania
B2 1421718
1310000 World
Class GDP per capita Nation
1210000 Brazil
980000 China
C1 761201
740000 Ukraine
510000 Syria
C2 482105
480000 Honduras
400000 India
D 350920
350000 Ghana
E 240069
240000 Cameroon
180000 North Korea
40000 Congo
SOCIAL CLASSES
Average gross annual household
income2013
Average gross annual household
income2014
R$ (ABEP 2012) PPP (US$) R$ (ABEP 2014) PPP (US$)
A1 15511200 7269054 29724000 8123634
A2 10101600 4733939 15913200 4349112
B1 5301600 2484503 13332000 3643665
B2 3078000 1442451 5202000 1421718
C1 1849200 866595 2785200 761201
C2 1228800 575856 1764000 482105
D 856800 401524 1284000 350920
E 572400 268245 878400 240069
Conversion=213 Conversion =365
Sources IBOPE ABEP IBGE and CIA 2015
bull Protecionismo
bull Tax and legal System
bull Infra-estrutura de Transporte
bull Energia
bull Educaccedilatildeo
bull RampD
bull Defesa e Seguranccedila
Barreiras ao crescimento
ANAacuteLISES TERRITORIAIS COMPARATIVAS
bull Heartland
bull Land of Opportunity
bull Preserve
bull Frontier
bull Middlelands
bull Challenge
Comparaccedilatildeo do desenvolvimento territorial
Faroeste
Agronegoacutecio
Agroinduacutestria
Meio-Oeste EUA
1860-1880
1880-1910
1910-1940
Centro-OesteBR
Cerrado BR+Aacutefrica SSA
1960-1980
1980-2010
2010-2040
2010-2030
2030-2060
2060-2090
Still lots of space to settle
Source IBGE 2013
Integration With South America
Source IIRSA 2015
2012-2040
2040-2070
Economic expansion
Space elevator
Fonte Heritage Foundation 2016
Fonte Heritage foundation 2016

Sources IBOPE ABEP IBGE and CIA 2015
SOCIAL CLASSES
Class GDP per capita Nation
10210000 Qatar
8550000 Monaco
A1 8123634
7790000 Luxemburg
5480000 Switzerland
5280000 USA
A2 4349112
4330000 Netherlands
3710000 Japan
B1 3643665
3620000 Israel
1440000 Rumania
B2 1421718
1310000 World
Class GDP per capita Nation
1210000 Brazil
980000 China
C1 761201
740000 Ukraine
510000 Syria
C2 482105
480000 Honduras
400000 India
D 350920
350000 Ghana
E 240069
240000 Cameroon
180000 North Korea
40000 Congo
SOCIAL CLASSES
Average gross annual household
income2013
Average gross annual household
income2014
R$ (ABEP 2012) PPP (US$) R$ (ABEP 2014) PPP (US$)
A1 15511200 7269054 29724000 8123634
A2 10101600 4733939 15913200 4349112
B1 5301600 2484503 13332000 3643665
B2 3078000 1442451 5202000 1421718
C1 1849200 866595 2785200 761201
C2 1228800 575856 1764000 482105
D 856800 401524 1284000 350920
E 572400 268245 878400 240069
Conversion=213 Conversion =365
Sources IBOPE ABEP IBGE and CIA 2015
bull Protecionismo
bull Tax and legal System
bull Infra-estrutura de Transporte
bull Energia
bull Educaccedilatildeo
bull RampD
bull Defesa e Seguranccedila
Barreiras ao crescimento
ANAacuteLISES TERRITORIAIS COMPARATIVAS
bull Heartland
bull Land of Opportunity
bull Preserve
bull Frontier
bull Middlelands
bull Challenge
Comparaccedilatildeo do desenvolvimento territorial
Faroeste
Agronegoacutecio
Agroinduacutestria
Meio-Oeste EUA
1860-1880
1880-1910
1910-1940
Centro-OesteBR
Cerrado BR+Aacutefrica SSA
1960-1980
1980-2010
2010-2040
2010-2030
2030-2060
2060-2090
Still lots of space to settle
Source IBGE 2013
Integration With South America
Source IIRSA 2015
2012-2040
2040-2070
Economic expansion
Space elevator
Fonte Heritage Foundation 2016
Fonte Heritage foundation 2016

Still lots of space to settle
Source IBGE 2013
Integration With South America
Source IIRSA 2015
2012-2040
2040-2070
Economic expansion
Space elevator
Fonte Heritage Foundation 2016
Fonte Heritage foundation 2016

Integration With South America
Source IIRSA 2015
2012-2040
2040-2070
Economic expansion
Space elevator
Fonte Heritage Foundation 2016
Fonte Heritage foundation 2016

2012-2040
2040-2070
Economic expansion
Space elevator
Fonte Heritage Foundation 2016
Fonte Heritage foundation 2016

Fonte Heritage Foundation 2016
Fonte Heritage foundation 2016

Fonte Heritage foundation 2016