

Línguas
Páginas
Legal


3Q09 Earnings

Disclaimer
1
This presentation contains statements that are forward-looking within the meaning of Section 27A of the Securities Act of 1933 and Section 21E of the Securities Exchange Act of 1934. Such forward-looking statements are only predictions and are not guarantees of future performance. Investors are cautioned that any such forward-looking statements are and will be, as the case may be, subject to many risks, uncertainties and factors relating to the operations and business environments of General Shopping and its subsidiaries that may cause the actual results of the companies to be materially different from any future results expressed or implied in such forward-looking statements.
This material is published solely for informational purposes and is not to be construed as a solicitation or an offer to buy or sell any securities or related financial instruments and should not be treated as giving investment advice. It is not targeted to the specific investment objectives, financial situation or particular needs of any recipient. No representation or warranty, either express or implied, is provided in relation to the accuracy, completeness or reliability of the information contained herein. This material should not be regarded by recipients as a substitute for the exercise of their own judgment.
Any opinions expressed in this material are expressed as of this date and subject to change without notice and General Shopping is not under the obligation to update or keep current the information contained herein. General Shopping and the respective affiliates, directors, partners and employees accept no liability whatsoever for any loss or damage of any kind arising out of the use of all or any part of this material. You should consult with your own legal, regulatory, tax, business, investment, financial and accounting advisers to the extent that you deem it necessary, and make your own investment, hedging and trading decision (including decisions regarding the suitability of this transaction) based upon your own judgment and advice from such advisers as you deem necessary and not upon any views expressed in this material.

Agenda
2
Financial Performance
Company Overview
Sector Overview

Gross Revenue
Total Gross Revenue (R$ million))
17.822.5
5.9
4.5
3Q08 3Q09 Rent Services
+ 26.4*%
+ 27.3%
22.3
28.4
+ 31.2%
Gross Rent Revenue - 3Q09
4.1% 5.9%1.8%
80.4%
7.8%
Minimum Rent Percentage on SalesOther Rent Key MoneyAdvertising
Gross Services Revenue - 3Q09
20.3%
5.1% 3.4%
71.2%
I Park Energy Wass Management
3(*) Adjusted following statement CPC 06

Total Gross Revenue (R$ million)
52.8 62.9
16.810.7
9M08 9M09 Rent Services
+ 19.3*%
+25.5%
63.5
79.7
+ 56.4%
Gross Rent Revenue - 9M09
7.1%
80.9%
1.9%5.3%4.8%
Minimum Rent Percentage on SalesOther Rent Key MoneyAdvertising
Gross Services Revenue - 9M09
18.5%
6.0% 3.0%
72.5%
I Park Energy Wass Management
4(*) Adjusted following statement CPC 06
Gross Revenue

Performance
5*Average in the period
Original Portfolio and Acquired Portfolio Evolution3Q08 3Q09 Chg. 9M08 9M09 Chg.
GLA* (m²) 93,791 96,791 3.2% 93,791 96,791 3.2%Rent (R$/m²) 114.01 133.21 16.8% 345.91 396.27 14.6%Services (R$/m²) 32.54 40.08 23.2% 92.06 114.81 24.7%Total (R$/m²) 146.55 173.29 18.2% 437.97 511.08 16.7%
Acquired PorfolioGLA* (m²) 77,785 89,563 15.1% 77,785 86,098 10.7%Rent (R$/m²) 91.86 107.75 17.3% 261.04 285.13 9.2%Services (R$/m²) 18.16 22.08 21.6% 27.13 66.14 143.7%Total (R$/m²) 110.02 129.83 18.0% 288.17 351.27 21.9%
Total GSB GLA* (m²) 171,576 186,354 8.6% 171,576 182,889 6.6%Rent (R$/m²) 103.97 120.98 16.4% 307.43 343.95 11.9%Services (R$/m²) 26.02 31.42 20.8% 62.63 91.90 46.7%Total (R$/m²) 129.99 152.40 17.2% 370.06 435.85 17.8%
Original Portfolio

6* Adjusted by Auto Shopping reorganization
Vacancy
2.5%
3.3%
1.9%
4.9% 4.9%
4.0%
3.4%
5.1%
3.7%
3Q08 3Q09 3Q09 Adjusted
Original Portfolio Acquired Portfolio GSB total

Services Revenue - Quarter(R$ million)
3Q08 3.1 0.9 0.2 0.2
3Q09 4.2 1.2 0.3 0.2
Parking Energy Water Management
7
Services Revenue
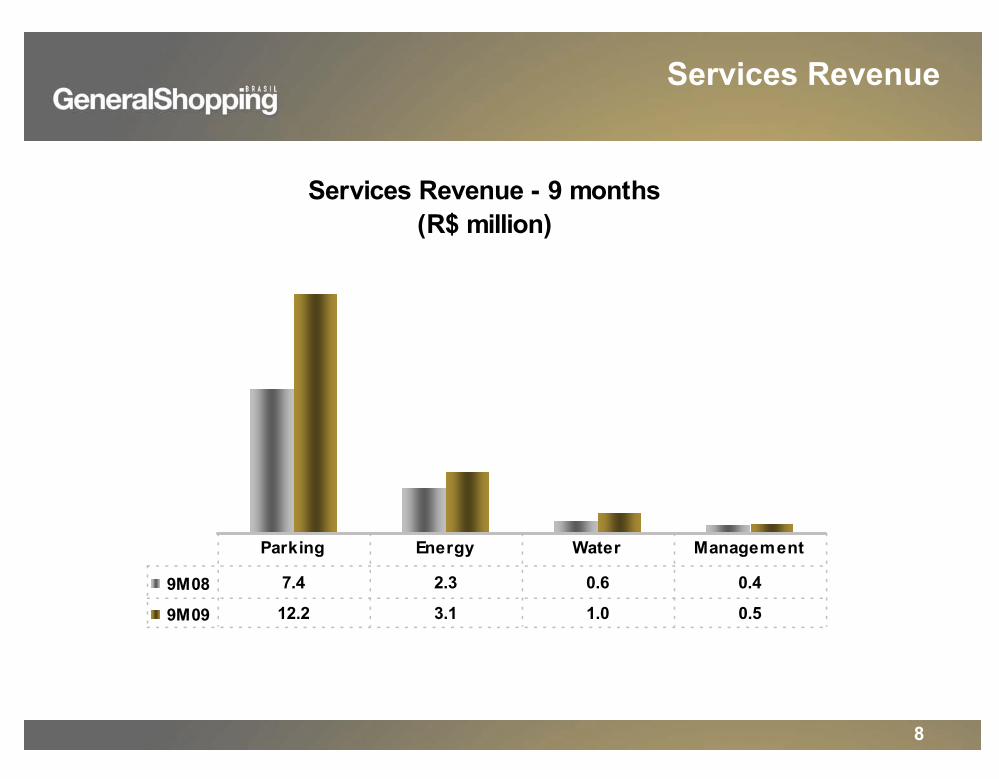
Services Revenue - 9 months(R$ million)
9M08 7.4 2.3 0.6 0.4
9M09 12.2 3.1 1.0 0.5
Parking Energy Water Management
8
Services Revenue

17.121.0
83.2%
81.7%
3Q08 3Q09
14.918.6
72.5%
72.5%
3Q08 3Q09
9
Consolidated NOI (R$ MM) and Margin Adjusted EBITDA (R$ MM) and Margin
Adjusted Net Income (R$ MM) Adjusted FFO (R$ MM)
Performance Indicators
-8,3
4.2
3Q08 3Q09
-5.5
6.5
3Q08 3Q09

48.757.7
80.8%83.4%
9M08 9M09
42.651.0
71.4%72.9%
9M08 9M09
18.2
(8.2)
9M08 9M09
1.2
25.1
9M08 9M09
10
Performance Indicators
Consolidated NOI (R$ MM) and Margin Adjusted EBITDA (R$ MM) and Margin
Adjusted Net Income (R$ MM) Adjusted FFO (R$ MM)

Indebtedness Breakdown16.8%
3.7%
55.1%
24.4%
CDI rate IGP-M rate TR rate Fixed
322.1
16.5
Cash Debt
Cash X Debt(R$ million)
11
Cash X Debt
R$ Million 2009 2010 2011 2012 After 2012 Total %CCI 3.0 15.9 18.6 21.6 196.8 255.9 79.4%Other Banks 53.3 8.3 3.4 1.2 0.0 66.2 20.6%Total 56.3 24.2 22.0 22.8 196.8 322.1 100.0%
Amortization Schedule

Company Overview

Differentials
13
Market-driven company with retail approachMarket-driven company with retail approach
B and C consumption classes as target marketB and C consumption classes as target market
Innovative complementary servicesInnovative complementary services
Majority ownership: 82.8% average interestMajority ownership: 82.8% average interest

14
Own GLA(1)
35.3%
24.1%9.3%
31.3%
Concluded Greenfields
AcquisitionsExpansions
Greenfieldsunder Development
Consolidation
Shopping center acquisitions
GreenfieldsConcept and development of new shopping centers
Expansions
Interest stake increase in assetsGLA expansion of the original portfolioImplementation of mixed-use projects− Synergies + Profitability
Turnaround
Remodeling and retrofit of tenant mixInnovation in complementary services
(1) Considering current shopping centers, expansions and announced greenfields.
Diversified Growth Strategy

General Shopping Brasil
15
Poli Shopping 50.0% 4,527 2,264 52 15,400Internacional Shopping 100.0% 75,958 75,958 292 -Auto Shopping 100.0% 11,477 11,477 80 -Santana Parque Shopping 50.0% 26,538 13,269 176 -Shopping Light 50.1% 14,140 7,092 134 -Suzano Shopping 100.0% 19,583 19,583 174 -Cascavel JL Shopping 85.5% 8,877 7,590 80 2,953Top Center Shopping 100.0% 6,166 6,166 55 -Prudente Parque Shopping 100.0% 10,276 10,276 56 -Americanas Osasco 100.0% 3,218 3,218 19 -Shopping do Vale 84.4% 16,487 13,913 94 -Shopping Unimart 100.0% 10,233 10,233 91 -Outlet Premium São Paulo(1) 30.0% 17,716 5,315 90 -
82.8% 225,196 186,354 1,393 18,353
Convention Center 100.0% 25,730 25,730Sulacap 90.0% 32,000 28,800São Bernardo Project 50.0% 30,000 15,000Barueri Project 96.0% 25,000 24,000
83.0% 112,730 93,530
Nº Stores
Own GLA Expansion (m2)
Greenfield InterestTotal GLA (m²)
Own GLA(m²)
Shopping Center InterestTotal GLA (m²)
Own GLA(m²)
(1) Considering a call option to acquire an additional 20.0% stake

16
Dominant Player in São Paulo
Total GLA (m2)No. of storesVisitors/year (mm)
11,47780
NA
9
75,958292
23.5
1
Total GLA (m2)No. of storesVisitors/year (mm)
13
17,71690
NA
Total GLA (m2)No. of storesVisitors/year (mm)
14,140134
12.0
7
Total GLA (m2)No. of storesVisitors/year (mm)
19,5831749.0
6
Total GLA (m2)No. of storesVisitors/year (mm)
5
26,538176NA
Total GLA (m2)No. of storesVisitors/year (mm)
Total GLA (m2)No. of storesVisitors/year (mm)
15
25,000 NA NA
(1)
14
25,730NANA
Total GLA (m2)No. of storesVisitors/year (mm)
4
3,21819
1.5
Total GLA (m2)No. of storesVisitors/year (mm)
2
6,16655
4.0
Total GLA (m2)No. of storesVisitors/year (mm)
4,52752
6.0
3
Total GLA (m2)No. of storesVisitors/year (mm)
8
10,27656
4.0
Total GLA (m2)No. of storesVisitors/year (mm)
12
10,23391
6.48
Total GLA (m2)No. of storesVisitors/year (mm)
17
30,000NANA
Total GLA (m2)No. of storesVisitors/year (mm) SP
(1)
São Paulo state30.9% of GDP32.6% of retail market
(1) Estimated

17
Focus on the Southeastern and Southern Regions
Shopping centers in operation1. Internacional Shopping Guarulhos2. Top Center3. Poli Shopping4. Americanas Osasco5. Santana Parque6. Suzano Shopping7. Shopping Light8. Prudente Parque Shopping9. Auto Shopping10. Shopping do Vale11. Cascavel JL Shopping12. Shopping Unimart13. Outlet Premium São PauloGreenfields14. Convention Center15. Barueri Project16. Sulacap Project18. São Bernardo Project
16,48794
2.0
Total GLA (m2)No. of storesVisitors/year (mm)
10
11
8,87780
3.4
Total GLA (m2)No. of storesVisitors/year (mm)
32,000165NA
(1)
(1)
16
Total GLA (m2)No. of storesVisitors/year (mm)
RJ
RS
PR
RegionSoutheast + South
GDP Retail mkt73.1% 73.9%
(1) Estimated

18Services currently provided to the mall Potential services / currently being implemented
*
Atlas
Energy
Wass
I Park
GSB Adm
ASG Adm
Stake Held
100%
100%
100%
100%
100%
ISG
Auto
Poli
Light
Santana
Cascavel
PrudenteParque
Americ.Osasco
Top Center
Do Vale
Unimart
Suzano
Increasing Complementary Services Activities
Management Parking Water Energy
* Partial
► Responsible for planning the energy supply and leasing of the equipment for its transmission and distribution
► Engaged in water supply planning and its treatment and distribution
► Controls and manages parking lots
► Manages operations of shopping centers
► Manages the operations of Auto Shopping
Outlet Premium São Paulo

19
Sustainability
Use of energy sources approved by the government’s Program of Incentives to Alternative Sources of Electric EnergyWater supply management
Wastewater use for air conditioning, gardens and toiletsLicensed wells
Garbage recycling
Fluorescent light bulb recycling
Natural lighting for architectural projects
Reforesting programs

(1): On 09/30/09(2): On 11/13/09
Stock Performance(100 base on 12/31/2008)
65.325 ( 2)
61.517 ( 1)
R $ 8.26 ( 2)
R $ 7.00 ( 1)
6 0 .0
110 .0
16 0 .0
2 10 .0
2 6 0 .0
3 10 .0
3 6 0 .0
4 10 .0
J a n - 0 9 F e b - 0 9 M a r - 0 9 A p r - 0 9 M a y - 0 9 J u n - 0 9 J u l - 0 9 A u g - 0 9 Se p - 0 9 O c t - 0 9 N o v - 0 9
Ibovespa GSHP3
GSH P 3: 207.02%( 1) ; 262.28%( 2)
Ibo vespa: 52.86%( 1) ; 62.32%( 2)
20
Stock Performance

21
40.59%
59.41%
Free float Controlling Stake
No. sharesControlling shareholder 29,990,000Free float 20,490,600Total 50,480,600
Market-making activities (through broker Ágora Senior) since October/07
Listed since July 2007
Shareholders

Sector Overview

Types of Shopping Malls in USA
The Brazilian shopping center sector presents ample room for growth
Souce: ABRASCE
Low Sector Penetration
11 8 8
637
81204
40
1,872
M exico Spain Brazil USA
GLA GLA / 1.000
Area and Area/Inhabitant by Countries
Neighborhood Center
Community Center
Lifestyle Center
Thematic Center
Outlet Center
Power Center
Super Regional Center
Regional Center
23

Unemployment Rate Evolution - Selected Months (%)
7.7%
7.7%
9.0%
10.0%
Decem
ber (
*)Ja
nuary
Februa
ry
March
April
May
June July
Augus
tSep
tembe
r
2009 2008 2007 2006
24
Economic Indicators
(*) Year beforeSource: PME-IBGEPrepared by GSB

25
Real Income (1) - Recent Evolution (R$ billion)
29.0
28.2
25.8
24.6
December (year
bef ore)
January February March April May June July August Sept ember
2009 2008 2007 2006
Economic Indicators
Source: PME-IBGE; Table prepared by GSB(1) Based on the employed population and average income of the employed population

26
Consumer Expectations Survey(quarterly moving average: Sept/05=100)
90.00
95.00
100.00
105.00
110.00
115.00
120.00
Se p -
0 8
O c t -
0 8
N o v -
0 8
D e c -
0 8
J a n -
0 9
F e b -
0 9
M a r -
0 9
A p r -
0 9
M a y -
0 9
J u n -
0 9
J u l -
0 9
A u g -
0 9
Se p -
0 9
O c t -
0 9
C onsumer C onf id ence Index Present Sit uat ion Exp ect at ions
Economic Indicators
Source: FGVPrepared by GSB

27
-10.0
-5.0
0.0
5.0
10.0
15.0
20.0
25.0
Sep- 0 8 12 .4 15.9 17.1 2 1.1 2 1.8 2 1.3
Oct - 0 8 19 .3 7.2 12 .0 17.5 8 .9 7.3
N ov- 0 8 18 .0 ( 2 .4 ) 2 .8 17.3 1.2 10 .9
D ec- 0 8 13 .5 0 .6 3 .3 18 .9 5.6 5.3
Jan- 0 9 16 .5 2 .1 5.4 13 .8 6 .0 5.6
Feb - 0 9 14 .6 0 .1 ( 2 .7) 17.0 4 .5 4 .9
M ar- 0 9 7.9 ( 1.0 ) 0 .3 2 1.1 8 .7 11.7
A pr- 0 9 2 2 .1 ( 3 .0 ) ( 9 .5) 18 .5 1.6 1.1
M ay- 0 9 12 .3 ( 4 .1) ( 6 .3 ) 17.7 4 .2 2 .7
Jun- 0 9 12 .3 6 .5 ( 1.2 ) 19 .9 10 .1 6 .0
Jul- 0 9 13 .1 4 .8 ( 0 .1) 2 1.2 1.0 9 .0
A ug- 0 9 11.4 0 .5 ( 0 .2 ) 2 2 .5 5.2 0 .0
Sep - 0 9 12 .9 ( 0 .2 ) 0 .1 14 .8 8 .1 8 .3
Supermarket s and hypermarket s
Fabrics, clo t hing and f oo t wear
Furnit ure and whit e/ durab le
goods
Pharmaceut ical, med ical, o rt hoped ic
and cosmet ics To t al A B R A SC E
Retail Growth
Retail Industry: Monthly Change (VS Same Year-Ago Period) of Nominal Revenue (Sep/08-Sep/09)
Source: PMC-IBGE and ABRASCETable prepared by GSB

28
-25.0
-15.0
-5.0
5.0
15.0
25.0
35.0
Sep- 0 8 3 4 .5 14 .5 2 3 .4 3 1.7 2 1.8 2 1.3
Oct - 0 8 2 2 .9 10 .9 18 .9 ( 5.2 ) 8 .9 7.3
N ov- 0 8 8 .1 12 .7 14 .0 ( 18 .9 ) 1.2 10 .9
D ec- 0 8 19 .1 16 .8 9 .8 ( 5.2 ) 5.6 5.3
Jan- 0 9 4 .9 2 7.1 13 .2 ( 3 .7) 6 .0 5.6
Feb - 0 9 4 .0 4 .9 2 0 .0 ( 4 .6 ) 4 .5 4 .9
M ar- 0 9 11.8 14 .2 13 .7 11.1 8 .7 11.7
A pr- 0 9 18 .2 3 .4 2 5.9 ( 16 .0 ) 1.6 1.1
M ay- 0 9 ( 0 .2 ) 11.2 2 0 .7 ( 2 .1) 4 .2 2 .7
Jun- 0 9 16 .2 8 .6 2 2 .0 11.8 10 .1 6 .0
Jul- 0 9 5.7 17.9 18 .1 ( 11.8 ) 1.0 9 .0
A ug- 0 9 ( 1.3 ) 16 .8 16 .3 1.0 5.2 0 .0
Sep - 0 9 ( 2 .5) 15.8 15.7 10 .3 8 .1 8 .3
Of f ice supp lies and equipment , personal
comput ers and
B ooks, newspapers, magazines and
st at ionery
Ot her personal and domest ic p roduct s
V ehicles, mot orcycles and
aut opart sTo t al A B R A SC E
Retail Growth
Retail Industry: Monthly Change (VS Same Year-Ago Period) of Nominal Revenue (Sep/08-Sep/09)
Source: PMC-IBGE and ABRASCETable prepared by GSB

29
GSB INVESTOR RELATIONS
Alessandro Poli VeroneziInvestor Relations Officer
Marcio SniokaInvestor Relations Manager
55 11 3159-5100
www.generalshopping.com.br
Contacts