Redalyc.Water deficit and water surplus maps for Brazil, based … · hidrológico e para projetos...
16
Ambiente & Água - An Interdisciplinary Journal of Applied Science ISSN: 1980-993X [email protected] Universidade de Taubaté Brasil Sentelhas, Paulo C.; dos Santos, Dayana L.; Machado, Ronalton E. Water deficit and water surplus maps for Brazil, based on FAO Penman-Monteith potential evapotranspiration Ambiente & Água - An Interdisciplinary Journal of Applied Science, vol. 3, núm. 3, dezembro, 2008, pp. 28-42 Universidade de Taubaté Taubaté, Brasil Available in: http://www.redalyc.org/articulo.oa?id=92830303 How to cite Complete issue More information about this article Journal's homepage in redalyc.org Scientific Information System Network of Scientific Journals from Latin America, the Caribbean, Spain and Portugal Non-profit academic project, developed under the open access initiative
-
Upload
phungkhanh -
Category
Documents
-
view
213 -
download
0
Transcript of Redalyc.Water deficit and water surplus maps for Brazil, based … · hidrológico e para projetos...
Ambiente & Água - An Interdisciplinary Journal
of Applied Science
ISSN: 1980-993X
Universidade de Taubaté
Brasil
Sentelhas, Paulo C.; dos Santos, Dayana L.; Machado, Ronalton E.
Water deficit and water surplus maps for Brazil, based on FAO Penman-Monteith potential
evapotranspiration
Ambiente & Água - An Interdisciplinary Journal of Applied Science, vol. 3, núm. 3, dezembro, 2008, pp.
28-42
Universidade de Taubaté
Taubaté, Brasil
Available in: http://www.redalyc.org/articulo.oa?id=92830303
How to cite
Complete issue
More information about this article
Journal's homepage in redalyc.org
Scientific Information System
Network of Scientific Journals from Latin America, the Caribbean, Spain and Portugal
Non-profit academic project, developed under the open access initiative
ISSN = 1980-993X – www.agro.unitau.br/ambi-agua E-mail: [email protected]; Tel.: (12) 3625-4116
Revista Ambiente e Água – An Interdisciplinary Journal of Applied Science: v. 3, n. 3, 2008.
Water deficit and water surplus maps for Brazil, based on FAO Penman-Monteith potential evapotranspiration
Paulo C. Sentelhas1; Dayana L. dos Santos2; Ronalton E. Machado3
1Departamento de Ciências Exatas, ESALQ/USP - Caixa Postal 9, 13418-900, Piracicaba, SP, Brasil
E-mail: [email protected]; Bolsista do CNPq 2Aluna do curso de Engenharia Agronômica - ESALQ/USP
E-mail: [email protected] 3Departamento de Engenharia Ambiental, Escola de Engenharia de Piracicaba, FUMEP
E-mail: [email protected] ABSTRACT
The climatological water balance (CWB) proposed by Thornthwaite and Mather (1957) is a useful tool for agricultural planning. This method requires the soil water holding capacity (SWHC), rainfall (R) and potential evapotranspiration (PET) data as input. Among the methods used to estimate PET, the one proposed by Thornthwaite (1948) is the simplest and the most used in Brazil, however it presents limitations of use, which is caused by its empirical relationships. When Thornthwaite PET method is used into the CWB, the errors associated to PET are transferred to the output variables, mainly water deficit (WD) and water surplus (WS). As all maps of WD and WS for Brazil are based on Thornthwaite PET, the objective of this study was to produce new maps of these variables considering Penman-Monteith PET. For this purpose, monthly normal climate data base (1961-1990) from Brazilian Meteorological Service (INMET), with 219 locations in all country, was used. PET data were estimated by Thornthwaite (TH) and FAO Penman-Monteith (PM) methods. PET, from both methods, and R data were used to estimate the CWB for a SWHC of 100 mm, having as results actual ET (AET), WD and WS. Results obtained with PET from the two methods were compared by regression analysis. The results showed that TH method underestimated annual PM PET by 13% in 84% of the places. Such underestimation also led to AET and WD underestimations of 7% (in 69% of places) and 40% (in 83% of places), respectively. For WS, the use of TH PET data in the CWB resulted in overestimations of about 80% in 78% of places. The differences observed in the CWB variables resulted in changes in the maps of WD and WS for Brazil. These new maps, based on PM PET, provide more accurate information, mainly for agricultural and hydrological planning and irrigation and drainage projects purposes. Keywords: climatological water balance; agricultural planning; irrigation projects.
Mapas de deficiência hídrica e excedente hídrico para o Brasil, baseados na evapotranspiração potencial de Penman-Monteith - FAO
RESUMO
O balanço hídrico climatológico (BHC) proposto por Thornthwaite e Mather (1957) é uma ferramenta muito útil para o planejamento agrícola. Esse método requer como variáveis de entrada a capacidade de água disponível do solo (CAD), a chuva (P) e a evapotranspiração potencial (ETP). A chuva é uma variável facilmente mensurável e a CAD pode ser determinada de forma relativamente simples conhecendo-se as características físicas do solo.
SENTELHAS, P. C.; SANTOS, D. L.; MACHADO, R. E. Water deficit and water surplus maps for Brazil, based on FAO Penman-Monteith potential evapotranspiration. Revista Ambi-Água, Taubaté, v. 3, n. 3, p. 28-42, 2008.
29
No entanto, a ETP necessita ser estimada com base em dados meteorológicos. Dentre os métodos utilizados para a estimativa da ETP, o proposto por Thornthwaite (1948) é o mais simples e o mais empregado no Brasil, exigindo apenas dados de temperatura. Entretanto, esse método apresenta limitações de uso, já que se baseia apenas em relações empíricas. Quando o BHC é estimado com a ETP calculada pelo método de Thornthwaite, os erros dessa variável são transferidos para as outras variáveis, especialmente para a DEF e o EXC. Como todos os mapas de DEF e EXC para o Brasil são baseados nos dados estimados com a ETP de Thornthwaite, o objetivo deste trabalho foi gerar novos mapas dessas variáveis considerando-se a ETP estimada pelo método Penman-Monteith, o qual é o método de referência adotado pela FAO. Para tanto, foram utilizados dados climáticos normais (1961-1990) do Instituto Nacional de Meteorologia (INMET), com 219 localidades em todo o país. Esses dados foram empregados na estimativa da ETP pelos métodos de Thornthwaite - TH e FAO Penman-Monteith – PM. Dados da ETP, estimada por ambos os métodos, e de chuva, foram usados para a estimativa do BHC para uma CAD de 100 mm, tendo como variáveis resultantes a evapotranspiração real (ETR), DEF e EXC, que foram comparadas por análise de regressão. Os resultados mostraram que o método de TH subestimou a ETP anual, em relação ao método de PM, em 13% em 84% das localidades. Tal subestimativa levou a subestimativas também da ETR e da DEF, respectivamente de 7% (em 69% dos locais) e 40% (em 83% dos locais). Para o EXC, o uso da ETP de TH resultou em superestimativas médias da ordem de 80% em 78% dos locais analisados. As diferenças observadas nas variáveis do BHC quando a ETP foi estimada por diferentes métodos resultou em mudanças substanciais nos mapas de DEF e EXC para o Brasil. Esses novos mapas, baseados na ETP estimada pelo método de PM, fornecem informações mais acuradas, especialmente para fins de planejamento agrícola e hidrológico e para projetos de irrigação. Palavras-chave: balanço hídrico climatológico; planejamento agrícola; projetos de irrigação. INTRODUCTION
The climatological water balance (CWB) proposed by Thornthwaite and Mather (1955, 1957) is a useful tool for agricultural planning, being used as a method to determine soil water storage (SWS), actual evapotranspiration (AET), water deficit (WD) and water surplus (WS) in a regional level. SWS is a function of the soil type and water balance (Rain – Evapotranspiration). AET is the evapotranspiration from a surface covered with short grass, controlled by weather conditions and current available soil water. This variable is equal or smaller than potential evapotranspiration (PET), which is controlled only by climatic variables. WD represents the water that the plant surface did not use during the period, in function of the shortage of water in the soil. By definition, WD is calculated by the difference between PET and AET. Finally, WS is the amount of water not retained by the soil when rainfall is greater than PET and soil moisture is at the field capacity. This surplus will be drained, recharging the water table.
Originally, CWB was proposed by Thornthwaite to rationalize the climatic classification, but with time its use in agriculture increased, mainly for agricultural planning purposes, like agroclimatic zoning and irrigation demand projects (Pereira et al., 2002a; Black, 2007).
Thornthwaite and Mather (1955, 1957) method requires the soil water holding capacity (SWHC), rainfall (R) and potential evapotranspiration (PET) data as input. Rainfall is an easy measurable variable and SWHC can be determined knowing physical soil properties, but normally ranges from 50 to 300 mm, depending on the soil type and depth. On the other hand,
SENTELHAS, P. C.; SANTOS, D. L.; MACHADO, R. E. Water deficit and water surplus maps for Brazil, based on FAO Penman-Monteith potential evapotranspiration. Revista Ambi-Água, Taubaté, v. 3, n. 3, p. 28-42, 2008.
30
PET, which represents the amount of water evaporated and transpired in a given time by a short grass crop, completely shading the ground, of uniform height and with adequate water status in the soil profile (Camargo and Camargo, 2000), must be estimated from standard weather data. Among the several methods used to estimate PET, the one proposed by Thornthwaite (1948) and revised by Thornthwaite and Mather (1955, 1957) is the simplest and the most used in Brazil, since it just requires temperature data (Camargo, 1962; Camargo, 1978; Camargo and Camargo, 2000; Pereira et al., 2002a). However, this method presents limitations of use, which is related with its empirical relationships, underestimating PET in dry climates and overestimating it in super-humid conditions (Hashemi and Habibian, 1979; Camargo and Sentelhas, 1997; Camargo et al., 1999). When Thornthwaite´s PET method is used in the CWB, the errors associated to PET estimates are expected to be transferred to the other variables, mainly WD and WS, important parameters for agroclimatic crop zoning.
The used of more accurate PET methods are normally limited by the availability of weather data (Pereira et al., 2002a). Where a complete weather data set is available, the best way to estimate PET is by Penman-Monteith method, which is recognized by the scientific community and FAO - Irrigation and Drainage expert team as the most precise and accurate (Allen et al., 1998). This method is universal, it can be calculated in different time intervals (Back, 2007) and presents a high performance in a wide range of climatic conditions, as reported by Allen (1986), Allen et al. (1989), Pereira (1998), Sentelhas (1998), Pereira et al. (2002b), and Medeiros et al. (2003), not requiring calibration or adjustments.
The objectives of this study was to compare monthly PET estimated by Thornthwaite and Penman-Monteith methods, and to produce new maps of these variables based on PET estimated by FAO Penman-Monteith method. MATERIAL AND METHODS
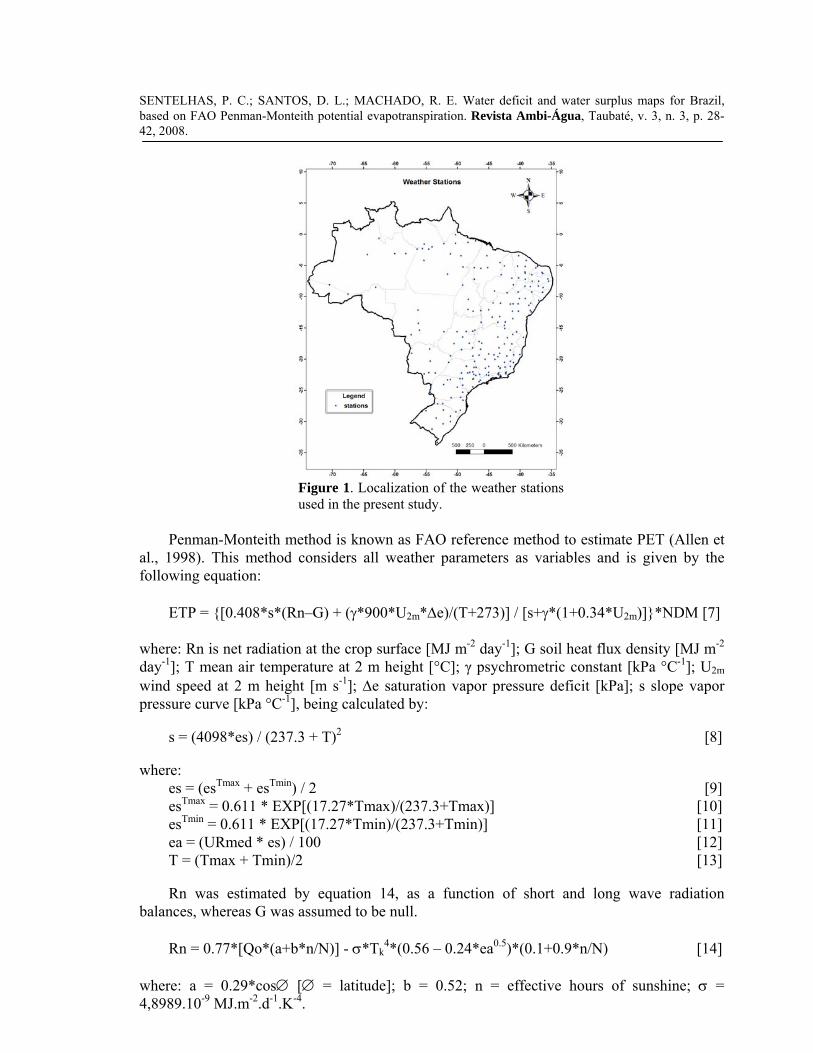
Monthly normal climate data (air temperature and relative humidity, hours of sunshine, and rainfall) for the period of 1961-1990, from the Brazilian Meteorological Service (Instituto Nacional de Meteorologia - INMET), with 219 locations in all country (Figure 1), were used do estimate potential evapotranspiration (PET) and climatological water balance (CWB).
PET was estimated by Thornthwaite (TH) and FAO Penman-Monteith (PM) methods. TH method has air temperature as its only variable and is determined by the following equations (Pereira et al., 2002a):
ETp = 16 * (10 * Tm/I)a for 0 ≤ Tm < 26.5oC [1] ETp = -415.85 + 32.24 * Tm – 0.43 * Tm2 for Tm ≥ 26.5oC [2] I = 12 * (0.2 * Ta)1,514 [3] a = 0.49239 + 1.7912*10-2 * I – 7.71*10-5 * I2 + 6.75*10-7 * I3 [4]
where: ETp is a standard evapotranspiration for a month of 30 days and with daylight period of 12h; Tm the monthly temperature; I and a thermal indexes, function of annual average temperature (Ta). ETP, in mm per month, will be obtained by:
ETP = ETp * fc [5] fc = N/12 * NDM/30 [6]
where: N is the daylight period of the current month and NDM the number of days of the month.
SENTELHAS, P. C.; SANTOS, D. L.; MACHADO, R. E. Water deficit and water surplus maps for Brazil, based on FAO Penman-Monteith potential evapotranspiration. Revista Ambi-Água, Taubaté, v. 3, n. 3, p. 28-42, 2008.
31
Figure 1. Localization of the weather stations used in the present study.
Penman-Monteith method is known as FAO reference method to estimate PET (Allen et
al., 1998). This method considers all weather parameters as variables and is given by the following equation:
ETP = {[0.408*s*(Rn–G) + (γ*900*U2m*Δe)/(T+273)] / [s+γ*(1+0.34*U2m)]}*NDM [7]
where: Rn is net radiation at the crop surface [MJ m-2 day-1]; G soil heat flux density [MJ m-2 day-1]; T mean air temperature at 2 m height [°C]; γ psychrometric constant [kPa °C-1]; U2m wind speed at 2 m height [m s-1]; Δe saturation vapor pressure deficit [kPa]; s slope vapor pressure curve [kPa °C-1], being calculated by:
s = (4098*es) / (237.3 + T)2 [8]
where: es = (esTmax + esTmin) / 2 [9] esTmax = 0.611 * EXP[(17.27*Tmax)/(237.3+Tmax)] [10] esTmin = 0.611 * EXP[(17.27*Tmin)/(237.3+Tmin)] [11] ea = (URmed * es) / 100 [12] T = (Tmax + Tmin)/2 [13] Rn was estimated by equation 14, as a function of short and long wave radiation
balances, whereas G was assumed to be null. Rn = 0.77*[Qo*(a+b*n/N)] - σ*Tk
4*(0.56 – 0.24*ea0.5)*(0.1+0.9*n/N) [14]
where: a = 0.29*cos∅ [∅ = latitude]; b = 0.52; n = effective hours of sunshine; σ = 4,8989.10-9 MJ.m-2.d-1.K-4.
SENTELHAS, P. C.; SANTOS, D. L.; MACHADO, R. E. Water deficit and water surplus maps for Brazil, based on FAO Penman-Monteith potential evapotranspiration. Revista Ambi-Água, Taubaté, v. 3, n. 3, p. 28-42, 2008.
32
As no wind data were available for all places at the INMET database, the normal wind speed data for estimating Penman-Monteith PET were obtained from the Brazilian Wind Potential Atlas (Amarante et al., 2001).
Climatological water balances, for a soil water holding capacity (SWHC) of 100 mm, were estimated by Thornthwaite and Mather’s method (Thornthwaite and Mather, 1955, 1957) using PET estimated by both TH and PM methods and rainfall data for each one of the 219 places, obtaining monthly AET, WD and WS. PET and AET, WD and WS estimated with PET from TH and PM methods were compared by regression analysis. The SWHC of 100 mm was adopted as an average of the main soils of the country, considering that each centimeter of depth has the capacity of holding 1 mm of water (Pereira et al., 2002a). A total depth of 1 m was considered. This procedure was required to make the results comparable in terms of climate characterization.
WD and WS database obtained by the CWB calculated with PET estimated by TH and PM methods were used to generate the maps of these variables for Brazil, and the differences between them were also spatialized. A geographical information system (ARCVIEW 3.2), was used for that, with interpolation being done by Spline method.
RESULTS AND DISCUSSION Comparison between PET estimated by Thornthwaite and FAO Penman-Monteith methods
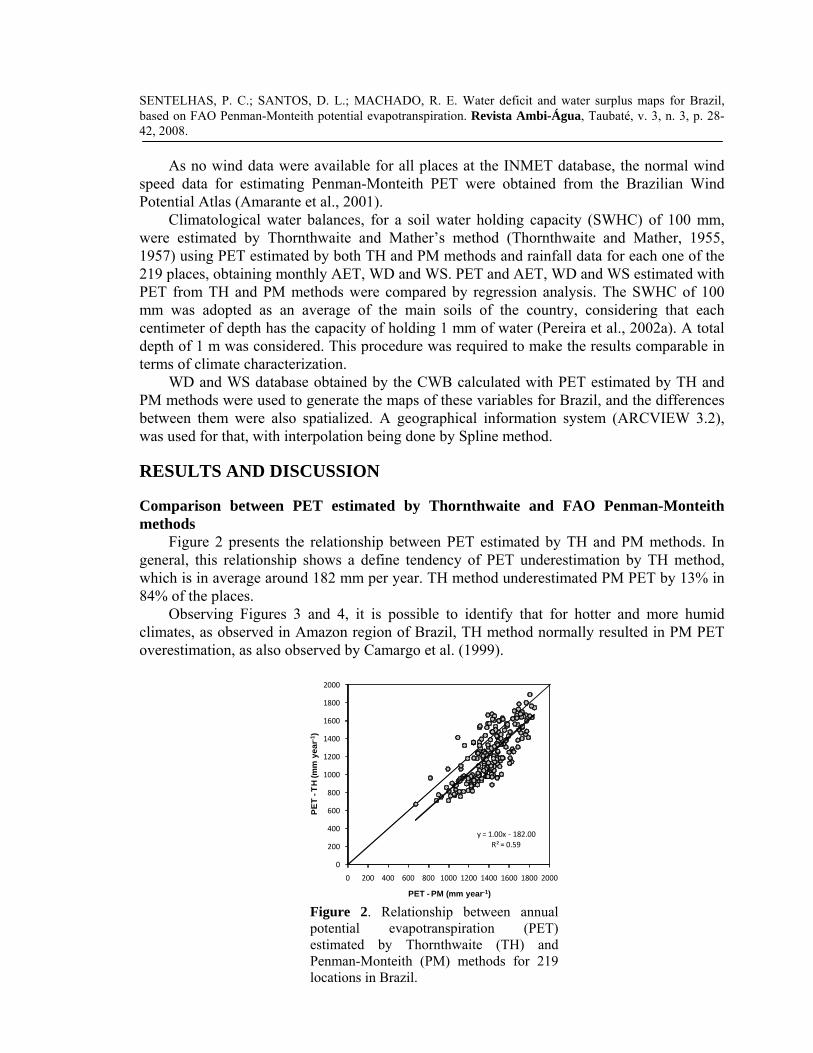
Figure 2 presents the relationship between PET estimated by TH and PM methods. In general, this relationship shows a define tendency of PET underestimation by TH method, which is in average around 182 mm per year. TH method underestimated PM PET by 13% in 84% of the places.
Observing Figures 3 and 4, it is possible to identify that for hotter and more humid climates, as observed in Amazon region of Brazil, TH method normally resulted in PM PET overestimation, as also observed by Camargo et al. (1999).
y = 1.00x ‐ 182.00R² = 0.59
0
200
400
600
800
1000
1200
1400
1600
1800
2000
0 200 400 600 800 1000 1200 1400 1600 1800 2000
PET
-TH
(mm
yea
r-1)
PET - PM (mm year-1) Figure 2. Relationship between annual potential evapotranspiration (PET) estimated by Thornthwaite (TH) and Penman-Monteith (PM) methods for 219 locations in Brazil.
SENTELHAS, P. C.; SANTOS, D. L.; MACHADO, R. E. Water deficit and water surplus maps for Brazil, based on FAO Penman-Monteith potential evapotranspiration. Revista Ambi-Água, Taubaté, v. 3, n. 3, p. 28-42, 2008.
33
0
200
400
600
800
1000
1200
1400
1600
1800
2000
Manaus Marabá Rio Branco
Ann
ual PET
(mm year‐1)
PET ‐ TH PET ‐ PM
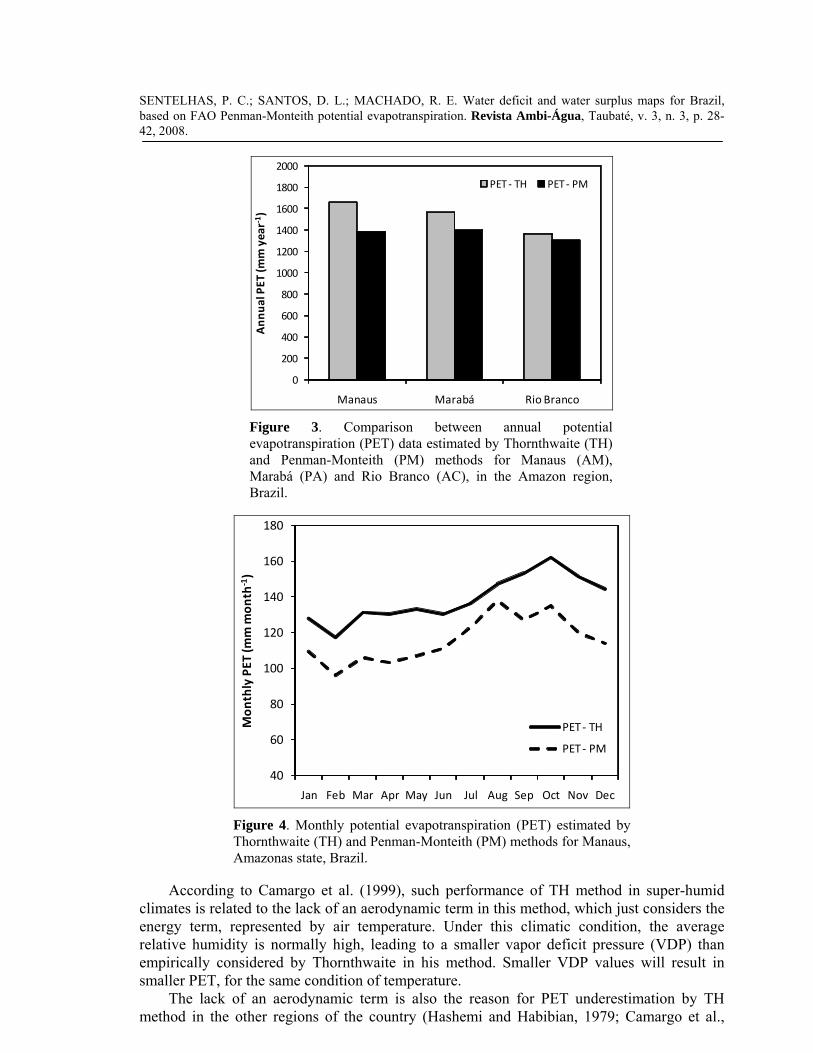
Figure 3. Comparison between annual potential evapotranspiration (PET) data estimated by Thornthwaite (TH) and Penman-Monteith (PM) methods for Manaus (AM), Marabá (PA) and Rio Branco (AC), in the Amazon region, Brazil.
40
60
80
100
120
140
160
180
Jan Feb Mar Apr May Jun Jul Aug Sep Oct Nov Dec
Mon
thly PET
(mm mon
th‐1)
PET ‐ TH
PET ‐ PM
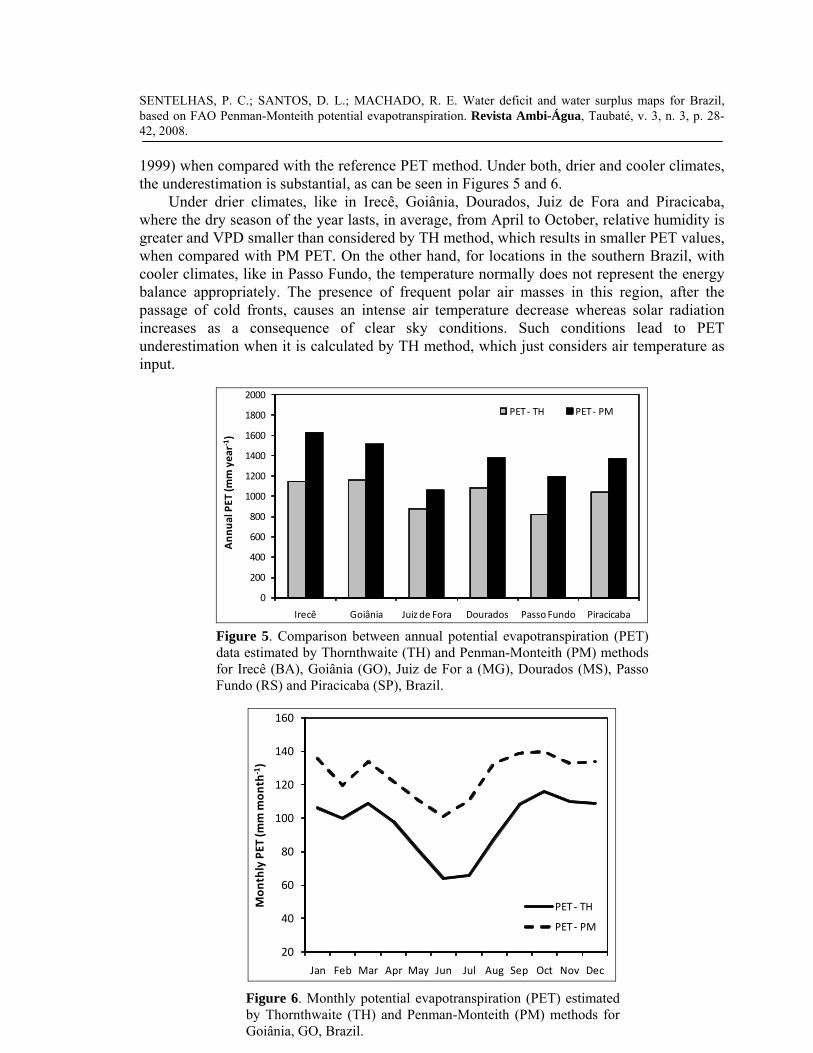
Figure 4. Monthly potential evapotranspiration (PET) estimated by Thornthwaite (TH) and Penman-Monteith (PM) methods for Manaus, Amazonas state, Brazil.
According to Camargo et al. (1999), such performance of TH method in super-humid
climates is related to the lack of an aerodynamic term in this method, which just considers the energy term, represented by air temperature. Under this climatic condition, the average relative humidity is normally high, leading to a smaller vapor deficit pressure (VDP) than empirically considered by Thornthwaite in his method. Smaller VDP values will result in smaller PET, for the same condition of temperature.
The lack of an aerodynamic term is also the reason for PET underestimation by TH method in the other regions of the country (Hashemi and Habibian, 1979; Camargo et al.,
SENTELHAS, P. C.; SANTOS, D. L.; MACHADO, R. E. Water deficit and water surplus maps for Brazil, based on FAO Penman-Monteith potential evapotranspiration. Revista Ambi-Água, Taubaté, v. 3, n. 3, p. 28-42, 2008.
34
1999) when compared with the reference PET method. Under both, drier and cooler climates, the underestimation is substantial, as can be seen in Figures 5 and 6.
Under drier climates, like in Irecê, Goiânia, Dourados, Juiz de Fora and Piracicaba, where the dry season of the year lasts, in average, from April to October, relative humidity is greater and VPD smaller than considered by TH method, which results in smaller PET values, when compared with PM PET. On the other hand, for locations in the southern Brazil, with cooler climates, like in Passo Fundo, the temperature normally does not represent the energy balance appropriately. The presence of frequent polar air masses in this region, after the passage of cold fronts, causes an intense air temperature decrease whereas solar radiation increases as a consequence of clear sky conditions. Such conditions lead to PET underestimation when it is calculated by TH method, which just considers air temperature as input.
0
200
400
600
800
1000
1200
1400
1600
1800
2000
Irecê Goiânia Juiz de Fora Dourados Passo Fundo Piracicaba
Ann
ual PET
(mm year‐1)
PET ‐ TH PET ‐ PM
Figure 5. Comparison between annual potential evapotranspiration (PET) data estimated by Thornthwaite (TH) and Penman-Monteith (PM) methods for Irecê (BA), Goiânia (GO), Juiz de For a (MG), Dourados (MS), Passo Fundo (RS) and Piracicaba (SP), Brazil.
20
40
60
80
100
120
140
160
Jan Feb Mar Apr May Jun Jul Aug Sep Oct Nov Dec
Mon
thly PET
(mm mon
th‐1)
PET ‐ TH
PET ‐ PM
Figure 6. Monthly potential evapotranspiration (PET) estimated by Thornthwaite (TH) and Penman-Monteith (PM) methods for Goiânia, GO, Brazil.
SENTELHAS, P. C.; SANTOS, D. L.; MACHADO, R. E. Water deficit and water surplus maps for Brazil, based on FAO Penman-Monteith potential evapotranspiration. Revista Ambi-Água, Taubaté, v. 3, n. 3, p. 28-42, 2008.
35
Effect of PET estimation method on CWB variables Considering that there are significant differences between PET estimated by TH and PM
methods for the majority of the locations evaluated, it is expected that these differences would be transferred to the other variables of the CWB.
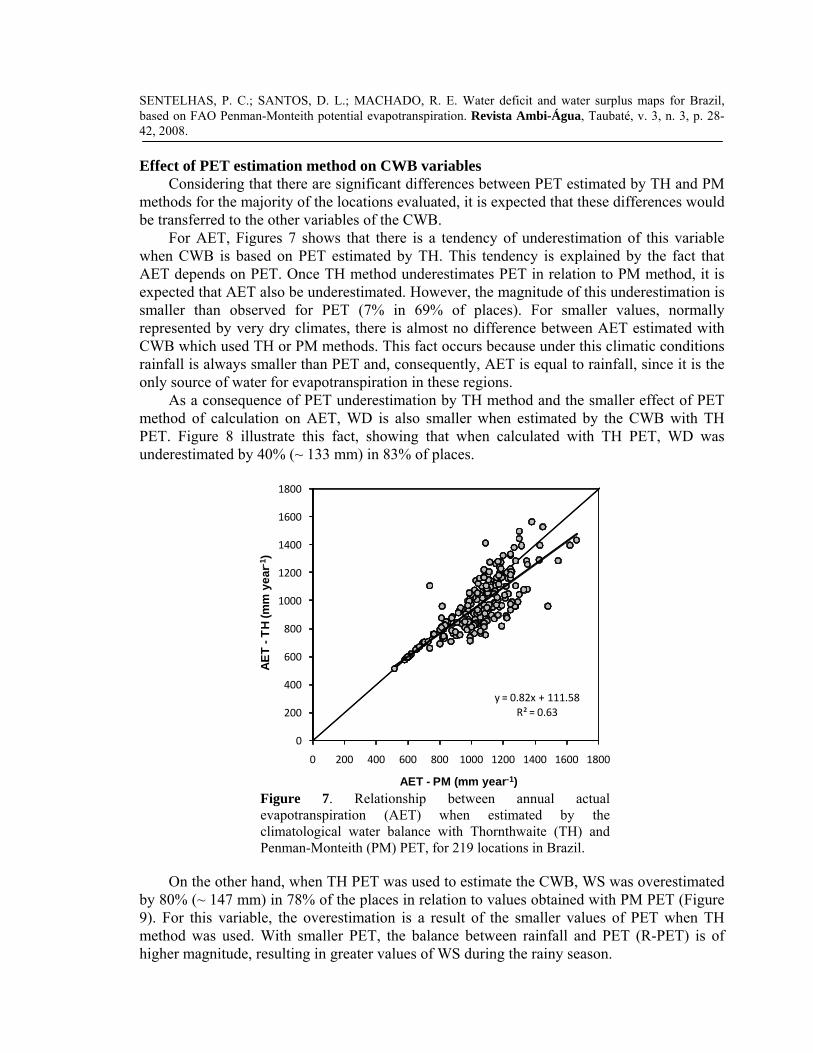
For AET, Figures 7 shows that there is a tendency of underestimation of this variable when CWB is based on PET estimated by TH. This tendency is explained by the fact that AET depends on PET. Once TH method underestimates PET in relation to PM method, it is expected that AET also be underestimated. However, the magnitude of this underestimation is smaller than observed for PET (7% in 69% of places). For smaller values, normally represented by very dry climates, there is almost no difference between AET estimated with CWB which used TH or PM methods. This fact occurs because under this climatic conditions rainfall is always smaller than PET and, consequently, AET is equal to rainfall, since it is the only source of water for evapotranspiration in these regions.
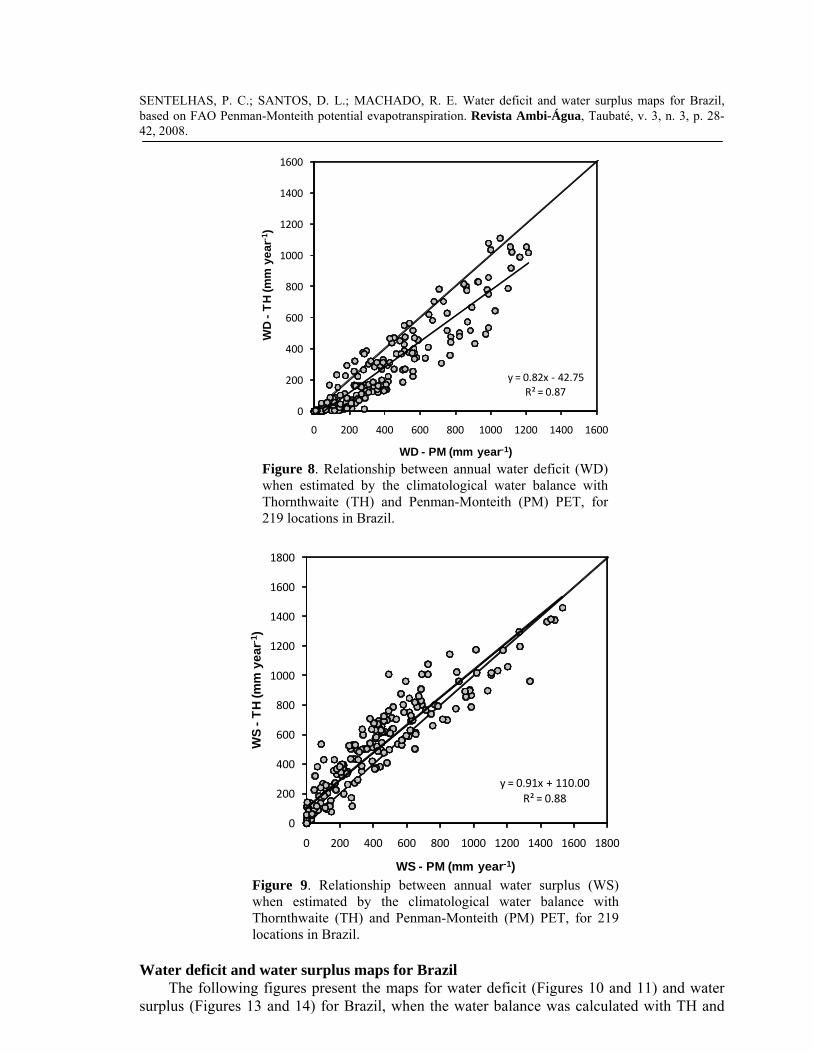
As a consequence of PET underestimation by TH method and the smaller effect of PET method of calculation on AET, WD is also smaller when estimated by the CWB with TH PET. Figure 8 illustrate this fact, showing that when calculated with TH PET, WD was underestimated by 40% (~ 133 mm) in 83% of places.
y = 0.82x + 111.58R² = 0.63
0
200
400
600
800
1000
1200
1400
1600
1800
0 200 400 600 800 1000 1200 1400 1600 1800
AET
-TH
(mm
yea
r-1)
AET - PM (mm year-1) Figure 7. Relationship between annual actual evapotranspiration (AET) when estimated by the climatological water balance with Thornthwaite (TH) and Penman-Monteith (PM) PET, for 219 locations in Brazil.
On the other hand, when TH PET was used to estimate the CWB, WS was overestimated
by 80% (~ 147 mm) in 78% of the places in relation to values obtained with PM PET (Figure 9). For this variable, the overestimation is a result of the smaller values of PET when TH method was used. With smaller PET, the balance between rainfall and PET (R-PET) is of higher magnitude, resulting in greater values of WS during the rainy season.
SENTELHAS, P. C.; SANTOS, D. L.; MACHADO, R. E. Water deficit and water surplus maps for Brazil, based on FAO Penman-Monteith potential evapotranspiration. Revista Ambi-Água, Taubaté, v. 3, n. 3, p. 28-42, 2008.
36
y = 0.82x ‐ 42.75R² = 0.87
0
200
400
600
800
1000
1200
1400
1600
0 200 400 600 800 1000 1200 1400 1600
WD
-TH
(mm
yea
r-1)
WD - PM (mm year-1) Figure 8. Relationship between annual water deficit (WD) when estimated by the climatological water balance with Thornthwaite (TH) and Penman-Monteith (PM) PET, for 219 locations in Brazil.
y = 0.91x + 110.00R² = 0.88
0
200
400
600
800
1000
1200
1400
1600
1800
0 200 400 600 800 1000 1200 1400 1600 1800
WS
-TH
(mm
yea
r-1)
WS - PM (mm year-1) Figure 9. Relationship between annual water surplus (WS) when estimated by the climatological water balance with Thornthwaite (TH) and Penman-Monteith (PM) PET, for 219 locations in Brazil.
Water deficit and water surplus maps for Brazil
The following figures present the maps for water deficit (Figures 10 and 11) and water surplus (Figures 13 and 14) for Brazil, when the water balance was calculated with TH and
SENTELHAS, P. C.; SANTOS, D. L.; MACHADO, R. E. Water deficit and water surplus maps for Brazil, based on FAO Penman-Monteith potential evapotranspiration. Revista Ambi-Água, Taubaté, v. 3, n. 3, p. 28-42, 2008.
37
PM potential evapotranspiration, as well as the deviations between the two WD maps (Figure 12) and WS maps (Figure 15).
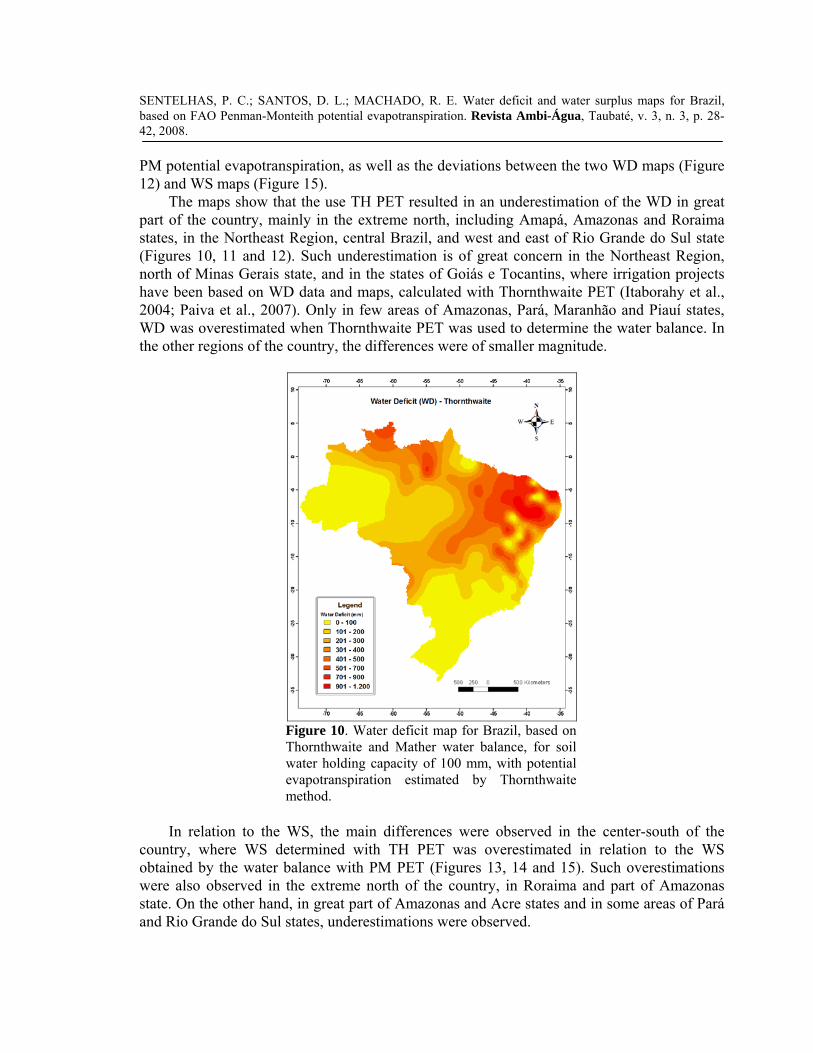
The maps show that the use TH PET resulted in an underestimation of the WD in great part of the country, mainly in the extreme north, including Amapá, Amazonas and Roraima states, in the Northeast Region, central Brazil, and west and east of Rio Grande do Sul state (Figures 10, 11 and 12). Such underestimation is of great concern in the Northeast Region, north of Minas Gerais state, and in the states of Goiás e Tocantins, where irrigation projects have been based on WD data and maps, calculated with Thornthwaite PET (Itaborahy et al., 2004; Paiva et al., 2007). Only in few areas of Amazonas, Pará, Maranhão and Piauí states, WD was overestimated when Thornthwaite PET was used to determine the water balance. In the other regions of the country, the differences were of smaller magnitude.
Figure 10. Water deficit map for Brazil, based on Thornthwaite and Mather water balance, for soil water holding capacity of 100 mm, with potential evapotranspiration estimated by Thornthwaite method.
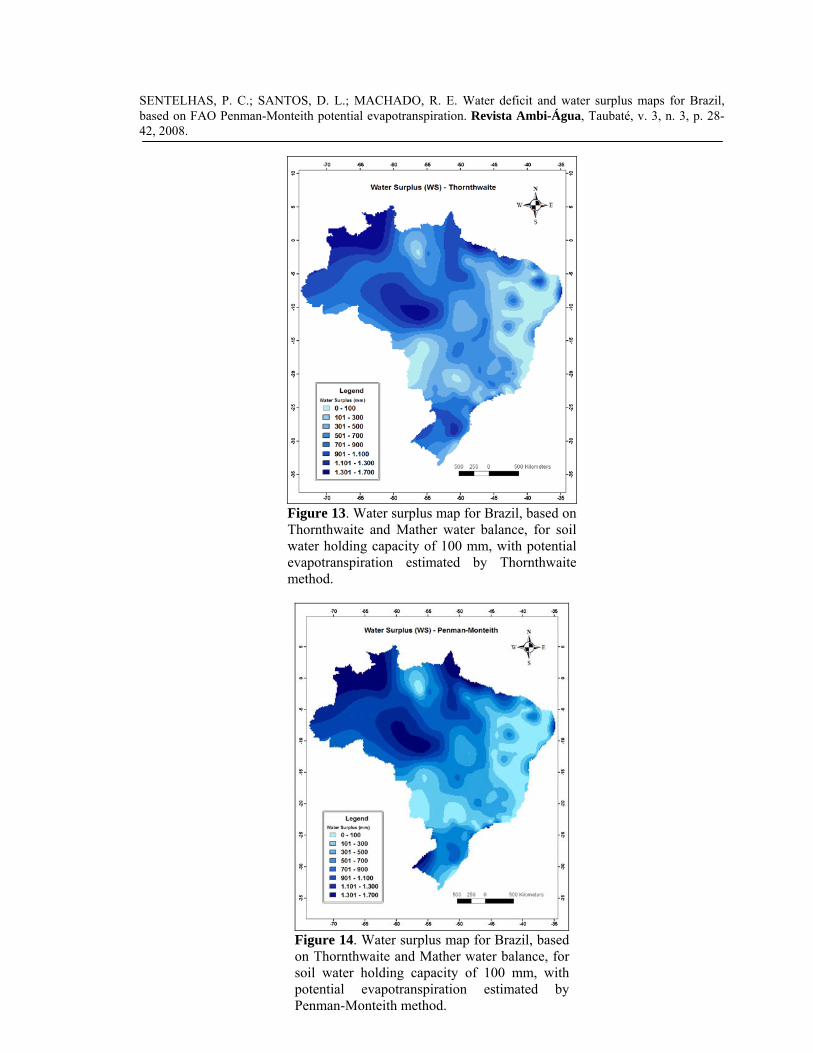
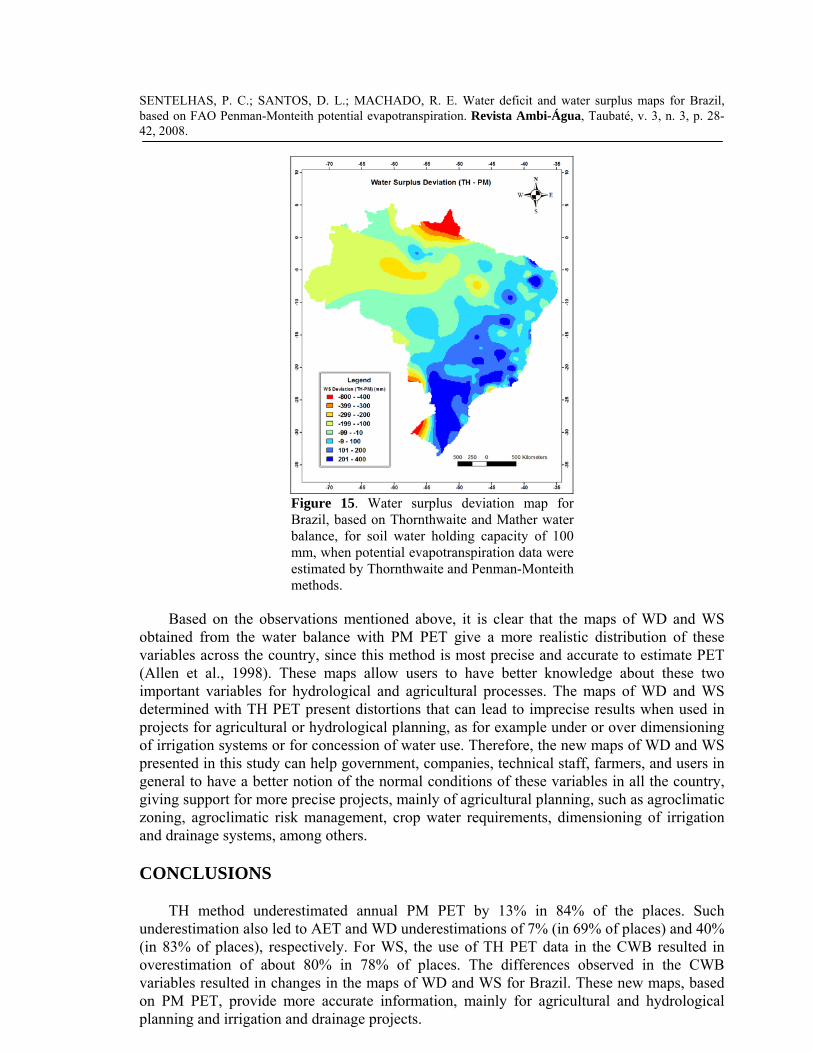
In relation to the WS, the main differences were observed in the center-south of the
country, where WS determined with TH PET was overestimated in relation to the WS obtained by the water balance with PM PET (Figures 13, 14 and 15). Such overestimations were also observed in the extreme north of the country, in Roraima and part of Amazonas state. On the other hand, in great part of Amazonas and Acre states and in some areas of Pará and Rio Grande do Sul states, underestimations were observed.
SENTELHAS, P. C.; SANTOS, D. L.; MACHADO, R. E. Water deficit and water surplus maps for Brazil, based on FAO Penman-Monteith potential evapotranspiration. Revista Ambi-Água, Taubaté, v. 3, n. 3, p. 28-42, 2008.
38
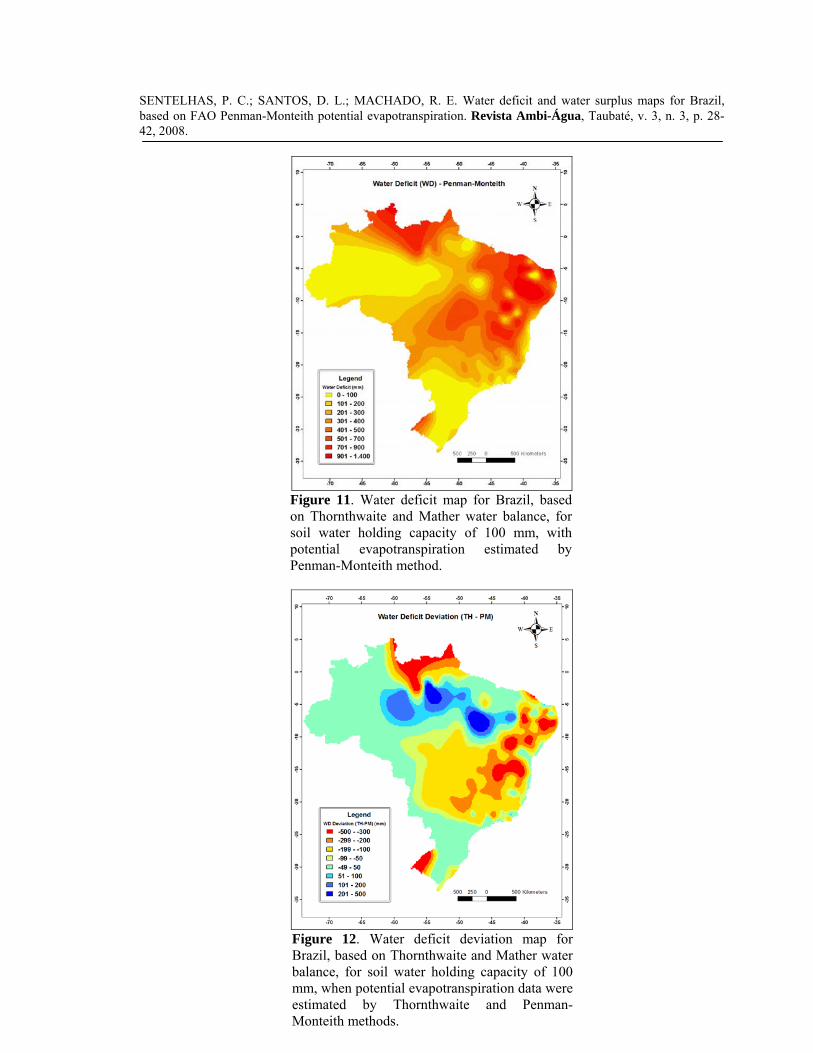
Figure 11. Water deficit map for Brazil, based on Thornthwaite and Mather water balance, for soil water holding capacity of 100 mm, with potential evapotranspiration estimated by Penman-Monteith method.
Figure 12. Water deficit deviation map for Brazil, based on Thornthwaite and Mather water balance, for soil water holding capacity of 100 mm, when potential evapotranspiration data were estimated by Thornthwaite and Penman-Monteith methods.
SENTELHAS, P. C.; SANTOS, D. L.; MACHADO, R. E. Water deficit and water surplus maps for Brazil, based on FAO Penman-Monteith potential evapotranspiration. Revista Ambi-Água, Taubaté, v. 3, n. 3, p. 28-42, 2008.
39
Figure 13. Water surplus map for Brazil, based on Thornthwaite and Mather water balance, for soil water holding capacity of 100 mm, with potential evapotranspiration estimated by Thornthwaite method.
Figure 14. Water surplus map for Brazil, based on Thornthwaite and Mather water balance, for soil water holding capacity of 100 mm, with potential evapotranspiration estimated by Penman-Monteith method.
SENTELHAS, P. C.; SANTOS, D. L.; MACHADO, R. E. Water deficit and water surplus maps for Brazil, based on FAO Penman-Monteith potential evapotranspiration. Revista Ambi-Água, Taubaté, v. 3, n. 3, p. 28-42, 2008.
40
Figure 15. Water surplus deviation map for Brazil, based on Thornthwaite and Mather water balance, for soil water holding capacity of 100 mm, when potential evapotranspiration data were estimated by Thornthwaite and Penman-Monteith methods.
Based on the observations mentioned above, it is clear that the maps of WD and WS
obtained from the water balance with PM PET give a more realistic distribution of these variables across the country, since this method is most precise and accurate to estimate PET (Allen et al., 1998). These maps allow users to have better knowledge about these two important variables for hydrological and agricultural processes. The maps of WD and WS determined with TH PET present distortions that can lead to imprecise results when used in projects for agricultural or hydrological planning, as for example under or over dimensioning of irrigation systems or for concession of water use. Therefore, the new maps of WD and WS presented in this study can help government, companies, technical staff, farmers, and users in general to have a better notion of the normal conditions of these variables in all the country, giving support for more precise projects, mainly of agricultural planning, such as agroclimatic zoning, agroclimatic risk management, crop water requirements, dimensioning of irrigation and drainage systems, among others.
CONCLUSIONS
TH method underestimated annual PM PET by 13% in 84% of the places. Such underestimation also led to AET and WD underestimations of 7% (in 69% of places) and 40% (in 83% of places), respectively. For WS, the use of TH PET data in the CWB resulted in overestimation of about 80% in 78% of places. The differences observed in the CWB variables resulted in changes in the maps of WD and WS for Brazil. These new maps, based on PM PET, provide more accurate information, mainly for agricultural and hydrological planning and irrigation and drainage projects.
SENTELHAS, P. C.; SANTOS, D. L.; MACHADO, R. E. Water deficit and water surplus maps for Brazil, based on FAO Penman-Monteith potential evapotranspiration. Revista Ambi-Água, Taubaté, v. 3, n. 3, p. 28-42, 2008.
41
REFERENCES ALLEN, R. G. A Penman for all seasons. Journal of Irrigation and Drainage Eng., v. 112,
n. 4, p. 348-368, 1986.
ALLEN, R. G.; JENSEN, M. E.; WRIGHT, J.; BURMAN, R. D. Operational estimates of reference evapotranspiration. Agronomy Journal, v. 81, p. 650-662, 1989.
ALLEN, R. G.; PEREIRA, L. S.; RAES, D.; SMITH, M. Crop evapotranspiration: guidelines for computing crop water requirements. Rome: FAO, 1998. (Irrigation and Drainage, 56).
AMARANTE, O. A. C.; BROWER, M.; ZACK, J.; SÁ, A. L. Atlas do potencial eólico brasileiro. Brasília: Ministério de Minas e Energia – ELETROBRAS, 2001.
BACK, A. J. Variação da evapotranspiração de referência calculada em diferentes intervalos de tempo. Engenharia Agrícola, v. 27, n. 1, p. 139-145, 2007.
BLACK, P. Revising the Thornthwaite and Mather water balance. Journal of the American Water Resources Association, v. 43, n. 6, p. 1604-1605, 2007.
CAMARGO, A. P. Contribuição para a determinação da evapotranspiração potencial no Estado de São Paulo. Bragantia, Campinas, v. 21, p. 163-203, 1962.
CAMARGO, A. P. Balanço hídrico no Estado de São Paulo. 4.ed. Campinas: Instituto Agronômico, 1978. 28p. (Boletim, 116).
CAMARGO, A. P.; SENTELHAS, P. C. Avaliação do desempenho de diferentes métodos de estimativa da evapotranspiração potencial no Estado de São Paulo. Revista Brasileira de Agrometeorologia, Santa Maria, v. 5, n. 1, p. 89-97, 1997.
CAMARGO, A. P.; MARIN, F. R.; SENTELHAS, P. C.; PICINI, A. G. Ajuste da equação de Thornthwaite para estimar a evapotranspiração potencial em climas áridos e superúmidos, com base na amplitude térmica. Revista Brasileira de Agrometeorologia, Santa Maria, v. 7, n. 2, p. 251-257, 1999.
CAMARGO, A. P.; CAMARGO, M. B. P. Uma revisão analítica da evapotranspiração potencial. Bragantia, Campinas, v. 59, n. 2, p. 125-137, 2000.
HASHEMI, F.; HABIBIAN, M. T. Limitations of temperature-based methods in estimating crop evapotranspiration in arid-zone agricultural development projects. Agricultural Meteorology, v. 20, p. 237-247, 1979.
ITABORAHY, C. R.; SANTOS, D. G.; REZENDE, L. S.; PRETO, L. A. Agricultura Irrigada: projeto de gerenciamento integrado das atividades desenvolvidas em terra na bacia do são Francisco. Brasília: ANA/GEF/PNUMA/OEA, 2004. 102p. (Estudo Técnico de Apoio ao PBHSF, 12).
MEDEIROS, A. T.; SENTELHAS, P. C.; LIMA, R. N. Estimativa da evapotranspiração de referência a partir da equação de Penman-Monteith, de medidas lisimétricas e de equações empíricas, em Paraipaba, CE. Engenharia Agrícola, Jaboticabal, v. 23, n. 1, p. 31-40, 2003.
SENTELHAS, P. C.; SANTOS, D. L.; MACHADO, R. E. Water deficit and water surplus maps for Brazil, based on FAO Penman-Monteith potential evapotranspiration. Revista Ambi-Água, Taubaté, v. 3, n. 3, p. 28-42, 2008.
42
PAIVA, Y. G.; SILVA, K. R.; CECÍLIO, R. A.; PEZZOPANE, J. E. M.; PEREIRA, M. C. Uso de dados GTOPO30 e redes neurais para a espacialização de elementos climáticos. Parte II – Evapotranspiração potencial para o estado da Bahia. IN: SIMPÓSIO BRASILEIRO DE SENSOREAMENTO REMOTO, 13., 2007, Florianópolis. Anais... São José dos Campos: INPE, 2007. p. 4129-4134.
PEREIRA, A. R.; ANGELOCCI, L. R.; SENTELHAS, P. C. Agrometeorologia: fundamentos e aplicações práticas. Guaíba: Agropecuária, 2002a. 478p.
PEREIRA, A. R.; SENTELHAS, P. C.; FOLEGATTI, M. V.; NOVA, N. A. V.; MAGGIOTTO, S. R.; PEREIRA, F. A. C. Substantiation of the daily FAO-56 reference evapotranspiration with data from automatic and conventional weather stations. Revista Brasileira de Agrometeorologia, Santa Maria, v. 10, n. 2, p. 251-257, 2002b.
PEREIRA, F. A. C. Desempenho do modelo de Penman-Monteith de dois evapotranspirômetros na estimativa da evapotranspiração de referência (ETo) em relação a um lisímetro de pesagem. 1998. 87f. Tese (Doutorado em Irrigação e Drenagem) - Escola Superior de Agricultura “Luiz de Queiroz”, Universidade de São Paulo, Piracicaba, 1998.
SENTELHAS, P. C. Estimativa diária da evapotranspiração de referência com dados de estações meteorológicas convencional e automática. 1998. 97f. Tese (Doutorado em Irrigação e Drenagem) - Escola Superior de Agricultura “Luiz de Queiroz”, Universidade de São Paulo, Piracicaba, 1998.
THORNTHWAITE, C. W. An approach toward a rational classification of climate. Geographical Review, New York, v. 38, n. 1, p. 55-94, 1948.
THORNTHWAITE, C. W.; MATHER, J. R. The water balance. Centerton: Drexel Institute of Technology – Laboratory of Climatology, 1955. 104p. (Publications in Climatology, v. 8, n. 1)
THORNTHWAITE, C. W.; MATHER, J. R. Instructions and tables for computing potential evapotranspiration and water balance. Centerton: Drexel Institute of Technology - Laboratory of Climatology, 1957. 311p.


![Modulo-8 Deficit Sensorial[1]](https://static.fdocumentos.com/doc/165x107/577ce1381a28ab9e78b50141/modulo-8-deficit-sensorial1.jpg)