INVESTIGAÇÃO DA CAPACIDADE GLICONEOGÊNICA EM FÍGADO DE … · que de forma direta ou indireta...
31
SANDONAID ANDREI GEISLER INVESTIGAÇÃO DA CAPACIDADE GLICONEOGÊNICA EM FÍGADO DE RATOS SUBMETIDOS À HIPOGLICEMIA INDUZIDA POR GLIBENCLAMIDA Maringá, 2009
Transcript of INVESTIGAÇÃO DA CAPACIDADE GLICONEOGÊNICA EM FÍGADO DE … · que de forma direta ou indireta...

SANDONAID ANDREI GEISLER
INVESTIGAÇÃO DA CAPACIDADE GLICONEOGÊNICA EM
FÍGADO DE RATOS SUBMETIDOS À HIPOGLICEMIA INDUZIDA
POR GLIBENCLAMIDA
Maringá, 2009
2
Universidade Estadual de Maringá Programa de Pós-Graduação em Ciências Biológicas Área de Concentração Biologia Celular e Molecular
SANDONAID ANDREI GEISLER
INVESTIGAÇÃO DA CAPACIDADE GLICONEOGÊNICA EM
FÍGADO DE RATOS SUBMETIDOS À HIPOGLICEMIA INDUZIDA
POR GLIBENCLAMIDA
Dissertação apresentada ao Programa de Pós-Graduação em Ciências Biológicas (Área de concentração - Biologia Celular e Molecular), da Universidade Estadual de Maringá para obtenção do grau de Mestre em Ciências Biológicas.
Orientador: Prof. Dr. Roberto Barbosa Bazotte
Maringá, 2009

3
Dados Internacionais de Catalogação-na-Publicação (CIP) (Biblioteca Central - UEM, Maringá – PR., Brasil) Geisler, Sandonaid Andrei G313i Investigação da capacidade gliconeogênic a em fígado
de ratos submetidos à hipoglicemia induzida por glibenclamida. / Sandonaid Andrei Geisler. -- Marin gá, 2009.
30 f. : figs. Orientador : Prof. Dr. Roberto Barbosa B azotte. Dissertação (mestrado) - Universidade Es tadual de
Maringá, Departamento de Biologia Celular, Programa de Pós-Graduação em Ciências Biológicas, 2009.
1. Glibenclamida. 2. Hipoglicemia. 3. Gl iconeogênese
hepática. 4. Ratos - Hipoglicemia. 5. Hipoglicemia induzida por sulfoniluréia. 6. Metabolismo hepático - Ratos. I. Bazotte, Roberto Barbosa, orient. II. Universidade Estadual de Maringá. Departamento de Biologia Celular. Programa de Pós-Graduação em Ciên cias Biológicas. III. Título.
CDD 21.ed. 572.4

4
BIOGRAFIA
Sandonaid Andrei Geisler nasceu em Rio dos Cedros/SC
em 21/03/1978. Possui Graduação em Ciências Biológicas (Licenciatura) pela
Universidade Estadual do Oeste do Paraná – Extensão Santa Helena, onde realizou estágio
e pesquisas em Análise do comportamento de ratos Wistar submetidos à ingesta de água
com glifosato e organoclorados. É pós-graduando do Programa de Pós-Graduação em
Ciências Biológicas (área de concentração - Biologia Celular e Molecular) pela
Universidade Estadual de Maringá, onde realizou pesquisas que investigaram a capacidade
gliconeogênica de fígado de ratos submetidos à hipoglicemia induzida por glibenclamida.

5
Canção Mínima
No mistério do sem-fim
equilibra-se um planeta
E, no planeta, um jardim,
e, no jardim, um canteiro;
no canteiro uma violeta,
e, sobre ela, o dia inteiro,
entre o planeta e o sem-fim
a asa de uma borboleta
Cecília Meireles
6
AGRADECIMENTOS
À Deus por ter guiado meu caminho.
Ao meu maior patrimônio, minha família, pois sem eles eu não teria alcançado esta
vitória.
A minha esposa Juliana, que sempre se fez atenciosa e disposta a me ouvir, quando
outros já haviam se cansado.
À Universidade Estadual de Maringá, à Fundação Araucária e ao Conselho
Nacional de Desenvolvimento Científico e Tecnológico - CNPq, pela disponibilização da
bolsa de estudos;
Aos docentes do Programa de Pós Graduação em Ciências Biológicas;
Ao Professor Doutor Roberto Barbosa Bazotte, pela excelente orientação e auxílio
na realização e elaboração de todo o trabalho;
Aos meus amigos, Mic, Milene, Samir, Dirceu, Marcelo, Márcio, Amanda, Dudu,
que de forma direta ou indireta estiveram presentes nesta caminhada.
Aos meus amigos e parceiros de laboratório Antonio, Simoni, Gabriela, Thauany,
Tom, Carlão e Solidalva que me auxiliaram muito na confecção deste trabalho e assim me
deram a chance de procurar e trilhar novos caminhos.
A todos, o meu muito obrigado!!!
7
APRESENTAÇÃO
Esta dissertação de Mestrado foi redigida na forma de um artigo científico
“Investigation of the gluconeogenic capacity in livers from rats submitted to
glibenclamide induced hypoglycemia” em consonância com as normas do Programa de
Pós-Graduação em Ciências Biológicas da Universidade Estadual de Maringá e da revista
Biological & Pharmaceutical Bulletin (ISSN: 0918-6158).
Este estudo representa a continuidade dos trabalhos desenvolvidos pelo grupo de
pesquisa do Laboratório de Farmacologia Endócrina que investiga os mecanismos de
manutenção, prevenção e recuperação da glicemia durante a hipoglicemia. Neste sentido, o
presente trabalho investigou a capacidade neoglicogênica hepática de ratos submetidos à
hipoglicemia induzida por glibenclamida.
.

8
RESUMO GERAL
INTRODUÇÃO - Apesar do fato de que concentrações fisiológicas de insulina inibem a
gliconeogênese hepática, concentrações supra fisiológicas que ocorrem durante a
insulinoterapia, estimulam a gliconeogênese. Este efeito paradoxal pode ser explicado pela
liberação dos hormônios contra-reguladores durante a hipoglicemia induzida por altas
doses insulina, os quais sobrepõem o efeito inibitório da insulina sobre a gliconeogênese
hepática. Assim como a injeção de insulina, as sulfoniluréias também promovem
hipoglicemia, efeito este atribuído à liberação de insulina. Deste modo, um efeito esperado
da hipoglicemia induzida por sulfoniluréia (HIS) seria uma ativação da gliconeogênese.
Contudo, sulfoniluréias infundidas diretamente no fígado inibem a gliconeogênese, efeito
este mediado, pelo menos parcialmente, pela inativação da função mitocondrial.
OBJETIVO - Portanto, considerando estas influências opostas na gliconeogênese
hepática, decidimos investigar se a gliconeogênese se encontra ativada ou inibida em
fígados de ratos submetidos a uma HIS. Considerando que ratos não diabéticos constituem
um bom modelo experimental para se investigar uma HIS e considerando que fígados de
ratos perfundidos in situ, refletem as condições in vivo do animal imediatamente antes do
isolamento do fígado, os experimentos foram realizados utilizando esta abordagem
experimental. Para alcançar este objetivo, empregou-se glibenclamida, uma sulfoniluréia
utilizada no tratamento do diabetes mellitus tipo 2. MATERIAIS E MÉTODOS - Ratos
Wistar machos (180-220 g) em jejum de 24 h foram utilizados. Os procedimentos
experimentais foram aprovados pelo comitê de ética da Universidade Estadual de Maringá,
PR, Brasil. Inicialmente, um experimento preliminar para caracterizar a HIS após
administração oral (intragástrica) de glibenclamida (10 mg/kg) foi realizado. O sangue foi
obtido por decapitação. Os valores obtidos para a glicemia 30, 60, 90, 120 e 150 min
(média ± D.P, n = 6) após administração oral de glibenlamida foram 111.9 ± 13.68, 75.33
± 4.5, 63.12 ± 3.04, 60.5 ± 2.74 e 71.96 ± 3.84 mg/dl, respectivamente. Assim, para
verificar o efeito da HIS na gliconeogênese hepática, os experimentos foram feitos 2 h
após a administração de glibenclamida (grupo HIS), quando os menores valores de
glicemia foram alcançados. O grupo controle normoglicêmico (grupo controle) foi
representado por animais que receberam salina via oral. Para os experimentos de perfusão
de fígado os ratos foram anestesiados com tiopental sódico (45 mg/kg) e em seguida
submetidos à laparotomia. Os fígados foram perfundidos in situ com tampão Krebs-
Henseileit Bicarbonato (KHB). Após um período de pré-infusão (10 min com KHB), os
substratos gliconeogênicos (L-alanina, L-glutamina, L-lactato, piruvato ou glicerol) foram

9
dissolvidos no KHB, seguido por um período de pós-infusão (10 min com apenas KHB)
para permitir o retorno aos valores basais. Amostras do líquido efluente da perfusão foram
coletadas em intervalos de 5 minutos e a produção hepática de glicose e uréia foram
analisadas. As diferenças na produção de glicose e uréia durante e antes da infusão de
substratos gliconeogênicos permitiram calcular a área sob a curva (AUC). A adição de L-
alanina, piruvato, L-glutamina ou glicerol aumentam proporcionalmente a taxa da
produção de glicose até os valores saturantes serem alcançados. Assim, usando uma
concentração saturante de precursores hepáticos de glicose, é possível medir a capacidade
máxima de produção hepática a partir de cada substrato gliconeogênico. Assim, a
capacidade gliconeogênica no fígado de ratos que receberam glibenclamida oral (grupo
HIS) ou salina (grupo controle) foram comparadas utilizando concentração saturante de L-
alanina (5 mM), L-glutamina (5 mM), L-lactato (2 mM), piruvato (5 mM) ou glicerol (2
mM). RESULTADOS - Na primeira série de experimentos, fígados de ratos que
receberam solução salina via oral (grupo controle) ou glibenclamida por via oral (grupo
HIS) foram infundidos com L-alanina (5 mM). Fígados de ratos HIS apresentaram menor
(p <0,05) produção de glicose e maior (p <0,05) produção de piruvato em comparação aos
fígados de ratos controle. No entanto, a produção de uréia e de L-lactato foi similar nos
dois grupos. Na segunda série de experimentos os fígados de ratos controle e HIS foram
infundidos com piruvato (5 mM). Fígados de ratos HIS apresentaram menor (p <0,05)
produção de glicose e maior (p <0,05) produção L-lactato em comparação aos ratos
controle. No terceiro conjunto de experimentos fígados de ratos controle e HIS foram
perfundidos com L-glutamina (5 mM). Fígados de ratos HIS apresentaram menor (p <0,05)
produção de glicose em comparação a fígados de ratos controle. No entanto, a produção de
uréia foi semelhante. Na quarta série de experimentos os fígados de ratos controle e HIS
foram infundidos com L-lactato (2 mM), ou glicerol (2 mM). Fígados de ratos HIS
apresentaram menor (p <0,05) produção de glicose a partir de L-lactato (2mM). Todavia, a
produção de glicose apartir do Glicerol (2 mM) foi semelhante nos dois grupos. Na quinta
série de experimentos, fígados de ratos HIS foram infundidos com L-alanina em
concentração fisiológica (0,45 mM) ou saturante (5 mM). Fígados infundidos em
condições saturantes de L-alanina apresentaram maior (p <0,05) produção de glicose e
uréia em comparação aos fígados infundidos com L-alanina em concentração fisiológica.
Na sexta série de experimentos os fígados de ratos HIS foram infundidos com L-glutamina
em concentração fisiológica (2 mM) e saturante (5 mM). Fígados infundidos com L-
glutamina em concentração saturante apresentaram maior (p <0,05) produção de glicose e

10
uréia do que os fígados infundidos em concentração fisiológica de L-glutamina.
DISCUSSÃO - O primeiro substrato gliconeogênico investigado foi a L-alanina, que
atravessa a membrana celular hepática para ser convertida em piruvato, que por sua vez a
partir do citosol entra na mitocôndria e é carboxilado e deixa a mitocôndria como aspartato
ou malato. No citosol o malato ou o aspartato é convertido em oxaloacetato e, em seguida,
a fosfoenolpiruvato e após várias etapas será convertido a glicose e liberado dos
hepatócitos. Uma vez que este complexo percurso depende do abastecimento de oxigênio e
vários compartimentos celulares, a produção de glicose, L-lactato e piruvato a partir da L-
alanina constituem um marcador da integridade do hepatócito. Desta forma, utilizando uma
concentração saturante de L-alanina, demonstrou-se que a capacidade de produção de
glicose em fígados de ratos submetidos à HIS foi diminuída (p <0,05). Este resultado não
poderia ser atribuído ao diminuído catabolismo da L-alanina, uma vez que a produção de
uréia a partir deste aminoácido foi inalterada. Além disso, considerando que a produção de
piruvato a partir da L-alanina em fígados de ratos HIS se elevou (p <0,05), a possibilidade
de uma menor entrada de piruvato na via gliconeogênica deve ser considerada. Em
concordância com esta proposição, fígados de ratos submetidos à HIS apresentaram
redução (p <0,05) de produção de glicose, não apenas a partir de piruvato, mas também a
partir de L-lactato. Além disso, a produção hepática de glicose a partir da L-glutamina, que
entra na via gliconeogênica após a piruvato carboxilase (PC), também foi diminuída (p
<0,05). Este resultado, não pode ser atribuído à diminuição do catabolismo da L-glutamina,
pois a produção de uréia a partir deste aminoácido foi inalterada. No entanto, a produção
de glicose a partir de glicerol, cuja entrada na gliconeogênese ocorre em uma etapa pós
mitocondrial permaneceu inalterada. No seu conjunto, os resultados sugerem que a
inibição da gliconeogênese promovida pela glibenclamida supera a intensificação da
gliconeogênese hepática em resposta à hipoglicemia. Além disso, se este efeito da
glibenclamida ocorrer in vivo, o resultado seria uma intensificação da eficácia desta droga
como agente hipoglicemiante. No entanto, apesar da diminuição da capacidade hepática de
produção de glicose durante uma HIS, a possibilidade de administrar substratos
gliconeogênicos durante esta condição deve ser considerada. Esta afirmação foi baseada no
fato de que, durante a HIS, a produção hepática de glicose a partir de L-alanina e L-
glutamina foi menor. Porém, mantida e influenciada pela disponibilidade destes
aminoácidos. Finalmente, nossos resultados e as considerações aqui apresentadas, abrem a
possibilidade da administração de substratos gliconeogênicos no tratamento da HIS,
particularmente quando a terapia com glicose não é eficaz.
11
GENERAL ABSTRACT
INTRODUCTION - In spite of the fact that physiological levels of insulin inhibit liver
gluconeogenesis, supraphysiological levels of insulin which occur during insulin therapy
stimulates gluconeogenesis. This paradoxical effect can be explained by the fact that the
counterregulatory hormones released during hypoglycemia induced by high doses of
insulin overcome the inhibitory effect of insulin on liver gluconeogenesis. In addition, the
oral administration of sulphonylurea, like insulin injection, promote hypoglycemia and this
effect was attributed to the insulin release. Thus, an expected effect of sulphonylurea
induced hypoglycemia (SIH) would be activation of gluconeogenesis. However,
sulphonylureas infused directly in the liver inhibits the gluconeogenesis, an this effect was
mediated partially at least by an inactivation of mitochondrial function. AIM – Theregore,
considering these opposite influences on liver gluconeogenesis we decided to clarify if the
gluconeogenesis was activated or inhibited in livers from rats submitted to SIH. Since non
diabetic rats is a suitable experimental model to investigate SIH and considering that in situ
perfused livers reflects the in vivo conditions of the animal immediately before the liver
isolation, this experimental approach was used. For this purpose glibenclamide, a
sulphonylurea used in the treatment of type 2 diabetes was employed. MATERIALS AND
METHODS - Male Wistar (180-220 g) 24 h fasted rats were used. The manipulation of
the animals was approved by the ethical committee of the State University of Maringá, PR,
Brazil. Thus, a preliminary experiment to characterize SIH after oral (intragastric)
administration of glibenclamide (10 mg/kg) was done. Blood was obtained by decapitation.
The values obtained for glycemia at 30, 60, 90, 120 and 150 min (means ± S.D, n = 6) after
the oral administration of glibenlamide were 111.9 ± 13.68, 75.33 ± 4.5, 63.12 ± 3.04, 60.5
± 2.74, and 71.96 ± 3.84 mg/dl, respectively. Thus, to verify the effect of oral SIH on liver
gluconeogenesis, the experiments were done 2 h after glibenclamide administration (SIH
group), when the lowest value of glycemia was obtained. Control normoglicemic group
(Control group) was represented by animals which received saline. For liver perfusion
experiments the rats were anaesthetized with thiopental (45 mg/kg) and submitted to
laparotomy. The livers were perfused in situ with Krebs Henseleit Bicarbonate (KHB).
After a pre-infusion period (10 min with KHB), the gluconeogenic substrates (L-alanine,
L-glutamine, L-lactate, pyruvate or glycerol) were dissolved in the perfusion fluid,
followed by a post-infusion period (10 min only with KHB) to allow the return to basal
12
levels. Samples of the effluent perfusion fluid were collected at 5 min intervals and the
liver production of glucose and urea were analyzed. The differences in the glucose and urea
production during and before the infusion of the gluconeogenic substrate allowed to
calculating the area under the curves (AUC). The addition of L-alanine, pyruvate, L-
glutamine or glycerol increases the rate of glucose production proportionately to the
amount of the glucose precursor until a saturating concentration is reached. Thus, by using
a saturating concentration of liver glucose precursors it is possible to measure the maximal
capacity of the liver to produce glucose from each gluconeogenic substrate. Thus, the
gluconeogenic capacity in livers from rats which received oral glibenclamide (SIH group)
or oral saline (Control group) were compared by using saturating concentration of L-
alanine (5 mM), L-glutamine (5 mM), L-lactate (2 mM), pyruvate (5 mM) or glycerol (2
mM). RESULTS - In the first set of experiments livers from rats that received oral saline
(Control group) or oral glibenclamide (SIH group) were infused with L-alanine (5 mM).
Livers of SIH rats showed lower (p < 0.05) glucose and higher (p < 0.05) pyruvate
production than livers of control rats. However, the urea and L-lactate production were
similar. In the second set of experiments livers from control and SIH rats were infused with
pyruvate (5 mM). Livers from SIH rats showed lower (p < 0.05) glucose and higher (p <
0.05) L-lactate production than livers from control rats. In the third set of experiments
livers from control and SIH rats were infused with L-glutamine (5 mM). Livers from SIH
rats showed lower (p < 0.05) glucose production than livers from control rats. However,
the urea production was similar. In the fourth set of experiments livers from control and
and SIH rats were infused with L-lactate (2 mM) or glycerol (2 mM). Livers from SIH rats
showed lower (p < 0.05) glucose production from L-lactate than livers from control rats.
However, the glucose production from glycerol (2 mM) was similar for both groups. In the
fifth set of experiments livers from SIH rats were infused with physiological (0.45 mM) or
saturating (5 mM) concentration of L-alanine. Livers infused with saturating concentration
of L-alanine showed higher (p < 0.05) glucose and urea production than livers infused with
physiological concentration of L-alanine. In the sixth set of experiments livers from SIH
rats were infused with physiological (2 mM) and saturating (5 mM) concentrations of L-
glutamine. Livers infused with saturating concentration of L-glutamine showed higher (p <
0.05) glucose and urea production than livers infused with physiological concentration of
L-glutamine. DISCUSSION - The first gluconeogenic substrate investigated was L-
alanine which cross the liver cell membrane and was then converted to pyruvate. From the
cytosol, pyruvate enters the mitochondria. There, pyruvate was carboxylate and leaves

13
mitochondria as aspartate or malate. In the cytosol malate or aspartate was converted to
oxalacetate, then to phosphoenolpyruvate and after various steps they were converted to
glucose and released from the hepatocyte. Since this complex pathway depends of oxygen
supply and several cellular compartments, the glucose, L-lactate and pyruvate production
from L-alanine can be used as a marker of the integrity of hepatocyte. Therefore, by using
saturating concentration of L-alanine we showed that the liver capacity to produce glucose
during SIH was decreased (p<0.05). This result could not be attributed to the decreased
catabolism of L-alanine, since the urea production from this amino acid was unchanged.
Moreover, considering that the pyruvate production from L-alanine in livers from SIH rats
was increased (p<0.05), the possibility of a lower entrance of pyruvate in the
gluconeogenic pathway must be considered. In agreement with this proposition, liver from
SIH rats showed a decreased (p<0.05) production of glucose not only from pyruvate but
also from L-Lactate. Moreover, the liver glucose production from L-glutamine, that
entered in the gluconeogenesis after the PC step, was also decreased (p <0,05). This result,
could not be attributed to the decreased catabolism of L-glutamine, since the urea
production from this amino acid was unchanged. However, the glucose production from
glycerol which enter in the gluconeogenesis after the mitochondrial step was maintained.
Taken together the results suggest that the inhibition of gluconeogenesis promoted by
glibenclamide overcome the intensification of liver gluconeogenesis in response to
hypoglycemia. Moreover, if these capabilities of glibenclamide occur in vivo, the result
could be an intensification of the effectiveness of this drug as hypoglycemic agent.
However, in spite of the decreased capacity to produce glucose during SIH, the possibility
of the administration of gluconeogenic substrates during this condition must be considered.
This affirmation was based in the fact that during SIH the liver glucose production from L-
alanine and L-glutamine were lower. But maintained and influenced by the availability of
these amino acids. Finally, our results and the considerations herein discussed, open the
possibility of the administration of gluconeogenic substrates in the treatment of SIH,
particularly when the therapy with glucose is not effective.

14
Biological & Pharmaceutical Bulletin
Regular Article
Pharmacology
Investigation of the gluconeogenic capacity in livers from rats submitted
to glibenclamide induced hypoglycemia.
Sandonaid Andrei GEISLERa and Roberto Barbosa BAZOTTE*, a
a Department of Pharmacy and Pharmacology, State University of Maringá, Maringá, PR
87020-900, Brazil
* To whom correspondence should be addressed.
Roberto Barbosa Bazotte, Ph.D., Department of Pharmacy and Pharmacology, State
University of Maringá, Maringá, PR 87020-900, Brazil
Fax: +55-44-3261-4999. E-mail: [email protected]
Running title: Liver gluconeogenesis in rats submitted to glibenclamide induced
hypoglycemia.

15
Investigation of the gluconeogenic capacity in livers from rats submitted to
glibenclamide induced hypoglycemia.
Our previous studies demonstrate an increased liver capacity to produce glucose
from several gluconeogenic substrates during insulin induced hypoglycemia (IIH). This
effect was partly at least mediated by an increased release of counterregulatory hormones
that overcome the inhibitory effect of insulin on liver gluconeogenesis (LG). Thus, an
expected effect of sulphonylureas induced hypoglycemia (SIH), like IIH, was an activation
of LG. But, sulphonylureas infused directly in the liver inhibits LG by an inhibition of the
mitochondrial function. Thus, considering these opposite effects we investigated LG in non
diabetic rats submitted to SIH. For this purpose 24 h fasted rats which received oral
glibenclamide (10 mg/kg) were used (SIH group). Control group received oral saline.
Glycemia at 30, 60, 90, 120 and 150 min (means ± S.D, n = 6) after the oral administration
of glibenlamide were 111.9 ± 13.68 mg/dl, 75.33 ± 4.5 mg/dl, 63.12 ± 3.04 mg/dl, 60.5 ±
2.74 mg/dl, 71.96 ± 3.84 mg/dl, respectively. Considering that the lower glycemia was
obtained 120 min after oral glibenclamide administration, this time was used to investigate
LG in situ perfused livers. The results shown that the gluconeogenic capacity from
substrates which enters in the gluconeogenesis before mitochondrial step, i.e., L-alanine (5
mM), L-lactate (2 mM), pyruvate (5 mM) and L-glutamine were decreased (p < 0.05).
However, the gluconeogenic capacity from glycerol (2 mM), which enters in the
gluconeogenesis after the mitochondrial step was maintained. Taken together the results
suggest that the inhibition of liver gluconeogenesis promoted by oral glibenclamide could
be attributed, partly at least to its effect on mitochondrial function.
Key words Glibenclamide; hepatic gluconeogenesis; hypoglycemia; rat
16
INTRODUCTION
In spite of the fact that physiological levels of insulin inhibits liver
gluconeogenesis, supraphysiological levels of insulin which occur during insulin therapy1)
stimulates gluconeogenesis. 2,3) This paradoxical effect was explained by the fact that the
counterregulatory hormones released during hypoglycemia induced by high doses of
insulin overcome the inhibitory effect of insulin on liver gluconeogenesis.4,5)
In addition, the oral administration of sulphonylurea, like insulin injection, promote
hypoglycemia and this effect was attributed to the insulin release. 6) Thus, an expected
effect of sulphonylurea induced hypoglycemia is an activation of gluconeogenesis.
However, it was well established that sulphonylureas infused directly in the liver
inhibits the gluconeogenesis,7) an this effect was mediated partially at least by an
inactivation of mitochondrial function.8-10)
Thus, considering these two opposite influences on liver gluconeogenesis we
decided to clarify if the gluconeogenesis was activated or inhibited in livers from rats
submitted to hypoglycemia induced by oral administration of sulphonylurea.
Since non diabetic rats is a suitable experimental model to investigate
sulphonylurea induced hypoglycemia7) and considering that in situ perfused livers reflects
the in vivo conditions of the animal immediately before the liver isolation2,3), this
experimental approach was used. For this purpose glibenclamide, a sulphonylurea used in
the treatment of type 2 diabetes was employed.
MATERIALS AND METHODS
Materials: Glibenclamide (also known as glyburide) was purchased from Sanofi
Aventis. L-alanine, L-glutamine and pyruvate were obtained from Sigma-Aldrich Chemie.
All other reagents were of the highest purity obtainable.

17
Animals: Adult male Wistar rats, weighting 180 - 220 g, were maintained on food
and water ad libitum before all experimental procedures. The manipulation of the animals
was approved by the ethical committee of the State University of Maringá, PR, Brazil
(approval number 042/2006). On the day before the experiment the animals were food
deprived from 8:00 a.m. All experiments were performed with 24 fasted rats (8:00 a.m –
8:00 a.m).
Experimental sulphonylurea induced hypoglycemia (SIH): A preliminary
experiment to characterize the hypoglycemia after oral (intragastric) administration of
glibenclamide (10 mg/kg) was done. Blood was obtained by decapitation. The values
obtained for glycemia11) at 30, 60, 90, 120 and 150 min (means ± S.D, n = 6) after the oral
administration of glibenlamide were 111.9 ± 13.68 mg/dl, 75.33 ± 4.5 mg/dl, 63.12 ± 3.04
mg/dl, 60.5 ± 2.74 mg/dl, and 71.96 ± 3.84 mg/dl, respectively. Thus, to verify the effect
of oral SIH on liver gluconeogenesis, the experiments were done 2 h after glibenclamide
administration (hypoglycemic group), when the lowest value of glycemia was obtained.
Control rats (normoglycemic group) were represented by animals which received oral
saline instead glibenclamide.
Liver perfusion experiments: The rats were anaesthetized with an ip injection of
sodium thiopental (45 mg/kg) and submitted to laparotomy. The livers were perfused in
situ according to the protocol previously described,12) in which after a pre-perfusion period
(10 min), the gluconeogenic substrate (L-alanine, L-glutamine, L-lactate, pyruvate or
glycerol) was dissolved in the perfusion fluid, followed by a post-infusion period (10 min)
to allow the return to basal levels. Samples of the effluent perfusion fluid were collected at
5 min intervals and the liver production of glucose11) was analyzed. The differences in the
glucose production during and before the infusion of the gluconeogenic substrate allowed

18
to calculate the area under the curves (AUC). In part of the experiments the liver
production of urea13) , pyruvate14) and L-lactate15) were evaluated.
Perfused livers from fasted rats produce negligible amounts of glucose in the
absence of gluconeogenic precursors. The addition of L-alanine, pyruvate, L-glutamine or
glycerol increases the rate of glucose production proportionately to the amount of the
glucose precursor until a saturating concentration is reached. The saturating concentration
for each substrate represents the lowest concentration at which the maximal glucose
production was obtained (results not shown). Thus, by using a saturating concentration of
liver glucose precursors it is possible to measure the maximal capacity of the liver to
produce glucose from each gluconeogenic substrate. Thus, the gluconeogenic capacity in
livers from rats which received oral glibenclamide (SIH group) or oral saline (Control
group) were compared by using saturating concentration of L-alanine (5 mM), L-glutamine
(5 mM), L-lactate (2 mM), pyruvate (5 mM) or glycerol (2 mM).
In part of the experiments, the role of the availability of the most important
gluconeogenic amino acid, i.e., L-alanine16) and the most abundant blood amino acid, i.e.,
L-glutamine17) in the activation of gluconeogenesis in livers from hypoglycemic rats were
investigated. For this purpose, saturating and physiological levels of these amino acids
were compared. The physiological values of L-alanine and L-glutamine was obtained in a
previous study16).
Statistical analysis: Statistical analysis were done with the software Graph Pad
Prism 5. Data concerning glycemia were analyzed by analysis of variance (ANOVA)
followed by Tukey´s post-test. The results of liver perfusion experiments were analyzed by
the unpaired Student’s t-test. Values are reported as mean + S.D. p< 0.05 was accepted for
all comparisons.
19
RESULTS
In the first set of experiments livers from rats that received oral saline
(normoglycemic rats) or oral glibenclamide (hypoglycemic rats) were infused with L-
alanine (5 mM). Livers of hypoglycemic rats showed lower (p < 0.05) glucose (Fig. 1A)
and higher (p < 0.05) pyruvate (Fig. 1C) production than livers of normoglycemic rats.
However the urea (Fig. 1B) and L-lactate (Fig. 1D) production were similar.
In the second set of experiments livers from normoglycemic rats and hypoglycemic
rats were infused with pyruvate (5 mM). Livers from hypoglycemic rats showed lower (p <
0.05) glucose (Fig. 2A) and higher (p < 0.05) L-lactate (Fig. 2B) production than livers
from normoglycemic rats.
In the third set of experiments livers from normoglycemic rats and hypoglycemic rats
were infused with L-glutamine (5 mM). Livers from hypoglycemic rats showed lower (p <
0.05) glucose production (Fig. 4A) than livers from normoglycemic rats. However, the
urea production (Fig. 3B) was similar.
In the fourth set of experiments livers from normoglycemic rats and hypoglycemic
rats were infused with L-lactate 2 mM (Fig. 3A) or glycerol 2 mM (Fig. 4B). Livers from
hypoglycemic rats showed lower (p < 0.05) glucose production from L-lactate (Fig. 4A)
than livers from normoglycemic rats. However, the glucose production from glycerol (2
mM) (Fig. 4B) was similar for both groups.
In the fifth set of experiments livers from hypoglycemic rats were infused with
physiological (0.45 mM) or saturating (5 mM) concentration of L-alanine. Livers infused
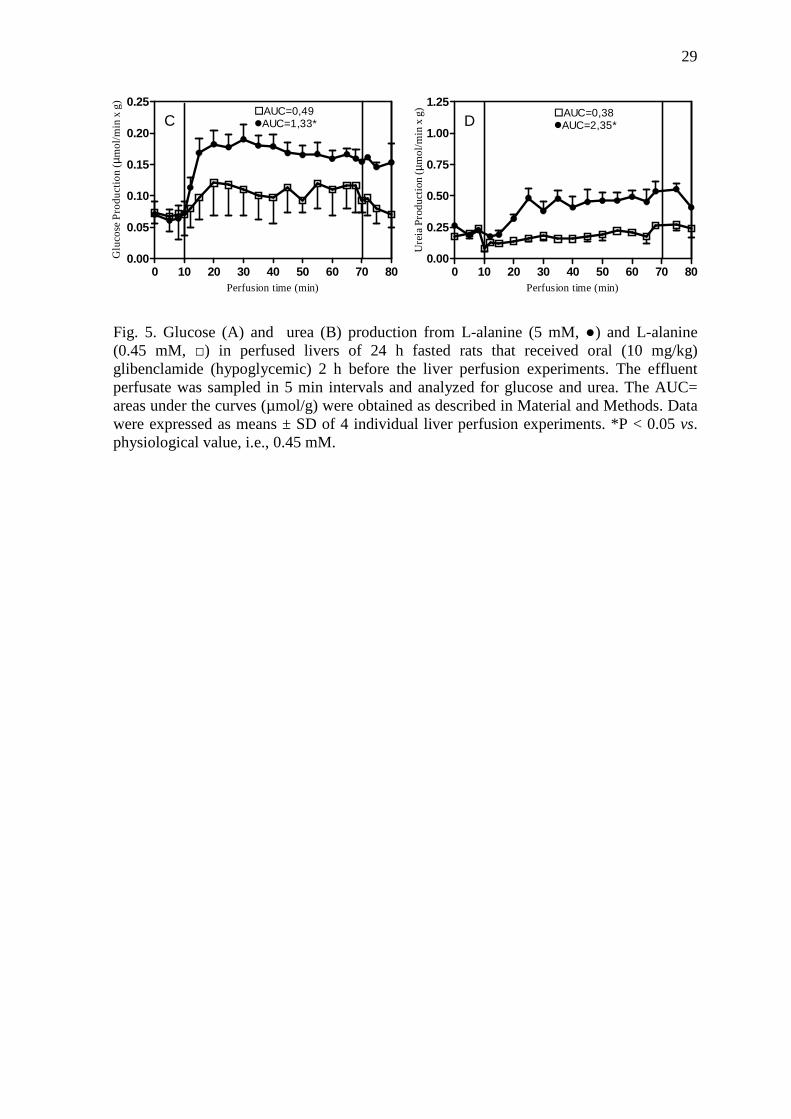
with saturating concentration of L-alanine showed higher (p < 0.05) glucose (Fig. 5A) and
urea (Fig. 5B) production than livers infused with physiological concentration of L-
alanine.

20
In the sixth set of experiments livers from hypoglycemic rats were infused with
physiological (2.0 mM) and saturating (5 mM) concentrations of L-glutamine. Livers
infused with saturating concentration of L-glutamine showed higher (p < 0.05) glucose
(Fig. 6A) and urea (Fig. 6B) production than livers infused with physiological
concentration of L-glutamine.
DISCUSSION
The first gluconeogenic substrate investigated was L-alanine which crossed the liver
cell membrane and was then converted to pyruvate. From the cytosol, pyruvate enters the
mitochondria. There, pyruvate was carboxylated and leaves mitochondria as aspartate or
malate. In the cytosol malate was converted to oxalacetate, then to phosphoenolpyruvate
and after of various steps they were converted by the microssomal glucose-6-phosphatase
to glucose wich was and released from the hepatocyte (Fig. 7). Since this complex pathway
depends of oxygen supply8) and several cellular compartments (plasma membrane, cytosol,
mitochondria and microssomal fraction), the glucose, L-lactate and pyruvate production
from L-alanine can be used as a marker of the integrity of the hepatocyte, since an absence
of glucose production and/or high L-lactate:pyruvate ratio indicate low viability and/or
poor oxygenation. Thus, L-alanine is a good indicator of the quality of the liver
preparation.
Therefore, by using saturating concentration of L-alanine we showed that the capacity
of the liver to produce glucose during SIH (Fig. 1A) was decreased (p<0.05). This result
could not be attributed to the decreased catabolism of L-alanine, since the urea production
from this amino acid was unchanged (Fig. 1B). Moreover, considering that the pyruvate
production (Fig. 1C) from L-alanine in livers from SIH rats was increased (p<0.05), the

21
possibility of a lower entrance of pyruvate in the gluconeogenic pathway must be
considered.
In agreement with this proposition, liver from SIH rats showed a decreased (p<0.05)
production of glucose not only from pyruvate (Fig. 2A) but also from L-Lactate (Fig. 4A).
Moreover, the liver glucose production from L-glutamine, that entered in the
gluconeogenesis after the Piruvate Carboxylase (PC) step, was also decreased (Fig. 3A).
This result, could not be attributed to the decreased catabolism of L-glutamine, since the
urea production from this amino acid was unchanged (Fig. 3B). However, the glucose
production from glycerol which enter in the gluconeogenesis after the mitochondrial step
was maintained.
Taken together the results suggest that the inhibition of gluconeogenesis promoted by
glibenclamide overcome the intensification of liver gluconeogenesis in response to
hypoglycemia18-20) Moreover, if these capabilities of glibenclamide are exerced in vivo, the
result will be an intensification of the effectiveness of this drug as hypoglycemic agent in
the fasted state. Moreover, it is possible that this suggestion could be expanded to other
sulphonylureas, specifically to fasted state. But not to fed state, since in this condition
glibenclamide stimulates glycogenolysis 8) .
However, in spite of the decreased capacity to produce glucose during SIH, the
possibility of the administration of gluconeogenic substrates during this condition must be
considered. This affirmation was based in the fact that during SIH the hepatic glucose
production from L-alanine (Fig. 5A) and L-glutamine (Fig. 6A) were lower but remained
virtually maintained and influenced by the availability of these gluconeogenic substrates.
Finally, our results and the considerations herein discussed, open the possibility of the
administration of gluconeogenic substrates in the treatment of SIH, particularly when the
therapy with glucose is not effective.

22
REFERENCES
1) Davis S., Alonso M. D., J. Diabetes Complications, 18, 60–68 (2004).
2) Souza H.M., Borba-Murad, G.R., Ceddia, R.B., Curi, R., Vardanega-Peicher, M.,
Bazotte, R.B., Braz. J. Med. Biol. Res., 34, 771–777 (2001).
3) Nascimento K. F., Garcia R. F., Gazola V. A. F. G., Souza H. M., Obici S., Bazotte
R. B., Life Science., 82, 1018-1022 (2008).
4) Davis S. N., Dobbins R., Tarumi C., Jacobs J., Neal D., Cherrington A. D., Am. J.
Physiol., 268, E521–E531 (1995).
5) Souza H. M., Hell N. S., Lopes G., Bazotte R. B., Acta Pharmacol. Sin., 17, 455-
459 (1996).
6) Sakamoto K., Yonoki Y., Fujioka T., Matsumura M., Mitsuta Y., Sano M., Saito
M., Nakahara T., Ishii K., Biol. Pharm. Bull., 29, 574–576 (2006).
7) Adams M.D., Raman P., Judd R. L., Biochem. Pharmacol., 55, 1915-1920, (1998).
8) Carvalho-Martini M., de Oliveira D.S., Suzuki-Kemmelmeier F., Bracht A. Res.
Commun. Mol. Pathol. Pharmacol., 119:115-126 (2006).
9) Fernandes M. A., Santos M. S., Moreno A. J., Duburs G., Oliveira C.R., Vicente J.
A., J. Biochem. Mol. Toxicol. 18,162-169 (2004).
10) White C. W., Rashed H. M., Patel T. B., J. Pharmacol. Exp. Ther., 246, 971-974,
(1988).
23
11) Bergmeyer H. U., Bernt E., “Determination of glucose with glucose-oxidase and
peroxidase,” ed. by Bergmeyer H. U., New York, 1974, pp. 1205–1215.
12) Obici S., Lopes-Bertolini G., Curi R., Bazotte R. B., Cell Biochem. Funct., 26, 755-
759 (2008).
13) Gutmann I., Bergmeyer H.U., “Determination of urea, indicator reaction with
phenol and hypochlorite,” ed. by Bergmeyer H. U., New York, 1974, pp. 1790–
1798.
14) Czok R., LamprechtW., “Pyruvate, phosphoenolpyruvate and D-glycerate-2-
phosphate”, ed. By Bergmeyer H. U., New York, 1974, pp. 1446-1448.
15) Gutmann I., Wahlefeld W., “L-(+)-Lactate. Determination with lactate
dehydrogenase and NAD” ed. By Bergmeyer H. U., New York, 1974, pp. 1464-
1472.
16) Garcia R. F., Gazola V. A. F. G., Barrena H. C., Hartmann E. M., Berti J., Toyama
M. H., Boschero A. C., Carneiro A. M., Manso F. C., Bazotte R.B., Amino Acids,
33, 151–155 (2007).
17) Newsholme P., Lima M. M. R., Procopio J., Pithon-Curi T. C., Doi S. Q., Bazotte
R. B., Curi R., Braz. J. Med. Biol. Res., 36, 153–163 (2003).
18) Garcia R. F., Gazola V. A. F. G., Curi R., Hartmann E. M., Barrena H. C.,
Nascimento K. F., Bazotte R. B. Lat. Am. J. Pharm., 27, 229-234 (2008).
19) Felisberto-Junior, A. M., Manso F. C., Gazola V. A. G., Obici S., Geisler, S. A.,
Bazotte, R. B., Biol. Pharm. Bull., 32, 232-236 (2009).
24
20) Oliveira-Yamashita F., Garcia R. F., Felisberto-Junior, A. M, Curi R., Bazotte R.B.,
Cell Biochem. Funct. 27, 30-34 (2009).

25
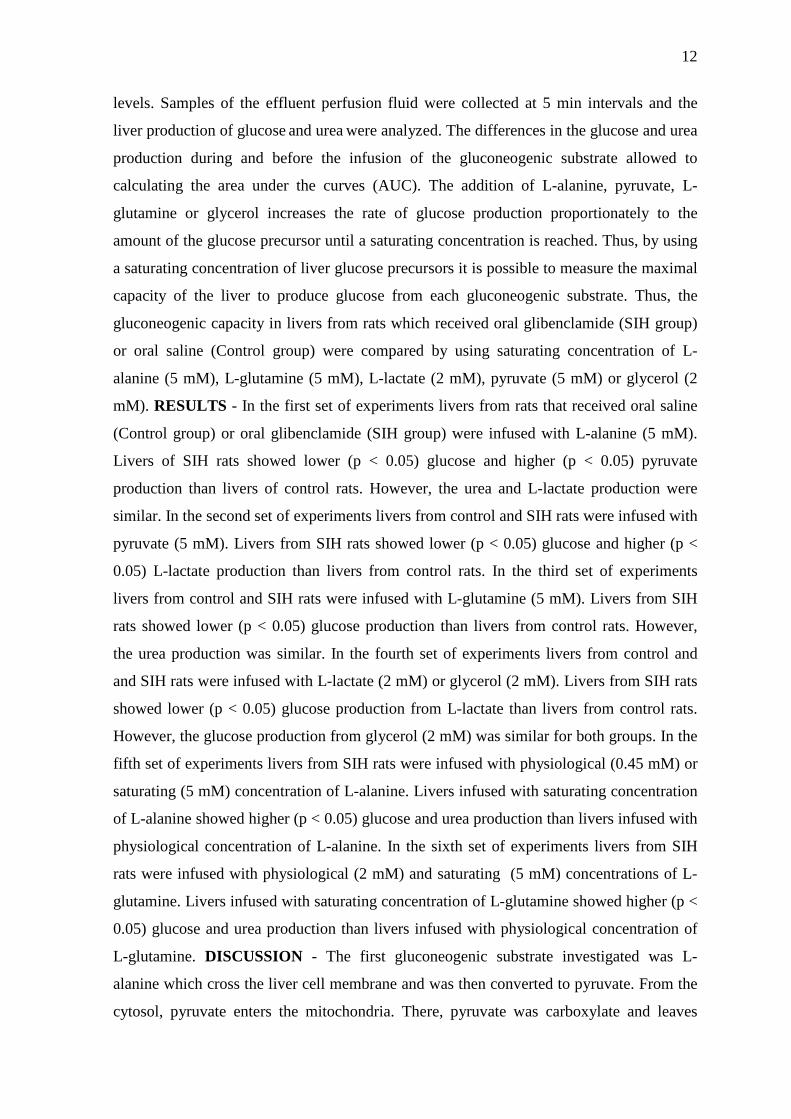
Fig.1. Glucose (A), urea (B), pyruvate (C) and L-lactate (D) production from L-alanine (5 mM) in perfused livers of 24 h fasted rats that received oral (10 mg/kg) glibenclamide (hypoglycemic, □) or saline (normoglycemic, ●) 2 h before the liver perfusion experiments. The effluent perfusate was sampled in 5 min intervals and analyzed for glucose, urea, pyruvate and L-lactate. The AUC= areas under the curves (µmol/g) were obtained as described in Material and Methods. Data were expressed as means ± SD of 4 individual liver perfusion experiments. *P < 0.05 vs. normoglycemic group.
0 10 20 30 40 50 60 70 800.0
0.1
0.2
0.3
0.4G
luc
ose
Pro
duc
tio
n ( µm
ol/m
in x
g)
1A� AUC = 2.32� AUC = 1.33*
Perfusion time (min)0 10 20 30 40 50 60 70 80
0.00
0.25
0.50
0.75
1.00
1.25
Ure
a P
rodu
cti
on ( µm
ol/m
in x
g)
1B� AUC = 2.57� AUC = 2.35
Perfusion time (min)
0 10 20 30 40 50 60 70 800.0
0.1
0.2
0.3
0.4
0.5
Pyr
uva
te P
rod
uct
ion
( µmo
l/min
x g
)
1C� AUC = 2.37� AUC = 4.02*
Perfusion time (min)
0 10 20 30 40 50 60 70 800.0
0.1
0.2
0.3
0.4
0.5
0.6
0.7
L-L
act
ate
Pro
duc
tion
( µmol
/min
x g
)
1D� AUC = 4.05� AUC = 5.39
Perfusion time (min)

26
Fig. 2. Glucose (A) and L-lactate (B) production from pyruvate (5 mM) in perfused livers of 24 h fasted rats that received oral (10 mg/kg) glibenclamide (hypoglycemic,□) or saline (normoglycemic, ●) 2 h before the liver perfusion experiments. The effluent perfusate was sampled in 5 min intervals and analyzed for glucose and L-lactate. The AUC= areas under the curves (µmol/g) were obtained as described in Material and Methods. Data were expressed as means ± SD of 4 individual liver perfusion experiments. *P < 0.05 vs. normoglycemic group.
0 10 20 30 40 50 60 70 800.0
0.2
0.4
0.6G
luc
ose
Pro
duc
tio
n ( µm
ol/m
in x
g)
2A
� AUC = 4.88� AUC = 3.86*
Perfusion time (min)0 10 20 30 40 50 60 70 80
0.0
0.5
1.0
1.5
2.0
L-L
act
ate
Pro
duct
ion
( µmol
/min
x g
)
2B
� AUC = 16.13� AUC = 21.64*
Perfusion time (min)

27
Fig. 3 Glucose (A) and urea (B) production from L-glutamine (5 mM) in perfused livers of 24 h fasted rats that received oral (10 mg/kg) glibenclamide (hypoglycemic, □) or saline (normoglycemic, ●) 2 h before the liver perfusion experiments. The effluent perfusate was sampled in 5 min intervals and analyzed for glucose and urea. The AUC= areas under the curves (µmol/g) were obtained as described in Material and Methods. Data were expressed as means ± SD of 4 individual liver perfusion experiments. *P < 0.05 vs. normoglycemic group.
0 10 20 30 40 50 60 70 800.0
0.1
0.2
0.3
0.4
0.5G
luco
se P
rod
uct
ion
(µ mo
l/min
x g
)3A
� AUC = 2.58� AUC = 1.66*
Perfusion time (min)
0 10 20 30 40 50 60 70 800.0
0.5
1.0
1.5
Ure
a p
rodu
ctio
n (µ m
ol/m
in x
g)
Perfusion time (min)
3B� AUC = 9.35� AUC = 8.84

28
Fig. 4. Glucose production from L-lactate 2 mM (A) and glycerol 2 mM (B) in perfused livers of 24 h fasted rats that received oral (10 mg/kg) glibenclamide (hypoglycemic, □) or saline (normoglycemic, ●) 2 h before the liver perfusion experiments. The effluent perfusate was sampled in 5 min intervals and analyzed for glucose. The AUC= areas under the curves (µmol/g) were obtained as described in Material and Methods. Data were expressed as means ± SD of 4 individual liver perfusion experiments. *P < 0.05 vs. normoglycemic group.
0 10 20 30 40 50 60 70 800.0
0.1
0.2
0.3
0.4
0.5
Glu
cose
Pro
du
ctio
n (µ m
ol/m
in x
g)
Perfusion time (min)
� AUC = 3.74� AUC = 3.17
4B
0 10 20 30 40 500.0
0.2
0.4
0.6
0.8
Glu
cose
Pro
du
ctio
n (µ m
ol/m
in x
g)
4A
� AUC = 4.17� AUC = 3.26*
Perfusion time (min)
29
Fig. 5. Glucose (A) and urea (B) production from L-alanine (5 mM, ●) and L-alanine (0.45 mM, □) in perfused livers of 24 h fasted rats that received oral (10 mg/kg) glibenclamide (hypoglycemic) 2 h before the liver perfusion experiments. The effluent perfusate was sampled in 5 min intervals and analyzed for glucose and urea. The AUC= areas under the curves (µmol/g) were obtained as described in Material and Methods. Data were expressed as means ± SD of 4 individual liver perfusion experiments. *P < 0.05 vs. physiological value, i.e., 0.45 mM.
0 10 20 30 40 50 60 70 800.00
0.05
0.10
0.15
0.20
0.25G
luco
se P
rod
uct
ion
(µ mo
l/min
x g
)C
�AUC=0,49�AUC=1,33*
Perfusion time (min)
0 10 20 30 40 50 60 70 800.00
0.25
0.50
0.75
1.00
1.25
Ure
ia P
rod
uctio
n (µ m
ol/m
in x
g)
D�AUC=0,38�AUC=2,35*
Perfusion time (min)

30
Fig. 6. Glucose (A) and urea (B) production from L-glutamine (5 mM, ●) and L-glutamine (2.0 mM, □) in perfused livers of 24 h fasted rats that received oral (10 mg/kg) glibenclamide (hypoglycemic) 2 h before the liver perfusion experiments. The effluent perfusate was sampled in 5 min intervals and analyzed for glucose and urea. The AUC= areas under the curves (µmol/g) were obtained as described in Material and Methods. Data were expressed as means ± SD of 4 individual liver perfusion experiments. *P < 0.05 vs. physiological value, i.e., 2.0 mM.
0 10 20 30 40 50 60 70 800.0
0.1
0.2
0.3
0.4G
luco
se P
rod
uct
ion
(µ mo
l/min
x g
)A �AUC=0,55
�AUC=1,66*
Perfusion time (min)0 10 20 30 40 50 60 70 80
0.0
0.5
1.0
1.5
Ure
ia P
rodu
ctio
n (µ m
ol/m
in x
g)
6B �AUC=1,670�AUC=8,849*
Perfusion time (min)

31
Fig. 7. Gluconeogenesis in the hepatocyte. Plasma membrane is represented by the greatest rectangle and mitochondria by the smallest rectangle. Decreased gluconeogenesis, ○Maintained gluconeogenesis. Abbreviations: AcCoA, acetyl-CoA; ASP, aspartate; CIT, citrate; AG, fatty acid; FDP, fructose diphosphate; F6P, fructose 6-phosphate; FUM, fumarate; GAP, glyceraldehyde phosphate; G6P, glucose 6-phosphate; α-KG, α-ketoglutarate; L-Glut, L-glutamine; PYR, pyruvate; MAL, malate; OAA, oxaloacetate; PEP, phosphoenolpyruvate, 2PG, 2-phosphoglycerate; 3PG, 3-phosphoglycerate; SUCC, succinate.
OAA
MAL
FUM
SUCC
ααααKG
CIT
AcCoA
AG PIR
ASP ASP
MAL
OAA
PIR PEP 2PG 3PG
GAP
FDP
F6P
G6P
GLIC
L-LACT L-ALAN
GLUCOSE
L-LACTATE L-ALANINE GLYCEROL
L-GLUTAMINE L-GLUT
PYRUVATE