RELATÓRIO AnuAl 2008/2009 - Associação Brasileira de...
36
2008/2009 ANNUAL REPORT RELATÓRIO ANUAL
Transcript of RELATÓRIO AnuAl 2008/2009 - Associação Brasileira de...

2008/2009AnnuAl RepoRt
RELATÓRIO AnuAl


�
Diretor – GuillermoHenDerson – Director
membro – CleverPirolaÁvila – MeMber
membro – aristiDesinÁCiovoGt – MeMber
membro – antonioauGustoDetoni – MeMber
membro – leomarsomensi – MeMber
membro – DilvoGrolli – MeMber
membro – mayrbonassi – MeMber
Conselho DiRetivo - Directive council
MessAge fRoM the exeCutive pResiDent
MensAgeM do Presidente Executivo
O ano de 2008 foi de muito trabalho para a ABEF e seus associados. O mercado internacional, que se mostrava extremamente favorável, foi atingido no último quadri-mestre pela crise financeira global. Mas ao seu término foram confirmados novos recordes, tanto em volumes quanto em receita.
Os acordos fechados para a abertura de dois dos maiores mercados do mundo, o da Índia e China, também foram resultados importantes das ações empreen-didas em 2008.
Para o futuro continuaremos com a priorida-de de oferecer ao mundo um produto dife-renciado, de elevado status sanitário, onde o modelo de integração entre produtores e frigoríficos e as melhores práticas no bem-estar animal são dois pilares.
A ABEF e seus associados também estão fir-mes no compromisso com a sustentabilida-de. Isto inclui iniciativas como o pleno respeito ao meio ambiente, em especial ao bioma amazônico.
Temos certeza de que a carne de frango brasileira conti-nuará sendo um produto de enorme apreciação por con-sumidores de todo o planeta.
É um grande orgulho para a ABEF trabalhar para o setor mais organizado do agronegócio brasileiro.
Francisco Turra
2008 was a hard working year for ABEF and its members. The international market, which showed extremely favorable before, was disturbed in the last four months of 2008, due to the global financial crisis. But at its ending, new records had been reached, both in volume and revenue.
The agreements signed opening two of the largest markets in the world, India and China, were important results of the actions un-dertaken in 2008.
For the future, we will continue with our priority to offer the world a differentiated product of high sanitary standards, where the model of integra-tion between producers and abattoirs, and the best practices in animal well-being are the most important factors.
ABEF and its members are also firm in their commit-ment to sustainability.
This includes initiatives of fully respecting the environment, in particular the Amazonian biome.
We are certain that Brazilian chicken meat will continue to be a product of enormous appreciation for worldwide.
It is with great pride that ABEF works for the best-organized sec-tor of the Brazilian agro-business.
Francisco Turra

inDexÍnDiCe
Relatório de atividades2008/2009
Destaques
Empresas associadas em 2008/2009
Estados exportadores em 2008
Destino da produção brasileira em 2008
Exportações brasileiras de carne de frango em 2008
Exportações brasileiras de carnes em 2008
O mercado mundial
Produção, importação e exportação mundial de carne de frango - 2008
Produção mundial de carne de frango - 2007/2008/2009
Importação mundial de carne de frango - 2007/2008/2009
Exportação mundial de carne de frango - 2007/2008/2009
Annual report 2008 x 2009
Highlights
Member companies in 2008/2009
Brazilian exporting states in 2008
Destination of Brazilian production in 2008
Brazilian chicken exports in 2008
Brazilian meat exports in 2008
The world market
World chicken meat production, imports and exports - 2008
World chicken meat production - 2007/2008/2009
World chicken meat Imports - 2007/2008/2009
World chicken meat exports - 2007/2008/2009
0706
10
10
11
1415
16
17
18
19

Exportações brasileiras de carne de frango – 2008 x 2007
Exportações de carne de frango por destinos selecionados
Exportações brasileiras de carne de frango por área geográfica em 2008
Exportações brasileiras de carne de frango por produto em 2008
Portos exportadores em 2008
Exportações brasileiras de carne de frango para outros destinos
Países
Exportações brasileiras de carne de frango (mil ton.) – série histórica
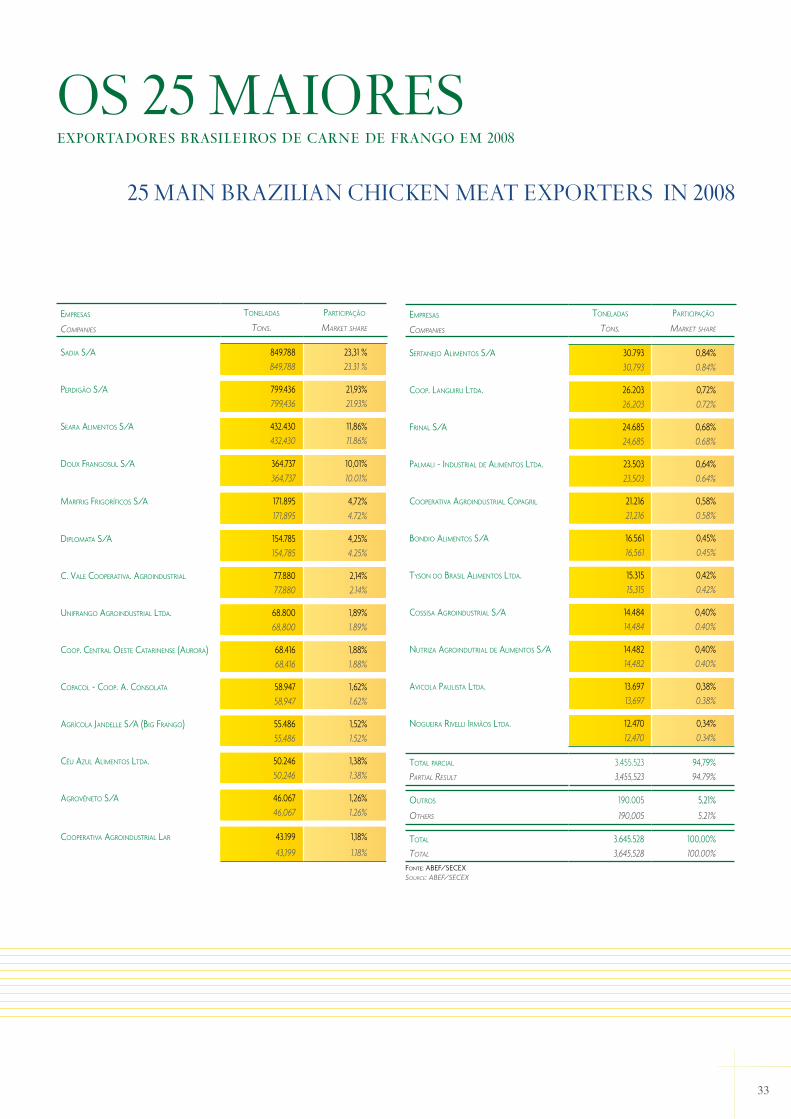
Os 25 maiores exportadores brasileiros de carne de frango em 2008
Exportações brasileiras de carnes de peru em 2008
Brazilian chicken meat exports – 2008 x 2007
Chicken meat exports by selected destinations
Brazilian chicken meat exports by geographic area in 2008
Brazilian chicken exports by product in 2008
Brazilian exporting ports in 2008
Brazilian chicken meat exports to other destinations
Countries
Brazilian chicken meat exports (1,000 MT) – historical background
25 main Brazilian chicken meat exporters in 2008
Brazilian turkey meat exports in 2008
20
21
25
25
26
27
32
33
37
30

�
Maior exportador mundial
Embarques de 3,6 milhões de toneladas
Receita cambial de US$ 6,9 bilhões
Crescimento de 11% no volume e de 40% na receita em relação a 2007
Participação nas exportações mundiais superior a 40%
Largest exporter in the world
Shipments of 3.6 million metric tons
Exchange revenue of US$ 6.9 billion
Growth of 11% in volume and 40% in revenue for 2007
Participation in world exports higher than 40%
DestAquesno setor
highlights

�
MeMbeR CoMpAnies in 2008/2009
eMpResAs AssoCiADAs em 2008/2009
AbAteDouRo são sAlvADoR ltDA. (supeR fRAngo)www.superfrango.com.brExportação: 6.468 toneladas líquidasExported volume: 6,468 net tonsParticipação: 0,18%Share in exports: 0.18%
AD’oRo s/Awww.adoro.com.brExportação: 9.395 toneladas líquidasExported volume: 9,395 net tonsParticipação: 0,26%Share in exports: 0.26%
AgRÍColA jAnDelle s/A (big fRAngo)www.bigfrango.com.brExportação: 55.486 toneladas líquidasExported volume: 55,486 net tonsParticipação: 1,52%Share in exports: 1.52%
AgRovêneto s/A inDústRiA De AliMentoswww.agroveneto.com.brExportação: 46.067 toneladas líquidasExported volume: 46,067 net tonsParticipação: 1,26%Share in exports: 1.26%
Céu Azul AliMentos ltDA.www.ceuazul.ind.brExportação: 50.246 toneladas líquidasExported volume: 50,246 net tonsParticipação: 1,38%Share in exports: 1.38%
CoopAvel – CoopeRAtivA AgRoinDustRiAlwww.coopavel.com.brExportação: 12.086 toneladas líquidasExported volume: 12,086 net tonsParticipação: 0,33%Share in exports: 0.33%
CoopeRAtivA AgRoinDustRiAl CopAgRilwww.copagril.com.brExportação: 21.216 toneladas líquidasExported volume: 21,216 net tonsParticipação: 0,64%Share in exports: 0.64%
CoopeRAtivA CentRAl oeste CAtARinense (AuRoRA AliMentos)www.auroraalimentos.com.brExportação: 68.416 toneladas líquidasExported volume: 68,416 net tonsParticipação: 1,88%Share in exports: 1.88%
CoopeRAtivA AgRoinDustRiAl lARwww.lar.ind.brExportação: 43.199 toneladas líquidasExported volume: 43,199 net tonsParticipação: 1,18%Share in exports: 1.18%
CopACol – CoopeRAtivA AgRoinDustRiAl ConsolAtAwww.copacol.com.brExportação: 58.947 toneladas líquidasExported volume: 58,947 net tonsParticipação: 1,62%Share in exports: 1.62%

�
CossisA AgRoinDustRiAl s/Awww.cossisa-agro.com.brExportação: 14.484 toneladas líquidasExported volume: 14,484 net tonsParticipação: 0,40%Share in exports: 0.40%
C. vAle CoopeRAtivA AgRoinDustRiAlwww.cvale.com.brExportação: 77.880 toneladas líquidasExported volume: 77,880 net tonsParticipação: 2,14%Share in exports: 2.14%
DiploMAtA s/A inDustRiAl e CoMeRCiAlwww.diplomata.ind.brExportação: 154.785 toneladas líquidasExported volume: 154,785 net tonsParticipação: 4,25%Share in exports: 4.25%
Doux fRAngosul s/A AgRo AvÍColA inDustRiAlwww.doux.com.brExportação: 364.737 toneladas líquidasExported volume: 364,737 net tonsParticipação: 10,01%Share in exports: 10.01%
fRinAl s/A fRigoRÍfiCo e integRAção AvÍColAwww.frinal.com.brExportação: 24.685 toneladas líquidasExported volume: 24,685 net tonsParticipação: 0,68%Share in exports: 0.68%
globoAves AgRo AvÍColA ltDA.www.globoaves.com.brExportação: 2.111 toneladas líquidasExported volume: 2,111 net tonsParticipação: 0,58%Share in exports: 0.58%
MARfRig fRigoRÍfiCos e CoMéRCio De AliMentos s/Awww.marfrig.com.brExportação: 171.895 toneladas líquidasExported volume: 171,895 net tonsParticipação: 4,72%Share in exports: 4.72%
MineRvA DAwn fARMs inDústRiA e CoMéRCio De pRoteÍnAs s/Awww.minerva.ind.br
nogueiRA Rivelli iRMãos ltDA. – Rivelli AliMentoswww.rivellialimentos.com.brExportação: 12.470 toneladas líquidasExported volume: 12,470 net tonsParticipação: 0,34%Share in exports: 0.34%
peRDigão s/Awww.perdigao.com.brExportação: 799.436 toneladas líquidasExported volume: 799,436 net tonsParticipação: 21,93%Share in exports: 21.93%

Rio bRAnCo AliMentos s/A (pif pAf)www.pifpaf.com.brExportação: 10.000 toneladas líquidasExported volume: 10,000 net tonsParticipação: 0,27%Share in exports: 0.27%
sADiA s/Awww.sadia.com.brExportação: 849.788 toneladas líquidasExported volume: 849,788 net tonsParticipação: 23,31%Share in exports: 23.31%
seARA AliMentos s/Awww.seara.com.brExportação: 432.430 toneladas líquidasExported volume: 432,430 net tonsParticipação: 11,86%Share in exports: 11.86%
seRtAnejo AliMentos s/Awww.gruposertanejo.com.brExportação: 30.793 toneladas líquidasExported volume: 30,793 net tonsParticipação: 0,84%Share in exports: 0.84%
unifRAngo AgRoinDustRiAl De AliMentos s/Awww.unifrango.comExportação: 68.800 toneladas líquidasExported volume: 68,800 net tonsParticipação: 1,89%Share in exports: 1.89%
vossko Do bRAsil AliMentos CongelADos ltDA.www.vosskodobrasil.com.brExportação: 9.585 toneladas líquidasExported volume: 9,585 net tonsParticipação: 0,26%Share in exports: 0.26%
zAnChettA AliMentos ltDA.www.zanchetta.com.br

bRAziliAn expoRting stAtes in 2008
21,28%//21.28%
26,76%// 26.76%
26,85%//26.85% 8,91%//8,91%
3,41%// 3.41%
2,95%//2.95%
4,43%//4.43%
1,90%// 1.90%
3,34%//3.34%
estaDos exPortação(tons.)
StateS exportS (tonS.)
ParanÁ 978.735
parana 978,735
santaCatarina 975.415
Santa catarina 975,415
rioGranDeDosul 775.685
rio GranDe Do Sul 775,685
sãoPaulo 324.903
Sao paulo 324,903
GoiÁs 161.387
GoiaS 161,387
matoGrossoDosul 124.250
Mato GroSSo Do Sul 124,250
minasGerais 121.904
MinaS GeraiS 121,904
matoGrosso 107.559
Mato GroSSo 107,559
DistritoFeDeral 69.132
DiStrito FeDeral 69,132
subtotal 3.638.970
Sub total 3,638,970
outrosComsiF 6.558
otherS with SiF 6,558
totalGeral 3.645.528
GranD total 3,645,528Fonte:seCex
Source: Secex
Destino DA pRoDução bRAsileiRA eM 2008DestinAtion of bRAziliAn pRoDuCtion in 2008
33% ExportaçõEs // 33% Exports
67% Consumo intErno // 67% DomEstiC salEs
Fonte:abeF
sourCe:abeF
estADosexportadores em 2008
10

11
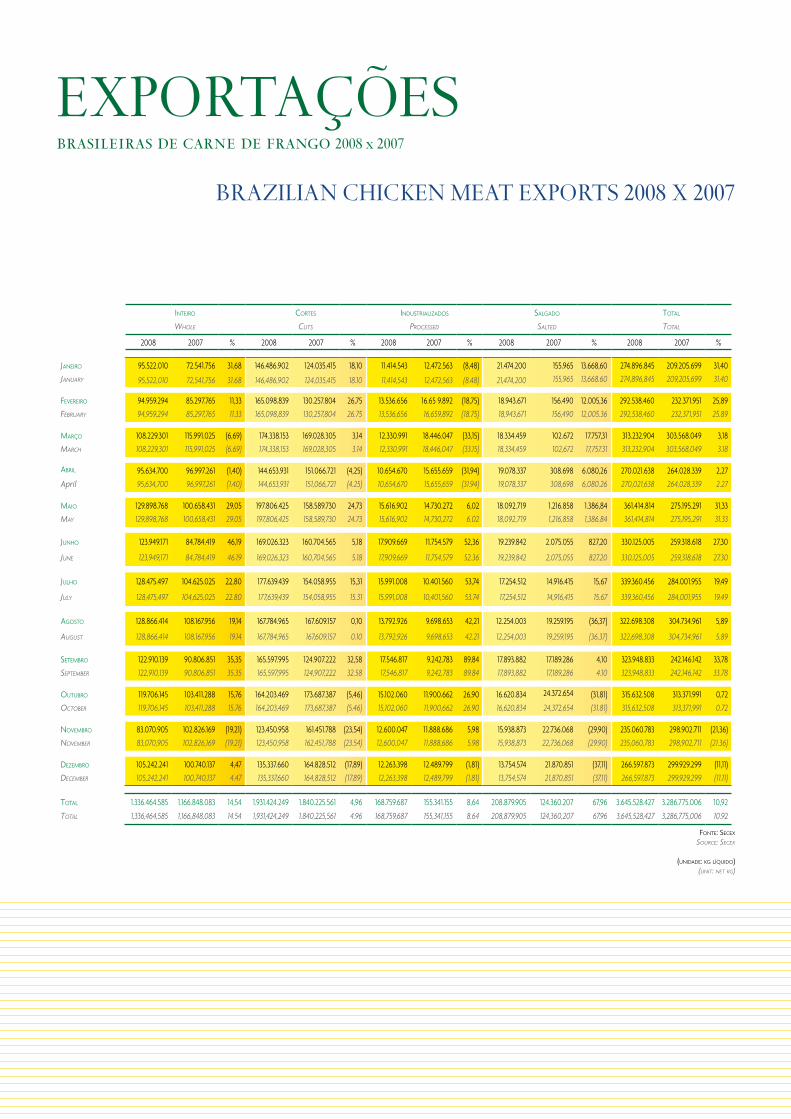
O ano de 2008 totalizou embarques de 3,6 milhões de toneladas de carne de frango, registrando um crescimen-to de 10,9% em relação a 2007 que superou os 8,6% ini-cialmente projetados para o período. Já a receita cam-bial, que atingiu a casa de US$ 6,9 bilhões, representou um aumento de 39,7% da receita cambial. Os números são crescentes e positivos considerando-se a inesperada crise econômica.
o DeseMpenho poR segMentos
CoRtes De fRAngo
Destrinchar o mercado por segmentos oferece uma visão mais nítida do comportamento do setor diante da crise. O ano de 2008 registrou embarques de corte de fran-go da ordem de 1,9 milhão de toneladas, representando 4,4% de crescimento em 2008. A receita cambial cresceu 30%, somando US$ 3,6 bilhões.
Nesse segmento destacaram-se os mercados do Japão, Hong-Kong, União Européia, África do Sul e Rússia como os principais clientes.
fRAngo inteiRo
Concentrados no Oriente Médio (particularmente na Arábia Saudita, Emirados Árabes, Iêmen e Kuwait) e em países como Venezuela, Rússia e Angola, os embarques de frango inteiro totalizaram 1,3 milhão de toneladas ex-portadas. A marca representa um aumento de 15% em re-lação ao exercício de 2007 e um crescimento da receita cambial da ordem de 53%, totalizando US$ 2,2 bilhões.
expoRtAçõesbrasileiras de carne de frango em 2008
bRAziliAn ChiCken expoRts in 2008
In 2008 we had a total shipment of 3.6 million metric tons of chicken meat, registering a growth of 10.9% compared to 2007, this exceeded the 8.6% originally projected for the period. The foreign exchange revenue, that reached US$ 6.9 billion, represented an increase of 39.7% over the last foreign revenue. The numbers are increasing and positive, considering the unexpected economic crisis.
peRfoRMAnCe by segMent
ChiCken Cuts
A view of the market in segments, offers a clear vision of the sector before the crisis. Shipments of chicken registered 1.9 million metric tons in 2008, representing 4.4% growth. The foreign exchange revenue grew 30%, adding US$ 3.6 billion,
Main customers for this segment were Japan, Hong-Kong, European Union, South Africa and Russia markets.
whole ChiCken
Concentrated in the Middle East (particularly in Saudi Arabia, United Arab Emirates, Yemen and Kuwait) and in other countries like Venezuela, Russia and Angola, whole chicken shipments totaled 1.3 million metric tons. This represents 15% increase for the year 2007 and growth in foreign exchange revenue of 53%, totaling US$ 2.2 billion.

outRos segMentos
Os embarques de produtos industrializados de frango so-maram em 2008 169 mil toneladas, um crescimento, com-parativamente a 2007, de 8,6% e aumento de 32% da recei-ta cambial, que totalizou US$ 531 milhões. No segmento de carnes salgadas o crescimento verificado foi de 68,5%, com embarques de 209 mil toneladas e receita cambial de US$ 596 milhões, 67,3% maior do que em 2007. A União Européia foi o principal destino dessas exportações.
o DeseMpenho poR MeRCADos
união euRopéiA
Apesar da redução de 6% no volume de embarques para a UE, que somaram 526 mil toneladas, a receita cambial de US$ 1,4 bilhão obtida representou um aumento de 8%comparativo a 2007.
oRiente MéDio
Esse mercado registrou crescimento de 13% no total de embarques, com um volume de 1,1 milhão de toneladas, e incremento de 46% na receita cambial, que somou US$ 2 bilhões.
AMéRiCA Do sul
Com os maiores aumentos percentuais registrados no período, os embarques para a América do Sul somaram 329 mil toneladas, um crescimento de 90% em compara-ção a 2007, e receita cambial de US$ 557 milhões, repre-sentando aumento de 157%.
ÁfRiCA
Queda de 4% marcou a performance do ano no continen-te africano, com embarques de 250 mil toneladas. Apesar disso, a receita cambial de US$ 269 milhões significou um aumento de 15% em relação a 2007.
otheR segMents
In 2008, shipments of processed totaled 169 metric tons, 8.6% growth compared to 2007, and an increase of 32% in foreign ex-change revenue, which totaled US$ 531 million. The salted meat sector presented a 68.5% growth, with shipments of 209 metric tons and foreign exchange revenue of US$ 596 million, 67.3% high-er than in 2007. The European Union was the main destination.
MARket peRfoRMAnCe
euRopeAn union
Despite the reduction of 6% in shipment volume for the EU, which totaled 526 metric tons, the exchange revenue was of US$ 1.4 bil-lion, representing 8% increase compared to 2007.
MiDDle eAst
The market rose by 13% in total shipments, with a volume of 1.1 million metric tons, and an increase of 46% in foreign exchange revenue, which added US$ 2 billion.
south AMeRiCA
With the largest percentage increase recorded in the period, ship-ments to South America totaled 329 thousand metric tons, a growth of 90% compared to 2007, and foreign exchange revenue of US$ 557 million, representing 157% growth.
AfRiCA
Decrease of 4% marked the performance in the year for the Afri-can continent, with shipments of 250 metric tons. However, for-eign exchange revenue of US$ 269 million represented an increase of 15% compared to 2007.

1�
ÁsiA
Para essa região as exportações de 936 mil toneladas re-gistraram um aumento de 15% em comparação a 2007, en-quanto a receita cambial, de US$ 1,9 bilhão, cresceu 62%.
RússiA
Outro registro de queda nos embarques, desta vez acen-tuada, atingindo 18%, refere-se ao mercado russo, que so-mou 159 mil toneladas, representando uma receita cam-bial de US$ 309 milhões, com aumento de 4% em relação aos índices de 2007.
peRspeCtivAs
Considerando o prolongamento da crise, as projeções da ABEF para 2009 estimam embarques de aproximadamen-te 3,8 milhões de toneladas, com aumento de até 5% em comparação aos números de 2008.
AsiA
Exports to this region totaled 936 metric tons, registering 15% in-crease compared to 2007, while the foreign exchange revenue of US$ 1.9 billion, represented 62% growth.
RussiA
Another recorded drop in shipments, this time accentuated reach-ing 18%. The Russian market totaled 159 thousand metric tons representing an exchange revenue of US$ 309 million, with an in-crease of 4% to the indexes in 2007.
peRspeCtive
Considering the extension of the crisis, ABEF estimates shipments of aproximately 3.8 million metric tones for 2009, an increase of up to 5% compared to figures of 2008.

volumeton.
VoluMe tonS.
PartiCiPação
Market Share
FranGo 3.645.528 63,26chicken 3,645,528 63.26
bovina 1.383.864 24,01beeF 1,383,864 24.01
suína 529.418 9,19pork 529,418 9.19
Peru 204.251 3,54turkey 204,251 3.54
total 5.763.061 100,00total 5,763,061 100.00
Fontes:abiPeCs,abieC,seCex
SourceS: abipecS, abiec, Secex
expoRtAçõesbrasileiras de carnes em 2008
bRAziliAn MeAt expoRts in 2008
24,01%Bovina// 24.01% Beef
9,19%suína// 9.19% pork 3,54%Peru//3.54% turkey
reCeitau$$mil
reVenue u$$ thouSanD
PartiCiPação
Market Share
FranGo 6.948.783 48,55chicken 6,948,783 48.55
bovina 5.325.480 37,21beeF 5,325,480 37.21
suína 1.479.242 10,34pork 1,479,242 10.34
Peru 557.904 3,90turkey 557,904 3.90
total 14.311.408 100,00total 14,311,408 100.00
Fontes:abiPeCs,abieC,seCex
SourceS: abipecS, abiec, Secex
48,55%FranGo//48.55% chicken
37,21%bovina// 37.21% beeF
10,34%suína// 10.34% pork 3,90%Peru//3.90% turkey
63,26%FranGo//63.26% chicken
14

15
pRoDução
Mesmo sob o impacto da crise econômica que se abateu sobre os cinco continentes em outubro de 2008, a pro-dução mundial de carne de frango registrou crescimento de 4,5%, pouco abaixo dos 6,2% registrados em 2007, to-talizando 71,2 milhões de toneladas, segundo dados do United States Department of Agriculture (USDA). O Brasil segue no terceiro lugar do ranking, com 10,9 milhões de toneladas, auferindo um crescimento de 6,2%, precedido pela China, com 11,9 milhões de toneladas, e Estados Uni-dos, em primeiro lugar com seus 16,6 milhões de tonela-das, com crescimentos respectivos de 5,4 e 2,1%.
iMpoRtAção
Também no volume de importações o mercado mundial de frango registrou crescimento, atingindo o percentual de 10,1% com 7,7 milhões de toneladas, muito próximo dos 11,8% registrados no ano anterior. O maior crescimen-to verificado deu-se na Arábia Saudita, que aumentou em 8,51% suas importações, seguida pelo Japão e União Eu-ropéia com índices de, respectivamente, 5,89% e 5,78%.
expoRtAção
Totalizando embarques de 8,4 milhões de toneladas, o crescimento de 13,7% no volume de exportações mun-diais mostra que o setor não se deixou abater pela crise.
Com o maior volume individual, o Brasil lidera o ranking com 3,6 milhões de toneladas exportadas, registrando um crescimento de 10,9%. Estados Unidos e União Eu-ropéia mantiveram-se em 2º e 3º lugar, com volumes de 3,2 e 0,7 milhão de toneladas respectivamente e cresci-mentos significativos de 17,5 e 16,5%. Para a China o ano terminou em vermelho, com uma queda de 20,4% nos embarques, que tiveram uma redução de 0,7 milhão em relação ao ano anterior.
o MeRCADo mundial
the woRlD MARket
pRoDuCtion
According to the United States Department of Agriculture (USDA), even under the impact of the global economic crisis that affected the five continents in October 2008, the global chicken meat pro-duction rose 4.5%, slightly below the 6.2% recorded in 2007, total-ing 71.2 million metric tons.
Brazil follows in third place with 10.9 million metric tons, earning a significant growth of 6.2%, preceded by China, with 11.9 million metric tons, and the United States, in first, with its 16.6 million metric tons, with a respective increase of 5.4% and 2.1%.
iMpoRt
The chicken world market also rose in the volume of imports, reaching 10.1% with 7.7 million metric tons, very close to the 11.8% recorded the previous year.
Saudi Arabia presented the higher growth, increasing 8.51% its imports, followed by Japan and European Union, with respective rates of 5.89% and 5.78%.
expoRt
With total shipments of 8.4 million metric tons, a growth of 13.7% in the volume of world exports shows that the industry has not been affected by the crisis.
With the greatest individual volume, Brazil leads the ranking with 3.6 million metric tons exported, registering a growth of 10.9%. The United States and the European Union stood at 2nd and 3rd places, with volumes of 3.2 and 0.7 million metric tons respec-tively and a significant growth of 17.5% and 16.5%. For China the year ended with negative figures, with a decline of 20.4% in ship-ments, which totaled a decline of 0.7 million compared to the previous year.

1�
2008woRlD ChiCken
MeAt pRoDuCtion
eua//uSa
CHina//china
brasil// brazil
ue27// eu 27
méxiCo//Mexico
munDo//worlD
0
0(milton.)
(1,000 MT)
2.804//2,804
8.560// 8,560
10.940//10,940
11.895// 11,895
70.000
70,000
60.000
60,000
50.000
50,000
40.000
40,000
30.000
30,000
20.000
20,000
10.000
10,000
16.561//16,561
71.249//71,249
iMpoRtAção MunDiAl De CARne De fRAngo
woRlD ChiCken MeAt iMpoRts
rússia//ruSSia
JaPão//Japan
ue27// eu 27
CHina//china
arÁbia//arábia
munDo//worlD
0
0(milton.)
(1,000 Mt)
7.732//7,732
510//510
399//399
677//677
737// 737
1.159// 1,159
7.000
7,000
6.000
6,000
5.000
5,000
4.000
4,000
3.000
3,000
2.000
2,000
1.000
1,000
expoRtAção MunDiAl De CARne De fRAngo
woRlD ChiCken MeAt expoRts
brasil//brazil
eua//uSa
ue27//eu 27
CHina//china
tailânDia//thailanD
munDo//worlD
0
0(milton.)
(1,000 Mt)
8.396//8,396
383//383
285//285
740//740
3.158// 3,158
3.645// 3,645
8.000
8,000
6.000
6,000
5.000
5,000
4.000
4,000
3.000
3,000
2.000
2,000
1.000
1,000
7.000
7,000
pRoDução MunDiAl De CARne De fRAngo
*
Fore
ca
St /
/
F
on
tes:
usD
a,a
beF
//
So
urc
e:S: u
SDa, a
beF

1�
*
Prev
isã
o/
/*
Fore
ca
St /
/
F
on
tes:
usD
a,a
beF
//
So
urc
eS: u
SDa, a
beF
pRoDuçãomundial de carne de frango
woRlD ChiCken MeAt pRoDuCtion
2008
50.000
50,000
40.000
40,000
30.000
30,000
20.000
20,000
10.000
10,000
0
0
(mil/ton.)
(1,000 Mt)
70.000
70,000
60.000
60,000
71.249//71,249
2.804//2,804
8.560// 8,560
10.940//10,940
11.895//11,895
16.561//16,561 eua// uSa
CHina//china
brasil// brazil
ue27//eu 27
méxiCo//Mexico
munDo//worlD
2007
50.000
50,000
40.000
40,000
30.000
30,000
20.000
20,000
10.000
10,000
0
0
(mil/ton.)
(1,000 Mt)
60.000
60,000
16.225//16,225 eua//uSa
68.187// 68,187
2.683//2,683
8.320//8,320
10.305//10,305
11.291 //11,291 CHina//china
brasil//brazil
ue27//eu 27
méxiCo//Mexico
munDo//worlD
2009*
50.000
50,000
40.000
40,000
30.000
30,000
20.000
20,000
10.000
10,000
0
0
(mil/ton.)
(1,000 Mt)
70.000
70,000
60.000
60,000
eua//uSa
CHina//china
brasil//brazil
ue27//eu 27
méxiCo//Mexico
munDo//worlD71.354//71,354
2.795//2,795
8.600//8,600
11.360// 11,360
12.133// 12,133
15.919//15,919

1�
*
Prev
isã
o/
/*
Fore
ca
St /
/
F
on
te:u
sDa/
/S
ou
rce:
uSD
a
2009*
5.000
5,000
4.000
4,000
3.000
3,000
2.000
2,000
1.000
1,000
0
0
(mil/ton.)
(1,000 Mt)
7.000
7,000
6.000
6,000
rússia//ruSSia
ue27//eu 27
JaPão//Japan
arÁbiasauDita//SauDi arabia
méxiCo//Mexico
munDo//worlD7.555//7,555
470//470
510//510
670//670
680//680
980//980
iMpoRtAçãomundial de carne de frango
woRlD ChiCken MeAt iMpoRts
2008
5.000
5,000
4.000
4,000
3.000
3,000
2.000
2,000
1.000
1,000
0
0
(mil/ton.)
(1,000 Mt)
7.000
7,000
6.000
6,000
7.732//7,732
447//447
510//510
677//677
737//737
1.159//1,159 rússia//ruSSia
JaPão//Japan
ue27//eu 27
arÁbiasauDita//SauDi arabia
méxiCo//Mexico
munDo//worlD
2007
5.000
5,000
4.000
4,000
3.000
3,000
2.000
2,000
1.000
1,000
0
0
(mil/ton.)
(1,000 Mt)
7.000
7,000
6.000
6,000
7.025//7,025
470//470
482//482
673//673
696//696
1.222//1,222 rússia//ruSSia
JaPão//Japan
ue27//eu 27
CHina//china
arÁbiasauDita//SauDi arabia
munDo//worlD

19
expoRtAçãomundial de carne de frango
woRlD ChiCken MeAt expoRts
*
Prev
isã
o/
/*
Fore
ca
St /
/
F
on
tes:
usD
a,a
beF
//
So
urc
eS: u
SDa, a
beF
2007
5.000
5,000
4.000
4,000
3.000
3,000
2.000
2,000
1.000
1,000
0
0
(mil/ton.)
(1,000 Mt)
7.000
7,000
6.000
6,000
7.382//7,382
296//296
358//358
635//635
2.678//2,678
3.287//3,287 brasil//brazil
eua//uSa
ue27//eu 27
CHina//china
tailânDia//thailanD
munDo//worlD
2008
5.000
5,000
4.000
4,000
3.000
3,000
2.000
2,000
1.000
1,000
0
0
(mil/ton.)
(1,000 Mt)
7.000
7,000
6.000
6,000
8.396//8,396
285//285
383//383
740//740
3.158//3,158
3.646//3,646 brasil//brazil
eua//uSa
ue27//eu 27
tailânDia//thailanD
CHina//china
munDo//worlD
8.000
8,000
2009*
5.000
5,000
4.000
4,000
3.000
3,000
2.000
2,000
1.000
1,000
0
0
(mil/ton.)
(1,000 Mt)
7.000
7,000
6.000
6,000
brasil//brazil
eua//uSa
ue27//eu 27
tailânDia//thailanD
CHina//china
munDo//worlD7.858//7,858
215//215
360//360
685//685
2.744//2,744
3.800//3,800
inteiro
whole
Cortes
cutS
inDustrializaDos
proceSSeD
salGaDo
SalteD
total
total
2008 2007 % 2008 2007 % 2008 2007 % 2008 2007 % 2008 2007 %
Janeiro 95.522.010 72.541.756 31,68 146.486.902 124.035.415 18,10 11.414.543 12.472.563 (8,48) 21.474.200 155.965 13.668,60 274.896.845 209.205.699 31,40
January 95,522,010 72,541,756 31.68 146,486,902 124,035,415 18.10 11,414,543 12,472,563 (8.48) 21,474,200 155,965 13,668.60 274,896,845 209,205,699 31.40
Fevereiro 94.959.294 85.297.765 11,33 165.098.839 130.257.804 26,75 13.536.656 16.659.892 (18,75) 18.943.671 156.490 12.005,36 292.538.460 232.371.951 25,89
February 94,959,294 85,297,765 11.33 165,098,839 130,257,804 26.75 13,536,656 16,659,892 (18.75) 18,943,671 156,490 12,005.36 292,538,460 232,371,951 25.89
março 108.229.301 115.991.025 (6,69) 174.338.153 169.028.305 3,14 12.330.991 18.446.047 (33,15) 18.334.459 102.672 17.757,31 313.232.904 303.568.049 3,18
March 108,229,301 115,991,025 (6.69) 174,338,153 169,028,305 3.14 12,330,991 18,446,047 (33.15) 18,334,459 102,672 17,757.31 313,232,904 303,568,049 3.18
abril 95.634.700 96.997.261 (1,40) 144.653.931 151.066.721 (4,25) 10.654.670 15.655.659 (31,94) 19.078.337 308.698 6.080,26 270.021.638 264.028.339 2,27
April 95,634,700 96,997,261 (1.40) 144,653,931 151,066,721 (4.25) 10,654,670 15,655,659 (31.94) 19,078,337 308,698 6,080.26 270,021,638 264,028,339 2.27
maio 129.898.768 100.658.431 29,05 197.806.425 158.589.730 24,73 15.616.902 14.730.272 6,02 18.092.719 1.216.858 1.386,84 361.414.814 275.195.291 31,33
May 129,898,768 100,658,431 29.05 197,806,425 158,589,730 24.73 15,616,902 14,730,272 6.02 18,092,719 1,216,858 1,386.84 361,414,814 275,195,291 31.33
JunHo 123.949.171 84.784.419 46,19 169.026.323 160.704.565 5,18 17.909.669 11.754.579 52,36 19.239.842 2.075.055 827,20 330.125.005 259.318.618 27,30
June 123,949,171 84,784,419 46.19 169,026,323 160,704,565 5.18 17,909,669 11,754,579 52.36 19,239,842 2,075,055 827.20 330,125,005 259,318,618 27.30
JulHo 128.475.497 104.625.025 22,80 177.639.439 154.058.955 15,31 15.991.008 10.401.560 53,74 17.254.512 14.916.415 15,67 339.360.456 284.001.955 19,49
July 128,475,497 104,625,025 22.80 177,639,439 154,058,955 15.31 15,991,008 10,401,560 53.74 17,254,512 14,916,415 15.67 339,360,456 284,001,955 19.49
aGosto 128.866.414 108.167.956 19,14 167.784.965 167.609.157 0,10 13.792.926 9.698.653 42,21 12.254.003 19.259.195 (36,37) 322.698.308 304.734.961 5,89
auGuSt 128,866,414 108,167,956 19.14 167,784,965 167,609,157 0.10 13,792,926 9,698,653 42.21 12,254,003 19,259,195 (36.37) 322,698,308 304,734,961 5.89
setembro 122.910.139 90.806.851 35,35 165.597.995 124.907.222 32,58 17.546.817 9.242.783 89,84 17.893.882 17.189.286 4,10 323.948.833 242.146.142 33,78
SepteMber 122,910,139 90,806,851 35.35 165,597,995 124,907,222 32.58 17,546,817 9,242,783 89.84 17,893,882 17,189,286 4.10 323,948,833 242,146,142 33.78
outubro 119.706.145 103.411.288 15,76 164.203.469 173.687.387 (5,46) 15.102.060 11.900.662 26,90 16.620.834 24.372.654 (31,81) 315.632.508 313.371.991 0,72
october 119,706,145 103,411,288 15.76 164,203,469 173,687,387 (5.46) 15,102,060 11,900,662 26.90 16,620,834 24,372,654 (31.81) 315,632,508 313,371,991 0.72
novembro 83.070.905 102.826.169 (19,21) 123.450.958 161.451.788 (23,54) 12.600.047 11.888.686 5,98 15.938.873 22.736.068 (29,90) 235.060.783 298.902.711 (21,36)
noVeMber 83,070,905 102,826,169 (19.21) 123,450,958 162,451,788 (23.54) 12,600,047 11,888,686 5.98 15,938,873 22,736,068 (29.90) 235,060,783 298,902,711 (21.36)
Dezembro 105.242.241 100.740.137 4,47 135.337.660 164.828.512 (17,89) 12.263.398 12.489.799 (1,81) 13.754.574 21.870.851 (37,11) 266.597.873 299.929.299 (11,11)
DeceMber 105,242,241 100,740,137 4.47 135,337,660 164,828,512 (17.89) 12,263,398 12,489,799 (1.81) 13,754,574 21,870,851 (37.11) 266,597,873 299,929,299 (11.11)
total 1.336.464.585 1.166.848.083 14,54 1.931.424.249 1.840.225.561 4,96 168.759.687 155.341.155 8,64 208.879.905 124.360.207 67,96 3.645.528.427 3.286.775.006 10,92
total 1,336,464,585 1,166,848,083 14.54 1,931,424,249 1.840,225,561 4.96 168,759,687 155,341,155 8.64 208,879,905 124,360,207 67.96 3,645,528,427 3,286,775,006 10.92
Fonte:seCex
Source: Secex
(uniDaDe:kGlíquiDo)(unit: net kG)
expoRtAçõesbrasileiras de carne de frango 2008 x 2007
bRAziliAn ChiCken MeAt expoRts 2008 x 2007

expoRtAçõesde carne de frango por destinos selecionados
ChiCken MeAt expoRts by seleCteD DestinAtions
Destino
iMportinG country
inteiro
whole
Cortes
cutS
inDustrializaDos
proceSSeD
salGaDos
SalteD
total
total
2008 2007 % 2008 2007 % 2008 2007 % 2008 2007 % 2008 2007 %
uniãoeuroPéia 16.057.752 25.934.411 (38,08) 169.797.676 288.715.386 (41,19) 132.146.130 123.802.756 6,74 207.866.609 122.506.386 69,68 525.868.167 560.958.939 (6,26)
european union 16,057,752 25,934,411 (38.08) 169,797,676 288,715,386 (41.19) 132,146,130 123,802,756 6.74 207,866,609 122,506,386 69,68 525,868,167 560,958,939 (6.26)
alemanHa 878.359 2.087.073 (57,91) 15.983.475 43.192.915 (63,00) 35.388.305 27.421.279 29,05 57.155.913 35.101.116 62,83 109.406.052 107.802.383 1,49
GerMany 878,359 2,087,073 (57.91) 15,983,475 43,192,915 (63.00) 35,388,305 27,421,279 29.05 57,155,913 35,101,116 62.38 109,406,052 107,802,383 1.49
Áustria 0 0 - 0 0 - 0 0 - 536.130 1.072.260 (50,00) 536.130 1.072.260 (50,00)
auStria 0 0 - 0 0 - 0 0 - 536,130 1,072,260 (50,00) 536,130 1,072,260 (50.00)
bélGiCa 63.996 111.031 (42,36) 1.757.680 3.326.200 (47,16) 63.360 61.070 3,75 1.885.215 1.204.264 56,54 3.770.251 4.702.565 (19,83)
belGiuM 63,996 111,031 (42.36) 1,757,680 3,326,200 (47.16) 63,360 61,070 3.75 1,885,215 1,204,264 56.54 3,770,251 4,702,565 (19.83)
bulGÁria 25.003 702.835 (96,44) 7.200.797 6.579.013 9,45 0 983.436 - 146.340 73.466 99.19 7.372.140 8.338.750 (11,59)
bulGaria 25,003 702,835 (96.44) 7,200,797 6,579,013 9.45 0 983,436 - 146,340 73,466 99,19 7,372,140 8,338,750 (11.59)
CHiPre 566.161 753.557 (24,87) 413.282 518.788 (20,34) 155.196 236.704 (34,43) 230.710 305.427 (24,46) 1.365.349 1.814.476 (24,75)
cypruS 566,161 753,557 (24.87) 413,282 518,788 (20.34) 155,196 236,704 (34.43) 230,710 305,427 (24.46) 1,365,349 1,814,476 (24.75)
DinamarCa 321.769 139.017 131,46 152.413 1.931.494 (92,11) 0 0 - 349.032 339.116 2,92 823.214 2.409.627 (65,84)
DenMark 321,769 139,017 131.46 152,413 1,931,494 (92.11) 0 0 - 349,032 339,116 2.92 823,214 2,409,627 (65.84)
eslovaCa 49.980 4.650 974,84 717.570 1.310.039 (45,23) 0 32.000 - 20.864 100.640 (79,27) 788.414 1.447.329 (45,53)
SloVakia 49,980 4,650 974,84 717,570 1,310,039 (45.23) 0 32,000 - 20,864 100,640 (79.27) 788,414 1,447,329 (45.53)
eslovênia 0 0 - 0 0 - 0 0 - 0 0 - 0 0 -
SloVenia 0 0 - 0 0 - 0 0 - 0 0 - 0 0 -
esPanHa 3.801.561 5.021.444 (24,29) 22.860.000 31.256.890 (26,86) 943.451 3.470.630 (72,82) 480.744 104.440 360,31 28.085.756 39.853.404 (29,53)
Spain 3,801,561 5,021,444 (24,29) 22,860,000 31,256,890 (26.86) 943,451 3,470,630 (72.82) 480,744 104,440 360.31 28,085,756 39,853,404 (29.53)
estônia 0 0 - 0 25.995 - 0 0 - 0 0 - 0 25.995 -
eStonia 0 0 - 0 25.995 - 0 0 - 0 0 - 0 25,995 -
FinlânDia 0 0 - 0 0 - 521.743 346.940 50,38 0 0 - 521.743 346.940 50,38
FinlanD 0 0 - 0 0 - 521,743 346,940 50.38 0 0 - 521,743 346,940 50.38
França 464.091 662.120 (29,91) 9.978.538 15.174.816 (34,24) 3.695.141 3.934.183 (6,08) 784.460 781.888 0,33 14.922.230 20.553.007 (27,40)
France 464,091 662,120 (29.91) 9,978,538 15,174,816 (34.24) 3,695,141 3,934,183 (6.08) 784,460 781,888 0.33 14,922,230 20,553,007 (27.40)
GréCia 184.012 362.558 (49,25) 1.675.282 1.379.757 21,42 21.236 284.401 (92,53) 39.073 82.800 (52,81) 1.919.603 2.109.516 (9,00)
Greece 184,012 362,558 (49.25) 1,675,282 1,379,757 21.42 21,236 284,401 (92.53) 39,073 82,800 (52.81) 1,919,603 2,109,516 (9.00)
HunGria 48.000 395.225 (87,86) 3.070.390 2.623.035 17,05 0 95.083 - 0 0 - 3.118.390 3.113.343 0,16
hunGary 48,000 395,225 (87,86) 3,070,390 2,623,035 17.05 0 95,083 - 0 0 - 3,118,390 3,113,343 0.16
irlanDa 0 99.012 - 627.270 2.033.136 (69,15) 1.442.744 4.083.774 (64,67) 3.274.578 1.266.090 158,64 5.344.592 7.482.012 (28,57)
irelanD 0 99,012 - 627,270 2,033,136 (69.15) 1,442,744 4,083,774 (64.67) 3,274,578 1,266,090 158.64 5,344,592 7,482,012 (28.57)
itÁlia 1.485.678 2.918.446 (49,09) 3.016.745 2.771.003 8,87 85.062 1.081.966 (92,14) 4.652.439 1.025.287 353,77 9.239.924 7.796.702 18,51
italy 1,485,678 2,918,446 (49.09) 3,016,745 2,771,003 8.87 85,062 1,081,966 (92.14) 4,652,439 1,025,287 353.77 9,239,924 7,796,702 18.51
letônia 0 0 - 50.005 592.394 (91,56) 0 26.000 - 0 0 - 50.005 618.394 (91,91)
latVia 0 0 - 50,005 592,394 (91.56) 0 26,000 - 0 0 - 50,005 618,394 (91.91)
lituânia 552.658 1.080.157 (48,84) 1.703.510 380.550 347,64 0 25.800 - 0 0 - 2.256.168 1.486.507 51,78
lithuania 552,658 1,080,157 (48.84) 1,703,510 380,550 347.64 0 25,800 - 0 0 - 2,256,168 1,486,507 51.78
(UNIDADE: KG LÍQUIDO)(UnIT: nET KG)
21

22
luxemburGo 0 0 - 0 0 - 0 0 - 0 0 - 0 0 -
luxeMbourG 0 0 - 0 0 - 0 0 - 0 0 - 0 0 -
malta 220.994 342.897 (35,55) 74.985 55.125 36,03 0 8.400 - 22.650 0 - 318.629 406.422 (21,60)
Malta 220,994 342,897 (35.55) 74,985 55,125 36.03 0 8,400 - 22,650 0 - 318,629 406,422 (21.60)
Paísesbaixos 2.812.580 4.871.204 (42,26) 61.068.109 114.249.766 (46,55) 65.366.454 59.629.719 9,62 116.077.493 67.516.094 71,93 245.324.636 246.266.783 (0,38)
the netherlanDS 2,812,580 4,871,204 (42.26) 61,068,109 114,249,766 (46.55) 65,366,454 59,629,719 9.62 116,077,493 67,516,094 71.93 245,324,636 246,266,783 (0.38)
Polônia 0 0 - 50.508 0 - 0 170.430 - 0 95.038 - 50.508 265.468 (80,97)
polanD 0 0 - 50,508 0 - 0 170,430 - 0 95,038 - 50,508 265,468 (80.97)
PortuGal 24.013 0 - 6.087.284 6.046.959 0,67 15.638 597.889 (97,38) 50.724 48.540 4,50 6.177.659 6.693.388 (7,71)
portuGal 24,013 0 - 6,087,284 6,046,959 0.67 15,638 597,889 (97.38) 50,724 48,540 4.50 6,177,659 6,693,388 (7.71)
reinouniDo 4.218.639 4.876.732 (13,49) 5.780.971 15.716.602 (63,22) 23.631.224 18.774.913 25,87 20.404.183 12.326.024 65,54 54.035.017 51.694.271 4,53
uniteD kinGDoM 4,218,639 4,876,732 (13.49) 5,780,971 15,716,602 (63.22) 23,631,224 18,774,913 25.87 20,404,183 12,326,024 65.54 54,035,017 51,694,271 4.53
rePúbliCatCHeCa 0 599.933 - 2.749.243 3.530.829 (22,14) 275.088 552.664 (50,23) 276.489 316.895 (12,75) 3.300.820 5.000.321 (33,99)
czech republic 0 599,933 - 2,749,243 3,530,829 (22.14) 275,088 552,664 (50.23) 276,489 316,895 (12.75) 3,300,820 5,000,321 (33.99)
romênia 340.258 906.520 (62,47) 24.779.619 35.851.545 (30,88) 541.488 1.966.755 (72,47) 1.073.757 437.060 145,68 26.735.122 39.161.880 (31,73)
roMania 340,258 906,520 (62.47) 24,779,619 35,851,545 (30.88) 541,488 1,966,755 (72.47) 1,073,757 437,060 145.68 26,735,122 39,161,880 (31.73)
suéCia 0 0 - 0 168.535 - 0 18.720 - 405.815 309.941 30,93 405.815 497.196 (18,38)
SweDen 0 0 - 0 168,535 - 0 18,720 - 405,815 309,941 30.93 405,815 497,196 (18.38)
orienteméDio 840.250.919 777.671.647 8,05 254.619.119 193.152.776 31,82 18.161.509 13.542.068 34,11 0 27.000 - 1.113.031.547 984.393.491 13,07
MiDDle eaSt 840,250,919 777,671,647 8.05 254,619,119 193,152,776 31.82 18,161,509 13,542,068 34.11 0 27,000 - 1,113,031,547 984,393,491 13.07
arÁbiasauDita 318.371.567 325.650.086 (2,24) 78.227.069 52.610.838 48,69 3.774.788 2.196.436 71,86 0 0 - 400.373.424 380.457.360 5,23
SauDi arabia 318,371,567 325,650,086 (2.24) 78,227,069 52,610,838 48.69 3,774,788 2,196,436 71.86 0 0 - 400,373,424 380,457,360 5.23
barein 14.442.195 15.063.751 (4,13) 4.091.362 3.385.143 20,86 884.086 663.498 33,25 0 0 - 19.417.643 19.112.392 1,60
bahrain 14,442,195 15,063,751 (4.13) 4,091,362 3,385,143 20.86 884,086 663,498 33.25 0 0 - 19,417,643 19,112,392 1.60
Catar 44.008.846 27.913.025 57,66 19.640.189 13.117.046 49,73 1.107.795 862.408 28,45 0 0 - 64.756.830 41.892.479 54,58
Qatar 44,008,846 27,913,025 57.66 19,640,189 13,117,046 49.73 1,107,795 862,408 28.45 0 0 - 64,756,830 41,892,479 54.58
emiraDosÁrabes 138.309.790 123.278.790 12,19 66.562.818 68.198.793 (2,40) 3.542.699 3.911.013 (9,42) 0 27.00 - 208.415.307 195.415.596 6,65
uniteD arab eMirateS 138,309,790 123,278,790 12.19 66,562,818 68,198,793 (2.40) 3,542,699 3,911,013 (9.42) 0 27,00 - 208,415,307 195,415,596 6.65
iêmen 50.396.717 59.376.666 (15,12) 908.079 592.248 53,33 73.077 99.472 (26,54) 0 0 - 51.377.873 60.068.386 (14,47)
yeMen 50,396,717 59,376,666 (15.12) 908,079 592,248 53.33 73,077 99,472 (26.54) 0 0 - 51,377,873 60,068,386 (14.47)
irã 8.230.159 42.321.467 (80,55) 1.333.682 411.080 224,43 0 25.002 - 0 0 - 9.563.841 42.757.549 (77,63)
iSlaMic rep. oF iran 8,230,159 42,321,467 (80.55) 1,333,682 411,080 224.43 0 25,002 - 0 0 - 9,563,841 42,757,549 (77.63)
iraque 43.473.569 26.615.543 63,34 12.455.183 5.258.920 136,84 77.402 222.114 (65,15) 0 0 - 56.006.154 32.096.577 74,49
iraQ 43,473,569 26,615,543 63.34 12,455,183 5,258,920 136.84 77,402 222,114 (65.15) 0 0 - 56,006,154 32,096,577 74.49
israel 0 21.039 - 0 16.470 - 0 53.063 - 0 0 - 0 90.572 -
iSrael 0 21,039 - 0 16,470 - 0 53,063 - 0 0 - 0 90,572 -
JorDânia 34.872.133 17.260.153 102,04 23.142.097 14.103.239 64,09 476.123 71.751 563,58 0 0 - 58.490.353 31.435.143 86,07
JorDan 34,872,133 17,260,153 102.04 23,142,097 14,103,239 64.09 476,123 71,751 563.58 0 0 - 58,490,353 31,435,143 86.07
Destino
iMportinG country
inteiro
whole
Cortes
cutS
inDustrializaDos
proceSSeD
salGaDos
SalteD
Total
total
2008 2007 % 2008 2007 % 2008 2007 % 2008 2007 % 2008 2007 %
(UNIDADE: KG LÍQUIDO)(UnIT: nET KG)

2�
kuwait 130.258.964 96.068.045 35,59 26.862.096 22.577.744 18,98 6.510.831 4.242.670 53,46 0 0 - 163.631.891 122.888.459 33,15
kuwait 130,258,964 96,068,045 35.59 26,862,096 22,577,744 18.98 6,510,831 4,242,670 53.46 0 0 - 163,631,891 122,888,459 33.15
omã 40.894.777 32.867.950 24,42 7.970.064 6.535.579 21,95 1.559.747 984.627 58,41 0 0 - 50.424.588 40.388.156 24,85
oMan 40,894,777 32,867,950 24.42 7,970,064 6,535,579 21.95 1,559,747 984,627 58.41 0 0 - 50,424,588 40,388,156 24.85
taDJiquistão 4.688.505 3.034.798 54,49 6.119.994 4.113.631 48,77 154.961 124.988 23,98 0 0 - 10.963.460 7.273.417 50,73
taJikiStan 4,688,505 3,034,798 54.49 6,119,994 4,113,631 48.77 154,961 124,988 23.98 0 0 - 10,963,460 7,273,417 50.73
turComenistão 155.993 75.228 107,36 3.169.090 0 - 0 0 - 0 0 - 3.325.083 75.228 4,320,01
turkMeniStan 155,993 75,228 107.36 3,169,090 0 - 0 0 - 0 0 - 3,325,083 75,228 4.320.01
turquia 11.731.689 7.912.592 48,27 4.137.396 1.779.645 132,48 0 85.026 - 0 0 - 15.869.085 9.777.263 62,31
turkey 11,731,689 7,912,592 48.27 4,137,396 1,779,645 132.48 0 85,026 - 0 0 - 15,869,085 9,777,263 62.31
uzbequistão 416.015 212.514 95,76 0 452.400 - 0 0 - 0 0 - 416.015 664.914 (37,43)
uzbekiStan 416,015 212,514 95.76 0 452,400 - 0 0 - 0 0 - 416,015 664,914 (37.43)
amériCaDosul 307.509.582 163.848.624 87,68 18.635.938 6.980.383 166,98 3.273.884 2.865.574 14,25 29.235 21.588 35,42 329.448.639 173.716.169 89,65
South aMerica 307,509,582 163,848,624 87.68 18,635,938 6,980,383 166.98 3,273,884 2,865,574 14.25 29,235 21,588 35.42 329,448,639 173,716,169 89.65
arGentina 0 0 - 2.392.410 3.105.951 (22,97) 1.801.685 1.626.831 10,75 1.841 77 2.290.91 4.195.936 4.732.859 (11,34)
arGentina 0 0 - 2,392,410 3,105,951 (22.97) 1,801,685 1,626,831 10.75 1,841 77 2,290,91 4,195,936 4,732,859 (11.34)
bolívia 0 0 - 0 0 - 15.367 15.705 (2,15) 108 501 (78,44) 15.475 16.206 (4,51)
boliVia 0 0 - 0 0 - 15,367 15,705 (2,15) 108 501 (78.44) 15,475 16,206 (4.51)
ParaGuai 22.564 41.051 (45,03) 552.236 384.472 43,63 498.356 422.761 17,88 11.200 5.562 101,37 1.084.356 853.846 27,00
paraGuay 22,564 41,051 (45.03) 552,236 384,472 43.63 498,356 422,761 17.88 11,200 5,562 101.37 1,084,356 853,846 27.00
Peru 2.064.988 1.786.611 15,58 156.008 212.104 (26,45) 0 36.253 - 0 0 - 2.220.996 2.034.968 9,14
peru 2,064,988 1,786,611 15.58 156,008 212,104 (26.45) 0 36,253 - 0 0 - 2,220,996 2,034,968 9.14
suriname 2.583.155 3.309.004 (21,94) 1.753.605 1.920.080 (8,67) 221.269 181.582 21,86 0 0 - 4.558.029 5.410.666 (15,76)
SurinaMe 2,583,155 3,309,004 (21.94) 1,753,605 1,920,080 (8.67) 221,269 181,582 21.86 0 0 - 4,558,029 5,410,666 (15.76)
uruGuai 0 0 - 0 0 - 737.207 563.981 30,71 16.086 15.448 4,13 753.293 579.429 30,01
uruGuay 0 0 - 0 0 - 737,207 563,981 30.71 16,086 15,448 4.13 753,293 579,429 30.01
venezuela 302.838.875 158.711.958 90,81 13.781.679 1.357.776 915,02 0 18.461 - 0 0 - 316.620.554 160.088.195 97,78
Venezuela 302,838,875 158,711,958 90.81 13,781,679 1,357,776 915.02 0 18,461 - 0 0 - 316,620,554 160,088,195 97.78
ÁFriCa 56.952.071 52.511.641 8,46 192.739.677 207.546.706 (7,13) 555.394 1.764.555 (68,52) 48.300 25.968 86,00 250.295.442 261.848.870 (4,41)
aFrica 56,952,071 52,511,641 8.46 192,739,677 207,546,706 (7.13) 555,394 1,764,555 (68.52) 48,300 25,968 86.00 250,295,442 261,848,870 (4.41)
ÁFriCaDosul 1.582.457 12.073.199 (86,89) 145.247.860 179.232.849 (18,96) 480.990 1.278.034 (62,36) 48.300 25.968 86,00 147.359.607 192.610.050 (23,49)
South aFrica 1,582,457 12,073,199 (86.89) 145,247,860 179,232,849 (18.96) 480,990 1,278,034 (62.36) 48,300 25,968 86.00 147,359,607 192,610,050 (23.49)
anGola 25.013.569 26.762.953 (6,54) 22.234.076 17.327.844 28,31 61.601 470.119 (86,90) 0 0 - 47.309.246 44.560.916 6,17
anGola 25,013,569 26,762,953 (6.54) 22,234,076 17,327,844 28.31 61,601 470,119 (86.90) 0 0 - 47,309,246 44,560,916 6.17
Camarões 12.792 28.400 (54,96) 39.655 138.350 (71,34) 0 0 - 0 0 - 52.447 166.750 (68,55)
caMeroon 12,792 28,400 (54.96) 39,655 138,350 (71.34) 0 0 - 0 0 - 52,447 166,750 (68.55)
ConGo 4.045.894 3.201.096 26,39 16.962.181 6.240.136 171,82 680 0 - 0 0 - 21.008.755 9.441.232 122,52
conGo 4,045,894 3,201,096 26.39 16,962,181 6,240,136 171.82 680 0 - 0 0 - 21,008,755 9,441,232 122.52
Destino
iMportinG country
inteiro
whole
Cortes
cutS
inDustrializaDos
proceSSeD
salGaDos
SalteD
total
total
2008 2007 % 2008 2007 % 2008 2007 % 2008 2007 % 2008 2007 %
(UNIDADE: KG LÍQUIDO)(UnIT: nET KG)

eGito 20.846.574 4.487.872 364,51 51.463 0 - 10.841 16.402 (33,90) 0 0 - 20.908.878 4.504.274 364,20
eGypt 20,846,574 4,487,872 364.51 51,463 0 - 10,841 16,402 (33.90) 0 0 - 20,908,878 4,504,274 364.20
reP.Dem.ConGo 5.450.785 5.958.121 (8,52) 8.204.442 4.607.527 78,07 1.282 0 - 0 0 - 13.656.509 10.565.648 29,25
DeM.rep.oF conGo 5,450,785 5,958,121 (8.52) 8,204,442 4,607,527 78.07 1,282 0 - 0 0 - 13,656,509 10,565,648 29.25
Ásia 19.480.947 28.278.273 (31,11) 914.435.416 780.123.711 17,22 1.647.027 1.811.502 (9,08) 25.992 25.008 3,93 935.589.382 810.238.494 15,47
aSia 19,480,947 28,278,273 (31.11) 914,435,416 780,123,711 17.22 1,647,027 1,811,502 (9.08) 25,992 25,008 3.93 935,589,382 810,238,494 15.47
CHina 0 0 - 980.295 12.319.461 (92,04) 0 0 - 0 0 - 980.295 12.319.461 (92,04)
china 0 0 - 980,295 12,319,461 (92.04) 0 0 - 0 0 - 980,295 12,319,461 (92.04)
CinGaPura 13.354.772 17.938.595 (25,55) 61.600.577 69.911.672 (11,89) 672.944 718.983 (6,40) 0 0 - 75.628.293 88.569.250 (14,61)
SinGapore 13,354,772 17,938,595 (25.55) 61,600,577 69,911,672 (11.89) 672,944 718,983 (6.40) 0 0 - 75,628,293 88,569,250 (14.61)
CoréiaDosul 0 24.012 - 21.527.532 20.679.841 4,10 0 0 - 0 0 - 21.527.532 20.703.853 3,98
rep. oF korea 0 24,012 - 21,527,532 20,679,841 4.10 0 0 - 0 0 - 21,527,532 20,703,853 3.98
HonGkonG 2.257.022 3.990.968 (43,45) 412.826.223 352.335.189 17,17 163.463 720.690 (77,32) 25.992 25.008 3,93 415.272.700 357.071.855 16,30
honG konG 2,257,022 3,990,968 (43.45) 412,826,223 352,335,189 17.17 163,463 720,690 (77.32) 25,992 25,008 3.93 415,272,700 357,071,855 16.30
JaPão 3.869.153 6.324.698 (38,82) 417.500.789 324.877.548 28,51 810.620 371.829 118,01 0 0 - 422.180.562 331.574.075 27,33
Japan 3,869,153 6,324,698 (38.82) 417,500,789 324,877,548 28.51 810,620 371,829 118.01 0 0 - 422,180,562 331,574,075 27.33
rússia 33.441.271 51.966.692 (35,65) 120.614.155 135.422.156 (10,93) 4.817.322 6.552.335 (26,48) 0 125.025 - 158.872.748 194.066.208 (18,13)
ruSSia 33,441,271 51,966,692 (35.65) 120,614,155 135,422,156 (10.93) 4,817,322 6,552,335 (26.48) 0 125,025 - 158,872,748 194,066,208 (18.13)
outros 62.772.043 66.636.795 (5,80) 260.582.268 228.284.443 14,15 8.158.421 5.002.365 63,09 909.770 1.629.232 (44,16) 332.422.502 301.552.835 10,24
otherS 62,772,043 66,636,795 (5.80) 260,582,268 228,284,443 14.15 8,158,421 5,002,365 63.09 909,770 1,629,232 (44.16) 332,422,502 301,552,835 10.24
total 1.336.464.585 1.166.848.083 14,54 1.931.424.249 1.840.225.561 4,96 168.759.687 155.341.155 8,64 208.879.906 124.360.207 67,96 3.645.528.427 3.286.775.006 10,92
total 1,336,464,585 1,166,848,083 14.54 1,931,424,249 1,840,225,561 4.96 168,759,687 155,341,155 8.64 208,879,906 124,360,207 67.96 3,645,528,427 3,286,775,006 10.92
Destino
iMportinG country
inteiro
whole
Cortes
cutS
inDustrializaDos
proceSSeD
salGaDos
SalteD
total
total
2008 2007 % 2008 2007 % 2008 2007 % 2008 2007 % 2008 2007 %
(UNIDADE: KG LÍQUIDO)(UnIT: nET KG)

25
volumeton.
volumetons.
PartiCiPação
marketsHare
Cortes 1.931.424 52,98
cutS 1,931,424 52.98
inteiros 1.336.465 36,66
whole 1,336,465 36.66
salGaDo 208.880 5,73
SalteD 208,880 5.73
inDustrializaDos 168.760 4,63
proceSSeD 168,760 4.63
totalGeral 3.645.528 100
GranD total 3,645,528 100
expoRtAções bRAsileiRAs De CARne De fRAngo poR pRoDuto eM 2008
expoRtAções brasileiras de carne de frango por área geográfica em 2008
bRAziliAn ChiCken MeAt expoRts by geogRAphiC AReA in 2008
bRAziliAn ChiCken expoRts by pRoDuCt in 2008
36,66% inteiros
36.66% wHole
52,98%Cortes
52.98%Cuts
5,73% salGaDo
5.73% salteD
4,63%inDustrializaDos
4.63% ProCesseD
Fonte:seCex/abeF
Source: Secex/abeF
volumeton.
volumetons.
PartiCiPação
marketsHare
orienteméDio 1.113.032 30,53
MiDDle eaSt 1,113,032 30.53
Ásia 935.589 25,66
aSia 935,589 25.66
ue-27 525.868 14,43
eu - 27 525,868 14.43
amériCaDosul 329.449 9,04
South aMerica 329,449 9.04
ÁFriCa 250.295 6,87
aFrica 250,295 6.87
rússia 158.873 4,36
ruSSia 158,873 4.36
outros 332.423 9,12
otherS 332,423 9.12
totalGeral 3.645.528 100
GranD total 3,645,528 100
Fonte:seCex/abeF
Source: Secex/abeF
30,53%orienteméDio
30.53% miDDleeast
14,43%ue-27
14.43% eu-2725,66%Ásia
25.66% asia
9,04%amériCaDosul
9.04% soutHameriCa
6,87%ÁFriCa
6.87% aFriCa
4,36%rússia
4.36% russia
9,12%outros
9.12% otHers

Portos exPortação(tons.) %
portS exportS (tonS.) %
itaJaí 1.285.553 35,26
itaJaí 1,285,553 35.26
ParanaGuÁ 1.218.133 33,41
paranaGua 1,218,133 33.41
rioGranDe 520.125 14,27
rio GranDe 520,125 14.27
santos 337.363 9,25
SantoS 337,363 9.25
sãoFranCisCoDosul 166.403 4,56
São FranciSco Do Sul 166,403 4.56
imbituba 36.684 1,01
iMbituba 36,684 1.01
antonina 34.322 0,94
antonina 34,322 0.94
rioDeJaneiro 24.672 0,68
rio De Janeiro 24,672 0.68
subtotal 3.623.260 99,39
Subtotal 3,623,260 99.39
outros 22.268 0,61
otherS 22,268 0.61
totalGeral 3.645.528 100,00
GranD total 3,645,528 100.00
Fonte:seCex
Source: Secex
poRtos expoRtADoRes em 2008
bRAziliAn expoRting poRts in 2008

2�
expoRtAçõesbrasileiras de carne de frango para outros destinos em 2008
bRAziliAn ChiCken MeAt expoRts to otheR DestinAtions in 2008
inteiro
whole
Cortes
cutS
inDustrializaDos
proceSSeD
salGaDo
SalteD
total
total
aFeGanistão 1.537.311 1.658.878 0 0 3.196.189
aFGhaniStan 1,537,311 1,658,878 0 0 3,196,189
albânia 4.896.593 1.932.859 100.186 0 6.929.638
albania 4,896,593 1,932,859 100,186 0 6,929,638
anGuilla 1.224 21.130 411 0 22.765
anGuilla 1,224 21,130 411 0 22,765
antíGuaebarbuDa 108.653 1.457.145 11.065 0 1.576.863
antiGua anD barbuDa 108,653 1,457,145 11,065 0 1,576,863
antilHasHolanDesas 1.025.914 5.736.992 166.146 0 6.929.052
the n. antilleS 1,025,914 5,736,992 166,146 0 6,929,052
arGélia 0 0 39.311 0 39.311
alGeria 0 0 39,311 0 39,311
armênia 2.106.114 1.874.882 308.281 0 4.289.277
arMenia 2,106,114 1,874,882 308,281 0 4,289,277
aruba 494.166 2.780.713 28.556 41.650 3.345.085
aruba 494,166 2,780,713 28,556 41,650 3,345,085
azerbaiJão 7.943.649 7.385.667 105.141 0 15.434.457
azerbaiJan 7,943,649 7,385,667 105,141 0 15,434,457
baHamas 47.980 2.113.328 0 0 2.161.308
bahaMaS 47,980 2,113,328 0 0 2,161,308
banGlaDesH 0 0 2.520 0 2.520
banGlaDeSh 0 0 2,520 0 2,520
belize 0 50.900 0 0 50.900
belize 0 50,900 0 0 50,900
benin 703.328 5.370.162 87 0 6.073.577
benin 703,328 5,370,162 87 0 6,073,577
bermuDas 42.499 12.977 317 0 55.793
berMuDa 42,499 12,977 317 0 55,793
bósnia-HerzeGovina 802.963 690.804 14.313 0 1.508.080
b. anD herzeGoVina 802,963 690,804 14,313 0 1,508,080
bruneiDarussalam 0 25.995 0 0 25.995
brunei 0 25,995 0 0 25,995
CaboverDe 240.403 4.811.051 21.396 0 5.072.850
cape VerDe 240.403 4,811,051 21,396 0 5,072,850
inteiro
whole
Cortes
cutS
inDustrializaDos
proceSSeD
salGaDo
SalteD
total
total
CanaDÁ 0 13.513.775 866.754 0 14.380.529
canaDa 0 13,513,775 866,754 0 14,380,529
CanÁria,ilHas 581.731 3.840.798 124.347 0 4.546.876
canary iSlanDS 581,731 3,840,798 124,347 0 4,546,876
Cazaquistão,reP. 899.430 4.391.847 524.363 16.576 5.832.216
kazakhStan 899,430 4,391,847 524,363 16,576 5,832,216
CHaDe 37.004 78.670 738 0 116.412
chaD 37,004 78,670 738 0 116,412
CHile 0 0 1.151.672 0 1.151.672
chile 0 0 1,151,672 0 1,151,672
Comores 13.829 1.567.087 0 0 1.580.916
coMoroS 13,829 1,567,087 0 0 1,580,916
Coréia,r.P.D.norte 0 231.615 0 0 231.615
D. p. r. oF korea 0 231,615 0 0 231,615
CostaDomarFim 299.926 169.145 0 0 469.071
iVory coaSt 299,926 169,145 0 0 469,071
CroÁCia,reP.Da 996.168 4.264.256 30.818 0 5.291.242
croatia 996,168 4,264,256 30,818 0 5,291,242
Cuba 1.499.456 31.258.518 56.076 0 32.814.050
cuba 1,499,456 31,258,518 56,076 0 32,814,050
DJibuti 849.794 58.623 5.060 0 913.477
DJibout 8w49,794 58,623 5,060 0 913,477
DominiCa 2.000 690.043 2.351 0 694.394
DoMinica 2,000 690,043 2,351 0 694,394
estaDosuniDos 75.999 382.964 9.009 0 467.972
uniteD StateS oF aMerica 75,999 382,964 9,009 0 467,972
Feroe,ilHas 23.847 0 0 0 23.847
Faroe iSlanDS 23,847 0 0 0 23,847
FiliPinas 0 10.706.874 0 0 10.706.874
the philippineS 0 10,706,874 0 0 10,706,874
Gabão 627.505 13.517.476 52.399 0 14.197.380
Gabon 627,505 13,517,476 52,399 0 14,197,380
Gambia 719.228 85.575 30.033 0 834.836
GaMbia 719,228 85,575 30,033 0 834,836
Gana 2.077.053 28.759.767 93.622 0 30.930.442
Ghana 2,077,053 28,759,767 93,622 0 30,930,442
2�
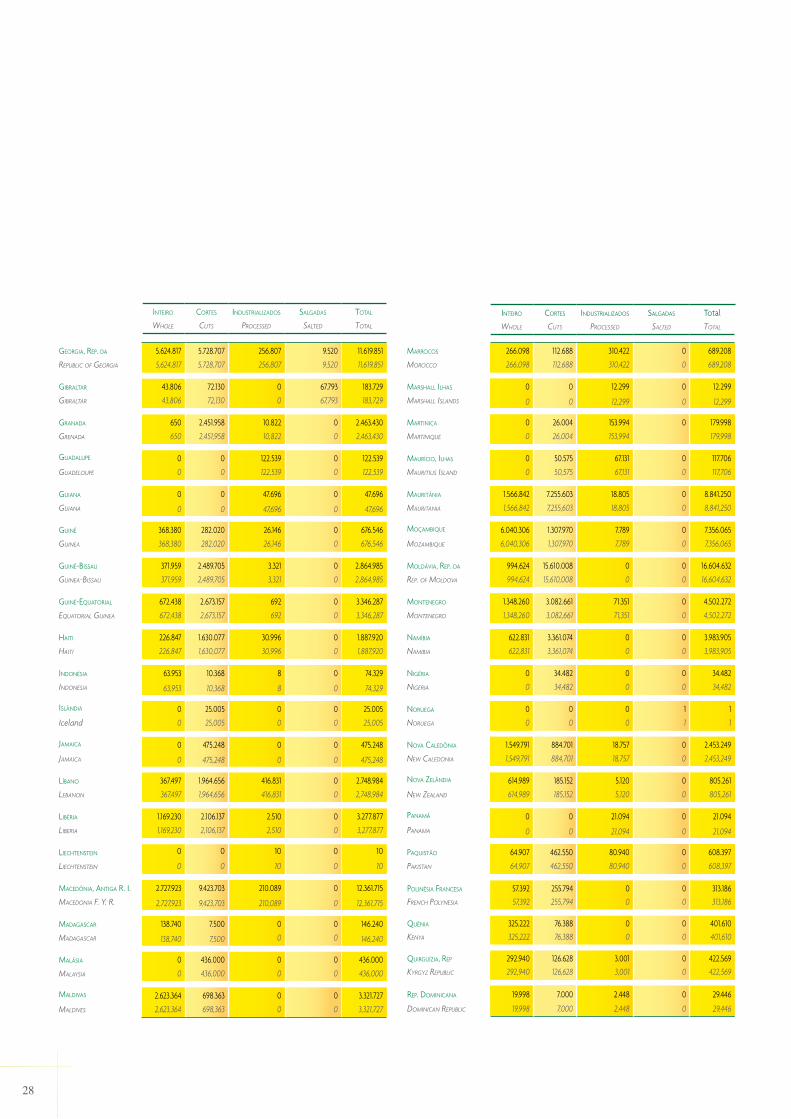
GeorGia,reP.Da 5.624.817 5.728.707 256.807 9.520 11.619.851
republic oF GeorGia 5,624,817 5,728,707 256,807 9,520 11,619,851
Gibraltar 43.806 72.130 0 67.793 183.729
Gibraltar 43,806 72,130 0 67,793 183,729
GranaDa 650 2.451.958 10.822 0 2.463.430
GrenaDa 650 2,451,958 10,822 0 2,463,430
GuaDaluPe 0 0 122.539 0 122.539
GuaDeloupe 0 0 122,539 0 122,539
Guiana 0 0 47.696 0 47.696
Guiana 0 0 47,696 0 47,696
Guiné 368.380 282.020 26.146 0 676.546
Guinea 368,380 282,020 26,146 0 676,546
Guiné-bissau 371.959 2.489.705 3.321 0 2.864.985
Guinea-biSSau 371,959 2,489,705 3,321 0 2,864,985
Guiné-equatorial 672.438 2.673.157 692 0 3.346.287
eQuatorial Guinea 672,438 2,673,157 692 0 3,346,287
Haiti 226.847 1.630.077 30.996 0 1.887.920
haiti 226,847 1,630,077 30,996 0 1,887,920
inDonésia 63.953 10.368 8 0 74.329
inDoneSia 63,953 10,368 8 0 74,329
islânDia 0 25.005 0 0 25.005
Iceland 0 25,005 0 0 25,005
JamaiCa 0 475.248 0 0 475.248
JaMaica 0 475,248 0 0 475,248
líbano 367.497 1.964.656 416.831 0 2.748.984
lebanon 367,497 1,964,656 416,831 0 2,748,984
libéria 1.169.230 2.106.137 2.510 0 3.277.877
liberia 1,169,230 2,106,137 2,510 0 3,277,877
lieCHtenstein 0 0 10 0 10
liechtenStein 0 0 10 0 10
maCeDônia,antiGar.i. 2.727.923 9.423.703 210.089 0 12.361.715
MaceDonia F. y. r. 2,727,923 9,423,703 210,089 0 12,361,715
maDaGasCar 138.740 7.500 0 0 146.240
MaDaGaScar 138,740 7,500 0 0 146,240
malÁsia 0 436.000 0 0 436.000
MalaySia 0 436,000 0 0 436,000
malDivas 2.623.364 698.363 0 0 3.321.727
MalDiVeS 2,623,364 698,363 0 0 3,321,727
inteiro
whole
Cortes
cutS
inDustrializaDos
proceSSeD
salGaDas
SalteD
Total
total
marroCos 266.098 112.688 310.422 0 689.208
Morocco 266,098 112,688 310,422 0 689,208
marsHallilHas 0 0 12.299 0 12.299
MarShall iSlanDS 0 0 12,299 0 12,299
martiniCa 0 26.004 153.994 0 179.998
MartiniQue 0 26,004 153,994 179,998
mauríCio,ilHas 0 50.575 67.131 0 117.706
MauritiuS iSlanD 0 50,575 67,131 0 117,706
mauritânia 1.566.842 7.255.603 18.805 0 8.841.250
Mauritania 1,566,842 7,255,603 18,805 0 8,841,250
moçambique 6.040.306 1.307.970 7.789 0 7.356.065
MozaMbiQue 6,040,306 1,307,970 7,789 0 7,356,065
molDÁvia,reP.Da 994.624 15.610.008 0 0 16.604.632
rep. oF MolDoVa 994,624 15,610,008 0 0 16,604,632
monteneGro 1.348.260 3.082.661 71.351 0 4.502.272
MonteneGro 1,348,260 3,082,661 71,351 0 4,502,272
namíbia 622.831 3.361.074 0 0 3.983.905
naMibia 622,831 3,361,074 0 0 3,983,905
niGéria 0 34.482 0 0 34.482
niGeria 0 34,482 0 0 34,482
norueGa 0 0 0 1 1
norueGa 0 0 0 1 1
novaCaleDônia 1.549.791 884.701 18.757 0 2.453.249
new caleDonia 1,549,791 884,701 18,757 0 2,453,249
novazelânDia 614.989 185.152 5.120 0 805.261
new zealanD 614,989 185,152 5,120 0 805,261
PanamÁ 0 0 21.094 0 21.094
panaMa 0 0 21,094 0 21,094
Paquistão 64.907 462.550 80.940 0 608.397
pakiStan 64,907 462,550 80,940 0 608,397
inteiro
whole
Cortes
cutS
inDustrializaDos
proceSSeD
salGaDas
SalteD
total
total
PolinésiaFranCesa 57.392 255.794 0 0 313.186
French polyneSia 57,392 255,794 0 0 313,186
quênia 325.222 76.388 0 0 401.610
kenya 325,222 76,388 0 0 401,610
quirGuízia,reP 292.940 126.628 3.001 0 422.569
kyrGyz republic 292,940 126,628 3,001 0 422,569
reP.DominiCana 19.998 7.000 2.448 0 29.446
DoMinican republic 19,998 7,000 2,448 0 29,446
inteiro
whole
Cortes
cutS
inDustrializaDos
proceSSeD
salGaDas
salteD
total
total
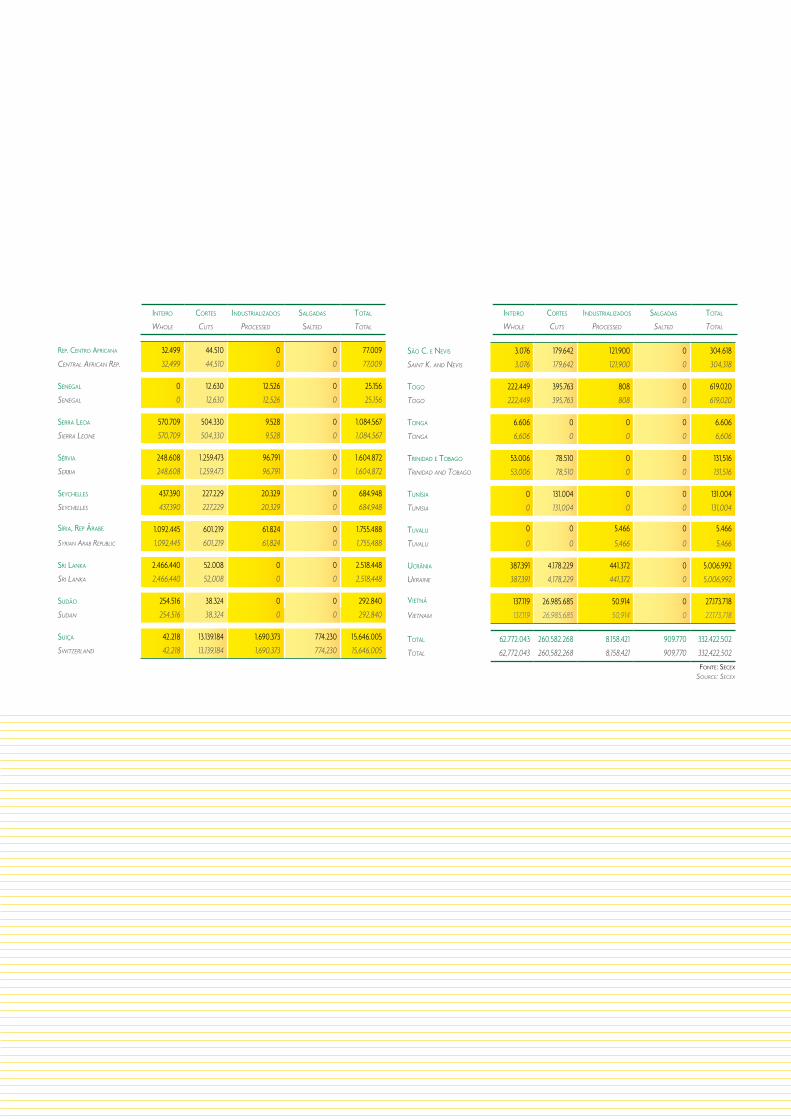
reP.CentroaFriCana 32.499 44.510 0 0 77.009
central aFrican rep. 32,499 44,510 0 0 77,009
seneGal 0 12.630 12.526 0 25.156
SeneGal 0 12,630 12,526 0 25,156
serraleoa 570.709 504.330 9.528 0 1.084.567
Sierra leone 570,709 504,330 9,528 0 1,084,567
sérvia 248.608 1.259.473 96.791 0 1.604.872
Serbia 248,608 1,259,473 96,791 0 1,604,872
seyCHelles 437.390 227.229 20.329 0 684.948
SeychelleS 437,390 227,229 20,329 0 684,948
síria,rePÁrabe 1.092.445 601.219 61.824 0 1.755.488
Syrian arab republic 1,092,445 601,219 61,824 0 1,755,488
srilanka 2.466.440 52.008 0 0 2.518.448
Sri lanka 2,466,440 52,008 0 0 2,518,448
suDão 254.516 38.324 0 0 292.840
SuDan 254,516 38,324 0 0 292,840
suiça 42.218 13.139.184 1.690.373 774.230 15.646.005
SwitzerlanD 42,218 13,139,184 1,690,373 774,230 15,646,005
sãoC.enevis 3.076 179.642 121.900 0 304.618
Saint k. anD neViS 3,076 179,642 121,900 0 304,318
toGo 222.449 395.763 808 0 619.020
toGo 222,449 395,763 808 0 619,020
tonGa 6.606 0 0 0 6.606
tonGa 6,606 0 0 0 6,606
triniDaDetobaGo 53.006 78.510 0 0 131,516
triniDaD anD tobaGo 53,006 78,510 0 0 131,516
tunísia 0 131.004 0 0 131.004
tuniSia 0 131,004 0 0 131,004
tuvalu 0 0 5.466 0 5.466
tuValu 0 0 5,466 0 5,466
uCrânia 387.391 4.178.229 441.372 0 5.006.992
ukraine 387,391 4,178,229 441,372 0 5,006,992
vietnã 137.119 26.985.685 50.914 0 27.173.718
VietnaM 137,119 26,985,685 50,914 0 27,173,718
total 62.772.043 260.582.268 8.158.421 909.770 332.422.502
total 62,772,043 260,582,268 8,158,421 909,770 332,422,502
inteiro
whole
Cortes
cutS
inDustrializaDos
proceSSeD
salGaDas
SalteD
total
total
Fonte:seCex
Source: Secex
�0
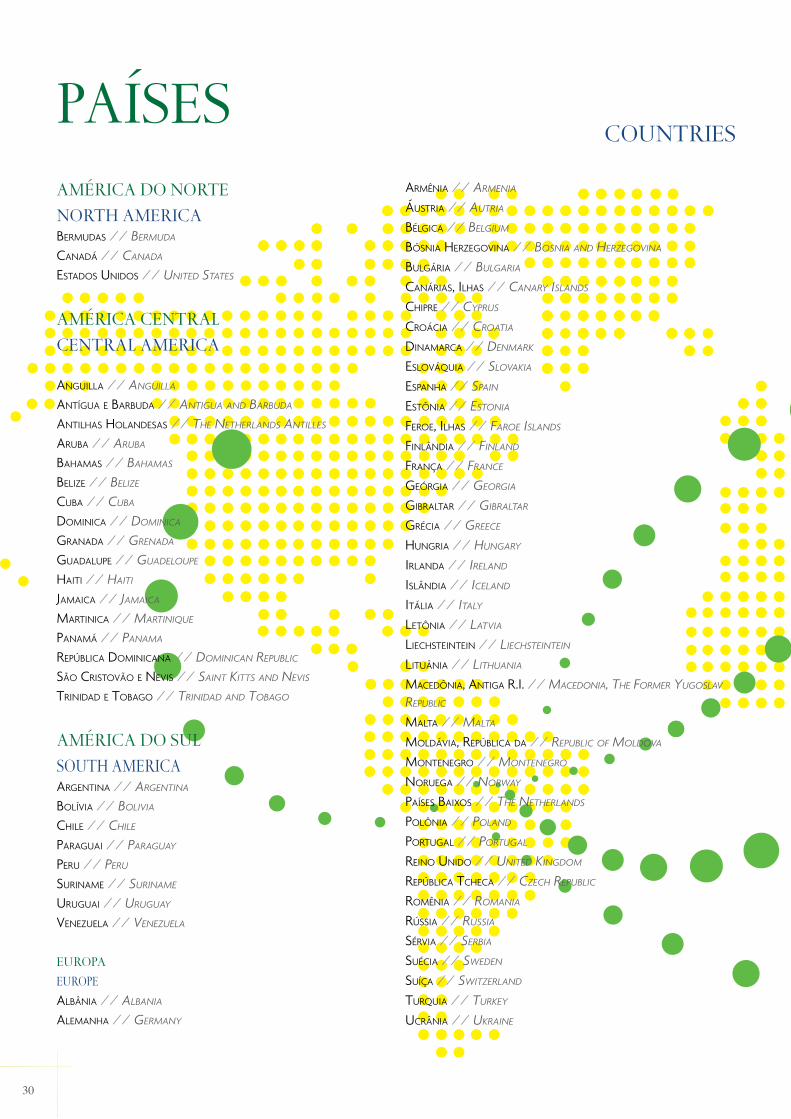
AMéRiCA Do noRtenoRth AMeRiCAbermuDas//berMuDa
CanaDÁ//canaDa
estaDosuniDos//uniteD StateS
AMéRiCA CentRAlCentRAl AMeRiCA
anGuilla//anGuilla
antíGuaebarbuDa//antiGua anD barbuDa
antilHasHolanDesas//the netherlanDS antilleS
aruba//aruba
baHamas//bahaMaS
belize//belize
Cuba//cuba
DominiCa// DoMinica
GranaDa//GrenaDa
GuaDaluPe//GuaDeloupe
Haiti//haiti
JamaiCa//JaMaica
martiniCa// MartiniQue
PanamÁ//panaMa
rePúbliCaDominiCana//DoMinican republic
sãoCristovãoenevis//Saint kittS anD neViS
triniDaDetobaGo//triniDaD anD tobaGo
AMéRiCA Do sulsouth AMeRiCAarGentina//arGentina
bolívia//boliVia
CHile//chile
ParaGuai//paraGuay
Peru//peru
suriname//SurinaMe
uruGuai//uruGuay
venezuela//Venezuela
euRopAeuRopealbânia//albania
alemanHa//GerMany
armênia//arMenia
Áustria//autria
bélGiCa//belGiuM
bósniaHerzeGovina//boSnia anD herzeGoVina
bulGÁria//bulGaria
CanÁrias,ilHas//canary iSlanDS
CHiPre//cypruS
CroÁCia//croatia
DinamarCa//DenMark
eslovÁquia//SloVakia
esPanHa//Spain
estônia//eStonia
Feroe,ilHas//Faroe iSlanDS
FinlânDia//FinlanD
França//France
GeórGia//GeorGia
Gibraltar//Gibraltar
GréCia//Greece
HunGria//hunGary
irlanDa//irelanD
islânDia//icelanD
itÁlia//italy
letônia//latVia
lieCHsteintein//liechSteintein
lituânia//lithuania
maCeDônia,antiGar.i.// MaceDonia, the ForMer yuGoSlaV republic
malta//Malta
molDÁvia,rePúbliCaDa//republic oF MolDoVa
monteneGro//MonteneGro
norueGa//norway
Paísesbaixos//the netherlanDS
Polônia//polanD
PortuGal//portuGal
reinouniDo//uniteD kinGDoM
rePúbliCatCHeCa//czech republic
romênia//roMania
rússia//ruSSia
sérvia//Serbia
suéCia//SweDen
suíça//SwitzerlanD
turquia//turkey
uCrânia//ukraine
pAÍsesCountRies

�1
ÁsiAAsiAaFeGanistão//aFGhaniStan
arÁbiasauDita//SauDi arabia
azerbaiJão//azerbaiJan
barein//bahrain
banGlaDesH//banGlaDeSh
bruneiDarussalam//brunei DaruSSalaM
Casaquistão//kazakhStan
Catar//Qatar
CHina//china
CinGaPura//SinGapore
Coréia,reP.sul//republic oF korea
Coréia,r.P.D.norte//D. p. r. oF korea
emiraDosÁrabes//uniteD arab aMirateS
FiliPinas//the philippineS
HonGkonG//honG konG
iêmen//yeMen
inDonésia//inDoneSia
irã,rePúbliCaDo// iSlaMic republic oF iran
iraque//iraQ
JaPão//Japan
JorDânia//JorDan
kuwait//kuwait
líbano//lebanon
malÁsia//MalaySia
malDivas//MalDiVeS
omã// oMan
Paquistão//pakiStan
quirGuízia,reP.//kyrGyz rep.síria//Syrian arab republic
srilanka//Sri lanka
taDJiquistão//taJikiStan
turComenistão//turkMeniStan
uzbequistão//uzbekiStan
vietnã//VietnaM
oCeAniAoCeAniAmarsHall,ilHas//MarShall iSlanDS
novaCaleDônia//new caleDonia
novazelânDia//new zealanD
PolinésiaFranCesa//French polyneSia
tonGa//tonGa
tuvalu//tuValu
ÁfRiCAAfRiCAÁFriCaDosul//South aFrica
anGola//anGola
arGélia//alGeria
benin//benin
CaboverDe//cape VerDe
Camarões//caMeroon
CHaDe//chaD
Comores//coMoroS
ConGo//conGo
ConGo,reP.Dem.Do//the DeMocratic republic oF the conGo
CostaDomarFim//iVory coaSt
DJibuti//DJibout
eGito//eGypt
Gabão//Gabon
Gâmbia//GaMbia
Gana//Ghana
Guiné//Guinea
Guinébissau//Guinea-biSSau
Guinéequatorial//eQuatorial Guinea
libéria//liberia
líbia//libia
maDaGasCar//MaDaGaScar
marroCos//Morocco
mauríCio,ilHas//MauritiuS iSlanDS
mauritânia//Mauritania
moçambique//MozaMbiQue
namíbia//naMibia
niGéria//niGeria
quênia//kenya
reP.CentroaFriCana//central aFrican republic
seneGal//SeneGal
serraleoa//Sierra leone
seyCHelles//SeychelleS
suDão//SuDan
toGo//toGo
tunísia//tuniSia

bRAziliAn ChiCken MeAt expoRts (1,000 Mt) – Historical background
expoRtAções brasileiras de carne de frango (mil ton.) – série Histórica
1.000.000 1,000,000
1990 1991 1992 1993 1994 1995 1996 1997 1998 1999 2000 2001 2003 2004 2005 2006 2007
(mil/ton.)
(1,000 MT.)
1.500.000 1,500,000
2.000.000 2,000,000
2.500.000 2,500,000
3.000.000 3,000,000
3.500.000 3,500,000
00
4.000.000 4,000,000
2002 2008
3.2873,287
3.6453,645
500.000 500,000
299299
322322
372372
433433
481481
435435
571571
651651
617617
776776
916916
1.2661,266
1.6251,625
1.9611,961
2.4702,470
2.8462,846
2.7182,718
�2
Fontes:seCex,abeF
SourceS: Secex, abeF
��
emPresas
coMpanieS
tonelaDas
tonS.
PartiCiPação
Market Share
saDias/a 849.788 23,31%849,788 23.31 %
PerDiGãos/a 799.436 21,93%799,436 21.93%
searaalimentoss/a 432.430 11,86%432,430 11.86%
DouxFranGosuls/a 364.737 10,01%364,737 10.01%
marFriGFriGoríFiCoss/a 171.895 4,72%171,895 4.72%
DiPlomatas/a 154.785 4,25%154,785 4.25%
C.valeCooPerativa.aGroinDustrial 77.880 2,14%77,880 2.14%
uniFranGoaGroinDustrialltDa. 68.800 1,89%68,800 1.89%
CooP.CentraloesteCatarinense(aurora) 68.416 1,88%68,416 1.88%
CoPaCol-CooP.a.Consolata 58.947 1,62%58,947 1.62%
aGríColaJanDelles/a(biGFranGo) 55.486 1,52%55,486 1.52%
CéuazulalimentosltDa. 50.246 1,38%50,246 1.38%
aGrovênetos/a 46.067 1,26%46,067 1.26%
CooPerativaaGroinDustriallar 43.199 1,18%
43,199 1.18%
emPresas
coMpanieS
tonelaDas
tonS.
PartiCiPação
Market Share
sertaneJoalimentoss/a 30.793 0,84%30,793 0.84%
CooP.lanGuirultDa. 26.203 0,72%26,203 0.72%
Frinals/a 24.685 0,68%24,685 0.68%
Palmali-inDustrialDealimentosltDa. 23.503 0,64%23,503 0.64%
CooPerativaaGroinDustrialCoPaGril 21.216 0,58%21,216 0.58%
bonDioalimentoss/a 16.561 0,45%16,561 0.45%
tysonDobrasilalimentosltDa. 15.315 0,42%15,315 0.42%
CossisaaGroinDustrials/a 14.484 0,40%14,484 0.40%
nutrizaaGroinDutrialDealimentoss/a 14.482 0,40%14,482 0.40%
aviColaPaulistaltDa. 13.697 0,38%13,697 0.38%
noGueirarivelliirmãosltDa. 12.470 0,34%12,470 0.34%
totalParCial 3.455.523 94,79%partial reSult 3,455,523 94.79%
outros 190.005 5,21%
otherS 190,005 5.21%
total 3.645.528 100,00%total 3,645,528 100.00%
os 25 MAioResexportadores brasileiros de carne de frango em 2008
25 MAin bRAziliAn ChiCken MeAt expoRteRs in 2008
Fonte:abeF/seCexSource: abeF/Secex

�4
estaDos
StateS
u$$Fob
u$$ Fob
volume(kG)
VoluMe (kG)
ParanÁ 213.288.591 74.144.446paraná 213,288,591 74,144,446
minasGerais 97.915.641 41.327.113MinaS GeraiS 97,915,641 41,327,113
rioGranDeDosul 90.773.175 33.436.635rio GranDe Do Sul 90,773,175 33,436,635
santaCatarina 83.902.928 35.202.874Santa catarina 83,902,928 35,202,874
GoiÁs 70.723.662 19.758.100GoiáS 70,723,662 19,758,100
matoGrosso 1.299.649 382.488
Mato GroSSo 1,299,649 382,488
total 557.903.646 204.251.656total 557,903,646 204,251,656
expoRtAçõesbrasileiras de carne de peru em 2008
bRAziliAn tuRkey MeAt expoRts in 2008
Fonte:seCex
Source: Secex
RS
SC
PR
MG
MT
GO

eMpResAs AssoCiADAs em 2008/2009
www.superfrango.com.br
www.adoro.com.br
www.bigfrango.com.br
www.agroveneto.com.br
www.ceuazul.ind.br
www.coopavel.com.br
www.copagril.com.br
www.auroraalimentos.com.br
www.lar.ind.br
www.copacol.com.br
www.cossisa-agro.com.br
www.cvale.com.br
www.diplomata.ind.br
www.doux.com.br
www.frinal.com.br
www.globoaves.com.br
www.marfrig.com.br
www.minerva.ind.br
www.rivellialimentos.com.br
www.perdigao.com.br
www.pifpaf.com.br
www.sadia.com.br
www.seara.com.br
www.gruposertanejo.com.br
www.unifrango.com
www.vosskodobrasil.com.br
www.zanchetta.com.br
^
MeMbeR CoMpAnies in 2008/2009
�5
ASSOCIAçãO BRASILEIRA DOS PRODUTORES E ExPORTADORES
DE FRANGOS
BRAzILIAN CHICKEN PRODUCERS AND ExPORTERS
ASSOCIATION
AV. BRIGADEIRO FARIA LIMA, 1.912 • CONJ. 20 L
01451-907 • SãO PAULO • SP
(TEL / FAx) 55 11 3031.4115
www.ABEF.COM.BR
PROJETO GRÁFICO E EDIçãO DE ARTE
TERRA COMUNICAçãO
TExTO
LAURA ROCHA
COORDENAçãO
DEPARTAMENTO DE INFORMAçãO E ESTATÍSTICA DA ABEF
IMAGENS
KEySTONE
VEJA TAMBÉM NO SITE
www.ABEF.COM.BR
GRAPHIC DESIGN AND ART EDITOR
TERRA COMUNICAçãO
TExT
LAURA ROCHA
COORDINATION
ABEF’S INFORMATION AND STATISTICS DEPARTMENT
IMAGES
KEySTONE
yOU CAN ALSO CHECK IN OUR wEB SITE
www.ABEF.COM.BR