RESULTADO OPERACIONAL ATINGE MÁXIMOS HISTÓRICOS, …
21
15.03.2018 PRESS RELEASE RESULTADOS CONSOLIDADOS DO GRUPO GENERALI ACTUALIZADOS EM 31 DE DEZEMBRO DE 2017 1 RESULTADO OPERACIONAL ATINGE MÁXIMOS HISTÓRICOS, RESULTADO LÍQUIDO ACIMA DE € 2,1 BILIÕES, DIVIDENDOS AUMENTAM 6% PARA € 0,85 POR AÇÃO, CONFIRMANDO PLENAMENTE A ESTRATÉGIA DA GENERALI Resultado operacional atinge o valor recorde de € 4,89 biliões (+2,3%) graças ao Ramo Vida, Investimentos, Gestão de Ativos e Património; objetivo de redução de custos atingido antes do prazo Resultado líquido € 2,1 biliões (+1.4%) Retorno sobre o capital operacional (RoE) 13,4%, em linha com os objetivos fixados no plano estratégico (>13%) Aumento da rentabilidade dos produtos Vida, com aumento em 53,8% do Valor do Novo Negócio (NBV). Receitas líquidas Vida atingem € 9,7 biliões, entre os valores mais altos no setor europeu. Reservas técnicas Vida aumentadas em 4,2% Rácio combinado 92,8%, confirmado como o melhor das maiores congéneres A posição de capital reforçada: Rácio de Solvência Regulamentar de 208%; Rácio de Solvência económica situa-se em 230% Dividendo por ação € 0,85, um aumento de 6% (€ 0,80 ano de 2016) Philippe Donnet, CEO do Grupo Generali, afirmou: “Os excelentes resultados que apresentamos hoje confirmam a eficácia e o valor do nosso plano estratégico no contexto dos mercados atuais. Estamos portanto na posição ideal para atingir todos os objetivos que estabelecemos para 2018. Considerados estes resultados, o Conselho de Administração proporá um dividendo de € 0,85 por ação, o que representa um aumento de 6% em comparação com os € 0,80 distribuídos em 2016. A nossa insistência na excelência técnica, em conjunto com os resultados do nosso negócio de Investimentos, Gestão de Ativos e Patrimónios e o objetivo de redução de custos atingido dois anos antes do prazo estabelecido, impulsionaram o resultado operacional para níveis recorde. Em 2017, implementámos vários importantes projetos, como o lançamento da nova estratégia de gestão de ativos, a racionalização da nossa presença internacional e a transformação do nosso negócio na Alemanha – todas iniciativas que contribuem à resiliência global do nosso Grupo. Estes resultados, obtidos graças ao empenho diário e à paixão dos nossos colegas, agentes e colaboradores, permitem-nos olhar com confiança para o futuro e criar valor sustentável para todos os nossos stakeholders.” _________________________ 1 Alterações em prémios, receitas liquidas, PVNBP (o valor atual dos prémios do novo negócio) e NBV (valor do novo negócio) são presentados em termos equivalentes, ou seja em taxas de câmbio e âmbito de consolidação constantes. Relativamente à alienação das companhias na Holanda e Irlanda, em aplicação da norma IFRS 5, os respetivos valores de ativos e passivos e o resultado económico – líquido de impostos – foram contabilizados separadamente nos itens específicos dos relatórios financeiros. Os valores de 2016 para comparação também foram igualmente reclassificados. Para mais informações, é favor consultar o parágrafo “Alterações na apresentação das medidas de desempenho do Grupo” na Nota ao Relatório de Gestão. Conceição Tomás Head of Marketing T 21 311 28 04 E-mail: [email protected] Generali Companhia de Seguros S.A. Rua Duque de Palmela, 11 1269-270 Lisboa T 21 311 2800 F 21356 60 67 [email protected] www.generali.pt Generali @GENERALI Generaligroup GruppoGenerali
Transcript of RESULTADO OPERACIONAL ATINGE MÁXIMOS HISTÓRICOS, …
15.03.2018 PRESS RELEASE
RESULTADOS CONSOLIDADOS DO GRUPO GENERALI ACTUALIZADOS EM 31 DE DEZEMBRO DE 20171
RESULTADO OPERACIONAL ATINGE MÁXIMOS HISTÓRICOS,
RESULTADO LÍQUIDO ACIMA DE € 2,1 BILIÕES, DIVIDENDOS
AUMENTAM 6% PARA € 0,85 POR AÇÃO, CONFIRMANDO
PLENAMENTE A ESTRATÉGIA DA GENERALI
Resultado operacional atinge o valor recorde de € 4,89 biliões (+2,3%) graças ao Ramo Vida, Investimentos, Gestão de Ativos e Património; objetivo de redução de custos atingido antes do prazo
Resultado líquido € 2,1 biliões (+1.4%)
Retorno sobre o capital operacional (RoE) 13,4%, em linha com os objetivos fixados no plano estratégico (>13%)
Aumento da rentabilidade dos produtos Vida, com aumento em 53,8% do Valor do Novo Negócio (NBV). Receitas líquidas Vida atingem € 9,7 biliões, entre os valores mais altos no setor europeu. Reservas técnicas Vida aumentadas em 4,2%
Rácio combinado 92,8%, confirmado como o melhor das maiores congéneres
A posição de capital reforçada: Rácio de Solvência Regulamentar de 208%; Rácio de Solvência económica situa-se em 230%
Dividendo por ação € 0,85, um aumento de 6% (€ 0,80 ano de 2016)
Philippe Donnet, CEO do Grupo Generali, afirmou: “Os excelentes resultados que
apresentamos hoje confirmam a eficácia e o valor do nosso plano estratégico no contexto
dos mercados atuais. Estamos portanto na posição ideal para atingir todos os objetivos
que estabelecemos para 2018. Considerados estes resultados, o Conselho de
Administração proporá um dividendo de € 0,85 por ação, o que representa um aumento
de 6% em comparação com os € 0,80 distribuídos em 2016. A nossa insistência na
excelência técnica, em conjunto com os resultados do nosso negócio de Investimentos,
Gestão de Ativos e Patrimónios e o objetivo de redução de custos atingido dois anos antes
do prazo estabelecido, impulsionaram o resultado operacional para níveis recorde. Em
2017, implementámos vários importantes projetos, como o lançamento da nova estratégia
de gestão de ativos, a racionalização da nossa presença internacional e a transformação
do nosso negócio na Alemanha – todas iniciativas que contribuem à resiliência global do
nosso Grupo. Estes resultados, obtidos graças ao empenho diário e à paixão dos nossos
colegas, agentes e colaboradores, permitem-nos olhar com confiança para o futuro e criar
valor sustentável para todos os nossos stakeholders.”
_________________________
1 Alterações em prémios, receitas liquidas, PVNBP (o valor atual dos prémios do novo negócio) e NBV (valor do
novo negócio) são presentados em termos equivalentes, ou seja em taxas de câmbio e âmbito de consolidação
constantes. Relativamente à alienação das companhias na Holanda e Irlanda, em aplicação da norma IFRS 5, os
respetivos valores de ativos e passivos e o resultado económico – líquido de impostos – foram contabilizados
separadamente nos itens específicos dos relatórios financeiros. Os valores de 2016 para comparação também
foram igualmente reclassificados. Para mais informações, é favor consultar o parágrafo “Alterações na
apresentação das medidas de desempenho do Grupo” na Nota ao Relatório de Gestão.
Conceição Tomás
Head of Marketing
T 21 311 28 04
E-mail: [email protected]
Generali Companhia de Seguros S.A.
Rua Duque de Palmela, 11
1269-270 Lisboa
T 21 311 2800
F 21356 60 67
www.generali.pt
Generali
@GENERALI
Generaligroup
GruppoGenerali
Milão – Em reunião presidida por Gabriele Galateri di Genola, o Conselho de Administração da Assicurazioni Generali aprovou os relatórios financeiros consolidados e a proposta de relatórios financeiros da Casa Mãe para o ano de 2017.
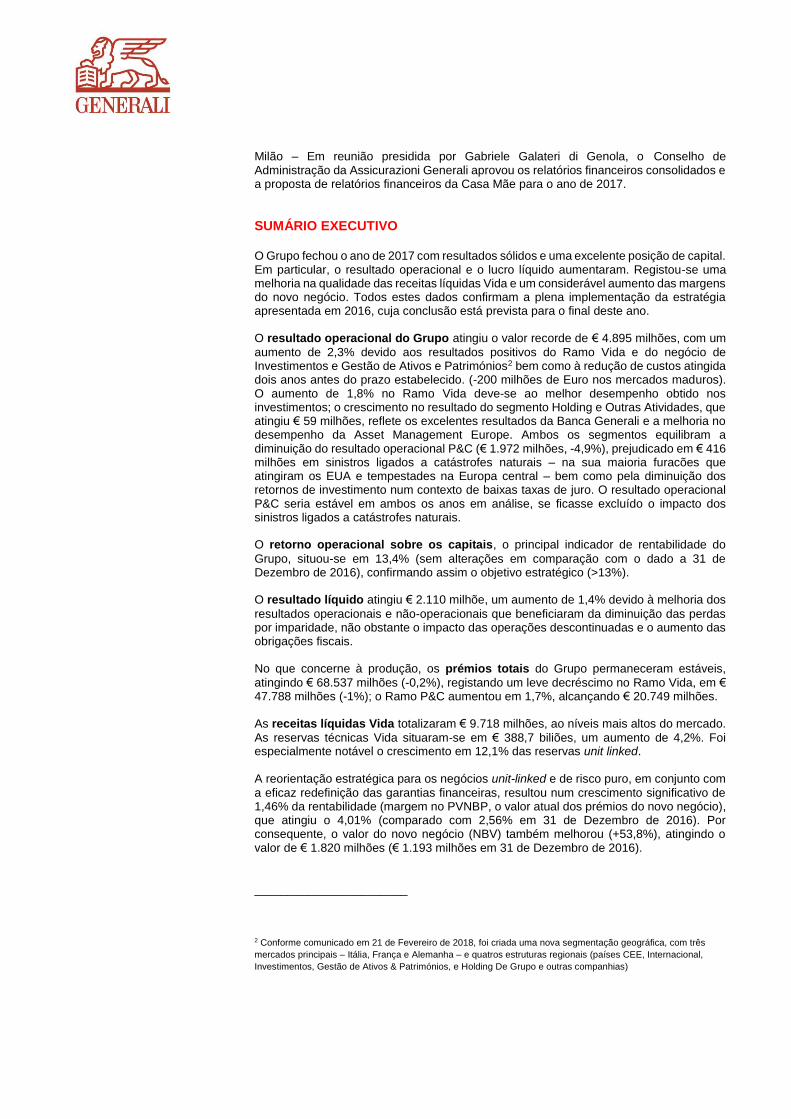
SUMÁRIO EXECUTIVO O Grupo fechou o ano de 2017 com resultados sólidos e uma excelente posição de capital. Em particular, o resultado operacional e o lucro líquido aumentaram. Registou-se uma melhoria na qualidade das receitas líquidas Vida e um considerável aumento das margens do novo negócio. Todos estes dados confirmam a plena implementação da estratégia apresentada em 2016, cuja conclusão está prevista para o final deste ano. O resultado operacional do Grupo atingiu o valor recorde de € 4.895 milhões, com um
aumento de 2,3% devido aos resultados positivos do Ramo Vida e do negócio de Investimentos e Gestão de Ativos e Patrimónios2 bem como à redução de custos atingida dois anos antes do prazo estabelecido. (-200 milhões de Euro nos mercados maduros). O aumento de 1,8% no Ramo Vida deve-se ao melhor desempenho obtido nos investimentos; o crescimento no resultado do segmento Holding e Outras Atividades, que atingiu € 59 milhões, reflete os excelentes resultados da Banca Generali e a melhoria no desempenho da Asset Management Europe. Ambos os segmentos equilibram a diminuição do resultado operacional P&C (€ 1.972 milhões, -4,9%), prejudicado em € 416 milhões em sinistros ligados a catástrofes naturais – na sua maioria furacões que atingiram os EUA e tempestades na Europa central – bem como pela diminuição dos retornos de investimento num contexto de baixas taxas de juro. O resultado operacional P&C seria estável em ambos os anos em análise, se ficasse excluído o impacto dos sinistros ligados a catástrofes naturais. O retorno operacional sobre os capitais, o principal indicador de rentabilidade do
Grupo, situou-se em 13,4% (sem alterações em comparação com o dado a 31 de Dezembro de 2016), confirmando assim o objetivo estratégico (>13%). O resultado líquido atingiu € 2.110 milhõe, um aumento de 1,4% devido à melhoria dos
resultados operacionais e não-operacionais que beneficiaram da diminuição das perdas por imparidade, não obstante o impacto das operações descontinuadas e o aumento das obrigações fiscais. No que concerne à produção, os prémios totais do Grupo permaneceram estáveis,
atingindo € 68.537 milhões (-0,2%), registando um leve decréscimo no Ramo Vida, em € 47.788 milhões (-1%); o Ramo P&C aumentou em 1,7%, alcançando € 20.749 milhões. As receitas líquidas Vida totalizaram € 9.718 milhões, ao níveis mais altos do mercado.
As reservas técnicas Vida situaram-se em € 388,7 biliões, um aumento de 4,2%. Foi especialmente notável o crescimento em 12,1% das reservas unit linked. A reorientação estratégica para os negócios unit-linked e de risco puro, em conjunto com
a eficaz redefinição das garantias financeiras, resultou num crescimento significativo de 1,46% da rentabilidade (margem no PVNBP, o valor atual dos prémios do novo negócio), que atingiu o 4,01% (comparado com 2,56% em 31 de Dezembro de 2016). Por consequente, o valor do novo negócio (NBV) também melhorou (+53,8%), atingindo o valor de € 1.820 milhões (€ 1.193 milhões em 31 de Dezembro de 2016).
_______________________
2 Conforme comunicado em 21 de Fevereiro de 2018, foi criada uma nova segmentação geográfica, com três
mercados principais – Itália, França e Alemanha – e quatros estruturas regionais (países CEE, Internacional,
Investimentos, Gestão de Ativos & Patrimónios, e Holding De Grupo e outras companhias)
O crescimento registado nos prémios de P&C deve-se ao segmento automóvel e bem com aos outros incluídos na categoria. O Rácio Combinado, em 92,8% (+0,5%), é o melhor entre as grandes congéneres
europeias, confirmando a comprovada trajetória de excelência técnica do Grupo. Em particular, o índice de sinistralidade – o efeito dos sinistros nos prémios – melhorou em 0,6% (de 63,5% em 2016 para 62,9%), excluindo o impacto das catástrofes naturais. O Rácio de Solvência Regulamentar – que representa a visão do regulador sobre o
capital do Grupo, e baseia-se na utilização de um modelo interno, exclusivo às companhias que obtiveram a aprovação do IVASS, e numa Fórmula Padrão para as outras companhias – colocou-se em 208% (178% no ano de 2016). O Rácio de Solvência Económica do Grupo, que representa o capital do Grupo do ponto
de vista económico e é calculado aplicando o modelo interno ao perímetro total do Grupo, fixou-se em 230% (194% no ano de 2016).
DIVIDENDO POR AÇÃO
O dividendo por ação a ser proposto na próxima Assembleia dos Acionistas é de € 0,85,
o que representa um aumento de 5 cêntimos por ação (+6%) desde o ano passado (€ 0,80 em 2016). A taxa de distribuição do lucro aos acionistas corresponde a 63%, comparado com 60% em 2016. O dividendo total relacionado às ações em circulação totaliza € 1.330 milhões. A data de pagamento do dividendo foi fixada para o dia 23 de Maio, a data de registo no dia 22 de maio e a data ex-dividendo a partir do dia 21 de Maio. Esta é uma tradução do Press Release oficial da Assicurazioni Generali S.p.A. Segue abaixo o Press Release oficial.
GRUPO GENERALI
A Generali é um Grupo independente italiano, com forte presença internacional. Fundado em
1831, é um dos maiores grupos seguradores do mundo, presente em mais de 60 países, com
uma receita total de prémios acima de € 68 mil milhões em 2017. Com aproximadamente
71.000 colaboradores em todo o mundo e 57 milhões de clientes, o Grupo ocupa uma posição
de liderança nos mercados da Europa Ocidental e tem uma presença cada vez mais importante
na Europa Centro-Oriental e na Ásia. Em 2017, o Grupo Generali foi incluído entre as
companhias mais sustentáveis do mundo pelo ranking Corporate Knights.

1
GENERALI GROUP CONSOLIDATED RESULTS AT 31 DECEMBER 2017 1
OPERATING RESULT HITS RECORD HIGH, NET PROFIT OVER € 2.1 BILLION, DIVIDEND RISES 6% TO € 0.85 PER SHARE. CONFIRMING GENERALI STRATEGY FULLY ON TRACK
Operating result at record of € 4.89 billion (+2.3%) thanksto the Life segment, the Investments, Asset & WealthManagement business and cost reduction target reachedahead of schedule
Net profit over € 2.1 billion (+1.4%)
Operating RoE at 13.4%, in line with the strategic plantarget (>13%)
Increase in profitability of life products, with NewBusiness Value (NBV) rising 53.8%. Life net cash inflowsat € 9.7 billion, among the highest levels in the Europeansector. Life technical reserves increased by 4.2%
Combined Ratio at 92.8%, confirmed as the best amonglarge peers
The capital position is further strengthened: RegulatorySolvency Ratio at 208%; Economic Solvency Ratio at 230%
Dividend per share at € 0.85, up 6% (€ 0.80 FY2016)
Generali Group CEO Philippe Donnet declared: “The excellent results that we presented
today confirm the validity and effectiveness of our strategic plan in this current market context.
We are perfectly positioned to reach all of our objectives that we had set for 2018. In light of
these results, the Board of Directors will propose a dividend of 0.85 Euro per share, an
increase of 6 per cent from 0.80 Euro in 2016. Our focus on technical excellence, combined
with the results of our Investments, Asset & Wealth Management business and the cost
reduction target hit two years ahead of schedule, have pushed the operating result to record
levels. In 2017, we implemented a series of important projects, such as the launch of the
new asset management strategy, the rationalizing of the international footprint and the
transformation of our German business - all initiatives that contribute to the overall resilience
of our Group. These results, obtained thanks to the daily commitment and passion of our
colleagues, agents and collaborators, allow us to look to the future with confidence and to
create sustainable value for all of our stakeholders.”
1 Changes in premiums, net cash inflows, PVNBP (the present value of new business premiums) and NBV (New Business Value) are presented in equivalent terms, that is at constant exchange rates and scope of consolidation. With reference to the divestment of the Dutch and Irish companies in application of IFRS 5, their value of assets and liabilities, and economic result - net of taxes - were separately entered in the specific items of the financial statements. The 2016 comparative figures were likewise reclassified. For more information, please refer to the paragraph “Change in presentation of the Group performance measures” in the Note to the Management Report.
15/03/2018 PRESS RELEASE
Media Relations
T +39.02.248248884
Investor Relations
T +39.040.671402
www.generali.com
user: Generali
user: @GENERALI
user: generaligroup
user: GruppoGenerali
user: Generali
user: @GENERALI
user: generaligroup
user: GruppoGenerali
2
Milan - At a meeting chaired by Gabriele Galateri di Genola, the Assicurazioni Generali Board
of Directors approved the consolidated financial statements and the Parent Company’s draft
financial statements for the year 2017.
EXECUTIVE SUMMARY
The Group closed the year 2017 with strong results and excellent capital position. In particular,
the operating result and net profit both increased. There was improvement of the quality of life
net cash inflows and strongly increased new business margins. They confirm the full
implementation of the strategy presented in 2016 that will be completed by year-end.
The Group’s operating result reached the record level of € 4,895 million, up 2.3% thanks to
the positive performance of the life segment and the Investments, Asset & Wealth
Management business2 and to the cost reduction reached two years ahead of schedule (-€200
million in mature markets). The 1.8% increase in the Life result is due to a better investment
performance; the growth in the result of the segment Holding and Other Activities, reaching
€ 59 million, reflects the excellent results of Banca Generali and the enhanced performance
of Asset Management Europe. Both segments balance the decrease of the P&C operating
result (€ 1,972 million, -4.9%) affected by €416 million in natural catastrophe claims that mainly
came from the US hurricanes and the storms that swept Central Europe as well as by the
lower contribution of investment returns in a low interest rate context. Excluding the impact of
natural catastrophe claims in both years under comparison, the P&C operating result would
be stable.
The operating return on equity, the Group’s main economic profitability indicator, came to
13.4% (unchanged compared with the 31 December 2016 figure), confirming the strategic
objective (>13%).
Net profit reached € 2,110 million, up 1.4% due to the improvement in the operating and non-
operating results that mostly benefit from lower impairment losses and notwithstanding the
impact of the discontinued operations and the increase in fiscal obligations.
As for production, the total premiums of the Group were steady at € 68,537 million (-0.2%),
with the life segment slightly down at € 47,788 million (-1%) while the P&C segment rose 1.7%
to € 20,749 million.
Life net inflows amounted to € 9,718 million, proving to be among the highest levels of the
market. The life technical reserves stood at €388.7 billion, up 4.2%. In particular, the unit
linked reserves grew by 12.1%.
The strategic reorientation toward the unit-linked and pure risk businesses, together with the
effective redefinition of the financial guarantees, resulted in significant growth of profitability
(margin on PVNBP) of 1.46 p.p., rising to 4.01% (2.56% at 31 December 2016). Also the new
business value (NBV) improved consequently (+53.8%), standing at € 1,820 million (€ 1,193
million at 31 December 2016).
2As communicated on 21 February 2018, there is a new geographic segmentation created by three main markets – Italy, France and Germany, and four regional structures (CEE countries, International, Investments, Asset & Wealth Management and Group Holding and other companies)
3
Growth in P&C premiums is due to both the motor and non-motor segments.
The Combined Ratio, at 92.8% (+0.5%), ranks number one among our large European peers
and is consistent with the Group’s proven track record of technical excellence. In particular,
not considering the impact of natural catastrophes, the loss ratio – the effect of claims on
premiums – improved by 0.6% (62.9% from 63.5% in 2016).
The Regulatory Solvency Ratio – which represents the regulatory view of the Group’s capital
and is based on use of the internal model, solely for companies that have obtained the relevant
approval from IVASS, and on the Standard Formula for other companies – stood at 208%
(178% FY 2016).
The Economic Solvency Ratio of the Group, which represents the economic view of the
Group’s capital and is calculated by applying the internal model to the entire Group perimeter,
stood at 230% (194% FY 2016).
DIVIDEND PER SHARE
The dividend per share to be proposed at the next Shareholders’ Meeting is €0.85, up by €
5 cents per share (+6%) compared to the previous year (€ 0.80 FY2016). The pay-out ratio is
equal to 63%, from 60% in 2016.
The total dividend relating to shares outstanding amounts to €1,330 million. The dividend
payment date shall be from May 23 with record date on May 22 and ex-dividend date from
May 21.
LIFE SEGMENT
Operating result up to € 3.1 billion (+1.8%)
Increased new business value (NBV) to € 1.8 billion (+53.8%)
and the new business margin (NBM) +1.46 p.p. thanks to
products having better characteristics in terms of return vs. risk
Net cash inflows at € 9.7 billion
Premiums at € 47.8 billion (-1%)
Technical reserves up by 4.2%
The net cash inflows stood at € 9,718 million, one of the highest levels in the market. The
trend (-17,1%) reflects in particular the decline registered in Italy (-20.8%) due to payments
coming from surrenders and the strategy for rebalancing the portfolio. International declined
as well (-57.9%) that takes into account a decline in inflows in Asia and EMEA combined with
higher payments. Compared to 2016, the net cash inflows are composed exclusively of unit
linked policies and protection while it is negative for traditional savings policies. The life
technical reserves stood at €388.7 billion, up 4.2%. In particular, the unit linked reserves grew
by 12.1%.
The reorientation toward the unit linked and pure risk businesses, together with the reduction
of financial guarantees, resulted in significant margin expansion (margin on PVNBP) of 1.46

4
p.p., rising to 4.01% (2.56% at 31 December 2016).
New business in terms of present value of new business premiums (PVNBP) amounted
to €45,429 million, down by 2.3%, in both the single premium (-2.8%) and the annual premium
policies (-2.6%). Unit linked production rose sharply (+28.7%) and the protection line improved
slightly (+3%). The traditional savings and pension line premiums posted a significant
decrease (-19.0%) due to the Group’s strategic actions aimed at reducing business subject to
financial guarantees. As a result of the strategic objectives, the new business value (NBV)
improved significantly (+53.8%), standing at € 1,820 million (€1,193 million at 31 December
2016).
Life premiums totalled € 47,788 million (-1%). The performance was consistent with the
underwriting policy that led to an increase in unit linked premiums (+22.4%) in particular in
Italy (+57.3%) and France (+52.1%). Premiums for protection policies grew 7% reflecting
the general increase across the countries where the Group is present.
(€ million) Operating result NBV
31/12/2017 31/12/2016 Change 31/12/2017 31/12/2016 Change
Italy 1,246 1,305 -4.5% 903 579 +56%
France 607 593 +2.3% 211 28 n.m.
Germany 526 457 +15.2% 243 273 -11.1%
Central Eastern Europe 229 249 -8.0% 97 78 +20.9%
International 659 645 +2.2% 367 235 +64.7%
Group Holding and other companies
-126 -163 -23.0% - - -
Total 3,141 3,084 +1.8% 1,820 1,193 +53.8%
P&C SEGMENT
Premiums up to € 20.7 billion (+1.7%)
Both the motor (+3%) and non-motor (+0.9%) segments
improved
Combined Ratio at 92.8%, best among large peers
Premiums of the P&C segment totalled € 20,749 million, up 1.7% due to the motor segment
(+3.0%) driven by Germany (+4.2%), CEE Countries (+3.2%), the Americas (+25.7%), France
(+2.6%) and Spain (+3.8%), which more than offset the drop in motor premium income in Italy
(-4.5%) where the average premium in the market continues to fall, and measures are being
taken by the Group to recover the returns of the portfolio. Also non-motor premium income is
up (+0.9%), which mainly benefited from the development in the CEE Countries (+3.6%), in
the EMEA region (+2.6%) and by Europ Assistance (+14%). Italy and France fell 1.8% and
2%, respectively, because of the weak market conditions in the corporate and property lines.
The operating result of the P&C was € 1,972 million (€ 2,073 million at 31 December 2016).
The decrease (-4.9%) was mostly influenced by the greater impact of natural catastrophe
claims, which on the whole affected the year for € 416 million, mainly due to the US hurricanes
and the storms that struck Central Europe. Excluding the impact of natural catastrophe claims

5
in both years under comparison, the P&C operating result would be stable.
The Group Combined Ratio stood at 92.8% (+0.5 p.p. compared to 31 December 2016),
confirming its leadership position among large European peers. In particular, the loss ratio
remained stable. Not considering the impact of natural catastrophes, the loss ratio improved
by 0.6% (62.9% from 63.5% in 2016).
(€ million) Operating result Combined ratio
31/12/2017 31/12/2016 Change 31/12/2017 31/12/2016 Change
Italy 651 714 -8.8% 90.0% 89.9% + 0.1 %pts
France 155 137 +12.8% 98.4% 99.4% -1.0 %pts
Germany 327 428 -23.6% 92.6% 90.0% + 2.6 %pts
Central Eastern Europe 249 204 +22.2% 87.8% 89.5% -1.7 %pts
International 520 597 -13.0% 96.2% 94.8% + 1.3 %pts
Group Holding and other companies
72 -6 n.m. 52.6% 68.7% - 16.1 %pts
Total 1,972 2,073 -4.9% 92.8% 92.3% + 0.5 %pts
HOLDING AND OTHER ACTIVITY SEGMENT3
The operating result of the Holding and other businesses segment amounted to € 59 million,
considerably up compared to the loss of € 74 million in 2016.
The operating result of the financial and other businesses segment grew to € 513 million
(€ 384 million at 31 December 2016). The increase (33.6%) was driven by the performance
of the financial segment, particularly the excellent results of Banca Generali, which rose from
€ 190 million to € 241 million, due to higher performance fees as well as the positive results
of the other asset management and real estate companies.
At 31 December 2017, the third party assets managed by the Group companies amounted to
€67,474 million (€56,324 million at 31 December 2016), up by 19.8%.
OUTLOOK
In an improving macroeconomic and financial context still characterised by low interest rates
and uncertainty in the financial markets, the disciplined execution of the current strategic plan
will continue. The Group will continue to rebalance the portfolio in the life segment with the
3 This segment includes the activities of the Group companies in the asset and wealth management
sectors, the costs incurred for management and coordination and business financing, and all other
operations that the Group considers to be ancillary to the core insurance business.
6
goal of optimising its profitability and allowing capital to be allocated more efficiently through
the simplification and innovation of the range of product solutions. Despite the strong
competitive pressure in the P&C business, premium income is expected to rise. The above-
mentioned initiatives will permit the Group to offset the prolonged low-interest rate scenario
and will encourage growth, confirming the objectives set in the strategic plan.
The Manager in charge of preparing the company’s financial reports, Luigi Lubelli, declares, pursuant to
paragraph 2 article 154 bis of the Consolidated Law on Finance, that the accounting information in this press
release corresponds to the document results, books and accounting entries.
THE GENERALI GROUP
Generali is an independent, Italian Group, with a strong international presence.
Established in 1831, it is among the world’s leading insurers and it is present in over
60 countries with total premium income exceeding €68 billion in 2017. With nearly
71,000 employees in the world and 57 million customers, the Group has a leading
position in Western Europe and an increasingly significant presence in Central and
Eastern Europe as well as in Asia. In 2017, Generali Group was included among the
most sustainable companies in the world by the Corporate Knights ranking.
NOTE TO EDITORIAL STAFF
At 7:30 a.m. the following documents will be available on www.generali.com: press release, pre-recorded video with transcription, presentation for analysts, financial statements and other financial documents.
The Analyst Call will take place at 12:00. Journalists may listen in by dialling +39 02 3600 8045 (listen-only mode).
The Generali corporate app offers the most recent institutional information package, which has
been optimized for mobile devices. The app may be downloaded free of charge from Apple and
Android stores.
List of annexes:
1. Group balance sheet and income statement
2. Parent Company balance sheet and income statement

1. GROUP’S BALANCE SHEET AND INCOME STATEMENT
BALANCE SHEET
Assets
References: (€ million) 31/12/2017 31/12/2016
1 INTANGIBLE ASSETS 8,784 8,866
4 1.1 Goodwill 6,679 6,664
19 1.2 Other intangible assets 2,105 2,202
2 TANGIBLE ASSETS 4,075 4,476
20 2.1 Land and buildings (self used) 2,606 2,810
20 2.2 Other tangible assets 1,469 1,666
14 3 AMOUNTS CEDED TO REINSURERS FROM INSURANCE PROVISIONS 4,294 3,933
39, 40, 41, 42 4 INVESTMENTS 471,233 469,172
11 4.1 Land and buildings (investment properties) 12,993 12,584
3 4.2 Investments in subsidiaries, associated companies and joint ventures 1,171 1,194
7 4.3 Held to maturity investments 2,267 2,168
8 4.4 Loans and receivables 40,262 44,178
9 4.5 Available for sale financial assets 320,641 313,933
10 4.6 Financial assets at fair value through profit or loss 93,897 95,114
of which financial assets where the investment risk is borne by the policyholders and related to pension funds
75,372 78,317
21 5 RECEIVABLES 11,676 11,790
5.1 Receivables arising out of direct insurance operations 7,238 7,155
5.2 Receivables arising out of reinsurance operations 1,441 1,163
5.3 Other receivables 2,997 3,471
22 6 OTHER ASSETS 30,170 15,414
6.1 Non-current assets or disposal groups classified as held for sale 16,146 772
15 6.2 Deferred acquisition costs 2,119 2,083
6.3 Deferred tax assets 2,091 2,477
6.4 Tax receivables 2,961 2,974
6.5 Other assets 6,853 7,108
12 7 CASH AND CASH EQUIVALENTS 6,849 7,533
TOTAL ASSETS 537,080 521,184

Equity and liabilities
References: (€ million) 31/12/2017 31/12/2016
16 1 SHAREHOLDERS' EQUITY 26,177 25,668
1.1 Shareholders' equity attributable to the Group 25,079 24,545
1.1.1 Share capital 1,562 1,560
1.1.2 Other equity instruments 0 0
1.1.3 Capital reserves 7,098 7,098
1.1.4 Revenue reserves and other reserves 9,209 8,604
1.1.5 (Own shares) -8 -7
1.1.6 Reserve for currency translation differences -115 42
1.1.7 Reserve for unrealized gains and losses on available for sale financial assets 6,279 6,319
1.1.8 Reserve for other unrealized gains and losses through equity -1,055 -1,153
1.1.9 Result of the period 2,110 2,081
1.2 Shareholders' equity attributable to minority interests 1,098 1,123
1.2.1 Share capital and reserves 915 879
1.2.2 Reserve for unrealized gains and losses through equity -3 86
1.2.3 Result of the period 185 158
23 2 OTHER PROVISIONS 1,950 1,804
13 3 INSURANCE PROVISIONS 430,489 421,477
of which insurance provisions for policies where the investment risk is borne by the policyholders and related to pension funds
67,997 60,799
4 FINANCIAL LIABILITIES 42,316 51,416
17 4.1 Financial liabilities at fair value through profit or loss 8,935 19,484
of which financial liabilities where the investment risk is borne by the policyholders and related to pension funds
7,360 17,404
18 4.2 Other financial liabilities 33,381 31,932
of which subordinated liabilities 8,379 9,126
24 5 PAYABLES 10,494 9,550
5.1 Payables arising out of direct insurance operations 3,602 3,465
5.2 Payables arising out of reinsurance operations 848 579
5.3 Other payables 6,043 5,506
25 6 OTHER LIABILITIES 25,653 11,269
6.1 Liabilities directly associated with non-current assets and disposal groups classified as held for sale
15,745 702
6.2 Deferred tax liabilities 2,642 2,616
6.3 Tax payables 1,487 1,644
6.4 Other liabilities 5,779 6,307
TOTAL SHAREHOLDERS' EQUITY AND LIABILITIES 537,080 521,184

INCOME STATEMENT
Income statement
References: (€ million) 31/12/2017 31/12/2016
26 1.1 Net earned premiums 64,604 64,944
1.1.1 Gross earned premiums 66,363 66,733
1.1.2 Earned premiums ceded -1,759 -1,789
27 1.2 Fee and commission income and income from financial service activities 1,080 959
28 1.3 Net income from financial instruments at fair value through profit or loss 5,326 1,784
of which net income from financial instruments where the investment risk is borne by the policyholders and related to pension funds
4,107 1,706
29 1.4 Income from subsidiaries, associated companies and joint ventures 135 131
30 1.5 Income from other financial instruments and land and buildings (investment properties) 14,880 14,782
1.5.1 Interest income 9,542 9,878
1.5.2 Other income 2,221 2,043
1.5.3 Realized gains 2,881 2,604
1.5.4 Unrealized gains and reversal of impairment losses 237 258
31 1.6 Other income 3,180 2,916
1 TOTAL INCOME 89,204 85,518
32 2.1 Net insurance benefits and claims -65,748 -63,616
2.1.1 Claims paid and change in insurance provisions -67,374 -64,558
2.1.2 Reinsurers' share 1,626 942
33 2.2 Fee and commission expenses and expenses from financial service activities -608 -611
34 2.3 Expenses from subsidiaries, associated companies and joint ventures -18 -43
35 2.4 Expenses from other financial instruments and land and buildings (investment properties) -2,784 -3,403
2.4.1 Interest expense -1,029 -1,088
2.4.2 Other expenses -388 -350
2.4.3 Realized losses -612 -471
2.4.4 Unrealized losses and impairment losses -755 -1,494
36 2.5 Acquisition and administration costs -10,868 -10,698
2.5.1 Commissions and other acquisition costs -8,122 -7,964
2.5.2 Investment management expenses -171 -188
2.5.3 Other administration costs -2,575 -2,546
37 2.6 Other expenses -5,493 -4,032
2 TOTAL EXPENSES -85,518 -82,403
EARNINGS BEFORE TAXES 3,686 3,115
38 3 Income taxes -1,173 -915
EARNINGS AFTER TAXES 2,513 2,199
4 RESULT OF DISCONTINUED OPERATIONS -217 40
CONSOLIDATED RESULT OF THE PERIOD 2,295 2,239
Result of the period attributable to the Group 2,110 2,081
Result of the period attributable to minority interests 185 158
16 EARNINGS PER SHARE
Basic earnings per share (€) 1.35 1.34
From continuing operations 1.49 1.34
Diluted earnings per share (€) 1.33 1.32
From continuing operations 1.47 1.32

BALANCE SHEET
(in thousands euro)
BALANCE SHEET
ASSETS
Year 2017 Year 2016
A. SUBSCRIBED CAPITAL UNPAID 0 0
of which called-up capital 0
B. INTANGIBLE ASSETS
1. Acquisition commissions to be amortised
a) life business 0
b) non-life business 0 0
2. Other acquisition costs 0
3. Formation and development expenses 0
4. Goodwill 0
5. Other intangible assets 30,127 30,127 33,197
C. INVESTMENTS
I Land and Buildings
1. Property used for own activities 7,716
2. Property used by third parties 97,110
3. Other properties 0
4. Other realty rights 0
5. Assets in progress and payments on account 1,787 106,613
II Investments in affiliated companies and other shareholdings
1. Interests in
a) parent companies 0
b) affiliated companies 29,491,857
c) affiliates of parent companies 0
d) associated companies 219,431
e) other 20,530 29,731,819
2. Debt securities issued by
a) parent companies 0
b) affiliated companies 650
c) affiliates of parent companies 0
d) associated companies 0
e) other 0 650
3. Loans to
a) parent companies 0
b) affiliated companies 1,662,883
c) affiliates of parent companies 0
d) associated companies 0
e) other 0 1,662,883 31,395,352
30,127 33,197

2 | Assicurazioni Generali
Year 2017 Year 2016
C. INVESTMENTS (follows)
III Other financial investments
1. Equities
a) quoted shares 15,540
b) unquoted shares 12,822
c) other interests 5,308 33,670
2. Shares in common investment funds 40,314
3. Debt securities and other fixed-income securities
a) quoted 1,962,570
b) unquoted 36,375
c) convertible bonds 367 1,999,312
4. Loans
a) mortgage loans 0
b) loans on policies 760
c) other loans 2,146 2,905
5. Participation in investment pools 0
6. Deposits with credit institutions 128,799
7. Other 9,990 2,214,991
IV Deposits with ceding companies 6,927,863 40,644,819 40,998,308
D. INVESTIMENTS FOR THE BENEFIT OF LIFE-ASSURANCE POLICYHOLDERS WHO BEAR
THE INVESTMENT RISK AND RELATING TO THE ADMINISTRATION OF PENSION FUNDS
I - Investiments relating to contracts linked to investments funds and market index 3,268,077
II - Investiments relating to the administration of pension funds 0 3,268,077 3,456,300
D.bis REINSURANCE AMOUNTS OF TECHNICAL PROVISIONS
I NON-LIFE INSURANCE BUSINESS
1. Provision for unearned premiums 124,702
2. Provision for claims outstanding 733,252
3. Provision for profit sharing and premium refunds 0
4. Other technical provisions 0 857,954
II - LIFE INSURANCE BUSINESS
1. Mathematical provision 36,165
2. Unearned premium provision for supplementary coverage 23,645
3. Provision for claims outstanding 341,307
4. Provision for profit sharing and premium refunds 19,424
5. Other provisions 0
6. Provisions for policies where the investment risk
is borne by the policyholders and relating
to the administration of pension funds 0 420,541 1,278,495 914,222
45,221,517 45,402,026
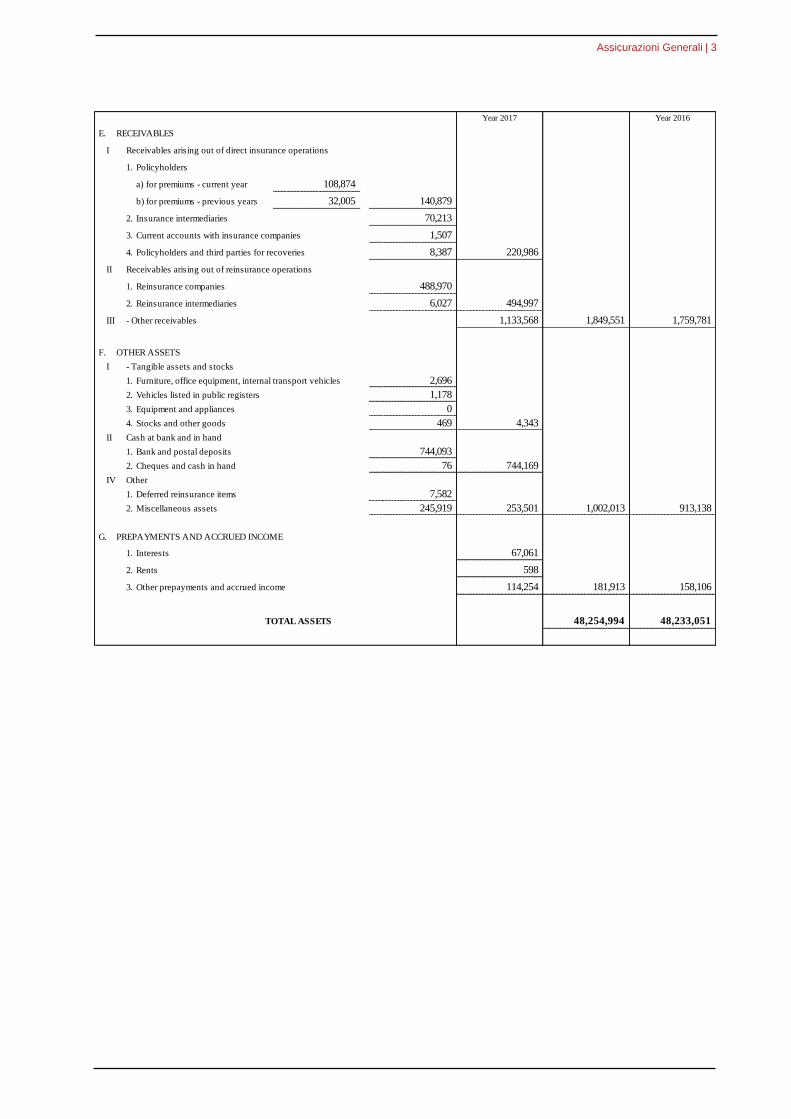
Assicurazioni Generali | 3
Year 2017 Year 2016
E. RECEIVABLES
I Receivables arising out of direct insurance operations
1. Policyholders
a) for premiums - current year 108,874
b) for premiums - previous years 32,005 140,879
2. Insurance intermediaries 70,213
3. Current accounts with insurance companies 1,507
4. Policyholders and third parties for recoveries 8,387 220,986
II Receivables arising out of reinsurance operations
1. Reinsurance companies 488,970
2. Reinsurance intermediaries 6,027 494,997
III - Other receivables 1,133,568 1,849,551 1,759,781
F. OTHER ASSETS
I - Tangible assets and stocks
1. Furniture, office equipment, internal transport vehicles 2,696
2. Vehicles listed in public registers 1,178
3. Equipment and appliances 0
4. Stocks and other goods 469 4,343
II Cash at bank and in hand
1. Bank and postal deposits 744,093
2. Cheques and cash in hand 76 744,169
IV Other
1. Deferred reinsurance items 7,582
2. Miscellaneous assets 245,919 253,501 1,002,013 913,138
G. PREPAYMENTS AND ACCRUED INCOME
1. Interests 67,061
2. Rents 598
3. Other prepayments and accrued income 114,254 181,913 158,106
TOTAL ASSETS 48,254,994 48,233,051

4 | Assicurazioni Generali
BALANCE SHEET
LIABILITIES AND SHAREHOLDERS' FUNDS
Year 2017 Year 2016
A. SHAREHOLDERS' FUNDS
I - Subscribed capital or equivalent funds 1,561,808
II - Share premium account 3,568,250
III - Revaluation reserve 2,010,835
IV - Legal reserve 312,362
V - Statutory reserve 0
VI - Reserve for parent company shares 0
VII - Other reserve 5,970,810
VIII - Profit or loss brought forward 0
IX - Profit or loss for the financial year 1,404,459
X - Negative reserve for own shares held 3,040 14,825,483 14,670,385
B. SUBORDINATED LIABILITIES 7,051,952 7,089,925
C. TECHNICAL PROVISIONS
I - NON-LIFE INSURANCE BUSINESS
1. Provision for unearned premiums 380,979
2. Provision for claims outstanding 1,916,612
3. Provision for profit sharing and premium refunds 0
4. Other provisions 0
5. Equalisation provision 314 2,297,906
II - LIFE INSURANCE BUSINESS
1. Mathematical provision 7,026,151
2. Unearned premium provision for supplementary coverage 31,850
3. Provision for claims outstanding 1,230,942
4. Provision for profit sharing and premium refunds 84,475
5. Other provisions 17,895 8,391,312 10,689,218 11,518,905
D. PROVISIONS FOR POLICIES WHERE THE INVESTMENT RISK IS BORNE BY THE
POLICYHOLDER AND RELATING TO THE ADMINISTRATION OF PENSION FUNDS
I Provisions relating to contracts linked to
investments funds and market index 3,265,804
II Provisions relating to the administration of pension funds 0 3,265,804 3,454,111
35,832,457 36,733,326

Assicurazioni Generali | 5
Year 2017 Year 2016
E. PROVISIONS FOR OTHER RISKS AND CHARGES
1. Provision for pensions and similar obligations 0
2. Provisions for taxation 45,278
3. Other provisions 57,143 102,420 113,298
F. DEPOSITS RECEIVED FROM REINSURERS 331,210 307,642
G. PAYABLES
I - Payables arising out of direct insurance operations
1. Insurance intermediaries 7,764
2. Current accounts with insurance companies 4,907
3. Premium deposits and premiums due to policyholders 6,377
4. Guarantee funds in favour of policyholders 0 19,048
II Payables arising out of reinsurance operations
1. Reinsurance companies 172,580
2. Reinsurance intermediaries 96,147 268,727
III - Bond issues 3,191,654
IV - Amounts owed to credit institutions 1,188,706
V - Loans guaranteed by mortgages 0
VI - Other financial liabilities 3,811,359
VII - Provisions for severance pay 4,746
VIII - Other Payables
1. Premium taxes 5,256
2. Other tax liabilities 33,046
3. Social security 3,935
4. Sundry creditors 2,606,292 2,648,529
IX - Other liabilities
1. Deferred reinsurance items 2,338
2. Commissions for premiums in course of collection 13,751
3. Miscellaneous liabilities 535,939 552,029 11,684,798 10,746,349
47,950,886 47,900,615
Year 2017 Year 2016
H. ACCRUALS AND DEFERRED INCOME
1. Interests 276,515
2. Rents 1,967
3. Other accruals and deferred income 25,626 304,109 332,436
TOTAL LIABILITIES AND SHAREHOLDERS' FUNDS 48,254,994 48,233,051
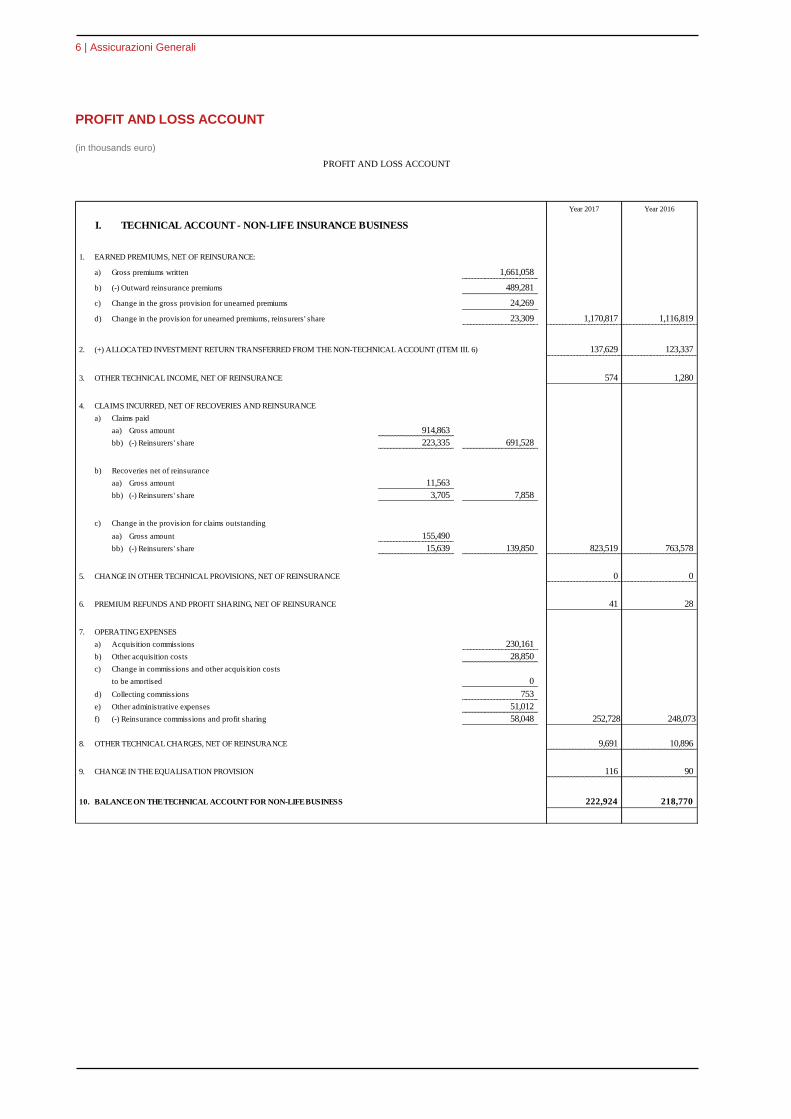
6 | Assicurazioni Generali
PROFIT AND LOSS ACCOUNT
(in thousands euro)
PROFIT AND LOSS ACCOUNT
Year 2017 Year 2016
I. TECHNICAL ACCOUNT - NON-LIFE INSURANCE BUSINESS
1. EARNED PREMIUMS, NET OF REINSURANCE:
a) Gross premiums written 1,661,058
b) (-) Outward reinsurance premiums 489,281
c) Change in the gross provision for unearned premiums 24,269
d) Change in the provision for unearned premiums, reinsurers' share 23,309 1,170,817 1,116,819
2. (+) ALLOCATED INVESTMENT RETURN TRANSFERRED FROM THE NON-TECHNICAL ACCOUNT (ITEM III. 6) 137,629 123,337
3. OTHER TECHNICAL INCOME, NET OF REINSURANCE 574 1,280
4. CLAIMS INCURRED, NET OF RECOVERIES AND REINSURANCE
a) Claims paid
aa) Gross amount 914,863
bb) (-) Reinsurers' share 223,335 691,528
b) Recoveries net of reinsurance
aa) Gross amount 11,563
bb) (-) Reinsurers' share 3,705 7,858
c) Change in the provision for claims outstanding
aa) Gross amount 155,490
bb) (-) Reinsurers' share 15,639 139,850 823,519 763,578
5. CHANGE IN OTHER TECHNICAL PROVISIONS, NET OF REINSURANCE 0 0
6. PREMIUM REFUNDS AND PROFIT SHARING, NET OF REINSURANCE 41 28
7. OPERATING EXPENSES
a) Acquisition commissions 230,161
b) Other acquisition costs 28,850
c) Change in commissions and other acquisition costs
to be amortised 0
d) Collecting commissions 753
e) Other administrative expenses 51,012
f) (-) Reinsurance commissions and profit sharing 58,048 252,728 248,073
8. OTHER TECHNICAL CHARGES, NET OF REINSURANCE 9,691 10,896
9. CHANGE IN THE EQUALISATION PROVISION 116 90
10. BALANCE ON THE TECHNICAL ACCOUNT FOR NON-LIFE BUSINESS 222,924 218,770

Assicurazioni Generali | 7
Year 2017 Year 2016
II. TECHNICAL ACCOUNT - LIFE ASSURANCE BUSINESS
1. PREMIUMS WRITTEN, NET OF REINSURANCE
a) Gross premiums written 1,708,336
b) (-) Outward reinsurance premiums 363,580 1,344,757 1,635,611
2. INVESTMENT INCOME:
a) From partecipating interests 1,003,319
(of which, income from Group companies) 1,001,314
b) From other investments
aa) income from land and buildings 0
bb) from other investments 320,273 320,273
(of which, income from Group companies) 245,751
c) Value re-adjustments on investment 4,949
d) Gains on the realisationof investments 10,865
(of which, income from Group companies) 0 1,339,406 1,308,046
3. INCOME AND UNREALISED GAINS ON INVESTMENTS FOR THE BENEFIT OF POLICYHOLDERS WHO BEAR
THE INVESTMENT RISK AND ON INVESTMENT RELATING TO THE ADMINISTRATION OF PENSION FUNDS 93,674 52,097
4. OTHER TECHNICAL INCOME, NET OF REINSURANCE 16,836 23,651
5. CLAIMS INCURRED, NET OF REINSURANCE
a) Claims paid
aa) gross amount 2,104,367
bb) (-) reinsurers' share 236,248 1,868,119
b) Change in the provision for claims outstanding
aa) gross amount 154,924
bb) (-) reinsurers' share 40,708 114,216 1,982,335 1,792,419
6. CHANGE IN THE PROVISION FOR POLICY LIABILITIES AND IN OTHER
TECHNICAL PROVISIONS, NET OF REINSURANCE
a) Provisions for policy liabilities
aa) gross amount -478,604
bb) (-) reinsurers' share 5,663 -484,266
b) Change in the provision for claims outstanding
aa) gross amount 5,358
bb) (-) reinsurers' share 10,247 -4,888
c) Other provisions
aa) gross amount 228
bb) (-) reinsurers' share 0 228
d) Provisions for policies where the investment risk is borne by the shareholders
and relating to the administration of pension funds
aa) gross amount -169,802
bb) (-) reinsurers' share 0 -169,802 -658,729 -211,500

8 | Assicurazioni Generali
Year 2017 Year 2016
7. PREMIUM REFUNDS AND PROFIT-SHARING, NET OF REINSURANCE 46,664 66,744
8. OPERATING EXPENSES
a) Acquisition commissions 230,391
b) Other acquisition costs 10,303
c) Change in commissions and other acquisition costs
to be amortised 0
d) Collecting commissions 0
e) Other administrative expenses 38,398
f) (-) Reinsurance commissions and profit sharing 65,318 213,774 254,879
9. INVESTMENT CHARGES
a) Investment administration charges, including interest 17,716
b) Value adjustments on investments 3,567
c) Losses on the realisation of investments 283 21,566 28,457
10. EXPENSES AND UNREALISED LOSSES ON INVESTMENTS FOR THE BENEFIT OF POLICYHOLDERS
WHO BEAR THE INVESTMENT RISK AND ON INVESTMENT RELATING
TO THE ADMINISTRATION OF PENSION FUNDS 3,190 10,171
11. OTHER TECHNICAL CHARGES, NET OF REINSURANCE 8,173 8,362
12. (-) ALLOCATED INVESTMENT RETURN TRANSFERRED TO THE NON-TECHNICAL ACCOUNT (item III. 4) 729,570 696,659
13. BALANCE ON THE TECHNICAL ACCOUNT FOR LIFE BUSINESS (item III.2) 448,130 373,213
III. NON TECHNICAL ACCOUNT
1. BALANCE ON THE TECHNICAL ACCOUNT FOR NON-LIFE BUSINESS (Item I.10) 222,924 218,770
2. BALANCE ON THE TECHNICAL ACCOUNT FOR LIFE BUSINESS (Item I.13) 448,130 373,213
3. NON-LIFE INVESTMENT INCOME
a) From partecipating interests 980,537
(of which, income from Group companies) 979,930
b) From other investments
aa) income from land and buildings 4,944
bb) from other investments 91,090 96,034
(of which, income from Group companies) 64,611
c) Value re-adjustments on investment 6,905
d) Gains on the realisationof investments 36,869
(of which, income from Group companies) 19,610 1,120,346 989,186

Assicurazioni Generali | 9
Year 2017 Year 2016
4. (+) ALLOCATED INVESTMENT RETURN TRANSFERRED FROM
THE LIFE TECHNICAL ACCOUNT (item iI. 2) 729,570 696,659
5. INVESTMENT CHARGES FOR NON-LIFE BUSINESS
a) Investment administration charges, including interest 31,656
b) Value adjustments on investments 36,893
c) Losses on realisation of investments 10,099 78,648 171,574
6. (-) ALLOCATED INVESTMENT RETURN TRANSFERRED TO THE NON-LIFE TECHNICAL ACCOUNT (item I. 2) 137,629 123,337
7. OTHER INCOME 398,403 491,556
8. OTHER CHARGES 1,631,104 1,603,197
9. RESULT FROM ORDINARY ACTIVITY 1,071,991 871,276
10. EXTRAORDINARY INCOME 254,534 79,590
11. EXTRAORDINARY CHARGES 43,557 44,817
12. EXTRAORDINARY PROFIT OR LOSS 210,977 34,773
13. RESULT BEFORE TAXATION 1,282,969 906,049
14. INCOME TAXES -121,491 -190,212
15. PROFIT (LOSS) FOR THE YEAR 1,404,459 1,096,261