Reunião pública com investidores e analistas – resultados do 2 t08
Upload
rirossiCategory
view
146download
2
Santander - 7th Latam Cement & Construction ConferenceSantander - 7th Latam Cement & Construction Conference
May 5th, 2007 - New YorkSergio Rossi – IR DirectorMay 5th, 2007 - New York
Sergio Rossi – IR Director

Disclaimer
This material is a presentation of general background information about Rossi Residencial S.A. (“Rossi”) as of the date of this presentation. Information contained herein has been summarized and does not purport to be complete. This presentation shall not be considered an advice of investment by potential investors. This presentation is strictly confidential and may not be disclosed to any third person. There are no representationsor warranties, express or implied, regarding the accuracy, fairness, or completeness of the information presented herein, which shall not support anydecision of investment.
This presentation contains statements and information that are forward-looking pursuant section 27A of the Securities Act of 1933, as amended, andSection 21E of the Securities and Exchange Act of 1934. Such forward-looking statements and information are only predictions and cannot assureRossi´s future performance. Investors have been cautioned that any such forward-looking statements and information are subject to many risks anduncertainties relating to the operations and business of Rossi and its subsidiaries. As a result of such risks and uncertainties, the actual results of Rossi and its subsidiaries may be materially different from any future result expressed or implied in the forward-looking statement or informationcontained herein.
Although Rossi believes that the expectations and assumptions reflected in the forward-looking statements and information are reasonable and havebeen based on data currently available to its officers and directores, Rossi cannot guarantee future results or events. Rossi does not assume thecommitment of update any of the forward-looking statement of information.
Securities may not be offered or sold in the United States unlesss they are registered or exempt from registration under the Securities Act of 1933, as amended. Any offering of securities to be made in the United States will be made by means of an offering memorandum that may be obtained fromthe underwriters. Such offering memorandum will contain, or incorporate by reference, detailed information about Rossi and its subsidiaries, theirbusiness and financial results, as well as its financial statements.
This material is for distribution only to person who (i) have professional experience in matters relating to investments falling within Article 19 (5) of theFinancial Services and Markets Act of 2000 (Financial Promotion) Order 2005 (as amended, the “Financial Promotion Order”), (ii) are persons fallingwithin Article 49 (2) (a) to (d) (“high net worth companies, unincorporated associations etc”) of the Financial Promotion Order, (iii)a are outside theUnited Kingdom, or (iv) are persons to whom an invitation or inducement to engage in investment activity (within the meaning of section 21 of theFinancial Services and Markets Act 2000) in connection with the issue or sale of any securities may otherwise lawfully be communicated or caused to be communicated (all such persons together being referred to as “relevant persons”). This material is directed only at relevant persons and must notbe acted on or relied on by persons who are not relevant persons. Any investment or investment activity to which this material relates is available onlyto relevant persons and will be engaged in only with relevant persons.
This presentation does not constitute an offer, or invitation, or solicitation of an offer, to subscribe for or purchase any securities. Neitherthis presentation nor anything contained herein shall form the basis of any contract or commitment whatsoever.

Presentation AgendaPresentation Agenda
IndustryOverview
Macroeconomic Outlook
Mortgage Financing
Competitive Environment
CompanyOverview
Historical Background
Business Model
Track Record
CompetitiveAdvantages
Geographical Diversification
Regional Offices
High Quality Land Bank
Partnerships
SAP Technology Platform
Sales Team
Guidance2007-2008
Coverage – RSID3

Section 1
Industry OverviewSection 1
Industry Overview

Macroeconomic OutlookBrazilian economy living very positive fundamentals...investment grade soon to come
Positive Economic TrendPositive Economic Trend
Largest economy in Latin America
Economic, political and social stability with growing
concern in relation to fiscal policy
Extremely strong economic fundamentals
Inflation under control
Unemployment rates falling
Country risk at lowest historic levels
Low external debt
Challenge: Growth
Economic Growth and falling int ratesEconomic Growth and falling int rates
2003 2004 2005 2006 2007E 2008E 2009E 2010E
Nominal Interest Rate GDP Growth
23,50%
16,40%
19,00%
12,75%12,00%
11,00% 10,50% 10,00%
0,5%
4,9%
2,3%
3,3%3,6% 3,7% 3,8%3,8%
5

Regional Housing Shortage
NorthNorth
Housing Shortage in units 850.335% total homes 22,90%
Housing Shortage in units 536.561% total homes 14,00%
Mid WestMid West
Housing Shortage in units 873.708% total homes 10,40%
SouthSouth
NortheastNortheastHousing Shortage in units 2.743.147% total homes 20,60%
SoutheastSoutheast
Housing Shortage in units 2.898.928% total homes 12,20%
BRAZILBRAZILHousing Shortage in units 7.902.699% total homes 14,90%
6

Potential Demand in Brazil
Very dependent on interest rate levels and mortgage term maturities
4.7 million families> R$ 4.801
R$ 1.201 < x > R$ 2.60012.0 million families
< R$ 1.20024.9 millionfamilies
11.7 million families> R$ 2.601
51%
25%
24%
Potential Demand:+ 7 million families+ 148% increase
2007 ExpectedAvg unit value R$mm = 110Real Mortgage Rate = 8%# years = 20PMT value = 0.9% Household Income = 35%Household Income = 2.6
51%
39%
10%
R$ 1.201 < x > R$ 4.80019.0 million families
< R$ 1.20024.9 millionfamilies
2005 OutlookAvg unit value R$mm = 110Real Mortgage Rate = 13%# years = 10PMT value = 1,7% Household Income = 35%Household Income = 4.8
7

Highest mortgage financing resources since the 70´s >> home ownership opporunity for over 1mm
Mortgage Financing...past years
Mortgage Financing through SFH Resources (in units)*Mortgage Financing through SFH Resources (in units)*
* Source : Associação Brasileira das Entidades de Crédito Imobiliário e Poupança (Abecip)
132
182
6875
41
6555
61
4738 36 39 35 37 36
2937
5461
114
0
20
40
60
80
100
120
140
160
180
200
87 88 89 90 91 92 93 94 95 96 97 98 99 00 01 02 03 04 05 06
Almost inexistent in the past...huge growth perspecitve for years to come
For the first time since 1988, mortgage financing (SFH) exceeded 100K units
Mortgage financing expected to reach R$ 20 billion in 2007
8
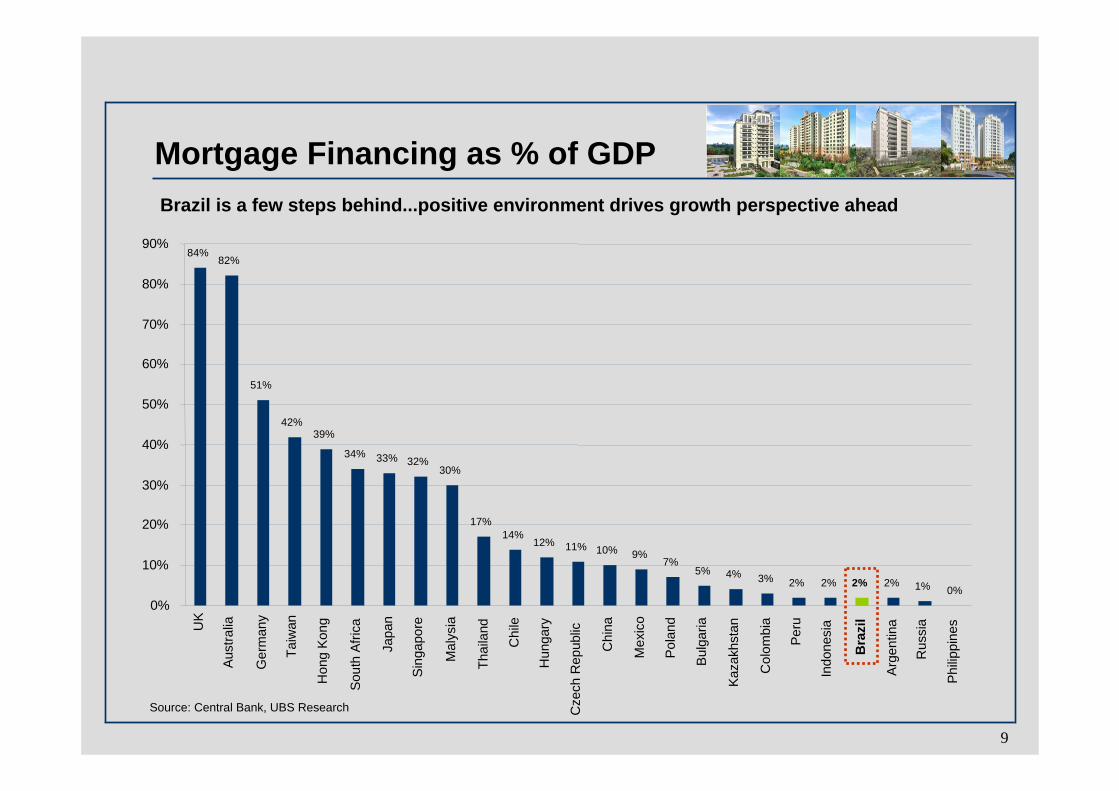
Mortgage Financing as % of GDPBrazil is a few steps behind...positive environment drives growth perspective ahead
84%
51%
42%39%
34% 33% 32%30%
17%14%
12% 11% 10% 9%7%
5% 4% 3% 2% 2% 2% 2% 1% 0%
82%
0%
10%
20%
30%
40%
50%
60%
70%
80%
90%
UK
Aust
ralia
Ger
man
y
Taiw
an
Hon
gKo
ng
Sout
hAf
rica
Japa
n
Sing
apor
e
Mal
ysia
Thai
land
Chi
le
Hun
gary
Cze
chR
epub
lic
Chi
na
Mex
ico
Pola
nd
Bulg
aria
Kaza
khst
an
Col
ombi
a
Peru
Indo
nesi
a
Bra
zil
Arge
ntin
a
Rus
sia
Philip
pine
s
9
Source: Central Bank, UBS Research

Credit Supply ShockMortgage loan origination grew by 60% in 2005 and by 95% in 2005. Reasons behind increase:
Credit supply expansion from changes in Central Bank requirements
Better macro outlook and monetary flexibility
Mortgage appetite from banks >> natural vehicle for client retention & cross-selling
Source: Central Bank, ABECIP
Mortgage Origination
10

Mortgage Availability Today• Maximum Property Value: In general, limited to R$ 350K when funded by SFH; no limit when financed by other source of funds
• % Financing: Could go up to 80% (SFH), thus varying from bank to bank
• Financing Terms: In general, up to 240 months (20 years) in all banks
• Interest Rates: Vary from 6% to 16% p.a. – a lot of research has to be taken out before committing to a mortgage plan
Max Property
Value% Financing Financing
TermInterest Rates
p.a.
No limit 80%<x>100% 240m (SFH) TR + 9-13%
< = R$350K < = 80% 144<x>240 TR + 8-16%
< = R$350K < = 80% 240m (SFH) TR + 8-12,5%
TR + 8-13%
< = R$350K 80% 240m (SFH) TR + 7,95-14%
< = R$250K < = 80% 120<x>240
No limit 240m (SFH) TR + 6-14%70%<x>100%
< = R$350K < = 80% 70<x>240 TR + 6-13%
< = R$350K < = 80% 240m (SFH) TR + 8%
11
Source: Central Bank, ABECIP

Competitive Environment
Today´s DynamicsToday´s Dynamics
Capital Markets
Total new capital raised (equity) exceeds R$ 12 billionCompanies extremely capitalizedGlobal liquidity - excess capital flowing into BRICsBrazilian Real Estate withín investor market loopWindow of opportunity should take more players public
Land Acquisitions
Prime areas are fully acquired in cashLandowners have the full upside of a bullish market...sell at premiumSwaps – very hard in urban centers like São Paulo & Rio de JaneiroLand inflation – some regions have lived a 30% spike in pricesCrowding out – natural process to ensure swaps and land availability
Partnerships across markets
Northeast Brazil living huge expansion...big names are moving thereGrowth through regional partnerships w/ local players is the gameConsolidationlalready happening – top brand names locking in localsLess room for small to mid-sized players – capital is barrier for growth
Huge Launching Growth
Increasing demand - > mortgage market & interest rate decreaseCould potentially drive some market oversupplies...timing not preciseSales speed downturn to drive launching rethinking...Rossi is hedgedRegional Expansion should fuel expected overall delivery
15 listed players...capitalized companies building up landbank and increasing launchings
12
Section 2
Company OverviewSection 2
Company Overview

Historical Background
Foundation of Rossi Residencial with focus
on middle-upperincome segments in SP
Opening up of regional offices in Campinas
and Porto Alegre
Launching of a new residential housingconcept: Villa Flora
Adhered to Bovespa´s “Nivel I” of Corporate
Governance
1980 1992
Launching of Plano 100 with a focus on low-
income developmentsacross the country
1993 1997
IPO of ON sharesin Bovespa
1999 2002
Acquisition of AmericaProperties – presence in commercial, upper, andupper-middel income
residential
2003 2006
Equity Offering(R$1billion) –
Novo Mercado
Rossi Residencial is today the main asset held by the Rossi Group
14

Ownership Structure
(1) Includes 15% Greenshoe Exercise
Current free float stands at 55,69%Current free float stands at 55,69%
78,851,814 shares78,851,814 shares
Post-Equity Offering (1)Post-Equity Offering (1)Pre-Equity Offering Feb 2006Pre-Equity Offering Feb 2006
48,351,814 shares 48,351,814 shares
91,47%
8,53%
ControllingShareholders
FreeFloat
Treasury
55,69%
43,41%
0,90%
ControllingShareholders Free Float
15

Main ActivitiesNet Revenues - 2006
R$ 411 million
95%
5%
Residential Development (1)Residential Development (1)
Focus on project development (vertical and horizontal) for all income segments, with a greater approach towards lower middle / middle upper housing throughout 27 cities (9 states) in Brazil
43 launches in 2006, totaling R$ 1,150 milion in potential sales volume (R$ R$ 883 milion = Rossi´s share)
Contracted Sales of R$ 730 million in 2006 (R$ 584 million = Rossi´s share)
Land Bank with 4.1 million m2 to be launched, representing a potential salesvolume of R$ 6.4 billion (Rossi´s share)
Commercial DevelopmentCommercial Development
Projects taken out by opportunity in diverse markets
Expertise in both vertical (triple A building in POA) and horizontal (Praça Capital (CPS)
Average Contracted Sales: 3-5% of overall sales volume
16

Business Model: WC Efficiency
LandAcquisiton
Construction
Post-KeySecuritization
(1) Brazilian mortgage financing system backed by savings deposits: TR @ 2.0% p.a. in 2006(2) Índice Nacional da Construção Civil: Construction Inflation Index
Swap Agreements (70%)
reduction in opportunity costs
boosting of project IRR
falling cash outlays
Construction partly financed by customers
17% of unit price cashed in before start of construction
44% of unit price cashed in at time of key delivery
Close to 80% of units sold before start of construction
Construction financing (SFH (1) funds @ TR + 11% p.a.)
Construction costs locked in: monthly PMTs adjusted byconstruction inflation (INCC) (2)
Repayment of construction financing through securitization of receivables originated by the project
True sale with cash in at par
Free cash flow plowed back into a new project
17
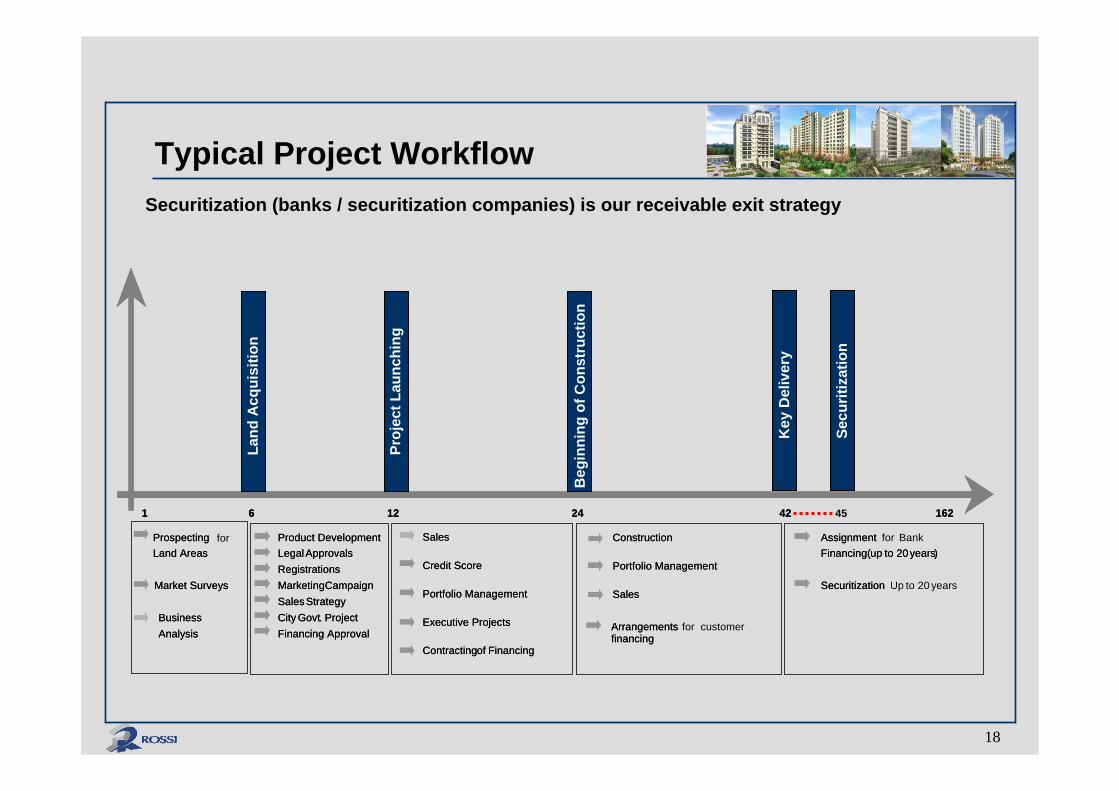
Typical Project WorkflowSecuritization (banks / securitization companies) is our receivable exit strategy
1
Product DevelopmentLegal ApprovalsRegistrationsMarketing CampaignSales StrategyCity Govt. ProjectFinancing Approval
Arrangements for customerfinancing
ProspectingLand Areas
Market Surveys
Business Analysis
6 12 24 42 162
Sales
Credit Score
Portfolio Management
Executive Projects
Contractingof Financing
Construction
Portfolio Management
Sales
Assignment for BankFinancing(up to 20 years)
Securitization Up to 20 years
1
Product DevelopmentLegal ApprovalsRegistrationsMarketing CampaignSales StrategyCity Govt. ProjectFinancing Approval
Arrangementsfinancing
Prospecting for Land Areas
Market Surveys
Business Analysis
6 12 24 42 162
Sales
Credit Score
Portfolio Management
Executive Projects
Contractingof Financing
Construction
Portfolio Management
Sales
AssignmentFinancing(up to 20 years)
Securitization
Land
Acq
uisi
tion
Proj
ect L
aunc
hing
Beg
inni
ngof
Con
stru
ctio
n
Key
Del
iver
y
45
Secu
ritiz
atio
n
18

Typical Cash Inflows vs. Revenues
12M 18M 24M 30M 36M
Accumulated Pre-Sales (a) 0% 60% 80% 85% 90% 95% 100%
% Budgeted Costs(b) 0% 20% 29% 56% 86% 100% 100%
Revenues Recognized(a x b) 0 12% 23% 48% 78% 95% 100%
% PMTs Received - 8% 17% 24% 33% 44% 100%Assumptions
(1) PotentialSales Volume: R$ 100million(nominal)(2) Land Swap: R$ 15million(3) Doesnot include any financialrevenues(INCC)during construction
Construction
6M0M
LaunchGo
AheadKey
Delivery Securitization
12M 18M 24M 30M 36M
Accumulated Pre- Sales (a) 0% 60% 80% 85% 90% 95% 100%
% Budgeted Costs (b) 0% 20% 29% 56% 86% 100% 100%
Revenues Recognized(a x b) 0 12% 23% 48% 78% 95% 100%
% PMTs Received - 8% 17% 24% 33% 44% 100%Assumptions
(1) PotentialSales Volume: R$ 100 (nominal)(2) Land Swap: R$ 15million(3) Doesnot include any
Construction
6M0M
LaunchLaunchGo
AheadGo
AheadKey
DeliveryKey
Delivery SecuritizationSecuritization
Average cash in up to key delivery adds up to 44% of unit´s sales price
19

Typical Project Cash Flows
(2.800.000)
(2.550.000)
(2.300.000)
(2.050.000)
(1.800.000)
(1.550.000)
(1.300.000)
(1.050.000)
(800.000)
(550.000)
(300.000)
(50.000)
200.000
450.000
700.000
950.000
1.200.000
1.450.000
1.700.000
1.950.000
2.200.000
Purc
hase
of L
and -5 -4 -3 -2 -1
Com
mer
cial
Lau
nch 1 2 3 4 5 6 7 8 9
Star
t of C
onst
ruct
ion 11 12 13 14 15 16 17 18 19 20 21 22 23
Com
plet
ion
of C
onsr
tuct
ion
Del
iver
y of
the
keys 26 27
Secu
ritiz
atio
n 29 30 31 32 33 34 35 36
With Construction Financing
Without Construction Financing
Investment financed with Working Capital
• 30% of the Construction completed• 80% of Units Sold
Months
Intensive use of Capital to expand
Growth
Cost of construction = 45% os salesConstruction Financing = 70% of CCEffective Financing = 31,5% of sales
20
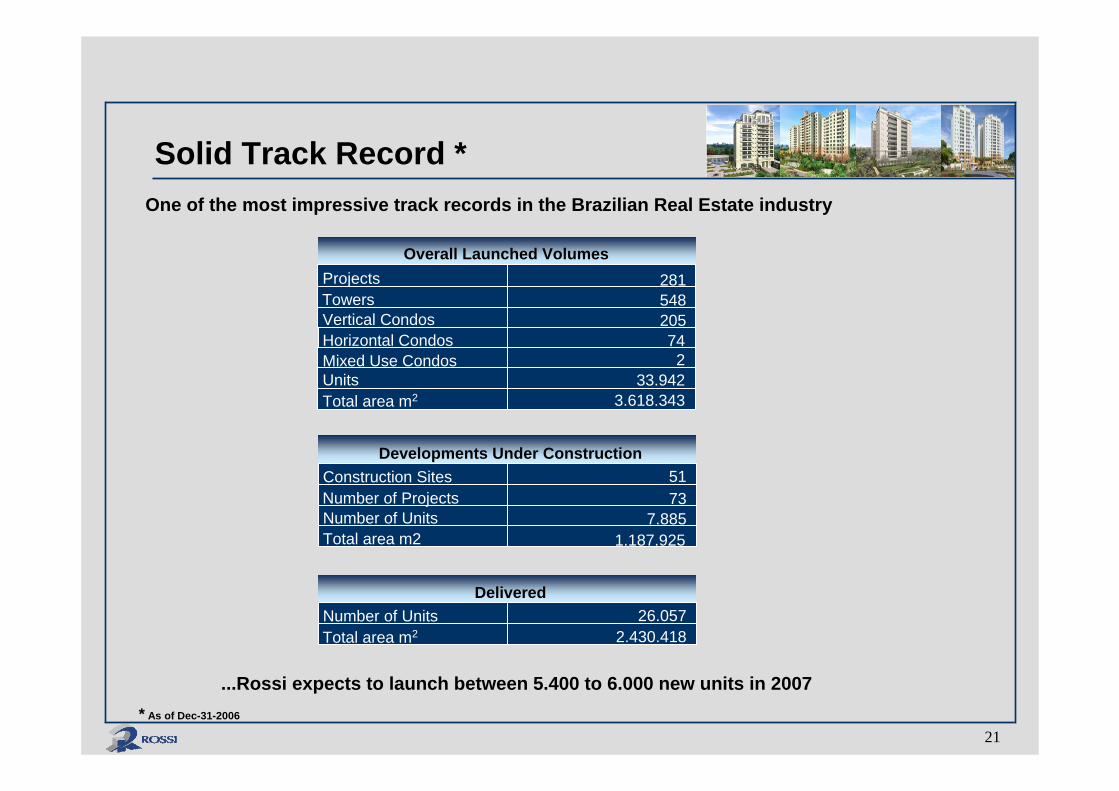
Solid Track Record *
Overall Launched VolumesProjectsTowersVertical Condos
281548205
Horizontal CondosMixed Use CondosUnitsTotal area m2
742
33.9423.618.343
Developments Under ConstructionConstruction SitesNumber of ProjectsNumber of Units
5173
7.885Total area m2 1.187.925
DeliveredNumber of UnitsTotal area m2
26.0572.430.418
One of the most impressive track records in the Brazilian Real Estate industry
* As of Dec-31-2006
...Rossi expects to launch between 5.400 to 6.000 new units in 2007
21

Investment CasesRecent investment cases with high sales turnover within short periods of time
ECONOMIC
MEDIUM-HIGHVictoria Bay – Jan 2007
LocationSalesUsable Area
Vitória - ES269 units – R$ 89 MM72-97 m2
269 units sold in 3 days
2nd successful project in town
CASE
HIGH-ENDEternity – Mar 2005
LocationSalesUsable Area
São Paulo - SP24 units – R$ 50 MM355 m2
Fully sold 1 year after launch
CASE
MEDIUMResidencial Club Tuiuti – Oct 2004
LocationSalesUsable Area
São Paulo - SP624 units – R$ 138 MM92-122 m2
616 units sold in 90 days
Condo Club Benchmark
CASE
Avalon – Phase 1 – Mar 2007LocationSalesUsable Area
Campinas - SP118 units – R$ 14 MM59-84 m2
fully sold in one weekend
project will be replicated
CASE
22

Section 3
Competitive AdvantagesSection 3
Competitive Advantages

Geographical DiversificationGeographical Diversification is a key element that brings up Rossi´s key market differentials
Geographical Diversification RationaleGeographical Diversification Rationale
Local Partnerships
Natural fuel to provide increasing growth perspectivesImmediate access to highly qualified landbankAccess to high quality local construction servicesHighly Diversified Landbank: 4-5 years of future launches in the bagPaving our way through a smoother project approval process
Regional Offices
Real Estate is a “LOCAL” business – be close to your marketsUnderstanding the local demand - key driver for successful projectsLocal market surveys and research – optimize product conceptionRossi is creating a national brand, but with a very local approachWe think real estate 24/7 at a local level
Diversification
Coverage of all income segments with Rossi´s leading brandnameGeographic coverage: 30 cities within 11 states Competitive Advantages in low-income segments: 27,000 units
l launched to date (priced up to R$ 100K)Portfolio mix with over 100 different products
Branding
Brand exposure through our local presence and product expertiseBackbone of any successful strategy going forwardRossi is able to market its label by addressing local client demandsMarketing and sales strategies at a local level deliver high sales
t turnover
24

Geographical PresenceLong Term Sustainable Competitive Advantage: Building up Local Know-How
Regional Offices (6)Regional Offices (6)(1) 1980 – São Paulo(2) 1996 – Campinas(3) 1999 – Porto Alegre(4) 2001 – Rio de Janeiro(5) 2006 – Belo Horizonte(6) 2007 – Salvador
Geographical PresenceGeographical Presence
12
3
4
5
6
Operations in 30 cities within 11 states in Brazil
RS
PR
SP
MG
RJ
ES
BA
PE
SC
CERN
25

Sizable Land BankLand Bank distributed throughout 30 cities, showingless dependence on any specific market
8.4 million m2 in buildable area
future launches (in units) – 46.378
4 to 5 years in the bag for future launches
Potential Sales Volume (100%): R$ 8.75 billion
Rossi´s share: R$6.3 billion
qoq Growth: + 324 %
495 594 939 1.128
2.266 2.4811.331 1.472
2.628
3.463
6.407 6.275
1.826 2.066
3.567
4.591
8.673
Dec 05 1Q06 2Q06 3Q06 4Q06 1Q07
8.756
Land Bank * PSV in R$ mmLand Bank * PSV in R$ mm
1Q07 Consolidated Rossi´s shareAcquired 6.358.000.000 4.382.000.000Optioned 2.398.000.000 1.893.000.000Total 8.756.000.000 6.275.000.000Balance Consolidated Rossi´s shareLB Dec-31-2006 8.673.000.000 6.407.000.000Launches 1Q07 -460.000.000 -410.000.000Origination 1Q07 543.000.000 278.000.000LB Final 1Q07 8.756.000.000 6.275.000.000* ex joint ventures´ PSV of R$ 2,35billion
Acquisition MethodAcquisition Method
31%
52%
17%
Cash
Swap byUnits
FinancialSwap
26
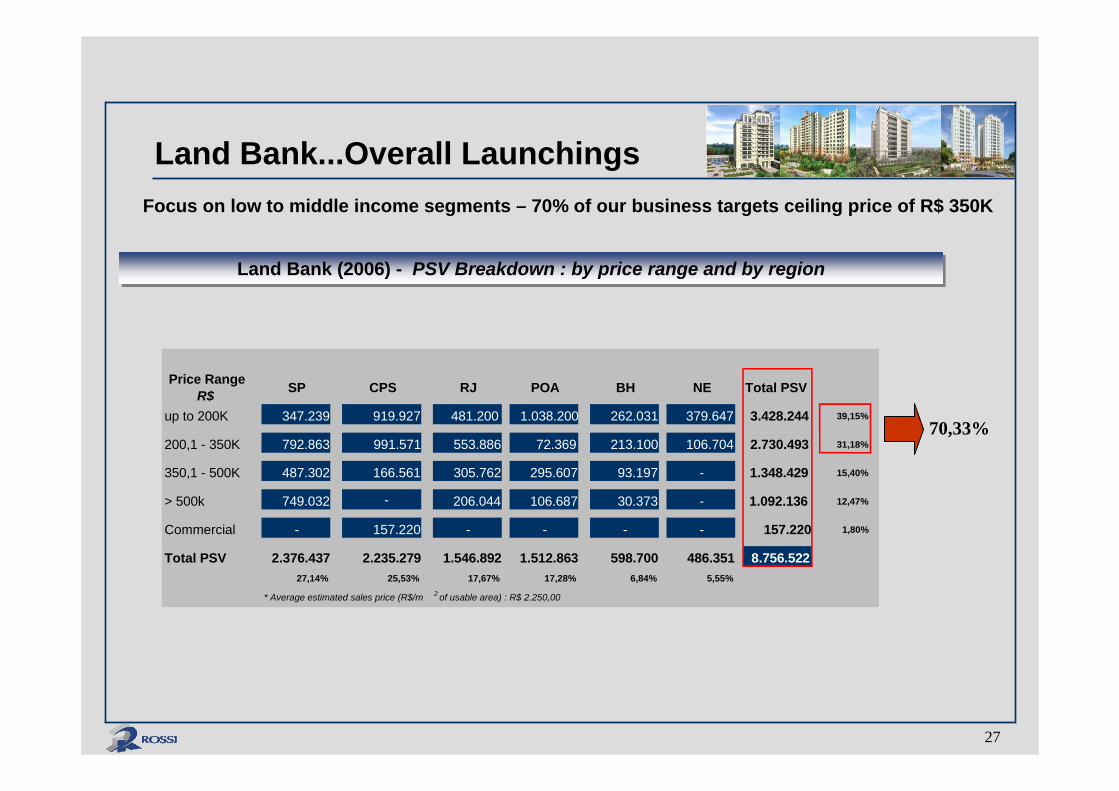
Land Bank...Overall LaunchingsFocus on low to middle income segments – 70% of our business targets ceiling price of R$ 350K
Land Bank (2006) - PSV Breakdown : by price range and by regionLand Bank (2006) - PSV Breakdown : by price range and by region
Price Range R$ SP CPS RJ POA BH NE Total PSV
up to 200K 347.239 919.927 481.200 1.038.200 262.031 379.647 3.428.244 39,15%
200,1 - 350K 792.863 991.571 553.886 72.369 213.100 106.704 2.730.493 31,18%
350,1 - 500K 487.302 166.561 305.762 295.607 93.197 - 1.348.429 15,40%
> 500k 749.032 206.044 106.687 30.373 - 1.092.136 12,47%
Commercial - 157.220 - - - - 157.220 1,80%
Total PSV 2.376.437 2.235.279 1.546.892 1.512.863 598.700 486.351 8.756.52227,14% 25,53% 17,67% 17,28% 6,84% 5,55%
* Average estimated sales price (R$/m 2 of usable area) : R$ 2.250,00
70,33%
-
27
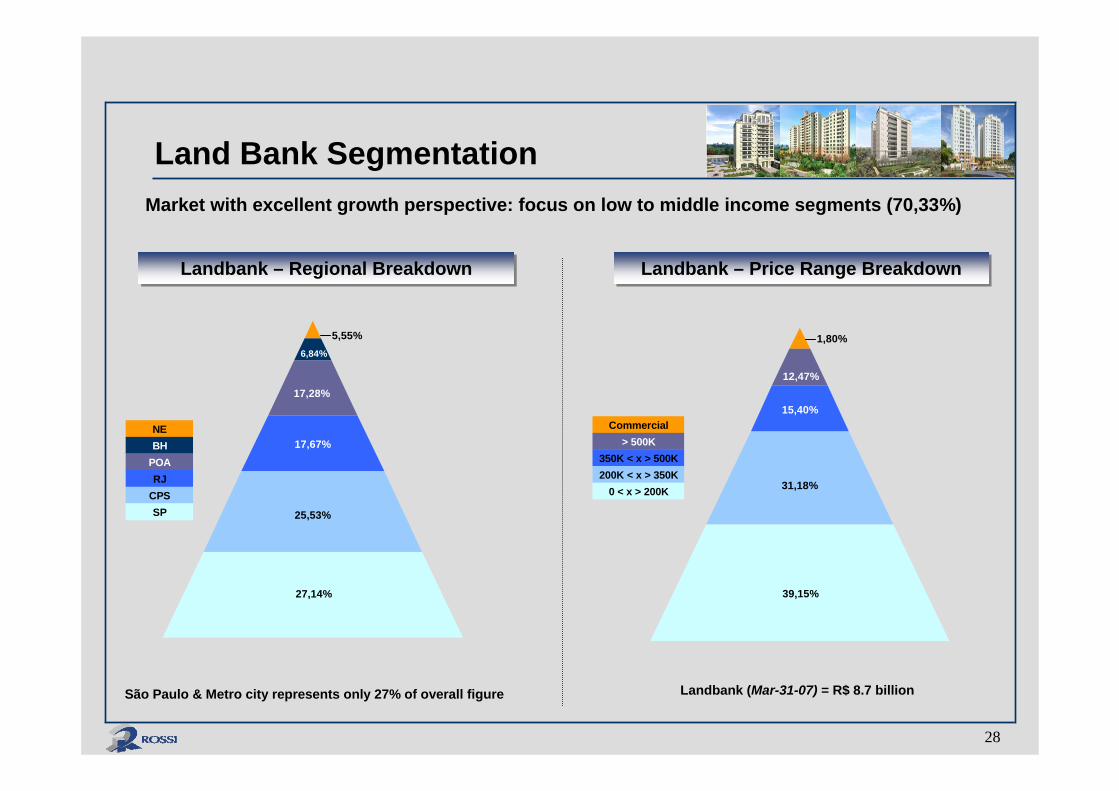
Land Bank SegmentationMarket with excellent growth perspective: focus on low to middle income segments (70,33%)
Landbank – Regional BreakdownLandbank – Regional Breakdown
São Paulo & Metro city represents only 27% of overall figure
27,14%
25,53%
17,67%
17,28%
5,55%6,84%
NEBH
POARJ
CPSSP
Landbank – Price Range BreakdownLandbank – Price Range Breakdown
Landbank (Mar-31-07) = R$ 8.7 billion
39,15%
31,18%
15,40%
12,47%
1,80%
Commercial> 500K
350K < x > 500K200K < x > 350K
0 < x > 200K
28

Joint Ventures
% Rossi City / State Segments # of projects Potential Sales R$MM
Paraná&
Santa Catarina
4
8050% Porto Alegre High 3
50% Vitória
100
50-70% All 6 200
50% Belo Horizonte
All
All 6 200
50-70% Recife All 15 500
300
50-80% Salvador All 3 500
50% Vila Velha All 6
Total 55 2.350
50-75% Fortaleza Natal All 12 470
Footprinting South, Southeast, and Northeast Brazil: 8 joint ventures as of follow-on (Feb-2006)
29

SAP Technology PlatformCompetitive advantage in the industry: growth through updated process-oriented tools
30

Sales Team – Rossi Vendas
Rossi Vendas is focusing in ramping up sales turnover and zeroing in pre-delivery inventoriesRossi Vendas is focusing in ramping up sales turnover and zeroing in pre-delivery inventories
Valuable interface to better monitor CRM, thus consistently building up client relationship activities
Our expertise shows that a homebuyer´s dream begins at the very moment he makes the option for Rossi
From this point on it is essential to have our clients as our most relevant asset
We have pilot tested São Paulo...great possibility of extending sales team throughout our other regional offices
Rossi Vendas is constantly focusing on the following core activities:
Inventories (6 months post launchings): full focus on speeding up sales turnover so as to not carry the burden of finished inventories by the time of project delivery
E-commerce channel: web based vehicle with trained team to help enrich homebuyer´s experience when home-shopping with us
Pre Sales Breakdown by Brokerage Company 2007EPre Sales Breakdown by Brokerage Company 2007E
Average monthly contracted sales hitting R$ 10 million
15%
35%
15%
12%
10%
8%5%
Rossi Vendas
Lopes
Abyara
Patrimóvel
Capucci Bauer
Dirani
Other
31
Section 4
GuidanceSection 4
Guidance

Guidance vs. Delivery 2006
Rossi´s stake in R$ MM 2006 Delivered
Net Revenues 400 - 430 411
Launches 850 - 950 883
Contracted Sales 575 584
Backlog Margin % 34 - 36 35,70
Gross Margin % 30 - 32 31,20
Ebitda Margin % 11 - 13 12,50
33

Guidance 2007-2008
Rossi´s stake in R$ MM 2007E 2008E
Net Revenues 550 - 650 800 - 900
Launches 1.300 - 1.450 1.560 - 1.740
Contracted Sales 1.000 - 1.100 1.150 - 1.265
Backlog Margin % 35 - 37 35 - 37
Gross Margin % 34 - 36 34 - 36
Ebitda Margin % 16 - 18 18 - 20
Scale in revenues to bring bottom line benefits and margin expansion along the way
34

Share Price Performance
J F M A M J J A S O N D J F M
RSID3 IBOVESPA
Share price appreciation given latest delivery... Closing price April 28th – R$ 28,50
2006 2007
35

Coverage – RSID3Rossi is currently covered by 5 institutions....5 more to initiate coverage in the near future
Current CoverageCurrent Coverage
Institution
Itaú
Fator
Santander
Deutsche Bank
Banco do Brasil
On the wayOn the way
Institution Analyst Contact Information
Guilherme Vilazante [email protected] Lee [email protected]
Marcelo Telles [email protected] Quiroga [email protected]
Carlos Firetti [email protected] Suzaki [email protected]
Adrian Huerta [email protected] Agarwal [email protected]
Bulltick Rafael Pinho [email protected]
UBS Pactual
Bradesco
JP Morgan
Credit Suisse
36

Why Rossi ?Competitive advantage in the industry: growth through updated process-oriented tools
Diversification
Expertise and Backbone to invest in diverse:Geographic regions (currently 30 cities within 11 states)Markets (exposure to all income segments)Products (portfolio with over 100 products in the shelf)
Management Expertise
Top management with over 25-year experience in the sectorStrong background in managing operations across different marketsFully focused and oriented towards implementing and executing R
RRossi´s business strategy going forward
SAP technology fullyimplemented
Business fully process orientedAll operations across the country online and fully integrated with back-
o office areas (sales, financial, accounting, legal, engineering)Current system capable of holding up to 30,000 active clientsFast Reporting – market and partners
Low-income intelligence
27,000 units (< R$100K) delivered to date: Plano 100, Vida Nova, VFWe truly know how to manage low-income client portfoliosRossi has mastered the engineering and construction processGreat exposure to low-income in the past – will drive our leadershipCredit scoring process developed in-house
37

Investor Relations Team
Sérgio RossiInvestor Relations [email protected]+ 55 11 3759-7232
Ciro PiovesanaInvestor Relations [email protected]+ 55 11 3759-8551
www.rossiresidencial.com.br
38